Article

Impact of Soil Organic Layer Thickness on Soil-to-Atmosphere GHG Fluxes in Grassland in Latvia

Latvian State Forest Research Institute ‘Silava’, LV-2169 Salaspils, Latvia
*
Author to whom correspondence should be addressed.
Agriculture 2024, 14(3), 387; https://doi.org/10.3390/agriculture14030387
Submission received: 31 January 2024 / Revised: 22 February 2024 / Accepted: 26 February 2024 / Published: 28 February 2024
(This article belongs to the Section Agricultural Soils)

Abstract

:
Drained organic soils in agricultural land are considered significant contributors to total greenhouse gas (GHG) emissions, although the temporal and spatial variation of GHG emissions is high. Here, we present results of the study on soil-to-atmosphere fluxes of carbon dioxide (CO2), nitrous oxide (N2O) and methane (CH4) from drained organic (fen) soils in grassland. A two-year study (from July 2021 to June 2023) was conducted in three research sites in Latvia (Europe’s hemiboreal zone). Soil total respiration (Rtot), CH4 and N2O fluxes were determined using a manual opaque chamber technique in combination with gas chromatography, while soil heterotrophic respiration (Rhet) was measured with a portable spectrometer. Among research sites, the thickness of the soil organic layer ranged from 10 to 70 cm and mean groundwater level ranged from 27 to 99 cm below the soil surface. Drained organic soil in all research sites was a net source of CO2 emissions (mean 3.48 ± 0.33 t CO2-C ha−1 yr−1). No evidence was obtained that the thickness of the soil organic layer (ranging from 10 to 70 cm) and OC stock in soil can be considered one of the main affecting factors of magnitude of net CO2 emissions from drained organic soil. Drained organic soil in grassland was mostly a source of N2O emissions (mean 2.39 ± 0.70 kg N2O-N ha−1 yr−1), while the soil both emitted and consumed atmospheric CH4 depending on the thickness of the soil organic layer (ranging from −3.26 ± 1.33 to 0.96 ± 0.10 kg CH4-C ha−1 yr−1).

1. Introduction

Pristine peatlands are wetland ecosystems characterised by common water-logged conditions and the accumulation of organic matter (peat) at the surface [1]. Although pristine peatlands ensure a wide variation of ecosystem services [2,3], their high water saturation makes them unsuitable for traditional forestry or agricultural practices, including grassland management. In the past 200 years, roughly 15 percent of the world’s peatlands have been altered by drainage [4] and thus, among other management of drained peatlands, agricultural production on peatland has increased significantly in many countries [5]. In boreal and cool temperate climatic zones, the total area of drained organic soils for agriculture is 15.6 million ha (about 60% of total organic soil drained for agriculture worldwide) [6]. Following drainage, hydrological and biogeochemical processes and thus physical and chemical properties of organic soil (peat) have been significantly altered [7,8]. Drainage leads to lower groundwater (GW) level and increases soil aeration, meeting the requirements of land use for agriculture [5]. Simultaneously, drainage increases the aerobic decay (mineralisation) of soil organic matter resulting in carbon (C) and nitrogen (N) losses from peatlands mainly in the form of carbon dioxide (CO2) and nitrous oxide (N2O) as well as dissolved and particulate material [9]. Soil-to-atmosphere CO2 exchange depends on the balance between C sequestration through photosynthesis and subsequent C input to the soil, and C release through soil autotrophic and heterotrophic respiration as well as methane (CH4) oxidation under aerobic conditions [9]. Soil autotrophic respiration reflects the release of CO2 from plant roots and the associated rhizosphere (mycorrhizae and rhizosphere microorganisms), while soil heterotrophic respiration (Rhet) represents the CO2 release from the decomposition of soil organic matter, including litter, driven by microorganisms [10,11,12]. Peatlands drained for agriculture are considered hotspots of CO2 emissions from the agriculture sector [7,8,13]. At the same time, drainage (GW level drawdown) significantly reduces CH4 emissions from soil to the atmosphere due to change from anaerobic conditions, which are favourable for CH4 production by methanogens, to aerobic conditions, which limit CH4 production and enhance CH4 oxidation to CO2 by methanotrophs [14,15].
It is estimated that 11–15% of drained or otherwise degraded peatlands worldwide are responsible for roughly 5% of total greenhouse gas (GHG) emissions of anthropogenic origin [4]. Regarding the climate change mitigation, the relatively large contribution to total anthropogenic GHG emissions from the relatively small area of drained organic soils is the reason for increased interest from policy makers, land owners and managers as well as from scientists both at global and regional level. In 2021, among agricultural land in Latvia, drained organic soils made up a total area of 166.3 kha (6.7% of the total agricultural land) [16]. Specifically in grassland, the total area of drained organic soils was 77.0 kha (8.3% of the total grassland area) in Latvia, and it is estimated that these drained organic soils contributed to CO2 emissions of 1110.9 kt CO2 eq. or 97.9% from the total net GHG emissions in the grassland category in Latvia in 2021 [16]. It is important to underline that the area of drained organic soils reported under Latvia`s National GHG Inventory includes both deep and shallow organic soils. A previous study has shown that among organic soils with varying soil organic carbon (SOC) content, there is a trend towards higher soil-specific basal respiration with lower SOC content (the specific basal respiration was the highest at the boundary between mineral and organic soils) [7]. Also, at the global scale, it has been found that SOC content has a negative influence on soil heterotrophic respiration [11]. At the same time, no effect on net ecosystem exchange of CO2 has been found regarding the SOC content within other studies (e.g., [17]). This underscores the potential underestimation of GHG emissions from organic soils that do not fall under the definition stated by the Intergovernmental Panel on Climate Change (IPCC) [18]. Contrary to the expectations, Leiber-Sauheitl et al. (2014), based on a study in northern Germany, concluded that shallow histic Gleysols (including peat mixed with mineral soil, with organic carbon content ~10%) release a similar quantity of CO2 as deep peat soils (unmixed peat soil with organic carbon content > 30%) [19]. In addition to meteorological conditions (temperature) and GW level, which have been identified as key limiting factors of the magnitude of GHG emissions from organic soils, soil moisture, nutrient content (including plant-available nitrogen and phosphorus), C/N ratio, soil pH, peat type, degree of decomposition, management activities (such as tillage and fertilization) and other aspects have been reported as factors affecting GHG emissions [5,7,8,13]. The result of complex interactions of multiple GHG affecting factors is a large variation in GHG emissions [13,20]. The studies conducted so far underline the need for further region-specific studies involving long-term measurements that additionally focus on the impact of climate and variations in land use practices (e.g., [21]).
In general, grasslands are ecosystems where plant biomass is produced mostly by perennial grasses, sedges and other herbaceous species and where the constant removal of biomass from the ecosystem occurs by wild animals or human activities (e.g., grazing and hay or silage production) [22]. In Latvia, grassland ecosystems are of secondary origin—semi-natural and cultivated grasslands (10 and 90% from the total grassland area, respectively) [22]. This study focused on grasslands with drained organic soils in Europe’s hemiboreal zone. The main objective of this study was to estimate soil-to-atmosphere CO2, CH4 and N2O fluxes from drained organic soils in grassland in Latvia with additional focus on evaluating how the thickness of soil organic layer and the organic C content in soil influence the magnitude of GHG fluxes. We tested the hypothesis that the thickness of the soil organic layer and the organic C content in soil have a significant impact on the magnitude of GHG emissions from drained organic soils in grassland.

2. Materials and Methods
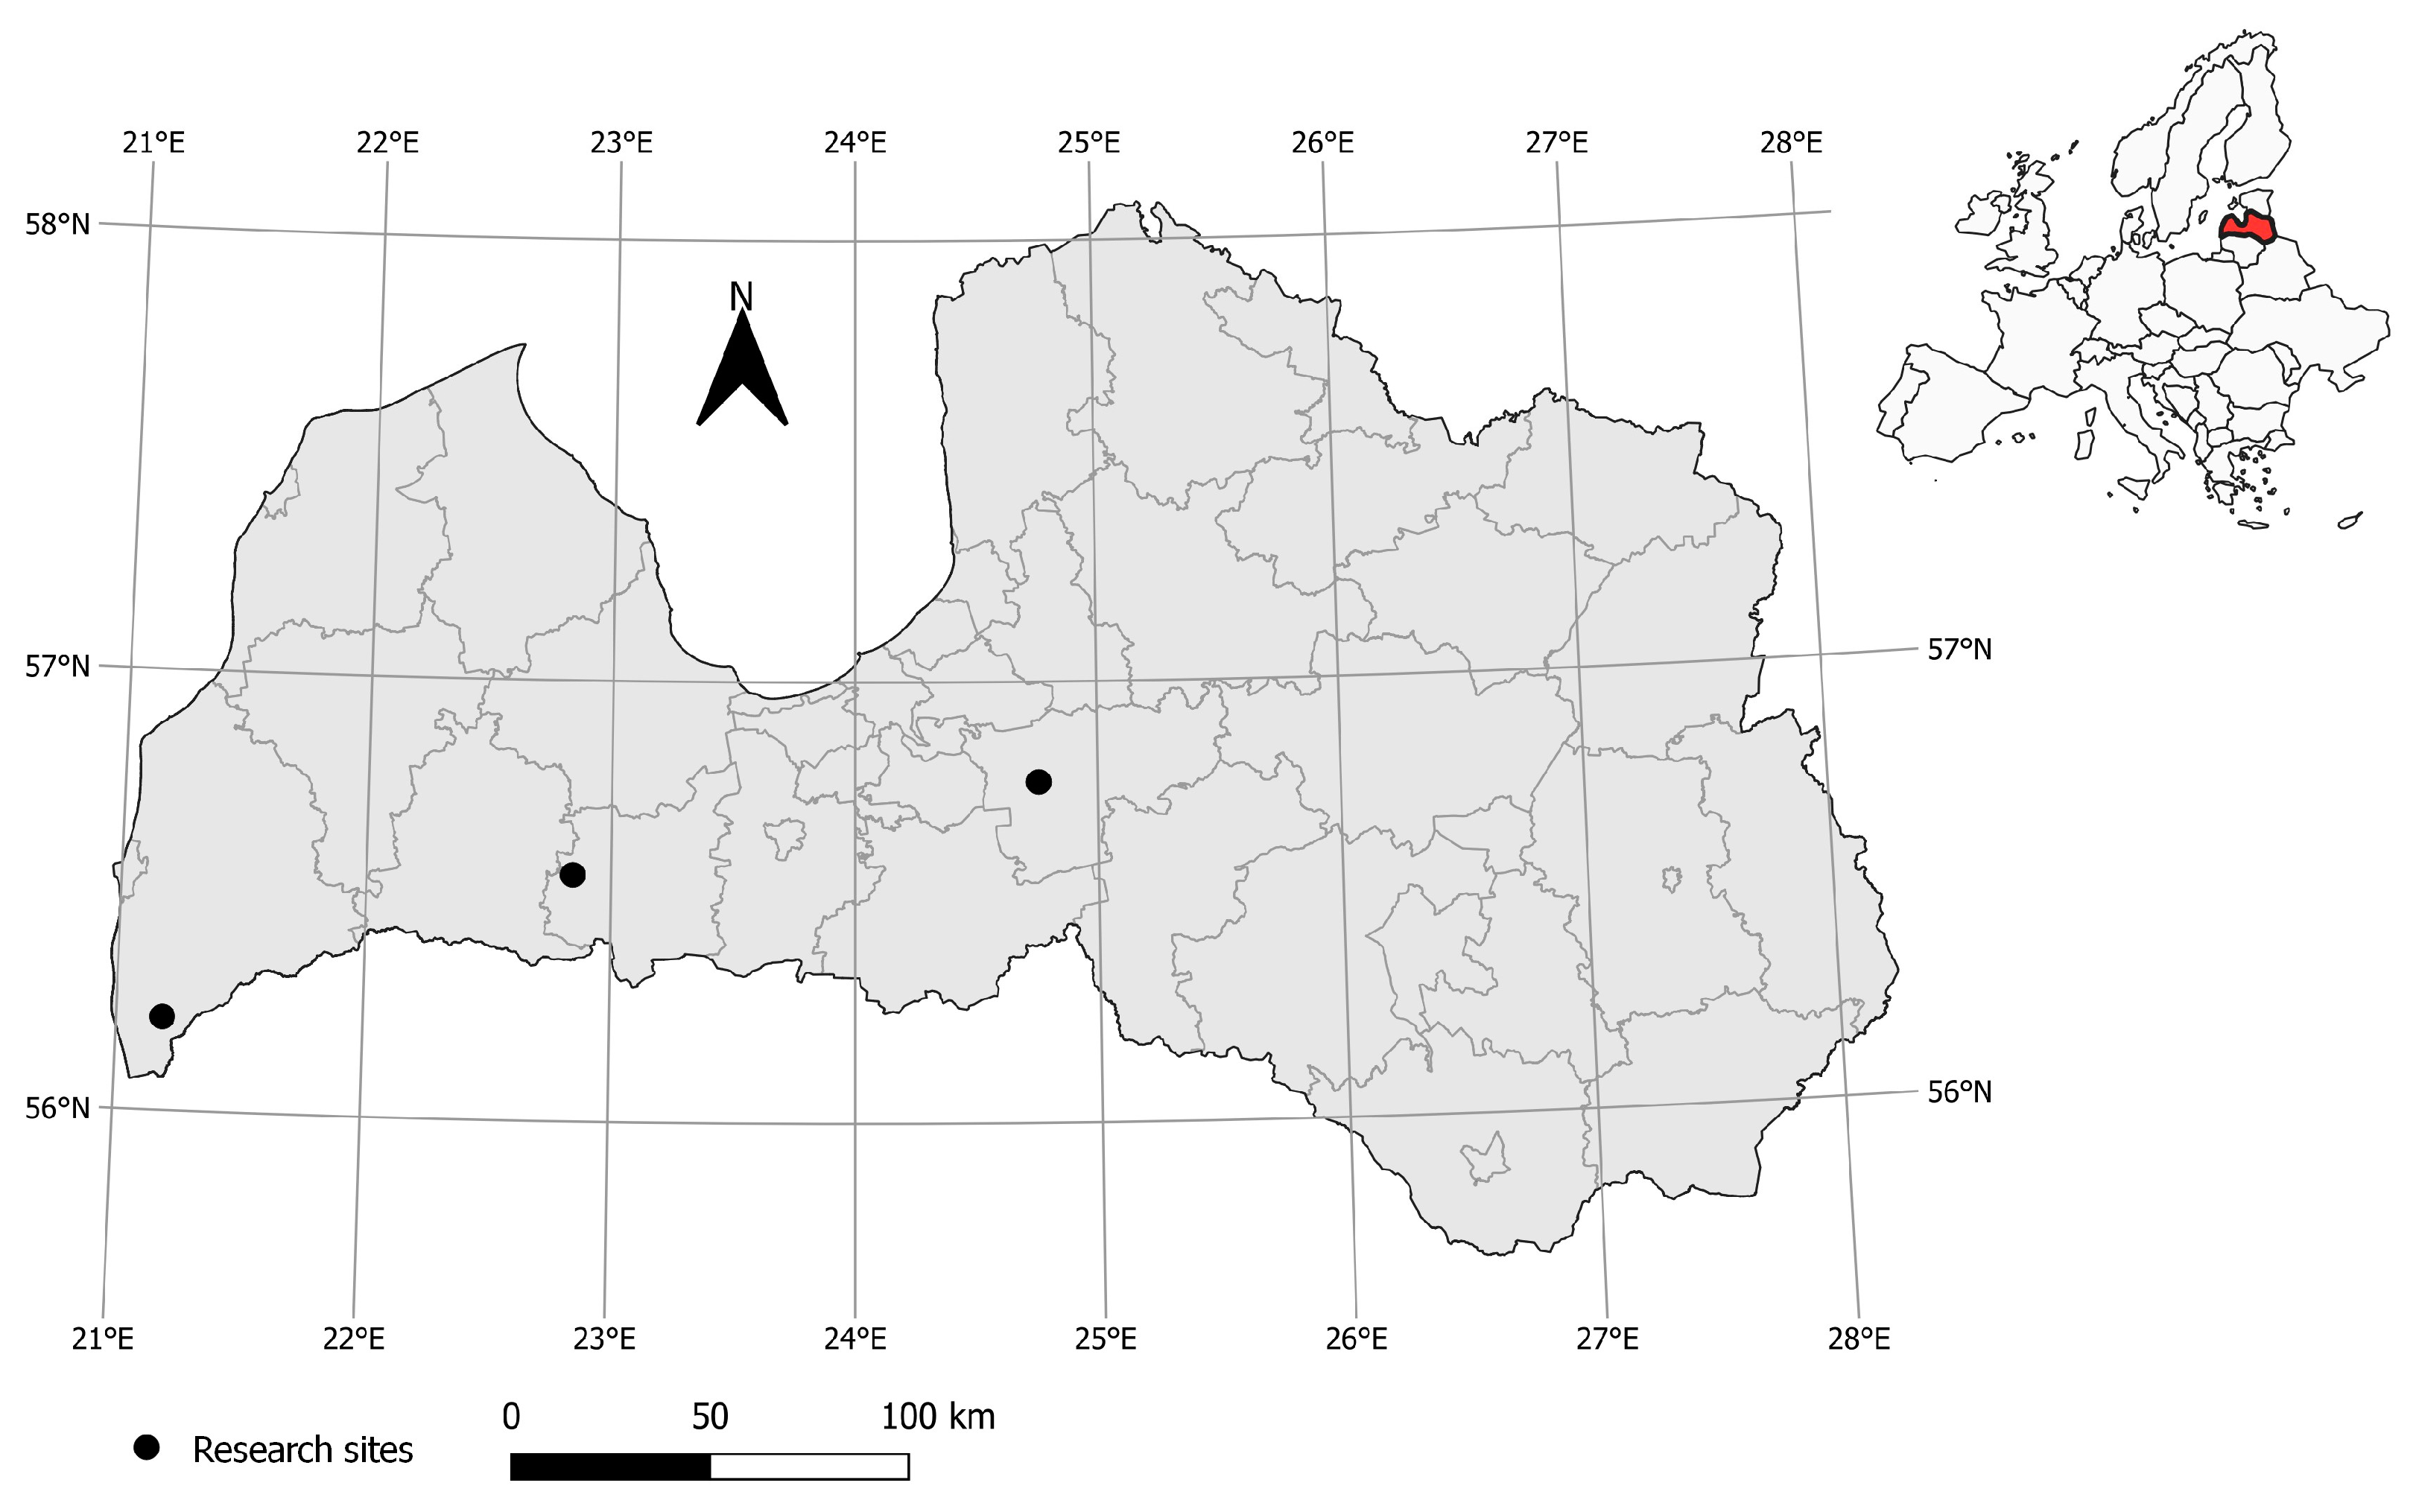
2.1. Research Sites

A two-year (between July 2021 and June 2023) study investigated three research sites with organic (fen) soil in grassland in Latvia (in Europe’s hemiboreal zone, Figure 1). In total, three subplots in each research site were established (Table 1). Among the research subplots, the thickness of the soil organic layer ranged from 10 to 70 cm, and the mean GW level ranged from 27.2 ± 3.8 to 98.8 ± 2.6 cm below the soil surface.
In Latvia, the mean long-term (1991–2020) annual air temperature was +6.8 °C and annual precipitation was 685.6 mm. In 2021 and 2022, the mean annual air temperature in Latvia was 7.0 and 7.3 °C, respectively, while the annual precipitation was 676.3 and 685.8 mm, respectively [23].

2.2. GHG Sampling Design and Measurements

Soil GHG fluxes were monitored at least once a month for 24 consecutive months between July 2021 and June 2023. Gas sampling to estimate soil total respiration (Rtot)–CO2 fluxes including both soil autotrophic and heterotrophic respiration as well as CH4 and N2O fluxes was conducted with manual sampling of discrete gas samples taken at intervals from closed non-flow-through and non-steady-state chambers (closed static chambers) [24,25] in the three replicates per subplot, nine replicates per plot. Ground vegetation was preserved intact both during collar installation and throughout the entirety of Rtot measurements. Chambers with a volume of 0.0655 m3 were used. Before sampling, the chambers were flushed and then placed on permanently installed collars (installed in soil at 5 cm depth). During the next 30 min period, after the chamber position on the collar, four consecutive gas samples (100 cm3) were taken in 10-min intervals (i.e., four samples per sampling set). CO2, CH4 and N2O concentrations in gas samples were measured using a gas chromatograph method (Shimadzu Nexis GC-230, Shimadzu USA manufacturing, Inc., Canby, OR, USA, delivered by Shimadzu authorised dealer “Armgate” (Liliju iela 20, Mārupe, Mārupes novads, Latvia); software LabSolutions 5.93) at the Latvian State Forest Research Institute ‘Silava’.
Soil heterotrophic respiration (Rhet) was measured by the non-steady-state through-flow chamber (closed dynamic chamber) method at least once a month during the vegetation periods between July 2021 and June 2023 with an EGM-5 portable CO2 gas analyser (PP Systems, Amesbury, MA, USA) using a manual opaque chamber with a volume of 0.023 m3. Each Rhet measurement area was prepared by removing the vegetation and trenching using geotextiles to avoid root distribution into the measurement area. Before soil Rhet measurements, chambers were flushed. The duration of each measurement was three minutes, and measurements in three replicates were conducted in each subplot.
All soil GHG fluxes were calculated using the equation of ideal gas law and slope of linear regression constructed based on obtained data on GHG concentrations in gas samples reflecting changes of GHG concentration over the measurement time. The GHG sampling design and measurement procedure were the same at all study subplots. Details on the basic design of subplots can be found in Purvina et al. (2023) [26].

2.3. Soil Sampling and Analyses

In June 2021, soil was sampled at each subplot using a soil sample probe (stainless-steel, 100 cm3 core) from the certain layers: 0–10 cm, 10–20 cm, 20–30 cm, 30–40 cm, 40–50 cm, 50–75 cm and 75–100 cm. Pretreatment of soil samples for physico-chemical analysis was completed as stated in LVS ISO 11464:2006 [27]. Soil reaction (pH in KCl) was determined as stated in LVS EN ISO 10390:2022 [28]. The content of the HNO3-extractable potassium (K) and phosphorus (P) was measured with the inductively coupled plasma-optical emission spectrometry (ICP-OES) method (the microwave mineralization was used). Total carbon (TC) and total nitrogen (TN) content was determined by dry combustion (elementary analysis) as stated in LVS ISO 10694:2006 [29] and LVS ISO 13878:1998 [30], respectively. Inorganic carbon (carbonate) content was determined by the volumetric method as stated in LVS ISO 10693:2014 [31]. The difference between TC and inorganic C content is equal to organic C (OC) content. In addition, the ratio of soil OC and TN content (C/N ratio) was calculated.

2.4. Measurements of Environmental Parameters

At the each GHG flux measurement date, at each subplot, air and soil temperature at 10 cm depth was determined with a Comet data logger equipped with temperature probes. The soil moisture was determined with a ProCheck meter equipped with a moisture sensor. The GW level was measured by measuring tape inside a GW well installed vertically down to a depth of 1.5 m; the GW temperature and dissolved oxygen (DO) content were measured with a YSI ProDSS water quality meter. The GW wells made of PVC pipes were covered between field surveys to minimize the impact of ambient air.
In addition, at the each GHG flux measurement date, GW was sampled from PVC pipes, and the following variables were determined at the laboratory: pH (reaction) was determined according to LVS ISO 10523:2012 [32]; electrical conductivity (Cond.) was determined according to LVS EN 27888:1993 [33]; total N (TN) and dissolved organic caron (DOC) content was determined as stated in LVS EN ISO 20236:2022 [34] and LVS EN 1484:2000 [35]; potassium (K) content was determined by the flame emission spectrometry method, as stated in LVS ISO 9964-3:2000 [36].

2.5. Sampling and Analyses of Above- and Below-Ground Parts of Vegetation

In each subplot, samples of vegetation (both above- and below-ground parts) were taken at four repetitions in August 2021 (area of each sample plot was 625 cm2). First, the above-ground biomass was collected by cutting all vegetation in the sample plot. Then, the below-ground biomass (roots) was collected by excavating to a depth of 0.25 m and removing soil particles. All samples were transported to the laboratory at the Latvian State Forest Research Institute ‘Silava’. To determine the dry mass of above- and below-ground parts of vegetation, samples were cleaned of remained soil particles by wet sieving (samples of below-ground part of vegetation) and dried at 70 °C. The C content in samples was detected by dry combustion (elementary analysis) as stated in LVS ISO 10694:2006 [29].

2.6. Estimation of Soil Annual GHG Emissions

Soil annual GHG emissions were calculated for each study subplot as the sum of monthly mean GHG emissions expressed as t CO2-C ha−1 month−1 for CO2 emissions, kg CH4-C ha−1 month−1 for CH4 emissions and kg N2O-N ha−1 month−1 for N2O emissions (Equation (1)). Monthly mean GHG emissions were calculated using measurement results from two consecutive years covering all calendar months and, thus, seasons. It was assumed that the monthly mean value of measurement results of instantaneous soil GHG emissions were equal to the mean GHG emissions in the relevant month and subplot. Annual net CO2 emissions were calculated as the difference between annual Rhet (expressed as t CO2-C ha−1 yr−1) and C input with above- and below-ground parts of vegetation (expressed as t C ha−1 yr−1). We did not directly utilize the data of the Rhet measurements; instead, Rhet was derived using the observed relationship in the study, indicating that Rhet is on average 70% of Rtot. Such an approach was used to justify soil C stock change calculation as a sum of estimated Rhet and soil C input. Additional assumptions of the decomposition rate of litter would be needed to estimate soil C stock changes by using data of direct Rhet and litter biomass measurement data. The annual C input from above-ground parts of vegetation was considered the same as C stock in above-ground parts of vegetation in the end of the vegetation season. To calculate the annual C input with below-ground parts of vegetation, it was assumed that the root turnover rate is 0.5 based on Gill and Jackson (2000) [37].
G H G a n n u a l = G H G m o n t h l y m e a n ( J a n D e c )
where GHGannual—soil annual GHG emissions expressed as t CO2-C ha−1 yr−1 for CO2 emissions, kg CH4-C ha−1 yr−1 for CH4 emissions and kg N2O-N ha−1 yr−1 for N2O emissions; GHGmonthly−mean(Jan…Dec)—soil monthly mean GHG emissions covering all calendar months (from January to December) expressed as t CO2-C ha−1 month−1 for CO2 emissions, kg CH4-C ha−1 month−1 for CH4 emissions and kg N2O-N ha−1 month−1 for N2O emissions.

2.7. Statistical Analysis

Software environment R (version 3.4.3) was used for all statistical analyses and graphics [38]. The data sets of instantaneous GHG fluxes did not fit a normal distribution (Shapiro–Wilk normality test was used, p < 0.001). Differences in GHG fluxes values grouped by, for instance, research sites or thickness of soil organic layer were evaluated using pairwise comparisons using Wilcoxon rank sum test with continuity correction. Multivariate regression method was used to analyse the relationship between several independent variables (for instance, environmental parameters) and a dependent variable (GHG fluxes).
Based on data quality check, the results of soil Rhet measurements from 4 subplots (subplot B at research site 1 and subplots A, B and C in research site 3) were included in further data analysis. Data quality check included exclusion of measurement results obtained in subplots where measurement results of Rhet exceeds the results of Rtot from further analysis to avoid risks of overestimating C losses due to soil Rhet.

3. Results and Discussion

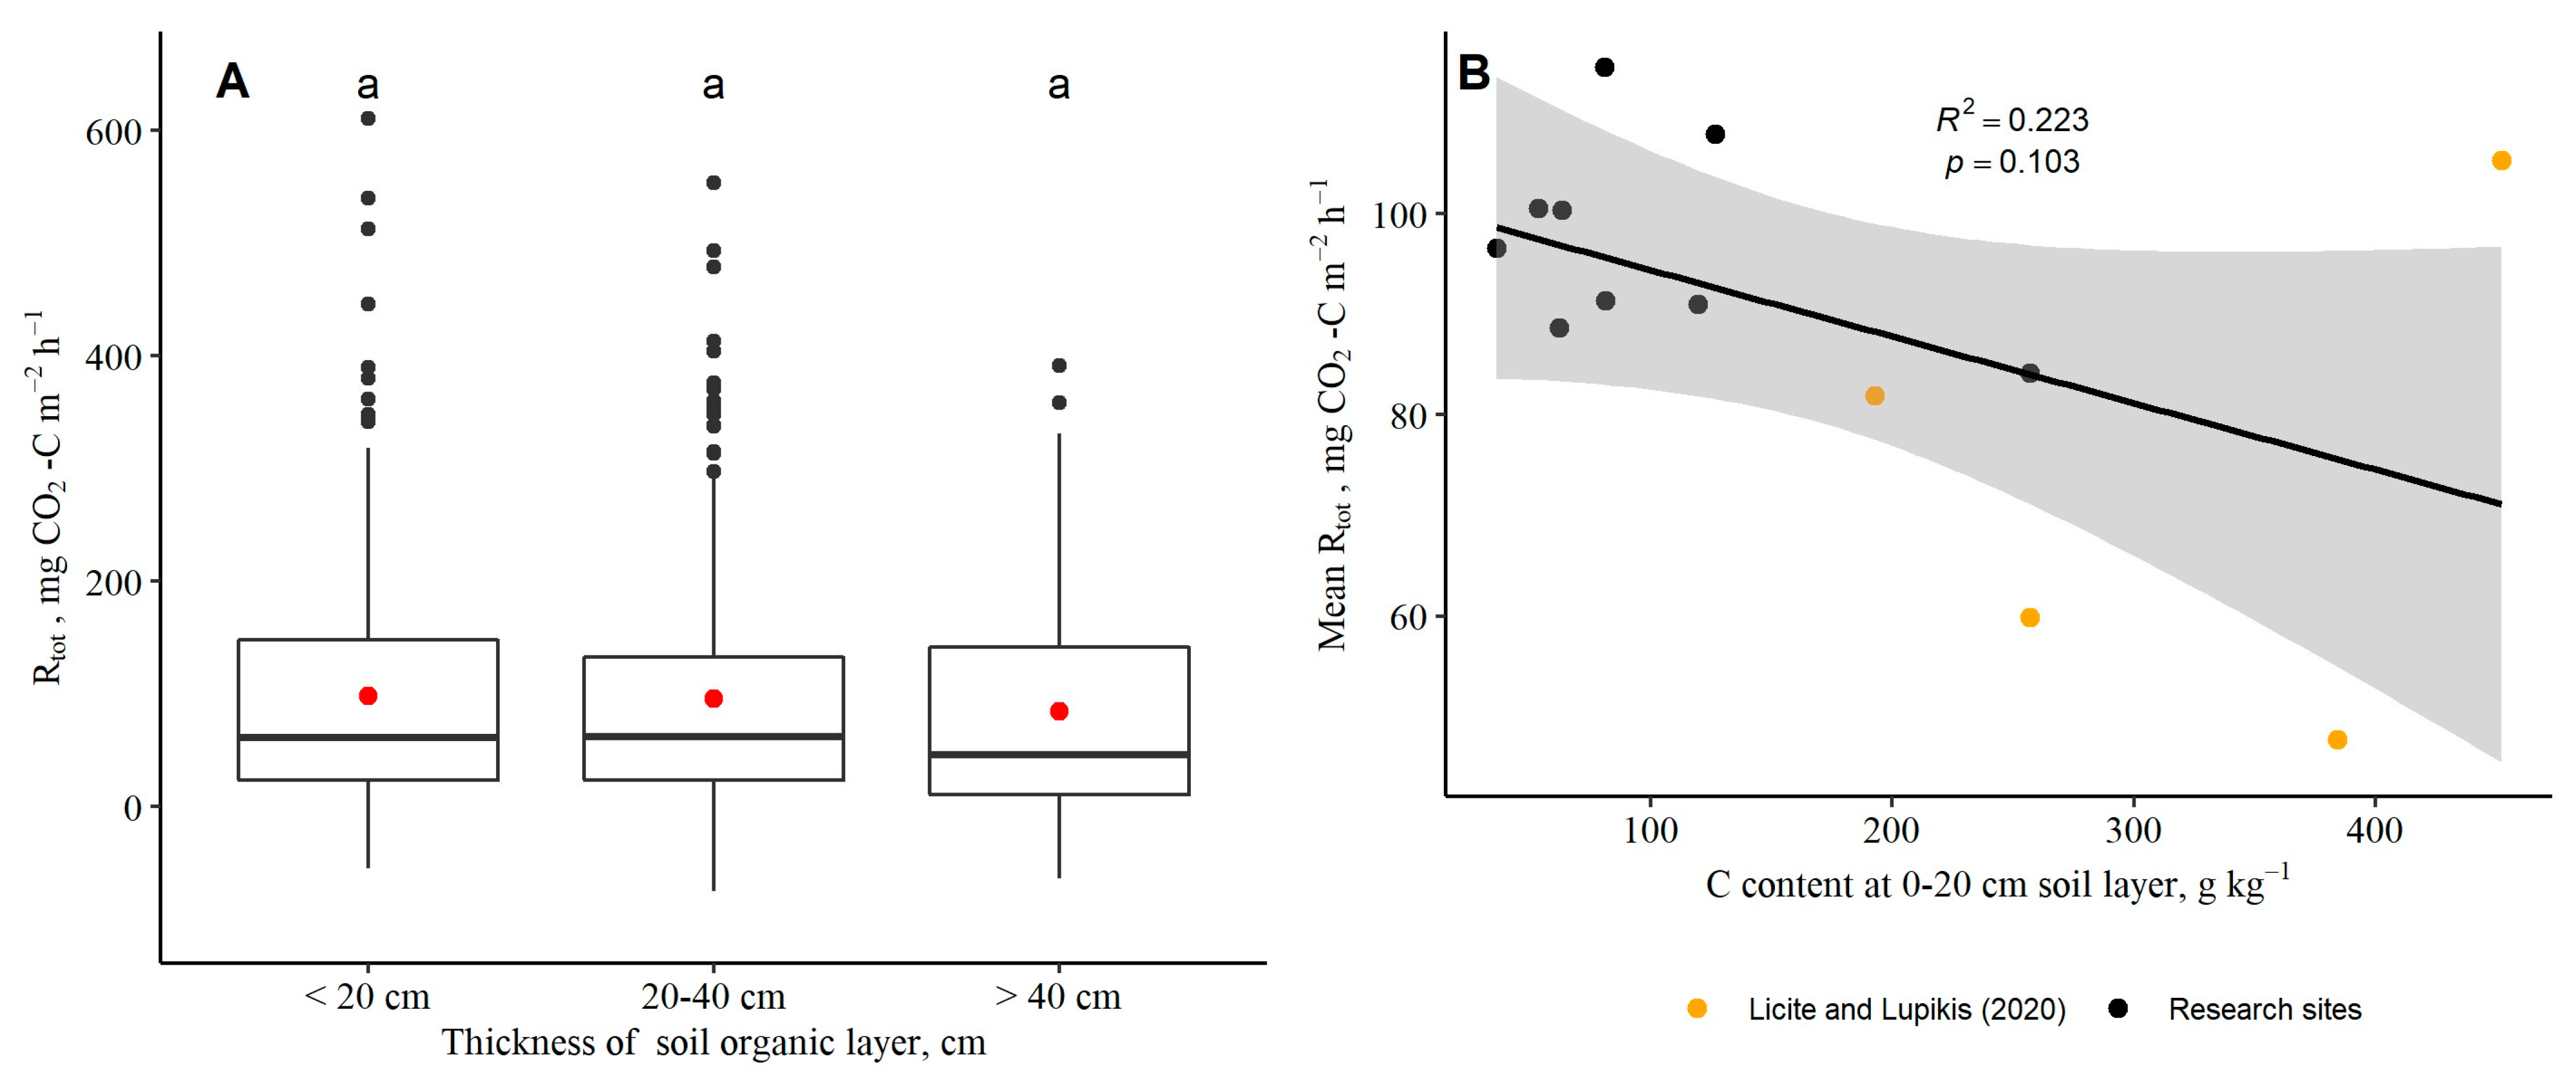
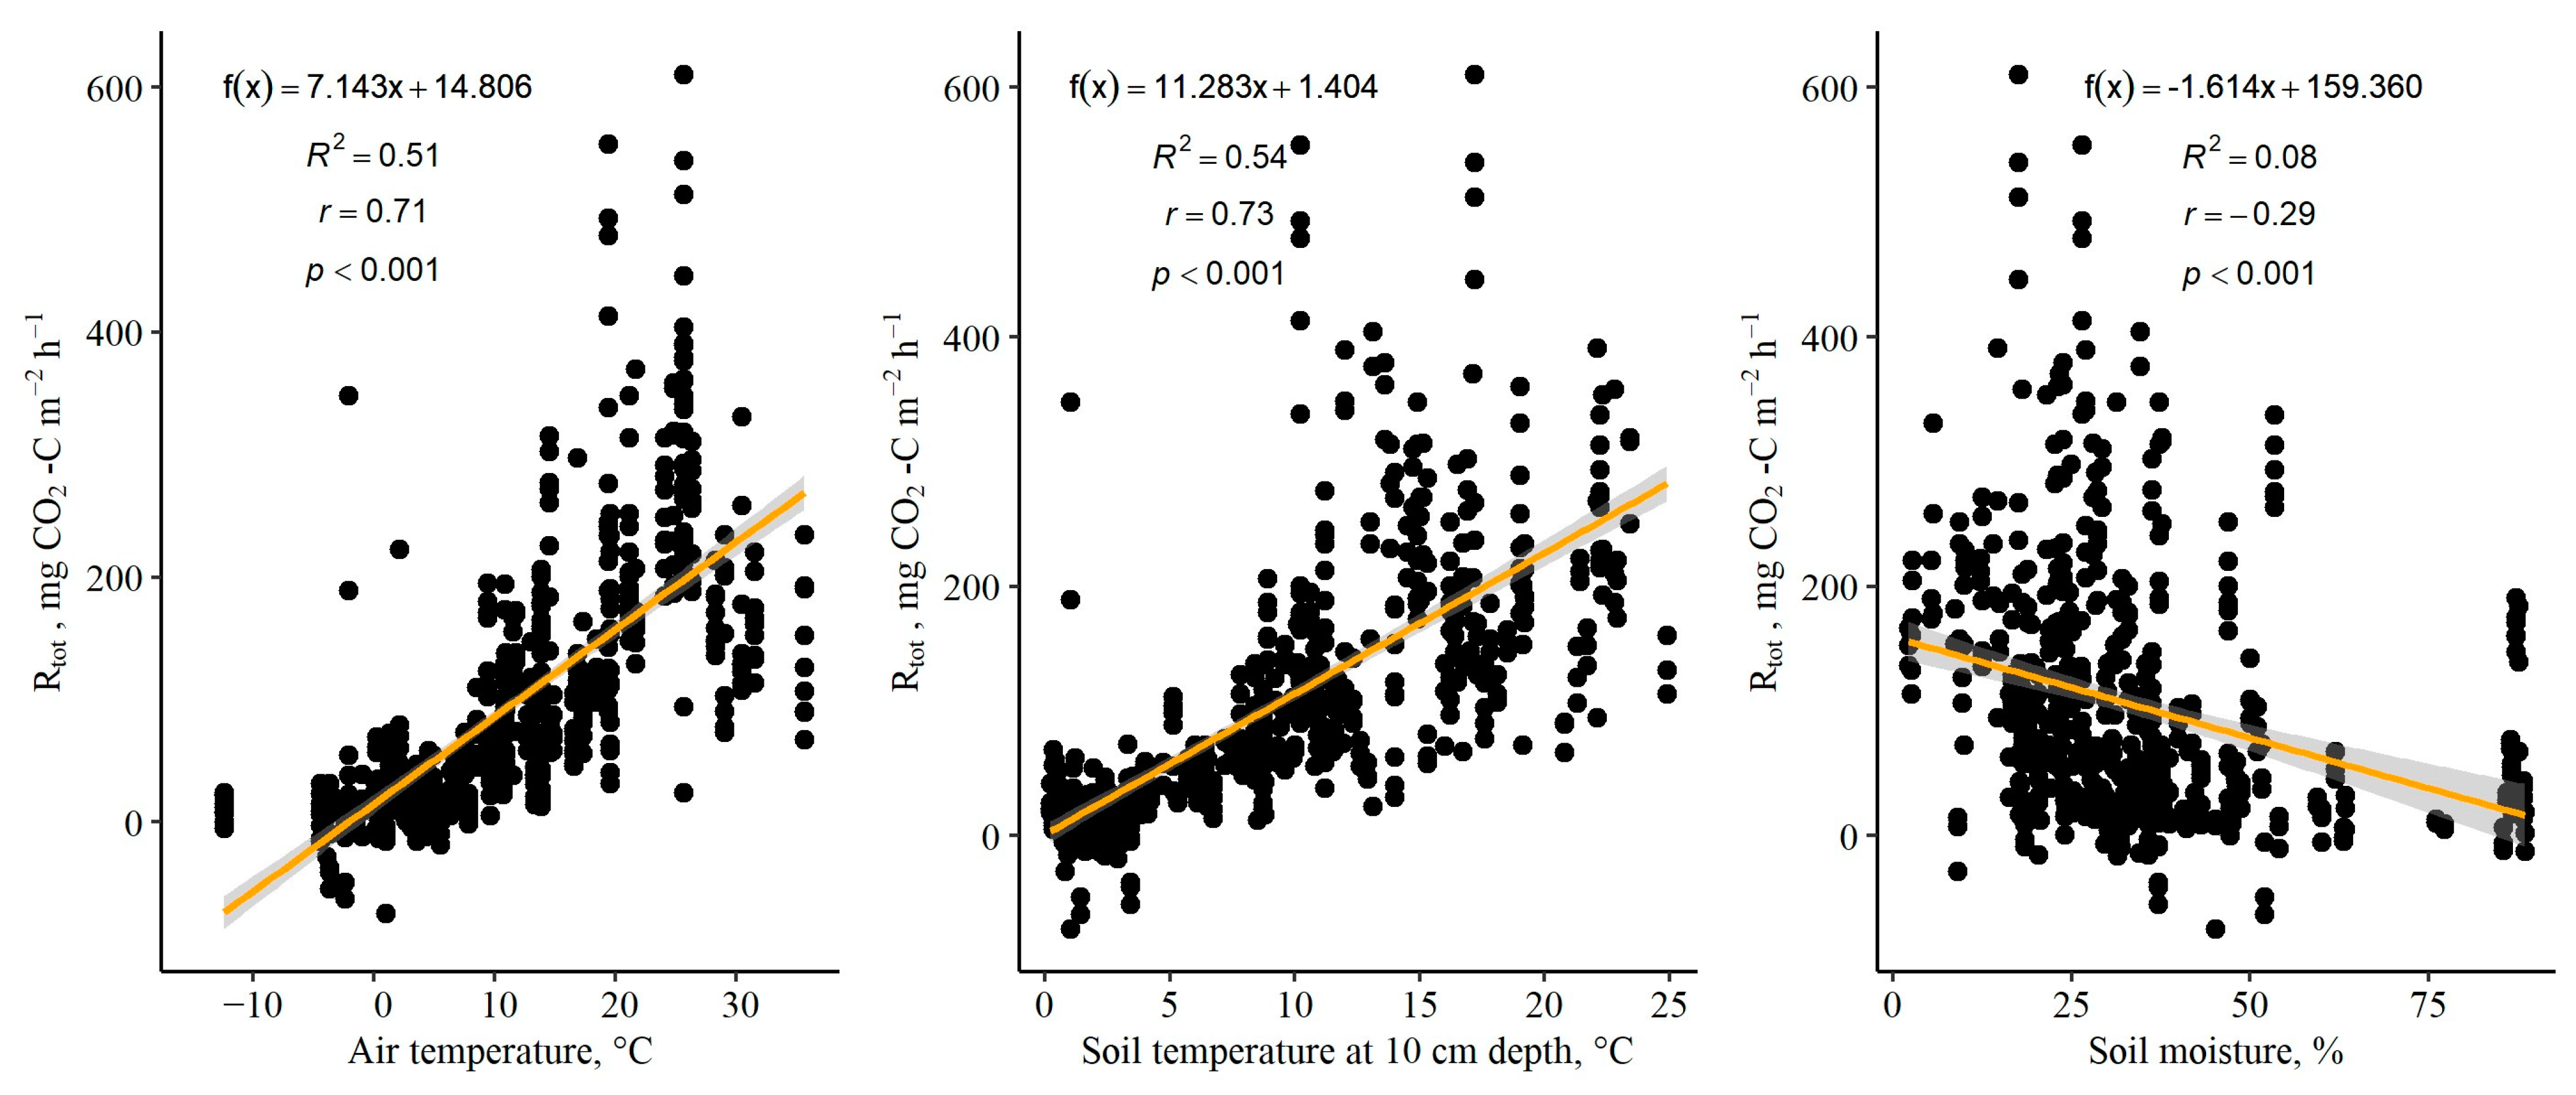
3.1. Soil Total Respiration (Instantaneous)

In terrestrial ecosystems, soil Rtot (sum of an autotrophic and heterotrophic component) is one of the key components in the C balance and nutrient cycling [39]. Results of our study conducted in grassland with organic soils (thickness of soil organic layer ≤ 70 cm) indicated that the monthly mean Rtot among different subplots ranged from −19.0 ± 11.8 mg C m−2 h−1 in December to 435.6 ± 62.0 mg C m−2 h−1 in June, while the annual mean Rtot calculated as the average from monthly means among subplots varied from 84.2 ± 28.8 to 114.6 ± 33.7 mg C m−2 h−1. No statistically significant difference in Rtot values between subplots with different thickness of soil organic layer was found (r = −0.47, p > 0.41, Figure 2A). Although there is a slight tendency (trend is not significant) towards higher soil Rtot with lower soil organic C content, no significant impact of C content in soil (0–20 cm layer) on the mean Rtot was found (r = −0.39, p = 0.103, Figure 2B) and between mean Rtot and C stock in soil at the 0–20 cm layer (r = −0.38, p = 0.307) and other variables of soil chemistry (Table 2). Similarly, a study conducted at the Ruukki research station in Finland found that the thickness of the peat layer (20–80 cm) did not significantly influence CO2 emissions in agricultural land [40]. In Figure 2B, which shows the regression of mean Rtot depending on the C content in soil at the 0–20 cm layer, this study’s results are supplemented by data from a previous study in Latvia conducted in drained grasslands with deep peat soils [41] to obtain a wider data range that includes research sites with higher C content in soil for estimating the relationship.
The instantaneous Rtot was positively correlated with the air temperature (r = 0.71, p < 0.001) and soil temperature at 10 cm depth (r = 0.73, p < 0.001), while it was either not correlated or only weakly correlated with other monitored environmental parameters (r < |0.50|, Figure 3), including the soil moisture, GW level below the soil surface, GW temperature and other water physico-chemical variables (Table 3). Hence, the environmental variable that best explained the variation in Rtot was soil temperature at 10 cm depth (R2 of the linear model with one independent variable was 0.54). The inclusion of other variables into the model such as the thickness of the soil organic layer, C content in soil and other environmental variables did not increase the adjusted R-squared value of the model. Similarly, a study on Danish agricultural peat soils under cool temperate conditions [42] as well as other studies in different climatic regions of the world (e.g., [43]) indicated that temperature (especially soil temperature at 5–10 cm depth), rather than GW level, was the main driver of ecosystem respiration [42].
Within this study, the lowest variation in soil Rtot was observed in a research site where the GW level was constantly below 40 cm during the entire study period, while in other research sites, periodically, the GW level rose and even reached the soil surface (thus, the fluctuation in GW level was higher). Also, the mean Rtot in this object was lower than in other research sites, but the difference was not significant. Thus, short-term soil saturation does not have a significant impact on the magnitude of soil Rtot.

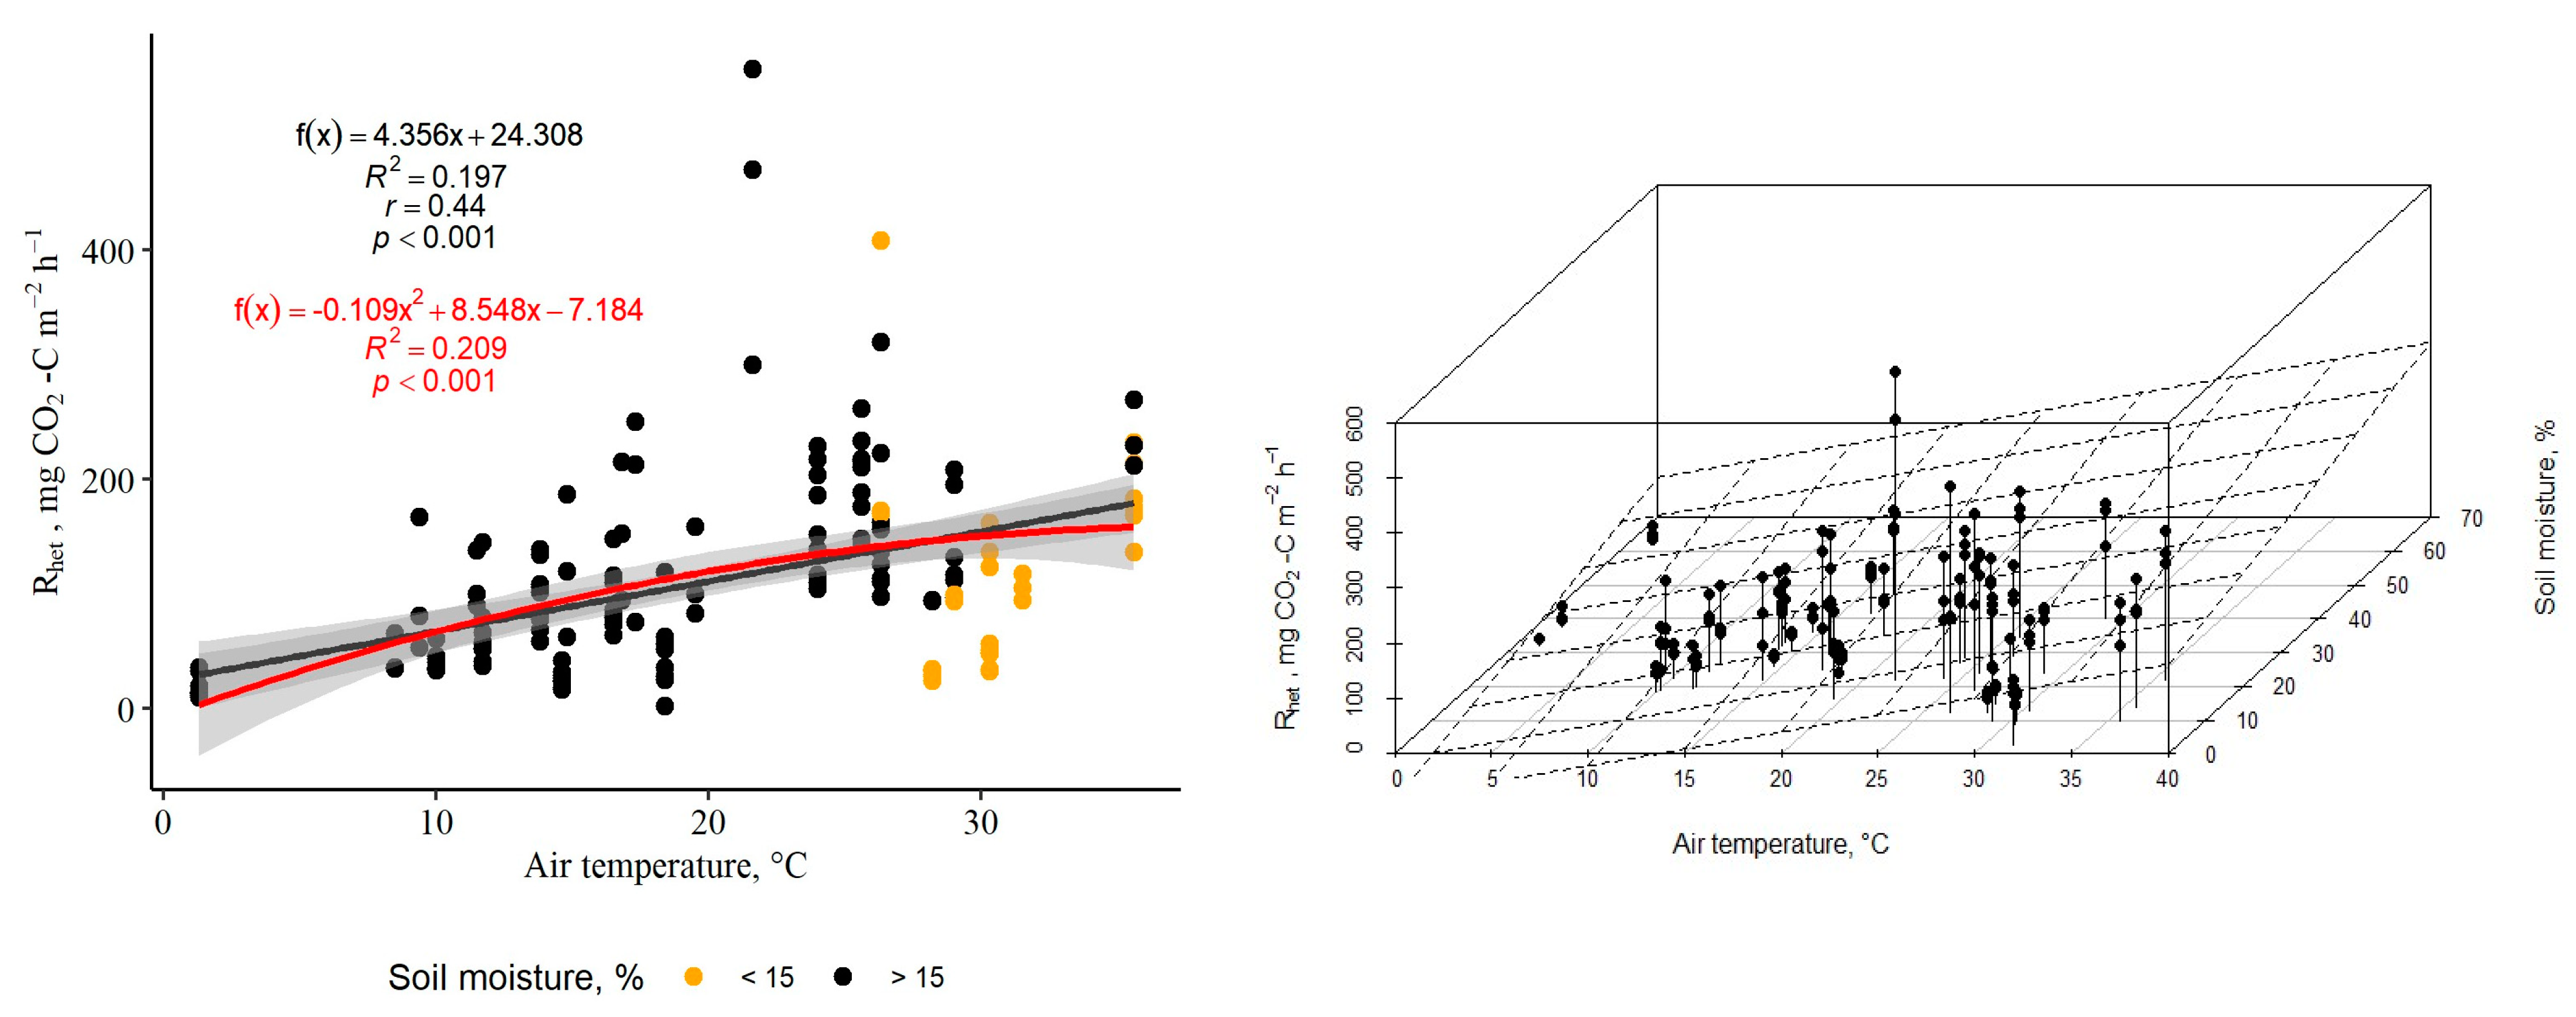
3.2. Soil Heterotrophic Respiration (Instantaneous)

In April–November, the monthly mean Rhet among different sublots varied between 13.9 ± 0.5 mg C m−2 h−1 in November and 274.6 ± 82.7 mg C m−2 h−1 in July, while the mean Rhet calculated as the average from monthly means in April–November, which varied between 74.2 ± 17.8 and 150.1 ± 29.9 mg C m−2 h−1. The mean contribution of soil Rhet to soil total respiration is 70.3%, while the plant-derived CO2 emissions, calculated as the difference between simultaneously detected Rtot (total CO2 fluxes from plots with vegetation cover) and Rhet (CO2 fluxes from bare soil) was 29.7%. The estimated contribution of plant-derived CO2 fluxes is similar to results (27–63%) obtained in central and southern Sweden (where the climate is similar to that of Latvia) and reported by Berglund et al. (2011, 2021) [44,45] and Norberg et al. (2016) [46], thus validating the methodologic approach of Rhet‘s measurement results interpretation in the study.
The instantaneous Rhet was positively correlated with the air temperature (among the subplots, r ranged up to 0.72, p < 0.001) and soil temperature at 10 cm depth (among the subplots, r ranged up to 0.68, p < 0.001), while these were either not correlated or only weakly correlated with other monitored environmental parameters (r < |0.50|). Thus, based on our dataset, the variable that best reflected the variation in Rhet was air temperature (R2 of linear model with one independent variable was 0.20, R2 of polynomial model was 0.21). However, there was a highly research subplot-specific dependency of soil Rhet response to the monitored environmental parameters.
Although no correlation between Rhet and soil moisture was found, there is a slight trend that at high air temperatures and low soil moisture, Rhet does not follow an increasing regression between Rhet and air temperature (Figure 4). Thus, at high air temperature and simultaneously dry conditions, the Rhet intensity may stop increasing or even begin lowering. Also, previous studies have concluded that soil moisture has an impact on CO2 fluxes—a parabolic dependence of CO2 fluxes on soil moisture was observed [8].

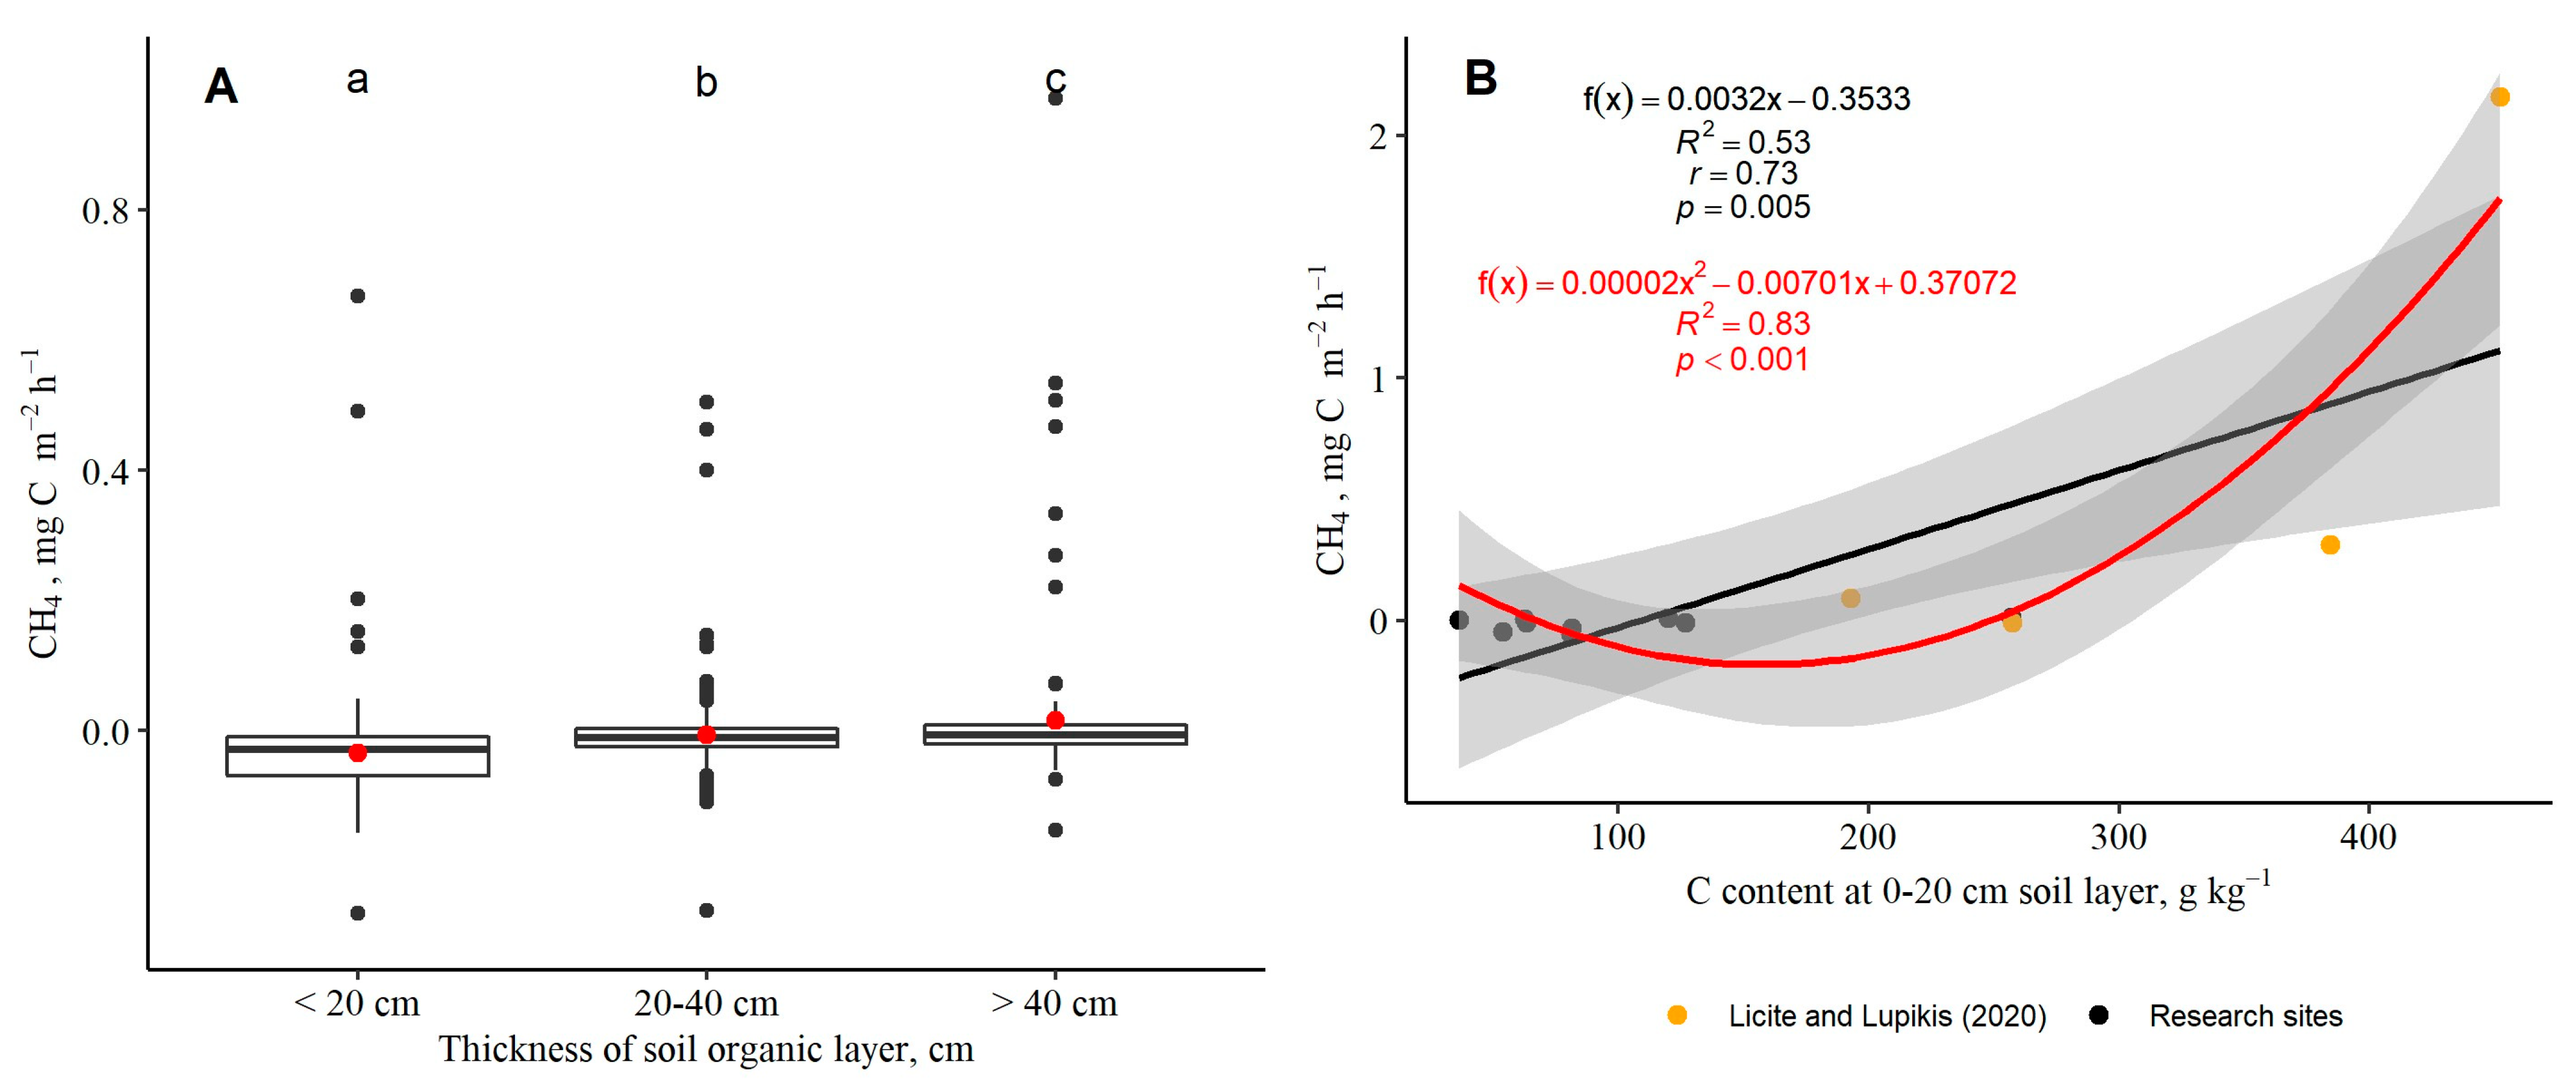
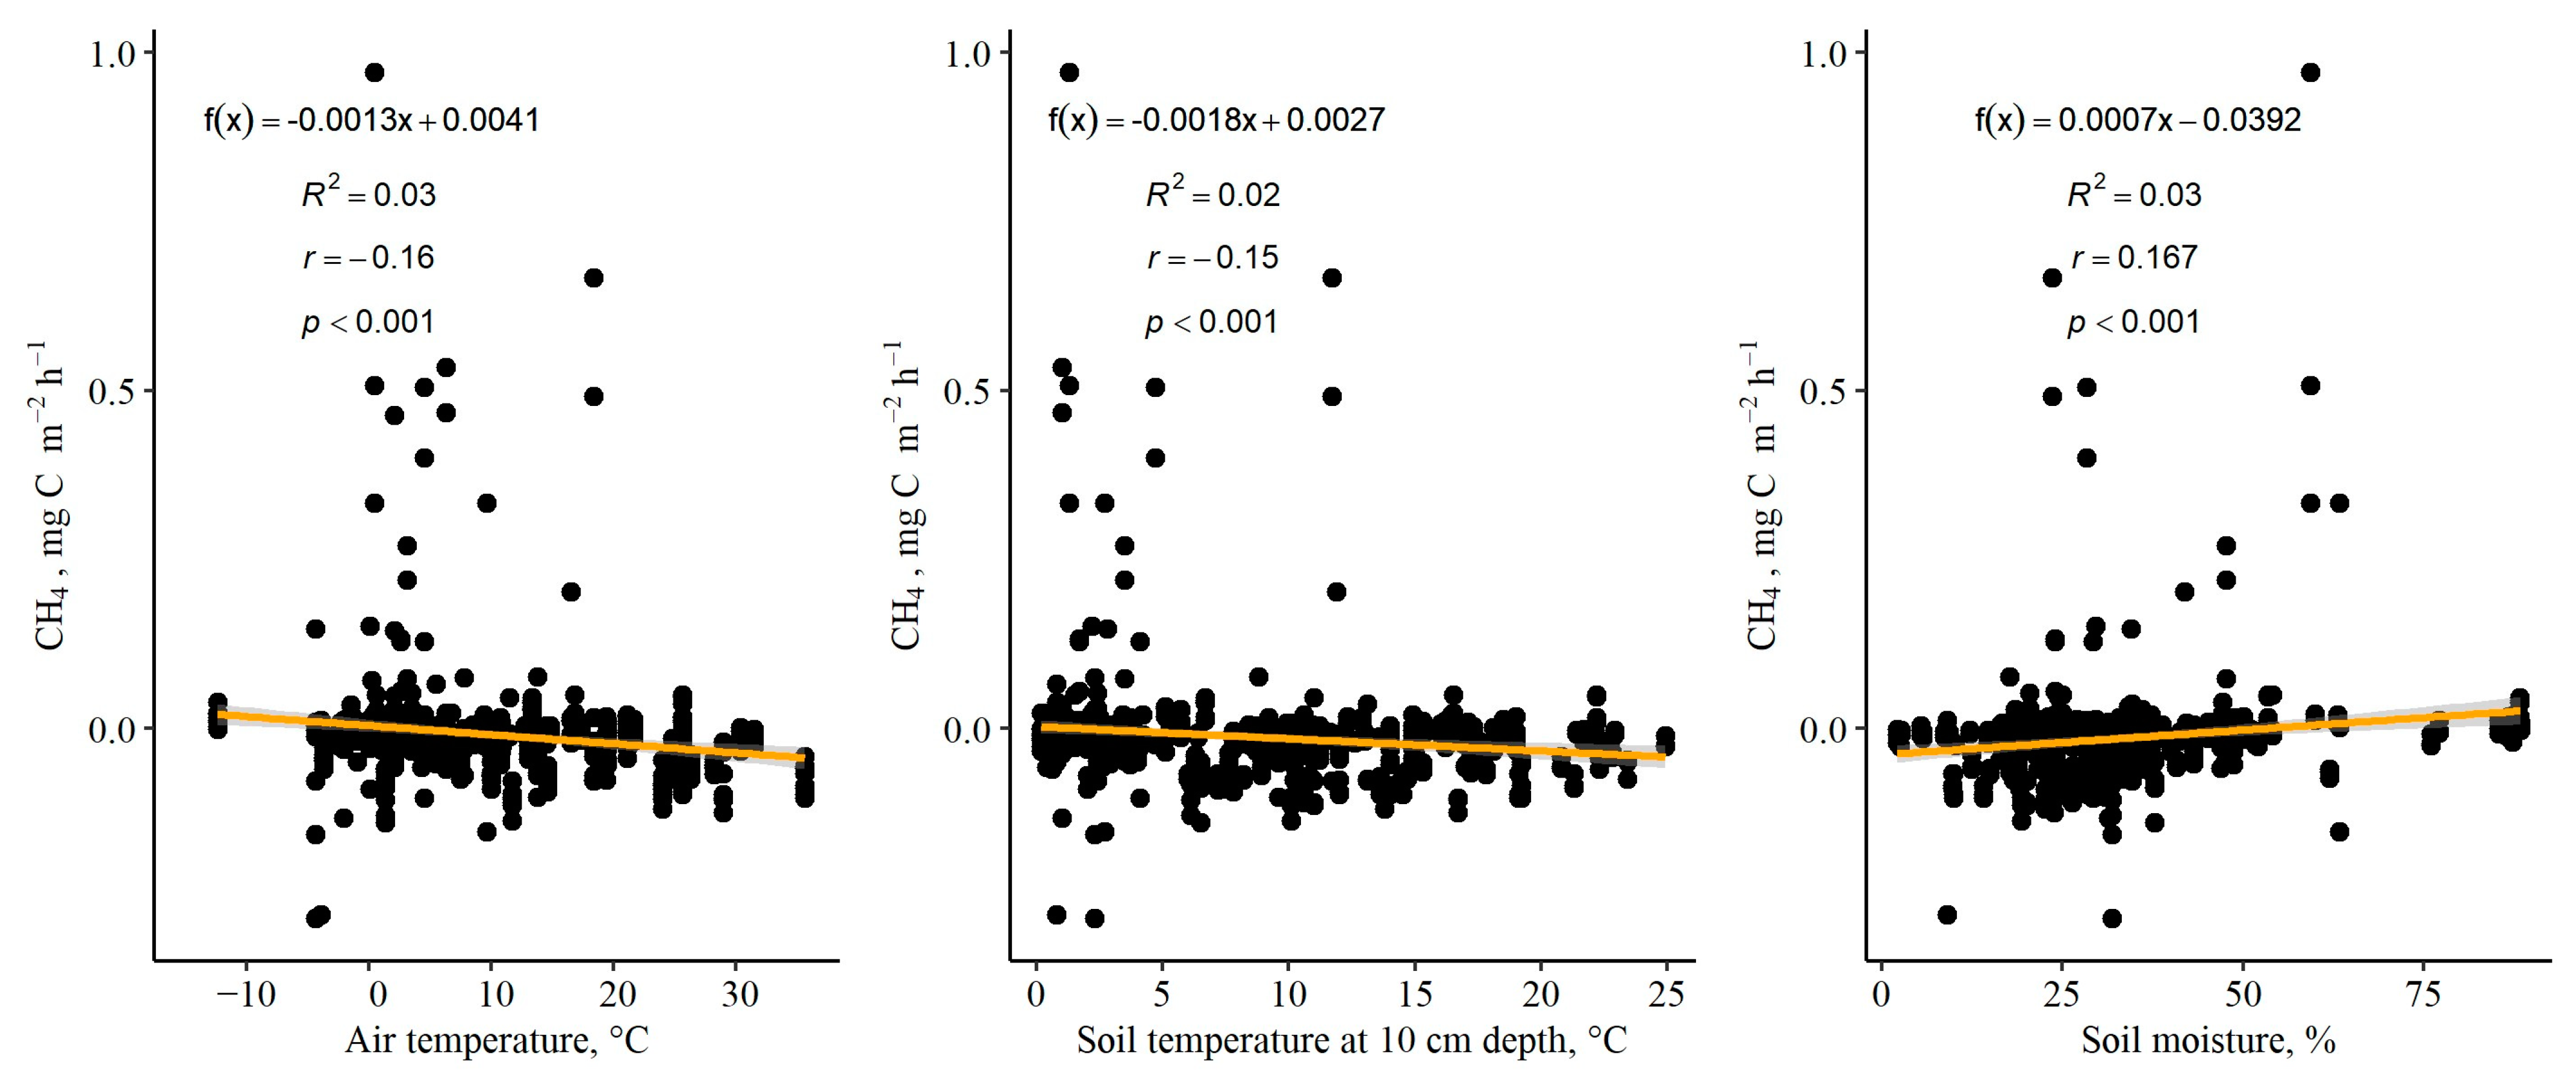
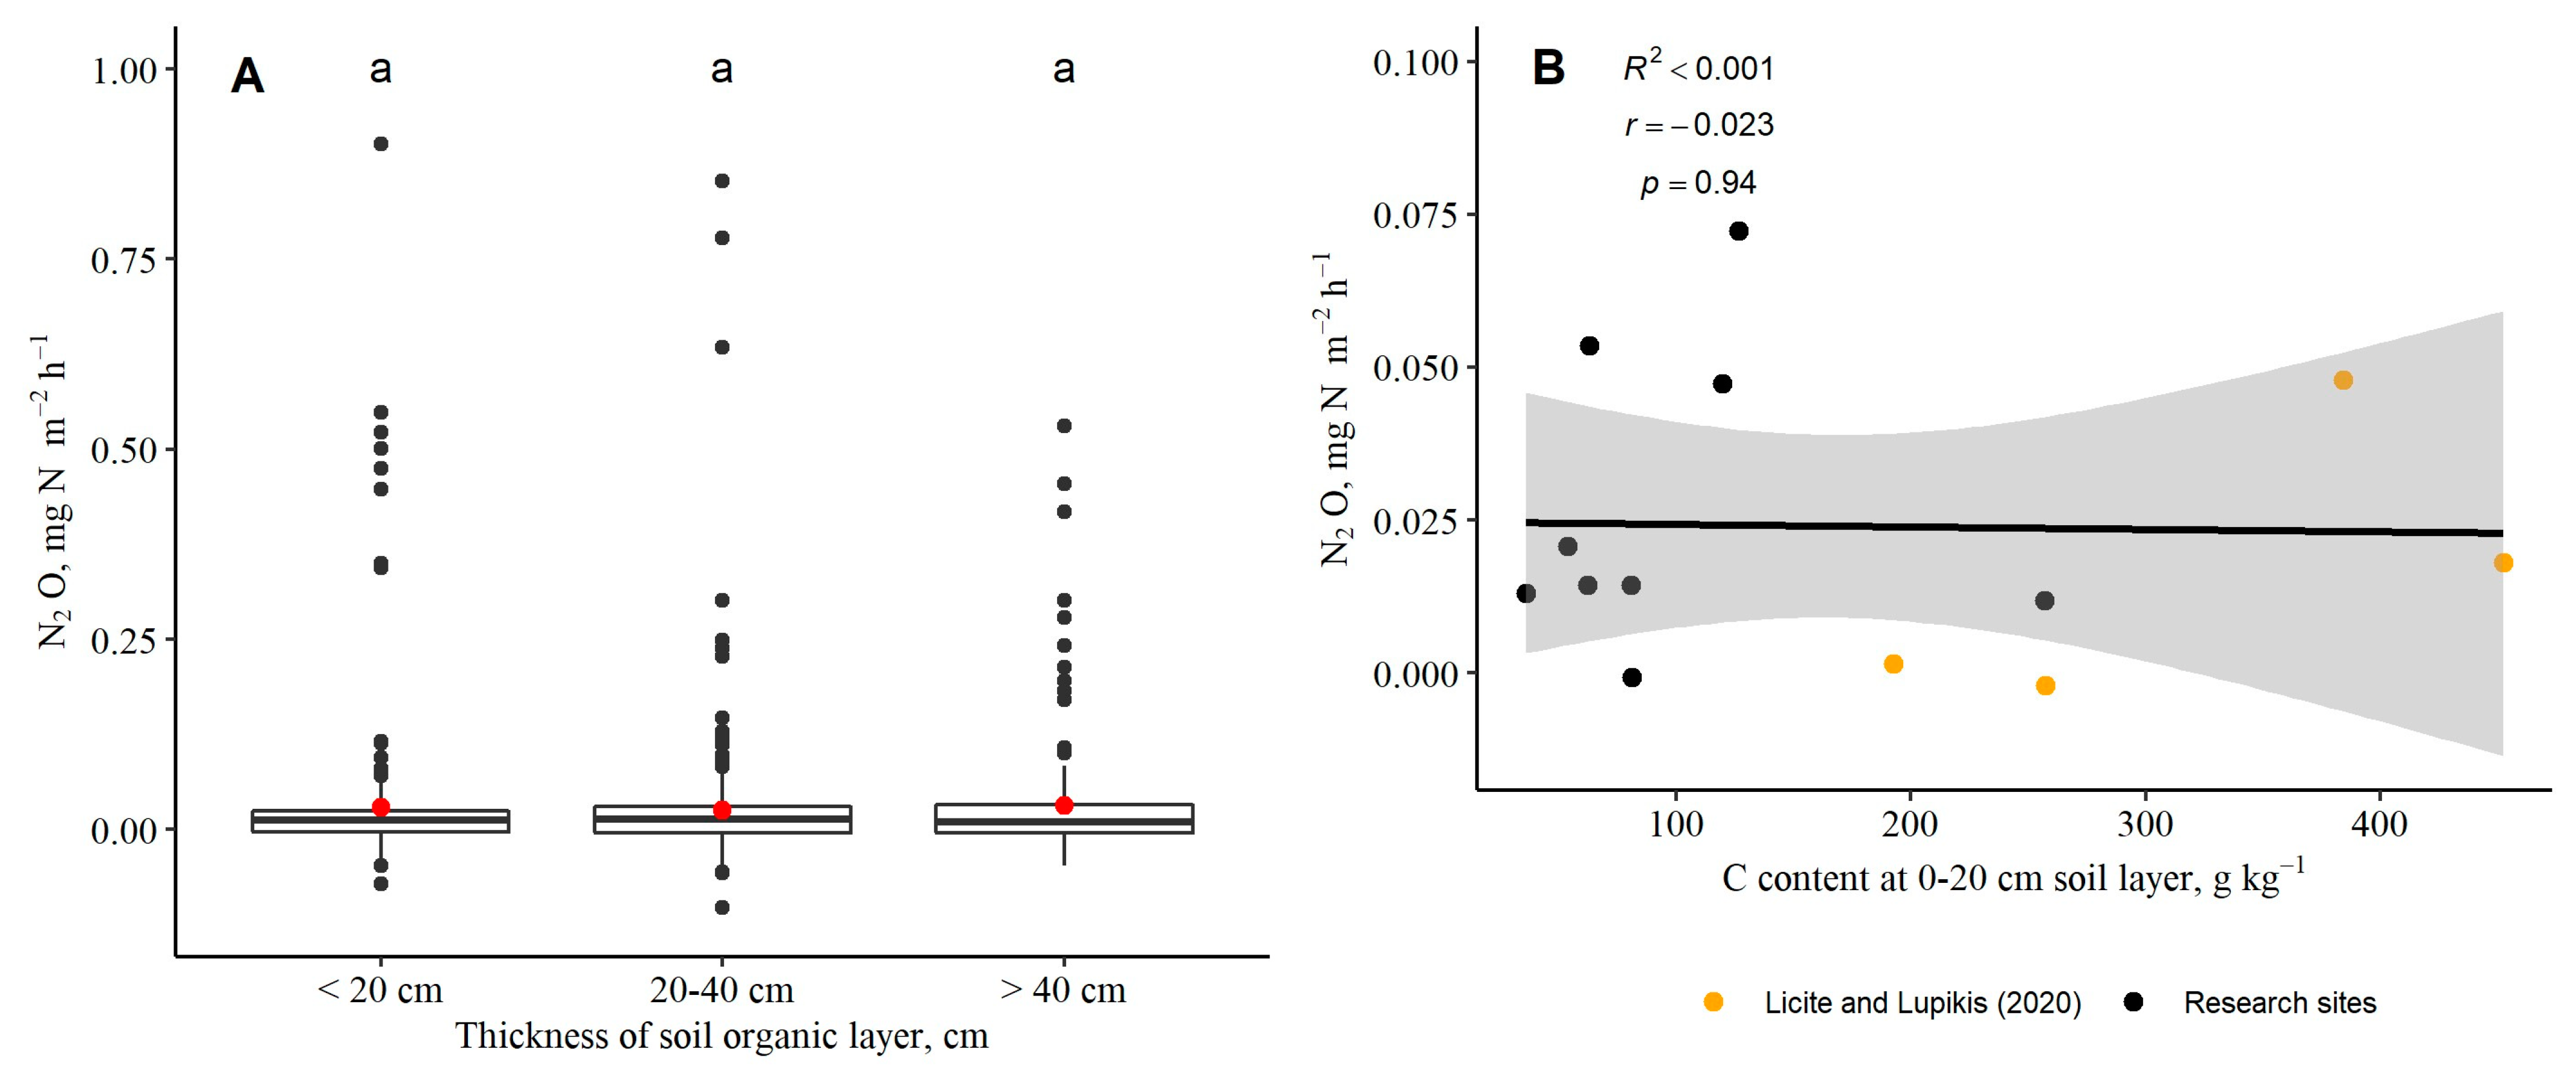
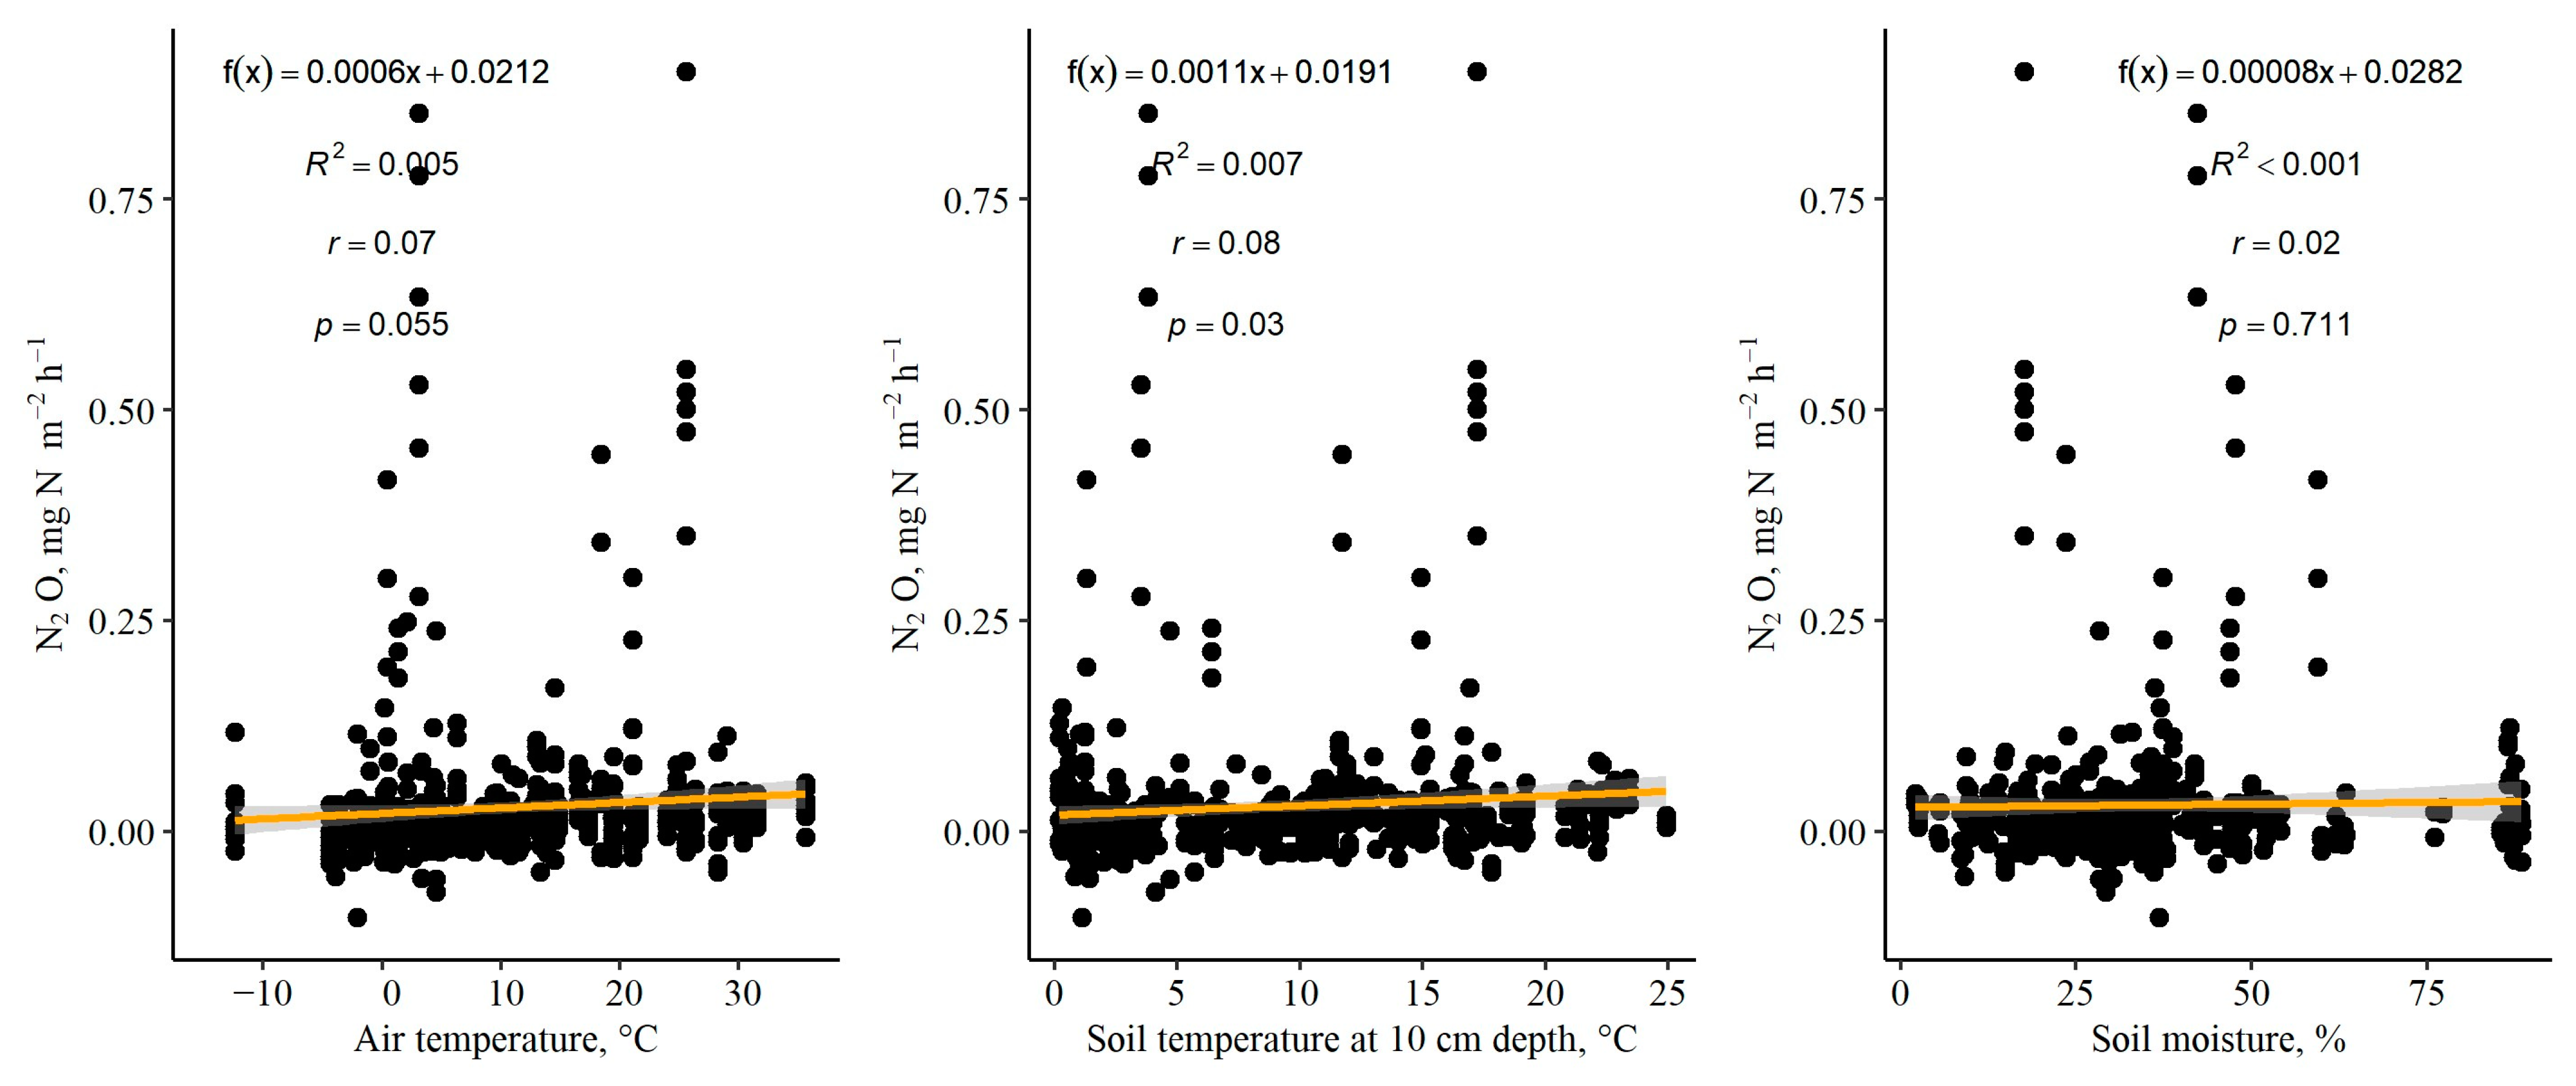
3.3. Soil-to-Atmosphere CH4 and N2O Fluxes (Instantaneous)

CH4 fluxes remained predominantly low, with minimal removal or zero emissions observed during most of the study period. CH4 fluxes above 0.50 mg CH4-C m−2 h−1 were seldom observed. The monthly mean CH4 fluxes among different sublots ranged from −0.099 ± 0.005 mg C m−2 h−1 in July to 0.207 ± 0.114 mg C m−2 h−1 in April, while the annual mean instantaneous soil-to-atmosphere CH4 fluxes calculated as the average from monthly means among different subplots ranged from −0.057 ± 0.009 to 0.012 ± 0.010 mg C m−2 h−1. The thickness of the soil organic layer and C content in soil as well as C stock had a strong impact on CH4 fluxes, and emissions increased with the increasing thickness of the organic soil layer (Figure 5A) and C content in soil (Figure 5B). In general, CH4 production may occur under anaerobic conditions through methanogenesis in the absence of electron acceptors, while under aerobic conditions, both soil and atmospheric CH4 can be oxidized [47]. The observed increase in magnitude of CH4 fluxes with an increase in the thickness of the soil organic layer and C content in soil could be explained by the larger soil organic C availability in deeper soil layer in combination with more anaerobic conditions and, thus, a greater thickness of the potential CH4 production zone [48]. Furthermore, among our research sites, the thickness of the organic soil layer negatively correlated with the mean GW level below the soil surface (r = −0.79, p = 0.012).
It is well known that temperature is a significant influencing factor of CH4 fluxes, since both CH4 production and consumption are microorganism-driven processes [47]. Simultaneously, the GW level and soil moisture are among the key influencing factors of CH4 emissions; furthermore, it is underlined that significant CH4 emissions in drained areas occur only when the mean GW level is near the surface for a sufficiently long period [47,49]. Within this study, CH4 fluxes were largely similar throughout the year despite variations in air temperature, soil temperature, soil moisture and GW level (Figure 6); no strong correlations were found between instantaneous CH4 fluxes and different environmental parameters (r < |0.50|). Similar results were observed, for instance, in a study focused on organic soils in western Denmark managed by agriculture [50].
The majority of N2O released from organic soils is the result (by-product) of both denitrification and nitrification processes [51]. In general, we observed low N2O fluxes with occasional peaks reaching less than 1.0 mg N2O-N m−2 h−1. The monthly mean N2O fluxes among different sublots varied between −0.027 ± 0.004 mg N m−2 h−1 in December and 0.550 ± 0.076 mg N m−2 h−1 in June, while the annual mean instantaneous soil-to-atmosphere N2O fluxes, calculated as the average from monthly means among different subplots, varied between −0.001 ± 0.004 and 0.072 ± 0.030 mg N m−2 h−1.
No significant difference in N2O fluxes between subplots with different soil organic layer thicknesses was found (r = −0.18, p = 0.68, Figure 7A). Also, no significant dependence of mean N2O fluxes on C content in soil at the 0–20 cm layer was found (r = −0.02, p = 0.94, Figure 7B). The mean N2O fluxes correlated positively with C stock in soil at the 0–20 cm layer (r = 0.46) and N content in soil at the 0–40 cm layer (r = 0.59), although the correlations were not statistically significant (p = 0.215 and p = 0.094, respectively).
The magnitude of N2O emission is mainly controlled by a number of factors such as climatic variables (especially temperature), electron donor availability, mineral N concentrations, oxygen status and soil carbon to nitrogen ratio and pH [50,51,52]. Within this study, no significant dependence of instantaneous N2O fluxes on different environmental parameters (r < |0.50|, p > 0.05, Figure 8) was found.

3.4. Annual GHG Fluxes

A summary of the annual Rtot, Rhet, C input with above- and below-ground parts of vegetation, as well as the soil-to-atmosphere annual CH4 and N2O fluxes is shown in Table 4. The annual C input into soil with above- and below-ground parts of vegetation in grassland (mean 2.53 ± 0.30 t C ha−1 yr−1, Table A1) does not compensate for losses of soil C caused by the mineralization of soil organic matter (mean Rhet 6.01 ± 0.20 t C ha−1 yr−1). Thus, all soils in the studied research sites were net sources of CO2 emissions. The annual net CO2 emissions from studied soils in grassland were calculated as the difference between Rhet and C input with the above- and below-ground parts of vegetation, which ranged from 2.06 to 5.08 t CO2-C ha−1 yr−1 with a mean value of 3.48 ± 0.33 t CO2-C ha−1 yr−1. The estimated mean annual net CO2 emissions are lower than the IPCC default emission factors [53] for drained grasslands in temperate zones with deep-drained, nutrient-rich organic soils (6.1 t CO2-C ha−1 yr−1) and nutrient-poor organic soils (5.3 t CO2-C ha−1 yr−1), while they were similar to those provided for shallow-drained, nutrient-rich organic soils (3.6 t CO2-C ha−1 yr−1) and reported in previous studies—for instance, in Finland (3.95 t CO2-C ha−1 yr−1) [54]. The annual net CO2 emission factor estimated for drained grassland with deep peat soil in a previous study in Latvia [41] is slightly higher (4.4 t CO2-C ha−1 yr−1) than our estimates within this study. Among our research sites, no significant correlations between annual net CO2 emissions and thickness of the soil organic layer or SOC stock were found (r < 0.50, p > 0.05), while the annual net CO2 emissions correlated positively with mean GW level (r = 0.52), although the correlation was not statistically significant (p = 0.150).
Our research sites acted as both a small CH4 sink and source with a mean value of −1.17 ± 0.75 kg CH4-C ha−1 yr−1. Thus, the contribution of CH4 fluxes to the total GHG balance of studied organic soils in grassland in Latvia was generally insignificant. Monitoring sites in grasslands with organic soil with CH4 sink profiles or that are neutral with respect to CH4 fluxes were found also in previous studies in Denmark [50,55], Germany [17] and Nordic countries (e.g., [54,56]). The default CH4 emission factors stated by the IPCC for drained grassland in temperate zone are significantly higher than our estimates and range from 1.8 kg CH4 ha−1 yr−1 for nutrient-poor areas to 39 kg CH4 ha−1 yr−1 for shallow-drained, nutrient-rich areas [53]. Also, the CH4 emission factor estimated for drained grassland with deep peat (>40 cm) soil in a previous study in Latvia [41] is significantly higher (57.8 kg CH4-C ha−1 yr−1) than our estimates within this study. All of our research sites were deep-drained with a mean GW level > 50 cm below the soil surface (Table 1) excluding one subplot with a mean GW level of 27.2 ± 3.8 cm and organic soil layer thickness of 70 cm, where the highest CH4 emissions were detected (1.07 kg CH4-C ha−1 yr−1). In general, annual CH4 emissions correlate positively with soil organic layer thickness (r = 0.63, p = 0.067), soil organic C and total N stock in soil (r = 0.86, p = 0.003 and r = 0.62, p = 0.075, respectively). Thus, the thickness of the organic soil layer and soil organic C stock could be one of the reasons for the differences in CH4 emission factors elaborated previously in Latvia [41] and within this study. No correlation between annual CH4 emissions and mean GW level was found. Previous studies have emphasized that CH4 emissions and their variability increased with GW level with higher emissions starting at a GW level of around 20 cm below the soil surface [13]. In our research sites, the mean GW level did not exceed 27 cm below the soil surface (Table 1); thus, the conditions in research sites favour methanotrophy over methanogenesis.
Organic soils in managed grasslands can be a significant source of N2O emissions [57]. Among our research sites, annual N2O fluxes ranged from −0.06 to 6.29 kg N2O-N ha−1 yr−1 with a mean value of 2.39 ± 0.70 kg N2O-N ha−1 yr−1. The N2O emission factor provided by IPCC for drained grassland in temperate zone ranges from 1.6 kg N2O-N ha−1 yr−1 for shallow-drained, nutrient-rich areas to 8.2 kg N2O-N ha−1 yr−1 for deep-drained, nutrient-rich areas [53]. Our research sites correspond to the deep-drained, nutrient-rich areas; thus, the elaborated annual N2O emission factor is lower than that provided by the IPCC. The mean N2O emission factor estimated for drained grassland with deep peat (> 40 cm) soil in a previous study in Latvia [41] is significantly lower (0.3 kg N2O–N ha−1 yr−1) than our estimates within this study. However, there was a clear spatial variation in the annual N2O similar to those found from organic agricultural soil, for instance, in Finland [54] and Germany [13]. Studies often emphasize the impact of N fertilizer application, GW level and winter temperature on annual N2O emissions from organic soils in grassland [20,57]. Among our research sites, the annual N2O emissions correlated positively with N stock in soil at 0–40 cm depth (r = 0.59, p = 0.095) and GW electrical conductivity (r = 0.65, p = 0.056) and negatively with GW DOC concentration (r = −0.80, p = 0.010).

4. Conclusions

The studied drained organic soils in grassland acted as a source of net CO2 emissions, releasing a mean of 3.48 ± 0.33 t CO2-C ha−1 yr−1; furthermore, the net soil C losses made the largest contribution to total soil GHG emissions. The annual C input into soil with above- and below-ground parts of vegetation in grassland does not compensate for losses of soil C caused by the mineralization of soil organic matter. No evidence was obtained that the thickness of the soil organic layer (ranged from 10 to 70 cm) and OC stock in soil can be considered some of the main affecting factors of the magnitude of net CO2 emissions from drained organic soil.
The studied organic soils were mostly sources of N2O emissions, releasing a mean of 2.39 ± 0.70 kg N2O-N ha−1 yr−1, while atmospheric CH4 exchange ranged from removals in research sites where the thickness of the soil organic layer is <20 cm (mean −3.26 ± 1.33 kg CH4-C ha−1 yr−1) to emissions in research sites where the thickness of the soil organic layer is >40 cm (mean 0.96 ± 0.10 kg CH4-C ha−1 yr−1).
Compared to the relevant annual soil-to-atmosphere GHG fluxes expressed by the default emission factors for deep-drained, nutrient-rich organic soils in temperate zones stated by the IPCC, the studied drained organic soils in grassland showed lower GHG fluxes generally. Additionally, both net CO2 and CH4 emissions were also lower than previous estimates for deep peat (>40 cm) soils in drained grassland in Latvia.
Future research should focus on continuing to improve estimates of GHG emissions from drained organic soils with different soil organic layer thicknesses distributed across agricultural land in the region, and studies should also be conducted on various additional impacting factors including soil compaction, type of grassland vegetation and species composition as well as nutrient availability.

Author Contributions

Conceptualization, A.B. (Arta Bārdule); methodology, A.B. (Aldis Butlers); software, A.B. (Arta Bārdule); validation, G.P. and D.P.; formal analysis, I.L.; investigation, A.B. (Arta Bārdule), I.S. and Z.A.Z.; resources, I.L.; data curation, D.P. and R.N.M.; writing—original draft preparation, A.B. (Arta Bārdule); writing—review and editing, A.B. (Arta Bārdule) and A.B. (Aldis Butlers); visualization, A.B. (Arta Bārdule); supervision, I.L.; project administration, I.L.; funding acquisition, I.L. All authors have read and agreed to the published version of the manuscript.

Funding

The Norwegian Financial Mechanism 2014-2021 Program “Mitigation of Climate Change, Adaptation to Climate Change, and the Environment” pre-defined project “Enhancement of sustainable soil resource management in agriculture” (2021/6e-JP/SAD (ZM Nr.2021/20)). The APC was funded by the Latvian State Forest Research Institute ‘Silava’.

Institutional Review Board Statement

Not applicable.

Data Availability Statement

Data are available upon request made to the corresponding author.

Acknowledgments

The contribution of Al.B., D.P., G.P., Z.A.Z. and I.S. was supported by the European Regional Development Fund project “Evaluation of factors affecting greenhouse gas (GHG) emissions reduction potential in cropland and grassland with organic soils” (No. 1.1.1.1/21/A/031), the contribution of R.N.M. was supported by the doctoral grant project (No. 8.2.2.0/20/I/006), the contribution of I.L. was supported by EU LIFE Programme project “Demonstration of climate change mitigation potential of nutrient rich organic soils in Baltic States and Finland” (LIFE OrgBalt, LIFE18 CCM/LV/001158). The authors are grateful for the support to the GHG field measurement team (Guntis Saule, Andris Turks, Mārtiņš Vanags Duka and Ritvars Ancāns) and Laboratory of Forest Environment for the contribution. The authors thank Emīls Mārtiņš Upenieks for help preparing Figure 1 and Santa Kalēja for support in the project administration.

Conflicts of Interest

The authors declare no conflicts of interest.

Appendix A

Table A1. Biomass of vegetation of both above- and below-ground parts (AGB and BGB, respectively) in research sites in grassland in Latvia (sampled in August 2021) and estimated C input to soil with above- and below-ground parts of vegetation (mean ± S.E. values are provided).
Research SiteBiomass,
t DM ha−1
C Stock,
t C ha−1
Annual C Input,
t C ha−1 yr−1
AGBBGBAGBBGBTotal
RS1 3.88 ± 1.130.69 ± 0.10 1.75 ± 0.52 0.29 ± 0.04 1.89 ± 0.43
RS26.50 ± 0.920.98 ± 0.213.00 ± 0.430.40 ± 0.093.20 ± 0.61
RS32.75 ± 0.386.26 ± 0.491.26 ± 0.182.49 ± 0.182.50 ± 0.25
All research sites pooled4.37 ± 0.55 2.65 ± 0.472.00 ± 0.261.06 ± 0.182.53 ± 0.30
Figure A1. Variation in soil temperature (at 10 cm depth), groundwater level and soil moisture in the research sites during GHG sampling (field surveys within the study). In the box plots, the medians are shown as bold horizontal lines in the boxes, the mean values are shown as red dots, and the black dots denote outliers of the datasets.
Agriculture 14 00387 g0a1

References

  1. Joosten, H. What are peatlands? In Assessment on Peatlands, Biodiversity and Climate Change; Parish, F., Sirin, A., Charman, D., Joosten, H., Minayeva, T., Silvius, M., Eds.; Global Environment Centre: Kuala Lumpur, Malaysia; Wetlands International: Wageningen, The Netherlands, 2008; pp. 8–19. [Google Scholar]
  2. Mitsch, W.J.; Bernal, B.; Hernandez, M.E. Ecosystem services of wetlands. Int. J. Biodivers. Sci. Ecosyst. Serv. Manag. 2015, 11, 1–4. [Google Scholar] [CrossRef]
  3. An, S.; Verhoeven, J.T.A. Wetland functions and ecosystem services: Implications for wetland restoration and wise use. In Wetlands: Ecosystem Services, Restoration and Wise Use; Verhoeven, J.T.A., Ed.; Springer: Cham, Switzerland, 2019; Volume 238, pp. 1–10. [Google Scholar]
  4. FAO. Peatlands and Climate Planning—Part 1: Peatlands and Climate Commitments; Food and Agriculture Organization of the United Nations: Rome, Italy, 2022; pp. 1–70. [Google Scholar]
  5. Oleszczuk, R.; Regina, K.; Szajdak, L.; Höper, H.; Maryganova, V. Impact of agricultural utilization of peat soils on the greenhouse gas balance. In Peatlands and Climate Change; Strack, M., Ed.; International Peat Society: Jyväskylä, Finland, 2008; pp. 70–91. [Google Scholar]
  6. Tubiello, F.N.; Biancalani, R.; Salvatore, M.; Rossi, S.; Conchedda, G. A worldwide assessment of greenhouse gas emissions from drained organic soils. Sustainability 2016, 8, 371. [Google Scholar] [CrossRef]
  7. Säurich, A.; Tiemeyer, B.; Don, A.; Fiedler, S.; Bechtold, M.; Amelung, W.; Freibauer, A. Drained organic soils under agriculture—The more degraded the soil the higher the specific basal respiration. Geoderma 2019, 355, 113911. [Google Scholar] [CrossRef]
  8. Säurich, A.; Tiemeyer, B.; Dettmann, U.; Don, A. How do sand addition, soil moisture and nutrient status influence greenhouse gas fluxes from drained organic soils? Soil Biol. Biochem. 2019, 135, 71–84. [Google Scholar] [CrossRef]
  9. Joosten, H.; Couwenberg, J. Peatlands and carbon. In Assessment on Peatlands, Biodiversity and Climate Change; Parish, F., Sirin, A., Charman, D., Joosten, H., Minayeva, T., Silvius, M., Eds.; Global Environment Centre: Kuala Lumpur, Malaysia; Wetlands International: Wageningen, The Netherlands, 2008; pp. 99–117. [Google Scholar]
  10. Epron, D. Separating autotrophic and heterotrophic components of soil respiration: Lessons learned from trenching and related root-exclusion experiments. In Soil Carbon Flux Measurements: An Integrated Methodology; Kutsch, W.L., Bahn, M., Heinemeyer, A., Eds.; Cambridge University Press: Cambridge, UK, 2010; pp. 157–168. [Google Scholar]
  11. Tang, X.; Du, J.; Shi, Y.; Lei, N.; Chen, G.; Cao, L.; Pei, X. Global patterns of soil heterotrophic respiration—A meta-analysis of available dataset. Catena 2020, 191, 104574. [Google Scholar] [CrossRef]
  12. Tang, X.; Pei, X.; Lei, N.; Luo, X.; Liu, L.; Shi, L.; Chen, G.; Liang, J. Global patterns of soil autotrophic respiration and its relation to climate, soil and vegetation characteristics. Geoderma 2020, 369, 114339. [Google Scholar] [CrossRef]
  13. Tiemeyer, B.; Albiac Borraz, E.; Augustin, J.; Bechtold, M.; Beetz, S.; Beyer, C.; Drösler, M.; Ebli, M.; Eickenscheidt, T.; Fiedler, S.; et al. High emissions of greenhouse gases from grasslands on peat and other organic soils. Glob. Chang. Biol. 2016, 22, 4134–4149. [Google Scholar] [CrossRef]
  14. Le Mer, J.; Roger, P. Production, oxidation, emission and consumption of methane by soils: A review. Eur. J. Soil Sci. 2001, 37, 25–50. [Google Scholar] [CrossRef]
  15. Abdalla, M.; Hastings, A.; Truu, J.; Espenberg, M.; Mander, Ü.; Smith, P. Emissions of methane from northern peatlands: A review of management impacts and implications for future management options. Ecol. Evol. 2016, 6, 7080–7102. [Google Scholar] [CrossRef] [PubMed]
  16. Latvia National Inventory Report. 1990–2021. Available online: https://unfccc.int/documents/627724 (accessed on 14 January 2024).
  17. Eickenscheidt, T.; Heinichen, J.; Drösler, M. The greenhouse gas balance of a drained fen peatland is mainly controlled by land-use rather than soil organic carbon content. Biogeosciences 2015, 12, 5161–5184. [Google Scholar] [CrossRef]
  18. IPCC. 2006 IPCC Guidelines for National Greenhouse Gas Inventories; Prepared by the National Greenhouse Gas Inventories Programme; Eggleston, H.S., Buendia, L., Miwa, K., Ngara, T., Tanabe, K., Eds.; IGES: Tokyo, Japan, 2006; Available online: https://www.ipcc-nggip.iges.or.jp/pub-lic/2006gl/index.html (accessed on 14 January 2024).
  19. Leiber-Sauheitl, K.; Fuß, R.; Voigt, C.; Freibauer, A. High CO2 fluxes from grassland on histic Gleysol along soil carbon and drainage gradients. Biogeosciences 2014, 11, 749–761. [Google Scholar] [CrossRef]
  20. Leppelt, T.; Dechow, R.; Gebbert, S.; Freibauer, A.; Lohila, A.; Augustin, J.; Drösler, M.; Fiedler, S.; Glatzel, S.; Höper, H.; et al. Nitrous oxide emission hotspots from organic soils in Europe. Biogeosciences 2014, 11, 6595–6612. [Google Scholar] [CrossRef]
  21. Beyer, C.; Liebersbach, H.; Höper, H. Multiyear greenhouse gas flux measurements on a temperate fen soil used for cropland or grassland. J. Plant. Nutr. Soil Sci. 2015, 178, 99–111. [Google Scholar] [CrossRef]
  22. Rūsiņa, S. Dabiskie zālāji un mežmalas. In Latvija. Zeme, Daba, Tauta, Valsts; Nikodemus, O., Kļaviņš, M., Krišjāne, Z., Zelčs, V., Eds.; Latvijas Universitātes Akadēmiskais apgāds: Riga, Latvia, 2018; pp. 414–423. [Google Scholar]
  23. LEGMC. Klimata Portals. Available online: https://klimats.meteo.lv/laika_apstaklu_raksturojums/2022/gads/ (accessed on 14 January 2024).
  24. Hutchinson, G.L.; Livingston, G.P. Use of chamber systems to measure trace gas fluxes. In Agricultural Ecosystem Effects on Trace Gases and Global Climate Change; Harper, L.A., Mosier, A.R., Duxbury, J.M., Rolston, D.E., Eds.; American Society of Agronomy, Crop Science Society of America, and Soil Science Society of America: Madison, WI, USA, 1993; pp. 63–78. [Google Scholar]
  25. Pumpanen, J.; Kolari, P.; Ilvesniemi, H.; Minkkinen, K.; Vesala, T.; Niinistö, S.; Lohila, A.; Larmola, T.; Morero, M.; Pihlatie, M.; et al. Comparison of different chamber techniques for measuring soil CO2 efflux. Agric. For. Meteorol. 2004, 123, 159–176. [Google Scholar] [CrossRef]
  26. Purvina, D.; Licite, I.; Butlers, A.; Lazdins, A.; Saule, G.; Turks, A.; Prysiazhniuk, L. Evaluation of peat layer thickness effect on soil GHG fluxes. In Proceedings of the 22nd International Scientific Conference Engineering for Rural Development, Jelgava, Latvia, 24–26 May 2023; pp. 454–460. [Google Scholar]
  27. LVS ISO 11464:2006; Soil Quality. Pretreatment of Samples for Physico-Chemical Analysis. Ltd. “Latvijas standarts” (LVS): Riga, Latvia, 2006.
  28. LVS EN ISO 10390:2022; Soil, Treated Biowaste and Sludge–Determination of pH (ISO 10390:2021). Ltd. “Latvijas standarts” (LVS): Riga, Latvia, 2022.
  29. LVS ISO 10694:2006; Soil Quality–Determination of Organic and Total Carbon after Dry Combustion (Elementary Analysis). Ltd. “Latvijas standarts” (LVS): Riga, Latvia, 2006.
  30. LVS ISO 13878:1998; Soil Quality. Determination of Total Nitrogen Content by Dry Combustion (“Elemental Analysis”). Ltd. “Latvijas standarts” (LVS): Riga, Latvia, 1999.
  31. LVS ISO 10693:2014; Soil Quality–Determination of Carbonate Content—Volumetric Method (ISO 10693:1995). Ltd. “Latvijas standarts” (LVS): Riga, Latvia, 2014.
  32. LVS ISO 10523:2012; Water Quality–Determination of pH (ISO 10523:2008). Ltd. “Latvijas standarts” (LVS): Riga, Latvia, 2012.
  33. LVS EN 27888:1993; Water Quality–Determination of Electrical Conductivity. Ltd. “Latvijas standarts” (LVS): Riga, Latvia, 1999.
  34. LVS EN ISO 20236:2022; Water Quality–Determination of Total Organic Carbon (TOC), Dissolved Organic Carbon (DOC), Total Bound Nitrogen (TNb) and Dissolved Bound Nitrogen (DNb) after High Temperature Catalytic Oxidative Combustion (ISO 20236:2018). Ltd. “Latvijas standarts” (LVS): Riga, Latvia, 2022.
  35. LVS EN 1484:2000; Water Analysis–Guidelines for the Determination of Total Organic Carbon (TOC) and Dissolved Organic Carbon (DOC). Ltd. “Latvijas standarts” (LVS): Riga, Latvia, 2000.
  36. LVS ISO 9964-3:2000; Water Quality–Determination of Sodium and Potassium—Part 3: Determination of Sodium and Potassium by Flame Emission Spectrometry. Ltd. “Latvijas standarts” (LVS): Riga, Latvia, 1999.
  37. Gill, R.; Jackson, R.B. Global patterns of root turnover for terrestrial ecosystems. New Phytol. 2000, 147, 13–31. [Google Scholar] [CrossRef]
  38. R Core Team. The R Project for Statistical Computing. Available online: https://www.R-project.org (accessed on 14 January 2024).
  39. Pumpanen, J.; Longdoz, B.; Kutsch, W.L. Field measurements of soil respiration: Principles and constraints, potentials and limitations of different methods. In Soil Carbon Dynamics. An Integrated Methodology; Kutsch, W.L., Bahn, M., Heinemeyer, A., Eds.; Cambridge University Press: Cambridge, UK, 2010; pp. 16–33. [Google Scholar]
  40. Yli-Halla, M.; Lötjönen, T.; Kekkonen, J.; Virtanen, S.; Marttila, H.; Liimatainen, M.; Saari, M.; Mikkola, J.; Suomela, R.; Joki-Tokola, E. Thickness of peat influences the leaching of substances and greenhouse gas emissions from a cultivated organic soil. Sci. Total Environ. 2022, 806, 150499. [Google Scholar] [CrossRef] [PubMed]
  41. Licite, I.; Lupikis, A. Impact of land use practices on greenhouse gas emissions from agriculture land on organic soils. In Proceedings of the 19th International Scientific Conference Engineering for Rural Development, Jelgava, Latvia, 20–22 May 2020; pp. 1823–1830. [Google Scholar]
  42. Elsgaard, L.; Görres, C.-M.; Hoffmann, C.C.; Blicher-Mathiesen, G.; Schelde, K.; Petersen, S.O. Net ecosystem exchange of CO2 and carbon balance for eight temperate organic soils under agricultural management. Agric. Ecosyst. Environ. 2012, 162, 52–67. [Google Scholar] [CrossRef]
  43. Nieveen, J.P.; Campbell, D.I.; Schipper, L.A.; Blair, I.J. Carbon exchange of grazed pasture on a drained peat soil. Glob. Chang. Biol. 2005, 11, 607–618. [Google Scholar] [CrossRef]
  44. Berglund, Ö.; Berglund, K.; Klemedtsson, L. Plant-derived CO2 flux from cultivated peat soils. Acta Agric. Scand. Sect. B Soil Plant Sci. 2011, 61, 508–513. [Google Scholar]
  45. Berglund, Ö.; Kätterer, T.; Meurer, K.H.E. Emissions of CO2, N2O and CH4 from cultivated and set aside drained peatland in Central Sweden. Front. Environ. Sci. 2021, 9, 630721. [Google Scholar] [CrossRef]
  46. Norberg, L.; Berglund, Ö.; Berglund, K. Seasonal CO2 emission under different cropping systems on Histosols in southern Sweden. Geoderma Regional. 2016, 7, 338–345. [Google Scholar] [CrossRef]
  47. Van den Pol-van Dasselaar, A. Methane Emissions from Grasslands. Ph.D. Thesis, Wageningen Agricultural University, Wageningen, The Netherlands, 1998. [Google Scholar]
  48. Lai, D.Y.F. Methane dynamics in Northern peatlands: A review. Pedosphere 2009, 19, 409–421. [Google Scholar] [CrossRef]
  49. Butlers, A.; Lazdiņš, A.; Kalēja, S.; Purviņa, D.; Spalva, G.; Saule, G.; Bārdule, A. CH4 and N2O emissions of undrained and drained nutrient-rich organic forest soil. Forests 2023, 14, 1390. [Google Scholar] [CrossRef]
  50. Petersen, S.O.; Hoffmann, C.C.; Schäfer, C.-M.; Blicher-Mathiesen, G.; Elsgaard, L.; Kristensen, K.; Larsen, S.E.; Torp, S.B.; Greve, M.H. Annual emissions of CH4 and N2O, and ecosystem respiration, from eight organic soils in Western Denmark managed by agriculture. Biogeosciences 2012, 9, 403–422. [Google Scholar] [CrossRef]
  51. Pärn, J.; Verhoeven, J.T.A.; Butterbach-Bahl, K.; Dise, N.B.; Ullah, S.; Aasa, A.; Egorov, S.; Espenberg, M.; Järveoja, J.; Jauhiainen, J.; et al. Nitrogen-rich organic soils under warm well-drained conditions are global nitrous oxide emission hotspots. Nat. Commun. 2018, 9, 1135. [Google Scholar] [CrossRef] [PubMed]
  52. Yu, L.; Zhang, Q.; Tian, Y.; Sun, W.; Scheer, C.; Li, T.; Zhang, W. Global variations and drivers of nitrous oxide emissions from forests and grasslands. Front. Soil Sci. 2022, 2, 1–10. [Google Scholar] [CrossRef]
  53. IPCC. 2013 Supplement to the 2006 IPCC Guidelines for National Greenhouse Gas Inventories: Wetlands; Hiraishi, T., Krug, T., Tanabe, K., Srivastava, N., Baasansuren, J., Fukuda, M., Troxler, T.G., Eds.; IPCC: Geneva, Switzerland, 2014; Available online: https://www.ipcc-nggip.iges.or.jp/public/wetlands/index.html (accessed on 14 January 2024).
  54. Maljanen, M.; Komulainen, V.M.; Hytonen, J.; Martikainen, P.; Laine, J. Carbon dioxide, nitrous oxide and methane dynamics in boreal organic agricultural soils with different soil characteristics. Soil Biol. Biochem. 2004, 36, 1801–1808. [Google Scholar] [CrossRef]
  55. Schäfer, C.M.; Elsgaard, L.; Hoffmann, C.C.; Petersen, S.O. Seasonal methane dynamics in three temperate grasslands on peat. Plant Soil 2012, 357, 339–353. [Google Scholar] [CrossRef]
  56. Maljanen, M.; Sigurdsson, B.D.; Guðmundsson, J.; Óskarsson, H.; Huttunen, J.T.; Martikainen, P.J. Greenhouse gas balances of managed peatlands in the Nordic countries—Present knowledge and gaps. Biogeosciences 2010, 7, 2711–2738. [Google Scholar] [CrossRef]
  57. van Beek, C.L.; Pleijter, M.; Jacobs, C.M.J.; Velthof, G.L.; van Groenigen, J.W.; Kuikman, P.J. Emissions of N2O from fertilized and grazed grassland on organic soil in relation to groundwater level. Nutr. Cycl. Agroecosyst. 2010, 86, 331–340. [Google Scholar] [CrossRef]
Figure 1. Geographical distribution of research sites in Latvia belonging to the Europe’s hemiboreal zone.
Agriculture 14 00387 g001
Figure 2. Soil total respiration (Rtot) depending on thickness of soil organic layer (A) and carbon (C) content at 0–20 cm soil layer (B). In the box plots (A), the medians are shown as bold horizontal lines in the boxes, the mean values are shown as red dots, and the black dots denote outliers of the datasets; groups with the same letter (a) are not statistically different from each other (p > 0.05). In (B), this study’s results (black dots) are supplemented by data (yellow points) from a previous study in Latvia conducted in drained grasslands with deep peat (>40 cm) soils [41]; grey area reflects confidence interval of linear regression.
Agriculture 14 00387 g002
Figure 3. Soil total respiration (Rtot) depending on air temperature, soil temperature at 10 cm depth and soil moisture (linear regressions). Grey area reflects confidence interval of regression.
Agriculture 14 00387 g003
Figure 4. Soil heterotrophic respiration (Rhet) depending on air temperature and soil moisture. Grey area in left graph shows confidence interval of regression.
Agriculture 14 00387 g004
Figure 5. Soil-to-atmosphere CH4 fluxes depending on thickness of soil organic layer (A) and carbon (C) content at 0–20 cm soil layer (B). In the box plots (A), the medians are shown as bold horizontal lines in the boxes, the mean values are shown as red dots, and the black dots denote outliers of the datasets; groups with different letters (a–c) are statistically different from each other (p < 0.05). In (B), this study’s results (black dots) are supplemented by data (yellow points) from a previous study in Latvia conducted in drained grasslands with deep peat (>40 cm) soils [41]; grey area reflects confidence interval of regression.
Agriculture 14 00387 g005
Figure 6. Soil-to-atmosphere CH4 fluxes depending on air temperature, soil temperature at 10 cm depth and soil moisture. Grey area reflects confidence interval of linear regression.
Agriculture 14 00387 g006
Figure 7. Soil-to-atmosphere N2O fluxes depending on thickness of soil organic layer (A) and carbon (C) content at 0–20 cm soil layer (B). In the box plots (A), the medians are shown as bold horizontal lines in the boxes, the mean values are shown as red dots, and the black dots denote outliers of the datasets; groups with the same letter (a) are not statistically different from each other (p > 0.05). In (B), this study’s results (black dots) are supplemented by data (yellow points) from a previous study in Latvia conducted in drained grasslands with deep peat (>40 cm) soils [41]; grey area reflects confidence interval of linear regression.
Agriculture 14 00387 g007
Figure 8. Soil-to-atmosphere N2O fluxes depending on air temperature, soil temperature at 10 cm depth and soil moisture. Grey area reflects confidence interval of linear regression.
Agriculture 14 00387 g008
Table 1. General description of research sites in grassland in Latvia included in the study.
Research Site (RS), the
Dominant Plant Functional Group
SubplotThickness of Soil
Organic Layer,
cm
Mean Groundwater Level ± S.E. (Range),
cm
Coordinates of Subplot (WGS84)
XY
RS1, graminoidA1587.6 ± 2.4 (47–118)21.1882656.21136
B2096.1 ± 2.5 (60–126)21.1881756.21148
C3098.8 ± 2.6 (58–127)21.1881256.21168
RS2, graminoidA2055.4 ± 3.1 (0–121)22.8442156.55879
B4054.8 ± 3.3 (8–125)22.8441556.55887
C7027.2 ± 3.8 (0–123)22.8439556.55900
RS3, forbs and graminoidA1089.2 ± 4.0 (0–146)24.7564856.77243
B1584.2 ± 4.0 (0–144)24.7566356.77254
C2575.6 ± 8.8 (16–124)24.7568756.77279
Table 2. Soil variables (0–20, 20–40 and 40–100 cm soil layer) at the research sites (all research sites are pooled, mean ± S.E., minimum and maximum values are provided; nsubplots—number of subplots, nsoil samples—number of soil samples).
ValuesSoil Physico-Chemical Variables (0–20, 20–40 and 40–100 cm Soil Layer)
OC Stock,
t ha−1
TN Stock,
t ha−1
P Stock,
t ha−1
K Stock,
t ha−1
C/N RatiopH (KCl)
0–20 cm soil layer (nsubplots = 9, nsoil samples = 18)
Mean ± S.E. 132.9 ± 12.210.7 ± 1.11.04 ± 0.123.04 ± 0.6912.8 ± 0.85.9 ± 0.3
Minimum68.55.50.650.9810.65.0
Maximum174.714.91.896.7318.87.5
20–40 cm soil layer (nsubplots = 9, nsoil samples = 18)
Mean ± S.E. 67.7 ± 19.04.7 ± 1.50.68 ± 0.092.91 ± 0.4712.3 ± 1.26.0 ± 0.3
Minimum2.30.40.331.636.55.1
Maximum167.511.21.095.2218.88.3
40–100 cm soil layer (nsubplots = 9, nsoil samples = 27)
Mean ± S.E. 143.7 ± 37.93.9 ± 1.72.14 ± 0.3225.1 ± 11.6-6.6 ± 0.3
Minimum9.91.10.624.58-5.6
Maximum317.917.43.5093.5-8.2
Table 3. Groundwater physico-chemical variables at the research sites (all research sites are pooled, mean ± S.E., minimum and maximum values are provided).
ValuesGroundwater Physico-Chemical Variables
pHTN, mg L−1DOC, mg L−1K, mg L−1Cond., μS cm−1DO, mg L−1
Mean ± S.E. 7.3 ± 0.14.48 ± 1.5119.8 ± 2.12.25 ± 0.74357.6 ± 83.87.75 ± 0.93
Minimum6.91.549.40.4199.55.40
Maximum7.715.1627.07.10723.014.4
Table 4. Summary of annual soil-to-atmosphere GHG fluxes released from drained organic soils in grassland in Latvia. Comparison with results obtained in drained grasslands with deep peat soil within previous study in Latvia [41] and with IPCC default emission factors [53] is provided.
Thickness of Organic Soil Layer, cmResearch Site (RS), SubplotCH4,
kg C ha−1
yr−1
N2O,
kg N ha−1 yr−1
Rtot,
t C ha−1
yr−1
Rhet *,
t C ha−1 yr−1
Cinput **,
t C ha−1 yr−1
Rhet − Cinput,
t C ha−1 yr−1
<20 cmRS1, A−0.664.638.786.171.284.90
RS3, A−5.031.2710.097.092.015.08
RS3, B−4.091.818.856.222.623.60
20–40 cmRS1, B0.591.237.765.461.673.78
RS1, C0.261.158.475.952.723.23
RS2, A−0.826.299.526.694.012.69
RS3, C−2.73−0.068.045.652.872.78
>40 cmRS2, B0.864.128.035.643.582.06
RS2, C1.071.037.425.212.013.21
<20 cmMean−3.26 ± 1.332.39 ± 0.708.55 ± 0.296.01 ± 0.202.53 ± 0.303.48 ± 0.33
20–40 cmMean−0.68 ± 0.75
>40 cmMean0.96 ± 0.10
Results from previous study in Latvia conducted in drained grasslands with deep peat (>40 cm) soils *** [41]57.8 ± 44.30.26 ± 0.25---4.39 ± 0.87
IPCC default emission factors for deep-drained, nutrient-rich organic soils in grassland in temperate zone [53] 12.0 (95% confidence
interval 1.8–21.7)
8.2 (95% confidence
interval 4.9–11)
---6.1 (95% confidence
interval 5.0–7.3)
* Rhet was calculated as 70% from Rtot based on mean observation (Rtot and Rhet field measurements). ** Annul C input with above- and below-ground parts of vegetation (Table A1). *** Organic soil with OC content > 190 g kg−1 at 0–20 cm soil depth [41].
Disclaimer/Publisher’s Note: The statements, opinions and data contained in all publications are solely those of the individual author(s) and contributor(s) and not of MDPI and/or the editor(s). MDPI and/or the editor(s) disclaim responsibility for any injury to people or property resulting from any ideas, methods, instructions or products referred to in the content.

