Prospects for Measurement of Dry Matter Yield in Forage Breeding Programs Using Sensor Technologies
by

Alem Gebremedhin
1,2, 
Pieter E. Badenhorst
1,
Junping Wang
1,
German C. Spangenberg
3,4 and
Kevin F. Smith
1,2,* 1
Hamilton Center, Agriculture Victoria Research, Hamilton, Victoria 3300, Australia
2
School of Agriculture and Food, Faculty of Veterinary and Agricultural Sciences, The University of Melbourne, Victoria 3010, Australia
3
Agriculture Victoria Research, AgriBio, Centre for AgriBioscience, Bundoora, Victoria 3083, Australia
4
School of Applied Systems Biology, La Trobe University, Bundoora, Victoria 3086, Australia
*
Author to whom correspondence should be addressed.
Agronomy 2019, 9(2), 65; https://doi.org/10.3390/agronomy9020065
Submission received: 4 January 2019
/
Revised: 21 January 2019
/
Accepted: 31 January 2019
/
Published: 1 February 2019
(This article belongs to the Special Issue Breeding Strategies for Improving Yield of Forage Crops and Energy Grasses)
Abstract
:Increasing the yield of perennial forage crops remains a crucial factor underpinning the profitability of grazing industries, and therefore is a priority for breeding programs. Breeding for high dry matter yield (DMY) in forage crops is likely to be enhanced with the development of genomic selection (GS) strategies. However, realising the full potential of GS will require an increase in the amount of phenotypic data and the rate at which it is collected. Therefore, phenotyping remains a critical bottleneck in the implementation of GS in forage species. Assessments of DMY in forage crop breeding include visual scores, sample clipping and mowing of plots, which are often costly and time-consuming. New ground- and aerial-based platforms equipped with advanced sensors offer opportunities for fast, nondestructive and low-cost, high-throughput phenotyping (HTP) of plant growth, development and yield in a field environment. The workflow of image acquisition, processing and analysis are reviewed. The “big data” challenges, proposed storage and management techniques, development of advanced statistical tools and methods for incorporating the HTP into forage breeding systems are also reviewed. Initial results where these techniques have been applied to forages have been promising but further research and development is required to adapt them to forage breeding situations, particularly with respect to the management of large data sets and the integration of information from spaced plants to sward plots. However, realizing the potential of sensor technologies combined with GS leads to greater rates of genetic gain in forages.
1. Introduction
Increasing the dry matter yield (DMY) of perennial forages remains a crucial factor underpinning the profitability of grazing industries [1], and is therefore a priority outcome for forage breeding programs. The rate of genetic gain in forage crops is lower (0.25–0.7% per year) than the main cereal crops (1.3% per year) [2,3,4,5]. DMY of perennial forages have high genotypic and phenotypic variability, with repeated phenotypic assessment required, a challenge which is exacerbated by the current shortcomings of phenotypic assessment methodology [6,7]. A typical forage breeding program requires yield to be estimated multiple times throughout the year and on plants sown in various configurations, from individual plants and individually sown rows to densely sown plots [6,8]. Trait assessment and the separation of genotypic and environmental effects and genotype × environment interaction (G × E), along with the associated challenges of data recording and analysis, remain rate-limiting in forage breeding programs.
These limitations restrict the number of seasons or environments that can be sampled with finite resources, thereby exacerbating this bottleneck to accelerating plant breeding [7,9]. Sample clipping and mowing are destructive and costly in addition to the time required for evaluating thousands of genotypes. In addition to determining forage yield through cutting and manual measurement, breeders have resorted to a visual estimation to allow higher throughput. Visual estimates on individually spaced plants or rows can be highly correlated to DMY but are still time-consuming and even with trained staff retain a certain degree of subjectivity [10,11]. The routine evaluation of a three-leaf stage single perennial ryegrass plant which includes measurement of plant height, leaf density score, cutting and bagging requires about 7 minutes for one person to perform. If the person works an 8-hour day, it would require 700 days to complete the evaluation of the 48,000-perennial-ryegrass-plant field trial located in Hamilton, Victoria, Australia (Figure 1). Application of the current phenotyping method is almost impossible to evaluate even more significant numbers like the 270,000 precisely planted ryegrass plant field trial at Hamilton [12].
Current phenotyping methods lack the resolution for the precise discrimination of genetic effects when the difference between genotypes may be small relative to those due to environmental effects. For example, measuring a particular trait of interest (e.g., DMY) is challenging because measurement is limited by the following factors: (1) the number of sampled plants from sections of experimental plots may not be the best representative, considering the genetic variability that can appear among genotypes; (2) mowing off all the plots is destructive and time-consuming; (3) samples harvesting and subsequent weighing to determine fresh weight and oven-drying to determine dry weight, as well as the logistics used to transport, may add more cost. Thus, development of robust and precise in-field forage phenotyping has the potential to replace destructive and costly phenotyping techniques as well as to provide options to utilise traits that were previously too complex to be assessed easily by breeders [4,13]. The estimation of forage yield is similar to the estimation of biomass, yield components and morphological functions of cereal crops [14,15]. Thus, developing robust and precise high-throughput phenotyping (HTP) methods that can increase the number of samples and record accurate data throughout the life cycle of the crop needs to be a priority for forage breeding.
On the other hand, the development of next-generation sequencing technologies for forage species [16,17,18] with associated reductions in the cost of genotyping has seen the development of genomic selection (GS) strategies for perennial forage species [8,19,20,21] with the potential to increase the rate of genetic gain and reduce the cost per unit of gain [21]. It is also evident that DMY improvement in ryegrass is not only achieved by genetic factors but also with improving management techniques to allow the expression of the plant’s genetic potential [22]. However, realising the full potential of genomic selection will require an increase in amount and rate of collection of phenotypic data, and thus phenotyping remains a critical bottleneck and impediment to the implementation of GS in forage species like perennial ryegrass [21,23].
Limited attention to developing field-based, high-throughput phenotyping of forage crops has restrained the progress of ‘-omics’ technologies for forage improvement [24]. However, a review [25] indicated the potential, opportunities and challenges of sensor-based HTP tools in forage DMY, quality, drought and disease tolerance improvement. Other authors indicated the possibility of sensor-based HTP to determine perennial ryegrass DMY and plant base area of regrowth after cutting [26,27]. These methods have been validated in experiments with small populations but have not been optimised to screen larger field trials. Recently, various sensors, vehicle platforms, data loggers and real-time kinematic global navigation and satellite systems (RTK-GNSS), along with processing pipelines, have been used to capture phenotypic data in the field from single plants, rows and sward plots of 270,000 perennial ryegrass genotypes [12]. Most of these have been demonstrated in the context of breeding programs, indicating the potential of utilising sensor-based technology for DMY phenotyping in forage improvement programs.
This review is structured in four sections. Firstly, we review the status of phenotyping forage DMY. Secondly, we discuss the advantages of advanced sensors deployed on the ground and aerial platforms for evaluating forage plant traits. The HTP platforms involve the deployment of proximal sensors with high-resolution imaging technologies accompanied by automation and precision to measure plant performance in large populations established as individual plants, rows, plots or swards. Thirdly, we review the “big data” challenges resulting from HTP, storage methods and management. Finally, we summarise the workflow of image processing and analysis as well as a method for modelling data postprocessing techniques.
2. Current Phenotyping Status of Forage Dry Matter Yield and Yield Components
Forage DMY is expressed as the amount of dried biomass obtained after clipping and removing the moisture available in the fresh forage biomass [28]. Methods of assessing DMY of forage can be grouped into direct and indirect measurement techniques. Direct methods that include sample clipping and mowing plots are widely used in breeding trials as a standard method to evaluate and phenotype individual plants, rows and swards plots in forage crops [10,11,29,30,31]. A range of indirect methods include rising plate meter, a ruler, a sward stick, visual score and others, which are useful to predict DMY, plant growth rate, plant height, number of tillers, leaf dimension and above-ground crown volume/density [6,32,33,34].
In the indirect methods of estimating DMY, calibration is made by developing empirical relationships between indirectly measured and actual sample values. Most indirect methods use inexpensive instruments and are nondestructive to predict DMY, and are thus applied widely to estimate DMY in various pasture simulation and grazing experiments [34,35,36,37,38]. Although these techniques are often easy to apply, estimations of DMY show inconsistent results with different species. For instance, plant density measured using a plate meter showed a low correlation (r = 0.21 to 0.41) with biomass across four different seasons of semiarid grassland [39], whereas a plate meter measuring plant height showed high (r = 0.79 to 0.94) correlation with DMY for tall fescue pasture [40].
3. Sensors and Phenotyping Platforms
3.1. Sensors
The typical sensors used for ground-based, high-throughput phenotyping (GB-HTP) include passive sensors (e.g., red-green-blue, hyperspectral, fluorescence and thermal) [40,41,42,43] and active sensors (e.g., GreenSeeker, ultrasonic sonar and LiDAR laser scanner [44,45,46], among others) [4,47]. Active sensors possess a light- or sound-emitting unit whereas passive sensors use ambient sunlight as a light source. Active sensors, as a result, are independent of radiation differences so that they can operate in cloudy weather conditions. Active sensors often possess a narrow field of view (FOV), whereas passive sensors are less limited to FOV depending on the light source distance from target objects. Unlike active sensors, images obtained from passive sensors require radiometric calibration, adding more steps to the data-processing complexity.
3.1.1. Visible Digital Imaging
Visible digital imaging systems are mainly red-green-blue (RGB) sensors that use wavelengths ranging from 400 to 700 nm to capture two-dimensional (2D) images from the band ranges of red (630–690 nm), green (510–580 nm) and blue (450–495 nm) [40,48]. Images from RGB require adjustment and correction of image brightness, as well as 3D structure reconstruction, followed by geometric and radiometric calibrations to minimise image variability and to capture information from overlapping plant parts. There have been several reports of the estimation of DMY from RGB imaging systems: (1) RGB image analysis through commercial software to calculate the number of pixels and compare with the actual weight measured [26]. In this experiment, image analysis algorithms were developed in Math Lab to estimate DMY with significant correlations, r = 0.74 and r = 0.93, to visual scores and measured DMY, respectively. RGB images analysis methods were also used to estimate plant morphological parameters, like individual plants base area and tiller number, to understand the growth rate between two cuts of perennial ryegrass field trial [27]. (2) Images from RGB cameras can be used to calculate the vegetative index (VI) and correlate it with measured DMY. The VIs are the spectral transformation of two or more bands designed for a qualitative or quantitative measure of vegetation properties [49]. Limited work has been done so far in using RGB images for extracting VIs, but results showed a potential to estimate biomass [50]. (3) Generating high-resolution digital surface models from RGB images through height maps can also be used to estimate DMY from plant height correlations. The retrieval of plant height from RGB images is a relatively new method of automated height measurement [51]. Unmanned aerial system (UAS)-acquired overlapped images can be photo-merged and processed using the structure from motion algorithms to create a 3D point cloud using commercial software (i.e., PiX4D Mapper Pro, Lausanne, Switzerland, http://pix4d.com) [52]. The resulting point clouds are mostly saved as TIFF/CSV files to allow digital surface model (DSM) information to be available for export. A study describing the automation of perennial ryegrass height estimation using the DSM technique indicated a high correlation (R2 = 0.54–0.63) between a ‘herbometre’ (a tool similar to rising plate meter [38]) and DSM, offering an alternative option to automating ryegrass plant height estimation [53].
3.1.2. Multispectral and Hyperspectral Imaging
Multispectral and hyperspectral imaging technologies are the most common HTP tools which may be deployed on the ground or aerial platforms. Multispectral imaging captures image data from a few specific narrow spectral bands (usually less than 10). Some multispectral imaging systems may be used to capture information at the RGB and near-infrared spectrum simultaneously. Hyperspectral imaging captures data from a broader range of spectral regions (400–2500 nm, usually more than 10 narrow bands). The use of continuous bands can be beneficial in using high-resolution images to describe the crop canopy in a more discrete and detailed manner.
The use of hyperspectral imaging systems to collect data across a broad range of wavelengths could have the advantage of refining old spectral indices and developing new VIs that may achieve higher correlations with morphological traits and DMY. Hyperspectral imaging systems operate to capture an image in the form of push-broom or snapshot sensor form. Hyperspectral push-broom systems work with a 2D detector array scanning the full spectrum simultaneously with spatial line scanning over time. Push-broom sensors collect spectral information on moving platforms in the form of scanned images or multiple points of the fibre optic spectrometer. The drawback of this sensor is that it requires moving along a platform (e.g., conveyor belt) where the movement of the platform may cause noise. Snapshot sensors are nonscanning sensors in which the entire data of an object can be captured in a single 3D data cube integration [54]. Snapshot sensors can avoid artefacts and noises since there is no requirement of movement while capturing the spectrum. Snapshot techniques, on the other hand, may not filter information, and thus image noise could be included. Generally, hyperspectral imaging systems are expensive and require technical knowledge to process the data. The use of continuous bands can be beneficial in using high-resolution images to describe the crop canopy in a more discrete and detailed manner. Therefore, application of machine learning and artificial intelligence to utilise all spectral information rather than simple VIs could have the advantage of refining new VIs that can achieve higher correlations with morphological traits.
Several VIs from multispectral and hyperspectral imaging systems have been calculated and utilised for nondestructive estimation of plant biomass [55,56,57]. For instance, the normalised difference vegetative index (NDVI) quantifies the vegetation density, greenness and health by calculating the difference in reflectance at the near-infrared and red region to the sum of reflectance at red and near-infrared regions [58]. The potential and limitations of NDVI for nondestructive forage DMY estimation are known [59,60,61,62,63]. However, at high canopy density, it may saturate and be less able to discriminate the difference in biomass yield [64,65,66,67]. This limitation can be alleviated by (1) applying narrowband vegetative indices like the red edge spectral reflectance, that could better estimate biomass than NDVI alone with less saturation at high biomass level [68]; (2) combining NDVI with other biophysical parameters (e.g., plant height) to overcome saturation and achieve accurate estimation [67,69,70,71]. The green–red, normalised difference vegetative index (GRNVI) has been shown to have a positive correlation with biomass estimation of corn, alfalfa and soybeans [72]. (3) There is an increased interest to use hyperspectral data to overcome the effect of saturation at higher DMY. Several narrow-band spectral signatures obtained from hyperspectral images may have a potential to indicate the subtle variations in reflected energy so that the canopy difference can be detected. This may lead to the introduction of new indices that may overcome issues associated with the saturation of NDVI in estimating DMY. The application of machine learning (ML) algorithms to refine and validate new VIs that can perform well across any growth stage may have great contribution in this regard [73].
3.1.3. Ultrasonic Sonar
Ultrasonic sonar, also called ultrasonic sonar height (USH), [74] measures the distance from a sensor to the plant canopy by detecting the time delay of sound echoes returning to the sensor from plant surfaces. Ultrasonic sonar enables significant improvement in sampling time and sample size compared to the manual measurement of canopy height. USH has been used for height measurement in cotton [75,76], blueberry [77,78], wheat [70,79], barley [38] and pasture grasses and legumes [35,80]. The use of ultrasonic sensors for plant height estimation may, however, be affected by the angle of divergence of the target plant (i.e., the field view becomes larger when the distance between the sensor and the targeted canopy increases, and the field view becomes smaller when the distance between the sensor the targeted canopy decreases). This results in a reduced accuracy of measurement. Similarly, the use of sonar estimates of height for biomass prediction may be affected by canopy structure [81] depending on the number and dimensions of a single leaf or a group of leaves that generate echoes [82].
3.1.4. Light Detection and Ranging (LiDAR)
Light Detection and Ranging (LiDAR) works based on laser light to measure the shortest distance to the target object from the LiDAR scanner (light source) by analysing the time of emission and the time of reflected light detection [83,84]. LiDAR technology provides an option to create and construct 3D point cloud data for filtering and segmenting canopy volume as well as for modelling plant architecture [85,86,87]. In recent years, LiDAR sensors have been utilised by researchers for the high-resolution and accurate high-throughput phenotyping of a range of forests and cereal crops. LiDAR can rapidly estimate canopy height, width, volume and other structural parameters [45,88,89]. The application of LiDAR covers a diverse range of crops from fruit trees and forests [90,91,92,93,94] to field crops and pasture grasses [95,96,97,98]. In perennial ryegrass, ground-based LiDAR was used to measure variation among 12 cultivars with high accuracy of fresh and dry biomass estimation (R2 = 0.76–0.78) [99]. In this study, it is noted that only 12 cultivars in 30 rows were evaluated with a ground-based platform where simultaneous measurement of thousands of plots and cultivars will require the development of aerial LiDAR systems [100].
LiDAR was used in forage management systems with Miscanthus giganteus Keng under static and dynamic modes to measure plant height [101]. The authors indicated that accurate height measurement using LiDAR compared to manual measurements with an error of 4.2% for static and 3.8% for the dynamic mode. Measured plant height using LiDAR also correlates well with biomass for some forage crops (e.g., tall fescue), indicating the potential application of LiDAR to estimate biomass per unit area [69]. LiDAR measurements, combined with other sensors, for instance, plant height measured using LiDAR combined with NDVI (height × NDVI), may be used to improve biomass estimation [69].
LiDAR is an existing technology that can fulfil the current phenotyping demands of perennial ryegrass and other forage breeding programs, but its expense limits its application. Installations can cost up to several thousand dollars (though this is decreasing), depending on the complexity and performance parameters of the technology [102] as well as its technical demands [4,103]. Most LiDAR is incapable of giving measures of plant physiological attributes. Therefore, combining georeferenced LiDAR data with data from different sensor types that look on physiological properties may be required to evaluate the overall plant growth performance in the field. However, it is sometimes challenging to combine data that come from different sensors with various temporal and spatial ranges of resolution and units of measurement [104].
3.2. Phenotyping Platforms
3.2.1. Ground-Based Platforms
A platform is a facility or a physical carrier where proximal remote-sensing sensors are mounted for the acquisition of phenomic data (Figure 2). Platforms are important for increasing and accelerating the capture of phenotypic information so that genotypic correlations could be made under diverse environmental conditions. Over recent years, several ground-based, high-throughput phenotyping (GB-HTP) platforms (both automated and semiautomated) have been developed and deployed for phenotyping various crops, including maize, wheat, Bermuda grass and lucerne [68,103,105]. These platforms are equipped with sensors mounted on bicycles, robots and other vehicles (e.g., tractors and other all-terrain vehicles). These vehicles often deploy multiple sensors that enable data capture of plots, rows and individual plants [46,106,107]. Moreover, GB-HTPs typically have a higher payload that provides access to many sensors with relatively minimum additional data-postprocessing requirements [46,106,107]. However, GB-HTPs require a longer time for data capture than unmanned aerial systems. The vehicles can cause soil compaction through repeated traversing—a variation of environmental conditions (such as temperature, light, wind) from the start to the end of the data capture period, which makes thermal imaging systems unapplicable. There is also less precision in output data due to speed variations and an inability to collect data from waterlogged and rough surfaces.
3.2.2. Aerial Platforms
Aerial platforms may include various UAS types carrying different sensors, including digital cameras, multispectral imaging, hyperspectral imaging systems and LiDAR (Figure 3) (for detail on the integration of sensors to UASs see review in Tables 2 and 3 by [108] and [109], respectively). UASs have the potential to rapidly measure ground cover, plant height, biomass and leaf area index [110,111,112,113,114,115]. Another aerial platform that can perform phenotyping may include satellites, where they have the advantage of covering large areas at a time. However, satellites have mostly lower temporal and spatial resolution compared to UASs. It is also challenging to obtain satellite imagery at frequent time intervals without cloud interference. Furthermore, UASs have a lower cost of buying and deploying compared to the launching and buying of the high-resolution satellites [116]. UASs fly at a lower altitude than satellites (even < 100 m) allowing reasonable resolution and may cover large areas of measurement in limited timeframe compared to GB-HTP. UASs are affordable and available for repeated data collection without impacting the soil or plants [117,118].
Limitations related to UAS phenotyping include operating safety regulations that limit payload and mode of operation [107]. Regarding payload and the flight specifications, some countries have restrictive flight operation rules, and this limits their application [116]. As a result, some researchers still prefer to invest in ground vehicles to increase the payload even though these are usually more expensive than UASs. However, recently UAS aviation regulation authorities have started to relax their rules. For instance, the Australian Civil Aviation Safety Authority (CASA) recently reduced licensing costs and introduced less strict legal and operational conditions for UASs [119].
In summary, the development of GB-HTP and aerial-based phenotyping platforms for forage breeding is promising and can provide reliable methods for nondestructive, cost- and time-efficient phenotyping methods for economically important traits. However, further research is required before these methods are routine. Calibration models need to be built that are robust across different environmental conditions and seasons to ensure applicability in multiharvest, multienvironment breeding programs. Moreover, sensors generate large amounts of data, and current processing methods often require manual interfacing and interaction from skilled operators [109,120]. Cost of data processing and analysis is another thing to be considered when developing phenotyping platforms and the automation of data extraction, analysis and interpretation is likely to aid the routine application of these methods in commercial programs. Image processing, data management techniques and statistical analysis and integration of sensors data will be covered in the following sections.
4. Image Processing
Sensor-based phenotyping platforms capture images with the interaction of electromagnetic radiation and the plant organ. The reflectance values vary with a wavelength of the radiation and chemical composition of the plants where many of the captured data require calibration, validation and standardising of the data-processing pipeline to produce quantitative values of phenotypes. However, noise and variation in sensor position during the capturing of images can create difficulty in standardising of raw images. Thus, pre-data collection sensor calibration and preprocess images correction influence the final accuracy of quantitative phenotypic data output. However, the captured and preprocessed image data require technical image processing software and machine learning algorithm which is a challenging scenario to put the pipeline developed in place and extract biologically meaningful quantitative data easily [116]. Many general image-processing software and hardware solutions are available for phenotyping images from GB-HTP [121,122,123,124]. Most of the image-processing software requires processing workflow procedures, including image segmentation, classification, image calibration (geometric and radiometric) and extraction features in the form of geographic information system (GIS) deliverable data.
4.1. Geometric Calibrations
Geometric distortion effects from the original images from cameras are common in remotely sensed data due to the altitude differences between the camera and the target position on the ground. The traditional geometric calibration method is based on ground control points (GCP) on the experimental site. The GCPs are visible marks on the ground and are mostly set with high RTK global positioning systems [125,126]. Geometric calibration with the manual matching of GCPs can be time-consuming but correlates well with onboard RTK positioning [127]. There is also a possibility to perform geometric calibration without GCPs; this can be achieved by repeated observation and low-precision positioning and orientation systems data [108,127]. The limitation of this method is that the errors may be high, and precision can be reduced with small field trials or measurements on individual plants.
4.2. Radiometric Calibrations
Sensor-based captured images require calibration and correction to minimise the variation due to change in brightness, cloudiness or reflectance surface temperature during imaging time. This correction involves the matching of a calibration reflectance panel (e.g., MicaSense Inc., Seattle, WA, USA) that has different reflectance percentages to orthomosaic images [117]. Several approaches to the use of radiometric calibration panels have been used depending on the data acquisition and extraction methods used [117,126,128,129] for calibration of acquired images to the known standard reflectance value in contrast to the well adopted methodology used with satellite imagery [130].
4.3. Segmentation
Image processing starts with segmentation and classification of raw images into the background (soils, debris and so forth) and foreground (mainly plants and plant parts) ([131], Figure 4). The segmentation of images involves training and validating of the software in order to partition digital images so that it can decide on the grouping of pixels into plants and background based on geometry, texture, intensity and colour [131,132]. Alternatively, raw images can be transformed to another form of domain like hue, saturation, value (HSV), canny edge detection and Zhang-Suen thinning algorithm for segmenting plants from the soil, plant structure and plant geometry [133,134]. Image-processing software (e.g., Pix4D, eCognition Developer 9, Trimble, Munich, Germany) is used to create georeferenced orthomosaic photos and then erase the background through an object identification software application to remain with the plant features.
4.4. Feature Extraction
Quantitative extraction of target features from processed images, on the other hand, involves object identification, image colour combination, geometry and texture, as well as local and global 3D point cloud creation [135]. The features extracted are mainly used as a potential method to identify plant organs and characterise the organs to extract relevant features accordingly. Feature extraction results in creating a series of secondary traits like plant biophysical indices that can be obtained from the orthomosaic image as point files (shapefile and TIFF files) which are used for the prediction of primary traits. Plant indices can be then calculated and processed for single plants, rows or plots based on user-defined georeferenced areas allowing for the quantitative measurements of various biophysical traits (Figure 4).
5. “Big Data” Storage, Management and Challenges
High-throughput phenotyping produces large volumes of data (big data) through sensors-based imaging and scanning. Big data is defined as ‘big’ when it becomes hard to process the data with the existing powerful processing tools [136]. Most data that come from large field trials incorporate multisensor captured images and scanned data in 100 s and 1000 s of gigabytes. Therefore, it is sometimes challenging to remove noise, process and analyse big data at the same time. The effectiveness of data processing and analysis of big data can be improved by developing pipelines and scripts in combination with commercially available software packages to allow for automation of quantitative data extraction in a fast and shorter time frame. The main problem with big data processing comes from calibration effects (internal sensor calibration, deployment calibration and environmental noise calibration). One option we should take into consideration is being able to be selective regarding information to be computed from sensors and avoiding low efficiency caused by non-trait-related spectral ranges. The other option is moving away from these simple indices and getting the software to create predictive models using all available information captured.
To fulfil the demand for proper big data acquisition, storage and backup for reanalysis, global data management and support tools are critical [137]. For instance, global data management and support tools like the “Minimum Information About a Plant Phenotyping Experiment” (MIAPPE) can be developed to store, protect and allow the retrieval of data [138,139]. Data stored in global data management systems and support tools can also be freely downloaded by scientists for validation, further analysis, the design of new experiments and decision-making. To fulfil the standards of which and what phenotypic information to be in the global data management and support tool system, scientists, private funders and the public sector must agree on the standards and essential requirements to be included. Funding and institutionalisation of a global, sensor-based phenotypic data management system will, therefore, help scientists to connect the genomic advancement achieved with the new phenotypic metadata to accelerate breeding [41,46,140].
6. Statistical Modeling
Application of HTP platforms to phenotype breeding trial at large scales presents challenges of data processing, data handling, data storing and application of suitable statistical methods and interpretation. Statistical and mathematical methods are required to analyse data from HTP platforms. The choice of statistical methods ranges from simple regression and partial least squares to advanced ML tools depending on the objective and hypothesis being tested. Several studies applied various regression models to calculate the relationship between measured biomass and spectral reflectance data [50,141,142]. These studies used regression models with limited features considered, where noise that comes from atmospheric effects, temporal effects and sensors limit the interpretation of the data. The models also tend to describe the relationship from a specific harvest rather than focus on developing predicitve models. ML techniques evolved to deal with the noise from remote sensed data [143]. ML involves the development of quantitative predictive models, splitting of data sets into training, validation and testing subsets, as well as selecting appropriate mathematical models to apply; this data can be used for ranking, visualising and screening forage genotypes (Figure 4).
ML is a relatively new data analysis method in agriculture [144] with promising results and a vast potential. Limited studies have used various ML algorithms to estimate forage grass biomass from proximal remote sensing. For example, the performance of support vector machine (SVM) and partial least squares regression (PLSR) was evaluated for biomass estimation of grassland using data derived from a field spectrometer [145]. The authors suggested using PLSR as the most accurate model to estimate biomass. Another experiment compared the Multiple Linear Regression (MLR) and the Random Forest Estimation (RF) to estimate grass biomass from plant height models, RGB and VI features [146]. Both ML techniques provided accurate estimation results. ML has not been validated in data to determine the biomass of forage species in a breeding program.
However, several cereal crops breeding programs have used ML algorithms to predict plant growth, plant height, biomass and leaf counts [147,148,149,150]. The current applications of machine learning tools in plant science were reviewed [151] and indicated the significance of using SVM and artificial neural networks in identifying stress-tolerant genotypes. [126] Deep neural networks and ML have been used to accurately estimate vegetation indices for high-throughput phenotyping of wheat using aerial imaging [126]. Therefore, ML is now an exciting technique that can be widely applied in forage data analysis for integration, interpretation and further quantification of phenotypic traits at large population field trials, particularly those that may be required for genomic selection.
7. Concluding Remarks
Current forage DMY phenotyping involves manual measuring of samples and mowing of plots and visual scoring. They are either destructive, costly, time-consuming or subjective. Recent developments in advanced sensors technologies are changing the course of phenotyping towards a rapid, large-scale and more accurate direction. Advanced field phenomics involves deployment of proximal sensors and imaging technologies in the field accompanied by high-resolution, precision and large population scale of measurement at individual plants, rows and plots levels. Images captured from the proximal sensors produce multidimensional big data sets that require calibration, validation and analysis to translate them into biologically meaningful measurements. The advanced phenotyping technologies are now capable of assessing large populations in a robust and cost-efficient manner [152]. Sensor-based HTP of forage crops now attracts large investments from governments and nongovernment organisations with a long-term objective to increase the profitability of the pasture-based dairy and meat industry [12]. Therefore, applications of sensor-based forage phenotyping, managing of the “big data” that comes out from the sensors and analysing and standardising of the data require more significant focus from scientists in the area. Application of sensor-based phenotyping can reduce the cost and speed up data collection, phenotyping at a scale we have never seen before and with high resolution. It will enable genomic selection and accelerate genetic gain for forage breeding.
Author Contributions
A.G. and K.F.S. conceived and designed the review; A.G. wrote the review manuscript; A.G., P.E.B., J.W., K.F.S., and G.C.S. reviewed and edited the review manuscript.
Funding
This research review was financially funded by the Victorian Department of Economic Development, Jobs, Transport and Resources and The University of Melbourne.
Acknowledgments
We aknowledge the staff of Hamilton Center (molecular plant breeding team) for sharing the knowledge and the information on phenomics resource on site. The authors thank Andrew Phelan and Chaya Smith for their valuable suggestions and comments on the overall idea of the review.
Conflicts of Interest
The authors declare no conflict of interest.
References
- Ludemann, C.I.; Smith, K.F. A comparison of methods to assess the likely on-farm value for meat production systems of pasture traits and genetic gain through plant breeding using phalaris (phalaris aquatica l.) as an example. Grass Forage Sci. 2016, 71, 66–78. [Google Scholar] [CrossRef]
- Wilkins, P.W.; Humphreys, M.O. Progress in breeding perennial forage grasses for temperate agriculture. J. Agric. Sci. 2003, 140, 129–150. [Google Scholar] [CrossRef]
- Hayes, B.J.; Cogan, N.O.I.; Pembleton, L.W.; Goddard, M.E.; Wang, J.; Spangenberg, G.C.; Forster, J.W. Prospects for genomic selection in forage plant species. Plant Breed. 2013, 132, 133–143. [Google Scholar] [CrossRef]
- Li, L.; Zhang, Q.; Huang, D. A review of imaging techniques for plant phenotyping. Sensors 2014, 14, 20078–20111. [Google Scholar] [CrossRef] [PubMed]
- Ray, D.K.; Mueller, N.D.; West, P.C.; Foley, J.A. Yield trends are insufficient to double global crop production by 2050. PLoS ONE 2013, 8, e66428. [Google Scholar] [CrossRef] [PubMed]
- Lee, J.M.; Matthew, C.; Thom, E.R.; Chapman, D.F. Perennial ryegrass breeding in new zealand: A dairy industry perspective. Crop Pasture Sci. 2012, 63, 107–127. [Google Scholar] [CrossRef]
- Pembleton, L.W.; Inch, C.; Baillie, R.C.; Drayton, M.C.; Thakur, P.; Ogaji, Y.O.; Spangenberg, G.C.; Forster, J.W.; Daetwyler, H.D.; Cogan, N.O.I. Exploitation of data from breeding programs supports rapid implementation of genomic selection for key agronomic traits in perennial ryegrass. Theor. Appl. Genet. 2018, 131, 1891–1902. [Google Scholar] [CrossRef] [PubMed]
- Lin, Z.; Cogan, N.O.; Pembleton, L.W.; Spangenberg, G.C.; Forster, J.W.; Hayes, B.J.; Daetwyler, H.D. Genetic gain and inbreeding from genomic selection in a simulated commercial breeding program for perennial ryegrass. Plant Genome 2016, 9. [Google Scholar] [CrossRef]
- Watanabe, K.; Guo, W.; Arai, K.; Takanashi, H.; Kajiya-Kanegae, H.; Kobayashi, M.; Yano, K.; Tokunaga, T.; Fujiwara, T.; Tsutsumi, N.; et al. High-throughput phenotyping of sorghum plant height using an unmanned aerial vehicle and its application to genomic prediction modeling. Front. Plant Sci. 2017, 8, 421. [Google Scholar] [CrossRef]
- Riday, H. Correlations between visual biomass scores and forage yield in space planted red clover (trifolium pratense l.) breeding nurseries. Euphytica 2009, 170, 339–345. [Google Scholar] [CrossRef]
- Smith, K.F.; Tasneem, M.; Kearney, G.A.; Reed, K.F.M.; Leonforte, A. Evaluation of herbage yield in a forage grass breeding program: Comparison of visual rating versus measurement in single-row plots or swards. Anim. Prod. Sci. 2001, 41, 1161–1166. [Google Scholar] [CrossRef]
- Slater, A.T.; Cogan, N.O.I.; Rodoni, B.C.; Daetwyler, H.D.; Hayes, B.J.; Caruana, B.; Badenhorst, P.E.; Spangenberg, G.C.; Forster, J.W. Breeding differently—The digital revolution: High-throughput phenotyping and genotyping. Potato Res. 2017, 60, 337–352. [Google Scholar] [CrossRef]
- Barrett, B.A.; Faville, M.J.; Nichols, S.N.; Simpson, W.R.; Bryan, G.T.; Conner, A.J. Breaking through the feed barrier: Options for improving forage genetics. Anim. Prod. Sci. 2015, 55, 883–892. [Google Scholar] [CrossRef]
- Varshney, R.K.; Singh, V.K.; Hickey, J.M.; Xun, X.; Marshall, D.F.; Wang, J.; Edwards, D.; Ribaut, J.-M. Analytical and decision support tools for genomics-assisted breeding. Trends Plant Sci. 2016, 21, 354–363. [Google Scholar] [CrossRef] [PubMed]
- Valliyodan, B.; Ye, H.; Song, L.; Murphy, M.; Shannon, J.G.; Nguyen, H.T. Genetic diversity and genomic strategies for improving drought and waterlogging tolerance in soybeans. J. Exp. Bot. 2016, 68, 1835–1849. [Google Scholar] [CrossRef]
- Pembleton, L.W.; Drayton, M.C.; Bain, M.; Baillie, R.C.; Inch, C.; Spangenberg, G.C.; Wang, J.; Forster, J.W.; Cogan, N.O.I. Targeted genotyping-by-sequencing permits cost-effective identification and discrimination of pasture grass species and cultivars. Theor. Appl. Genet. 2016, 129, 991–1005. [Google Scholar] [CrossRef] [PubMed]
- Honig, J.A.; Zelzion, E.; Wagner, N.E.; Kubik, C.; Averello, V.; Vaiciunas, J.; Bhattacharya, D.; Bonos, S.A.; Meyer, W.A. Microsatellite identification in perennial ryegrass using next-generation sequencing. Crop Sci. 2017, 57, S331–S340. [Google Scholar] [CrossRef]
- Talukder, S.K.; Saha, M.C. Toward genomics-based breeding in c3 cool-season perennial grasses. Front. Plant Sci. 2017, 8, 1317. [Google Scholar] [CrossRef]
- Grinberg, N.F.; Lovatt, A.; Hegarty, M.; Lovatt, A.; Skøt, K.P.; Kelly, R.; Blackmore, T.; Thorogood, D.; King, R.D.; Armstead, I.; et al. Implementation of genomic prediction in lolium perenne (l.) breeding populations. Front. Plant Sci. 2016, 7, 133. [Google Scholar] [CrossRef]
- Simeão Resende, R.M.; Casler, M.D.; Vilela de Resende, M.D. Genomic selection in forage breeding: Accuracy and methods. Crop Sci. 2014, 54, 143–156. [Google Scholar] [CrossRef]
- Lin, Z.; Wang, J.; Cogan, N.O.I.; Pembleton, L.W.; Badenhorst, P.; Forster, J.W.; Spangenberg, G.C.; Hayes, B.J.; Daetwyler, H.D. Optimizing resource allocation in a genomic breeding program for perennial ryegrass to balance genetic gain, cost, and inbreeding. Crop Sci. 2017, 57, 243–252. [Google Scholar] [CrossRef]
- Wang, J.; Cogan, N.O.I.; Pembleton, L.W.; Forster, J.W. Variance, inter-trait correlation, heritability and trait-marker association of herbage yield, nutritive values, and morphological characteristics in italian ryegrass (lolium multiflorum lam.). Crop Pasture Sci. 2015, 66, 973–984. [Google Scholar] [CrossRef]
- Lin, Z.; Shi, F.; Hayes, B.J.; Daetwyler, H.D. Mitigation of inbreeding while preserving genetic gain in genomic breeding programs for outbred plants. Theor. Appl. Genet. 2017, 130, 969–980. [Google Scholar] [CrossRef] [PubMed]
- Rasmussen, S.; Parsons, A.J.; Jones, C.S. Metabolomics of forage plants: A review. Ann. Bot. 2012, 110, 1281–1290. [Google Scholar] [CrossRef] [PubMed]
- Walter, A.; Studer, B.; Kölliker, R. Advanced phenotyping offers opportunities for improved breeding of forage and turf species. Ann. Bot. 2012, 110, 1271–1279. [Google Scholar] [CrossRef] [PubMed]
- Hunt, C.L.; Jones, C.S.; Hickey, M.; Hatier, J.H.B. Estimation in the field of individual perennial ryegrass plant position and dry matter production using a custom-made high-throughput image analysis tool. Crop Sci. 2015, 55, 2910–2917. [Google Scholar] [CrossRef]
- Lootens, P.; Ruttink, T.; Rohde, A.; Combes, D.; Barre, P.; Roldán-Ruiz, I. High-throughput phenotyping of lateral expansion and regrowth of spaced lolium perenne plants using on-field image analysis. Plant Methods 2016, 12, 32. [Google Scholar] [CrossRef] [PubMed]
- Allen, V.G.; Batello, C.; Berretta, E.J.; Hodgson, J.; Kothmann, M.; Li, X.; McIvor, J.; Milne, J.; Morris, C.; Peeters, A.; et al. An international terminology for grazing lands and grazing animals. Grass Forage Sci. 2011, 66, 2–28. [Google Scholar] [CrossRef]
- Bruckner, P.L.; Raymer, P.L.; Burton, G.W. Recurrent phenotypic selection for forage yield in rye. Euphytica 1991, 54, 11–17. [Google Scholar] [CrossRef]
- Schmer, M.R.; Mitchell, R.B.; Vogel, K.P.; Schacht, W.H.; Marx, D.B. Efficient methods of estimating switchgrass biomass supplies. BioEnergy Res. 2010, 3, 243–250. [Google Scholar] [CrossRef]
- Smith, K.F.; Kearney, G.A.; Culvenor, R.A. The use of repeated measurements analysis for the evaluation of seasonal variation in the dry matter yield and nutritive value of perennial ryegrass (lolium perenne l.) cultivars. Aust. J. Exp. Agric. 1998, 38, 145–154. [Google Scholar] [CrossRef]
- Khaembah, E.N.; Gastal, F.; Carre, S.; Irving, L.J.; Barre, P.; Matthew, C. Morphology and rubisco turnover characteristics of perennial ryegrass breeding populations after two and four cycles of divergent selection for long or short leaf length. Crop Pasture Sci. 2013, 64, 687–695. [Google Scholar] [CrossRef]
- Griffiths, W.M.; Matthew, C.; Lee, J.M.; Chapman, D.F. Is there a tiller morphology ideotype for yield differences in perennial ryegrass (lolium perenne l.)? Grass Forage Sci. 2016, 72, 700–713. [Google Scholar] [CrossRef]
- Serrano, J.; Shahidian, S.; Marques da Silva, J. Calibration of grassmaster ii to estimate green and dry matter yield in mediterranean pastures: Effect of pasture moisture content. Crop Pasture Sci. 2016, 67, 780–791. [Google Scholar] [CrossRef]
- Hutchings, N.J. Spatial heterogeneity and other sources of variance in sward height as measured by the sonic and hfro sward sticks. Grass Forage Sci. 1991, 46, 277–282. [Google Scholar] [CrossRef]
- Serrano, J.M.; Peça, J.O.; Marques da Silva, J.; Shahidian, S. Calibration of a capacitance probe for measurement and mapping of dry matter yield in mediterranean pastures. Precis. Agric. 2011, 12, 860–875. [Google Scholar] [CrossRef]
- Nakagami, K.; Itano, S. Improving pooled calibration of a rising-plate meter for estimating herbage mass over a season in cool-season grass pasture. Grass Forage Sci. 2014, 69, 717–723. [Google Scholar] [CrossRef]
- Barmeier, G.; Mistele, B.; Schmidhalter, U. Referencing laser and ultrasonic height measurements of barleycultivars by using a herbometre as standard. Crop Pasture Sci. 2016, 67, 1215–1222. [Google Scholar] [CrossRef]
- Fehmi, J.S.; Stevens, J.M. A plate meter inadequately estimated herbage mass in a semi-arid grassland. Grass Forage Sci. 2009, 64, 322–327. [Google Scholar] [CrossRef]
- Fahlgren, N.; Feldman, M.; Gehan, M.A.; Wilson, M.S.; Shyu, C.; Bryant, D.W.; Hill, S.T.; McEntee, C.J.; Warnasooriya, S.N.; Kumar, I.; et al. A versatile phenotyping system and analytics platform reveals diverse temporal responses to water availability in setaria. Mol. Plant 2015, 8, 1520–1535. [Google Scholar] [CrossRef]
- Zhang, X.; Huang, C.; Wu, D.; Qiao, F.; Li, W.; Duan, L.; Wang, K.; Xiao, Y.; Chen, G.; Liu, Q.; et al. High-throughput phenotyping and qtl mapping reveals the genetic architecture of maize plant growth. Plant Physiol. 2017, 173, 1554–1564. [Google Scholar] [CrossRef] [PubMed]
- Ge, Y.; Bai, G.; Stoerger, V.; Schnable, J.C. Temporal dynamics of maize plant growth, water use, and leaf water content using automated high throughput rgb and hyperspectral imaging. Comput. Electron. Agric. 2016, 127, 625–632. [Google Scholar] [CrossRef]
- Mangus, D.L.; Sharda, A.; Zhang, N. Development and evaluation of thermal infrared imaging system for high spatial and temporal resolution crop water stress monitoring of corn within a greenhouse. Comput. Electron. Agric. 2016, 121, 149–159. [Google Scholar] [CrossRef]
- Paulus, S.; Behmann, J.; Mahlein, A.-K.; Plümer, L.; Kuhlmann, H. Low-cost 3d systems: Suitable tools for plant phenotyping. Sensors 2014, 14, 3001–3018. [Google Scholar] [CrossRef] [PubMed]
- Sun, S.; Li, C.; Paterson, H.A. In-field high-throughput phenotyping of cotton plant height using lidar. Remote Sens. 2017, 9, 377. [Google Scholar] [CrossRef]
- Tanger, P.; Klassen, S.; Mojica, J.P.; Lovell, J.T.; Moyers, B.T.; Baraoidan, M.; Naredo, M.E.B.; McNally, K.L.; Poland, J.; Bush, D.R.; et al. Field-based high throughput phenotyping rapidly identifies genomic regions controlling yield components in rice. Sci. Rep. 2017, 7, 42839. [Google Scholar] [CrossRef]
- Yang, W.; Xu, X.; Duan, L.; Luo, Q.; Chen, S.; Zeng, S.; Liu, Q. High-throughput measurement of rice tillers using a conveyor equipped with x-ray computed tomography. Rev. Sci. Instrum. 2011, 82, 025102. [Google Scholar] [CrossRef]
- Xue, J.; Su, B. Significant remote sensing vegetation indices: A review of developments and applications. J. Sens. 2017, 2017. [Google Scholar] [CrossRef]
- Bannari, A.; Morin, D.; Bonn, F.; Huete, A.R. A review of vegetation indices. Remote Sens. Rev. 1995, 13, 95–120. [Google Scholar] [CrossRef]
- Bendig, J.; Yu, K.; Aasen, H.; Bolten, A.; Bennertz, S.; Broscheit, J.; Gnyp, M.L.; Bareth, G. Combining uav-based plant height from crop surface models, visible, and near infrared vegetation indices for biomass monitoring in barley. Int. J. Appl. Earth Observ. Geoinf. 2015, 39, 79–87. [Google Scholar] [CrossRef]
- Bendig, J.; Bolten, A.; Bareth, G. Uav-based imaging for multi-temporal, very high resolution crop surface models to monitor crop growth variabilitymonitoring des pflanzenwachstums mit hilfe multitemporaler und hoch auflösender oberflächenmodelle von getreidebeständen auf basis von bildern aus uav-befliegungen. Photogramm.-Fernerkund.-Geoinf. 2013, 2013, 551–562. [Google Scholar]
- Hassan, M.; Yang, M.; Rasheed, A.; Jin, X.; Xia, X.; Xiao, Y.; He, Z. Time-series multispectral indices from unmanned aerial vehicle imagery reveal senescence rate in bread wheat. Remote Sens. 2018, 10, 809. [Google Scholar] [CrossRef]
- Borra Serrano, I.; De Swaef, T.; Muylle, H.; Mertens, K.; Nuyttens, D.; Vangeyte, J.; Willner, E.; Hegarty, M.J.; Barre, P.; Sampoux, J.-P.; et al. Non-destructive monitoring of grassland canopy height using a uav. In Proceedings of the 11th European Conference on Precision Agriculture, Edinburgh, UK, 16–20 July 2017. [Google Scholar]
- Hagen, N.; Kester, R.T.; Gao, L.; Tkaczyk, T.S. Snapshot advantage: A review of the light collection improvement for parallel high-dimensional measurement systems. Opt. Eng. (Redondo Beach, Calif.) 2012, 51, 111702. [Google Scholar] [CrossRef] [PubMed]
- Berni, J.A.J.; Zarco-Tejada, P.J.; Suárez Barranco, M.D.; Fereres Castiel, E. Thermal and Narrow-Band Multispectral Remote Sensing for Vegetation Monitoring from an Unmanned Aerial Vehicle; Institute of Electrical and Electronics Engineers: Piscataway Township, NJ, USA, 2009. [Google Scholar]
- Turner, D.; Lucieer, A.; Watson, C. Development of an unmanned aerial vehicle (uav) for hyper resolution vineyard mapping based on visible, multispectral, and thermal imagery. In Proceedings of the 34th International Symposium on Remote Sensing of Environment, Sydney, Australia, 10–15 April 2011; p. 4. [Google Scholar]
- Fava, F.; Colombo, R.; Bocchi, S.; Meroni, M.; Sitzia, M.; Fois, N.; Zucca, C. Identification of hyperspectral vegetation indices for mediterranean pasture characterization. Int. J. Appl. Earth Observ. Geoinf. 2009, 11, 233–243. [Google Scholar] [CrossRef]
- Rouse, J.W., Jr.; Haas, R.H.; Schell, J.A.; Deering, D.W. Monitoring Vegetation Systems in the Great Plains with Earth Resources Technology Satellite-1; Third ERTS Symposium; NASA SP-351: Washington, DC, USA, 1974; pp. 309–317.
- Pilon, R.; Klumpp, K.; Carrère, P.; Picon-Cochard, C. Determination of aboveground net primary productivity and plant traits in grasslands with near-infrared reflectance spectroscopy. Ecosystems 2010, 13, 851–859. [Google Scholar] [CrossRef]
- Psomas, A.; Kneubühler, M.; Huber, S.; Itten, K.; Zimmermann, N.E. Hyperspectral remote sensing for estimating aboveground biomass and for exploring species richness patterns of grassland habitats. Int. J. Remote Sens. 2011, 32, 9007–9031. [Google Scholar] [CrossRef]
- Andersson, K.; Trotter, M.; Robson, A.; Schneider, D.; Frizell, L.; Saint, A.; Lamb, D.; Blore, C. Estimating pasture biomass with active optical sensors. Adv. Anim. Biosci. 2017, 8, 754–757. [Google Scholar] [CrossRef]
- Trotter, M.G.; Lamb, D.W.; Donald, G.E.; Schneider, D.A. Evaluating an active optical sensor for quantifying and mapping green herbage mass and growth in a perennial grass pasture. Crop Pasture Sci. 2010, 61, 389–398. [Google Scholar] [CrossRef]
- Hogrefe, R.K.; Patil, P.V.; Ruthrauff, R.D.; Meixell, W.B.; Budde, E.M.; Hupp, W.J.; Ward, H.D. Normalized difference vegetation index as an estimator for abundance and quality of avian herbivore forage in arctic alaska. Remote Sens. 2017, 9, 1234. [Google Scholar] [CrossRef]
- Roth, L.; Streit, B. Predicting cover crop biomass by lightweight uas-based rgb and nir photography: An applied photogrammetric approach. Precis. Agric. 2018, 19, 93–114. [Google Scholar] [CrossRef]
- Tilly, N.; Aasen, H.; Bareth, G. Fusion of plant height and vegetation indices for the estimation of barley biomass. Remote Sens. 2015, 7, 11449–11480. [Google Scholar] [CrossRef]
- Liebisch, F.; Kirchgessner, N.; Schneider, D.; Walter, A.; Hund, A. Remote, aerial phenotyping of maize traits with a mobile multi-sensor approach. Plant Methods 2015, 11, 9. [Google Scholar] [CrossRef] [PubMed]
- Freeman, K.W.; Girma, K.; Arnall, D.B.; Mullen, R.W.; Martin, K.L.; Teal, R.K.; Raun, W.R. By-plant prediction of corn forage biomass and nitrogen uptake at various growth stages using remote sensing and plant height. Agron. J. 2007, 99, 530–536. [Google Scholar] [CrossRef]
- Mutanga, O.; Skidmore, A.K. Narrow band vegetation indices overcome the saturation problem in biomass estimation. Int. J. Remote Sens. 2004, 25, 3999–4014. [Google Scholar] [CrossRef]
- Schaefer, T.M.; Lamb, W.D. A combination of plant ndvi and lidar measurements improve the estimation of pasture biomass in tall fescue (festuca arundinacea var. Fletcher). Remote Sens. 2016, 8, 109. [Google Scholar] [CrossRef]
- Scotford, I.M.; Miller, P.C.H. Combination of spectral reflectance and ultrasonic sensing to monitor the growth of winter wheat. Biosyst. Eng. 2004, 87, 27–38. [Google Scholar] [CrossRef]
- Fricke, T.; Wachendorf, M. Combining ultrasonic sward height and spectral signatures to assess the biomass of legume–grass swards. Comput. Electron. Agric. 2013, 99, 236–247. [Google Scholar] [CrossRef]
- Hunt, E.R.; Cavigelli, M.; Daughtry, C.S.T.; McMurtrey, J.E.; Walthall, C.L. Evaluation of digital photography from model aircraft for remote sensing of crop biomass and nitrogen status. Precis. Agric. 2005, 6, 359–378. [Google Scholar] [CrossRef]
- Wang, L.A.; Zhou, X.; Zhu, X.; Dong, Z.; Guo, W. Estimation of biomass in wheat using random forest regression algorithm and remote sensing data. Crop J. 2016, 4, 212–219. [Google Scholar] [CrossRef]
- Moeckel, T.; Safari, H.; Reddersen, B.; Fricke, T.; Wachendorf, M. Fusion of ultrasonic and spectral sensor data for improving the estimation of biomass in grasslands with heterogeneous sward structure. Remote Sens. 2017, 9, 98. [Google Scholar] [CrossRef]
- McCarthy, C.; Hancock, N.; Raine, S. Apparatus and infield evaluations of a prototype machine vision system for cotton plant internode length measurement. J. Cotton Sci. 2010, 14, 221–232. [Google Scholar]
- Sui, R.; Fisher, D.K.; Reddy, K.N. Cotton yield assessment using plant height mapping system. J. Agric. Sci. 2013, 5, 23. [Google Scholar] [CrossRef]
- Chang, Y.K.; Zaman, Q.U.; Rehman, T.U.; Farooque, A.A.; Esau, T.; Jameel, M.W. A real-time ultrasonic system to measure wild blueberry plant height during harvesting. Biosyst. Eng. 2017, 157, 35–44. [Google Scholar] [CrossRef]
- Farooque, A.A.; Chang, Y.K.; Zaman, Q.U.; Groulx, D.; Schumann, A.W.; Esau, T.J. Performance evaluation of multiple ground based sensors mounted on a commercial wild blueberry harvester to sense plant height, fruit yield and topographic features in real-time. Comput. Electron. Agric. 2013, 91, 135–144. [Google Scholar] [CrossRef]
- Schirrmann, M.; Hamdorf, A.; Garz, A.; Ustyuzhanin, A.; Dammer, K.-H. Estimating wheat biomass by combining image clustering with crop height. Comput. Electron. Agric. 2016, 121, 374–384. [Google Scholar] [CrossRef]
- Pittman, J.J.; Arnall, D.B.; Interrante, S.M.; Wang, N.; Raun, W.R.; Butler, T.J. Bermudagrass, wheat, and tall fescue crude protein forage estimation using mobile-platform, active-spectral and canopy-height data. Crop Sci. 2016, 56, 870–881. [Google Scholar] [CrossRef]
- Hutchings, N.J. Factors affecting sonic sward stick measurements: The effect of different leaf characteristics and the area of sward sampled. Grass Forage Sci. 1992, 47, 153–160. [Google Scholar] [CrossRef]
- Escola, A.; Planas, S.; Rosell, J.R.; Pomar, J.; Camp, F.; Solanelles, F.; Gracia, F.; Llorens, J.; Gil, E. Performance of an ultrasonic ranging sensor in apple tree canopies. Sensors 2011, 11, 2459–2477. [Google Scholar] [CrossRef]
- Rischbeck, P.; Elsayed, S.; Mistele, B.; Barmeier, G.; Heil, K.; Schmidhalter, U. Data fusion of spectral, thermal and canopy height parameters for improved yield prediction of drought stressed spring barley. Eur. J. Agron. 2016, 78, 44–59. [Google Scholar] [CrossRef]
- Gibbs, J.A.; Pound, M.; French, A.P.; Wells, D.M.; Murchie, E.; Pridmore, T. Approaches to three-dimensional reconstruction of plant shoot topology and geometry. Funct. Plant Biol. 2016, 44, 62–75. [Google Scholar] [CrossRef]
- Hofle, B. Radiometric correction of terrestrial lidar point cloud data for individual maize plant detection. IEEE Geosci. Remote Sens. Lett. 2014, 11, 94–98. [Google Scholar] [CrossRef]
- Grenzdörffer, G.J. Crop height determination with uas point clouds. Int. Arch. Photogramm. Remote Sens. Spat. Inf. Sci. 2014, 40, 135. [Google Scholar] [CrossRef]
- Hoffmeister, D.; Waldhoff, G.; Korres, W.; Curdt, C.; Bareth, G. Crop height variability detection in a single field by multi-temporal terrestrial laser scanning. Precis. Agric. 2016, 17, 296–312. [Google Scholar] [CrossRef]
- Hosoi, F.; Nakabayashi, K.; Omasa, K. 3-d modeling of tomato canopies using a high-resolution portable scanning lidar for extracting structural information. Sensors 2011, 11, 2166–2174. [Google Scholar] [CrossRef] [PubMed]
- Colaço, A.F.; Molin, J.P.; Rosell-Polo, J.R.; Escolà, A. Application of light detection and ranging and ultrasonic sensors to high-throughput phenotyping and precision horticulture: Current status and challenges. Hortic. Res. 2018, 5, 35. [Google Scholar] [CrossRef] [PubMed]
- Ribes-Dasi, M.; Masip-Vilalta, J.; Camp, F.; Gràcia-Aguilá, F.; Solanelles-Batlle, F.; Planas-DeMartí, S.; Pallejà-Cabré, T.; Palacin-Roca, J.; Gregorio-Lopez, E.; Del-Moral-Martínez, I. Innovative lidar 3d dynamic measurement system to estimate fruit-tree leaf area. Sensors 2011, 11, 5769–5791. [Google Scholar]
- Keightley, K.E.; Bawden, G.W. 3d volumetric modeling of grapevine biomass using tripod lidar. Comput. Electron. Agric. 2010, 74, 305–312. [Google Scholar] [CrossRef]
- Hiraoka, Y.; Takahashi, M.; Watanabe, A. Application of terrestrial lidar for forest tree breeding: Evaluation of stem traits on f1 progenies of cryptomeria japonica plus trees. Nihon Ringakkai Shi/J. Jpn. For. Soc. 2015, 97, 290–295. [Google Scholar] [CrossRef]
- Herrero-Huerta, M.; Lindenbergh, R.; Gard, W. Leaf movements of indoor plants monitored by terrestrial lidar. Front. Plant Sci. 2018, 9, 189. [Google Scholar] [CrossRef]
- Lau, A.; Bentley, L.P.; Martius, C.; Shenkin, A.; Bartholomeus, H.; Raumonen, P.; Malhi, Y.; Jackson, T.; Herold, M. Quantifying branch architecture of tropical trees using terrestrial lidar and 3d modelling. Trees 2018, 1–13. [Google Scholar] [CrossRef]
- Jiang, Y.; Li, C.; Paterson, A.H. High throughput phenotyping of cotton plant height using depth images under field conditions. Comput. Electron. Agric. 2016, 130, 57–68. [Google Scholar] [CrossRef]
- Liu, S.; Baret, F.; Abichou, M.; Boudon, F.; Thomas, S.; Zhao, K.; Fournier, C.; Andrieu, B.; Irfan, K.; Hemmerlé, M. Estimating wheat green area index from ground-based lidar measurement using a 3d canopy structure model. Agric. For. Meteorol. 2017, 247, 12–20. [Google Scholar] [CrossRef]
- Jimenez-Berni, J.A.; Deery, D.M.; Rozas-Larraondo, P.; Condon, A.T.G.; Rebetzke, G.J.; James, R.A.; Bovill, W.D.; Furbank, R.T.; Sirault, X.R.R. High throughput determination of plant height, ground cover, and above-ground biomass in wheat with lidar. Front. Plant Sci. 2018, 9, 237. [Google Scholar] [CrossRef] [PubMed]
- Thapa, S.; Zhu, F.; Walia, H.; Yu, H.; Ge, Y. A novel lidar-based instrument for high-throughput, 3d measurement of morphological traits in maize and sorghum. Sensors 2018, 18, 1187. [Google Scholar] [CrossRef] [PubMed]
- Ghamkhar, K.; Irie, K.; Hagedorn, M.; Hsiao, J.; Fourie, J.; Gebbie, S.; Flay, C.; Barrett, B.; Stewart, A.; Werner, A. Using Lidar for Forage Yield Measurement of Perennial Ryegrass (lolium perenne l.) Field Plots; Breeding Grasses and Protein Crops in the Era of Genomics, Cham; Brazauskas, G., Statkevičiūtė, G., Jonavičienė, K., Eds.; Springer International Publishing: Cham, The Netherlands, 2018; pp. 203–208. [Google Scholar]
- Araus, J.L.; Cairns, J.E. Field high-throughput phenotyping: The new crop breeding frontier. Trends Plant Sci. 2013, 19, 52–61. [Google Scholar] [CrossRef] [PubMed]
- Zhang, L.; Grift, T.E. A lidar-based crop height measurement system for miscanthus giganteus. Comput. Electron. Agric. 2012, 85, 70–76. [Google Scholar] [CrossRef]
- Ehlert, D.; Adamek, R.; Horn, H.-J. Laser rangefinder-based measuring of crop biomass under field conditions. Precis. Agric. 2009, 10, 395–408. [Google Scholar] [CrossRef]
- Montes, J.M.; Technow, F.; Dhillon, B.S.; Mauch, F.; Melchinger, A.E. High-throughput non-destructive biomass determination during early plant development in maize under field conditions. Field Crops Res. 2011, 121, 268–273. [Google Scholar] [CrossRef]
- Lin, Y. Lidar: An important tool for next-generation phenotyping technology of high potential for plant phenomics? Comput. Electron. Agric. 2015, 119, 61–73. [Google Scholar] [CrossRef]
- Pittman, J.J.; Arnall, B.D.; Interrante, M.S.; Moffet, A.C.; Butler, J.T. Estimation of biomass and canopy height in bermudagrass, alfalfa, and wheat using ultrasonic, laser, and spectral sensors. Sensors 2015, 15, 2920–2943. [Google Scholar] [CrossRef]
- Sadeghi-Tehran, P.; Sabermanesh, K.; Virlet, N.; Hawkesford, M.J. Automated method to determine two critical growth stages of wheat: Heading and flowering. Front. Plant Sci. 2017, 8, 252. [Google Scholar] [CrossRef] [PubMed]
- Shafiekhani, A.; Kadam, S.; Fritschi, B.F.; DeSouza, N.G. Vinobot and vinoculer: Two robotic platforms for high-throughput field phenotyping. Sensors 2017, 17, 214. [Google Scholar] [CrossRef] [PubMed]
- Sankaran, S.; Khot, L.R.; Espinoza, C.Z.; Jarolmasjed, S.; Sathuvalli, V.R.; Vandemark, G.J.; Miklas, P.N.; Carter, A.H.; Pumphrey, M.O.; Knowles, N.R. Low-altitude, high-resolution aerial imaging systems for row and field crop phenotyping: A review. Eur. J. Agron. 2015, 70, 112–123. [Google Scholar] [CrossRef]
- Yang, G.; Liu, J.; Zhao, C.; Li, Z.; Huang, Y.; Yu, H.; Xu, B.; Yang, X.; Zhu, D.; Zhang, X.; et al. Unmanned aerial vehicle remote sensing for field-based crop phenotyping: Current status and perspectives. Front. Plant Sci. 2017, 8, 1111. [Google Scholar] [CrossRef] [PubMed]
- Sugiura, R.; Noguchi, N.; Ishii, K. Remote-sensing technology for vegetation monitoring using an unmanned helicopter. Biosyst. Eng. 2005, 90, 369–379. [Google Scholar] [CrossRef]
- Hunt, E.R.; Hively, W.D.; Fujikawa, J.S.; Linden, S.D.; Daughtry, T.C.S.; McCarty, W.G. Acquisition of nir-green-blue digital photographs from unmanned aircraft for crop monitoring. Remote Sens. 2010, 2, 290–305. [Google Scholar] [CrossRef]
- Chapman, C.S.; Merz, T.; Chan, A.; Jackway, P.; Hrabar, S.; Dreccer, F.M.; Holland, E.; Zheng, B.; Ling, J.T.; Jimenez-Berni, J. Pheno-copter: A low-altitude, autonomous remote-sensing robotic helicopter for high-throughput field-based phenotyping. Agronomy 2014, 4, 279–301. [Google Scholar] [CrossRef]
- Sankaran, S.; Khot, L.R.; Carter, A.H. Field-based crop phenotyping: Multispectral aerial imaging for evaluation of winter wheat emergence and spring stand. Comput. Electron. Agric. 2015, 118, 372–379. [Google Scholar] [CrossRef]
- Duan, T.; Zheng, B.; Guo, W.; Ninomiya, S.; Guo, Y.; Chapman, S.C. Comparison of ground cover estimates from experiment plots in cotton, sorghum and sugarcane based on images and ortho-mosaics captured by uav. Funct. Plant Biol. 2016, 44, 169–183. [Google Scholar] [CrossRef]
- Holman, H.F.; Riche, B.A.; Michalski, A.; Castle, M.; Wooster, J.M.; Hawkesford, J.M. High throughput field phenotyping of wheat plant height and growth rate in field plot trials using uav based remote sensing. Remote Sens. 2016, 8, 1031. [Google Scholar] [CrossRef]
- Zhang, C.; Kovacs, J.M. The application of small unmanned aerial systems for precision agriculture: A review. Precis. Agric. 2012, 13, 693–712. [Google Scholar] [CrossRef]
- Haghighattalab, A.; González Pérez, L.; Mondal, S.; Singh, D.; Schinstock, D.; Rutkoski, J.; Ortiz-Monasterio, I.; Singh, R.P.; Goodin, D.; Poland, J. Application of unmanned aerial systems for high throughput phenotyping of large wheat breeding nurseries. Plant Methods 2016, 12, 35. [Google Scholar] [CrossRef] [PubMed]
- Shi, Y.; Thomasson, J.A.; Murray, S.C.; Pugh, N.A.; Rooney, W.L.; Shafian, S.; Rajan, N.; Rouze, G.; Morgan, C.L.S.; Neely, H.L.; et al. Unmanned aerial vehicles for high-throughput phenotyping and agronomic research. PLoS ONE 2016, 11, e0159781. [Google Scholar] [CrossRef] [PubMed]
- CASA. Australian Civil Aviation Safety Authority (Casa), Civil Aviation Legislation Amendment (part 101) Regulation 2016. Available online: https://www.Legislation.Gov.Au/details/f2016l00400 (accessed on 24 March 2016).
- Coppens, F.; Wuyts, N.; Inzé, D.; Dhondt, S. Unlocking the potential of plant phenotyping data through integration and data-driven approaches. Curr. Opin. Syst. Biol. 2017, 4, 58–63. [Google Scholar] [CrossRef]
- Köhl, K.; Gremmels, J. A software tool for the input and management of phenotypic data using personal digital assistants and other mobile devices. Plant Methods 2015, 11, 25. [Google Scholar] [CrossRef] [PubMed]
- Zhou, J.; Applegate, C.; Alonso, A.D.; Reynolds, D.; Orford, S.; Mackiewicz, M.; Griffiths, S.; Penfield, S.; Pullen, N. Leaf-gp: An open and automated software application for measuring growth phenotypes for arabidopsis and wheat. Plant Methods 2017, 13, 117. [Google Scholar] [CrossRef] [PubMed]
- Crescente, J.M.; Guidobaldi, F.; Demichelis, M.; Formica, M.B.; Helguera, M.; Vanzetti, L.S. Phenobook: An open source software for phenotypic data collection. GigaScience 2017, 6, 1–5. [Google Scholar] [CrossRef] [PubMed]
- Giuffrida, M.V.; Doerner, P.; Tsaftaris, S.A. Pheno-deep counter: A unified and versatile deep learning architecture for leaf counting. Plant J. Cell Mol. Biol. 2018, 96, 880–890. [Google Scholar] [CrossRef] [PubMed]
- Hu, P.; Chapman, S.C.; Wang, X.; Potgieter, A.; Duan, T.; Jordan, D.; Guo, Y.; Zheng, B. Estimation of plant height using a high throughput phenotyping platform based on unmanned aerial vehicle and self-calibration: Example for sorghum breeding. Eur. J. Agron. 2018, 95, 24–32. [Google Scholar] [CrossRef]
- Khan, Z.; Rahimi-Eichi, V.; Haefele, S.; Garnett, T.; Miklavcic, S.J. Estimation of vegetation indices for high-throughput phenotyping of wheat using aerial imaging. Plant Methods 2018, 14, 20. [Google Scholar] [CrossRef] [PubMed]
- Forlani, G.; Dall’Asta, E.; Diotri, F.; Cella, U.M.d.; Roncella, R.; Santise, M. Quality assessment of dsms produced from uav flights georeferenced with on-board rtk positioning. Remote Sens. 2018, 10, 311. [Google Scholar] [CrossRef]
- Shafian, S.; Rajan, N.; Schnell, R.; Bagavathiannan, M.; Valasek, J.; Shi, Y.; Olsenholler, J. Unmanned aerial systems-based remote sensing for monitoring sorghum growth and development. PLoS ONE 2018, 13, e0196605. [Google Scholar] [CrossRef] [PubMed]
- Sankaran, S.; Zhou, J.; Khot, L.R.; Trapp, J.J.; Mndolwa, E.; Miklas, P.N. High-throughput field phenotyping in dry bean using small unmanned aerial vehicle based multispectral imagery. Comput. Electron. Agric. 2018, 151, 84–92. [Google Scholar] [CrossRef]
- Wang, M.; Cheng, Y.; Chang, X.; Jin, S.; Zhu, Y. On-orbit geometric calibration and geometric quality assessment for the high-resolution geostationary optical satellite gaofen4. ISPRS J. Photogramm. Remote Sens. 2017, 125, 63–77. [Google Scholar] [CrossRef]
- Perez-Sanz, F.; Navarro, P.J.; Egea-Cortines, M. Plant phenomics: An overview of image acquisition technologies and image data analysis algorithms. GigaScience 2017, 6, gix092. [Google Scholar] [CrossRef] [PubMed]
- Barth, R.; Ijsselmuiden, J.; Hemming, J.; Van Henten, E.J. Synthetic bootstrapping of convolutional neural networks for semantic plant part segmentation. Comput. Electron. Agric. 2017, in press. [Google Scholar] [CrossRef]
- Constantino, K.P.; Gonzales, E.J.; Lazaro, L.M.; Serrano, E.C.; Samson, B.P. Towards an automated plant height measurement and tiller segmentation of rice crops using image processing. In Mechatronics and Machine Vision in Practice 3; Billingsley, J., Brett, P., Eds.; Springer International Publishing: Cham, The Netherlands, 2018; pp. 155–168. [Google Scholar]
- Lee, U.; Chang, S.; Putra, G.A.; Kim, H.; Kim, D.H. An automated, high-throughput plant phenotyping system using machine learning-based plant segmentation and image analysis. PLoS ONE 2018, 13, e0196615. [Google Scholar] [CrossRef] [PubMed]
- Kim, S.-L.; Solehati, N.; Choi, I.-C.; Kim, K.-H.; Kwon, T.-R. Data management for plant phenomics. J. Plant Biol. 2017, 60, 285–297. [Google Scholar] [CrossRef]
- Madden, S. From databases to big data. IEEE Internet Comput. 2012, 16, 4–6. [Google Scholar] [CrossRef]
- Rathore, A.; Singh, V.K.; Pandey, S.K.; Rao, C.S.; Thakur, V.; Pandey, M.K.; Anil Kumar, V.; Das, R.R. Current status and future prospects of next-generation data management and analytical decision support tools for enhancing genetic gains in crops. Adv. Biochem. Eng. Biotechnol. 2018. [Google Scholar]
- Krajewski, P.; Chen, D.; Ćwiek, H.; van Dijk, A.D.J.; Fiorani, F.; Kersey, P.; Klukas, C.; Lange, M.; Markiewicz, A.; Nap, J.P.; et al. Towards recommendations for metadata and data handling in plant phenotyping. J. Exp. Bot. 2015, 66, 5417–5427. [Google Scholar] [CrossRef]
- Ćwiek-Kupczyńska, H.; Altmann, T.; Arend, D.; Arnaud, E.; Chen, D.; Cornut, G.; Fiorani, F.; Frohmberg, W.; Junker, A.; Klukas, C.; et al. Measures for interoperability of phenotypic data: Minimum information requirements and formatting. Plant Methods 2016, 12, 44. [Google Scholar] [CrossRef] [PubMed]
- Wu, D.; Guo, Z.; Ye, J.; Feng, H.; Liu, J.; Chen, G.; Zheng, J.; Yan, D.; Yang, X.; Xiong, X.; et al. Combining high-throughput micro-ct-rgb phenotyping and genome-wide association study to dissect the genetic architecture of tiller growth in rice. J. Exp. Bot. 2019, 70, 545–561. [Google Scholar] [CrossRef] [PubMed]
- Brocks, S.; Bareth, G. Estimating barley biomass with crop surface models from oblique rgb imagery. Remote Sens. 2018, 10, 268. [Google Scholar] [CrossRef]
- Aparicio, N.; Villegas, D.; Casadesus, J.; Araus, J.L.; Royo, C. Spectral vegetation indices as nondestructive tools for determining durum wheat yield. Agron. J. 2000, 92, 83–91. [Google Scholar] [CrossRef]
- Yue, J.; Feng, H.; Yang, G.; Li, Z. A comparison of regression techniques for estimation of above-ground winter wheat biomass using near-surface spectroscopy. Remote Sens. 2018, 10, 66. [Google Scholar] [CrossRef]
- Kamilaris, A.; Prenafeta-Boldú, F.X. Deep learning in agriculture: A survey. Comput. Electron. Agric. 2018, 147, 70–90. [Google Scholar] [CrossRef]
- Marabel, M.; Alvarez-Taboada, F. Spectroscopic determination of aboveground biomass in grasslands using spectral transformations, support vector machine and partial least squares regression. Sensors 2013, 13, 10027–10051. [Google Scholar] [CrossRef]
- Viljanen, N.; Honkavaara, E.; Näsi, R.; Hakala, T.; Niemeläinen, O.; Kaivosoja, J. A novel machine learning method for estimating biomass of grass swards using a photogrammetric canopy height model, images and vegetation indices captured by a drone. Agriculture 2018, 8, 70. [Google Scholar] [CrossRef]
- van Eeuwijk, F.; Bustos-Korts, D.; Millet, E.J.; Boer, M.; Kruijer, W.; Thompson, A.; Malosetti, M.; Iwata, H.; Quiroz, R.; Kuppe, C. Modelling strategies for assessing and increasing the effectiveness of new phenotyping techniques in plant breeding. Plant Sci. 2018, in press. [Google Scholar] [CrossRef]
- Ubbens, J.; Cieslak, M.; Prusinkiewicz, P.; Stavness, I. The use of plant models in deep learning: An application to leaf counting in rosette plants. Plant Methods 2018, 14, 6. [Google Scholar] [CrossRef] [PubMed]
- Zhang, H.; Sun, Y.; Chang, L.; Qin, Y.; Chen, J.; Qin, Y.; Du, J.; Yi, S.; Wang, Y. Estimation of grassland canopy height and aboveground biomass at the quadrat scale using unmanned aerial vehicle. Remote Sens. 2018, 10, 851. [Google Scholar] [CrossRef]
- Junker, A.; Muraya, M.M.; Weigelt-Fischer, K.; Arana-Ceballos, F.; Klukas, C.; Melchinger, A.E.; Meyer, R.C.; Riewe, D.; Altmann, T. Optimizing experimental procedures for quantitative evaluation of crop plant performance in high throughput phenotyping systems. Front. Plant Sci. 2015, 5, 770. [Google Scholar] [CrossRef] [PubMed]
- Singh, A.; Ganapathysubramanian, B.; Singh, A.K.; Sarkar, S. Machine learning for high-throughput stress phenotyping in plants. Trends Plant Sci. 2016, 21, 110–124. [Google Scholar] [CrossRef] [PubMed]
- Reynolds, D.; Baret, F.; Welcker, C.; Bostrom, A.; Ball, J.; Cellini, F.; Lorence, A.; Chawade, A.; Khafif, M.; Noshita, K.; et al. What is cost-efficient phenotyping? Optimizing costs for different scenarios. Plant Sci. 2018, in press. [Google Scholar] [CrossRef]
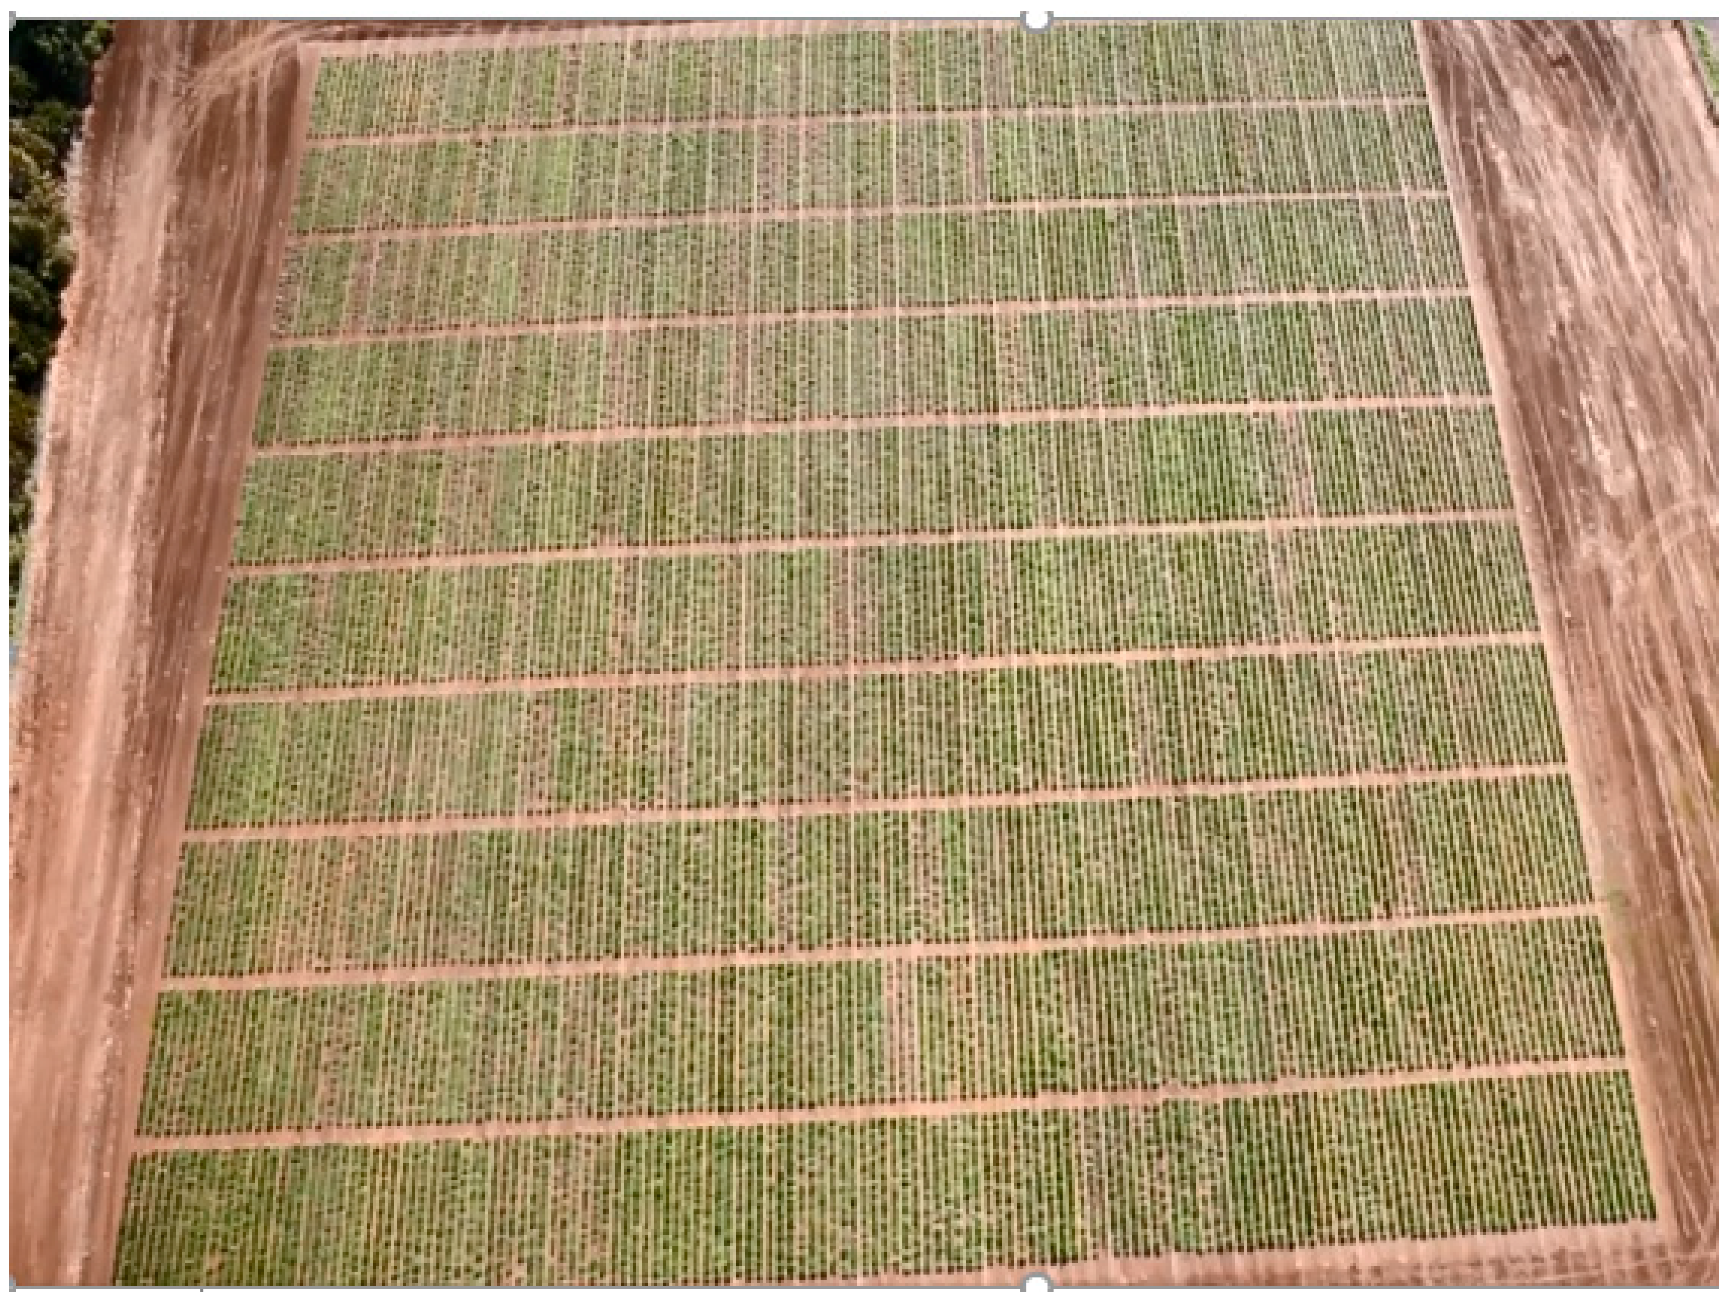
Figure 1.
An aerial image of perennial ryegrass genomic subsection field trial which comprises 48,000 individual plants at Hamilton Centre, Victoria, Australia.
Figure 1.
An aerial image of perennial ryegrass genomic subsection field trial which comprises 48,000 individual plants at Hamilton Centre, Victoria, Australia.

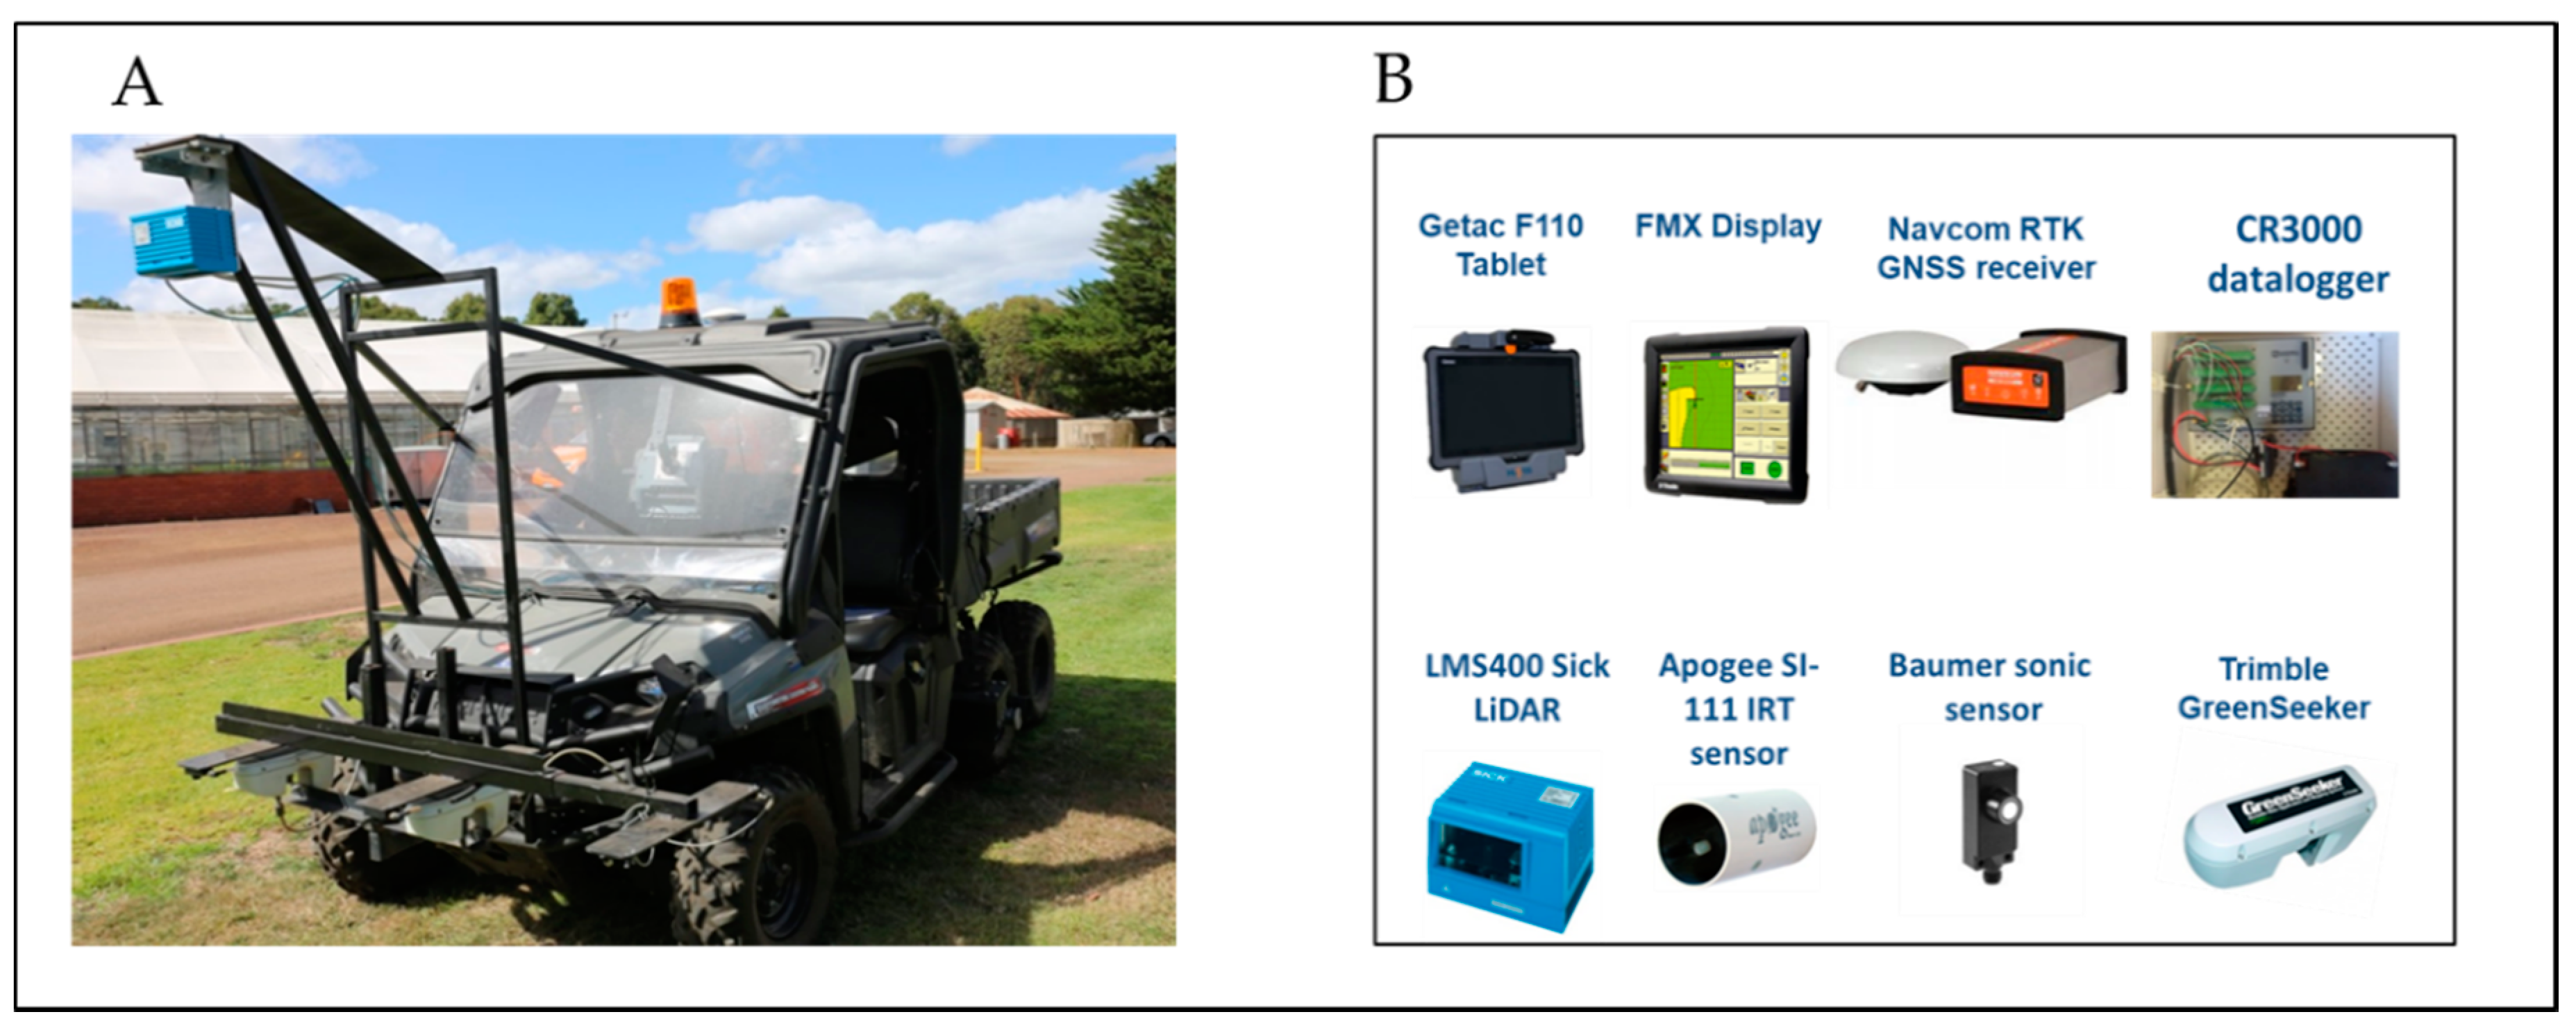
Figure 2.
The ground-based phenotyping platform named as “Phenorover” assembled in Hamilton Centre, AVR for field phenotyping of perennial ryegrass. (A) Semiautomated ground vehicle named Phenorover; (B) list of deployed sensors on Phenorover.
Figure 2.
The ground-based phenotyping platform named as “Phenorover” assembled in Hamilton Centre, AVR for field phenotyping of perennial ryegrass. (A) Semiautomated ground vehicle named Phenorover; (B) list of deployed sensors on Phenorover.

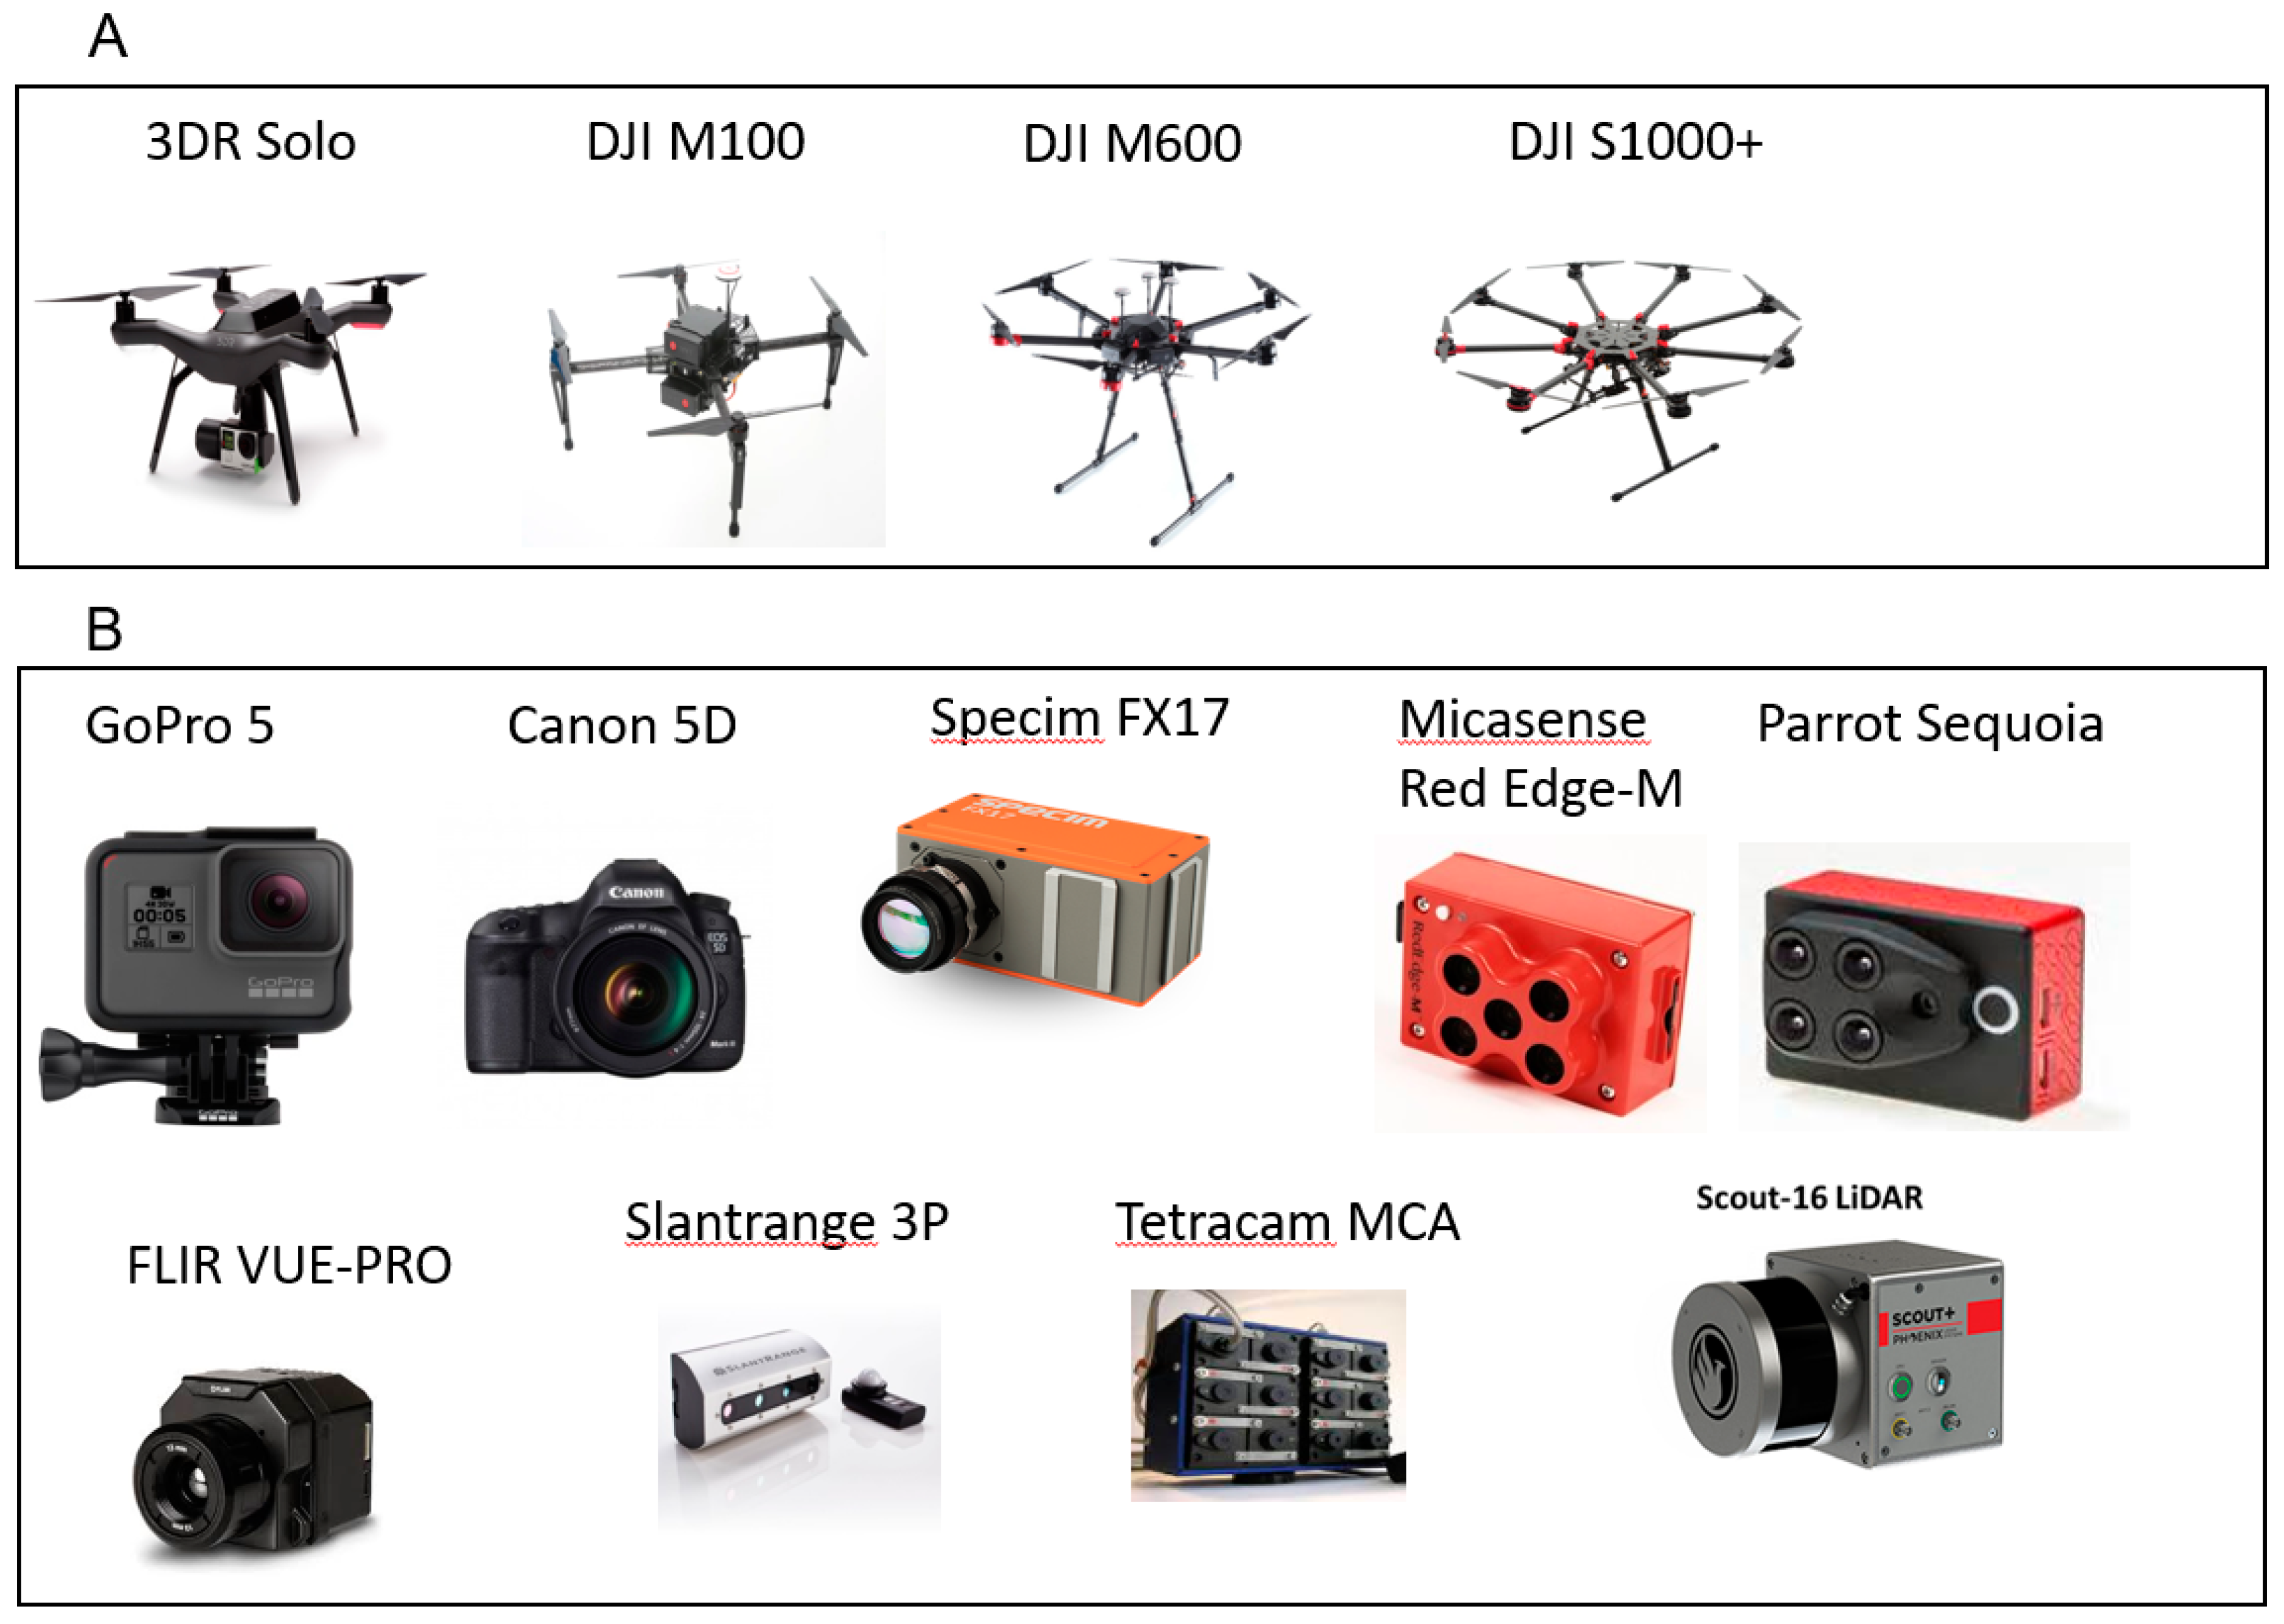
Figure 3.
The aerial-based unmanned aerial system (UAS) phenotyping platform in Hamilton Centre, AVR for field phenotyping of perennial ryegrass. (A) List of various semiautomated UASs; (B) list of sensors deployed on UASs.
Figure 3.
The aerial-based unmanned aerial system (UAS) phenotyping platform in Hamilton Centre, AVR for field phenotyping of perennial ryegrass. (A) List of various semiautomated UASs; (B) list of sensors deployed on UASs.

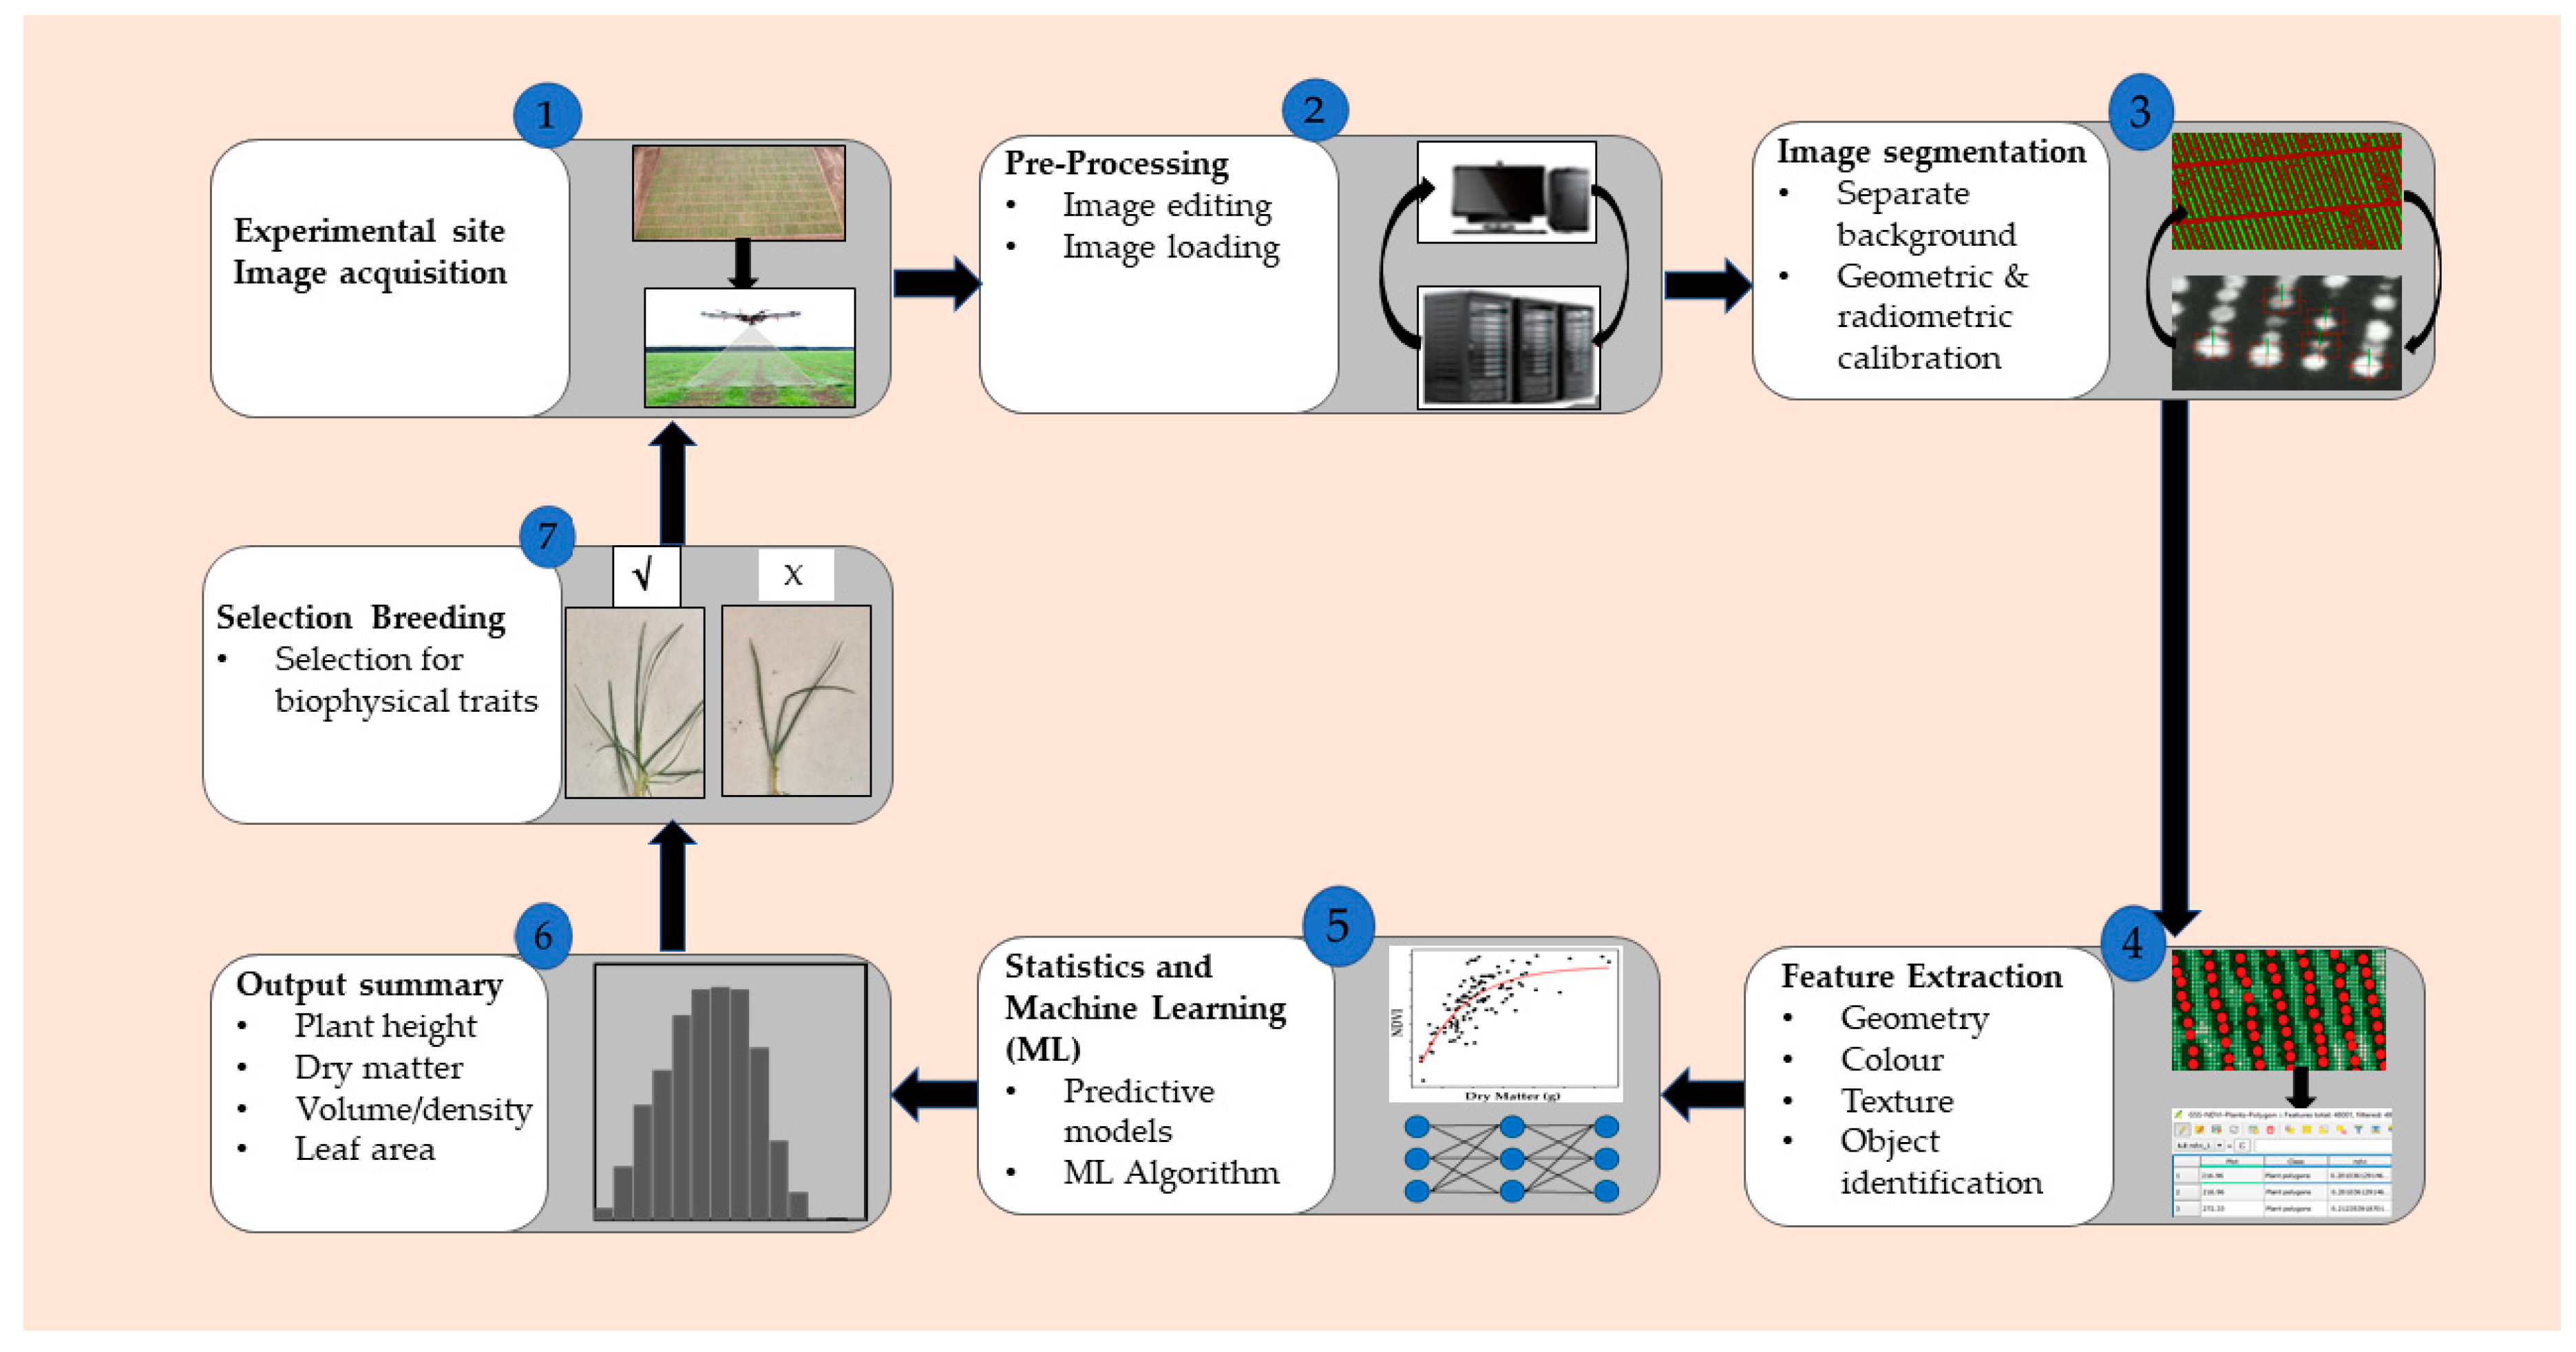
Figure 4.
A diagram of workflow indicating image acquisition, processing and analysis. Image- and data-processing platform (in phenomics lab) requires data and image capture from an experimental field. Images and data obtained can be preprocessed to remove noise and artefacts and stored in a server for further processing. Images can be further identified, segmented and classified from the background and nontarget objects using the software. In the post-megadata processing, machine learning through predictive models would develop to the framework for data analysis and analysed data can be used to rank, visualise and screen at individual, row and sward plot levels.

© 2019 by the authors. Licensee MDPI, Basel, Switzerland. This article is an open access article distributed under the terms and conditions of the Creative Commons Attribution (CC BY) license (http://creativecommons.org/licenses/by/4.0/).
Share and Cite
MDPI and ACS Style
Gebremedhin, A.; Badenhorst, P.E.; Wang, J.; Spangenberg, G.C.; Smith, K.F. Prospects for Measurement of Dry Matter Yield in Forage Breeding Programs Using Sensor Technologies. Agronomy 2019, 9, 65. https://doi.org/10.3390/agronomy9020065
AMA Style
Gebremedhin A, Badenhorst PE, Wang J, Spangenberg GC, Smith KF. Prospects for Measurement of Dry Matter Yield in Forage Breeding Programs Using Sensor Technologies. Agronomy. 2019; 9(2):65. https://doi.org/10.3390/agronomy9020065
Chicago/Turabian StyleGebremedhin, Alem, Pieter E. Badenhorst, Junping Wang, German C. Spangenberg, and Kevin F. Smith. 2019. "Prospects for Measurement of Dry Matter Yield in Forage Breeding Programs Using Sensor Technologies" Agronomy 9, no. 2: 65. https://doi.org/10.3390/agronomy9020065
Note that from the first issue of 2016, this journal uses article numbers instead of page numbers. See further details here.