Article

Macronutrients in Soil and Wheat as Affected by a Long-Term Tillage and Nitrogen Fertilization in Winter Wheat–Fallow Rotation

1
Department of Crop and Soil Sciences, Washington State University, Pullman, WA 99164, USA
2
Department of Crop and Soil Science, Oregon State University, Corvallis, OR 97331, USA
3
USDA Agricultural Research Service, Columbia Plateau Conservation Research Center, Adams, OR 97810, USA
4
Stockbridge School of Agriculture, University of Massachusetts, Amherst, MA 01003, USA
*
Author to whom correspondence should be addressed.
Agronomy 2019, 9(4), 178; https://doi.org/10.3390/agronomy9040178
Submission received: 27 March 2019 / Accepted: 2 April 2019 / Published: 6 April 2019

Abstract

:
The insights gained from the long-term impacts of tillage and N fertilization on soil fertility are crucial for the development of sustainable cropping systems. The objectives of this study were to quantify the effects of 75 years of tillage and N fertilization on macronutrients in soil and wheat (Triticum aestivum L.) tissues grown in a winter wheat–summer fallow rotation. The experiment included three types of tillage (disc, DP; sweep, SW; and moldboard, MP) and five N application rates (0, 45, 90, 135, and 180 kg ha−1). Soil and tissue samples were analyzed for the concentration of total N, S, and C, Mehlich III extractable P, K, Mg, Ca in the soil, and the total concentration of the same nutrients in wheat tissue. Soil N concentration was significantly greater under DP (1.10 g kg−1) than under MP (1.03 g kg−1). The P concentration in upper 20 cm soil depth increased with increased N rates. Comparison of experiment plots to a nearby undisturbed pasture revealed a decline of P (32%), SOC (34%), Mg (77%), and Ca (86%) in the top 10 cm soil depth. The results suggest that DP with high N rates could reduce the macronutrient decline in soil and plant over time.

Graphical Abstract

1. Introduction

For sustainable crop production, it is of utmost importance to determine the direction of changes in soil health indicators such as soil organic matter (SOM) and the status of plant essential nutrients. Plant nutrient availability and SOM can be maintained or increased if the land is kept covered, crop residues or nutrients are returned to the soil, and erosion is kept to minimum; practices that are not common in the drylands of the Pacific Northwest (PNW) [1]. A winter wheat–14 months fallow (WW–F) rotation is commonly practiced in the PNW to harvest one winter’s precipitation for next year’s wheat crop because the precipitation in this region is not always sufficient for annual winter wheat cropping. However, fallow conditions have negative impacts on the concentration of SOM and on nutrient availability, and hence reduce the capacity of the soil to supply plant nutrients [1]. There has been increasing interest in the impact of soil management practices on nutrient cycling all over the world [2]. However, there is limited knowledge of how soil management practices, such as different tillage systems and N fertilization, affect essential plant macronutrients in the drylands of PNW over long-term periods.
Tillage affects SOM [3], pH [4], and nutrient availability [5]. Conservation tillage, such as disc plow (DP) and sweep (SW), have shown positive effects on crop productivity. The DP or SW reduces soil disturbance and retains crop residue which, in turn, increases soil water content and nutrient availability [6]. On the other hand, more traditional tillage, such as moldboard plow tillage (MP), promotes SOM loss and nutrient losses due to increased soil disturbance and residue incorporation. Consequently, a larger volume of SOM becomes accessible to microbes and subject to mineralization [7]. Mineralization is intensified under dryland fallow cropping system, because fallow accompanied by tillage buries residue in the moist soil profile, which would otherwise have been very slow due to dryness of the soil under dryland winter wheat cropping.
The other important management practice affecting SOM and nutrient availability is N fertilization. Nitrogen fertilization was shown to increase SOM and total N due to increased root and shoot biomass production [8]. On the other hand, increased N fertilization enhances mineralization and may subsequently contribute to increased N losses through leaching and gaseous emissions [9].
Nutrients in wheat grain and straw are an important aspect of sustainable crop production as nutrient content is directly related to grain quality for human consumption, price determination, and crop residue quality. Soil management practices play a crucial role in the quality of the wheat grain [10]. For example, grain protein content is the prime measure of wheat grain quality, which is directly related to the availability of N [10]. However, Gürsoy et al. [11] reported little or no correlation between wheat grain protein and tillage systems. In contrast, López-Bellido et al. [10] found higher grain protein content under MP than under reduced tillage, as moisture stress tends to increase grain protein in wheat. Short-term experiments and site-specific inconsistency require a critical examination of the samples from a long-term agroecosystem experiment so that sustainable practices for the specific or similar region can be identified.
The present study was conducted on one of the several long-term experiments (LTE) maintained by Columbia Basin Agricultural Research Center (CBARC), Adams, OR. Different tillage methods and inorganic N application were the common soil management strategies of farmers during 1900s. Therefore, this LTE was established in 1940 to evaluate the long-term effect of three tillage regimes and application of varying rates of inorganic N fertilizer on soil properties and crop productivity under the WW–F cropping system in the drylands of the PNW. It has been reported that combinations of different tillage practices and fertilizer management were found to affect soil nutrients at different depths [8]. Therefore, this study investigated plant essential macronutrients in wheat and soil at four soil depths under three tillage systems and five N application rates. To date, no studies have examined the dynamics of essential macronutrients in crops or soil other than C and N under WW–F rotation in the PNW. The objective of this study was to quantify the effect of different tillage systems and N application rates on macronutrients (C, N, P, K, S, Ca, and Mg) in soil and in wheat tissues, following 75 years of tillage and N fertilization under WW–F rotation. We compared the concentrations of macronutrients in wheat tissue (grain and straw) and soil samples at four depths (0–10, 10–20, 20–30, 30–60 cm) from 1995, 2005 and 2015 to determine the 20 years trend of the macronutrients. Additionally, macronutrients of 2015 soil samples from the WW–F were compared with that of undisturbed nearby grass pasture (GP) plots to determine changes in the concentration of soil macronutrients after 75 years of tillage and N fertilization in WW–F rotation. The hypotheses of this study were:
(i) The concentration of macronutrients will be greater under conservation tillage (Disc plow (DP) or sweep (SW)) than under conventional tillage (Moldboard plow (MP)). The base of this hypothesis is that the greater amount of crop residues left and lesser volume of soil disturbance under SW and DP will accumulate and conserve more SOM than under MP.
(ii) The plots with higher N fertilization will have a greater concentration of macronutrients than zero or low N rates application. This hypothesis is based on the well-established fact that N enhances root biomass production and so increases SOM concentration.

2. Materials and Methods

2.1. Site Description and Experimental Design

This long-term study was conducted in one of the several ongoing long-term experiment (LTE) plots situated at the Columbia Basin Agriculture Research Center (CBARC), near Pendleton, OR (45°42′ N, 118°36′ W, elev. 438 m). The soil is a well-drained Walla Walla silt loam (coarse-silty, mixed, superactive, mesic Typic Haploxeroll) with a 2–4% slope [12]. The site receives an average annual precipitation of 420 mm, with 90% of precipitation between November and June [13]. This LTE was established in 1940 as a randomized block, split-plot tillage by fertility experiment with three replications under a dryland winter wheat–14 months fallow (WW–F) cropping system. Main plots were three primary tillage systems (moldboard plow (MP), disc plow (DP) and sweep (SW)) with the size of 35 by 40 m each. Subplots were comprised of five N application rates (0, 45, 90, 135, and 180 kg N ha−1) and were 5.8 by 40 m in size. The MP, DP, and SW differed in tillage depth and percentage of residue cover left on the soil surface at the time of seeding. The tillage depths of MP, DP, and SW were 23 cm, 10 cm, and 15 cm, respectively, and left 7%, 34%, and 43% soil surface covered by residue, respectively. Earlier studies on this plot had reported 20% clay, 68% silt, 1.1% organic C kg−1, and 16 cmolc kg−1 cation exchange capacity (CEC) in the upper 30 cm of the soil [4].
Primary tillage treatments were carried out in late March on undisturbed stubble left after wheat harvest. Plots were rod weeded two to four times between April and October to control weeds. Nitrogen fertilizer (Urea ammonium nitrate) was applied to a depth of 10 cm every other year (during crop year) using Viper Coulter (Yetter Manufacturing Inc. Colchester, IL, USA) during the first week of October. Wheat was seeded at 72 ± 5 kg seed ha−1 with row spacing of 25 cm a week following the N application. Before 2002, JD 8300 drill (Deere and Company, Moline, IL, USA) was used to sow wheat and thereafter Case IH 5300 disk drill (Klamath Basin Eq. Inc. Klamath Falls, OR, USA) has been used. The wheat variety grown during the 1995–2005 period was Malcolm, and after that Stephens was used. These are semi-dwarf winter wheat varieties. Weeds within the growing season were controlled using late-fall or early-spring herbicide application. Wheat was harvested in late July.
A long-term undisturbed (since 1931) nearby perennial grass pasture (GP) was used as the reference/baseline to detect the changes manifested by cultivation practices. The GP was a cropland between 1881 and 1931, then was converted back to pasture. It is comprised of blue-bunch wheatgrass (Agropyron spicatum L. Pursh) and Idaho fescue (Festuca idahoensis L. Elmer) as dominant grasses.

2.2. Soil Sampling and Analysis

Archived samples of soil and wheat grain and straw from 1995 and 2005 were used in this study. The soil samples from 1995 and 2005 were at four depths (0–10, 10–20, 20–30, and 30–60 cm). Additional soil samples were collected in the summer of 2015 at the four soil depths after the wheat harvest. A truck-mounted Giddings Hydraulic Probe (Giddings Machine Company, Inc., Windsor, CO) and a steel sampling tube (internal diameter 3.6 cm) were used to sample the soils. The samples were homogenized and brought to the Central Analytical Lab (CAL, Oregon State University, Corvallis, OR, USA) to determine the soil total N, C, S, and Mehlich III-extractable P, K, Ca, and Mg. Concentrations of soil and plant C, N, and S were determined by the dry combustion method using a Thermo Finnigan FlashEA 1112 Elemental Analyzer (Thermo Finnigan FlashEA 1112 E, Milan, Italy) for the 1995 and 2005 samples and a Vario Micro Cube combustion analyzer (Elementar Analysensysteme GmbH, Hanau, Germany) for the 2015 samples. Mehlich III extraction method [14] was used to extract P, K, Ca, and Mg from soil samples, whereas the grain and straw samples were dry ashed [15]. Nutrients were determined using an inductively coupled plasma-optical emissions spectroscopy (ICP-OES, Model #2100 DV, Waltham, MA, USA). Soil pH data from 1995, 2005, and 2015 were provided by CBARC, and were determined with pH electrodes using 10 g sample in a 1:2 soil to 0.01 M CaCl2 solution.

2.3. Statistical Analysis

Data were subjected to ANOVA as a split-plot design using the mixed-model in JMP© version 13 (SAS Institute Inc, 2014, Cary, NC, USA). Tillage system, N rate, year, and soil depth were considered the fixed effects, while replications and their interactions were considered the random effects. The adjusted Tukey method was used for multiple means comparisons. Letter groupings were generated using a 5% level of significance.
The ANOVA of the soil pH were determined by converting the soil pH data to H+ concentration (µmol L−1) before analysis because the pH scale is a logarithmic and a small difference in pH can represent a significant difference. However, the mean comparisons of soil pH represent the original pH data.

3. Results and Discussion

Macronutrient concentration did not change with time. Therefore, only the 2015 data for soil were used in the statistical analysis of tillage and N application effects. The total carbon at the depths measured is organic only and was confirmed by the soil pH from this study and previous studies [1,4].

3.1. Effect of Tillage and N Rates on Soil Macronutrients and Soil pH

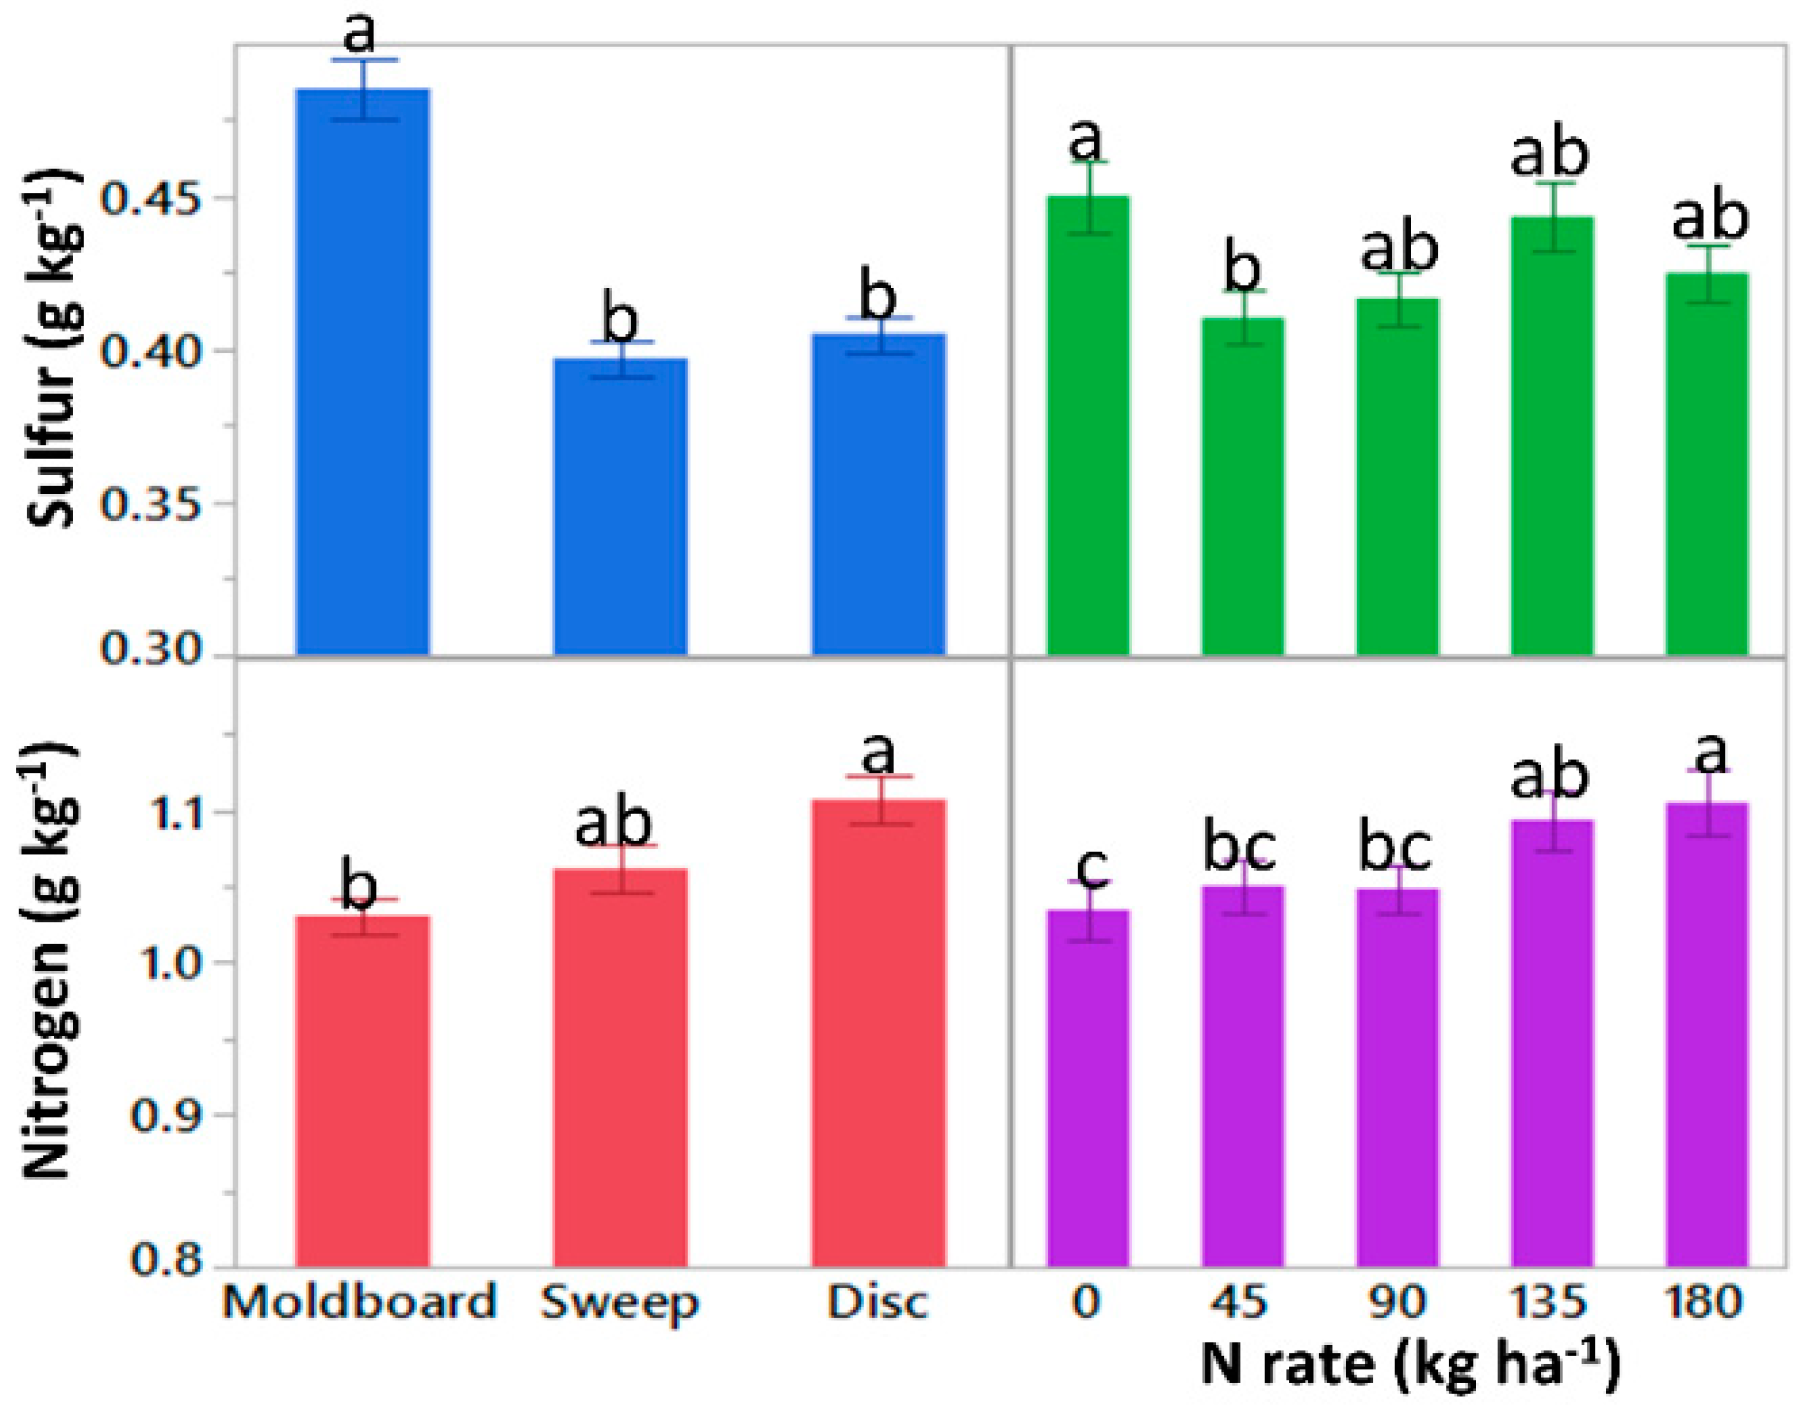
3.1.1. Total N and Total S

Averaged over the soil depths, both DP and SW plots had higher total N (1.10/1.06 g N kg−1, respectively) than MP plots (1.03 g N kg−1) (Figure 1). This result is consistent with a previous study by Rasmussen and Rhode [16] on the same plot 30 years ago, and with a study from central Italy [17]. The MP plots had a lower percentage of crop residue than the DP and SW. Mazzoncini et al. [17] suggested that the higher residue cover and the lower volume of disturbed soil may have contributed to the higher N under DP and SW than under MP. The MP exposed greater proportions of protected organic matter, increased aeration, temperature, and thereby enhanced microbial decomposition rates resulting in the release of inorganic N along with other nutrients [16,18].
Total N concentration in the soil increased with high N application rates (Figure 1), supporting our first hypothesis for N. Previous studies have shown positive correlations between N application rates and soil total N [16,17]. The possible reason for a positive correlation between high N fertilization rate and soil total N could be the higher crop biomass production resulting from N fertilizer application [1]. Furthermore, enhanced crop production with high N application rates are known to chemically stabilize SOM and make N available at a steady rate for a long time [17]. Total S under MP (0.48 g kg−1) was greater than under SW (0.39 g kg−1) or DP (0.40 g kg−1) (Figure 1). Enhanced decomposition under MP is expected to decrease the S [2,19]; however, the results from this study do not support this concept. Total S was greater in MP than in DP or SW even after the 75 years of cultivation, refuting our first hypothesis for S (Figure 1).

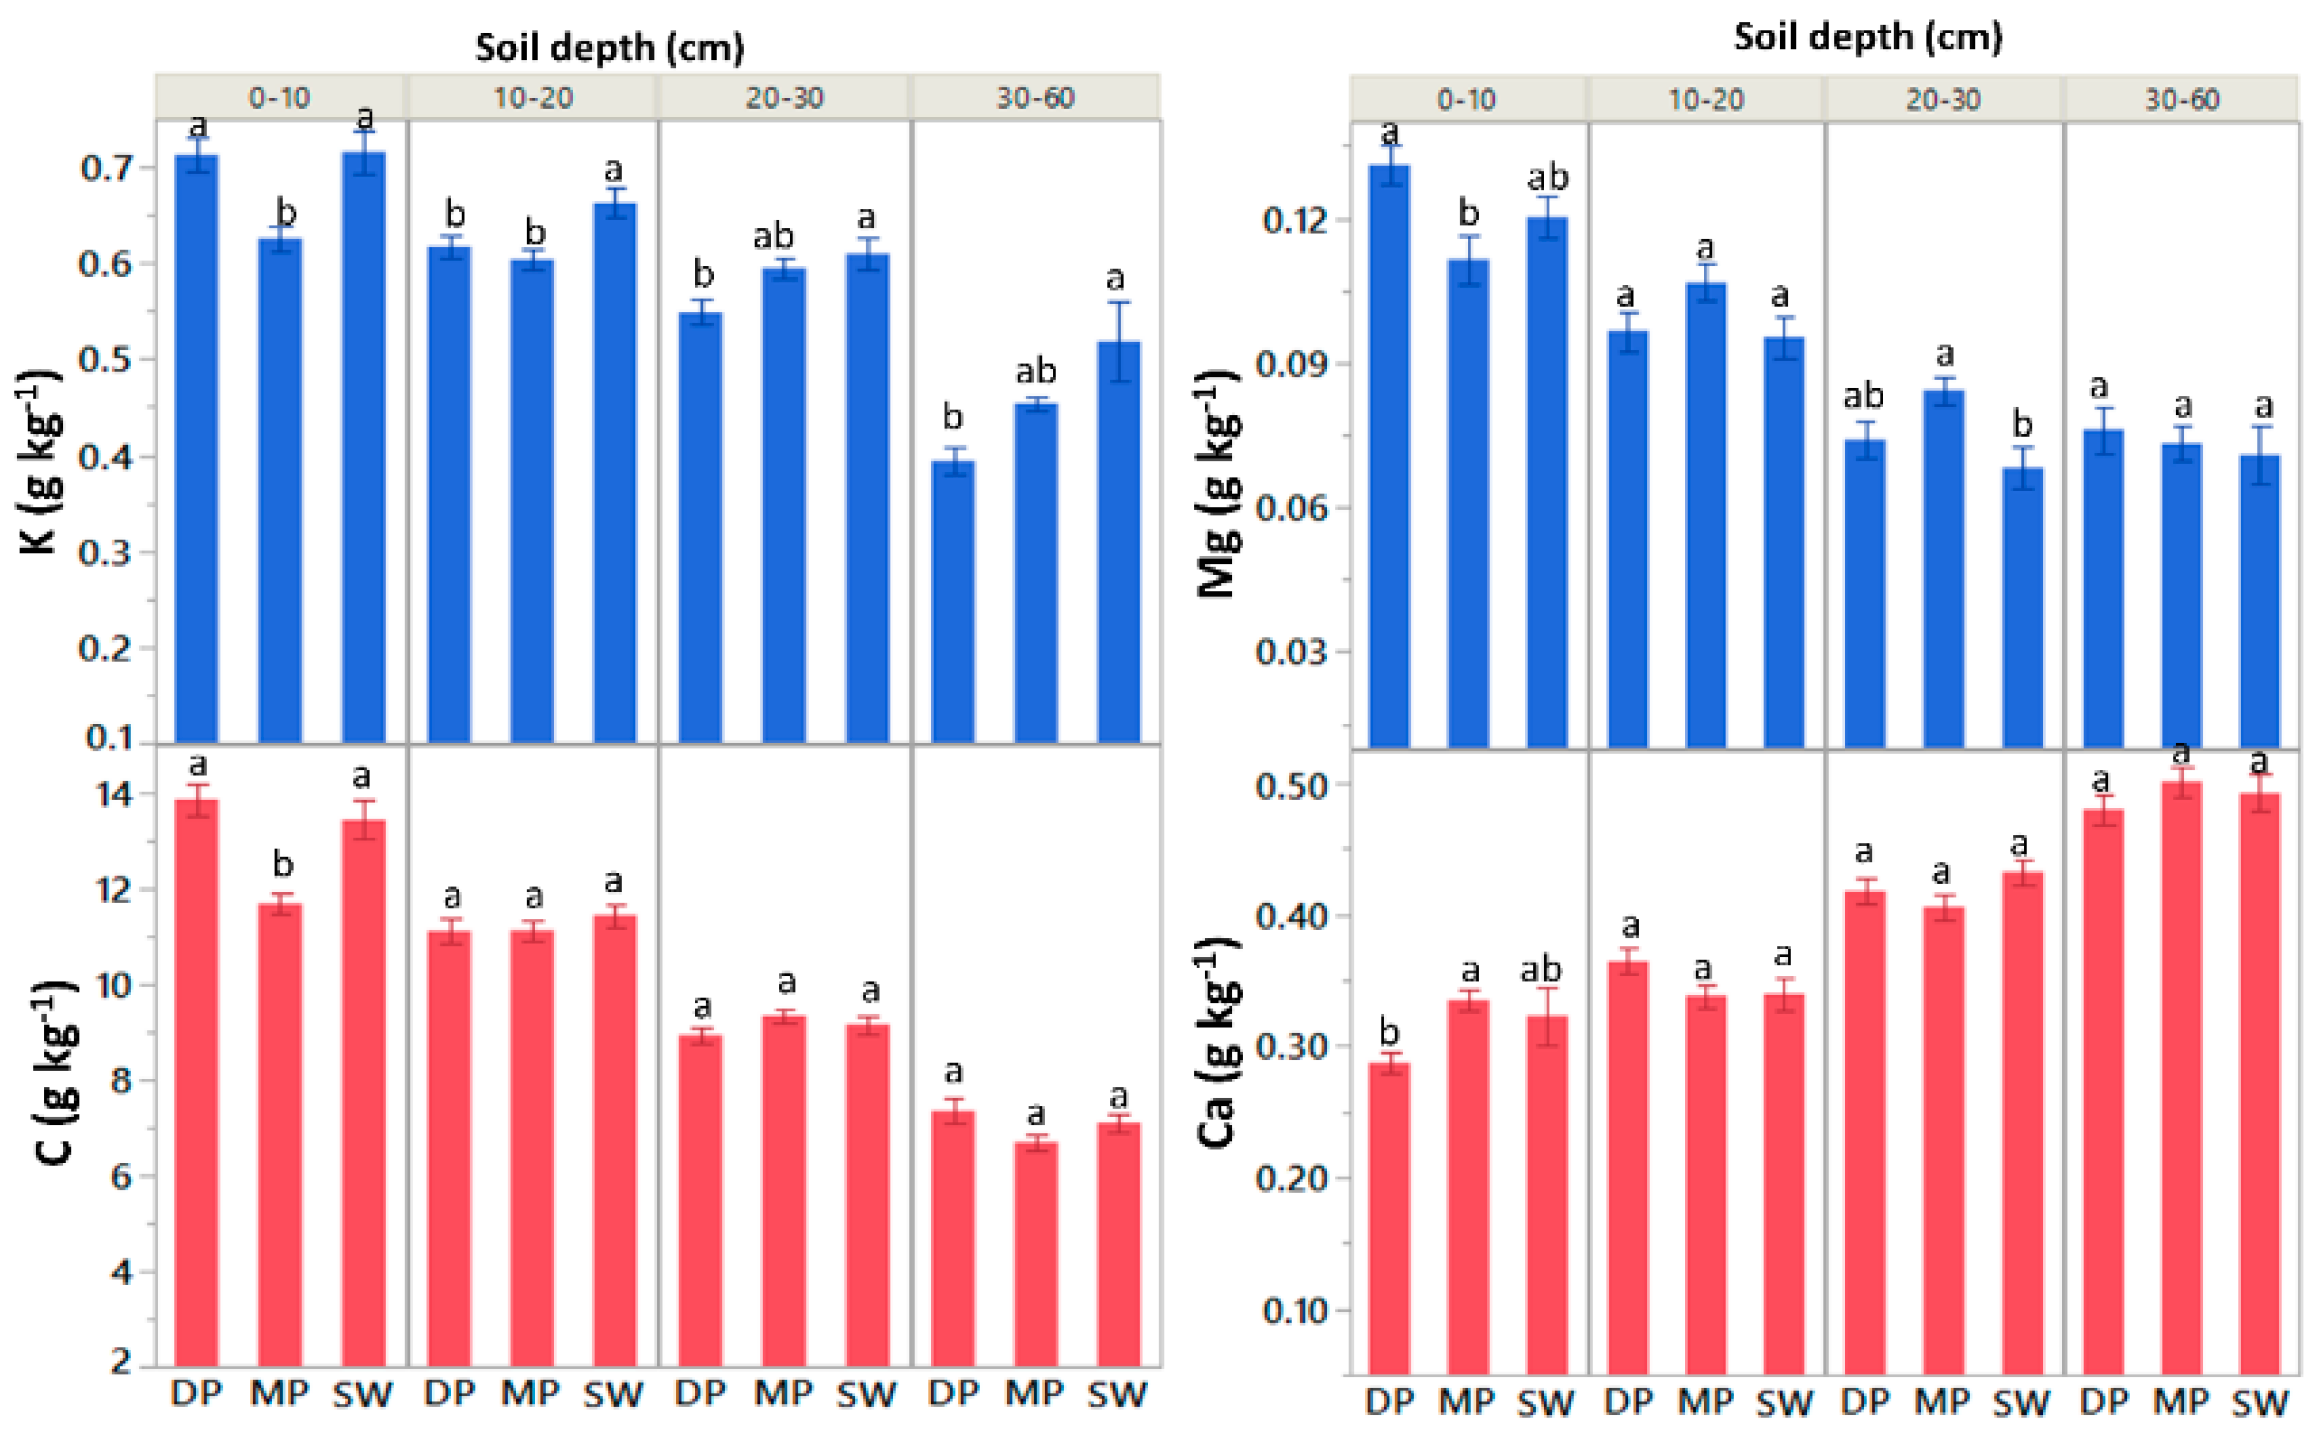
3.1.2. Soil Organic C, Mehlich III Extractable K, Ca, and Mg

In the 0–10 cm soil depth, the concentrations of soil organic C (SOC), K, and Mg were significantly higher under DP or SW than under MP (Figure 2). This supports our first hypothesis for SOC, K, and Mg. Earlier studies had reported similar results for SOC [16], K [20,21], and Mg [5]. Higher SOC, K, and Mg in the surface soil layer for the DP or SW than the MP is attributed to reduced soil–residue interaction in the DP or SW compared to MP (crop residue was buried 10–15 cm deep under SW and DP vs. 23 cm under MP), and subsequently lowering the rates of SOM mineralization. The other plausible reason for higher K and Mg under DP or SW than under MP might be due to greater number of cation exchange sites associated with increased SOM contents under DP and SW. Interestingly, we observed antagonistic behavior between Mg and Ca relating to their availability within the soil depths. Although Ca and Mg come from the same source and are absorbed by plants in similar amounts, Ca increased with depths while Mg decreased with soil depths (Figure 2). The lower Ca in the surface soil could be due to lower soil pH [18] in the surface soil than in the subsoils (Figure S1). The inorganic N fertilizer (Urea ammonium nitrate) was applied to a depth of 10 cm, and in the drylands, nitrification derived acidity is concentrated in the fertilizer placement zone [4]. In addition to this, this soil has free lime in the subsoil and thus a greater amount of Ca was observed in the deep than in the upper soil profile [16]. On the other hand, greater Mg in the top soil than in the subsoil could be due to the presence of more organic matter (wheat residues) at this depth than deeper down.

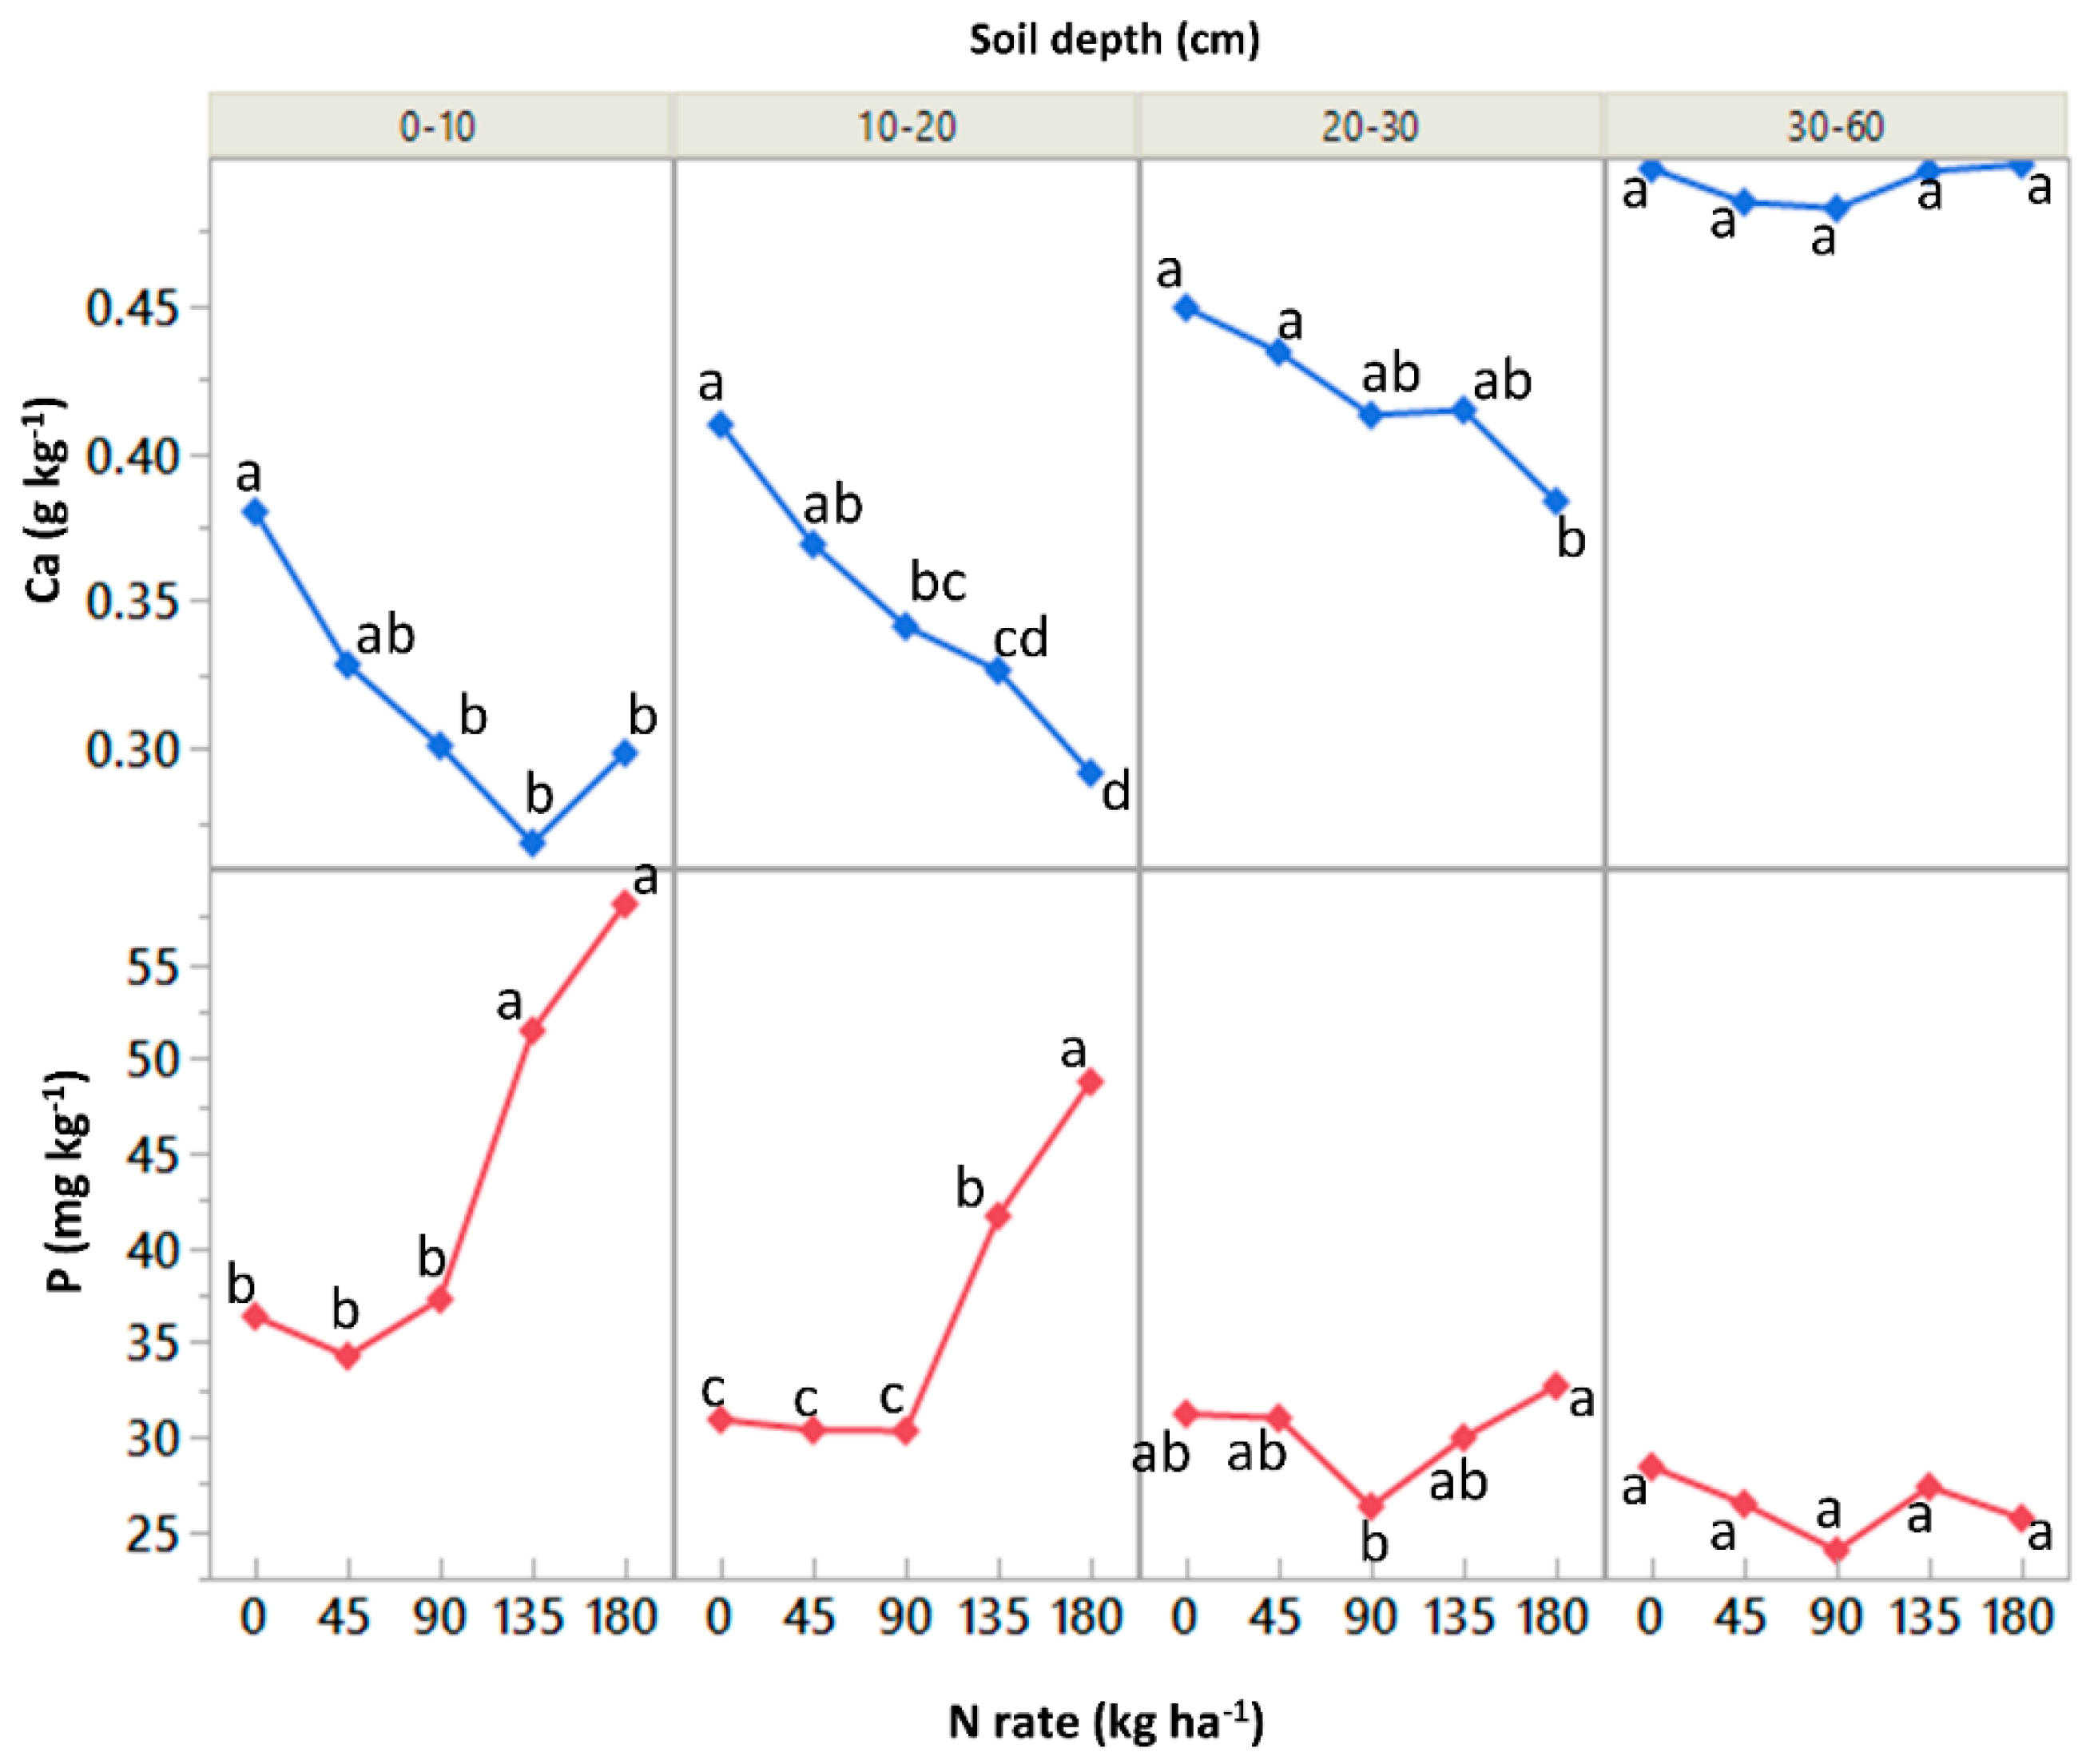
3.1.3. Mehlich III Extractable Ca and P

Soil Ca in the 0–10 cm soil depth was higher under MP (0.33 g kg−1) than under DP (0.28 g kg−1) or SW (0.32 g kg−1) (Figure 3); therefore, we reject our first hypothesis for Ca. The result agrees with Blevins et al. [8]; however, Edwards et al. [5] found greater Ca at 0–10 cm soil depth in less disturbed plots compared to conventional tillage. In this study, K at the 0–10 cm soil depth was greater under DP or SW than under MP and this could have probably decreased the concentration of Ca in DP or SW due to the competition between K and Ca for exchange sites. Consistent decline of Ca in the studied soil depths, except in 30–60 cm, was observed with the high N rates (Figure 3), which doesn’t support our first hypothesis for Ca. This result is in line with the study of Ai et al. [22]; however, other studies had contrasting results [7,20]. The availability of Ca is inversely related to soil acidity and decreases with high N application rates. Acidic soils have high exchangeable Al, which replaces Ca on exchange sites and depresses Ca concentrations [18].
A reverse trend was observed with the concentration of extractable P in the top 20 cm soil depth. The P concentration linearly increased with N rates higher than 45 kg ha−1 (Figure 3), supporting our first hypothesis for P. The results from this study were in contrast with the study of Franzluebbers and Hons [20] who reported no effect of N application rates on soil P. Probably, the effect of increased acidity on P resulting from the high N rates was balanced by the high biomass production and increased N availability in this study. Increased N availability probably facilitated decomposition of crop residue and release of P from microbial activity.

3.1.4. Soil pH

Soil pH was significantly (p < 0.01) influenced by N application rates in the 0–10 cm and 10–20 cm soil depths only (Figure S1 and Table S1). At these soil depths, pH was significantly higher in the 0 kg N ha−1, 45 kg N ha−1, and 90 kg N ha−1 treatments than in the 135 kg N ha−1 and 180 kg N ha−1 application rates. These results are consistent with the results from previous long-term studies, which reported that N fertilizer application markedly decreased soil pH in the top layers only [4,7]. This suggests that soil acidification resulting from N application did not move beyond 20 cm soil depth which is significant because acidification is confined at upper layers and has limited effect on the subsoil. Mahler et al. [23] reported that only high application rates of N (>100 kg N ha−1) acidified soil in a 40-year long-term study. However, in this study, even low N application rates acidified the soil when administered over 75 years. This finding was also reported by Ghimire et al. [4] in a 70-year study. Among the tillage systems, MP was found to be the most detrimental regarding soil pH. Soil pH at the 10–20 cm and 20–30 cm soil depths were 5.35 and 6.03, respectively, under MP and were significantly (p < 0.01) lower than the soil pH of 5.52 and 6.30 under SW or 5.74 and 6.43 under DP, respectively (Figure S1). This could be attributed to the higher volume of soil disturbance and mixing of crop residue with soil deeper in the profile under MP than under SW or DP treatments.

3.2. Soil Macronutrients after 75 Years of Tillage and N Fertilization versus Grass Pasture (GP)

3.2.1. Soil Organic C, Total N, and Total S

Among the tillage systems used in this experiment, DP had greater concentrations of most of the macronutrients, while SW and DP were comparable for many of the macronutrients. Thus, we compared the DP system with the nearby undisturbed GP to detect soil micronutrient changes manifested by tillage and inorganic N application over 75 years under dryland WW–F cropping system. All five N application rates decreased C and N at each of the studied soil depths (Table 1). Carbon and N declined by at least 34% (14.4 g kg−1) and 35% (1.4 g kg−1); respectively, when compared to GP (C: 21.8 g kg−1; N: 2.1 g kg−1) in the top 10 cm depth at all N fertilization rates after 75 years of treatment. These results refute our second hypothesis that DP maintains the nutrient in soil comparable with that of GP. According to Rasmussen et al. [1], the top 30 cm of soil in these plots lost about 35% of C in the first 50 years after the soil was cultivated in 1881, while under pasture following cultivation, C and N of soils increased with time [1]. High biological oxidation and absence of C input during the fallow year is the major driver of SOC loss in the dryland wheat–fallow cropping system of eastern Oregon [1]. Furthermore, Hedley et al. [2] reported that conversion of perennial pasture over time accumulates more C in the soil than the annually cultivated pasture. The protected SOM becomes more accessible to the soil microbes, and the soil environment becomes more conducive to SOM mineralization under cropland than in undisturbed pasture, increasing the probability of C and N loses in cultivated soils [3]. The loss of nutrients becomes more severe in dryland wheat-fallow cropping systems of the PNW because fallowing keeps the soil moist in the summer which permits greater biological oxidation than would normally occur [1]. In addition, perennial grasses contribute a greater amount of C and N all year round through their dense and deep root systems than the wheat–fallow cropping system [24].
There was no significant loss of N at deeper depths (20–30 cm and 30–60 cm) at any N application rate. This is significant for agriculture because long-term cultivation has not limited N availability in subsoil and suggests that mineralization enhanced by tillage is the major factor responsible for C and N loss at the 0–20 cm soil depths. Interestingly, the S concentration at the 20–30 cm soil depth increased significantly after cultivation compared to GP and was numerically (but not significantly) increased at all N rates in the rest of studied soil depths (Table 1). However, it is not quite clear what increased the S by 41% at the 20–30 cm depth in the 0 kg N ha−1 of cultivated soil (0.45 g kg−1) compared to GP (0.32 g kg−1). These results partially agree with Sakadevan et al. [25] who reported gradual decrease in S after many years of pasture improvement because mineralization became a significantly greater source of S for perennial grasses. It has been reported that greater amounts of crop residues and root exudates (which is in GP in our study) greatly affect oxidation of S and release of S in soil solution [26].

3.2.2. Mehlich III Extractable P, K, Ca, and Mg

The concentration of Mehlich III extractable P, Ca, and Mg decreased after 75 years of WW–F rotation at all N application rates and at each of the studied soil depths (Table 2). Extractable P declined by 32%, 33%, 39%, and 40% in the 0–10 cm, 10–20 cm, 20–30 cm, and 30–60 cm soil depths, respectively, compared with P in the GP. Similarly, extractable Ca decreased by 86%, 83%, 81%, 78%, and extractable Mg decreased by 77%, 84%, 89%, 85% in the 0–10 cm, 10–20 cm, 20–30 cm, 30–60 cm soil depths, respectively (Table 2). The effect of N application rates on extractable K was not significant in the top soils (0–10 cm, 10–20 cm, and 20–30 cm); however, an obvious decline in K concentration was observed deeper in the soil (30–60 cm). At this depth, extractable K sharply declined by 31% when compared with that in GP.
This study revealed significant declines in soil macronutrients after 75 years of cultivation under WW–F rotation, which could have implications for the soil nutrient supplying capacity of this region. Loss of macronutrients in cultivated plots was primarily due to increased weathering of primary minerals with tillage and nutrient removal by high yielding crops, whereas in the GP, aboveground biomass was sometimes clipped but not removed from the plots. The nutrient concentrations in the soil are the balance between nutrients removed and nutrients added to the soil. In these plots, soil macronutrients were not returned to the soil except for N in the N fertilization treatments and incorporating crop residue. Furthermore, the straw: grain ratio has decreased progressively over time [1], thus resulting in lower contributions to SOM. Under GP, SOM was higher than under cultivated plots [27], resulting in higher CEC under GP, which in turn affected the nutrient pool of the soil. Thus, SOM losses, nutrient removal by crops, no input of mineral nutrients except N, and weathering of minerals could be the major factors responsible for macronutrient declines in this long-term study.

3.3. Macronutrients Accumulation in Wheat Straw and Grain

Sweep tillage (SW) noticeably increased N accumulation in straw more than in MP (Figure S2). Similar to the result reported by Malhi et al. [28], there was no tillage effect on straw N and C accumulation. The concentration of N, K, Ca, and Mg in straw was prominently greater at higher N application rates (above 90 kg N ha−1) than at the lower rates (i.e., 0 and 45 kg N ha−1) (Figures S2 and S3). No interaction between tillage systems, N application rates or year was observed for nutrient accumulation in straw (Table S2).
The effect of N application rates on soil N was reflected in wheat straw and wheat grain nutrients. Higher N rates consistently increased N accumulation in wheat grain (Figure 4). Except at 180 kg N ha−1, N accumulation increased significantly over time at all N rates (Figure 4). These results agree with those of Gao et al. [29], who reported a linear increase of grain N uptake (up to 120 kg N ha−1). Grain N concentration from this study suggest that N rates could be used as a management tool for manipulating wheat grain N content because low N content is desired in soft wheat, whereas high N content is desired in hard wheat.

4. Conclusions

The DP tillage was more effective in maintaining macronutrient levels than the other tillage systems, which suggests that opting for a tillage method that leaves more residue cover and less soil disturbance can be a wise decision to sustain soil fertility compared to conventional tillage. However, a comparison with the nutrient status of GP revealed great losses of macronutrients due to 75 years of continuous WW–F cropping. Further understanding of the sustainability of current agriculture management practices in this region and other semiarid regions requires long-term monitoring of nutrient status in the soil and crops. Since the nutrients are continually decreasing in the WW–F cropping system even under DP, shifting to no-tillage can be a better strategy to reduce the macronutrient loses. Under no-tillage, a greater amount of organic matter accumulates and less disturbances to soil occur which enhances microbial activity leading to soil resiliency and sustainability. However, a long-term study is required to confirm if shifting from DP to no-tillage in the drylands of the PNW is a viable solution to curb the nutrient losses from agricultural practices or not. Any short-term study will miss gradual changes in soil nutrient status which could become a problem in the future if not detected and corrected early enough.

Supplementary Materials

The following are available online at https://www.mdpi.com/2073-4395/9/4/178/s1, Figure S1: Long-term effect of tillage (left) and N application rates (right) on pH in four soil depths (cm) under the winter wheat–fallow system. Plow: moldboard tillage; Sweep: sweep tillage; and Disc: disc tillage. The bars sharing the same letters within each soil depths are not significantly different at 0.05 probability level, Figure S2: Effect of different inorganic N application rates and tillage systems on the accumulation of N and K in wheat straw in the winter wheat–fallow cropping system in 2015. Plow: moldboard tillage; Sweep: sweep tillage; and Disc: disc tillage. The bars sharing the same letters are not significantly different at 0.05 probability level, Figure S3: Effect of different rates of inorganic N applications on the accumulation of Ca and Mg in wheat straw in the winter wheat–fallow cropping system in 2015. The bar sharing the same letters are not significantly different at 0.05 probability level, Table S1: ANOVA for macronutrients in soil and soil pH as influenced by 75 years of tillage, N rate, and depth. Significant effects (p < 0.05) that require multiple means comparison are shown in bold, Table S2: ANOVA for N, C, S, P, K, Ca, and Mg in wheat straw and grain as influenced by tillage, year and N rates. Significant effects (p < 0.05) that require multiple means comparison are shown in bold.

Author Contributions

V.D.Z. came up with the idea, conceptualization and the methodology. In addition, V.D.Z. was involved with editing and revision of the paper; S.S. collected, analyzed the samples and prepared the original draft; H.T.G. analyzed the carbon, nitrogen and sulfur of soil and wheat tissue for the study and was involved in the review and edit of the manuscript; M.K. and B.X. reviewed and edited the manuscript.

Funding

This research was supported by Oregon State University startup funds awarded to Valtcho D. Jeliazkov (Zheljazkov).

Acknowledgments

We thank Karl Rhinhart and his crews for their help with the field soil sampling. Special thanks to Paul Rasmussen (retired), Chris Roager (retired) and coworkers at USDA Agricultural Research Service for collecting and archiving long-term grass pasture and soil and plant samples from tillage-fertility (TF) plots.

Conflicts of Interest

The authors declare no conflict of interest.

References

  1. Rasmussen, P.E.; Albrecht, S.L.; Smiley, R.W. Soil C and N changes under tillage and cropping systems in semi-arid Pacific Northwest agriculture. Soil Tillage Res. 1998, 47, 197–205. [Google Scholar] [CrossRef]
  2. Hedley, M.J.; Saggar, S.; Francis, G.S. Chemical fractionation to characterize changes in sulphur and carbon in soil caused by management. Eur. J. Soil Sci. 2004, 55, 79–90. [Google Scholar]
  3. Awale, R.; Emeson, M.A.; Machado, S. Soil organic carbon pools as early indicators for soil organic matter stock changes under different tillage practices in inland Pacific Northwest. Front. Ecol. Evol. 2017, 5, 96. [Google Scholar] [CrossRef]
  4. Ghimire, R.; Machado, S.; Bista, P. Soil pH, soil organic matter, and crop yields in winter wheat-summer fallow systems. Agron. J. 2017, 109, 706–717. [Google Scholar] [CrossRef]
  5. Edwards, J.H.; Wood, C.W.; Thurlow, D.L.; Ruf, M.E. Tillage and crop-rotation effects on fertility status of a Hapludult soil. Soil Sci. Soc. Am. J. 1992, 56, 1577–1582. [Google Scholar] [CrossRef]
  6. Seddaiu, G.; Iocola, I.; Farina, R.; Orsini, R.; Iezzi, G.; Roggero, P.P. Long term effects of tillage practices and N fertilization in rainfed Mediterranean cropping systems: Durum wheat, sunflower and maize grain yield. Eur. J. Agron. 2016, 77, 166–178. [Google Scholar] [CrossRef]
  7. Obour, A.K.; Mikha, M.M.; Holman, J.D.; Stahlman, P.W. Changes in soil surface chemistry after fifty years of tillage and nitrogen fertilization. Geoderma 2017, 308, 46–53. [Google Scholar] [CrossRef]
  8. Blevins, R.L.; Thomas, G.W.; Smith, M.S.; Frye, W.W.; Cornelius, P.L. Changes in soil properties after 10 years continuous non-tilled and conventionally tilled corn. Soil Tillage Res. 1983, 3, 135–146. [Google Scholar] [CrossRef]
  9. Malhi, S.S.; Lemke, R. Tillage, crop residue and N fertilizer effects on crop yield, nutrient uptake, soil quality and nitrous oxide gas emissions in a second 4-yr rotation cycle. Soil Tillage Res. 2007, 96, 269–283. [Google Scholar] [CrossRef]
  10. López-Bellido, L.; López-Bellido, R.J.; Castillo, J.E.; López-Bellido, F.J. Effects of long-term tillage, crop rotation and nitrogen fertilization on bread-making quality of hard red spring wheat. Field Crops Res. 2001, 72, 197–210. [Google Scholar] [CrossRef]
  11. Gürsoy, S.; Sessiz, A.; Malhi, S.S. Short-term effects of tillage and residue management following cotton on grain yield and quality of wheat. Field Crops Res. 2010, 119, 260–268. [Google Scholar] [CrossRef]
  12. Gollany, H.T.; Allmaras, R.R.; Copeland, S.M.; Albrecht, S.L.; Douglas, J.C.L. Tillage and nitrogen fertilizer influence on carbon and soluble silica relations in a Pacific Northwest mollisol. Soil Sci. Soc. Am. J. 2005, 69, 1102–1109. [Google Scholar] [CrossRef]
  13. Gollany, H.T. CQESTR Simulation of dryland agroecosystem soil organic carbon changes under climate change scenarios. In Synthesis and Modeling of Greenhouse Gas Emissions and Carbon Storage in Agricultural and Forest Systems to Guide Mitigation and Adaptation. Advances in Agricultural Systems Modeling; Del Grosso, S., Ahuja, L., Parton, W., Eds.; ASA-CSSA-SSSA: Madison, WI, USA, 2016; pp. 59–87. [Google Scholar]
  14. Mehlich, A. Mehlich 3 soil test extractant: A modification of Mehlich 2 extractant. Commun. Soil Sci. Plant Anal. 1984, 15, 1409–1416. [Google Scholar] [CrossRef]
  15. Papp, C.; Harms, T. Comparison of digestion methods for total elemental analysis of peat and separation of its organic and inorganic components. Analyst 1985, 110, 237–243. [Google Scholar] [CrossRef]
  16. Rasmussen, P.E.; Rhode, C.R. Long-term tillage and nitrogen fertilization effects on organic nitrogen and carbon in a semiarid soil. Soil Sci. Soc. Am. J. 1988, 52, 1114–1117. [Google Scholar] [CrossRef]
  17. Mazzoncini, M.; Sapkota, T.B.; Bàrberi, P.; Antichi, D.; Risaliti, R. Long-term effect of tillage, nitrogen fertilization and cover crops on soil organic carbon and total nitrogen content. Soil Tillage Res. 2011, 114, 165–174. [Google Scholar] [CrossRef]
  18. Prasad, R.; Power, J. Soil Fertility Management for Sustainable Agriculture; CRC Press: Boca Raton, FL, USA; New York, NY, USA, 1997; ISBN 9781566702546. [Google Scholar]
  19. Kopittke, P.M.; Dalal, R.C.; Menzies, N.W. Changes in exchangeable cations and micronutrients in soils and grains of long-term, low input cropping systems of subtropical Australia. Geoderma 2017, 285, 293–300. [Google Scholar] [CrossRef]
  20. Franzluebbers, A.J.; Hons, F.M. Soil-profile distribution of primary and secondary plant-available nutrients under conventional and no tillage. Soil Tillage Res. 1996, 39, 229–239. [Google Scholar] [CrossRef]
  21. Ussiri, D.A.N.; Lal, R. Long-term tillage effects on soil carbon storage and carbon dioxide emissions in continuous corn cropping system from an alfisol in Ohio. Soil Tillage Res. 2009, 104, 39–47. [Google Scholar] [CrossRef]
  22. Ai, Z.; Wang, G.; Liang, C.; Liu, H.; Zhang, J.; Xue, S.; Liu, G. The effects of nitrogen addition on the uptake and allocation of macro and micronutrients in Bothriochloa ischaemum on loess plateau in China. Front. Plant Sci. 2017, 8, 1476. [Google Scholar] [CrossRef]
  23. Mahler, L.R.; Hammel, J.E.; Harder, R.W. The influence of crop rotation and tillage methods on the distribution of extractable boron in Northern Idaho Soils. Soil Sci. 1985, 139, 67–73. [Google Scholar] [CrossRef]
  24. Wuest, S.B.; Gollany, H.T. Soil organic carbon and nitrogen after application of nine organic amendments. Soil Sci. Soc. Am. J. 2013, 77, 237–245. [Google Scholar] [CrossRef]
  25. Sakadevan, K.; Mackay, A.D.; Hedley, M.J. Sulphur cycling in New Zealand hill country pastures. II. The fate of fertilizer sulphur. J. Soil Sci. 1993, 44, 615–624. [Google Scholar] [CrossRef]
  26. Germida, J.J.; Janzen, H.H. Factors affecting the oxidation of elemental sulfur in soils. Fertil. Res. 1993, 35, 101–114. [Google Scholar] [CrossRef]
  27. Elliott, E.T. Aggregate structure and carbon, nitrogen, and phosphorus in native and cultivated soils. Soil Sci. Soc. Am. J. 1986, 50, 627–633. [Google Scholar] [CrossRef]
  28. Malhi, S.S.; Lemke, R.; Wang, Z.H.; Chhabra, B.S. Tillage, nitrogen and crop residue effects on crop yield, nutrient uptake, soil quality, and greenhouse gas emissions. Soil Tillage Res. 2006, 90, 171–183. [Google Scholar] [CrossRef]
  29. Gao, Y.; Li, Y.; Zhang, J.; Liu, W.; Dang, Z.; Cao, W.; Qiang, Q. Effects of mulch, N fertilizer, and plant density on wheat yield, wheat nitrogen uptake, and residual soil nitrate in a dryland area of China. Nutr. Cycl. Agroecosyst. 2009, 85, 109–121. [Google Scholar] [CrossRef]
Figure 1. Long-term effect of tillage and N application rates on soil total N and total S in the winter wheat–fallow system. The bars sharing the same letters within the treatments are not significantly different at the 0.05 probability level.
Agronomy 09 00178 g001
Figure 2. Long-term tillage × depth effects on total soil organic carbon and on the Mehlich III-extractable cations in the winter wheat–fallow system. DP: Disc plow; MP: Moldboard plow; SW: Sweep. The bars sharing the same letters within the treatments are not significantly different at the 0.05 probability level.
Agronomy 09 00178 g002
Figure 3. Soil depth distribution of Mehlich III-extractable phosphorus (P) and calcium (Ca) as influenced by long-term inorganic N application rates in the winter wheat–fallow system. Means sharing the same letters within each soil depths are not significantly different at the 0.05 probability level.
Agronomy 09 00178 g003
Figure 4. Effect of N application rates and Year on nitrogen accumulation in wheat grain of the winter wheat–fallow cropping system. Means sharing the same uppercase letters within the N rates and same lowercase letters within the year are not significantly different at the 0.05 probability level.
Agronomy 09 00178 g004
Table 1. Impact of 75 years of inorganic N application rate on total soil C, N, and S in the dryland winter wheat–fallow cropping system under disc tillage management compared to nearby grass pasture (GP).
NutrientsSoil Depth (cm)N Application Rate (kg ha−1) Cultivation Effect 1
04590135180GP
Carbon (g kg−1)0–1013.3 b13.5 b13.8 b14.4 b14.2 b21.8 a34% ↓
10–2011.4 ab11.4 ab10.7 ab10.6 b11.5 ab13.6 a15% ↓
20–309.1 a8.8 a9.1 a8.5 a9.1 a10.3 a12% ↓
30–607.2 ab6.6b7.9 ab6.7 b8.4 ab9.8 a14% ↓
Nitrogen (g kg−1)0–101.2 b1.2 b1.2 b1.4 b1.4 b2.1 a35% ↓
10–201.2 ab1.1 b1.1 b1.1 b1.2 ab1.4 a20% ↓
20–301.1 a1.1 a1.0 a1.0 a1.1 a1.2 a3% ↓
30–600.9 a0.9 a0.9 a0.9 a1.0 a1.1 a13%↓
Sulfur (g kg−1)0–100.4 a0.4 a0.4 a0.5 a0.4 a0.4 a7% ↑
10–200.4 a0.4 a0.4 a0.4 a0.4 a0.4 a19% ↑
20–300.5 a0.4 ab0.4 ab0.4 ab0.4 ab0.3 b41% ↑
30–600.4 a0.4 a0.4 a0.4 a0.4 a0.3 a21% ↑
Means sharing the same letters within the rows are not significantly different at the 0.05 probability level. 1 Percentage obtained from the difference in the value from grass pasture (GP) and the highest value from the treatment within each soil depths. Downward and upward arrow indicates decline and incline from the soils of GP after cultivation respectively.
Table 2. Impact of 75 years of inorganic N application rate on Mehlich III extractable P, K, Ca, and Mg in the dryland winter wheat–fallow cropping system under disc tillage management compared to nearby perennial grass pasture (GP).
NutrientsSoil Depth (cm)N Rate (kg ha−1) Cultivation Effect 1
04590135180GP
Phosphorus (mg kg−1)0–1034.9 c35.2 c35.7 c56.1 b61.1 b89.9 a32% ↓
10–2029.9 b29.8 b25.3 b37.4 b40.3 b60.6 a33% ↓
20–3031.3 b30.2 b26.6 b26.4 b26.4 b50.9 a39% ↓
30–6027.8 b25.7 b24.9 b27.9 b23.7 b46.4 a40% ↓
Potassium (g kg−1)0–100.7 a0.7 a0.7 a0.7 a0.8 a0.8 a6% ↓
10–200.6 ab0.5 b0.6 ab0.7 ab0.6 ab0.7 a3%↓
20–300.5 a0.5 a0.6 a0.6 a0.6 a0.6 a2% ↓
30–600.4 b0.4 b0.4 b0.4 b0.4 b0.6 a31% ↓
Calcium (g kg−1)0–100.3 b0.3 bc0.3 bc0.3 bc0.2 c2.4 a86% ↓
10–200.4 b0.4 bc0.3 bc0.4 bc0.3 c2.4 a83% ↓
20–300.4 b0.4 b0.4 b0.5 b0.4 b2.4 a81% ↓
30–600.5 bc0.5 bc0.4c0.5 b0.5 bc2.4 a78% ↓
Magnesium (g kg−1)0–100.1 b0.1 b0.1 b0.1 b0.1 b0.6 a77% ↓
10–200.1 b0.1 b0.1 b0.1 b0.1 b0.6 a84% ↓
20–300.1 b0.1 b0.1 b0.1 b0.1 b0.6 a89% ↓
30–600.1 b0.1 b0.1 b0.1 b0.1 b0.6 a85% ↓
Means sharing the same letter within the rows are not significantly different at the 0.05 probability level. 1 Percentage obtained from the difference in the value from grass pasture (GP) and the highest value from the treatment within each soil depths. Downward and upward arrow indicates decline and incline from the soils of GP after cultivation, respectively.

