Remotely Sensed Imagery for Early Detection of Respiratory Disease in Pigs: A Pilot Study


 , ,
, ,
Abstract
:Simple Summary
Abstract
1. Introduction
2. Materials and Methods
2.1. Animals and Sample Collection
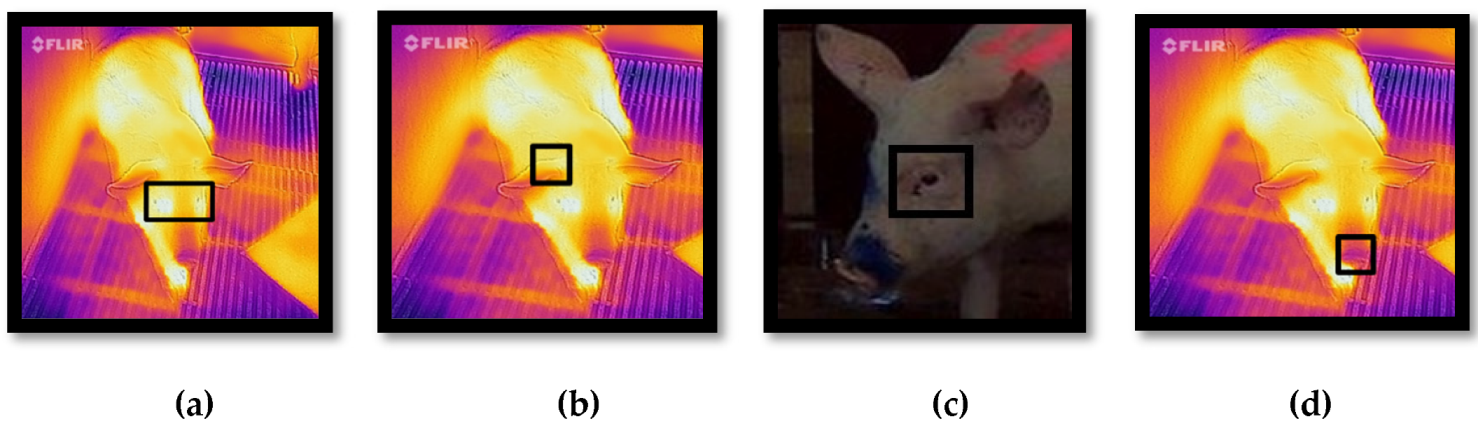
2.2. Cameras Used and Image Processing
2.3. Data Analysis
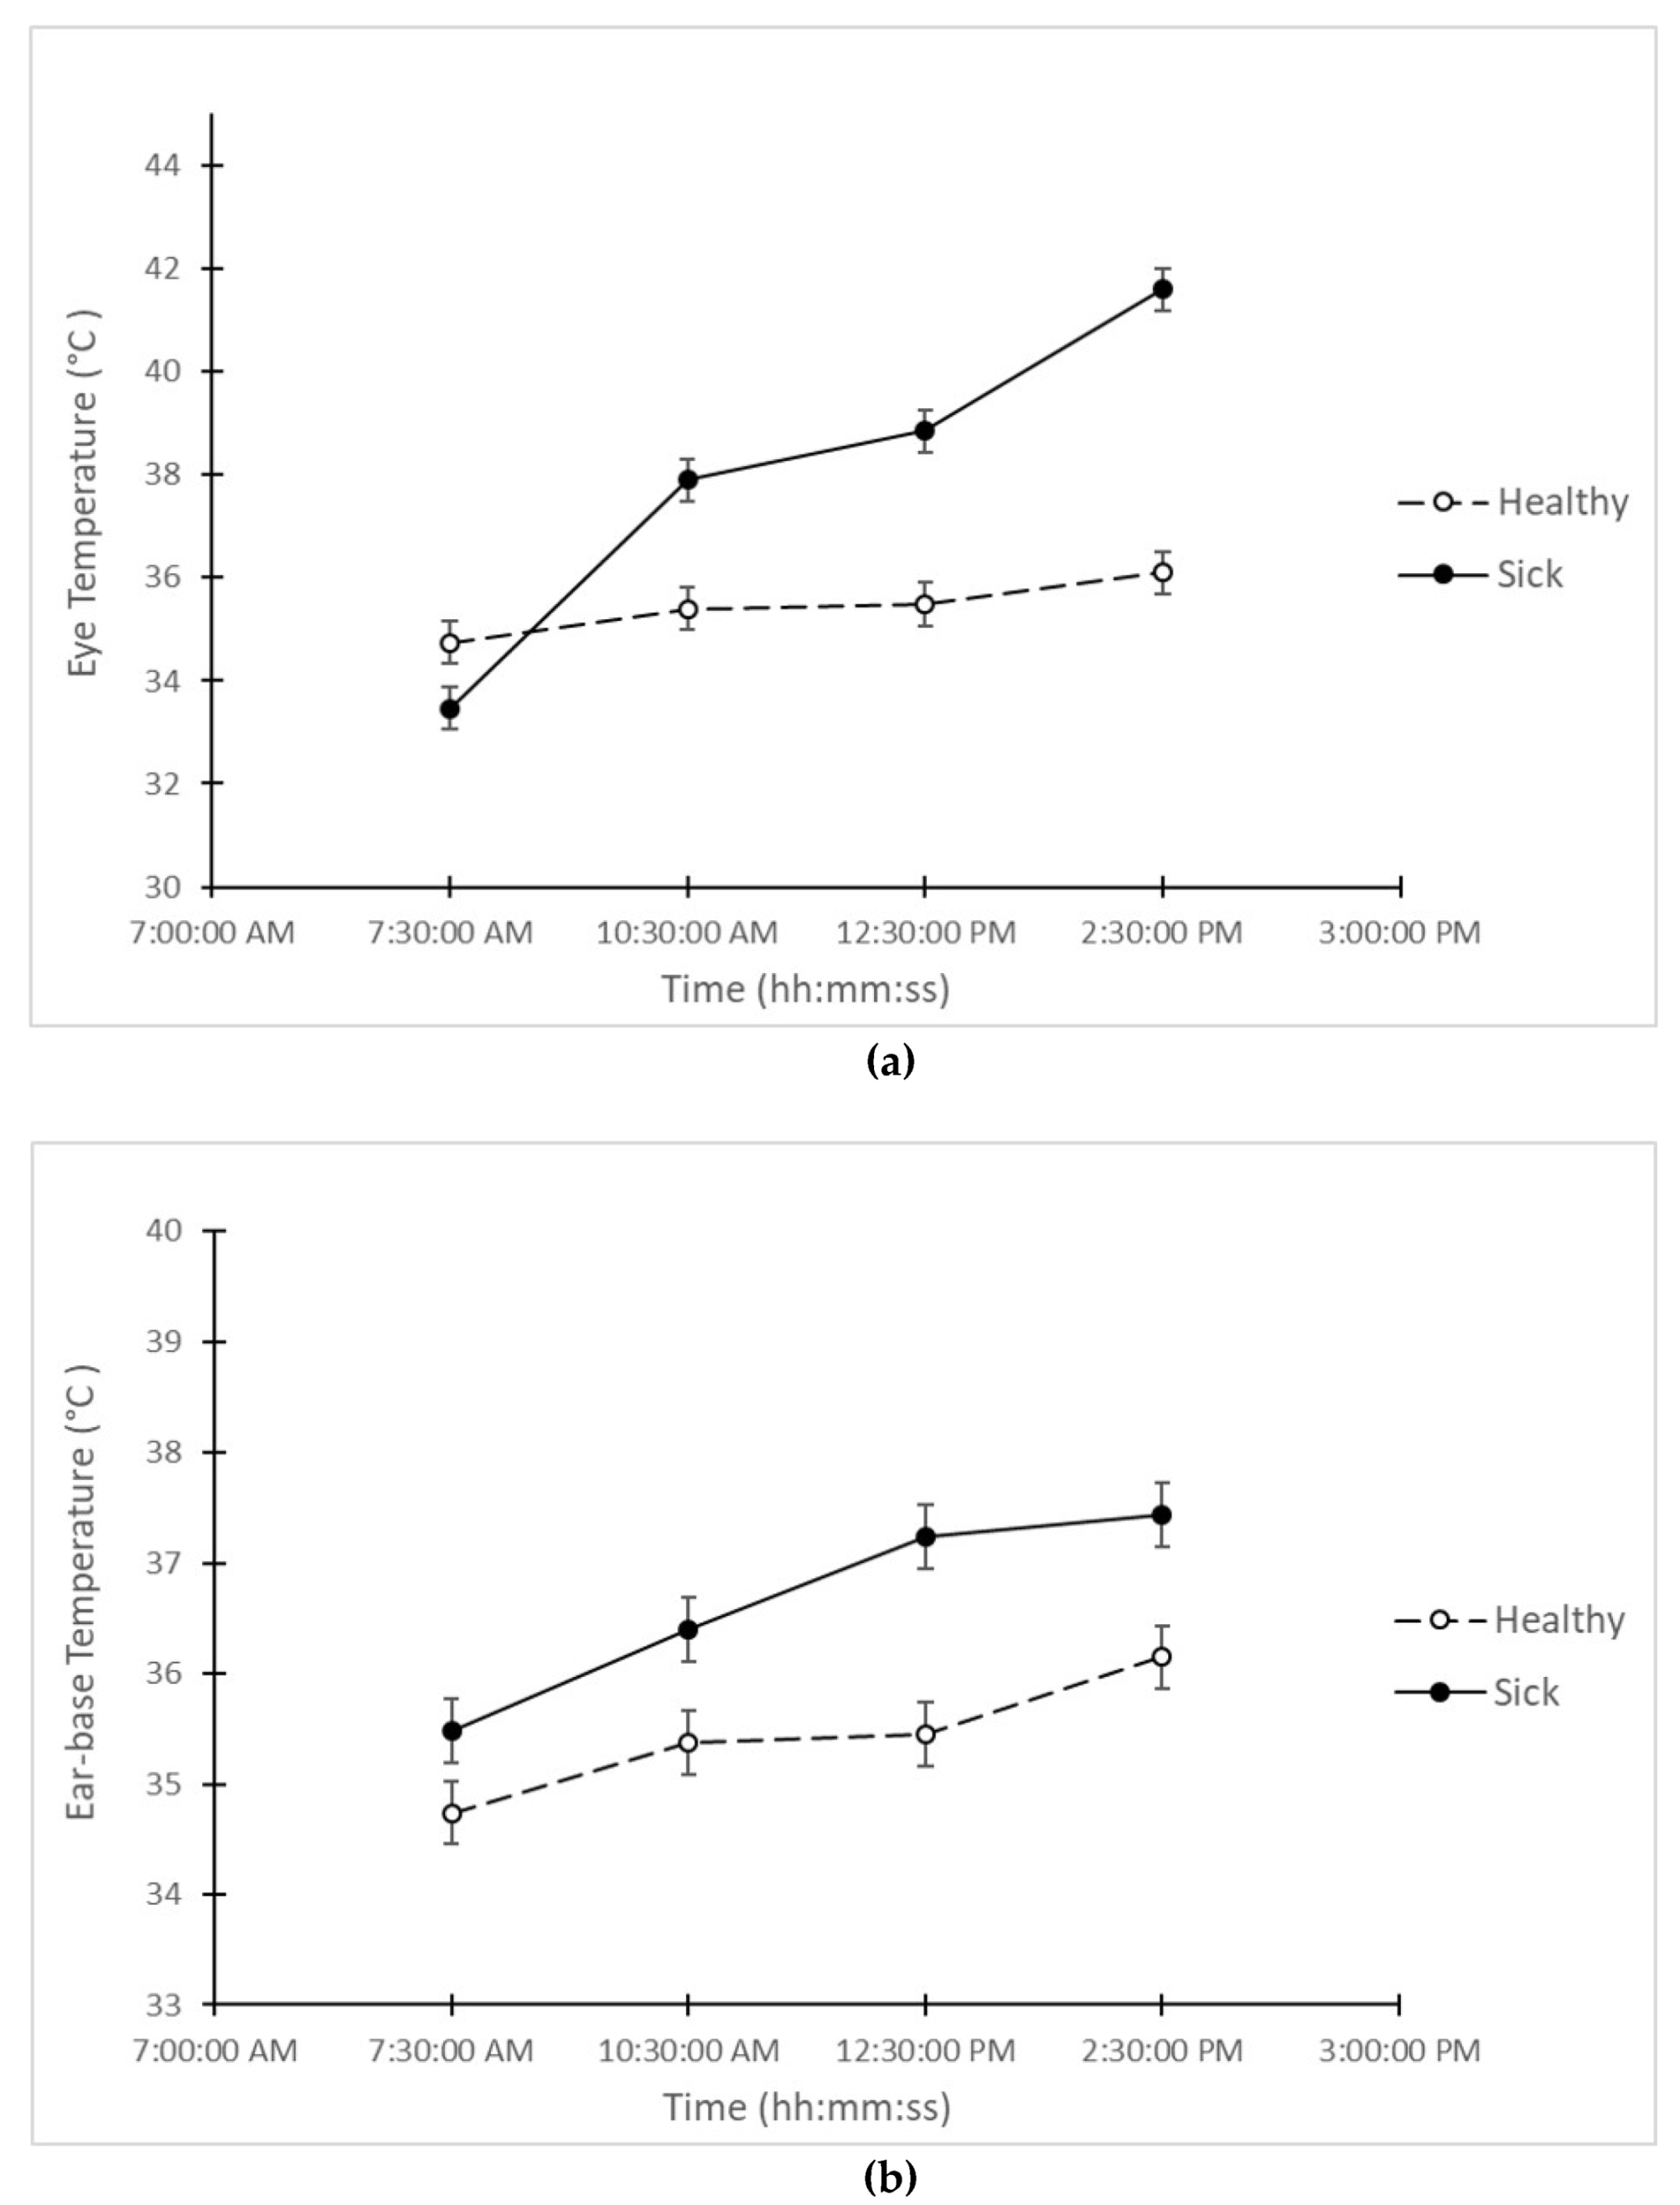
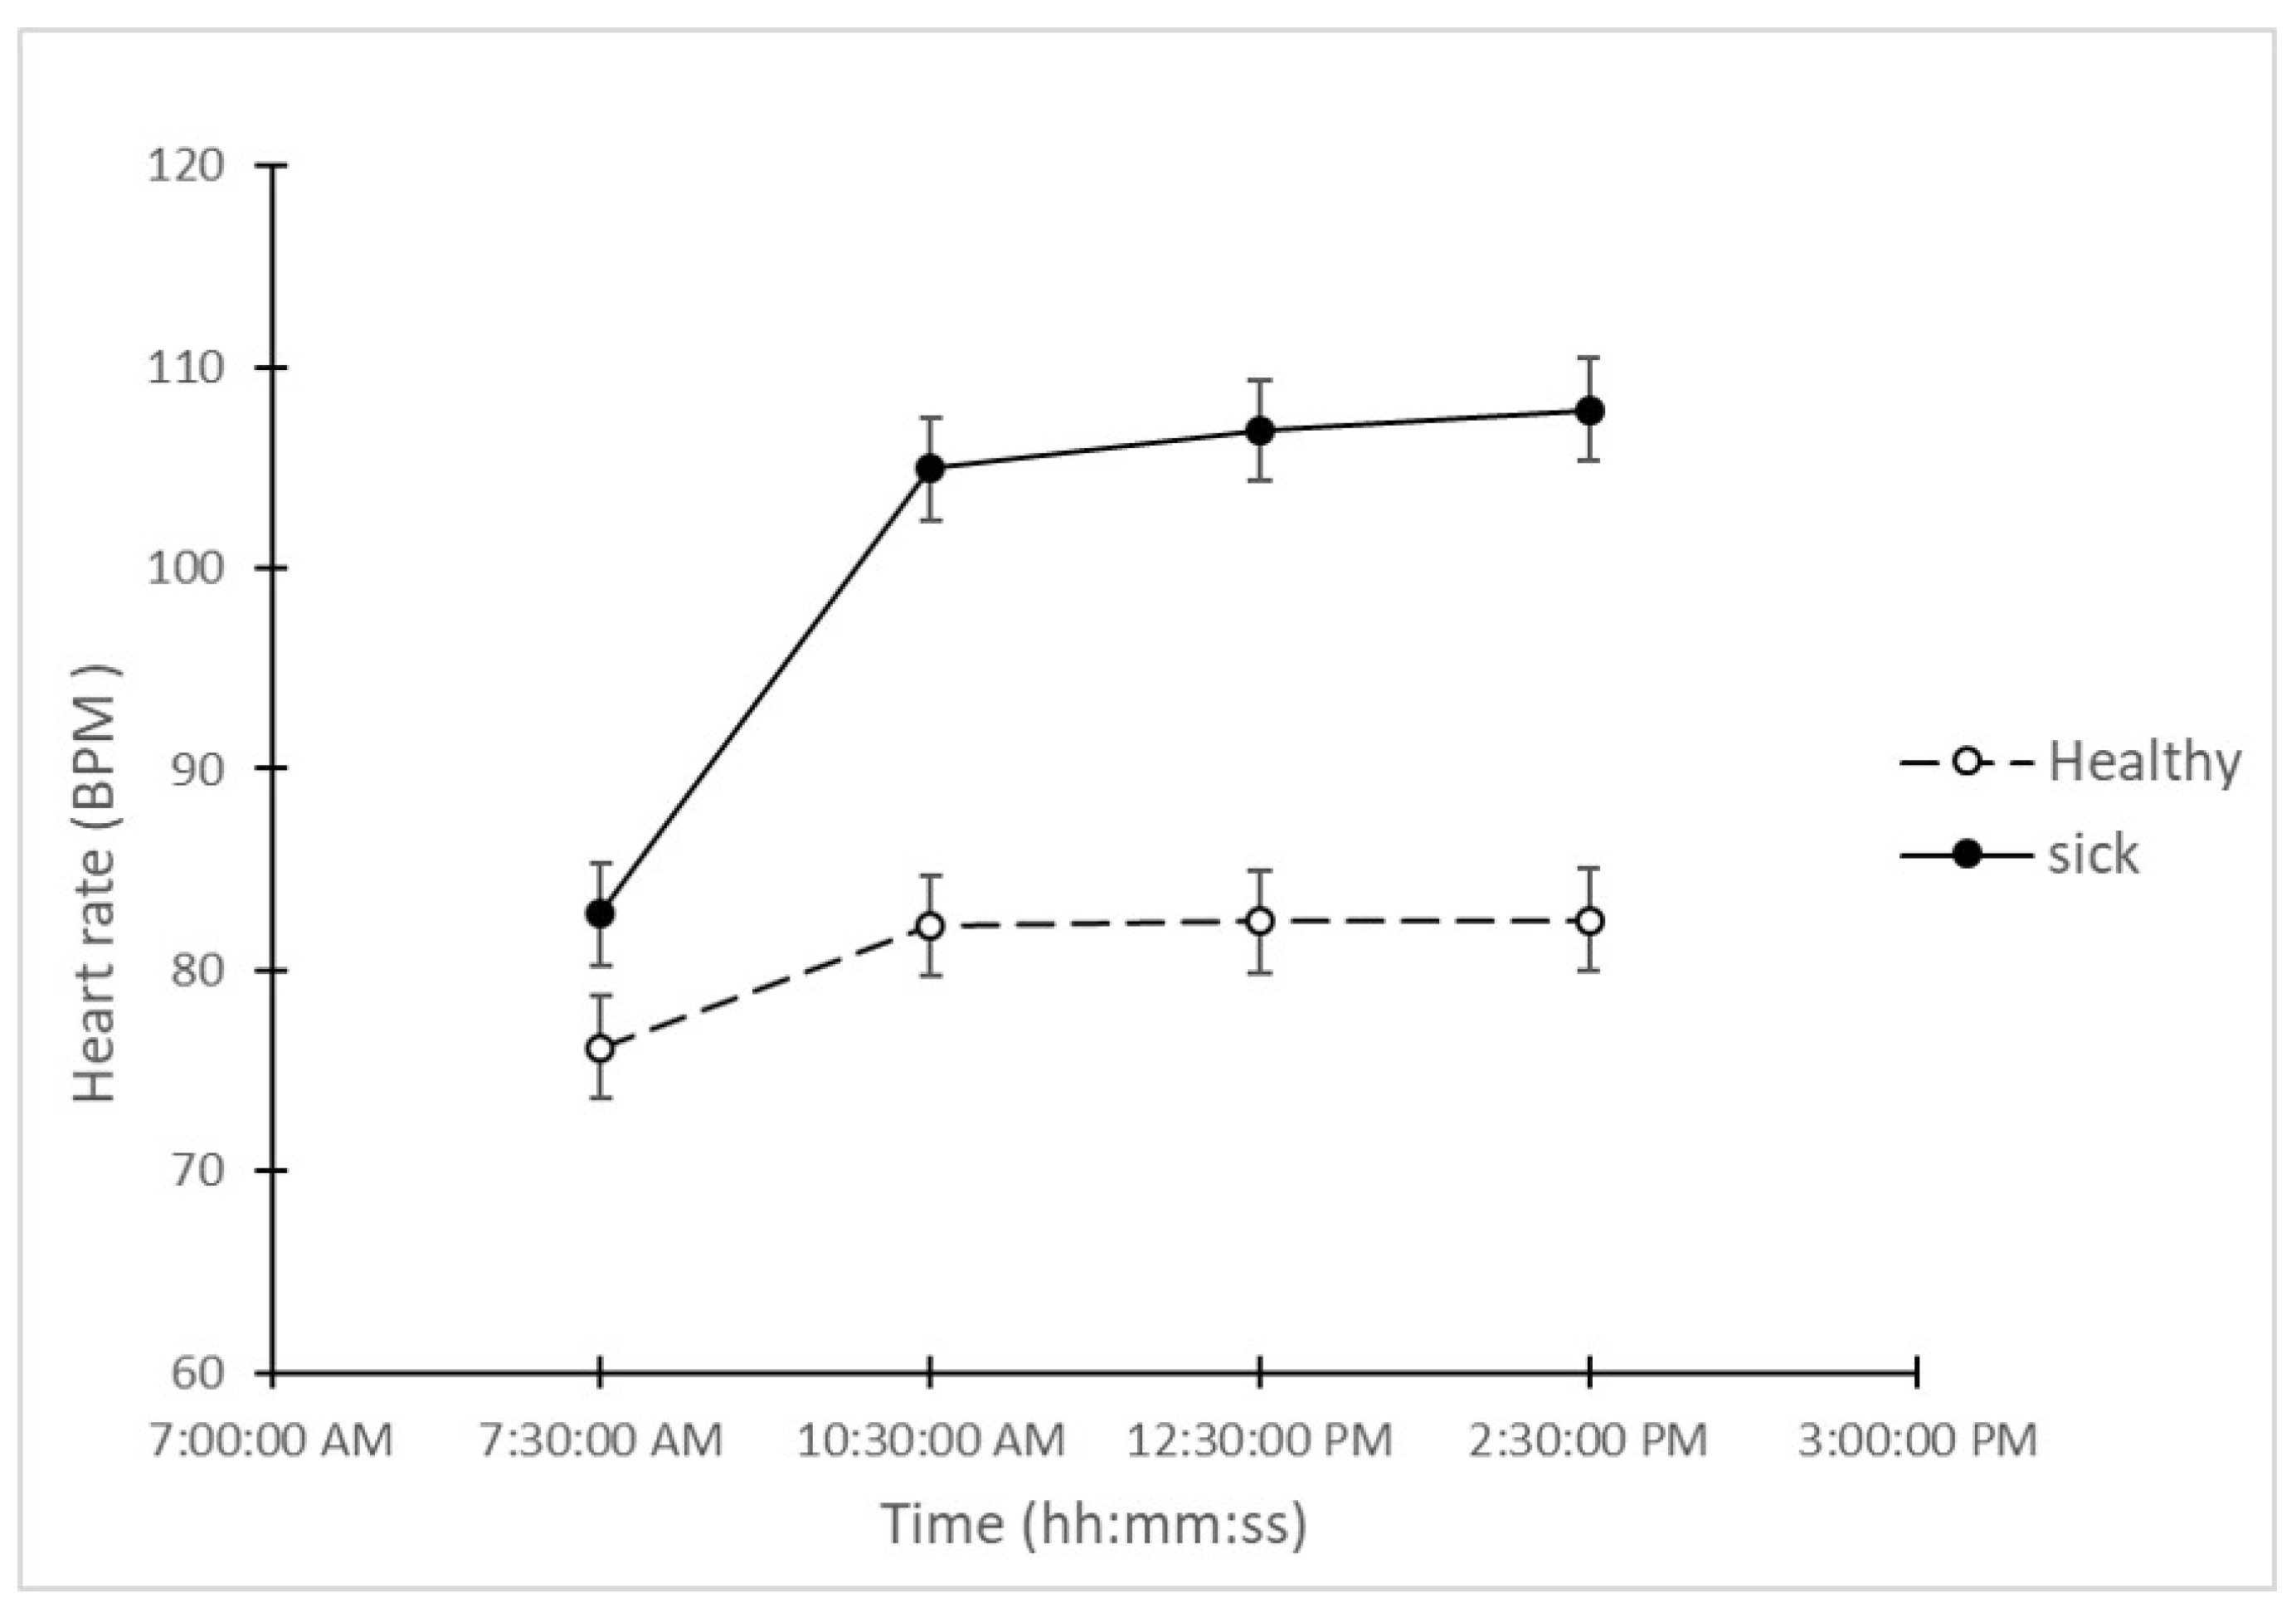
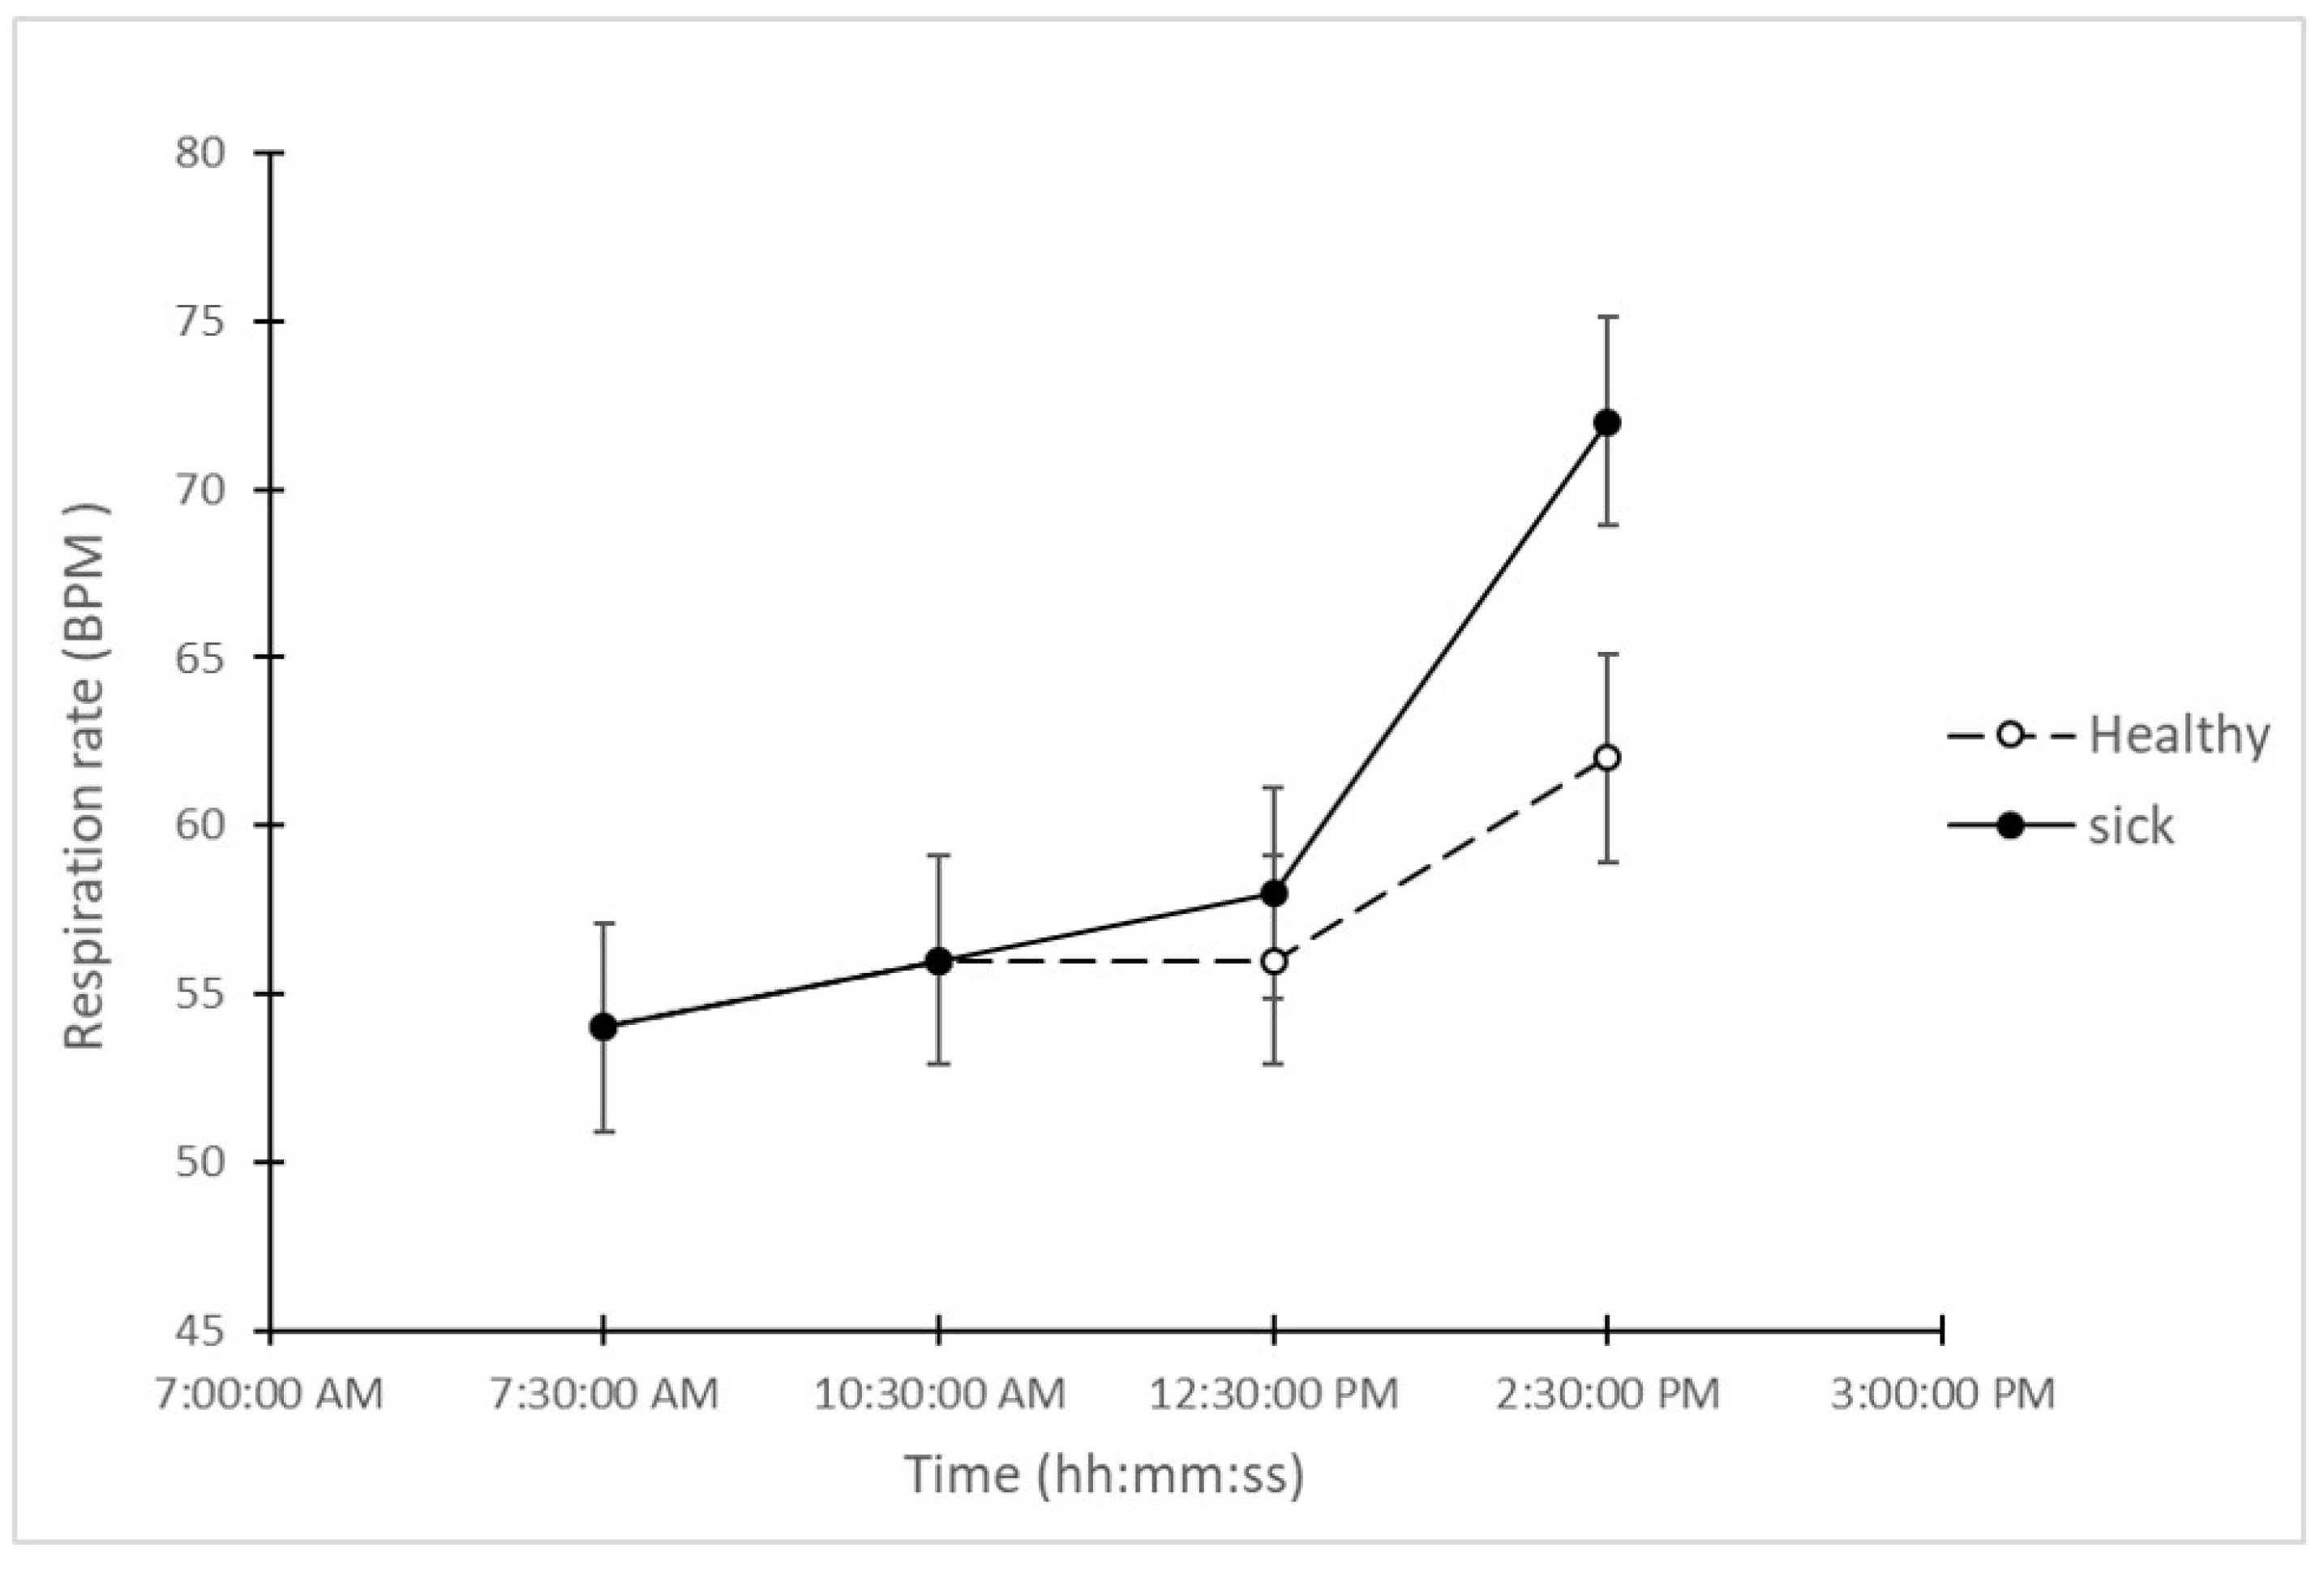
3. Results
4. Discussion
5. Conclusions and Further Research
Author Contributions
Funding
Acknowledgments
Conflicts of Interest
References
- Opriessnig, T.; Giménez-Lirola, L.G.; Halbur, P.G. Polymicrobial respiratory disease in pigs. Anim. Health Res. Rev. 2011, 12, 133–148. [Google Scholar] [CrossRef]
- Losinger, W.C. Economic impacts of reduced pork production associated with the diagnosis of actinobacillus pleuropneumoniae on grower/finisher swine operations in the united states. Prev. Vet. Med. 2005, 68, 181–193. [Google Scholar] [CrossRef]
- Kerr, C.A.; Eamens, G.; Briegel, J.; Sheehy, P.; Giles, L.; Jones, M. Effects of combined actinobacillus pleuropneumoniae challenge and change in environmental temperature on production, plasma insulin-like growth factor i (igf-i), and cortisol parameters in growing pigs. Aust. J. Agric. Res. 2003, 54, 1057–1064. [Google Scholar] [CrossRef]
- Holt, H.R.; Alarcon, P.; Velasova, M.; Pfeiffer, D.U.; Wieland, B. Bpex pig health scheme: A useful monitoring system for respiratory disease control in pig farms? BMC Vet. Res. 2011, 7, 82. [Google Scholar] [CrossRef] [PubMed] [Green Version]
- Maes, D.; Sibila, M.; Kuhnert, P.; Segalés, J.; Haesebrouck, F.; Pieters, M. Update on mycoplasma hyopneumoniae infections in pigs: Knowledge gaps for improved disease control. Transbound. Emerg. Dis. 2018, 65, 110–124. [Google Scholar] [CrossRef] [PubMed] [Green Version]
- Jordan, D.; Chin, J.C.; Fahy, V.; Barton, M.; Smith, M.; Trott, D. Antimicrobial use in the Australian pig industry: Results of a national survey. Aust. Vet. J. 2009, 87, 222–229. [Google Scholar] [CrossRef]
- Barton, M.D. Impact of antibiotic use in the swine industry. Curr. Opin. Microbiol. 2014, 19, 9–15. [Google Scholar] [CrossRef]
- Lekagul, A. Patterns of antibiotic use in global pig production: A systematic review. Vet. Anim. Sci. 2019, 7, 100058. [Google Scholar] [CrossRef]
- Gleeson, B.; Collins, A. Under what conditions is it possible to produce pigs without using antimicrobials? Anim. Prod. Sci. 2015, 55, 1424–1431. [Google Scholar] [CrossRef]
- Exadaktylos, V.; Silva, M.; Ferrari, S.; Guarino, M.; Taylor, C.J.; Aerts, J.-M.; Berckmans, D. Time-series analysis for online recognition and localization of sick pig (sus scrofa) cough sounds. J. Acoust. Soc. Am. 2008, 124, 3803–3809. [Google Scholar] [CrossRef]
- Ferrari, S.; Silva, M.; Exadaktylos, V.; Berckmans, D.; Guarino, M. The sound makes the difference: The utility of real time sound analysis for health monitoring in pigs. In Livestock Housing: Modern Management to Ensure Optimal Health and Welfare of Farm Animals; Wageningen Academic Publishers: Wageningen, The Netherlands, 2013; pp. 2–43. [Google Scholar]
- Silva, M.; Ferrari, S.; Costa, A.; Aerts, J.-M.; Guarino, M.; Berckmans, D. Cough localization for the detection of respiratory diseases in pig houses. Comput. Electron. Agric. 2008, 64, 286–292. [Google Scholar] [CrossRef]
- Schaefer, A.L.; Cook, N.; Tessaro, S.V.; Deregt, D.; Desroches, G.; Dubeski, P.L.; Tong, A.K.W.; Godson, D.L. Early Detection and Prediction of Infection Using Infrared Thermography. Can. J. Anim. Sci. 2004, 84, 73–80. [Google Scholar] [CrossRef]
- Soerensen, D.D.; Pedersen, L.J. Infrared skin temperature measurements for monitoring health in pigs: A review. Acta Vet. Scand. 2015, 57, 5. [Google Scholar] [CrossRef] [PubMed] [Green Version]
- Stewart, M.; Wilson, M.; Schaefer, A.; Huddart, F.; Sutherland, M. The use of infrared thermography and accelerometers for remote monitoring of dairy cow health and welfare. J. Dairy Sci. 2017, 100, 3893–3901. [Google Scholar] [CrossRef]
- Guo, Y.-Z.; Zhu, W.-X.; Jiao, P.-P.; Ma, C.-H.; Yang, J.-J. Multi-object extraction from top view group-housed pig images based on adaptive partitioning and multilevel thresholding segmentation. Biosyst. Eng. 2015, 135, 54–60. [Google Scholar] [CrossRef]
- Wang, Y.; Yang, W.; Winter, P.; Walker, L. Walk-through weighing of pigs using machine vision and an artificial neural network. Biosyst. Eng. 2008, 100, 117–125. [Google Scholar] [CrossRef]
- Viejo, C.G.; Fuentes, S.; Torrico, D.D.; Dunshea, F.R. Non-contact heart rate and blood pressure estimations from video analysis and machine learning modelling applied to food sensory responses: A case study for chocolate. Sensors 2018, 18, 1802. [Google Scholar] [CrossRef] [Green Version]
- Zhao, F.; Li, M.; Qian, Y.; Tsien, J.Z. Remote measurements of heart and respiration rates for telemedicine. PLoS ONE 2013, 8, e71384. [Google Scholar] [CrossRef] [Green Version]
- Poh, M.-Z.; McDuff, D.J.; Picard, R.W. Non-contact, automated cardiac pulse measurements using video imaging and blind source separation. Opt. Express 2010, 18, 10762–10774. [Google Scholar] [CrossRef]
- Weixing, Z.; Zhilei, W. Detection of Porcine Respiration Based on Machine Vision. In Proceedings of the Knowledge Acquisition and Modeling (KAM) 2010 3rd International Symposium, Wuhan, China, 20–21 October 2010; pp. 398–401. [Google Scholar]
- Act, A.W. Prevention of cruelty to animals act 1979 (nsw). In Prevention of Cruelty to Animals Act 1985; NSW legislation: Sydney, Australia, 1992. [Google Scholar]
- Australia, C.o. Australian Code for the Care and Use of Animals for Scientific Purposes; NHMRC: Canberra, Australia, 2013. [Google Scholar]
- Jobert, J.-L.; Savoye, C.; Cariolet, R.; Kobisch, M.; Madec, F. Experimental aerosol transmission of actinobacillus pleuropneumoniae to pigs. Can. J. Vet. Res. 2000, 64, 21. [Google Scholar]
- Jorquera-Chavez, M.; Fuentes, S.; Dunshea, F.R.; Warner, R.D.; Poblete, T.; Jongman, E.C. Modelling and validation of computer vision techniques to assess heart rate, eye temperature, ear-base temperature and respiration rate in cattle. Animals 2019, 9, 1089. [Google Scholar] [CrossRef] [PubMed] [Green Version]
- Rashid, T.; Khawaja, H.A.; Edvardsen, K. Measuring thickness of marine ice using IR thermography. Cold. Reg. Sci. Technol. 2019, 158, 221–229. [Google Scholar] [CrossRef]
- Schmidt, M.; Lahrmann, K.-H.; Ammon, C.; Berg, W.; Schön, P.; Hoffmann, G. Assessment of body temperature in sows by two infrared thermography methods at various body surface locations. J. Swine Health Prod. 2013, 21, 203–209. [Google Scholar]
- Sikdar, A.; Behera, S.K.; Dogra, D.P. Computer-vision-guided human pulse rate estimation: A review. IEEE RBME 2016, 9, 91–105. [Google Scholar] [CrossRef] [PubMed]
- Aarestrup, F.M.; Duran, C.O.; Burch, D.G. Antimicrobial resistance in swine production. Anim. Health Res. Rev. 2008, 9, 135–148. [Google Scholar] [CrossRef]
- Abraham, S.; O’Dea, M.; Page, S.; Trott, D. Current and future antimicrobial resistance issues for the australian pig industry. Anim. Prod. Sci. 2017, 57, 2398–2407. [Google Scholar] [CrossRef]
- Tabuaciri, P.; Bunter, K.L.; Graser, H.-U. Thermal Imaging as a Potential Tool for Identifying Piglets at Risk; University of New England: Armidale, Australia, 2012; pp. 23–30. [Google Scholar]
- Gloster, J.; Ebert, K.; Gubbins, S.; Bashiruddin, J.; Paton, D.J. Normal variation in thermal radiated temperature in cattle: Implications for foot-and-mouth disease detection. BMC Vet. Res. 2011, 7, 73. [Google Scholar] [CrossRef] [Green Version]
- Jackson, P.; Cockcroft, P. Clinical Examination of Farm Animals; John Wiley & Sons: New York, NY, USA, 2008. [Google Scholar]
- Reyes-Lagos, J.J.; Hadamitzky, M.; Peña-Castillo, M.Á.; Echeverría, J.C.; Bösche, K.; Lückemann, L.; Schedlowski, M.; Pacheco-López, G. Exogenous oxytocin reduces signs of sickness behavior and modifies heart rate fluctuations of endotoxemic rats. Physiol. Behav. 2016, 165, 223–230. [Google Scholar] [CrossRef]
- Weingartl, H.M.; Berhane, Y.; Czub, M. Animal models of henipavirus infection: A review. Vet. J. 2009, 181, 211–220. [Google Scholar] [CrossRef]
- Geisbert, T.W.; Feldmann, H.; Broder, C.C. Animal challenge models of henipavirus infection and pathogenesis. In Henipavirus; Springer: New York, NY, USA, 2012; pp. 153–177. [Google Scholar]
- Reinhold, P.; Ostermann, C.; Liebler-Tenorio, E.; Berndt, A.; Vogel, A.; Lambertz, J.; Rothe, M.; Rüttger, A.; Schubert, E.; Sachse, K. A bovine model of respiratory chlamydia psittaci infection: Challenge dose titration. PLoS ONE 2012, 7, e30125. [Google Scholar] [CrossRef] [Green Version]
- Van Reeth, K.; Gregory, V.; Hay, A.; Pensaert, M. Protection against a european h1n2 swine influenza virus in pigs previously infected with h1n1 and/or h3n2 subtypes. Vaccine 2003, 21, 1375–1381. [Google Scholar] [CrossRef]


| Symptoms | Observations | Score Assigned |
|---|---|---|
| Nasal discharge | None | 0 |
| Clear discharge | 1 | |
| Clear discharge for several observations | 2 | |
| Bloody frothy discharge from nose and mouth | 3 | |
| Coughing | No coughing | 0 |
| Coughs once | 1 | |
| Coughing episodes of 1–3 short coughs at a time | 2 | |
| Short coughs with signs of breathing difficulties | 3 | |
| Laboured breathing | Normal (8–16 breath/minute) | 0 |
| Breathing increased (>16 breaths/min) | 1 | |
| Abdominal breathing | 2 | |
| Laboured breathing, breathing through mouth, head extended | 3 | |
| Reddened conjuctiva—Cyanosis | Normal | 0 |
| Reddened conjunctiva, pale appearance | 1 | |
| Slightly red about the nose and lips | 2 | |
| Blueness about tongue, lips, mucous membrane of the eyes, ears, legs and reddened skin | 3 | |
| Lethargy | Alert and active | 0 |
| Depressed, lack of response to verbal stimuli, disinclination to move about, ears laid back | 1 | |
| Recumbent position, reluctance to get up | 2 | |
| Will not get up even if prompted, dullness of eyes | 3 | |
| Anorexia | Eats | 0 |
| Does not eat | 1 | |
| Does not eat and evident empty gastrointestinal tract (tucked in), not observed drinking | 2 | |
| Roughness in coat, tucked in and extremely dehydrated | 3 | |
| Fever (rectal temperature) | No fever (39.3 °C) | 0 |
| Temp rise (39.4–39.9 °C) | 1 | |
| Temperature increase at second observation | 2 | |
| Increase of temp 40–42 °C | 3 |
© 2020 by the authors. Licensee MDPI, Basel, Switzerland. This article is an open access article distributed under the terms and conditions of the Creative Commons Attribution (CC BY) license (http://creativecommons.org/licenses/by/4.0/).
Share and Cite
Jorquera-Chavez, M.; Fuentes, S.; Dunshea, F.R.; Warner, R.D.; Poblete, T.; Morrison, R.S.; Jongman, E.C. Remotely Sensed Imagery for Early Detection of Respiratory Disease in Pigs: A Pilot Study. Animals 2020, 10, 451. https://doi.org/10.3390/ani10030451
Jorquera-Chavez M, Fuentes S, Dunshea FR, Warner RD, Poblete T, Morrison RS, Jongman EC. Remotely Sensed Imagery for Early Detection of Respiratory Disease in Pigs: A Pilot Study. Animals. 2020; 10(3):451. https://doi.org/10.3390/ani10030451
Chicago/Turabian StyleJorquera-Chavez, Maria, Sigfredo Fuentes, Frank R. Dunshea, Robyn D. Warner, Tomas Poblete, Rebecca S. Morrison, and Ellen C. Jongman. 2020. "Remotely Sensed Imagery for Early Detection of Respiratory Disease in Pigs: A Pilot Study" Animals 10, no. 3: 451. https://doi.org/10.3390/ani10030451