Article

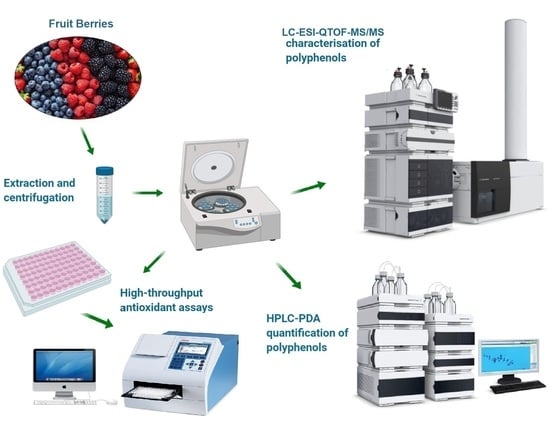
Screening of Phenolic Compounds in Australian Grown Berries by LC-ESI-QTOF-MS/MS and Determination of Their Antioxidant Potential

1
Faculty of Veterinary and Agricultural Sciences, School of Agriculture and Food, The University of Melbourne, Parkville, VIC 3010, Australia
2
Commonwealth Scientific and Industrial Research Organisation (CSIRO), Agriculture and Food, 671 Sneydes Road, Private Bag 16, Werribee, VIC 3030, Australia
3
Centre for Chemistry and Biotechnology, School of Life and Environmental Sciences, Deakin University, Waurn Ponds, VIC 3217, Australia
4
Faculty of Biological Sciences, The University of Leeds, Leeds LS2 9JT, UK
*
Author to whom correspondence should be addressed.
Antioxidants 2021, 10(1), 26; https://doi.org/10.3390/antiox10010026
Submission received: 3 December 2020 / Revised: 22 December 2020 / Accepted: 24 December 2020 / Published: 29 December 2020
(This article belongs to the Special Issue Antioxidant Activity of “Polyphenolic Food” and Human Health)

Abstract

:
Berries are grown worldwide with the most consumed berries being blackberries (Rubus spp.), blueberries (Vaccinium corymbosum), red raspberries (Rubus idaeus) and strawberries (Fragaria spp.). Berries are either consumed fresh, frozen, or processed into wines, juices, and jams. In recent times, researchers have focused their attention on berries due to their abundance in phenolic compounds. The current study aimed to evaluate the phenolic content and their antioxidant potential followed by characterization and quantification using LC-ESI-QTOF-MS/MS and HPLC-PDA. Blueberries were highest in TPC (2.93 ± 0.07 mg GAE/gf.w.) and TFC (70.31 ± 1.21 µg QE/gf.w.), whereas the blackberries had the highest content in TTC (11.32 ± 0.13 mg CE/gf.w.). Blueberries had the highest radical scavenging capacities for the DPPH (1.69 ± 0.09 mg AAE/gf.w.), FRAP (367.43 ± 3.09 µg AAE/gf.w.), TAC (1.47 ± 0.20 mg AAE/gf.w.) and ABTS was highest in strawberries (3.67 ± 0.14 mg AAE/gf.w.). LC-ESI-QTOF-MS/MS study identified a total of 65 compounds including 42 compounds in strawberries, 30 compounds in raspberries, 28 compounds in blueberries and 21 compounds in blackberries. The HPLC-PDA quantification observed phenolic acid (p-hydroxybenzoic) and flavonoid (quercetin-3-rhamnoside) higher in blueberries compared to other berries. Our study showed the presence of phenolic acids and provides information to be utilized as an ingredient in food, pharmaceutical and nutraceutical industries.

Graphical Abstract

1. Introduction

Berries are widely grown and consumed in Europe, America and Australia [1]. They are either consumed fresh, frozen or processed into wines, juices and jams [2]. In 2018, 116, 585 tonnes of fresh berries were produced in Australia and worth $911.4 million [3]. Blackberry (Rubus spp.), blueberry (Vaccinium corymbosum), red raspberry (Rubus idaeus) and strawberry (Fragaria spp.) are most commonly eaten berries [4]. In recent times, berry fruits have garnered the interest of the researchers around the world due to their high content and wide range of positive health promoting phenolic compounds [5].
Phenolic compounds are often known as phytonutrients, secondary metabolites or dietary bioactive compounds [6]. They have one or more aromatic ring and at least two hydroxyl groups [7]. Classification of phenolic compounds are based on their source of origin, biological function and chemical structure [8]. Phenolic compounds are divided into classes such as flavonoids, tannin, stilbenes, lignans [9], coumarins [10] and phenolic acids [6]. Majority of phenolic compounds are synthesized from the phenylpropanoid pathway [8].
The most abundant phenolic compounds present in berries are anthocyanidins, proanthocyanidins, kaempferol, quercetin, myricetin, p-Coumaric acid, caffeic acid, ferulic acid, p-hydroxybenzoic acid, gallic acid, ellagic acid, ellagitannin, flavonols, phenolic acids, and flavan-3-ols [11]. Anthocyanidins considerably contribute colour to berries such as dark red, blue green or purple, which attracts the consumers [2]. Phenolic compounds including flavonoid and phenolic acid concentrations differ due to the climate, varieties and the harvest time [2,4].
Phenolic compounds present in different berries can prevent excessive free radicals and have positive health benefits such as anti-carcinogenic, anti-inflammatory activities [11], anti-bacterial, anti-diabetics [1], prevent neurodegenerative diseases such as Alzheimer’s disease, Parkinson’s disease, prion disease, and motor neurone disease [12,13], decrease the level of blood pressure, improvement of plasma lipid profile and endothelial function [6]. In blueberries, chlorogenic acid plays a major role in antioxidant activity. Raspberries and blackberries are rich in cyanidin glycosides having high antioxidant activity whereas, strawberries have higher content of pelargonidin-3-glucoside, which are relatively weak antioxidants [5].
Phenolic compounds can be extracted using various organic solvents and evaluated using various in vitro spectrophotometric-based assays [14]. Different solvents can be used in extraction of phenolic compounds such as water, ethanol, methanol, acetone and hexane or their combinations [15]. The phenolic content can be assessed using various assays such as total phenolic content (TPC), total flavonoid content (TFC) and total tannin content (TTC). Different types of in vitro methods such as 2,2′-diphenyl-1-picrylhydrazyl (DPPH) antioxidant assay, the 2,2′-azino-bis-3-ethylbenzothiazoline-6-sulfonic acid (ABTS) and the ferric reducing-antioxidant power (FRAP) assay can be used to assess the antioxidant activity [16].
Identification, quantification and characterisation of phenolics extracted from berries can be achieved by different developed analytical methodologies [14]. Liquid chromatography integrated with electrospray-ionization, triple quadrupole and two mass spectrometry (LC-ESI-QTOF-MS/MS) is a highly sensitive tool used to identify various phenolic compounds, while high-pressure liquid chromatography (HPLC) combined with photodiode array detector (PDA) is mostly used for quantification purposes of bioactive compounds [17]. Previously, HPLC and LC-MS analysis of strawberries and blueberries showed the presence of some phenolic compounds including p-coumaric acid derivatives, pelargonidin, quercetin, myricetin, kaempferol and cyanidin [18] whereas, raspberries and blackberries are rich sources of ellagic acid [19].
While various studies have characterised the phenolic compounds in the berries, there are limited studies available on characterisation of phenolic compounds from Australian grown berries. For example, genetic diversity and the environmental factors may have induced some diversity in phenolic compounds of native Australian grown berries. Therefore, in the current study, we extracted phenolic compounds from Australian grown blackberries, blueberries, raspberries, and strawberries, and analysed for their antioxidant potential. Further, the identification, characterization and quantification of phenolic compounds were obtained through LC-ESI-QTOF-MS/MS and HPLC photodiode array (PDA). This outcome of the current study will provide sufficient information on the phenolic content and antioxidant properties of the native Australian grown berries to promote their usage in the food and pharmaceutical industries.

2. Materials and Methods

2.1. Chemicals and Reagents

The chemicals used in the extraction and characterisation of phenolic compounds were of analytical grade. Standards for antioxidant assays including gallic acid, quercetin, catechin and L-ascorbic acid were purchased from Sigma-Aldrich (St. Louis, MO, USA). Chemicals for antioxidant assays including Folin-Ciocalteu’s phenol reagent, aluminium chloride hexahydrate, vanillin, 2,2′-diphenyl-1-picrylhydrazl (DPPH), ferric (III) chloride anhydrous, 2,4,6-tripyridyl-s-triazine (TPTZ), potassium persulfate, 2-2′-azino-bis(3-ethylbenz-thiazoline-6-sulphonate) (ABTS), 3-ethylbenzothiazoline-6-sulphonic acid were purchased from Sigma-Aldrich (St. Louis, MO, USA). Anhydrous sodium carbonate and sodium acetate (hydrated) were purchased from Chem-Supply Pvt Ltd. and Ajax Finecham, respectively (VIC, Melbourne, Australia). Anhydrous sodium acetate, hydrochloric acid, ethanol, glacial acetic acid, and acetic acid were purchased from Thermo Fisher Scientific Inc (Waltham, MA, USA). 98% sulphuric acid was procured from RCI Labscan Ltd. (Bangkok, Thailand). HPLC grade methanol, acetic acid and acetonitrile were purchased from Fisher chemical company (San Jose, CA, USA). The standards used in HPLC including protocatechuic acid, chlorogenic acid, quercetin, quercetin-3-O-glucoside, quercetin-3-galactoside, quercetin-3-glucuronide, quercetin-3-rhamnoside, kaempferol, kaempferol-3-O-glucoside, caffeic acid, p-hydroxybenzoic acid, syringic acid, sinapic acid, gallic acid, caftaric acid, catechin, epicatechin, epicatechin gallate, ferulic acid and p-coumaric acid were purchased from Sigma Aldrich (St. Louis, MO, USA). Milli-Q water (deionized), by Millipore Milli-Q Gradient Water Purification System (Darmstadt, Germany).

2.2. Sample Preparation

Fruit berries (blueberries, blackberries, strawberries, and raspberries) required for this study were produced in different regions of Victoria. Freshly ripened berries were harvested, distributed and marketed within (1–3 days) and procured from a local market in Melbourne, Victoria, Australia. The berries were washed and blended into a slurry by using a 1.5 L electric blender (Russell Hobbs Classic, model DZ-1613, Melbourne, VIC, Australia). The slurry samples were stored in −20 °C for further analysis.

2.3. Extraction of Phenolic Compounds

The phenolic compounds present in the slurry 5 g were extracted with 20 mL 70% ethanol by modifying our previously published protocol of Gu, et al. [20]. Extracts of the berries were then prepared by homogenising the slurry samples in Ultra-Turrax T25 Homogenizer (IKA, Staufen, Germany) for 30 s at 10,000 rpm. Homogenised samples were incubated in a shaking incubator (ZWYR-240 incubator shaker, Labwit, Ashwood, VIC, Australia) for 12 h at 4 °C for 120 rpm. Subsequently after incubation, the samples were centrifuged by Hettich Refrigerated Centrifuge (ROTINA380R, Tuttlingen, Baden-Württemberg, Germany) at 5000 rpm for 15 min at 4 °C. For LC-ESI-QTOF-MS/MS and HPLC-PDA, the extract was filtered using a syringe filter (Thermo Fisher Scientific Inc., Waltham, MA, USA) of size 0.45 µm.

2.4. Estimation of Phenolic Compounds and Antioxidant Assay

For phenolic estimation (TPC, TFC and TTC) and for total antioxidant capacity determination (DPPH, FRAP, ABTS and TAC) the analysis were performed according to our previously published methods in Tang, et al. [21]. Absorption data was attained using a Multiskan® Go microplate photometer (Thermo Fisher Scientific Inc., Waltham, MA, USA).

2.4.1. Determination of Total Phenolic Content (TPC)

The TPC content in the berries was quantified by using Folin-Ciocalteu’s method as described in Samsonowicz, et al. [22] with some modifications. 25 µL extract, 25 µL Folin-Ciocalteu’s reagent solution (1:3 diluted with water) and 200 µL water were added into the 96-well plate (Costar, Corning, NY, USA). The reaction mixture was then incubated for 5 min in the dark at room temperature (~25 °C). To the reaction mixture, 25 µL of 10% (w:w) sodium carbonate was added and incubated for 60 min at 25 °C. Absorbance was measured at 765 nm using spectrophotometer (Thermo Fisher Scientific, Waltham, MA, USA). Gallic acid standard with concentration ranging from 0 to 200 µg/mL was used to prepare the standard curve and the TPC content was expressed in mg of gallic acid equivalents per gram on the basis of fresh weight (f.w.) (mg GAE/g of sample).

2.4.2. Determination of Total Flavonoid Content (TFC)

The TFC was quantified by using aluminium chloride method described in Stavrou, et al. [23] with few modifications. 80 µL extract, 80 µL of 2% aluminium chloride and 120 µl of 50 g/L sodium acetate solution were added into the 96-well plate. The reaction mixture was incubated in dark room for 2.5 h. Absorbance was measured at 440 nm. Quercetin calibration curve with concentration (0–50 µg/mL) was used to determine TFC and expressed in mg quercetin equivalents per gram of sample (mg QE/gf.w.).

2.4.3. Determination of Total Tannin Content (TTC)

The vanillin sulphuric acid method was used to determine the total tannin content present in the extract with some modifications according to Haile and Kang [24]. 25 µL of 32% sulphuric acid, 25 µL of sample extract and 150 µL of 4% vanillin solution were added to 96-well plate and incubated for 15 min in the dark room. The absorbance was measured at 500 nm. Catechin calibration curve with concentration from 0 to 1 mg/mL used for estimation of TTC and expressed in mg catechin equivalents (CE) per g of sample weight (mg CE/gf.w.).

2.4.4. 2,2′-Diphenyl-1-picrylhydrazyl (DPPH) Assay

The DPPH method was used for estimation of free-radical scavenging activity of the berries by modifying the method of Ouyang, et al. [25]. DPPH (4 mg) was dissolved in 100 mL of analytical grade methanol for DPPH radical solution. 40 µL of extract and 260 µL of DPPH solution added to 96-well plate and were vigorously shaken in the dark for 30 min at 25° C. The absorbance was measured at 517 nm. Ascorbic acid standard curve with concentration ranging from 0 to 50 µg/mL was used to determine the DPPH radical scavenging activity and expressed in mg of ascorbic acid equivalent per gram (mg AAE/gf.w.) of sample.

2.4.5. Ferric Reducing Antioxidant Power (FRAP) Assay

In the FRAP assay, at low pH oxidised Fe3+ colourless is reduced into a blue colour Fe2+ tripyridyltriazine (TPTZ) by the action of electron-donating antioxidants [26]. This assay has been used to estimate the antioxidant capacity in berries with some modification of Sogi, et al. [27]. At the ratio 10:1:1, 300 mM sodium acetate solution, 10 mM TPTZ solution and 20 mM Fe [III] solution was mixed to prepare the FRAP solution. 20 µL of the extract and 280 µL prepared dye solution was added to a 96-well plate and incubated for 10 min at 37 °C. The absorbance was measured at 593 nm. Ascorbic acid standard curve with concentration ranging from 0–150 µg/mL was used to determine the FRAP values and expressed in mg of ascorbic acid equivalent per gram of sample (mg AAE/gf.w.).

2.4.6. 2,2′-Azino-bis-3-ethylbenzothiazoline-6-sulfonic acid (ABTS) Assay

ABTS radical cation decolourization assay was used to determine the free radical scavenging activity of samples with few modifications as described in Rajurkar and Hande [26]. The ABTS+ stock solution was prepared by addition of 5 mL of 7 mM ABTS solution and 88 µL of 140 mM potassium persulfate, the reaction mixture incubated in the dark room for 16 h. 10 µL of the extract and 290 µL dye solution was added to the 96-well plate and incubated for 6 min at 25 °C. The absorbance was measured at 734 nm. The antioxidant potential was calculated using the standard curve of ascorbic acid with concentration ranging from 0 to 150 µg/mL and was expressed in ascorbic acid equivalents (AAE) in mg per gram of sample.

2.4.7. Total Antioxidant Capacity (TAC)

The phosphomolybdate method was used to estimate the total antioxidant capacity as described in Prieto, et al. [28]. Sulphuric acid (0.6 M), 0.028 M sodium phosphate and 0.004 M ammonium molybdate were mixed to form phosphomolybdate reagent. 40 µL extract and 260 µL of phosphomolybdate reagent added to the 96-well plate and incubated at 95 °C for 10 min. The absorbance was measured at 695 nm upon the reaction mixture, cooling down to the room temperature. TAC was determined by using the ascorbic acid standard curve with concentration of 0–200 μg/mL and expressed in mg ascorbic acid equivalents (AAE) per g of fresh sample weight.

2.5. Characterization of Phenolic Compounds by LC-ESI-QTOF-MS/MS Analysis

Extensive characterisation of phenolic compounds of four different berries were carried out using the LC-ESI-QTOF-MS/MS and method followed as described by Suleria, Barrow and Dunshea [17]. An Agilent 1200 series of HPLC (Agilent Technologies, Santa Clara, CA, USA) connected via electrospray ionisation source (ESI) to the Agilent 6530 Accurate-Mass Quadrupole Time-of-Flight (Q-TOF) LC/MS (Agilent Technologies, Santa Clara, CA, USA). The separation was carried out using a Synergi Hydro-Reverse Phase 80 °A, LC column 250 × 4.6 mm, 4 μm (Phenomenex, Torrance, CA, USA) with temperature 25 °C and sample temperature at 10 °C. HPLC buffers were sonicated using 5 L Digital Ultrasonic water bath (Power sonic 505, Gyeonggi-do, Korea) for 10 min at 25 °C. The sample injected was 6 µL and the flow rate was set at 0.8 mL/min. The system utilizes a binary solvent delivery as follows: Mobile phase A: 98% water and 2% Acetic acid; Mobile phase B: acetonitrile, water and acetic acid solution (50:49.5:0.5). The condition set for the program was carried out as following: 0 min with 10% B, 20 min with 25% B, 30 min with 35% B, 40 min with 40% B, 70 min with 55% B, 75 min with 80% B, 77 min with 100% B, 79 min with 100% B, 82–85 min with isocratic 10% B. Both positive and negative modes were applied for peak identification. Nitrogen gas has been used as nebulizer and drying gas at 45 psi, with flow rate of 5 L/min at 300 °C. Capillary and nozzle voltage was placed at 3.5 kV and 500 V respectively and the mass spectra were obtained in the range of 50–1300 amu. Further, MS/MS analyses were carried out in automatic mode with collision energy (10, 15 and 30 eV) for fragmentation. Data acquisition and analysis were performed using Agilent LC-ESI-QTOF-MS/MS Mass Hunter workstation software (Qualitative Analysis, version B.03.01, Agilent).

2.6. HPLC–PDA Analysis

The quantification of phenolic compounds present in the berries were executed by Agilent 1200 series HPLC (Agilent Technologies, CA, USA) coupled with a photodiode array detector (PDA) as described by Feng, et al. [29]. The sample injected was 20 µL and the wavelengths used for detection of the samples were 280 nm, 320 nm, 370 nm. Column and conditions were the same as described in LC-ESI-QTOF-MS/MS analysis. Standard calibration curves were used to detect the compounds found in sample. Data acquisition and analysis were performed using Agilent LC-ESI-QTOF-MS/MS Mass Hunter workstation software (Qualitative Analysis, version B.03.01, Agilent).

2.7. Statistical Analysis

The data of the phenolic content and the antioxidant assays is represented as the means ± standard deviation and one-way analysis of variance (ANOVA) was used to test for differences in mean values between different samples, followed by Tukey’s honestly significant differences (HSD) multiple rank test at p < 0.05. ANOVA was performed by Minitab Program for Windows version 18.0 (Minitab, LLC, State College, PA, USA).

3. Results and Discussion

3.1. Phenolic Compound Estimation (TPC, TFC and TTC)

Berries are rich source of phenolic compounds [5] and in our study, different berry extracts were analysed for estimation of phenolic compounds including TPC, TFC and TTC (Table 1).
Folin-Ciocalteu’s reagent method allows the estimation of all the phenolic compounds present including the flavonoids, anthocyanin and non-flavonoid phenolic compounds and are expressed in gallic acid equivalent (GAE/gf.w.). In this study, the highest concentrations of total phenolic compounds were present in blueberries with 2.93 ± 0.07 mg GAE/g and the lowest concentration was observed in raspberries with 1.52 ± 0.12 mg GAE/g. In previous studies, TPC value of the methanolic extract of blueberries and blackberries ranged between 424.84–819.12 mg GAE/100 g [30] and 192.8–329.1 mg/100 g [31], respectively, while the TPC found in raspberries was 1776.02–1137.25 mg GAE/kg [32] and strawberries was 225 mg/100 g [33]. Previously, Abdelrahman, et al. [34] also reported higher concentration in these berries as compared to our study. The TPC values reported in the literature were found to be similar to the values recorded in this study (Table 1). This difference in the total phenolic compounds in the samples might be due to environmental factors, such as light, temperature, agronomic practices and genetic variation of the berries [31].
Flavonoids have gained attention due to their antioxidant activity and are an important index for nutritional assessment in food ingredients [35]. The TFC was determined by the aluminium chloride method and the TFC in this study ranged between 70.31 ± 1.21 µg QE/g and 14.31 ± 0.13 µg QE/g. The highest TFC was observed in blueberries with 70.31 ± 1.21 µg QE/g and the lowest in strawberries with 14.31 ± 0.13 µg QE/g. In previous studies, the TFC value were 30.44–91.69 mg QE/100 mg in blueberries [36], blackberries leaves with 449.00–715.00 mg QE/L based on their extraction temperature ranging between 40–80 °C [37], strawberries with 14.6 ± 3.0 mg QE/100 g [38] and raspberries 73.70–51.14 mg QE/100 gf.w. [39] which showed almost similar values to our study.
The TTC in our selected berries ranged between 11.32 ± 0.13 and 0.97 ± 0.13 mg CE/g. Blackberries had the highest tannin content (11.32 ± 0.13 mg CE/gf.w.) followed by blueberries (7.41 ± 0.09 mg CE/g), strawberries (2.37 ± 0.09 mg CE/g) and raspberries (0.97 ± 0.13 mg CE/g). Previously, few studies have been conducted to calculate the total tannin content in different berries. According to Heinonen [40], red raspberries and strawberries are very rich in tannin. The concentration of tannin present in the methanolic extracts of blueberries, raspberries, blackberries were 160, 120 and 80 mg/100 g [41]. Blueberries extracted with 70% acetone and 95% ethanol had higher concentration of tannin, when compared to our study [42]. The tannin recorded in our study were lower than the literature which might be due to environmental factors, such as light, temperature, agronomic practices and genetic variation of the berries [31].

3.2. Antioxidant Activity (DPPH, FRAP, ABTS and TAC)

Antioxidant activity is the ability of redox molecules to scavenge free radicals present in the food and biological systems [30]. The antioxidant capacity of the four different berries were determined by DPPH, FRAP, ABTS and TAC assays and expressed in ascorbic acid per gram (AAE/gf.w.) of sample as mentioned in Table 1.
In DPPH assay, the DPPH radical is reduced in the presence of the hydrogen and the electron donating antioxidants. Similarly, antioxidants derived from plants can reduce free radicals in food [43]. The antioxidant potential concentration varied between 1.69 ± 0.09 to 1.11 ± 0.12 mg AAE/g. Blueberries had the highest DPPH free radical scavenging activity with 1.69 ± 0.09 mg AAE/g. followed by raspberries (1.41 ± 0.11 mg AAE/g), blackberries (1.12 ± 0.07 mg AAE/g) and strawberries (1.11 ± 0.12 mg AAE/g). In the previous study, the free radical scavenging activity of blueberries were observed to be 65.07 ± 0.04 mg AAE/g [44], raspberries were 395.80 AAE/g [44], strawberries ranged between 3.33–21.08 mg AAE/gd.w. [45] and blackberries leaves with 111.5 mg AAE/gd.w. [46] which showed higher values when compared to our study. The difference in results might be due difference in varieties, growing region, extraction solvent, solute to solvent ratio, harvesting season and maturation stages of berries.
The FRAP assay was also conducted to measure the antioxidant capacity of the berries. In this assay, the electron transfer method was used to measure the capacity to reduce Fe3+ to Fe2+. The berries antioxidant capacity varied significantly (p < 0.05) from 367.43 ± 3.09 to 93.14 ± 1.76 µg AAE/g. The highest antioxidant activity was recorded in blueberries (367.43 ± 3.09 µg AAE/gf.w.) followed by blackberries (294.24 ± 3.20 µg AAE/g), strawberries (121.51 ± 2.10 µg AAE/g), and raspberries (93.14 ± 1.76 µg AAE/g). Previously in Lal, et al. [47] study, the antioxidant capacity of strawberries ranged between 326.06–701.13 mg AAE/100 gfw. The 30% ethanolic extract of blueberries and raspberries had antioxidant activity of 2.39 mg (AAE)/g and 2.32 mg (AAE)/g respectively [20]. The blackberries grown in Mexico ranged from 158.7–285.2 mol CE/g [48], which are also comparable to our study.
In the ABTS assay, the antioxidant ability is measured by reaction of the extracts with ABTS+ radical cation generated in the system [30]. In ABTS, the highest antioxidant ability observed in strawberries was 3.67 ± 0.14 mg AAE/g, followed by blueberries with 2.32 ± 0.09 mg AAE/g, blackberries with 1.73 ± 0.04 mg AAE/g and raspberries with 1.71 ± 0.11 mg AAE/g. In Leong and Shui [49] study, ethanolic extract of strawberries had 472 mg AAE/100 g, which is similar to the values reported in our study. The antioxidant ability of strawberries ranged between 2.25–19.58 mg AAE/gd.w. [45], blackberries 5422.38 mg AAE/100 g [50], blueberries 1.60 mg AAE/g [20] and 1.83 mg AAE/gd.w. raspberries [20]. In the previous study, blackberries showed higher value when compared to our study. These differences might be due different growing region, extraction solvent because different solvents were used to extract berries phenolics and performed antioxidant activities which might affect the extraction rate and overall antioxidant potential.
In the total antioxidant capacity (TAC) assay, the blueberries had the highest total antioxidant at 1.47 ± 0.20 mg AAE/g followed by raspberries (1.21 ± 0.01 mg AAE/g), blackberries (1.03 ± 0.09 mg AAE/g) and strawberries (0.97 ± 0.09 mg AAE/g). In a previous study led by Huang, et al. [51], the total antioxidant capacity in the methanolic extract of blueberries 14.98 mmol Trolox/100 g, blackberries 11.48 mmol Trolox/100 g and strawberries 4.44 ± 0.45 mmol Trolox/100 gd.w. were less than the values recorded in our study. The TAC of blackberry and blueberry was recoded as 6125.7 and 4814.6 mg AAE/100 gd.w., respectively by Lee, et al. [52], which is higher than the values recorded in our study. The water-soluble and insoluble TAC of strawberries were 430–900 and 390–1040 Vitamin E (TE μmol/100 g)., respectively, demonstrated by previous study [53].

3.3. LC-MS Characterization

Qualitative analysis and identification of the phenolic compounds from four different berries were carried out using LC-ESI-QTOF-MS/MS in both positive (ESI+) and negative (ESI-) ionization modes. The phenolic compounds were tentatively identified based on their m/z and MS spectra using an Agilent LC-MS mass hunter qualitative software and the Personal Compounds Database and Library (PCDL) (Supplementary data, Figures S1 and S2). The criteria for the compounds to be further analysed were the mass error < 5 ppm and PCDL library score more than 80, thereby, compounds were further identified using MS/MS identification and m/z characterization (Table 2). In the current study, total of 65 phenolic compounds were identified in 4 different berries including phenolic acids (19), flavonoids (33), other polyphenols (7), lignans (5) and stilbene (1).

3.3.1. Phenolic Acids

In this study, a total of 19 phenolic acids including hydroxybenzoic acids (8), hydroxycinnamic acids (8), hydroxyphenylacetic acids (2), hydroxyphenylpropanoic acids (1) were identified and characterised in four berries.

Hydroxybenzoic Acids

Compound 1,2,3 and 5 were tentatively characterised as gallic acid, gallic acid 4-O-glucoside, 2-hydroxybenzoic acid and 2,3-dihydroxybenzoic acid respectively and the compounds were present in negative ionisation mode. The compounds have precursors ions at m/z 169.0148 (Compound 1), m/z 331.0655 (Compound 2), m/z 137.0247 (Compound 3) and m/z 153.0198 (Compound 5). Further, MS/MS analysis showed that the product ions at 125, 93 and 109 due to the loss of CO2 (44 Da) from precursor ions whereas product ions at 169 due to the loss of hexosyl moiety (162 Da) [54,55,56]. Gallic acid 4-O-glucoside was identified in strawberries and blackberries, whereas the compounds gallic acid and 2,3-dihydroxybenzoic acid were only present in strawberries, however, the compound 2-hydroxybenzoic acid was present in strawberries, raspberries and blueberries. In previous studies, gallic acid 4-O-glucoside presence was observed in blueberries and bilberries [57], compound gallic acid found in various maturity stages in strawberries [58] and 2,3-dihydroxybenzoic acid was observed in hops and juniper berries [21]. Compound 4 identified as protocatechuic acid 4-O-glucoside (m/z 315.0707) was present in both modes and the product ions at m/z 153 indicating the loss of hexosyl moiety (162 Da) from precursor molecule [54] and was only detected in strawberries. Williamson and Clifford [59] also reported the presence of protocatechuic acid 4-O-glucoside in blackcurrants.

Hydroxycinnamic Acids and Other Phenolic Acid Derivatives

In current study, the observed hydroxycinnamic acids had eight compounds with antioxidant potential. Compound 9 was identified as 1,5-dicaffeoylquinic acid ([M − H] m/z at 515.1198) observed in both modes. The product ions were at m/z 353, m/z 335, m/z 191, m/z 179 due to the loss of [M-H-C9H6O3], [M-H-C9H8O4], [M-H-C18H12O6] and [M-H-C16H16O8] from the precursor molecule, respectively [60] and had been identified in strawberries, raspberries, blueberries. 3-Feruloylquinic acid (Compound 10, precursor ([M − H] m/z at 367.1038) was present in strawberries and raspberries, confirmed by the fragments at m/z 298, m/z 288, m/z 192 and m/z 191, corresponding to the loss of [M-H-3H2O2-CH3], [M-H-H2O-CH3-HCOOH], [M-H-C7H11O5] and [M-H-C10H8O3], respectively [61] and previously observed in cherries [57]. 3-caffeoylquinic acid (Compound 12) with precursor [M –H] m/z at 353.0884 present in strawberries and raspberries, yielded product ions at m/z 253, m/z 190 and m/z 144 due to the corresponding loss of HCOOH-3H2O, C6H5O2-3H2O and C7H11O6-H2O, respectively, from the precursor molecule [61]. Compound 14 with the precursor ion at [M − H] m/z 179.0349 had been identified, and the fragment peaks at m/z 143 and m/z 133 due to the loss of 2H2O and HCOOH further confirmed the compound as caffeic acid and was present only in strawberries [61]. Previously, caffeic acid was found in chokeberries, raspberries and strawberries and was the major phenolic compound in saskatoon berries and wild blueberries [62]. m-Coumaric acid identified as compound 16 ([M − H] m/z at 163.0392), was found in all the four berries and the characteristic fragment peak was at m/z 119, corresponding to the loss of CO2 [63]. Jakobek, et al. [64] also observed the presence of m-coumaric acid in blueberries, strawberries and red raspberries.

3.3.2. Flavonoids

A total of 33 flavonoids were identified including flavanols (4), flavones (2), flavanones (3), flavonols (6), dihydrochalcones (1), dihydroflavonols (1), anthocyanins (7) and isoflavonoids (9).

Flavanols

Three flavanols including compound 21, 22 and 23 were detected in the berries and present in both modes of ionisation. Compound 21 identified as 3′-O-methylcatechin with precursor [M − H] m/z at 303.0873 was only found in blueberries. The product ions at m/z 271 and m/z 163 were due to the loss of CH3OH and C6H5O2, respectively [65]. Compound 22 identified as procyanidin dimer B1 was present in strawberries, blueberries, blackberries with precursor [M − H] m/z at 577.1348 and the compound was identified upon the loss of phloroglucinol from the precursor molecule [66]. Previously, minor amounts of procyanidin dimer B1 was found in yellow raspberries [67]. Prodelphinidin dimer B3 (Compound 23, [M − H] m/z 611.1409), were identified in strawberries, blueberries and blackberries. The formation of peak at m/z 469 was due to the heterocyclic ring fission followed by removal of phloroglucinol whereas the peaks at m/z 311 and m/z 291 were due to the reduction into monomers through quinone methide fission cleavage and due to the loss of –OH group from gallocatechin respectively [68]. Li and Beta [69] reported the presence of prodelphinidin dimer B3 in whole-grain barley flour, however, to our best acknowledge, this is the first time to report the presence of this compound in berries.

Flavanones and Flavonols

Neoeriocitrin (Compound 26, [M − H] at m/z at 595.1674) was present in both mode and identified in strawberries, raspberries and blackberries. Based on MS/MS study, neoeriocitrin was confirmed by product ions at m/z 431 and m/z 287 due to the loss of H2O and glucoside [70]. Previously, the compound was identified and quantified in grapefruit juice [71].
Compound 29 with precursor at [M − H] m/z 463.0881 was identified as myricetin 3-O-rhamnoside and present in strawberries. The further confirmation was achieved by the fragment peak at 317 due to the loss of rhamnoside [72]. Serreli, et al. [73] also observed myricetin 3-O-rhamnoside in white myrtle berries. Compound 30 (Myricetin 3-O-galactoside with [M − H] m/z at 479.0841) present in strawberries and blueberries was identified by the product ion at m/z 317 due to the loss of glucoside [74]. Compound 32 was identified as quercetin 3-O-(6”-malonyl-glucoside) based on the precursor ion [M + H]+ at m/z 551.1038. Upon the analysis of MS/MS data, this compound was confirmed by the peak fragment at m/z 303 corresponding to the loss of malonyl-hexose unit [75]. Previously, quercetin 3-O-(6”-malonyl-glucoside) compound was identified in red chicory [76].

Dihydrochalcones, Dihydroflavonols and Anthocyanins

Phloridzin (compound 35, [M − H] m/z 435.1279) with peak fragmentation at m/z 273 due to the consecutive loss of glucoside confirms the molecule and was present in strawberries, blackberries and blueberries [77]. In previous studies, phloridzin was reported in apple flesh and peel [78] and was also confirmed in strawberries [79]. Compound 36 was identified as dihydroquercetin [M − H] m/z at 303.0508) based the fragment peaks at m/z 285 [M-H-H2O], m/z 275 [M-H-CO] and m/z 151 [M-H-RDA cleavage] [80]. Previously, Suh, et al. [81] found compound dihydroquercetin abundant in chokeberries and honeyberries.
Anthocyanins are mostly water-soluble phenolics and responsible for the color formation including red, blue and purple colors in different fruits and vegetables [82,83]. Anthocyanins, particularly glucosides and galactosides of cyanidin, peonidin, delphinidin, petunidin and malvidin have remarkable antioxidant potential. The antioxidant activity is high in anthocyanins when compared to other flavonoids due to their positively charged oxygen atom [84]. During ripening of different berry fruits, anthocyanins increase in production whereas the other phenolic compounds decrease including (−)-epicatechin, (+)-catechin and dimeric proanthocyanidins [85].

Isoflavonoids

Compound 45 present in both modes were tentatively identified as violanone present in strawberries, raspberries and blueberries with precursor at ([M − H] at m/z 315.0872). MS/MS analysis confirmed the compound 45 by the presence of the product ions at m/z 300, m/z 285 and m/z 135 corresponding to the loss of CH3, 2CH3 and C10H12O3 [86]. Violanone has been isolated from Dalbergia oliveri previously and used in traditional Thai medicine for treatment of chronic ulcer [87]. 3′-Hydroxygenistein (Compound 49, precursor ion [M + H]+ at m/z 287.0547) was identified by the product ions at m/z 269 and m/z 259 due to the loss of H2O and CO [88]. This compound was present in raspberries, blueberries and blackberries.

3.3.3. Other Polyphenols

The MS/MS experiment confirmed the compound 53 as coumarin ([M + H]+ at m/z 147.0441) due to the product ions at m/z 103 and m/z 91 corresponding to the loss of CO2 and 2CO [89] present in blueberries. Javeri and Chand [90] reported that coumarin was an important component in turmeric. Compound 54 was tentatively identified as esculetin by the precursor ion [M − H] at m/z 177.0190 in strawberries. In MS/MS study, the product ions were at m/z 149 (M-H-CO), m/z 133 (M-H-CO2) and m/z 89 (M-H-2 CO2) [91]. Previously compound esculetin was reported to be present in Vaccinium myrtillus (bilberries) and V. gaultherioides (false or bog bilberries) [92]. Compound 56 (demethoxycurcumin) was only detected in the negative mode with [M − H] m/z at 337.1091 present in blueberries. In MS/MS analysis, the product ion formed at m/z 217 was corresponding to the loss of C8H8O (120 Da) from the parent ions [93].

3.3.4. Lignans

Schisandrin C (Compound 61) and schisantherin A (Compound 64) were only identified in positive ionisation mode at m/z 385.1647 and m/z 537.2119. Further analysis of MS/MS confirmed the presence of schisantherin C based on product ions at m/z 370, m/z 315 and m/z 300 corresponding to the loss of CH3, C5H10, C5H10 [94], while product ions at m/z 519, m/z 415, m/z 385 and m/z 371 were characterized as schisantherin A due to the loss of H2O, C6H5COOH, C6H5COOH-CH2O and C6H5COOH-C2H4O. Schisandrin C and schisantherin A were only identified in blackberries. The above compounds were also identified in Schisandra chinensis used in Chinese medicine for years [95]. Compound 60 identified as pinoresinol was found only in blueberries with the precursor ion at m/z 357.1331 and obtained product ions at m/z 342 [M-H-CH3], m/z 327 [M-H-C2H6], m/z 313[M-H-CO2] and m/z 221 [M-H-C8H8O2] [60]. Compound 63 (Deoxyschisandrin) present in negative mode at m/z 415.2146 was found in strawberries. The compound was identified and confirmed by MS/MS analysis upon the loss of CH3, C5H10, C5H10−OCH3 and C5H10−OCH3−CH3 [94]. Lee, et al. [96] reported the presence of deoxyschizandrin in Schisandra berries.

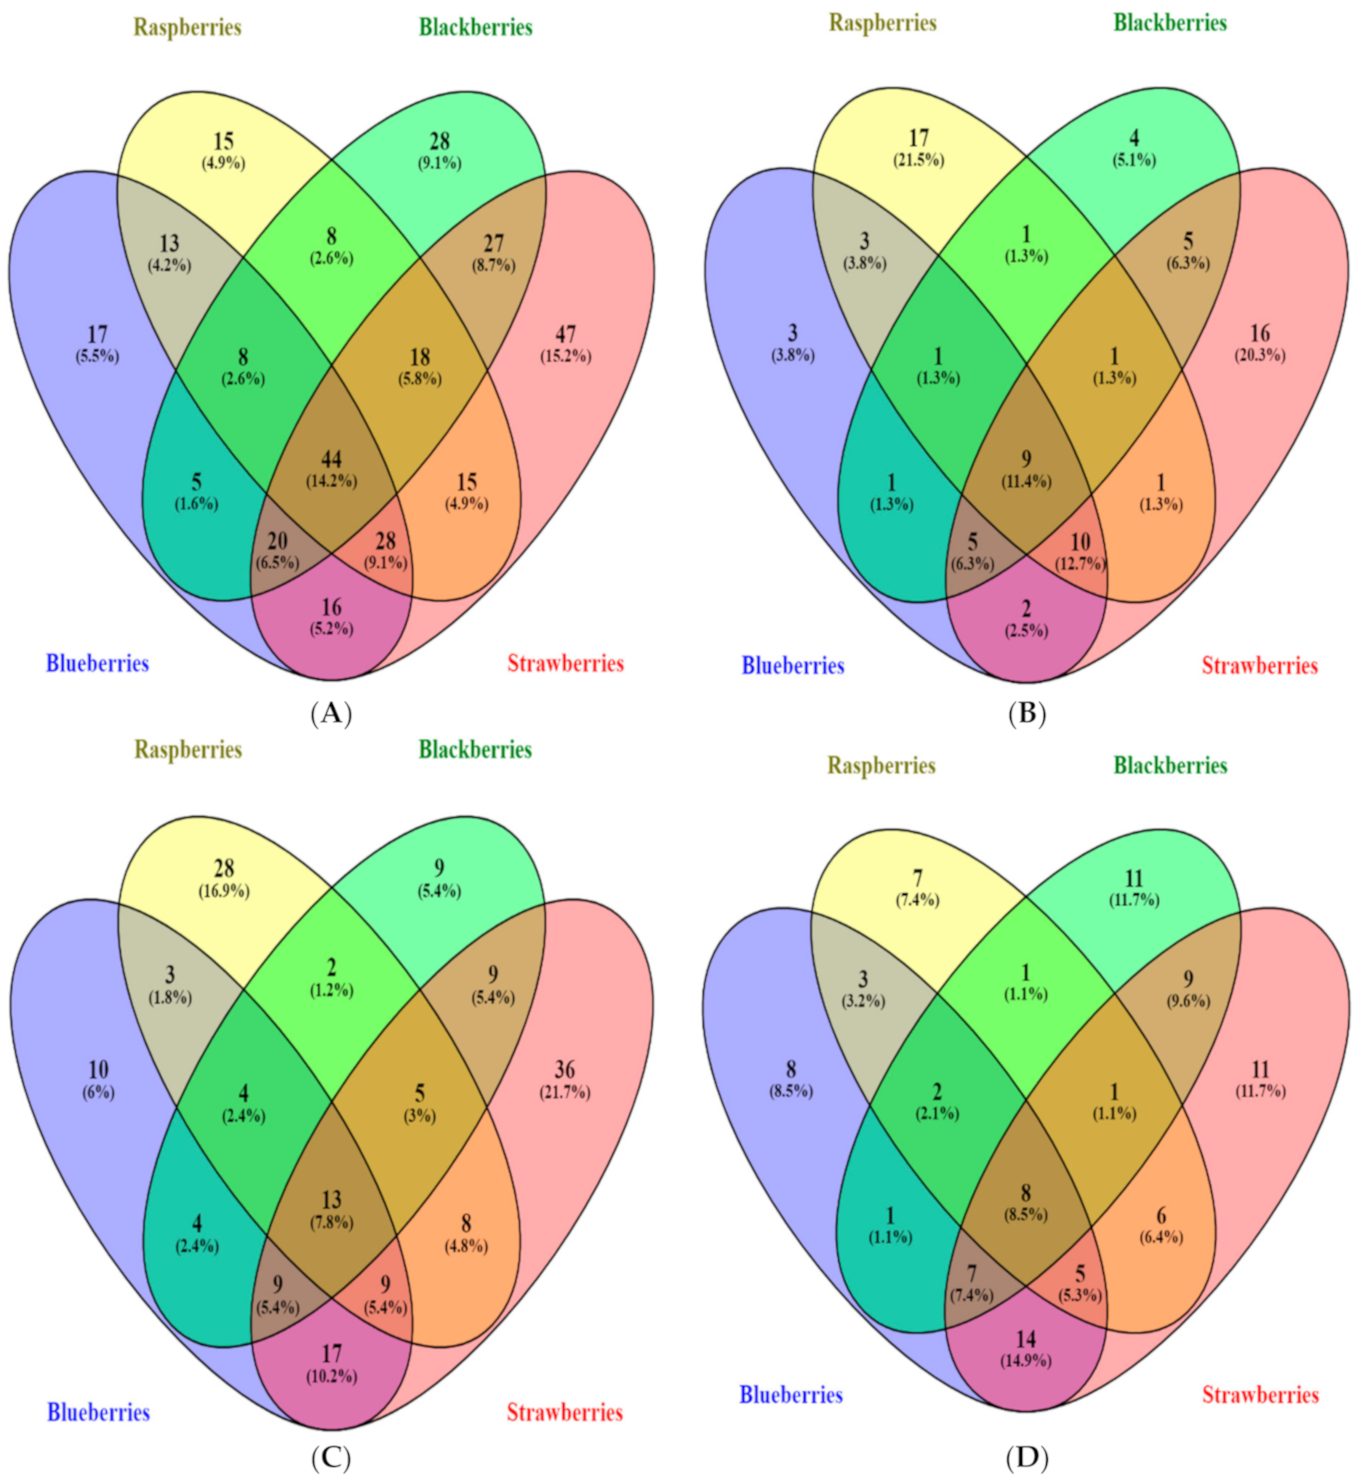
3.4. Distribution of Phenolic Compounds in Berries

Berries contain a wide range of phenolic compounds in different conjugated forms, a fact that makes their simultaneous analysis a difficult task, therefore, researchers have established a keen interest in the distribution of phenolic compounds in berries. The Venn diagrams (Figure 1) were developed according to the number of phenolic compounds that had been detected in blueberries (blue), strawberries (red), raspberries (green) and blackberries (yellow).
In the Venn diagram of total phenolic compound, the unique compounds in strawberries, blackberries, blueberries, and Raspberries are 47 (15.2%), 28 (9.1%), 17 (5.5%) and 15 (4.9%) respectively. The maximum overlapping phenols were 44 (14.2%) that were shared among the four berries. The lowest number of overlapped compounds were 5 (1.6%) phenols in blackberries and blueberries followed by raspberries with blackberries and blueberries. Previous researchers, found that blackberries, raspberries and strawberries contain similar amount of total phenolic compounds [97], but another study found that blueberries had the highest polyphenol [98]. In our study, blueberries showed highest phenolic content compared to other berries. Whereas, other researchers found that the blackberries have greater concentration of total phenolic compound than strawberries and raspberries, which are grown in tropical conditions [99]. Croge, et al. [100] found fruits grown in temperate region have higher polyphenol content.
A total of 11.4% phenolic acids were common among the four berries, whereas 12.7% of phenolic acids were common among blueberries, raspberries, and strawberries. The presence of unique compounds in blueberries, strawberries, raspberries, and blackberries were 3 (3.8%), 16 (20.3%), 17 (21.5%) and 4 (5.1%), respectively. The flavonoid presented in the Venn diagram consisted of 13 flavonoids common among four berries, whereas the unique flavonoids were high in strawberries and raspberries. The highest similarity of flavonoids was among blueberries and strawberries and on the other hand the lowest common flavonoids were among blueberries and blackberries. According to the previous studies, the strawberries obtained lower content of anthocyanin as compared to blueberries, blackberries and raspberries [101]. The anthocyanin concentration accumulated was maximum at the ripening stage and around 25 anthocyanins was reported in the strawberries [102]. In our study, the total flavonoid content was present in blueberries higher than other berries.
Among the other polyphenols, 8 polyphenols were commonly found in four berries. Blueberries and strawberries had 14 polyphenols overlapped followed by 7 polyphenols common in blueberries, strawberries, and blackberries. The unique polyphenols were present in blueberries (8.5%), raspberries (7.4%), strawberries (11.7%) and blackberries (11.7%). As per our best knowledge, we did not find any related studies on the characterization of other polyphenols from fruit berries.

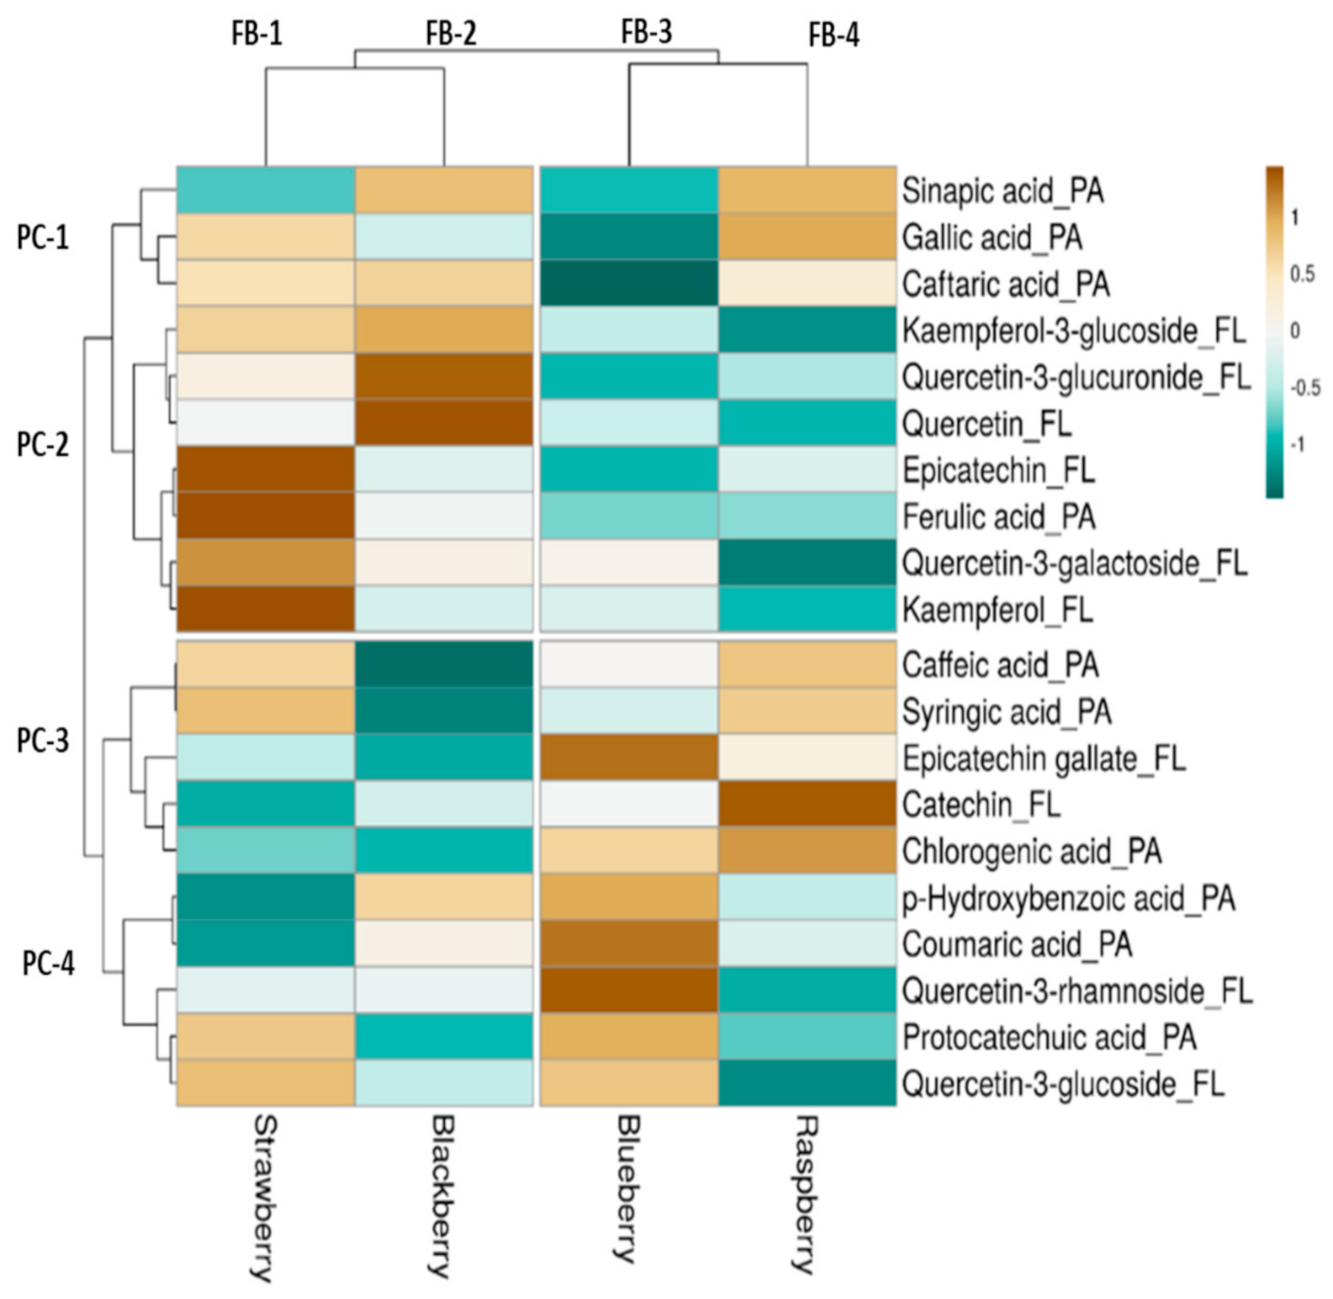
3.5. Heatmap and Hierarchical Cluster Analysis of Quantified Phenolics in Berries

A heat map (Figure 2) was constructed along with hierarchical clusters for further analysing HPLC-PDA quantified phenolic compounds in fruit berries. Twenty phenolic compounds were quantified consisting of ten phenolic acids and ten flavonoids (Supplementary Table S1).
The hierarchically clustered heat map of the phenolic compounds of the fresh grown berries including strawberries, raspberries, blueberries and blackberries were generated. The axis of the map had samples and phenolic compounds; therefore, the pattern of branching showed the similarity among them and each branch point shows a divergence. The darker brown colour has the higher content (catechin and chlorogenic acid) and the blue colour had lower concentration; the colour difference also showed the difference among the berries.
The phenolic compounds were clustered into 4 groups of PC-1, PC-2, PC-3, and PC-4. As the branches divides and forms subgroups the similarity among the compounds increases. The phenolic acids (caffeic acid, syringic acid, chlorogenic acid) and flavonoids (epicatechin, quercetin-3-galactoside, kaempferol) showed great similarity. Whereas phenolic acids (gallic acid, syringic acid) and flavonoids (kaempferol-3-glucoside, quercetin-3-glucoside) have shown high dissimilarity. Blueberries showed higher content of phenolic acids (p-hydroxybenzoic acid and p-coumaric acid) and flavonoids (quercetin-3-rhamnoside and epicatechin) in the heat map and similar to the in vitro studies.
In phenolic acids, presence of gallic acid was high in raspberries compared to strawberries, blackberries, and blueberries. Huang, Zhang, Liu and Li [51] showed the presence of gallic acid in strawberries and blackberries, whereas, Sellappan, et al. [103] study showed that rabbit-eye blueberries had high concentration of gallic acid compared to blackberries. Blueberries had higher concentration of p-hydroxybenzoic acid compared to blackberry and was least in strawberries. Previous study of Huang, Zhang, Liu and Li [51] also found that the blueberries had high concentration of p-hydroxybenzoic acid and in our study the in vitro assays showed higher phenolic content. In our study, caffeic acid and chlorogenic acid concentration was high in raspberry but not detected in blackberry. Previous study showed that the blueberries had higher concentration of caffeic acid and chlorogenic acid [103,104] and lowest in blackberries [64]. Ferulic acid and p-coumaric acid concentration were high in strawberry and blueberry, respectively. Jakobek, Šeruga, Novak and Medvidović-Kosanović [64] showed the presence of low concentration of ferulic and p-coumaric acid in blackberries. Caftaric acid and sinapic acid were detected in blackberries, raspberries, strawberries, and negligible concentration or not detected in blueberries. Protocatechuic acid was found in all four berries, whereas syringic acid was not detected in blackberries.
In flavonoids, quercetin and its derivates including quercetin-3-glucuronide, quercetin-3-galactoside, quercetin-3-glucoside and quercetin-3-rhamnoside were identified in all four berries. Blackberries had highest concentration of quercetin and quercetin-3-glucuronide followed by strawberries. Previously, quercetin-3-rhamnoside was reported higher in blueberries [51] as compared to our results. Quercetin was detected in all four berries and previous study showed the presence in raspberries and strawberries [105]. Kaempferol presence was identified high in strawberries and its derivative kaempferol-3-glucoside was detected in blackberries. In the previous studies, the presence of kaempferol was detected in strawberries. Presence of Epicatechin and catechin was observed in all four berries [106,107].

4. Conclusions

In conclusion, all the selected four Australian berries have high phenolic contents and antioxidant potential. The in vitro assays (TPC, TFC, DPPH, FRAP, TAC) showed that blueberries compared to other berries had higher phenolic acids and antioxidant content. The LC-ESI-QTOF-MS/MS identified 65 phenolic compounds in the four berries. The quantification by HPLC showed the quantity of phenolic compound present and the phenolic acid (p-hydroxybenzoic) and flavonoid (quercetin-3-rhamnoside) were higher in blueberries. According to the results obtained, berries can have a positive benefit when used in food and nutraceutical industries. To commercialise the ingredients, further analysis can be done on bioavailability, bio accessibility and toxicology studies.

Supplementary Materials

The following are available online at https://www.mdpi.com/2076-3921/10/1/26/s1, Figure S1: LC-ESI-QTOF-MS/MS basic peak chromatograph (BPC) for characterization of phenolic compounds of berries. Figure S2. Extracted ion chromatogram of strawberries and their mass spectrum. Table S1: Quantification of targeted phenolics in berries through HPLC-PDA.

Author Contributions

Conceptualization, methodology, formal analysis, validation and investigation, V.S., B.Z. and H.A.R.S.; resources, H.A.R.S., C.J.B. and F.R.D.; writing—original draft preparation, V.S. and H.A.R.S.; writing—review and editing, V.S., B.Z., M.A.N., C.J.B., H.A.R.S. and F.R.D.; supervision, H.A.R.S., F.R.D. and M.A.N.; ideas sharing, H.A.R.S.; C.J.B. and F.R.D.; funding acquisition, H.A.R.S., F.R.D. and C.J.B. All authors have read and agreed to the published version of the manuscript.

Funding

This research was funded by the University of Melbourne under the “McKenzie Fellowship Scheme” (Grant No. UoM-18/21), the “Richard WS Nicholas Agricultural Science Scholarship” and the “Faculty Research Initiative Funds” funded by the Faculty of Veterinary and Agricultural Sciences, The University of Melbourne, Australia and “The Alfred Deakin Research Fellowship” funded by Deakin University, Australia.

Institutional Review Board Statement

Not applicable.

Informed Consent Statement

Not applicable.

Acknowledgments

We would like to thank Nicholas Williamson, Shuai Nie and Michael Leeming from the Mass Spectrometry and Proteomics Facility, Bio21 Molecular Science and Biotechnology Institute, the University of Melbourne, VIC, Australia for providing access and support for the use of HPLC-PDA and LC-ESI-QTOF-MS/MS and data analysis.

Conflicts of Interest

The authors declare no conflict of interest.

References

  1. Yang, J.; Cui, J.; Chen, J.; Yao, J.; Hao, Y.; Fan, Y.; Liu, Y. Evaluation of physicochemical properties in three raspberries (rubus idaeus) at five ripening stages in northern china. Sci. Hortic. 2020, 263. [Google Scholar] [CrossRef]
  2. Siracusa, L.; Ruberto, G. Not only what is food is good—Polyphenols from edible and nonedible vegetable waste. In Polyphenols in Plants; Elsevier: Amsterdam, The Netherlands, 2019; pp. 3–21. [Google Scholar]
  3. Hort Innovation. Australian Horticulture Statistics Handbook–Fruit; Hort Innovation: Sydney, NSW, Australia, 2019. [Google Scholar]
  4. Luís, Â.; Duarte, A.P.; Pereira, L.; Domingues, F. Interactions between the major bioactive polyphenols of berries: Effects on antioxidant properties. Eur. Food Res. Technol. 2018, 244, 175–185. [Google Scholar] [CrossRef]
  5. Stoner, G.D.; Seeram, N.P. Berries and Cancer Prevention; Springer: Berlin/Heidelberg, Germany, 2011. [Google Scholar]
  6. Williamson, G. The role of polyphenols in modern nutrition. Nutr. Bull. 2017, 42, 226–235. [Google Scholar] [CrossRef] [PubMed]
  7. Kim, Y.; Keogh, J.B.; Clifton, P.M. Polyphenols and glycemic control. Nutrients 2016, 8, 17. [Google Scholar] [CrossRef]
  8. Boath, A.S.; Grussu, D.; Stewart, D.; McDougall, G.J. Berry polyphenols inhibit digestive enzymes: A source of potential health benefits? Food Dig. 2012, 3, 1–7. [Google Scholar] [CrossRef]
  9. Hardman, W.E. Diet components can suppress inflammation and reduce cancer risk. Nutr. Res. Pract. 2014, 8, 233–240. [Google Scholar] [CrossRef] [Green Version]
  10. Matos, M.J.; Santana, L.; Uriarte, E.; Abreu, O.A.; Molina, E.; Yordi, E.G. Coumarins—An important class of phytochemicals. In Phytochemicals—Isolation, Characterisation and Role in Human Health; InTech: London, UK, 2015; pp. 113–140. [Google Scholar]
  11. Koli, R.; Erlund, I.; Jula, A.; Marniemi, J.; Mattila, P.; Alfthan, G. Bioavailability of various polyphenols from a diet containing moderate amounts of berries. J. Agric. Food Chem. 2010, 58, 3927–3932. [Google Scholar] [CrossRef]
  12. Marhuenda, J.; Alemán, M.D.; Gironés-Vilaplana, A.; Pérez, A.; Caravaca, G.; Figueroa, F.; Mulero, J.; Zafrilla, P. Phenolic composition, antioxidant activity, and in vitro availability of four different berries. J. Chem. 2016, 2016, 1–7. [Google Scholar] [CrossRef] [Green Version]
  13. Pérez-Jiménez, J.; Neveu, V.; Vos, F.; Scalbert, A. Identification of the 100 richest dietary sources of polyphenols: An application of the phenol-explorer database. Eur. J. Clin. Nutr. 2010, 64, S112–S120. [Google Scholar] [CrossRef]
  14. Farrés-Cebrián, M.; Seró, R.; Saurina, J.; Núñez, O. Hplc-uv polyphenolic profiles in the classification of olive oils and other vegetable oils via principal component analysis. Separations 2016, 3, 33. [Google Scholar] [CrossRef] [Green Version]
  15. Turkmen, N.; Sari, F.; Velioglu, Y.S. Effects of extraction solvents on concentration and antioxidant activity of black and black mate tea polyphenols determined by ferrous tartrate and folin–ciocalteu methods. Food Chem. 2006, 99, 835–841. [Google Scholar] [CrossRef]
  16. Alam, M.N.; Bristi, N.J.; Rafiquzzaman, M. Review on in vivo and in vitro methods evaluation of antioxidant activity. Saudi Pharm. J. 2013, 21, 143–152. [Google Scholar] [CrossRef] [PubMed] [Green Version]
  17. Suleria, H.A.R.; Barrow, C.J.; Dunshea, F.R. Screening and characterization of phenolic compounds and their antioxidant capacity in different fruit peels. Foods 2020, 9, 1206. [Google Scholar] [CrossRef] [PubMed]
  18. Tulipani, S.; Mezzetti, B.; Capocasa, F.; Bompadre, S.; Beekwilder, J.; de Vos, C.H.R.; Capanoglu, E.; Bovy, A.; Battino, M. Antioxidants, phenolic compounds, and nutritional quality of different strawberry genotypes. J. Agric. Food Chem. 2008, 56, 696–704. [Google Scholar] [CrossRef] [PubMed]
  19. Grace, M.H.; Xiong, J.; Esposito, D.; Ehlenfeldt, M.; Lila, M.A. Simultaneous lc-ms quantification of anthocyanins and non-anthocyanin phenolics from blueberries with widely divergent profiles and biological activities. Food Chem. 2019, 277, 336–346. [Google Scholar] [CrossRef] [PubMed]
  20. Gu, C.; Howell, K.; Dunshea, F.R.; Suleria, H.A. Lc-esi-qtof/ms characterisation of phenolic acids and flavonoids in polyphenol-rich fruits and vegetables and their potential antioxidant activities. Antioxidants 2019, 8, 405. [Google Scholar] [CrossRef] [Green Version]
  21. Tang, J.; Dunshea, F.R.; Suleria, H.A. Lc-esi-qtof/ms characterization of phenolic compounds from medicinal plants (hops and juniper berries) and their antioxidant activity. Foods 2020, 9, 7. [Google Scholar] [CrossRef] [Green Version]
  22. Samsonowicz, M.; Regulska, E.; Karpowicz, D.; Leśniewska, B. Antioxidant properties of coffee substitutes rich in polyphenols and minerals. Food Chem. 2019, 278, 101–109. [Google Scholar] [CrossRef]
  23. Stavrou, I.J.; Christou, A.; Kapnissi-Christodoulou, C.P. Polyphenols in carobs: A review on their composition, antioxidant capacity and cytotoxic effects, and health impact. Food Chem. 2018, 269, 355–374. [Google Scholar] [CrossRef]
  24. Haile, M.; Kang, W.H. Antioxidant activity, total polyphenol, flavonoid and tannin contents of fermented green coffee beans with selected yeasts. Fermentation 2019, 5, 29. [Google Scholar] [CrossRef] [Green Version]
  25. Ouyang, H.; Hou, K.; Peng, W.; Liu, Z.; Deng, H. Antioxidant and xanthine oxidase inhibitory activities of total polyphenols from onion. Saudi J. Biol. Sci. 2018, 25, 1509–1513. [Google Scholar] [CrossRef]
  26. Rajurkar, N.S.; Hande, S. Estimation of phytochemical content and antioxidant activity of some selected traditional indian medicinal plants. Indian J. Pharm. Sci. 2011, 73, 146. [Google Scholar] [CrossRef] [Green Version]
  27. Sogi, D.S.; Siddiq, M.; Greiby, I.; Dolan, K.D. Total phenolics, antioxidant activity, and functional properties of ‘tommy atkins’ mango peel and kernel as affected by drying methods. Food Chem. 2013, 141, 2649–2655. [Google Scholar] [CrossRef]
  28. Prieto, P.; Pineda, M.; Aguilar, M. Spectrophotometric quantitation of antioxidant capacity through the formation of a phosphomolybdenum complex: Specific application to the determination of vitamin e. Anal. Biochem. 1999, 269, 337–341. [Google Scholar] [CrossRef]
  29. Feng, Y.; Dunshea, F.R.; Suleria, H.A.R. Lc-esi-qtof/ms characterization of bioactive compounds from black spices and their potential antioxidant activities. J. Food Sci. Technol. 2020, 57, 1–17. [Google Scholar] [CrossRef]
  30. Bunea, A.; Rugina, O.D.; Pintea, A.M.; Sconta, Z.; Bunea, C.I.; Socaciu, C. Comparative polyphenolic content and antioxidant activities of some wild and cultivated blueberries from romania. Notulae Botanicae Horti Agrobotanici Cluj-Napoca 2011, 39, 70–76. [Google Scholar] [CrossRef] [Green Version]
  31. Benvenuti, S.; Pellati, F.; Melegari, M.a.; Bertelli, D. Polyphenols, anthocyanins, ascorbic acid, and radical scavenging activity of rubus, ribes, and aronia. J. Food Sci. 2006, 69, FCT164–FCT169. [Google Scholar] [CrossRef]
  32. De Ancos, B.; González, E.M.; Cano, M.P. Ellagic acid, vitamin c, and total phenolic contents and radical scavenging capacity affected by freezing and frozen storage in raspberry fruit. J. Agric. Food Chem. 2000, 48, 4565–4570. [Google Scholar] [CrossRef] [PubMed] [Green Version]
  33. Olas, B. Berry phenolic antioxidants—Implications for human health? Front. Pharmacol. 2018, 9, 78. [Google Scholar] [CrossRef]
  34. Abdelrahman, M.; Burritt, D.J.; Tran, L.-S.P. The Use of Metabolomic Quantitative Trait Locus Mapping and Osmotic Adjustment Traits for the Improvement of Crop Yields under Environmental Stresses; Seminars in Cell & Developmental Biology; Elsevier: Amsterdam, The Netherlands, 2018; pp. 86–94. [Google Scholar]
  35. Ravishankar, D.; Rajora, A.K.; Greco, F.; Osborn, H.M. Flavonoids as prospective compounds for anti-cancer therapy. Int. J. Biochem. Cell Biol. 2013, 45, 2821–2831. [Google Scholar] [CrossRef]
  36. Okan, O.T.; Deniz, I.; Yayli, N.; ŞAT, İ.G.; Mehmet, Ö.; Serdar, G.H. Antioxidant activity, sugar content and phenolic profiling of blueberries cultivars: A comprehensive comparison. Notulae Botanicae Horti Agrobotanici Cluj-Napoca 2018, 46, 639–652. [Google Scholar] [CrossRef] [Green Version]
  37. Salevic, A.; Kaluševic, A.; Levic, S.; Bugarski, B.; Nedovic, V. Effect of Extraction Conditions on Phenolic Compounds from Blackberry Leaves Extracts. In Proceedings of the 11th Baltic Conference on Food Science and Technology ”Food science and technology in a changing world“ FOODBALT 2017, Jelgava, Latvia, 27–28 April 2017; pp. 40–44. [Google Scholar]
  38. Lin, J.-Y.; Tang, C.-Y. Determination of total phenolic and flavonoid contents in selected fruits and vegetables, as well as their stimulatory effects on mouse splenocyte proliferation. Food Chem. 2007, 101, 140–147. [Google Scholar] [CrossRef]
  39. Onopiuk, A.; Półtorak, A.; Moczkowska, M.; Szpicer, A.; Wierzbicka, A.J.C.-J.o.F. The impact of ozone on health-promoting, microbiological, and colour properties of Rubus ideaus raspberries. J. Food 2017, 15, 563–573. [Google Scholar]
  40. Heinonen, M. Antioxidant activity and antimicrobial effect of berry phenolics—A finnish perspective. Mol. Nutr. Food Res. 2007, 51, 684–691. [Google Scholar] [CrossRef] [PubMed]
  41. Zorița Diaconeasa, F.R.; Rugina, D.; Leopold, L.; Oana, P.; Vodnar, D.; Cuibus, L.; Socaciu, C. Phenolic content and their antioxidant activity in various berries cultivated in romania. Bull. UASVM Food Sci. Technol. 2015, 72, 1. [Google Scholar] [CrossRef]
  42. Naczk, M.; Grant, S.; Zadernowski, R.; Barre, E. Protein precipitating capacity of phenolics of wild blueberry leaves and fruits. Food Chem. 2006, 96, 640–647. [Google Scholar] [CrossRef]
  43. Bobinaitė, R.; Viškelis, P.; Venskutonis, P.R. Variation of total phenolics, anthocyanins, ellagic acid and radical scavenging capacity in various raspberry (rubus spp.) cultivars. Food Chem. 2012, 132, 1495–1501. [Google Scholar] [CrossRef]
  44. Roidaki, A.; Kollia, E.; Panagopoulou, E.; Chiou, A.; Varzakas, T.; Markaki, P.; Proestos, C. Super foods and Super herbs: Antioxidant and Antifungal Activity. Curr. Res. Nutr. Food Sci. J. 2016, 4, 138–145. [Google Scholar] [CrossRef]
  45. Zitouni, H.; Hssaini, L.; Ouaabou, R.; Viuda-Martos, M.; Hernández, F.; Ercisli, S.; Ennahli, S.; Messaoudi, Z.; Hanine, H.J.P. Exploring antioxidant activity, organic acid, and phenolic composition in strawberry tree fruits (Arbutus unedo L.) growing in morocco. Plants 2020, 9, 1677. [Google Scholar] [CrossRef]
  46. Buřičová, L.; Réblová, Z. Czech medicinal plants as possible sources of antioxidants. Czech J. Food Sci. 2008, 26, 132–138. [Google Scholar] [CrossRef] [Green Version]
  47. Lal, S.; Ahmed, N.; Singh, S.R.; Singh, D.B.; Sharma, O.C.; Kumar, R.J.F. Variability of health and bioactive compounds in strawberry (fragaria x ananassa duch.) cultivars grown under an indian temperate ecosystem. Fruits 2013, 68, 423–434. [Google Scholar] [CrossRef] [Green Version]
  48. Reyes-Carmona, J.; Yousef, G.G.; Martínez-Peniche, R.A.; Lila, M.A. Antioxidant capacity of fruit extracts of blackberry (Rubus sp.) produced in different climatic regions. J. Food Sci. 2005, 70, s497–s503. [Google Scholar] [CrossRef]
  49. Leong, L.P.; Shui, G. An investigation of antioxidant capacity of fruits in singapore markets. Food Chem. 2002, 76, 69–75. [Google Scholar] [CrossRef]
  50. Zafra-Rojas, Q.Y.; González-Martínez, B.E.; Cruz-Cansino, N.D.S.; López-Cabanillas, M.; Suárez-Jacobo, Á.; Cervantes-Elizarrarás, A.; Ramírez-Moreno, E. Effect of ultrasound on in vitro bioaccessibility of phenolic compounds and antioxidant capacity of blackberry (Rubus fruticosus) residues cv. Tupy. Plant Foods Hum. Nutr. 2020, 75, 608–613. [Google Scholar] [CrossRef] [PubMed]
  51. Huang, W.-y.; Zhang, H.-c.; Liu, W.-x.; Li, C.-y. Survey of antioxidant capacity and phenolic composition of blueberry, blackberry, and strawberry in nanjing. J. Zhejiang Univ. Sci. B 2012, 13, 94–102. [Google Scholar] [CrossRef] [PubMed] [Green Version]
  52. Lee, S.G.; Vance, T.M.; Nam, T.G.; Kim, D.O.; Koo, S.I.; Chun, O.K. Contribution of anthocyanin composition to total antioxidant capacity of berries. Plant Foods Hum. Nutr. 2015, 70, 427–432. [Google Scholar] [CrossRef] [PubMed]
  53. Olsson, M.E.; Ekvall, J.; Gustavsson, K.-E.; Nilsson, J.; Pillai, D.; Sjöholm, I.; Svensson, U.; Åkesson, B.; Nyman, M.G.L. Antioxidants, low molecular weight carbohydrates, and total antioxidant capacity in strawberries (fragaria × ananassa):  Effects of cultivar, ripening, and storage. J. Agric. Food Chem. 2004, 52, 2490–2498. [Google Scholar] [CrossRef]
  54. Sun, J.; Zhao, R.; Zeng, J.; Li, G.; Li, X. Characterization of destrins with different dextrose equivalents. Molecules 2010, 15, 5162–5173. [Google Scholar] [CrossRef] [Green Version]
  55. Rajauria, G.; Foley, B.; Abu-Ghannam, N. Identification and characterization of phenolic antioxidant compounds from brown irish seaweed himanthalia elongata using lc-dad–esi-ms/ms. Innov. Food Sci. Emerg. Tech. 2016, 37, 261–268. [Google Scholar] [CrossRef]
  56. Wang, X.; Yan, K.; Ma, X.; Li, W.; Chu, Y.; Guo, J.; Li, S.; Zhou, S.; Zhu, Y.; Liu, C. Simultaneous determination and pharmacokinetic study of protocatechuic aldehyde and its major active metabolite protocatechuic acid in rat plasma by liquid chromatography-tandem mass spectrometry. J. Chromatograph. Sci. 2016, 54, 697–705. [Google Scholar] [CrossRef] [Green Version]
  57. Nemzer, B.V.; Kalita, D.; Yashin, A.Y.; Yashin, Y.I. Bioactive compounds, antioxidant activities, and health beneficial effects of selected commercial berry fruits: A review. J. Food Res. 2020, 9, 78. [Google Scholar] [CrossRef]
  58. Mahmood, T.; Anwar, F.; Abbas, M.; Saari, N. Effect of maturity on phenolics (phenolic acids and flavonoids) profile of strawberry cultivars and mulberry species from pakistan. Int. J. Mol. Sci. 2012, 13, 4591–4607. [Google Scholar] [CrossRef] [PubMed] [Green Version]
  59. Williamson, G.; Clifford, M.N. Colonic metabolites of berry polyphenols: The missing link to biological activity? Br. J. Nutr. 2010, 104, 48–66. [Google Scholar] [CrossRef] [PubMed] [Green Version]
  60. Wang, X.; Liu, J.; Zhang, A.; Sun, H.; Zhang, Y. Systematic characterization of the absorbed components of acanthopanax senticosus stem. In Serum Pharmacochemistry of Traditional Chinese Medicine; Wang, X., Zhang, A., Sun, H., Eds.; Elsevier: Amsterdam, The Netherlands, 2017; pp. 313–336. [Google Scholar]
  61. Lin, H.; Zhu, H.; Tan, J.; Wang, H.; Wang, Z.; Li, P.; Zhao, C.; Liu, J. Comparative analysis of chemical constituents of moringa oleifera leaves from china and india by ultra-performance liquid chromatography coupled with quadrupole-time-of-flight mass spectrometry. Molecules 2019, 24, 942. [Google Scholar] [CrossRef] [Green Version]
  62. Huang, J.; Sun, J.; Li, W.-X.; Wang, L.-J.; Wang, A.-X.; Huo, J.-S.; Chen, J.-S.; Chen, C.-M. Efficacy of different iron fortificants in wheat flour in controlling iron deficiency. Biomed. Environ. Sci. 2009, 22, 118–121. [Google Scholar] [CrossRef]
  63. Wang, J.; Jia, Z.; Zhang, Z.; Wang, Y.; Liu, X.; Wang, L.; Lin, R. Analysis of chemical constituents of melastoma dodecandrum lour. By uplc-esi-q-exactive focus-ms/ms. Molecules 2017, 22, 476. [Google Scholar] [CrossRef] [Green Version]
  64. Jakobek, L.; Šeruga, M.; Novak, I.; Medvidović-Kosanović, M. Flavonols, phenolic acids and antioxidant activity of some red fruits. Deutsche Lebensmittel-Rundschau: Zeitschrift für Lebensmittelkunde und Lebensmittelrecht 2007, 103, 369. [Google Scholar]
  65. Reed, K.A. Identification of Phenolic Compounds from Peanut Skin Using hplc-msn; Virginia Tech: Blacksburg, VA, USA, 2009. [Google Scholar]
  66. Lv, Q.; Luo, F.; Zhao, X.; Liu, Y.; Hu, G.; Sun, C.; Li, X.; Chen, K. Identification of proanthocyanidins from litchi (litchi chinensis sonn.) pulp by lc-esi-q-tof-ms and their antioxidant activity. PLoS ONE 2015, 10, e0120480. [Google Scholar] [CrossRef] [Green Version]
  67. Carvalho, E.; Franceschi, P.; Feller, A.; Palmieri, L.; Wehrens, R.; Martens, S. A targeted metabolomics approach to understand differences in flavonoid biosynthesis in red and yellow raspberries. Plant Physiol. Biochem. 2013, 72, 79–86. [Google Scholar] [CrossRef]
  68. Zalke, A.S. Investigations of Anticancer Activity of Ethanol Extract Fractions of Cardiospermum Halicacabum Linn and Combretum Albidum G Don; JSS University: Mysuru, India, 2014. [Google Scholar]
  69. Li, W.; Beta, T. Food Sources of Phenolics Compounds; Springer: Berlin/Heidelberg, Germany, 2013. [Google Scholar]
  70. Zeng, X.; Su, W.; Zheng, Y.; Liu, H.; Li, P.; Zhang, W.; Liang, Y.; Bai, Y.; Peng, W.; Yao, H. Uflc-q-tof-ms/ms-based screening and identification of flavonoids and derived metabolites in human urine after oral administration of exocarpium citri grandis extract. Molecules 2018, 23, 895. [Google Scholar] [CrossRef] [Green Version]
  71. Gattuso, G.; Barreca, D.; Gargiulli, C.; Leuzzi, U.; Caristi, C. Flavonoid composition of citrus juices. Molecules 2007, 12, 1641–1673. [Google Scholar] [CrossRef] [PubMed] [Green Version]
  72. Riethmüller, E.; Tóth, G.; Alberti, Á.; Végh, K.; Burlini, I.; Könczöl, Á.; Balogh, G.T.; Kéry, Á. First characterisation of flavonoid-and diarylheptanoid-type antioxidant phenolics in corylus maxima by hplc-dad-esi-ms. J. Pharm. Biomed. Anal. 2015, 107, 159–167. [Google Scholar] [CrossRef] [PubMed]
  73. Serreli, G.; Jerković, I.; Gil, K.A.; Marijanović, Z.; Pacini, V.; Tuberoso, C.I.G. Phenolic compounds, volatiles and antioxidant capacity of white myrtle berry liqueurs. Plant Foods Human Nutr. 2017, 72, 205–210. [Google Scholar] [CrossRef] [PubMed]
  74. Long, W.X.; Ye, Z.; Ping, W.; Zhen, X.W.; Zhuang, W.J.; Chong, L.H.; Qiong, L.H. Rapid separation and identification of multiple constituents in vine tea by uflc system coupled with q-tof-ms/ms. J. Pharm. Sci. Innov. 2015, 4, 120–126. [Google Scholar] [CrossRef]
  75. Martucci, M.E.P.; De Vos, R.C.; Carollo, C.A.; Gobbo-Neto, L. Metabolomics as a potential chemotaxonomical tool: Application in the genus vernonia schreb. PLoS ONE 2014, 9, e93149. [Google Scholar] [CrossRef] [Green Version]
  76. Frond, A.D.; Iuhas, C.I.; Stirbu, I.; Leopold, L.; Socaci, S.; Andreea, S.; Ayvaz, H.; Andreea, S.; Mihai, S.; Diaconeasa, Z.J.M. Phytochemical characterization of five edible purple-reddish vegetables: Anthocyanins, flavonoids, and phenolic acid derivatives. Molecules 2019, 24, 1536. [Google Scholar] [CrossRef] [Green Version]
  77. Kelebek, H.; Kadiroğlu, P.; Demircan, N.B.; Selli, S. Screening of bioactive components in grape and apple vinegars: Antioxidant and antimicrobial potential. J. Inst. Brew. 2017, 123, 407–416. [Google Scholar] [CrossRef] [Green Version]
  78. Boyer, J.; Liu, R.H. Apple phytochemicals and their health benefits. Nutr. J. 2004, 3, 5. [Google Scholar] [CrossRef] [Green Version]
  79. Tsao, R.; Yang, R. Optimization of a new mobile phase to know the complex and real polyphenolic composition: Towards a total phenolic index using high-performance liquid chromatography. J. Chromatogr. A 2003, 1018, 29–40. [Google Scholar] [CrossRef]
  80. Chen, G.; Li, X.; Saleri, F.; Guo, M. Analysis of flavonoids in rhamnus davurica and its antiproliferative activities. Molecules 2016, 21, 1275. [Google Scholar] [CrossRef]
  81. Suh, D.H.; Jung, E.S.; Lee, G.M.; Lee, C.H. Distinguishing six edible berries based on metabolic pathway and bioactivity correlations by non-targeted metabolite profiling. Front. Plant Sci. 2018, 9, 1462. [Google Scholar] [CrossRef] [PubMed] [Green Version]
  82. D’Archivio, M.; Filesi, C.; Di Benedetto, R.; Gargiulo, R.; Giovannini, C.; Masella, R. Polyphenols, dietary sources and bioavailability. Annali-Istituto Superiore di Sanita 2007, 43, 348. [Google Scholar]
  83. Bravo, L. Polyphenols: Chemistry, dietary sources, metabolism, and nutritional significance. Nutr. Rev. 1998, 56, 317–333. [Google Scholar] [CrossRef] [PubMed]
  84. Liu, Y.; Tikunov, Y.; Schouten, R.E.; Marcelis, L.F.; Visser, R.G.; Bovy, A. Anthocyanin biosynthesis and degradation mechanisms in solanaceous vegetables: A review. Front. Chem. 2018, 6, 52. [Google Scholar] [CrossRef] [PubMed]
  85. Evans, W.C.; Evans, D. Chapter 21—Phenols and phenolic glycosides. In Trease and Evans’ Pharmacognosy, 16th ed.; Evans, W.C., Evans, D., Eds.; Elsevier: Amsterdam, The Netherlands, 2009; pp. 219–262. [Google Scholar]
  86. Li, Z.; Zhang, X.; Liao, J.; Fan, X.; Cheng, Y. An ultra-robust fingerprinting method for quality assessment of traditional chinese medicine using multiple reaction monitoring mass spectrometry. J. Pharm. Anal. 2020, in press. [Google Scholar] [CrossRef]
  87. Deesamer, S.; Kokpol, U.; Chavasiri, W.; Douillard, S.; Peyrot, V.; Vidal, N.; Combes, S.; Finet, J.-P. Synthesis and biological evaluation of isoflavone analogues from dalbergia oliveri. Tetrahedron 2007, 63, 12986–12993. [Google Scholar] [CrossRef]
  88. Hussain, F.; Jahan, N.; Rahman, K.-u.; Sultana, B.; Jamil, S. Identification of hypotensive biofunctional compounds of coriandrum sativum and evaluation of their angiotensin-converting enzyme (ace) inhibition potential. Oxid. Med. Cell Longev. 2018, 2018. [Google Scholar] [CrossRef] [Green Version]
  89. Zeng, Y.; Lu, Y.; Chen, Z.; Tan, J.; Bai, J.; Li, P.; Wang, Z.; Du, S. Rapid characterization of components in bolbostemma paniculatum by uplc/ltq-orbitrap msn analysis and multivariate statistical analysis for herb discrimination. Molecules 2018, 23, 1155. [Google Scholar] [CrossRef] [Green Version]
  90. Javeri, I.; Chand, N. Chapter 31—Curcumin. In Nutraceuticals; Gupta, R.C., Ed.; Academic Press: Boston, MA, USA, 2016; pp. 435–445. [Google Scholar]
  91. Ouyang, H.; Li, T.; He, M.; Li, Z.; Tan, T.; Zhang, W.; Li, Y.; Feng, Y.; Yang, S. Identification and quantification analysis on the chemical constituents from traditional mongolian medicine flos scabiosae using uhplc–dad–q-tof-ms combined with uhplc–qqq-ms. J. Chromatogr. Sci. 2016, 54, 1028–1036. [Google Scholar] [CrossRef] [Green Version]
  92. Ancillotti, C.; Ciofi, L.; Pucci, D.; Sagona, E.; Giordani, E.; Biricolti, S.; Gori, M.; Petrucci, W.A.; Giardi, F.; Bartoletti, R.; et al. Polyphenolic profiles and antioxidant and antiradical activity of italian berries from vaccinium myrtillus l. and vaccinium uliginosum l. Subsp. Gaultherioides (bigelow) s.B. Young. Food Chem. 2016, 204, 176–184. [Google Scholar]
  93. Xu, L.; Liu, Y.; Wu, H.; Wu, H.; Liu, X.; Zhou, A. Rapid identification of chemical profile in gandou decoction by uplc-q-tof-mse coupled with novel informatics unifi platform. J. Pharm. Anal. 2020, 10, 35–48. [Google Scholar] [CrossRef] [PubMed]
  94. Yang, S.; Shan, L.; Luo, H.; Sheng, X.; Du, J.; Li, Y. Rapid classification and identification of chemical components of schisandra chinensis by uplc-q-tof/ms combined with data post-processing. Molecules 2017, 22, 1778. [Google Scholar] [CrossRef] [PubMed] [Green Version]
  95. Wang, M.; Wu, Q.-L.; Tadmor, Y.; Simon, J.E.; Sang, S.; Ho, C.-T. Schisandra chinensis: Chemistry and analysis. In Oriental Foods and Herbs; American Chemical Society: Washington, DC, USA, 2003; Volume 859, pp. 234–246. [Google Scholar]
  96. Lee, K.; Ahn, J.-H.; Lee, K.-T.; Jang, D.S.; Choi, J.-H. Deoxyschizandrin, isolated from schisandra berries, induces cell cycle arrest in ovarian cancer cells and inhibits the protumoural activation of tumour-associated macrophages. Nutrients 2018, 10, 91. [Google Scholar] [CrossRef] [PubMed] [Green Version]
  97. Tylewicz, U.; Nowacka, M.; Martín-García, B.; Wiktor, A.; Caravaca, A.M.G. Target sources of polyphenols in different food products and their processing by-products. In Polyphenols: Properties, Recovery, and Applications; Elsevier: Amsterdam, The Netherlands, 2018; pp. 135–175. [Google Scholar]
  98. Zorzi, M.; Gai, F.; Medana, C.; Aigotti, R.; Morello, S.; Peiretti, P.G. Bioactive compounds and antioxidant capacity of small berries. Foods 2020, 9, 623. [Google Scholar] [CrossRef]
  99. De Souza, V.R.; Pereira, P.A.P.; da Silva, T.L.T.; de Oliveira Lima, L.C.; Pio, R.; Queiroz, F. Determination of the bioactive compounds, antioxidant activity and chemical composition of brazilian blackberry, red raspberry, strawberry, blueberry and sweet cherry fruits. Food Chem. 2014, 156, 362–368. [Google Scholar] [CrossRef] [Green Version]
  100. Croge, C.P.; Cuquel, F.L.; Pintro, P.T.; Biasi, L.A.; De Bona, C.M.J.H. Antioxidant capacity and polyphenolic compounds of blackberries produced in different climates. 2019, 54, 2209–2213. HortScience 2019, 54, 2209–2213. [Google Scholar] [CrossRef]
  101. Skrovankova, S.; Sumczynski, D.; Mlcek, J.; Jurikova, T.; Sochor, J. Bioactive compounds and antioxidant activity in different types of berries. Int. J. Mol. Sci. 2015, 16, 24673–24706. [Google Scholar] [CrossRef] [Green Version]
  102. Padmanabhan, P.; Mizran, A.; Sullivan, J.A.; Paliyath, G. Strawberries. In Encyclopedia of Food and Health; Caballero, B., Finglas, P.M., Toldrá, F., Eds.; Academic Press: Oxford, UK, 2016; pp. 193–198. [Google Scholar]
  103. Sellappan, S.; Akoh, C.C.; Krewer, G. Phenolic compounds and antioxidant capacity of georgia-grown blueberries and blackberries. J. Agric. Food Chem. 2002, 50, 2432–2438. [Google Scholar] [CrossRef]
  104. Diaconeasa, Z.; Florica, R.; Rugină, D.; Cuibus, L.; Socaciu, C. Hplc/pda–esi/ms identification of phenolic acids, flavonol glycosides and antioxidant potential in blueberry, blackberry, raspberries and cranberries. J. Food Nutr. Res. 2014, 2, 781–785. [Google Scholar] [CrossRef] [Green Version]
  105. Amakura, Y.; Umino, Y.; Tsuji, S.; Tonogai, Y. Influence of jam processing on the radical scavenging activity and phenolic content in berries. J. Agric. Food Chem. 2000, 48, 6292–6297. [Google Scholar] [CrossRef]
  106. Häkkinen, S.H.; Kärenlampi, S.O.; Heinonen, I.M.; Mykkänen, H.M.; Törrönen, A.R.J.J.o.t.S.o.F.; Agriculture. Hplc method for screening of flavonoids and phenolic acids in berries. J. Sci. Food Agric. 1998, 77, 543–551. [Google Scholar] [CrossRef]
  107. Häkkinen, S.H.; Törrönen, A.R. Content of flavonols and selected phenolic acids in strawberries and vaccinium species: Influence of cultivar, cultivation site and technique. Food Res. Int. 2000, 33, 517–524. [Google Scholar] [CrossRef]
Figure 1. Venn diagram of phenolic compounds presented in different fruit berries. (A) shows the relations of total phenolic compounds present in different berries samples (B) shows the relations of phenolic acids among the berries. (C) shows the relations of flavonoids present in berry samples (D) shows the relations of other phenolic compounds present in different berry samples.
Antioxidants 10 00026 g001
Figure 2. Heatmap showing phenolic compounds’ distribution and concentration among four samples of berries. Darker brown boxes mean concentrations are higher among different berries samples. Blue boxes mean lower concentrations. PA: phenolic acids; FL: flavonoids; FB 1–4: fruit berries; PC 1–4: phenolic compound clusters.
Antioxidants 10 00026 g002
Table 1. Estimation of phenolic content and antioxidant activity present in berries.
Antioxidant AssaysBlueberriesStrawberriesBlackberriesRaspberries
TPC (mg GAE/g)2.93 ± 0.07 a1.92 ± 0.07 b1.81 ± 0.08 c1.52 ± 0.12 d
TFC (µg QE/g)70.31 ± 1.21 a14.31 ± 0.13 d30.12 ± 0.13 b22.98 ± 0.07 c
TTC (mg CE/g)7.41 ± 0.09 b2.37 ± 0.09 c11.32 ± 0.13 a0.97 ± 0.13 d
DPPH (mg AAE/g)1.69 ± 0.09 a1.11 ± 0.12 c1.12 ± 0.07 c1.41 ± 0.11 b
FRAP (µg AAE/g)367.43 ± 3.09 a121.51 ± 2.10 c294.24 ± 3.20 b93.14 ± 1.76 d
ABTS (mg AAE/g)2.32 ± 0.09 b3.67 ± 0.14 a1.73 ± 0.04 c1.71 ± 0.11 c
TAC (mg AAE/g)1.47 ± 0.20 a0.97 ± 0.09 d1.03 ± 0.09 c1.21 ± 0.01 b
The data shown in the table as mean ± standard deviation (n = 3); Lettering (a,b,c,d) indicated the significant difference in the means (p < 0.05) using a one-way analysis of variance (ANOVA) and Tukey’s HSD test. GAE: gallic acid equivalents; QE: quercetin equivalents; CE: catechin equivalents; AAE: ascorbic acid equivalents; TPC: Total phenolic content; TFC: total flavonoid content; TTC: total tannin content; DPPH: 2,2′-diphenyl-1-picrylhydrazyl; FRAP: ferric reducing antioxidant power, ABTS: 2,2′-azinobis-(3-ethylbenzo-thiazoline-6-sulfonic acid; TAC: total antioxidant content.
Table 2. Characterization of phenolic compounds in different Berries by LC-ESI-QTOF-MS/MS.
No.Proposed CompoundsMolecular FormulaRT (min)Ionization (ESI+/ESI)Molecular WeightTheoretical (m/z)Observed (m/z)Error (ppm)MS2 Product IonsBerries
Phenolic acid
Hydroxybenzoic acids
1Gallic acidC7H6O56.956** [M − H]170.0215169.0142169.01483.5125* STRB
2Gallic acid 4-O-glucosideC13H16O1010.236[M − H]332.0743331.0670331.0655−4.5169, 125* STRB, BLKB
32-Hydroxybenzoic acidC7H6O310.932** [M − H]138.0317137.0244137.02472.293* STRB, RASB, BLUB
4Protocatechuic acid 4-O-glucosideC13H16O912.539** [M − H]316.0794315.0721315.0707−4.4153* STRB
52,3-Dihydroxybenzoic acidC7H6O414.394[M − H]154.0266153.0193153.01983.3109* STRB
63-O-Methylgallic acidC8H8O514.529** [M + H]+184.0372185.0445185.04471.1170, 142* RASB, STRB, BLUB
73,4-O-Dimethylgallic acidC9H10O538.894** [M + H]+198.0528199.0601199.0596−2.5153, 139, 125, 111* RASB, BLUB, BLKB
8PaeoniflorinC23H28O1158.033** [M − H]480.1632479.1559479.15773.8449, 357, 327* RASB
Hydroxycinnamic acids
91,5-Dicaffeoylquinic acidC25H24O124.106** [M − H]516.1268515.1195515.11980.6353, 335, 191, 179* STRB, RASB, BLUB
103-Feruloylquinic acidC17H20O94.653** [M − H]368.1107367.1034367.10381.1298, 288, 192, 191* STRB, RASB
11Ferulic acidC10H10O44.821** [M − H]194.0579193.0506193.05112.6178, 149, 134* RASB
123-Caffeoylquinic acidC16H18O94.852** [M − H]354.0951353.0878353.08841.7253, 190, 144* STRB, RASB
13Ferulic acid 4-O-glucuronideC16H18O1023.672** [M − H]370.0900369.0827369.0810−4.6193* STRB, BLUB
14Caffeic acidC9H8O428.724** [M − H]180.0423179.0350179.0349−0.6143, 133* STRB
151,2,2′-TriferuloylgentiobioseC42H46O2031.127** [M − H]870.2582869.2509869.2506−0.3693, 517* STRB
16m-Coumaric acidC9H8O335.682** [M − H]164.0473163.0400163.0392−4.9119* STRB, RASB, BLUB, BLKB
Hydroxyphenylacetic acids
173,4-Dihydroxyphenylacetic acidC8H8O413.450** [M − H]168.0423167.0350167.0344−1.8149, 123* STRB
182-Hydroxy-2-phenylacetic acidC8H8O340.106** [M − H]152.0473151.0400151.0394−4.0136, 92* STRB
Hydroxyphenylpropanoic acids
19Dihydrocaffeic acid 3-O-glucuronideC15H18O1012.340[M − H]358.0900357.0827357.0818−2.5181* STRB
Flavonoids
Flavanols
20(-)-EpigallocatechinC15H14O74.804** [M − H]306.0740305.0667305.06793.9261, 219* RASB, STRB
213′-O-MethylcatechinC16H16O611.736** [M − H]304.0947303.0874303.0873−0.3271, 163* BLUB
22Procyanidin dimer B1C30H26O1219.047** [M − H]578.1424577.1351577.1324−4.7451* STRB, RASB, BLUB
23Prodelphinidin dimer B3C30H26O1443.974** [M + H]+610.1323611.1396611.14092.1469, 311, 291* STRB, BLUB, BLKB
Flavones
24Apigenin 7-O apiosylglucosideC26H28O1432.285** [M + H]+564.1479565.1552565.1528−4.2296* RASB
25Chrysoeriol 7-O-glucosideC22H22O1135.368** [M + H]+462.1162463.1235463.1228−1.5445, 427, 409, 381* BLKB
Flavanones
26NeoeriocitrinC27H32O1513.168** [M − H]596.1741595.1668595.16741.0431, 287* STRB, RASB, BLKB
27NarirutinC27H32O1438.326** [M − H]580.1792579.1719579.1707−2.1271* STRB
28HesperidinC28H34O1544.090[M + H]+610.1898611.1971611.19811.6593, 465, 449, 303* STRB, BLUB, RASB
Flavonols
29Myricetin 3-O-rhamnosideC21H20O1211.810** [M − H]464.0955463.0882463.08932.4317* STRB
30Myricetin 3-O-galactosideC21H20O1312.754[M − H]480.0904479.0831479.08412.1317* STRB, BLUB
31Kaempferol 3-O-(2′′-rhamnosyl-galactoside) 7-O-rhamnosideC33H40O1921.217** [M − H]740.2164739.2091739.2067−3.2593, 447, 285* STRB, RASB, BLUB
32Quercetin 3-O-(6′′-malonyl-glucoside)C24H22O1525.423[M + H]+550.0959551.1032551.10381.1303* STRB
33Quercetin-3-O-xylosyl-glucuronideC26H26O1743.990** [M + H]+610.1170611.1243611.1222−3.4479, 303, 285, 239* STRB, RASB
34Kaempferol 7-O-glucosideC21H19O1186.415** [M − H]−447.0927446.0854446.0835−4.3357,327,297,285* BLKB, BLUB
Dihydrochalcones
35PhloridzinC21H24O1049.400** [M − H]436.1369435.1296435.1279−3.9273* STRB, BLUB, BLKB
Dihydroflavonols
36DihydroquercetinC15H12O712.382** [M − H]304.0583303.0510303.0508−0.7285, 275, 151* BLUB, STRB, RASB, BLKB
Anthocyanins
37Delphinidin 3-O-glucosideC21H21O1222.960** [M + H]+465.1033466.1106466.11172.4303* RASB
38Cyanidin 3,5-O-diglucosideC27H31O1626.207** [M + H]+611.1612612.1685612.17002.5449, 287* STRB, RASB, BLKB
39Peonidin 3-O-sambubioside-5-O-glucosideC33H41O2027.813** [M + H]+757.2191758.2264758.2245−2.5595, 449, 287* RASB, BLKB
404-O-Methyldelphinidin-3-O-D-glucosideC22H23O1229.100[M + H]+479.1190480.1263480.1248−3.1317, 303, 285, 271* STRB
41Isopeonidin 3-O-arabinosideC21H21O1032.685[M + H]+433.1135434.1208434.1196−2.8271, 253, 243* BLUB, BLKB
42Pelargonidin 3-O-rutinosideC27H31O1434.025[M + H]+579.1714580.1787580.17941.2271, 433* BLUB, STRB, RASB
43Cyanidin 3-O-(6′′-p-coumaroyl-glucoside)C30H27O1350.086** [M + H]+595.1452596.1525596.1519−1.0287* STRB, RASB, BLUB, BLKB
Isoflavonoids
442-Dehydro-O-desmethylangolensinC15H12O44.554[M − H]256.0736255.0663255.0657−2.4135, 119* STRB, BLUB
45ViolanoneC17H16O612.572** [M − H]316.0947315.0874315.0872−0.6300, 285, 135* STRB, RASB, BLUB
463′-O-MethylviolanoneC18H18O613.301[M − H]330.1103329.103329.10330.9314,299,284,256* STRB, BLUB
47EquolC15H14O314.132[M + H]+242.0943243.1016243.1015−0.4255, 211, 197* RASB
486-O-MalonylgenistinC24H22O1329.000[M + H]+518.1060519.1133519.1112−4.0271* STRB
493′-HydroxygenisteinC15H10O629.470** [M + H]+286.0477287.0550287.0547−1.0269, 259* RASB, BLUB, BLKB
513′-HydroxydaidzeinC15H10O532.205[M + H]+270.0528271.0601271.06041.1253, 241, 225* BLUB
506′′-O-MalonylglycitinC25H24O1341.082** [M + H]+532.1217533.1290533.1277−2.4285, 270, 253* BLKB, BLUB
525,6,7,3′,4′-PentahydroxyisoflavoneC15H10O744.007** [M + H]+302.0427303.0500303.05020.7285, 257* STRB, RASB, BLKB
Other polyphenols
Hydroxycoumarins
53CoumarinC9H6O226.474** [M + H]+146.0368147.0441147.0440−0.7103, 91* BLUB
54EsculetinC9H6O427.267[M − H]178.0266177.0193177.019−1.7149, 133, 89* STRB
Hydroxybenzaldehydes
55p-AnisaldehydeC8H8O213.850** [M + H]+136.0524137.0597137.06002.2122, 109* STRB, RASB
Curcuminoids
56DemethoxycurcuminC20H18O520.648[M − H]338.1154337.1081337.10913.0217* BLUB
57BisdemethoxycurcuminC19H16O433.646[M + H]+308.1049309.1122309.11230.3291, 263* BLKB
Other polyphenols
58ArbutinC12H16O74.148** [M − H]272.0896271.0823271.08240.4109* BLUB, RASB
59Lithospermic acidC27H22O1276.972[M − H]538.1111537.1038537.1035−0.6493, 339, 295* BLKB
Lignans
60PinoresinolC20H22O611.189** [M − H]358.1416357.1343357.1331−3.4342, 327, 313, 221* BLUB
61Schisandrin CC22H24O611.666[M + H]+384.1573385.1646385.16470.3370, 315, 300* BLKB
62SesaminC20H18O614.676[M − H]354.1103353.103353.10382.3338, 163* STRB, RASB
63DeoxyschisandrinC24H32O623.125[M − H]416.2199415.2126415.21464.8402, 347, 361, 301* STRB
64Schisantherin AC30H32O981.398[M + H]+536.2046537.2119537.21190.0519, 415, 385, 371* BLKB
Stilbenes
654-Hydroxy-3,5,4′-trimethoxystilbeneC17H18O444.923[M + H]+286.1205287.1278287.12873.1271, 241, 225* RASB, BLKB
* Data presented in the table are from the sample indicated with an asterisk; ** Compounds were detected in both negative [M − H] and positive [M + H]+ mode of ionization while only single mode data was presented. Berry samples mentioned in abbreviations are Strawberry “STRB”, Raspberry “RASB”, Blueberry “BLUB’’ and Blackberry “BLKB”.
Publisher’s Note: MDPI stays neutral with regard to jurisdictional claims in published maps and institutional affiliations.

