
Effect of Cooking Methods on the Antioxidant Capacity of Foods of Animal Origin Submitted to In Vitro Digestion-Fermentation

 , , ,
, , ,
Abstract
:
1. Introduction
2. Materials and Methods
2.1. Chemicals
2.1.1. In Vitro Digestion and Fermentation
2.1.2. Antioxidant Capacity
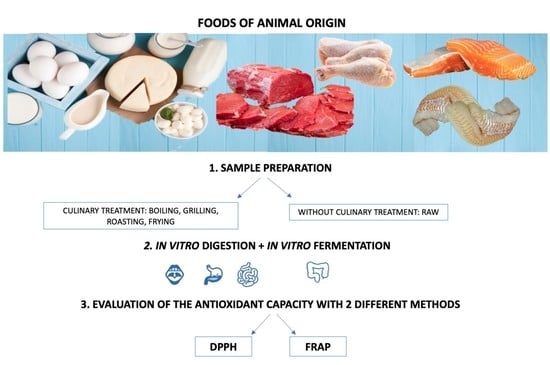
2.2. Samples and Cooking Conditions Applied
2.3. In Vitro Digestion and Fermentation
2.4. Antioxidant Test
2.5. Daily Antioxidant Intake Calculations
2.6. Statistical Analysis
3. Results
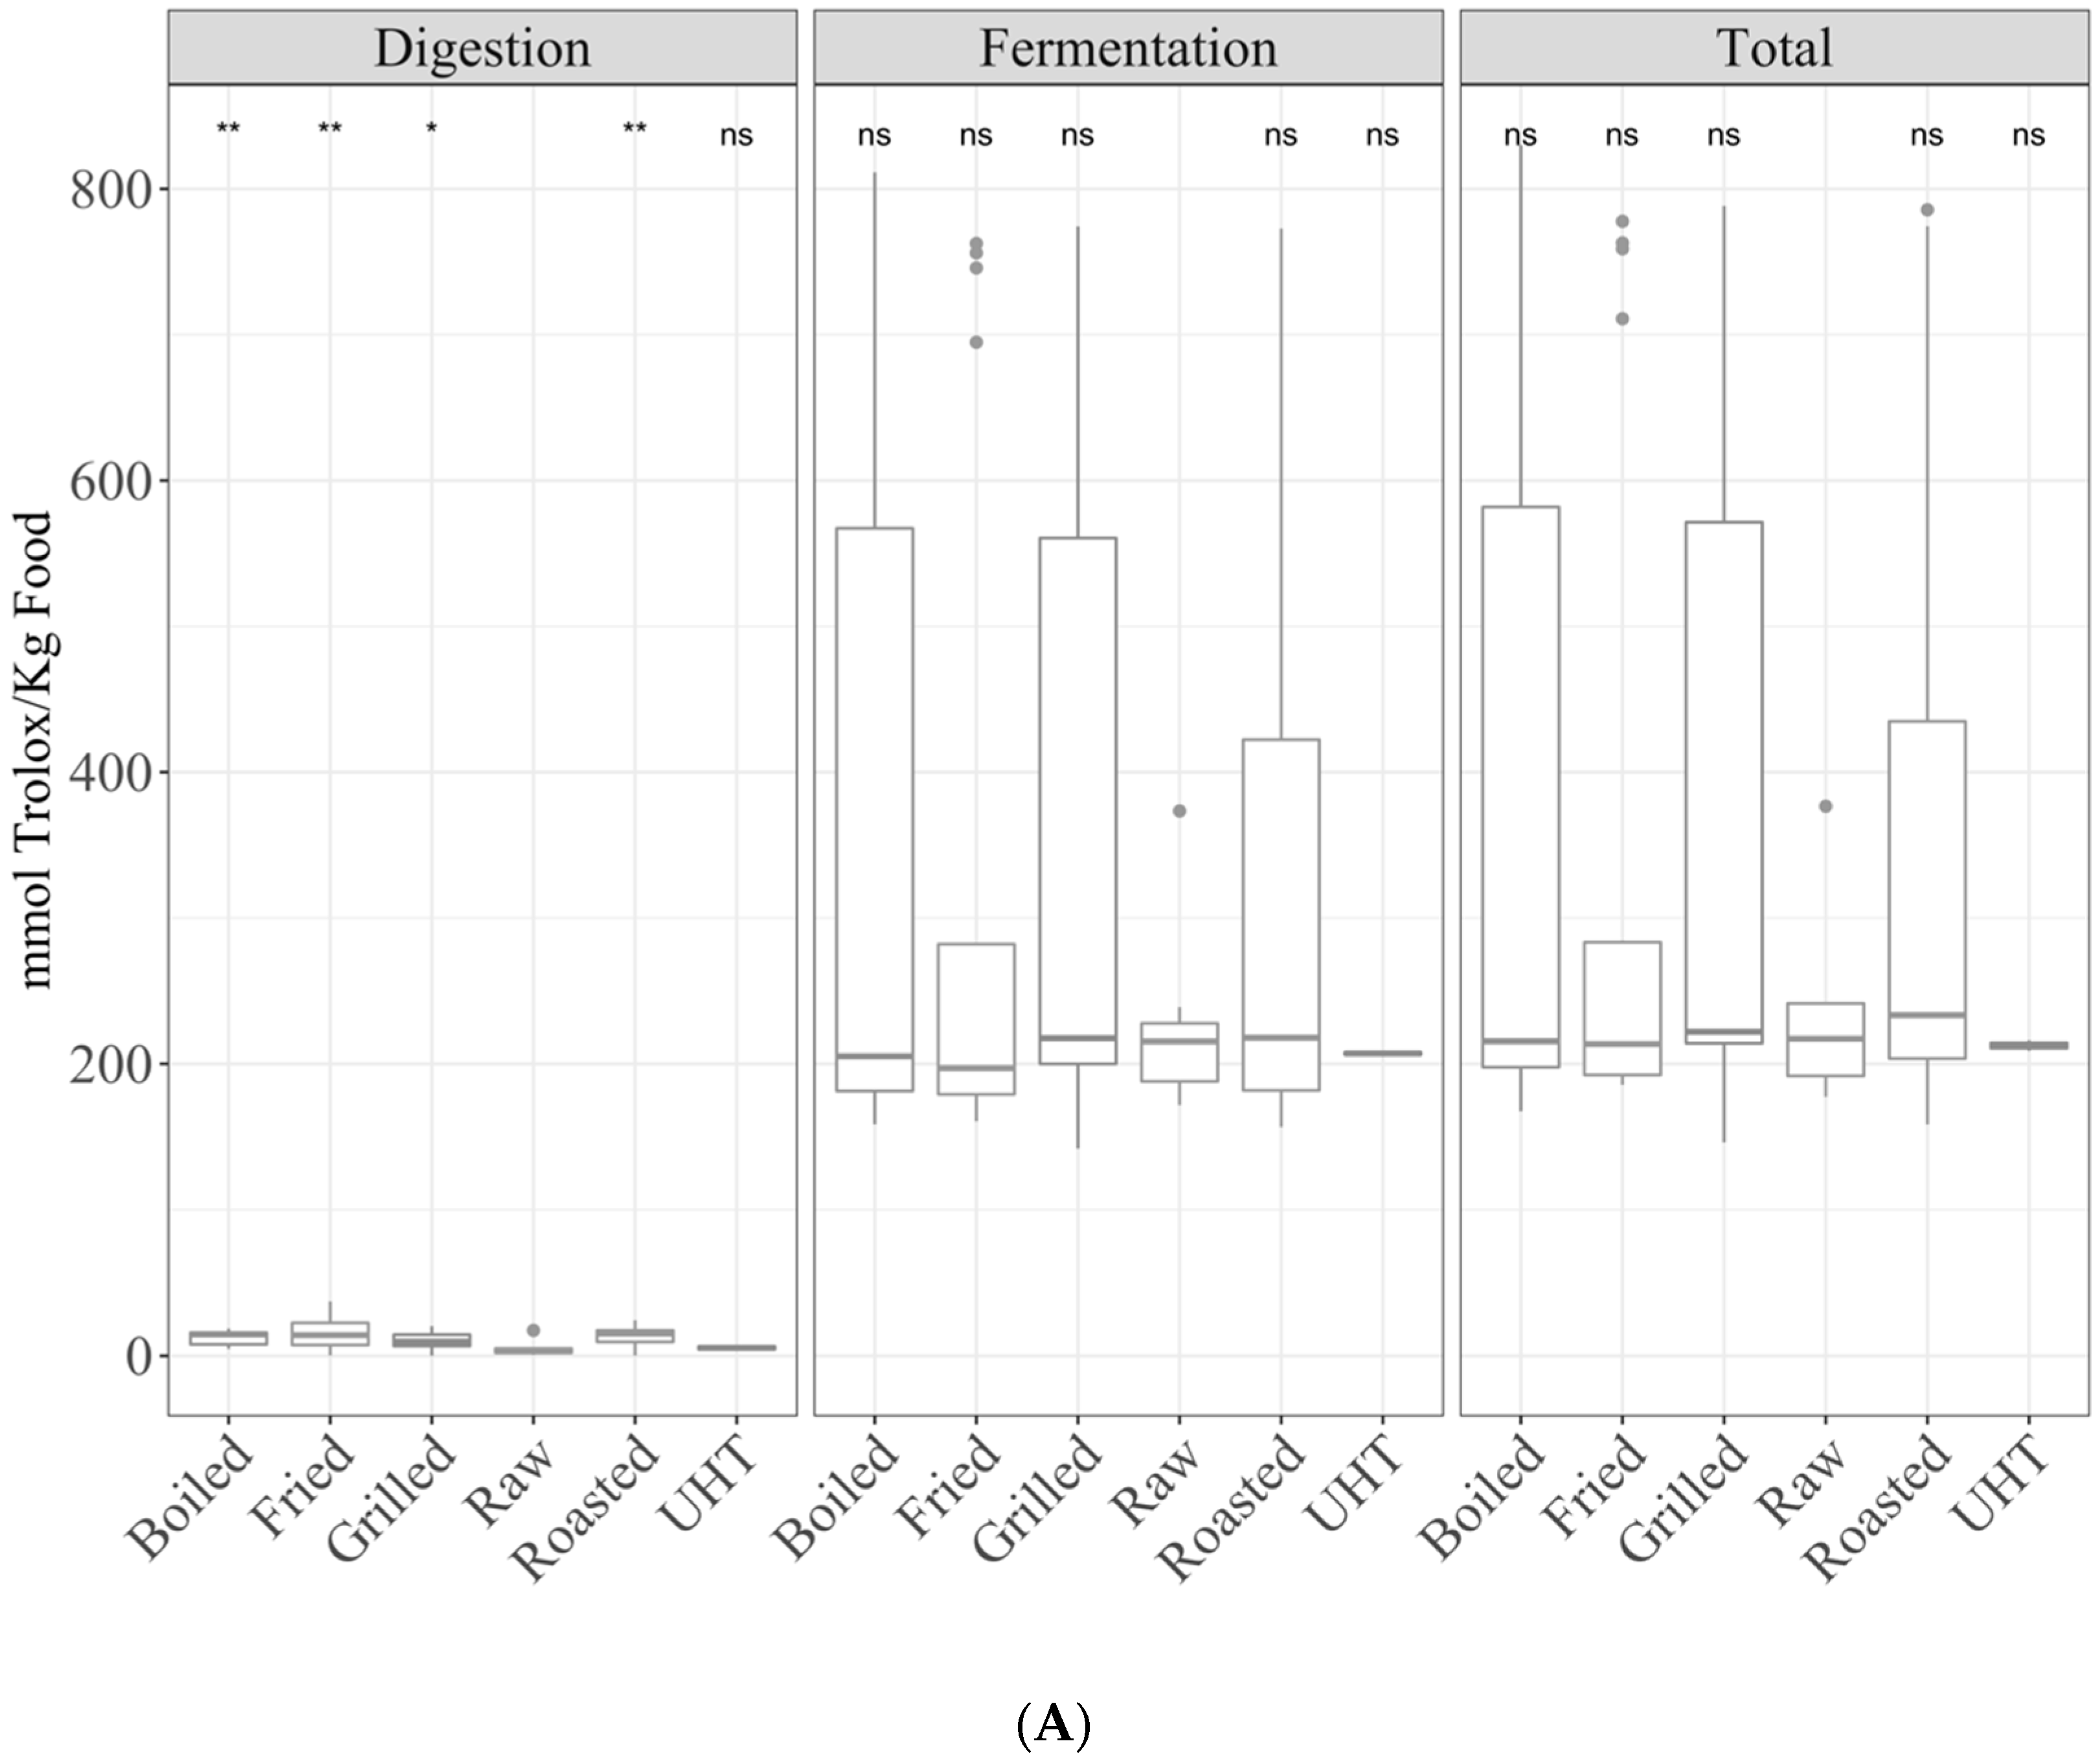
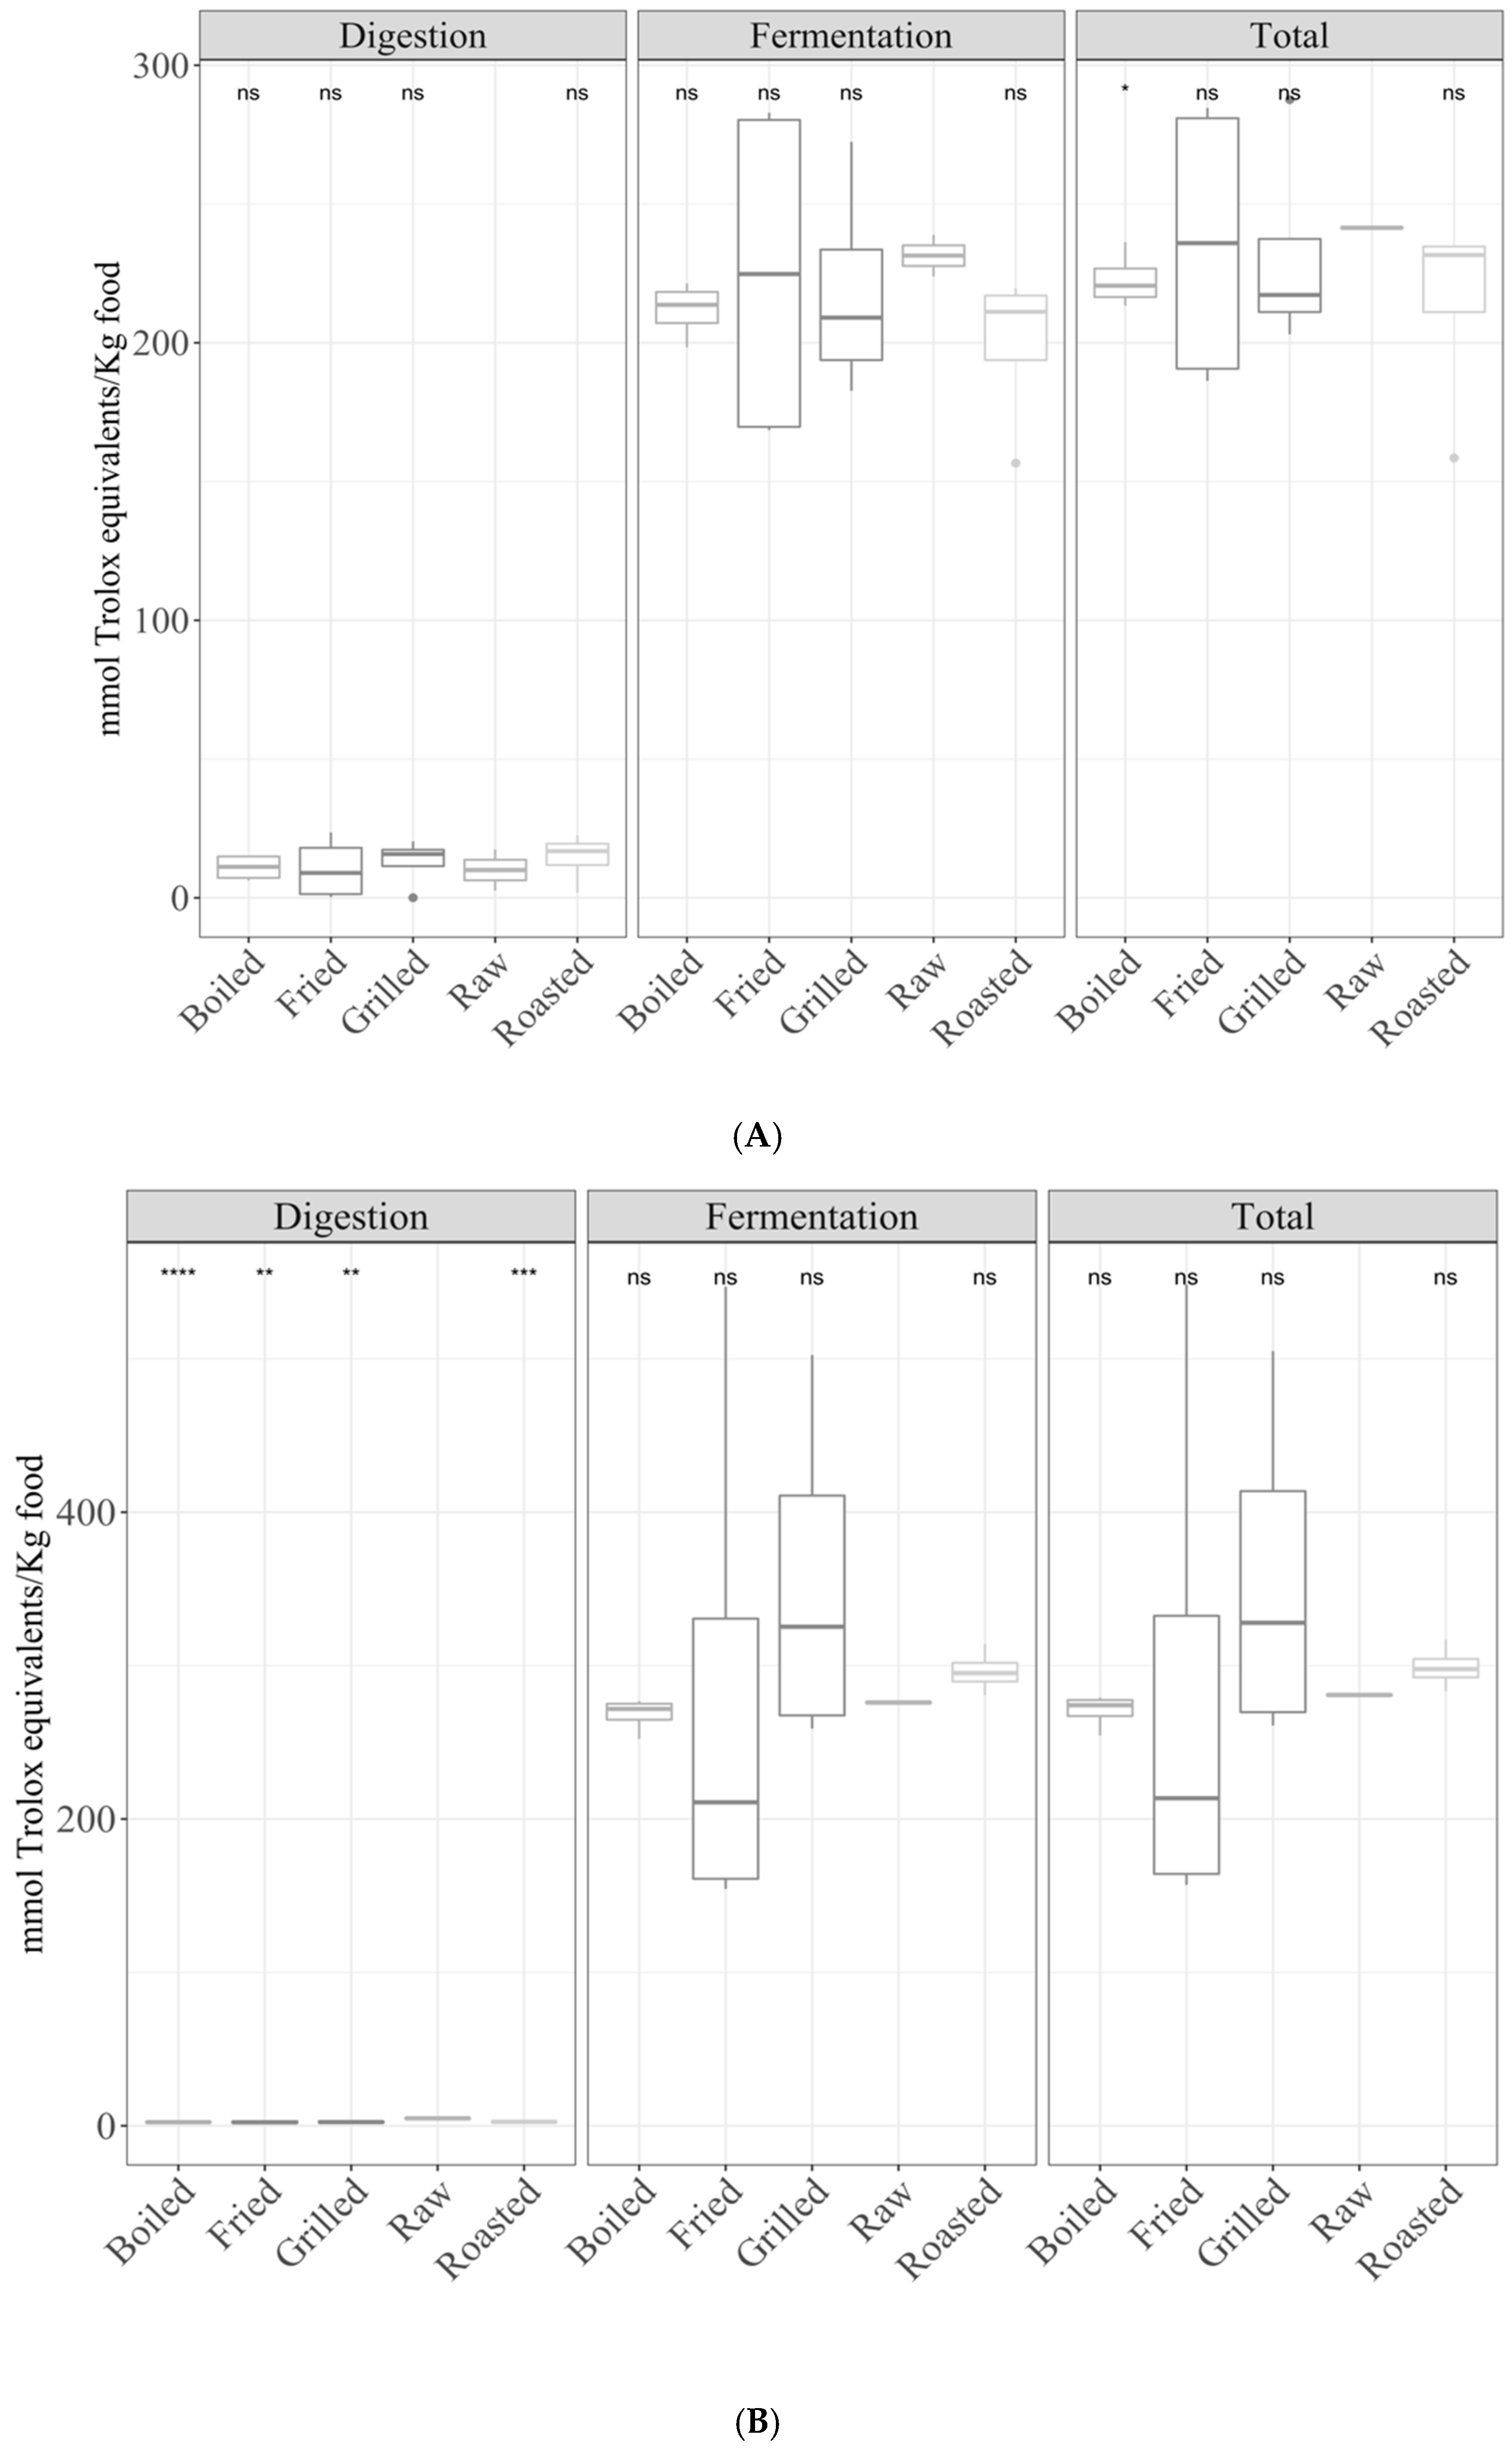
3.1. Samples by Type of Cooking
3.1.1. Gastrointestinal Digestion Supernatant
3.1.2. Fermentation Supernatant and Total Antioxidant Capacity
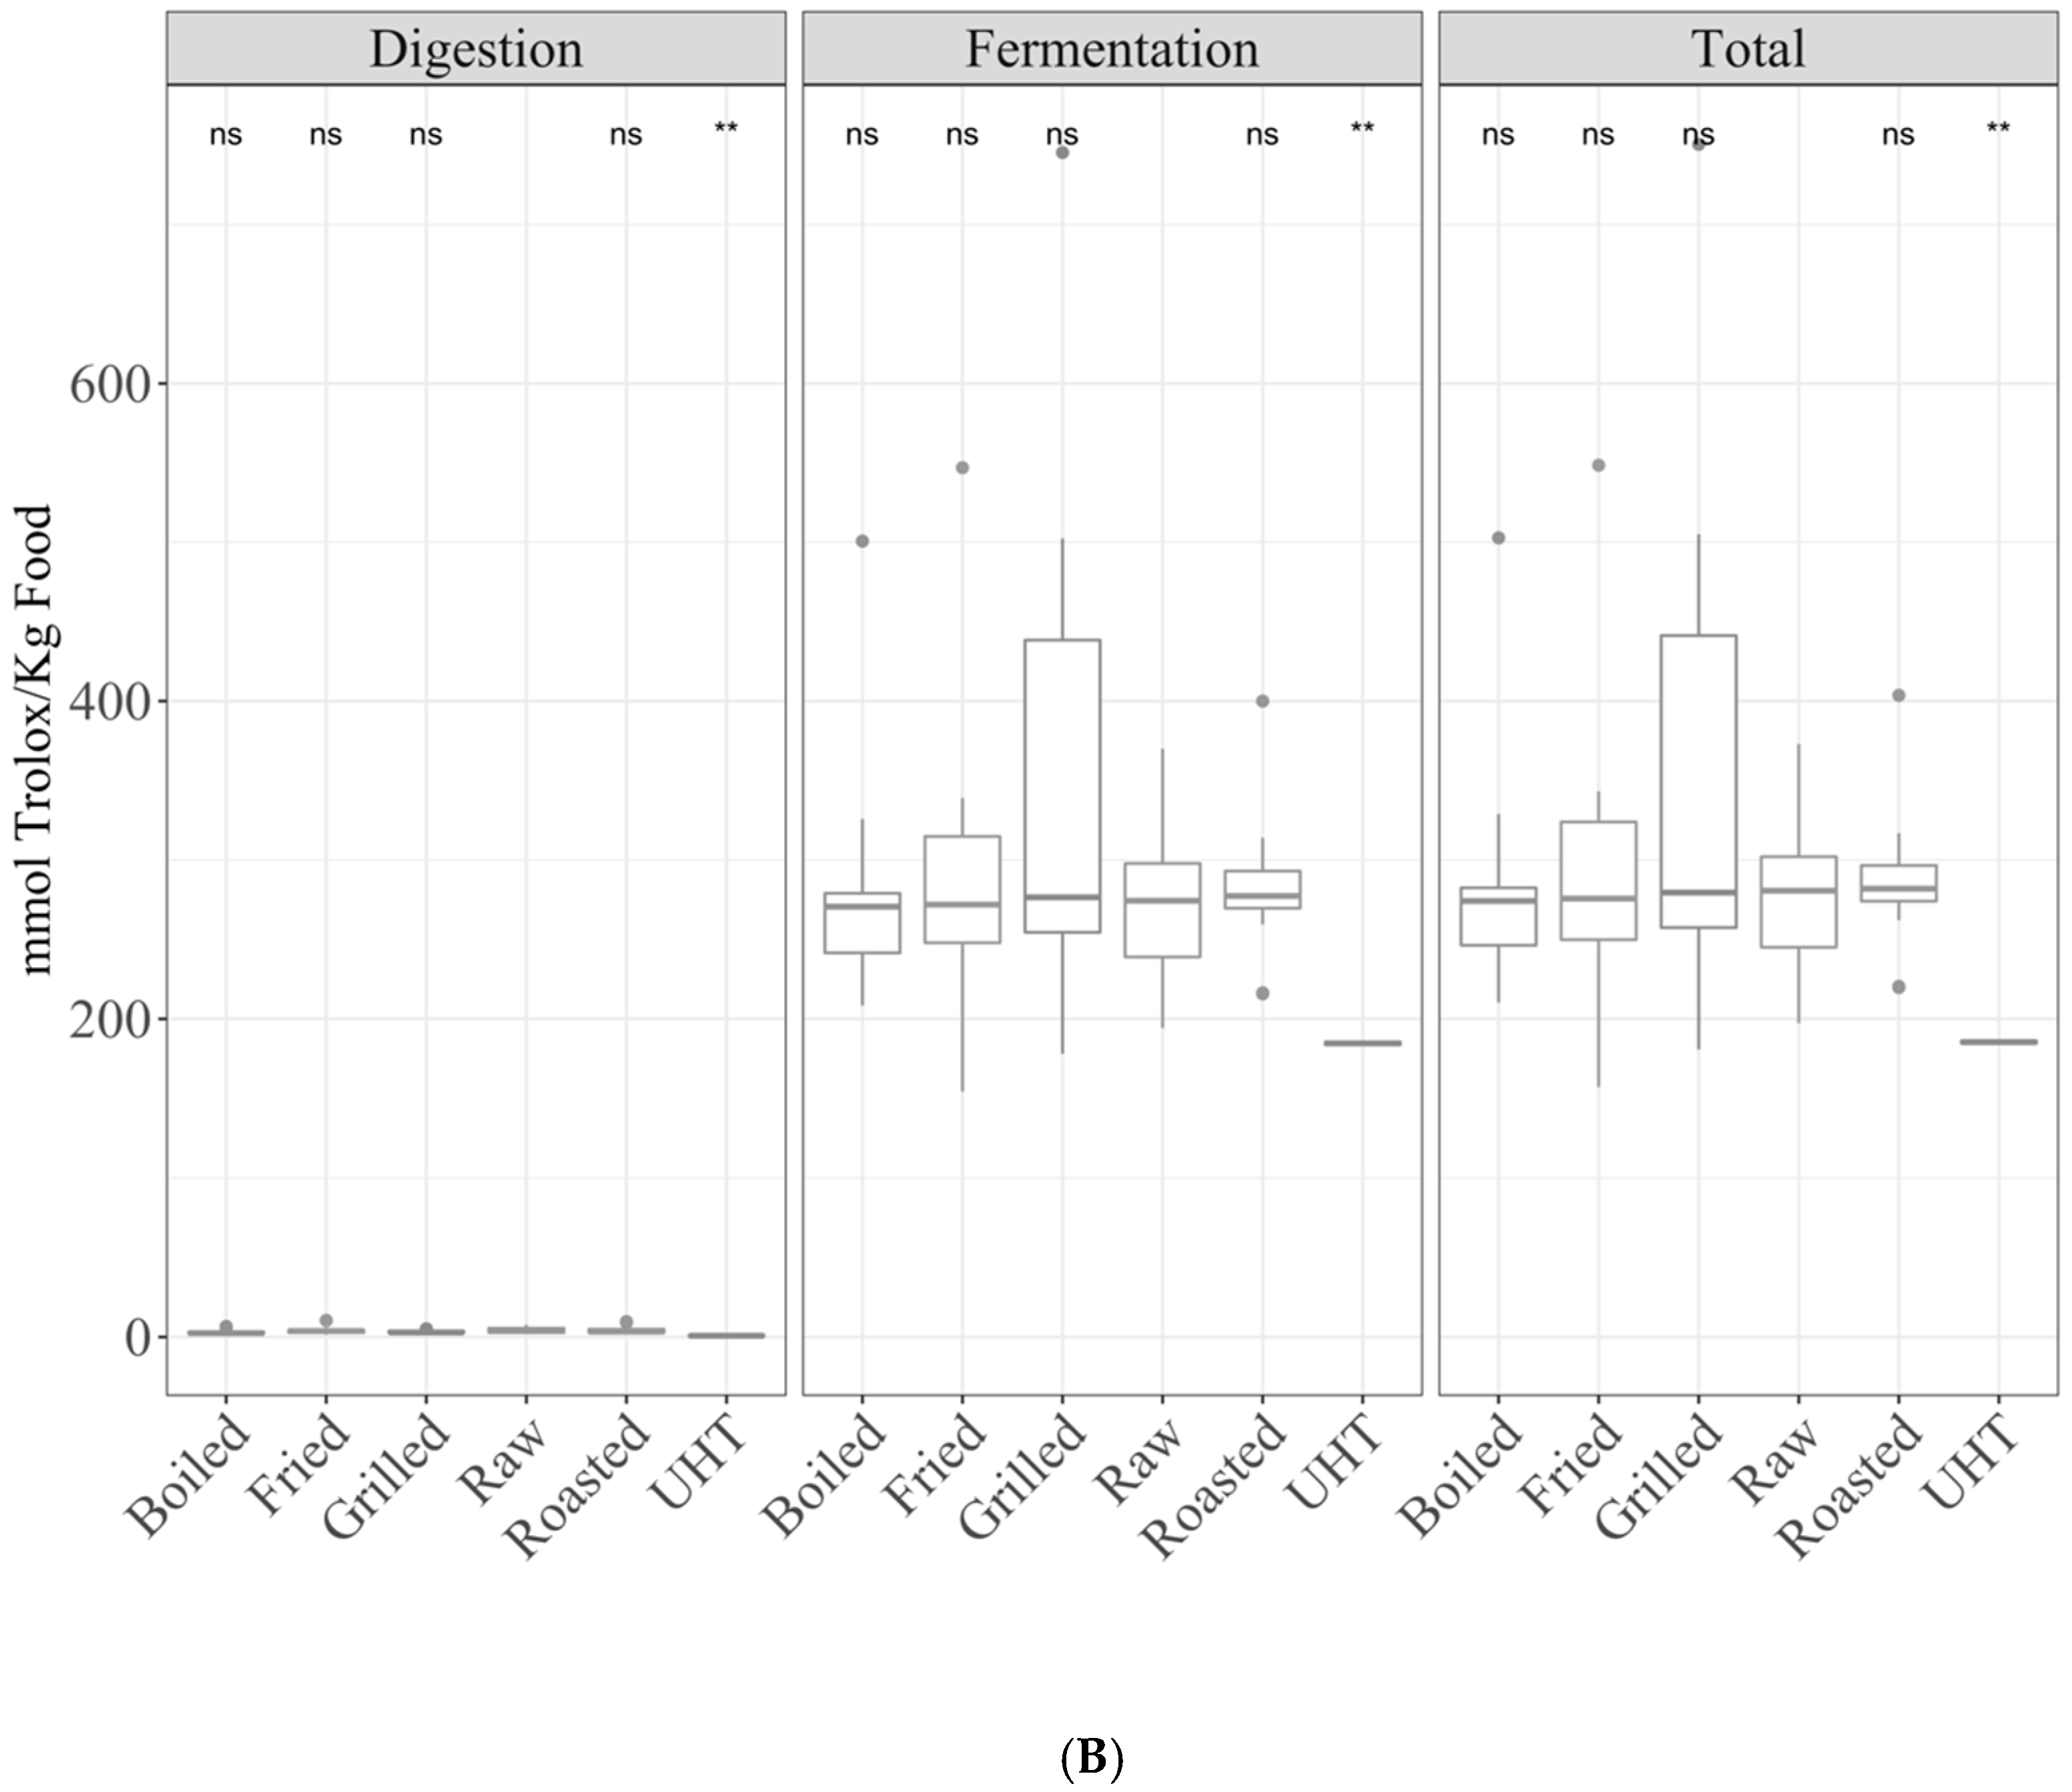
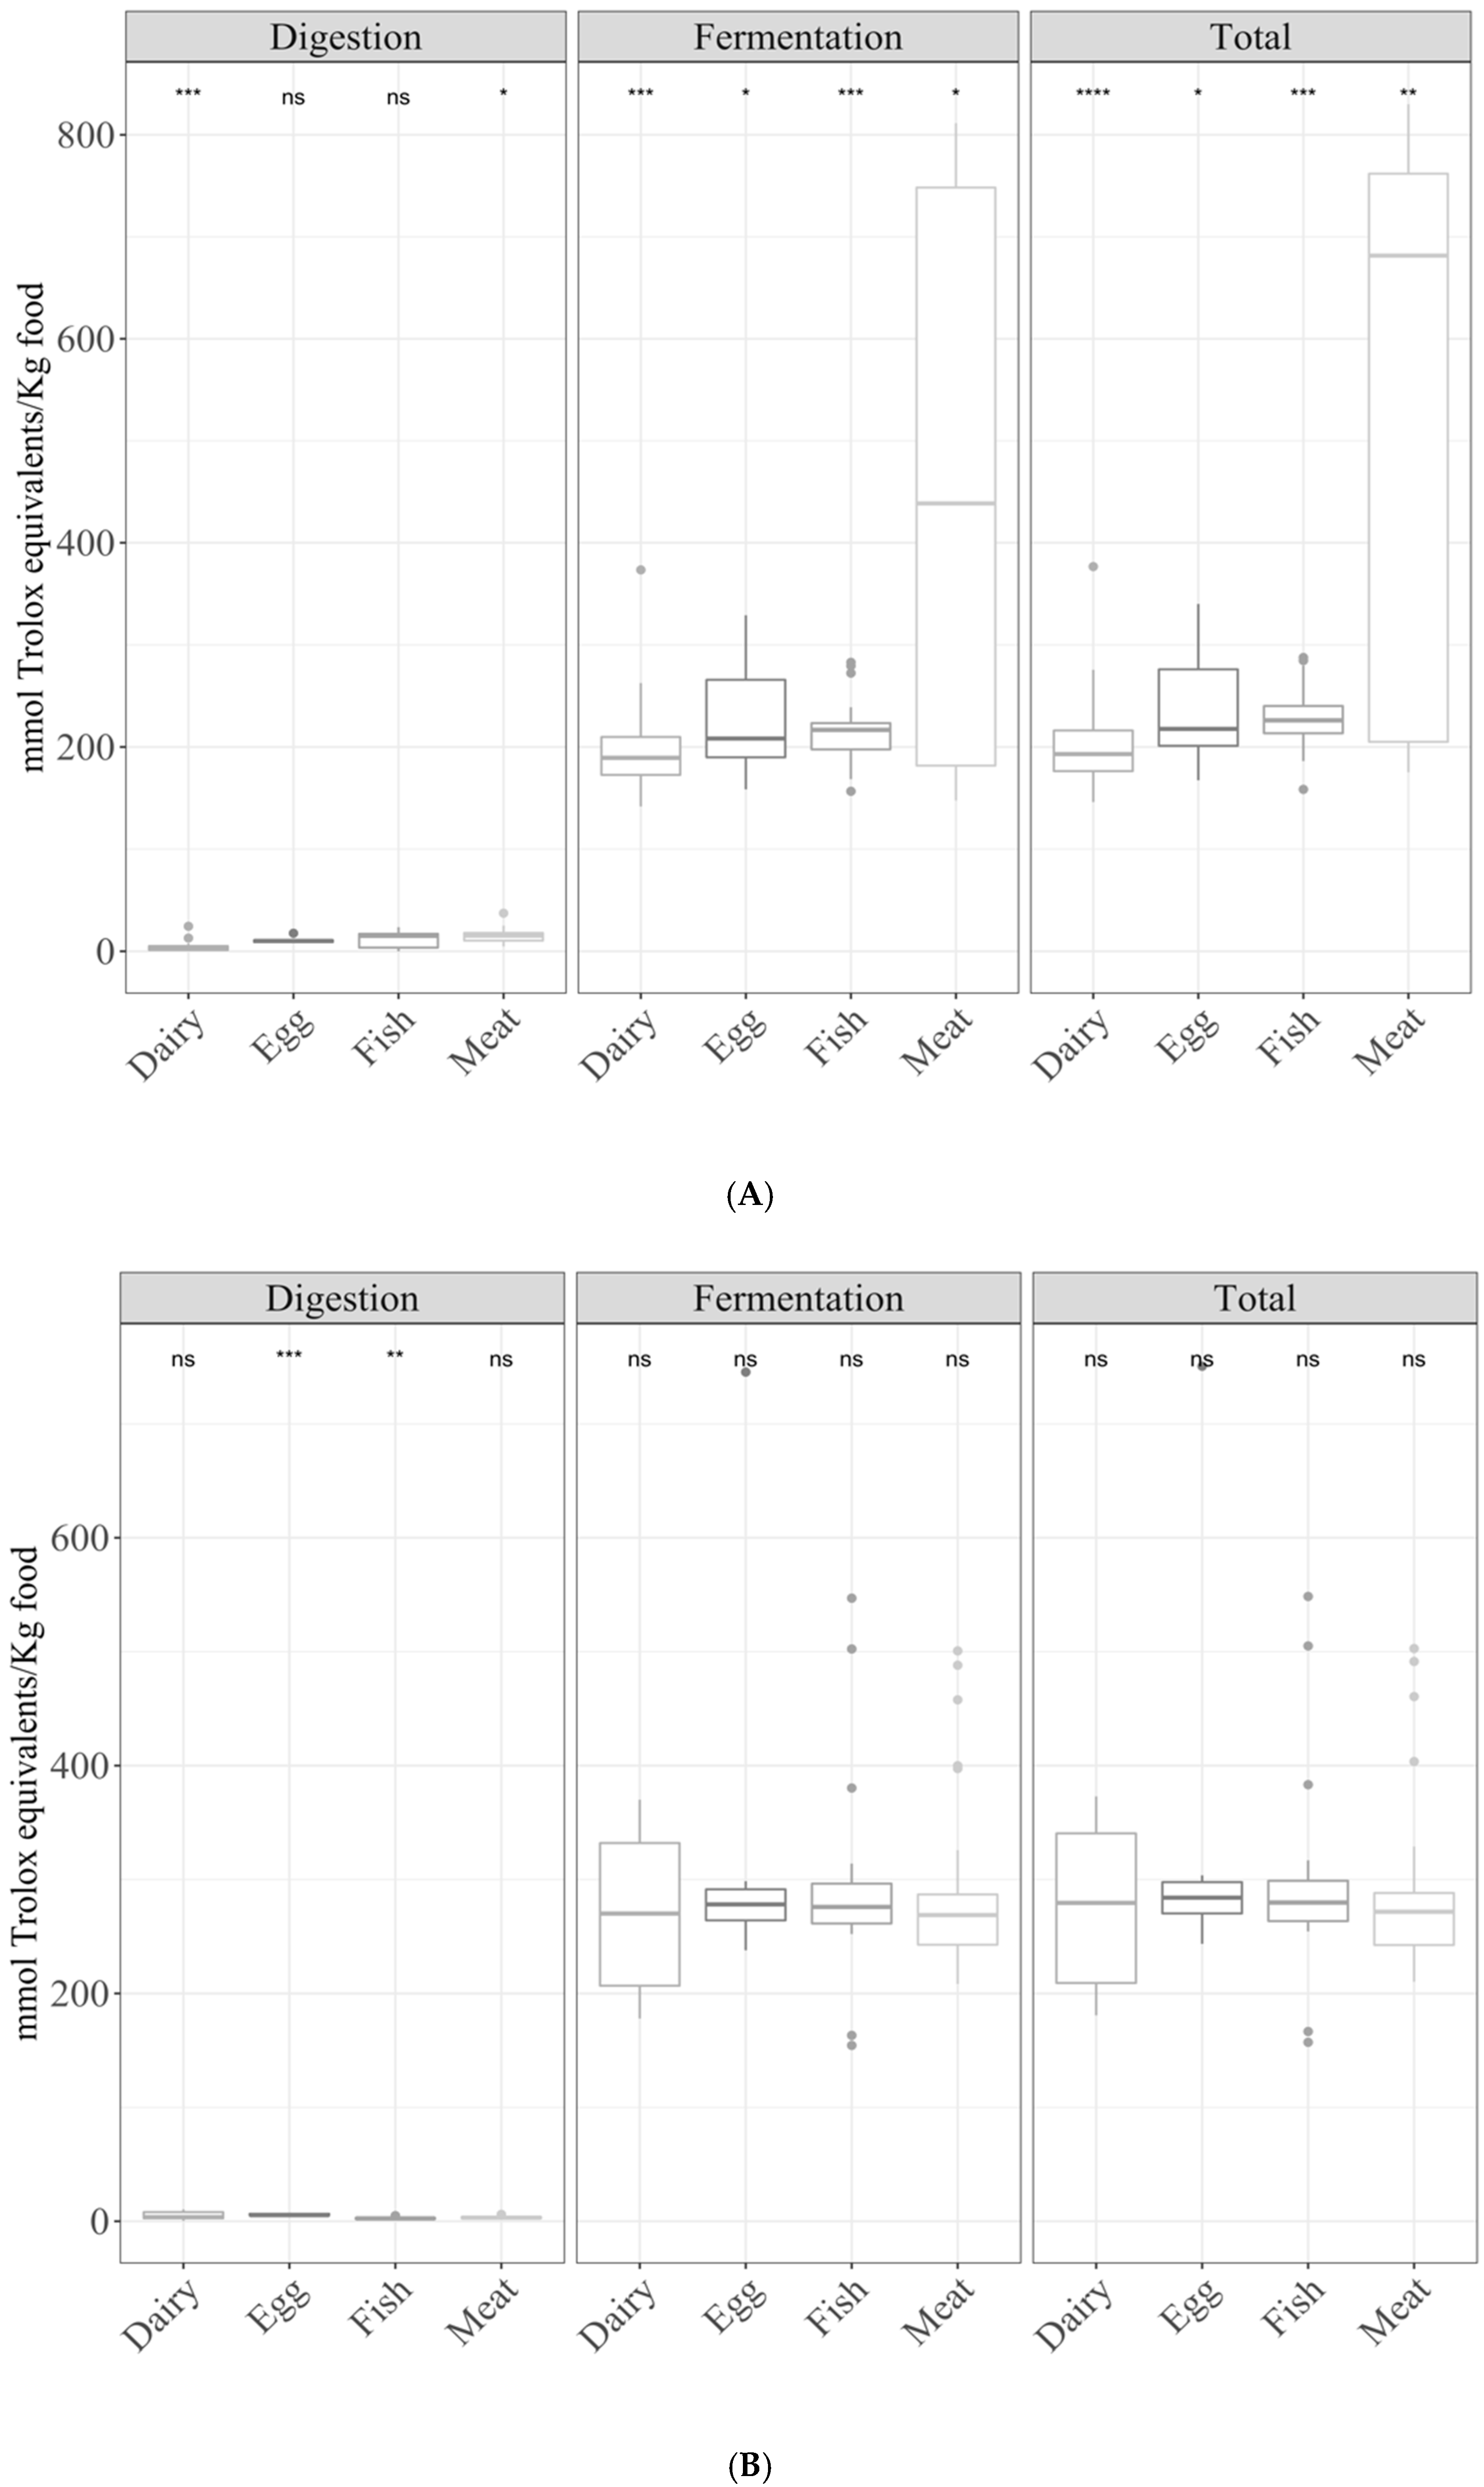
3.2. Samples by Type of Food
3.2.1. Gastrointestinal Digestion Supernatant
3.2.2. Fermentation Supernatant and Total Antioxidant Capacity
3.3. Specific Group Analysis
3.3.1. Dairy
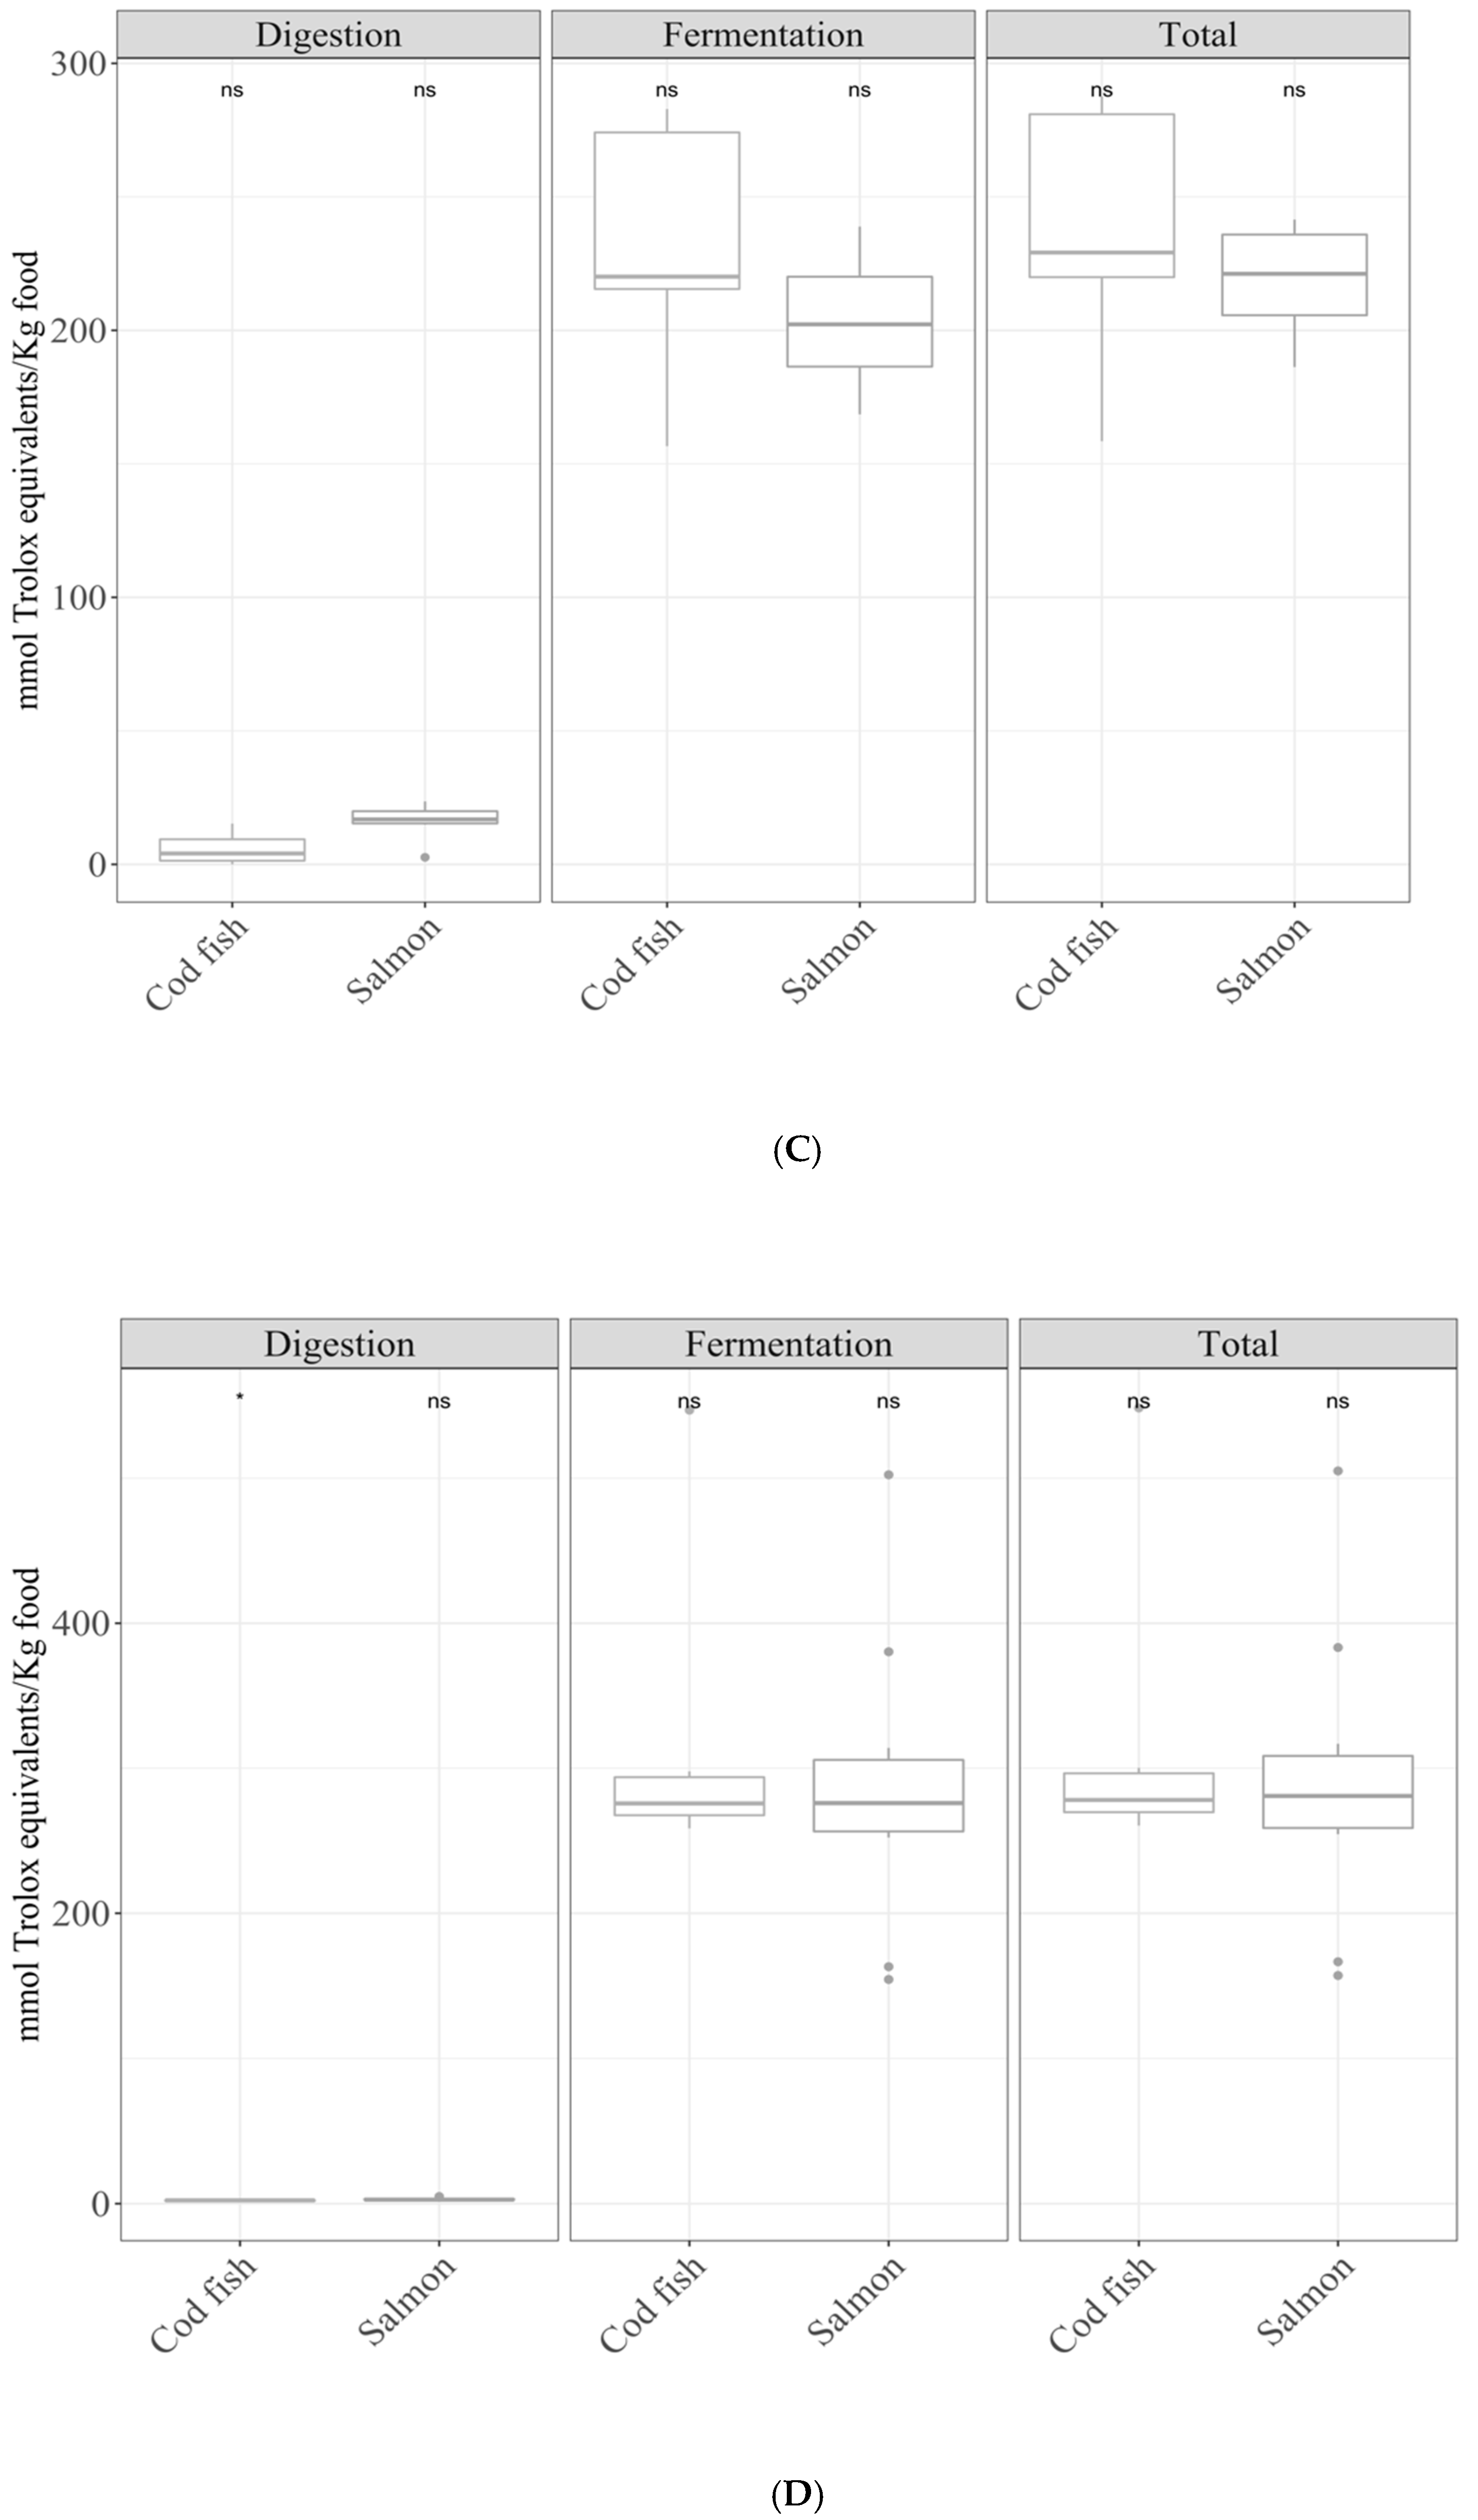
3.3.2. Fish
3.3.3. Meat
3.4. Daily Antioxidant Intake
4. Discussion
5. Conclusions
Supplementary Materials
Author Contributions
Funding
Institutional Review Board Statement
Informed Consent Statement
Data Availability Statement
Acknowledgments
Conflicts of Interest
References
- Sotos Prieto, M.; Guillen, M.; Sorlí, J.V.; Asensio, E.M.; Gillem Sáiz, P.; González, J.I.; Corella, D. Consumo de Carne y Pescado En Población Mediterránea Española de Edad Avanzada y Alto Riesgo Cardiovascular. Nutr. Hosp. 2011, 26, 1033–1040. [Google Scholar] [CrossRef] [PubMed]
- Yip, C.S.C.; Lam, W.; Fielding, R. A Summary of Meat Intakes and Health Burdens. Eur. J. Clin. Nutr. 2018, 72, 18–29. [Google Scholar] [CrossRef]
- Olmedilla-Alonso, B.; Jiménez-Colmenero, F.; Sánchez-Muniz, F.J. Development and Assessment of Healthy Properties of Meat and Meat Products Designed as Functional Foods. Meat Sci. 2013, 95, 919–930. [Google Scholar] [CrossRef] [Green Version]
- Abuajah, C.I.; Ogbonna, A.C.; Osuji, C.M. Functional Components and Medicinal Properties of Food: A Review. J. Food Sci. Technol. 2015, 52, 2522–2529. [Google Scholar] [CrossRef] [Green Version]
- Leri, M.; Scuto, M.; Ontario, M.L.; Calabrese, V.; Calabrese, E.J.; Bucciantini, M.; Stefani, M. Healthy Effects of Plant Polyphenols: Molecular Mechanisms. Int. J. Mol. Sci. 2020, 21, 1250. [Google Scholar] [CrossRef] [PubMed] [Green Version]
- Pimentel, F.A.; Nitzke, J.A.; Klipel, C.B.; Jong, E.V. de chocolate and red wine—A comparison between flavonoids content. Food Chem. 2010, 120, 109–112. [Google Scholar] [CrossRef]
- Marcolini, E.; Babini, E.; Bordoni, A.; Di Nunzio, M.; Laghi, L.; Maczó, A.; Picone, G.; Szerdahelyi, E.; Valli, V.; Capozzi, F. Bioaccessibility of the Bioactive Peptide Carnosine during in Vitro Digestion of Cured Beef Meat. J. Agric. Food Chem. 2015, 63, 4973–4978. [Google Scholar] [CrossRef] [PubMed]
- Xing, L.; Chee, M.E.; Zhang, H.; Zhang, W.; Mine, Y. Carnosine—A Natural Bioactive Dipeptide: Bioaccessibility, Bioavailability and Health Benefits. J. Food Bioact. 2019, 5, 8–17. [Google Scholar] [CrossRef] [Green Version]
- Radzik-Rant, A.; Rant, W.; Sosnowiec, G.; Świątek, M.; Niżnikowski, R.; Szymańska, Ż. The Effect of Genotype and Muscle Type on the Physico-Chemical Characteristics and Taurine, Carnosine and L-Carnitine Concentration in Lamb Meat. Arch. Anim. Breed. 2020, 63, 423–430. [Google Scholar] [CrossRef]
- Chen, D.; Wu, M.; Xie, S.; Li, X.; Tao, Y.; Wang, X.; Huang, L.; Pan, Y.; Peng, D.; Yuan, Z. Determination of Tartrazine, Lutein, Capsanthin, Canthaxanthin and β-Carotene in Animal-Derived Foods and Feeds by HPLC Method. J. Chromatogr. Sci. 2019, 57, 462–468. [Google Scholar] [CrossRef]
- Grażyna, C.; Hanna, C.; Adam, A.; Magdalena, B.M. Natural Antioxidants in Milk and Dairy Products. Int. J. Dairy Technol. 2017, 70, 165–178. [Google Scholar] [CrossRef]
- Pérez-Burillo, S.; Rufián-Henares, J.A.; Pastoriza, S. Towards an improved global antioxidant response method (GAR+): Physiological-resembling in vitro antioxidant capacity methods. Food Chem. 2018, 239, 1263–1272. [Google Scholar] [CrossRef]
- Agans, R.; Gordon, A.; Kramer, D.L.; Pérez-Burillo, S.; Rufián-Henares, J.A.; Paliy, O. Dietary Fatty Acids Sustain the Growth of the Human Gut Microbiota. Appl. Environ. Microbiol. 2018, 84, e01525-18. [Google Scholar] [CrossRef] [PubMed] [Green Version]
- Navajas-Porras, B.; Pérez-Burillo, S.; Valverde-Moya, Á.J.; Hinojosa-Nogueira, D.; Pastoriza, S.; Rufián-Henares, J.Á. Effect of Cooking Methods on the Antioxidant Capacity of Plant Foods Submitted to In Vitro Digestion–Fermentation. Antioxidants 2020, 9, 1312. [Google Scholar] [CrossRef] [PubMed]
- Pérez-Burillo, S.; Rufián-Henares, J.A.; Pastoriza, S. Towards an Improved Global Antioxidant Response Method (GAR+): Physiological-Resembling in vitro Digestion-Fermentation Method. Food Chem. 2018, 239, 1253–1262. [Google Scholar] [CrossRef] [PubMed]
- Pastoriza, S.; Delgado-Andrade, C.; Haro, A.; Rufián-Henares, J.A. A Physiologic Approach to Test the Global Antioxidant Response of Foods. The GAR Method. Food Chem. 2011, 129, 1926–1932. [Google Scholar] [CrossRef]
- Rapisarda, P.; Tomaino, A.; Lo Cascio, R.; Bonina, F.; De Pasquale, A.; Saija, A. Antioxidant Effectiveness as Influenced by Phenolic Content of Fresh Orange Juices. J. Agric. Food Chem. 1999, 47, 4718–4723. [Google Scholar] [CrossRef]
- Benzie, I.F.F.; Strain, J.J. The Ferric Reducing Ability of Plasma (FRAP) as a Measure of “Antioxidant Power”: The FRAP Assay. Anal. Biochem. 1996, 239, 70–76. [Google Scholar] [CrossRef] [Green Version]
- Mercasa. La Alimentación en España. 2020. Available online: https://www.mercasa.es/media/publicaciones/281/AEE_2020_web.pdf (accessed on 15 January 2021).
- Salvador i Castells, G. Tabla de Medidas Caseras de Alimentos. In Nutrición y Dietética Clínica; Salas-Salvadó, J., Bonada, A., Trallero, R., Saló, M.E., Eds.; Elsevier-Masson: Barcelona, Spain, 2000; pp. 557–570. [Google Scholar]
- Ramírez-Anaya, J.P.; Samaniego-Sánchez, C.; Castañeda-Saucedo, M.C.; Villalón-Mir, M.; de la Serrana, H.L.-G. Phenols and the antioxidant capacity of Mediterranean vegetables prepared with extra virgin olive oil using different domestic cooking techniques. Food Chem. 2015, 188, 430–438. [Google Scholar] [CrossRef]
- Miglio, C.; Chiavaro, E.; Visconti, A.; Fogliano, V.; Pellegrini, N. Effects of different cooking methods on nutritional and physicochemical characteristics of selected vegetables. J. Agric. Food Chem. 2008, 56, 139–147. [Google Scholar] [CrossRef]
- Rufián-Henares, J.A.; Guerra-Hernández, E.; García-Villanova, B. Effect of Red Sweet Pepper Dehydration Conditions on Maillard Reaction, Ascorbic Acid and Antioxidant Activity. J. Food Eng. 2013, 118, 150–156. [Google Scholar] [CrossRef]
- Pérez-Burillo, S.; Rufián-Henares, J.A.; Pastoriza, S. Effect of Home Cooking on the Antioxidant Capacity of Vegetables: Relationship with Maillard Reaction Indicators. Int. Food Res. J. 2019, 121, 514–523. [Google Scholar] [CrossRef]
- Pérez-Burillo, S.; Pastoriza, S.; Jiménez-Hernández, N.; D’Auria, G.; Francino, M.P.; Rufián-Henares, J.A. Effect of Food Thermal Processing on the Composition of Gut Microbiota. J. Agric. Food Chem. 2018, 66, 11500–11509. [Google Scholar] [CrossRef]
- Carrillo, C.; Barrio, A.; Cavia, M.M.; Alonso-Torre, S. Global antioxidant response of meat. J. Sci. Food Agric. 2017, 97, 2358–2365. [Google Scholar] [CrossRef]
- Rufián-Henares, J.A.; Guerra-Hernández, E.; García-Villanova, B. Colour measurement as indicator for controlling the manufacture and storage of enteral formulas. Food Cont. 2006, 17, 489–493. [Google Scholar] [CrossRef]
- Delgado-Andrade, C.; Rufián-Henares, J.A.; Morales, F.J. Lysine availability is diminished in commercial fibre-enriched breakfast cereals. Food Chem. 2007, 100, 725–731. [Google Scholar] [CrossRef]
- Pastoriza de la Cueva, S.; Álvarez, J.; Végvári, Á.; Montilla-Gómez, J.; Cruz-López, O.; Delgado-Andrade, C.; Rufián-Henares, J.A. Relationship between HMF intake and SMF formation in vivo: An animal and human study. Mol. Nutr. Food Res. 2017, 61, 1600773. [Google Scholar] [CrossRef]
- Zhou, Y.; Xie, F.; Zhou, X.; Wang, Y.; Tang, W.; Xiao, Y. Effects of Maillard reaction on flavor and safety of Chinese traditional food: Roast duck. J. Sci. Food Agric. 2016, 96, 1915–1922. [Google Scholar] [CrossRef]
- Rodríguez, A.; Lema, P.; Bessio, M.I.; Moyna, G.; Panizzolo, L.A.; Ferreira, F. Isolation and Characterization of Melanoidins from Dulce de Leche, A Confectionary Dairy Product. Molecules 2019, 24, 4163. [Google Scholar] [CrossRef] [Green Version]
- Gu, F.L.; Kim, J.M.; Abbas, S.; Zhang, X.M.; Xia, S.Q.; Chen, Z.X. Structure and antioxidant activity of hugh molecular Maillard reaction products from casein-glucose. Food Chem. 2010, 120, 505–511. [Google Scholar] [CrossRef]
- Tagliazucchi, D.; Bellesia, A. The gastro-intestinal tract as the major site of biological action of dietary melanoidins. Amino Acids 2015, 47, 1077–1089. [Google Scholar] [CrossRef] [PubMed] [Green Version]
- Saura-Calixto, F.; Goñi, I. Antioxidant capacity of the Spanish Mediterranean diet. Food Chem. 2006, 94, 442–447. [Google Scholar] [CrossRef]


| Food Type | Analytical Assay | AOX/Daily Intake 1 (μmol Trolox/day) | AOX/Serving Intake 2 (μmol Trolox/serving) | Mean Contribution to Daily Antioxidant Intake (%) | Mean Contribution to Daily Antioxidant Per Serving Intake (%) |
| Dairy | DPPH | 49,170 | 23,198 | 56.3 | 14.1 |
| Egg | DPPH | 5491 | 28,871 | 6.29 | 17.6 |
| Meat | DPPH | 31,308 | 70,944 | 35.9 | 43.2 |
| Fish | DPPH | 1344 | 41,173 | 1.54 | 25.1 |
| Food Type | Analytical Assay | AOX/Daily Intake 1 (μmol Trolox/day) | AOX/Serving Intake 2 (μmol Trolox/serving intake) | Mean Contribution to Daily Antioxidant Intake (%) | Mean Contribution to Daily Antioxidant Per Serving Intake (%) |
| Dairy | FRAP | 57,643 | 29,660 | 66.2 | 34.0 |
| Egg | FRAP | 7659 | 40,271 | 8.79 | 46.2 |
| Meat | FRAP | 20,042 | 39,518 | 23.0 | 45.4 |
| Fish | FRAP | 1765 | 54,028 | 2.03 | 62.0 |
| Food Type | Thermal Processing | Analytical Assay | AOX/Daily Intake 1 (μmol Trolox/day) | AOX/Serving Intake 2 (μmol Trolox/serving) | Mean Contribution to Daily Antioxidant Intake (%) | Mean Contribution to Daily Antioxidant Per Serving Intake (%) |
|---|---|---|---|---|---|---|
| Dairy | Fried | DPPH | 4319 | 8539 | 1.69 | 3.35 |
| Dairy | Raw | DPPH | 4670 | 15,299 | 1.83 | 6.00 |
| Dairy | Roasted | DPPH | 44,700 | 23,660 | 17.5 | 9.28 |
| Dairy | Brewed | DPPH | 5973 | 19,564 | 2.34 | 7.68 |
| Egg | Boiled | DPPH | 35,026 | 46,355 | 13.7 | 18.2 |
| Egg | Fried | DPPH | 5962 | 31,351 | 2.34 | 12.3 |
| Egg | Grilled | DPPH | 6068 | 31,908 | 2.38 | 12.5 |
| Egg | Roasted | DPPH | 12,030 | 63,257 | 4.72 | 24.8 |
| Meat | Boiled | DPPH | 6574 | 34,568 | 2.58 | 13.6 |
| Meat | Fried | DPPH | 32,686 | 72,016 | 12.8 | 28.3 |
| Meat | Grilled | DPPH | 30,649 | 70,579 | 12.0 | 27.7 |
| Meat | Roasted | DPPH | 28,329 | 82,381 | 11.1 | 32.3 |
| Fish | Boiled | DPPH | 31,625 | 71,840 | 12.4 | 28.2 |
| Fish | Fried | DPPH | 1320 | 40,085 | 0.52 | 15.7 |
| Fish | Grilled | DPPH | 1320 | 41,083 | 0.52 | 16.1 |
| Fish | Raw | DPPH | 1460 | 44,605 | 0.57 | 17.5 |
| Fish | Roasted | DPPH | 969 | 50,549 | 0.38 | 19.8 |
| Dairy | Fried | FRAP | 7552 | 14,410 | 3.42 | 6.53 |
| Dairy | Raw | FRAP | 41,077 | 23,419 | 18.6 | 10.6 |
| Dairy | Roasted | FRAP | 5973 | 19,564 | 2.71 | 8.87 |
| Dairy | UHT | FRAP | 35,026 | 46,355 | 15.9 | 21.0 |
| Egg | Boiled | FRAP | 5962 | 31,351 | 2.70 | 14.2 |
| Egg | Fried | FRAP | 6068 | 31,908 | 2.75 | 14.5 |
| Egg | Grilled | FRAP | 12,030 | 63,257 | 5.45 | 28.7 |
| Egg | Roasted | FRAP | 6574 | 34,568 | 2.98 | 15.7 |
| Meat | Boiled | FRAP | 21,833 | 41,983 | 9.90 | 19.0 |
| Meat | Fried | FRAP | 19,589 | 38,637 | 8.88 | 17.5 |
| Meat | Grilled | FRAP | 24,088 | 45,616 | 10.9 | 20.7 |
| Meat | Roasted | FRAP | 22,053 | 40,586 | 10.0 | 18.4 |
| Fish | Boiled | FRAP | 1593 | 48,692 | 0.72 | 22.1 |
| Fish | Fried | FRAP | 1593 | 48,939 | 0.72 | 22.2 |
| Fish | Grilled | FRAP | 2191 | 63,983 | 0.99 | 29.0 |
| Fish | Raw | FRAP | 969 | 50,549 | 0.44 | 22.9 |
| Fish | Roasted | FRAP | 1770 | 53,802 | 0.80 | 24.4 |
| Type of Food | Mean Contribution to Daily Antioxidant Capacity Intake (%) DPPH Assay | Mean Contribution to Daily Antioxidant Capacity Per Serving Intake (%) DPPH Assay | Mean Contribution to Daily Antioxidant Capacity Intake (%) FRAP Assay | Mean Contribution to Daily Antioxidant Capacity Per Serving Intake (%) FRAP Assay |
|---|---|---|---|---|
| Dairy | 35.1 | 18.1 | 28.1 | 13.2 |
| Egg | 4.70 | 24.5 | 3.10 | 16.5 |
| Meat | 12.2 | 24.1 | 17.9 | 40.5 |
| Fish | 1.10 | 32.9 | 0.80 | 23.5 |
| Alcoholic drinks1 | 0.70 | 2.20 | 4.40 | 10.1 |
| Cereals1 | 13.6 | 3.90 | 12.7 | 3.40 |
| Cocoa1 | 0.60 | 4.20 | 0.60 | 4.60 |
| Coffee1 | 0.20 | 0.90 | 0.60 | 2.80 |
| Fruits1 | 11.6 | 13.5 | 12.1 | 15.1 |
| Legumes1 | 0.80 | 10.1 | 0.70 | 9.20 |
| Nuts1 | 0.80 | 3.50 | 0.70 | 2.70 |
| Oils1 | 0.30 | 0.20 | 1.10 | 0.60 |
| Tubers1 | 9.00 | 19.0 | 6.50 | 14.3 |
| Vegetables1 | 9.30 | 9.70 | 10.7 | 9.80 |
Publisher’s Note: MDPI stays neutral with regard to jurisdictional claims in published maps and institutional affiliations. |
© 2021 by the authors. Licensee MDPI, Basel, Switzerland. This article is an open access article distributed under the terms and conditions of the Creative Commons Attribution (CC BY) license (http://creativecommons.org/licenses/by/4.0/).
Share and Cite
Navajas-Porras, B.; Pérez-Burillo, S.; Valverde-Moya, Á.; Hinojosa-Nogueira, D.; Pastoriza, S.; Rufián-Henares, J.Á. Effect of Cooking Methods on the Antioxidant Capacity of Foods of Animal Origin Submitted to In Vitro Digestion-Fermentation. Antioxidants 2021, 10, 445. https://doi.org/10.3390/antiox10030445
Navajas-Porras B, Pérez-Burillo S, Valverde-Moya Á, Hinojosa-Nogueira D, Pastoriza S, Rufián-Henares JÁ. Effect of Cooking Methods on the Antioxidant Capacity of Foods of Animal Origin Submitted to In Vitro Digestion-Fermentation. Antioxidants. 2021; 10(3):445. https://doi.org/10.3390/antiox10030445
Chicago/Turabian StyleNavajas-Porras, Beatriz, Sergio Pérez-Burillo, Álvaro Valverde-Moya, Daniel Hinojosa-Nogueira, Silvia Pastoriza, and José Ángel Rufián-Henares. 2021. "Effect of Cooking Methods on the Antioxidant Capacity of Foods of Animal Origin Submitted to In Vitro Digestion-Fermentation" Antioxidants 10, no. 3: 445. https://doi.org/10.3390/antiox10030445