Intraoperative Imaging of Cortical Blood Flow by Camera-Based Photoplethysmography at Green Light


1
Almazov National Medical Research Centre, 2 Akkuratova str., Saint Petersburg 197341, Russia
2
Department of Internal Medicine, Pavlov First Saint Petersburg State Medical University, 6-8 L’va Tolstogo str., Saint Petersburg 197022, Russia
3
City Alexandrovskaya Hospital, 4 Solidarnosti ave., Saint Petersburg 193312, Russia
4
Optoelectronics Department, Institute of Automation and Control Processes FEB RAS, 5 Radio St., Vladivostok 690041, Russia
5
Faculty of Photonics and Optical Information, ITMO University, 49 Kronverksky ave., Saint Petersburg 197101, Russia
*
Author to whom correspondence should be addressed.
Appl. Sci. 2020, 10(18), 6192; https://doi.org/10.3390/app10186192
Submission received: 13 August 2020
/
Revised: 2 September 2020
/
Accepted: 3 September 2020
/
Published: 6 September 2020
(This article belongs to the Special Issue Medical Imaging and Analysis)
Abstract
:Intraoperative evaluation of blood perfusion in the brain cortex is an important but hitherto unresolved problem. Our aim was to demonstrate the feasibility of cerebral microcirculation assessment during open brain surgery by using camera-based photoplethysmography (cbPPG) synchronized with an electrocardiograph. Cortical blood flow was monitored in five patients with different diagnoses. Two cases (tumor resection and extra-intracranial bypass grafting) are presented in detail. Blood-flow parameters were visualized after processing cortex images recorded under green-light illumination before and after surgical intervention. In all cases, blood flow was successfully visualized in >95% of open brain. Distributions of blood pulsation amplitude, a parameter related to cortical blood perfusion; pulse arrival time; and blood-pressure-pulse shape were calculated with high spatial resolution (in every pixel). Changes in cerebral blood supply caused by surgical intervention were clearly revealed. We have shown that the temporal spread of pulse arrival time and the spatiotemporal variability of pulse shape are very sensitive markers of brain circulatory disturbances. The green-light cbPPG system offers a new approach to objective assessment of blood-flow changes in the brain during surgical intervention. The proposed system allows for contactless monitoring of cortex blood flow in real time with high resolution, thus providing useful information for surgery optimization and minimization of brain tissue damage.
1. Introduction
Evaluation of blood perfusion in the brain cortex during surgical intervention is an important but hitherto unresolved problem. Several methods were tested for intraoperative imaging of cortical blood flow. Perfusion computed tomography (PCT) requires sophisticated equipment that can be used only in specially equipped hybrid operational theaters. Moreover, the interpretation of PCT data is not always unambiguous and does not reveal the dynamic component of perfusion. In addition, both the PCT method and magnetic resonance imaging disrupt the surgical procedure and require significant extra time for preparation. Laser Doppler flowmetry measures blood velocity in only a single point, whereas laser Doppler imaging is a rather expensive system and has poor temporal resolution [1]. Moreover, blood flow in Doppler methods is characterized by means of relative perfusion units, the physical significance of which has a contentious interpretation [2]. The method of video angiography that uses intravenous administration of indocyanine green (ICG) with subsequent video recording of the cortex was also proposed for intraoperative assessment of vessel patency during neurovascular surgery [3]. The video-angiography system is rather simple and provides views of the full field of cerebral blood flow. However, the need to administer the intravenous dye ICG to increase the contrast of functioning vessels does not allow them to be visualized continuously and in real time. Another camera-based method, laser speckle contrast imaging (LSCI), is also capable of full-field visualization of cortical blood flow [4]. In contrast to video angiography, LSCI does not require an exogenous contrast agent, thus providing continuous monitoring of cerebral blood flow in two dimensions with high resolution [5,6]. More advanced modifications of the LSCI technique, dynamic and multi-exposure, allow visualization of blood flow in the full field of view, pixel by pixel, but require the use of high-speed video cameras [7,8]. Although speckle contrast values are indicative of the level of motion in the sample, they are not directly proportional to red blood cell (RBC) velocity or blood flow [4]. Moreover, the results of the LSCI technique are ambiguous in interpretation due to multiple light scattering in biological tissue [9]. None of the above methods can provide a quantitative assessment of blood perfusion and dynamic parameters of the cerebral cortex supply in real time and with high spatial resolution allowing for estimation of the state of microcirculation simultaneously over the full field of view. However, it is the assessment of blood flow in the microvessels (arteries of medium and small caliber down to 30 μm) that provides the most important information about the problems of brain function. Superficial microvessels are situated in the pia mater, constituting about 80% of the total blood flow of the brain. Continuity of blood circulation in microvessels of the convexital brain surface prognosticates restoration of the cortex functions as it was shown in experiments with animals [10].
Optical methods are widely considered as very promising for contactless measurements of blood-flow parameters in skin. Nowadays, remote assessment of cutaneous blood perfusion is usually provided by two commercially available optical techniques, both using coherent-light illumination: laser Doppler perfusion imaging and LSCI [11]. However, another optical method proposed 80 years ago to evaluate blood supply to the skin and referred to as photoplethysmography (PPG) [12] until now has not been used to assess cutaneous microcirculation. This may be caused by still insufficient knowledge of the mechanism of light interaction with pulsatile blood vessels. Notwithstanding the long history of research in this field, the origin of the PPG signal remains the subject of continuing debates [11,13,14,15]. The key feature of PPG is synchronization with heartbeat modulation of the light interacting with live biological tissue. The consensual PPG model (originally developed for infrared light) suggests that this modulation originates from blood volume variations in major blood vessels (pulsatile arteries). This model provides rationale for a widely used clinical application of PPG referred to as pulse oximetry [16].
However, several experimental observations conflicting with the consensual PPG model were reported recently using the advanced camera-based PPG (cbPPG) technique. The first is paradoxical spectral dependence of the PPG signal that peaks at green [14,17] despite the fact that this light cannot even reach pulsatile arterioles. Second, recent videocapillaroscopy study of RBC motion in nail-fold capillaries revealed that reemitted light is modulated at the heart rate not only in the capillaries but also in the space between them [18]. Nevertheless, we suggested that the cbPPG system operating at green illumination is capable of assessment microcirculation not only in the skin but also in the cortex. Grounds for this suggestion have arisen from anatomical-physiological structure of the brain vascular system in which small vessels and capillaries are supplied from arteries situated at the cortex surface [19]. The main blood supply of the brain is carried out by meningeal vessels penetrating brain tissue from the side of the convexital surface. These vessels depart from the Willis circle as paired anterior, middle, and posterior cerebral arteries and further ramify on gyri of cerebrum gradually decreasing in diameter from 700 to 40 µm from conducting to precortical arteries. Next, from each precortical artery, 2–3 cortical arteries depart penetrating into the cortical space at right angles [19]. Unlike in the skin, all types of vessels are ideally accessible for observation in the cortex providing efficient interaction of green light with blood in microvessels.
Effective use of the cbPPG technique for quantitative evaluation of changes in cortical blood perfusion of rats caused by painful stimuli was recently demonstrated by our group [20]. It was shown in these experiments that the amplitude of the PPG waveform is a measure of the cerebral arterial tone. A distinctive feature of the cbPPG system synchronized with the electrocardiogram (ECG) is not only the ability to quantify the time of the pulse-wave arrival to the measuring point (pulse arrival time, PAT) but also mapping a spatial distribution of PAT over large skin areas (e.g., face) [21]. Such maps allow one to obtain important additional information about the perfusion parameters, namely, to measure the spread in time of arrival of the blood-pressure pulse wave to different areas under study [22,23]. Moreover, cbPPG is capable of estimating variations in the PPG-pulse shape both in time and space [24].
The wide range of hemodynamic parameters assessed by the advanced cbPPG system motivated us to carry out pilot experiments on measuring the parameters of pulsatile blood flow in open brain cortex during surgical interventions. The main objective of the research was estimation of eligibility to use the cbPPG system for remote visualization of cortical microcirculation in patients with various pathologies of the brain. We also aimed to show feasibility of monitoring the viability of brain structures with quantitative assessment of changes in parameters of blood supply (such as pulsation index, pulse arrival time, and pulse shape variability) to different areas of the brain before and after surgical intervention.
2. Methods and Clinical Cases
2.1. Remote PPG System
To monitor blood perfusion in cortical microvessels, a cbPPG system consisting of a video-recording block synchronized with a digital electrocardiograph was used. Detailed description of the system was previously published [24], including a layout of the video-recording block that consisted of 8 light emitting diodes and a digital monochrome complementary metal-oxide-semiconductor (CMOS) camera. The cortex was illuminated by incoherent linearly polarized green light (wavelength 530 ± 40 nm) from a distance of about 70 cm. Each video with duration of 40 s was recorded at 39 frames per second with pixel resolution of 752 × 480 (one video was recorded before surgical intervention and another after it). The recorded frames were saved into the hard disk of a personal computer. A digital electrocardiograph at the data acquisition frequency of 1 kHz was used to record an electrocardiogram (ECG). To synchronize ECG and video recordings, synch pulses of each frame were recorded in one of the ECG channels providing synchronization accuracy of one millisecond. During video recording, the main illumination in the operating room was turned off, providing an intensity of light-emitted diode (LED) illumination at the cortex (the mean value of about 3 mW/cm2) at least 10 times higher than the intensity of remaining ambient light.
2.2. Data Processing
The recorded data were processed offline by using custom software implemented in the MATLAB® platform (Version, R2018b, The MathWorks, Inc., MA, USA, 2018). First, we compensated the heterogeneous motion of an open brain cortex. To this end, the whole image was divided on the segments of 64 × 30 pixels and, then, the motion of each segment was compensated independently. It was assumed that the motion-related component of the pixel-value variations is proportional to the image gradient and lateral offset. The latter was estimated in every segment by optical flow algorithm using the gradient method [25]. Thereafter, the motion-related component was reconstructed and subtracted from the original image. Second, we manually selected an area for evaluation of blood-pulsation parameters in one of the recorded images. PPG waveforms were calculated as frame-by-frame evolution of the average pixel value in every pixel within the selected area of the motion-compensated frames. The size of each pixel corresponds to 260 µm at the cortex. To compensate uneven illumination of the cortex, the waveform was calculated as the ratio of the alternating component (AC) modulated at the heart rate and slowly varying (DC) component (AC/DC ratio). As it is conventionally accepted in papers devoted to photoplethysmography [26,27], the sign of the obtained waveform was inverted so that its increase follows the increase of blood volume (and pressure) in vessels during a cardiac cycle. These waveform transformations are typically applied in photoplethysmography [14,15]. Third, the noise and DC components were removed from the calculated waveforms by applying a band-pass (0.12–20 Hz) zero-phase digital filter.
Typically, each oscillation of a PPG waveform follows the R-peak of the ECG signal [24]. These oscillations can be plotted together so that each R-peak is at the beginning of the time scale. Thereafter, we calculated in each small region of interest (ROI) the mean waveform by averaging the filtered one-cardiac-cycle oscillations during the recording time of 40 s. Since the minimum of the mean waveform corresponds to the beginning of the anacrotic wave with fast blood-pressure increase [28], the parameter PAT was calculated as the time delay between the R-peak and this minimum. Amplitude of the pulsatile component (APC) was estimated as the difference between the maximum and minimum values of the mean PPG waveform. In other words, APC is the amplitude of heart-related oscillations of light reemitted from the brain cortex.
2.3. Mapping of Microcirculation Parameters
Parameters APC and PAT were estimated in each pixel, thus allowing us to calculate two-dimensional maps showing distribution of these parameters over the cerebral cortex with high spatial resolution. To assess an effect of surgical intervention on the cortical blood flow, 40-s videos of the open brain were recorded before and after intervention. These recordings allowed us to obtain APC/PAT maps before and after surgery and reveal the areas of significant changes in these parameters. For quantitative analysis, we manually selected in these maps a few regions of interest (ROI) with sizes of 7 × 7 pixels or 1.8 × 1.8 mm2. Note that manual selection of ROIs was chosen due to a serious change in the topology of the cerebral cortex after surgery. We tried to select ROI positions in approximately the same areas of the cortex before and after the surgery. The mean PPG waveform was calculated in these ROIs by averaging heart-related oscillations both in time (37–45 cardiac cycles depending on the actual heart rate) and in space (over 49 pixels). This mean waveform was used for assessing both the temporal and spatial stability of PPG-waveform pulsations in selected ROIs.
2.4. Patients
This report is based on pilot experiments of remote monitoring of blood perfusion in the open brain during neurosurgical intervention. The experiments were carried out in the Almazov National Medical Research Center, St. Petersburg in accordance with ethical standards presented in the 2013 Declaration of Helsinki. The study plan was approved by the research ethical committee of the Almazov National Medical Research Center prior the experiments (decision No. 98 of 17 June 2017). All patients provided informed consent in written form for participation in the experiment.
2.5. Clinical Cases
The study was carried out with five patients with different diagnoses who underwent open surgery on the brain. Four of them had tumor pathologies, and one had diagnosis of arterial atherosclerotic occlusion. In all trials, the cbPPG system revealed spatial distribution of blood-pulsation parameters over more than 98% of the open brain cortex. However, here, we report in detail the results of the two most representative trials. The first patient had a tumor formation of the right lateral ventricle, complicated by occlusive hydrocephalus syndrome. He underwent surgery for tumor resection with open transcortical access. His ependimoma of the right ventricle was treated with typical right-side frontal craniotomy. After dura mater dissection, slight brain protrusion was observed. The transfrontal approach to the anterior horn of the right ventricle was used. After tumor resection, the brain surface was returned to its original position. The second patient had extracranial atherosclerotic occlusion with the left internal carotid artery. He underwent an anastomosis operation between the left temporal artery and the M4 segment of the left mid-cerebral artery. In both cases, intraoperative and early postoperative complications were not observed.
3. Results
3.1. Patient with Pathological Formation of the Lateral Right Brain Ventricle
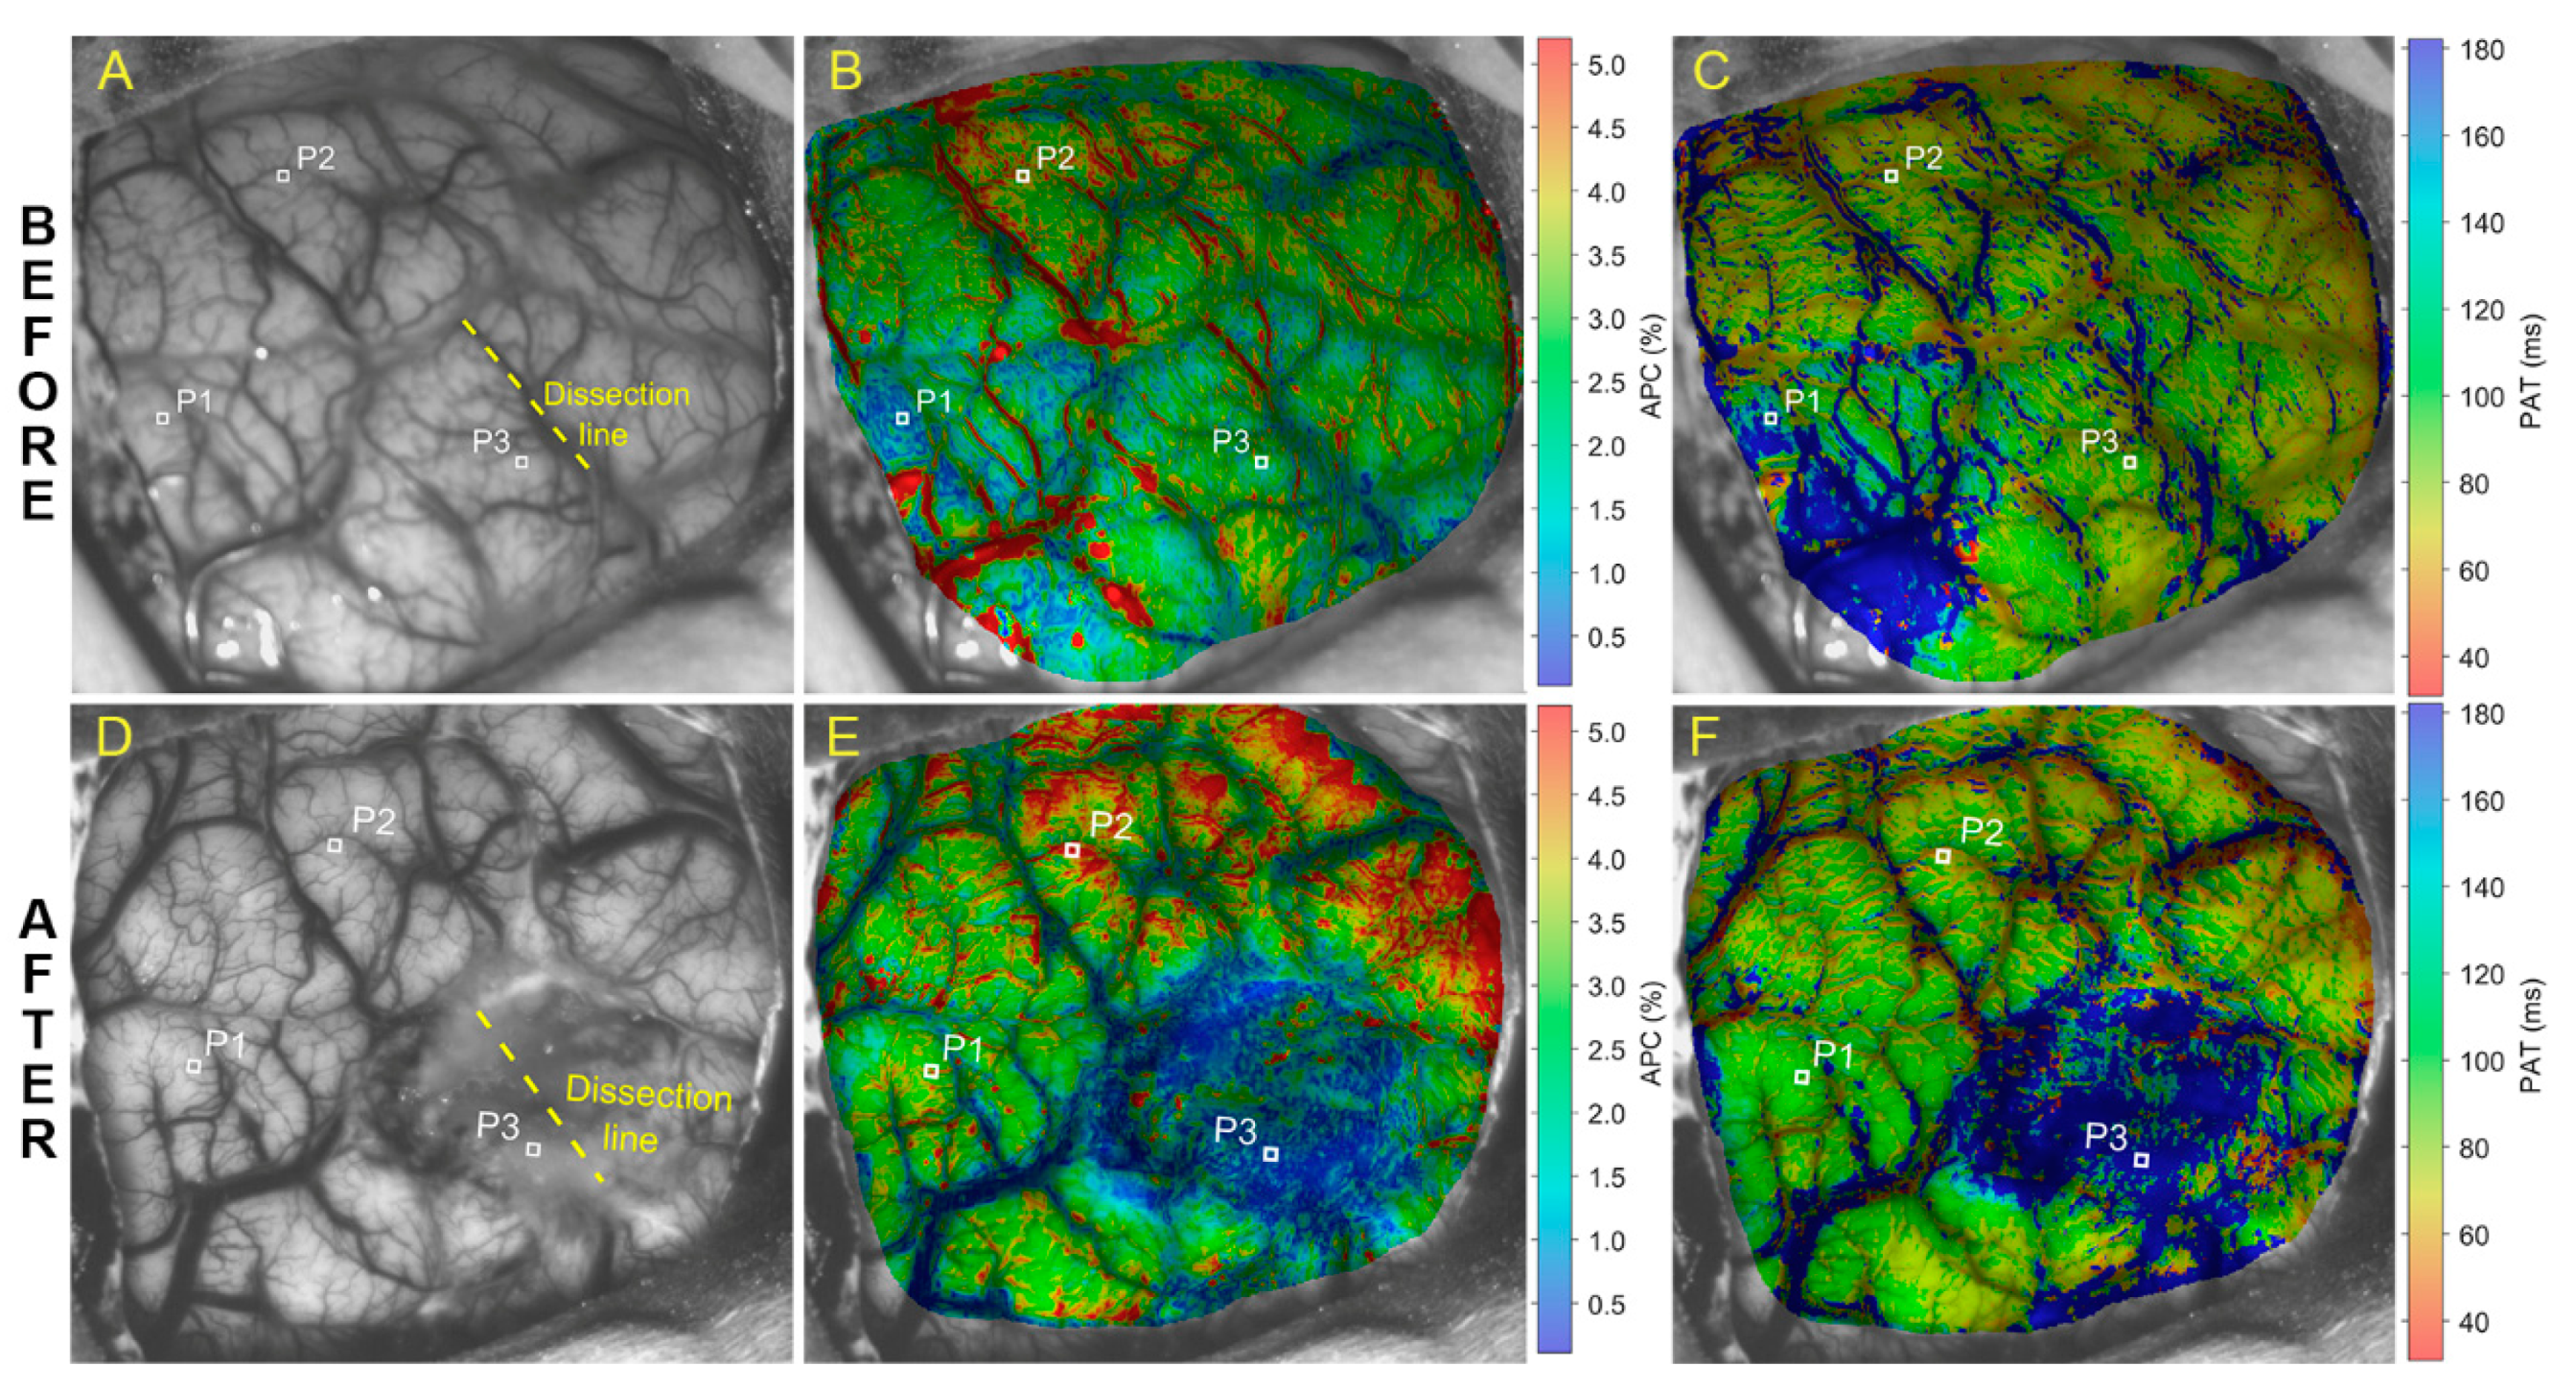
Parameters of cerebral blood-flow pulsations evaluated in the case of pathological formation of the brain right lateral ventricle are shown in Figure 1, where images of the upper and lower rows were obtained before and after surgery, respectively. Photographs of the open brain before and after tumor resection are shown in Figure 1A,D, respectively. The tumor was situated about three cm below the cortex in the brain right ventricle, near the region of the yellow dashed line (Figure 1A,D) marking the cortex dissection to access the tumor. Maps of APC (panels B and E) and PAT (panels C and F) in Figure 1 overlay respective images of the brain.
Before surgery, the amplitude of blood pulsations is distributed rather evenly over the cerebral cortex with the exception of the lower left part of the APC map with a reduced APC indicated in blue in Figure 1B. The mean APC in the lower left quarter of the map in Figure 1B is 1.12 ± 0.51% whereas it is 2.74 ± 0.68% in the rest of the APC map. Probably, these changes are explained by the mechanical effect of the volumetric process on the local hemodynamics of the cortex, leading to compression of the vessels by the tumor. Lack of uniformity in the spatial distribution of PAT (Figure 1C) was observed as well. The blue area in the same quarter of the PAT map means that the pulse wave reached this area with a greater delay than the rest of the cortex: 188 ± 65 ms vs. 82 ± 54 ms, respectively.
After tumor removal, a significant decrease in the amplitude of pulsations was observed in the area around the dissection of the pia matter (dark blue area in Figure 1E) that might be caused by drawing apart the pia matter to reach the tumor. While before surgery the APC average within this region was 2.14 ± 0.67%, it became 1.21 ± 1.02% after intervention. Notably, the mean PAT in the same area increased from 98 ± 70 ms (Figure 1C) to 237 ± 114 ms (Figure 1F). It is worth noting that significant increase in the average APC outside the dissection area was observed: 2.38 ± 1.01% before surgery vs. 3.48 ± 1.05% after it. The average PAT value outside the dissection region decreased moderately from 109 ± 61 to 81 ± 36 ms.
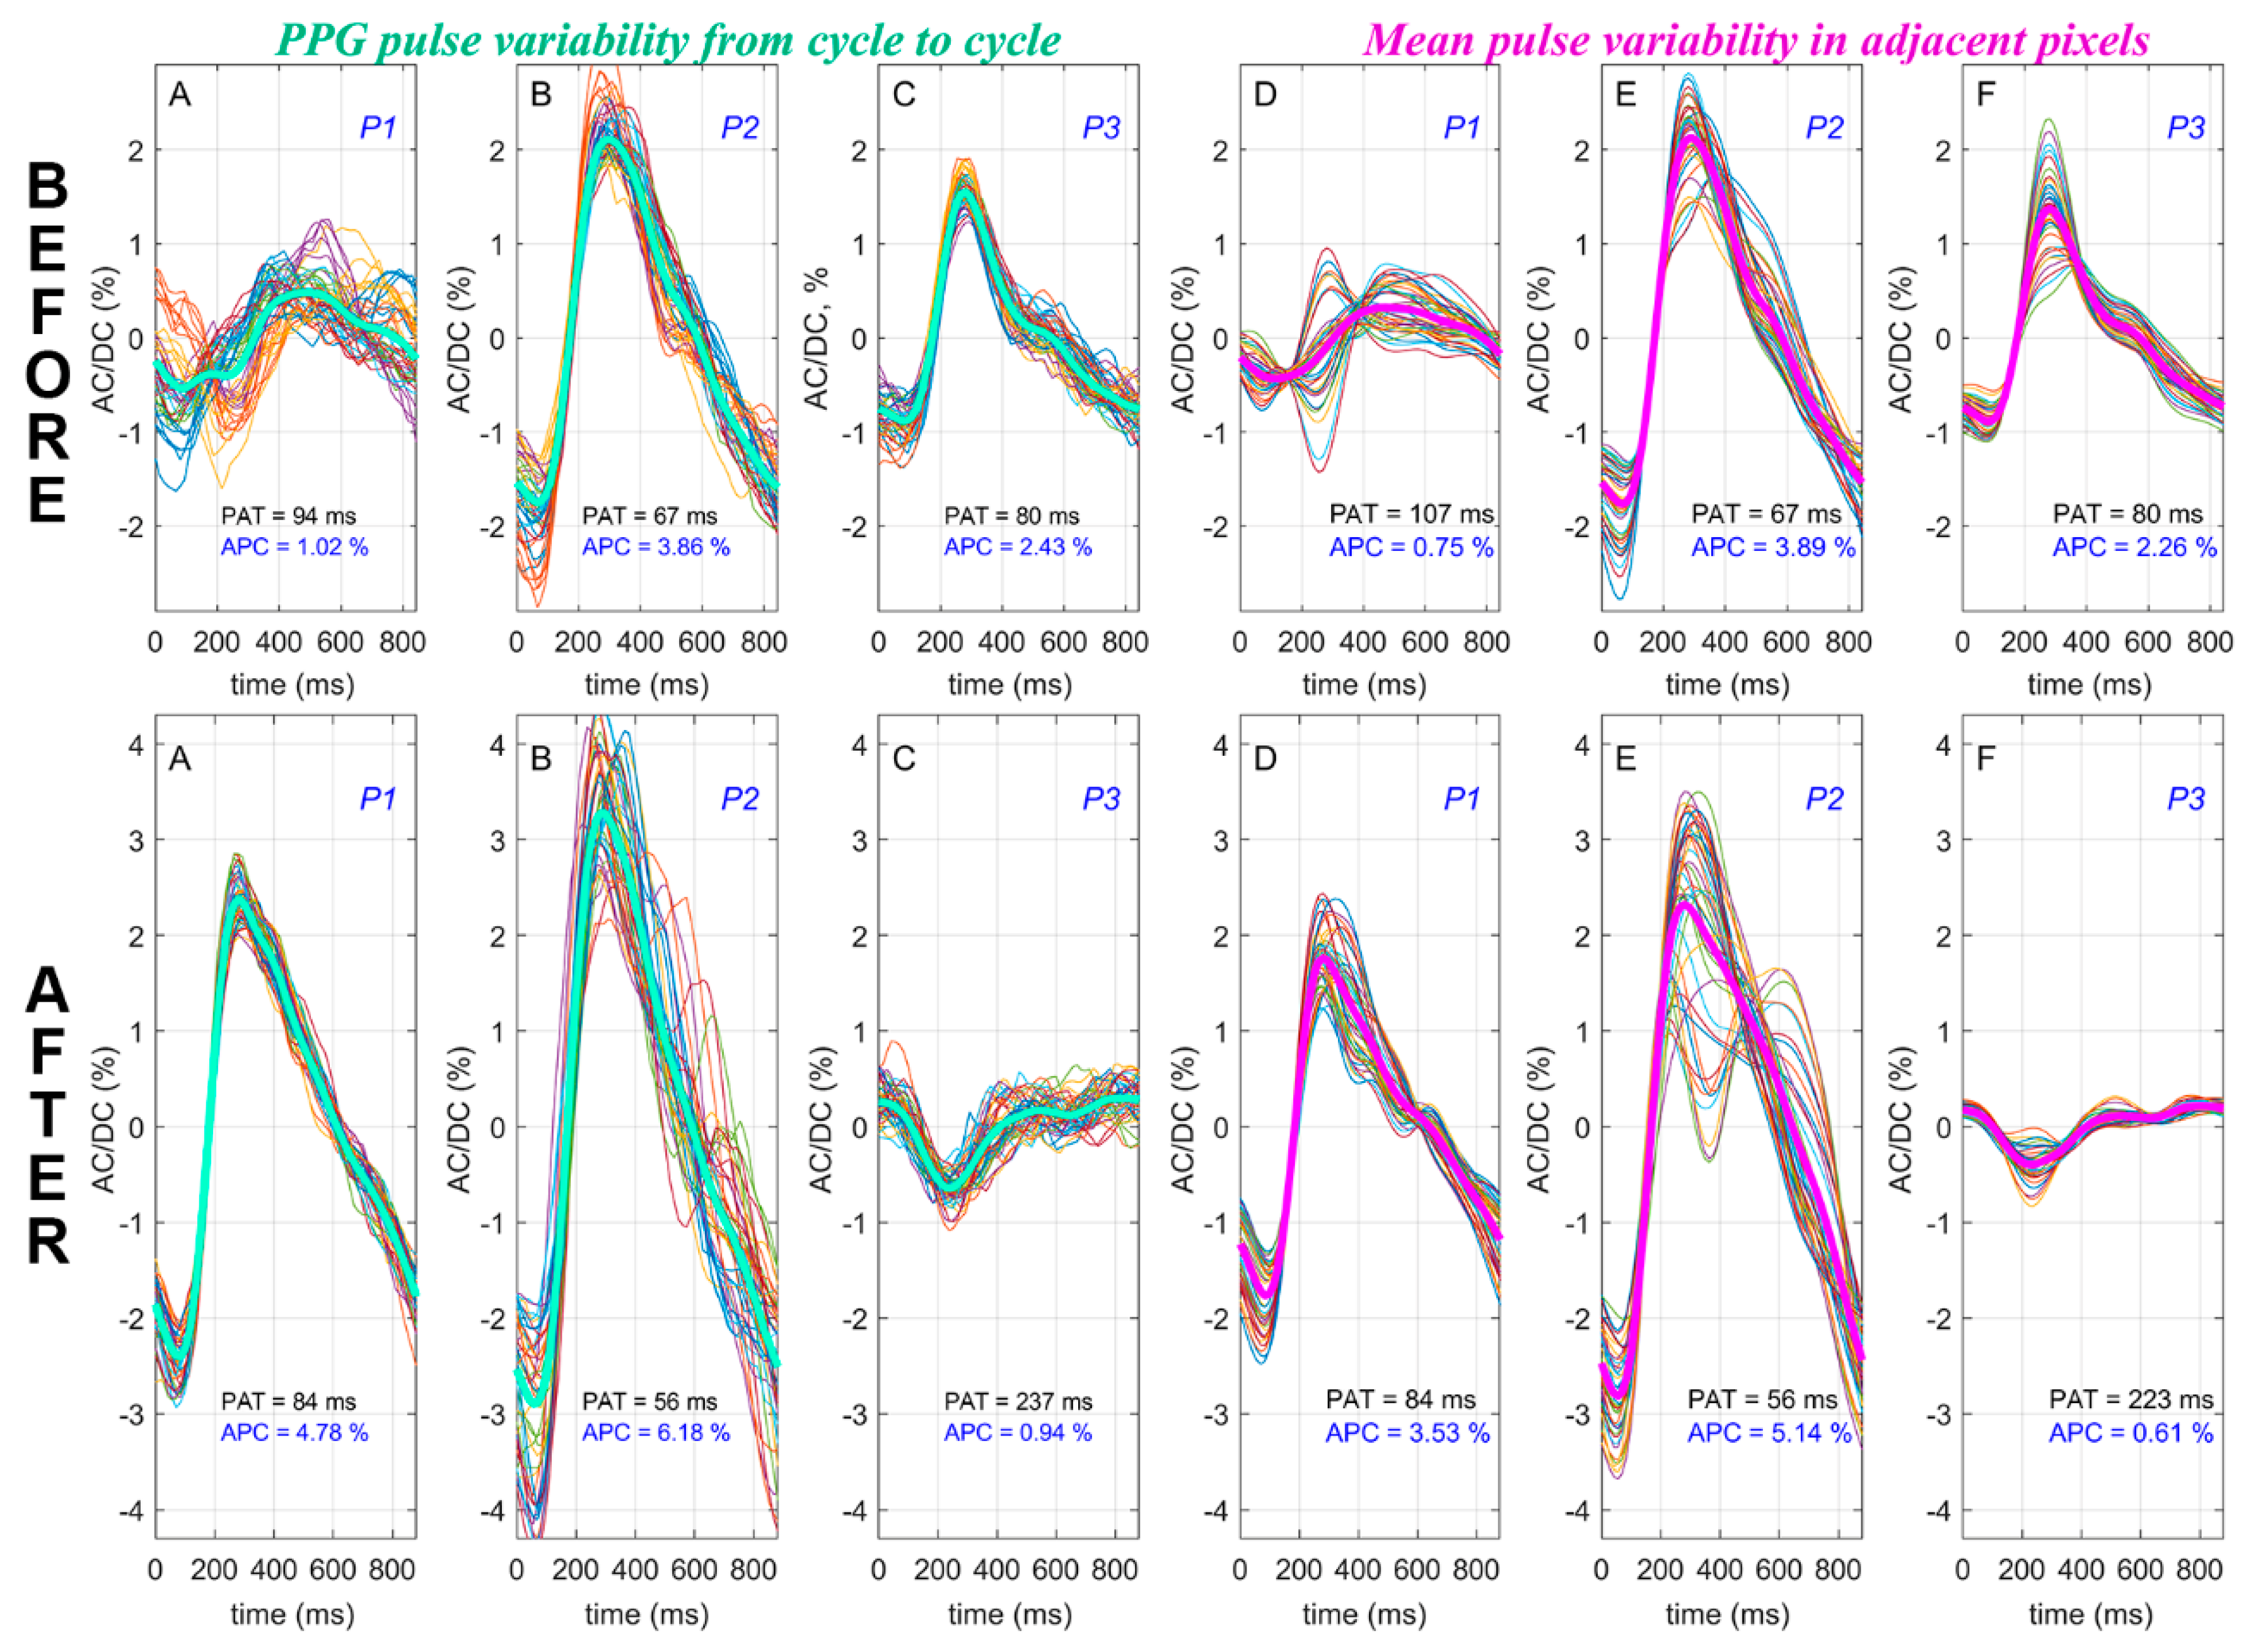
To estimate changes in the pulse shape and its spatial stability, we selected three representative ROIs marked as P1, P2, and P3 in Figure 1. In addition, to illustrate temporal variability of the PPG-pulse shape, we calculated the PPG waveform in the central pixel of each ROI and showed PPG pulses for every cardiac cycle during 40-s of recording by thin colored lines in Figure 2 (graphs A, B, and C in both the lower and upper rows). While in a single pixel we observed the pulse-shape variability in time, the spatial variability was assessed in a ROI of size 7 × 7 pixels. The data are shown in Figure 2, where together with instability of the pulse shape before operation, we found that the shape of the PPG waveforms is also different in different cortex areas. Note that instability of PPG pulses both in time and in space was observed before surgery especially in the area with diminished APC (lower left quarter of the map in Figure 1B). Thick green lines in these graphs show the waveforms averaged over 43 consecutive cardiac cycles. Thus, graphs A, B, and C characterize stability of the PPG pulse in time: the closer the thin lines are to the mean pulse, the more stable the blood pulsations at this point.
Spatial variability of the PPG-pulse shape can be assessed in graphs D, E, and F in Figure 2, where thin color lines show the set of mean PPG pulses calculated in each pixel within the respective ROI. Thick pink lines in these graphs show the waveforms averaged over 49 pixels within each ROI. Before surgery, the lower left part of the cortex is characterized by much higher variability of the pulse shape both in time (Figure 2A, upper row) and in space (Figure 2D, upper row). After tumor removal, in the same area (ROI marked as P1), a steady stabilization of the PPG-pulse shape is observed with a significant increase in the amplitude of the pulsations (see Figure 2A,D in the lower row). Therefore, in the area with initially decreased APC and increased PAT, restoration of PPG-waveform parameters was observed that became comparable with that in the rest of regions not affected by dissection. It is worth noting that, despite a significant decrease in APC inside the dissection region (ROI P3), the PPG-pulse shape remained rather stable after surgery (see Figure 2C,F in the lower row), although PAT was increased almost threefold and the signal had an unusual shape, indicating minimal residual blood flow. The presence of these pulsations gives reason to expect future restoration of blood flow in the area of the injured meninges. Similar results were obtained in three other patients with brain tumors.
3.2. Revascularization of Internal Carotid Artery in Patient with Arterial Atherosclerotic Occlusion
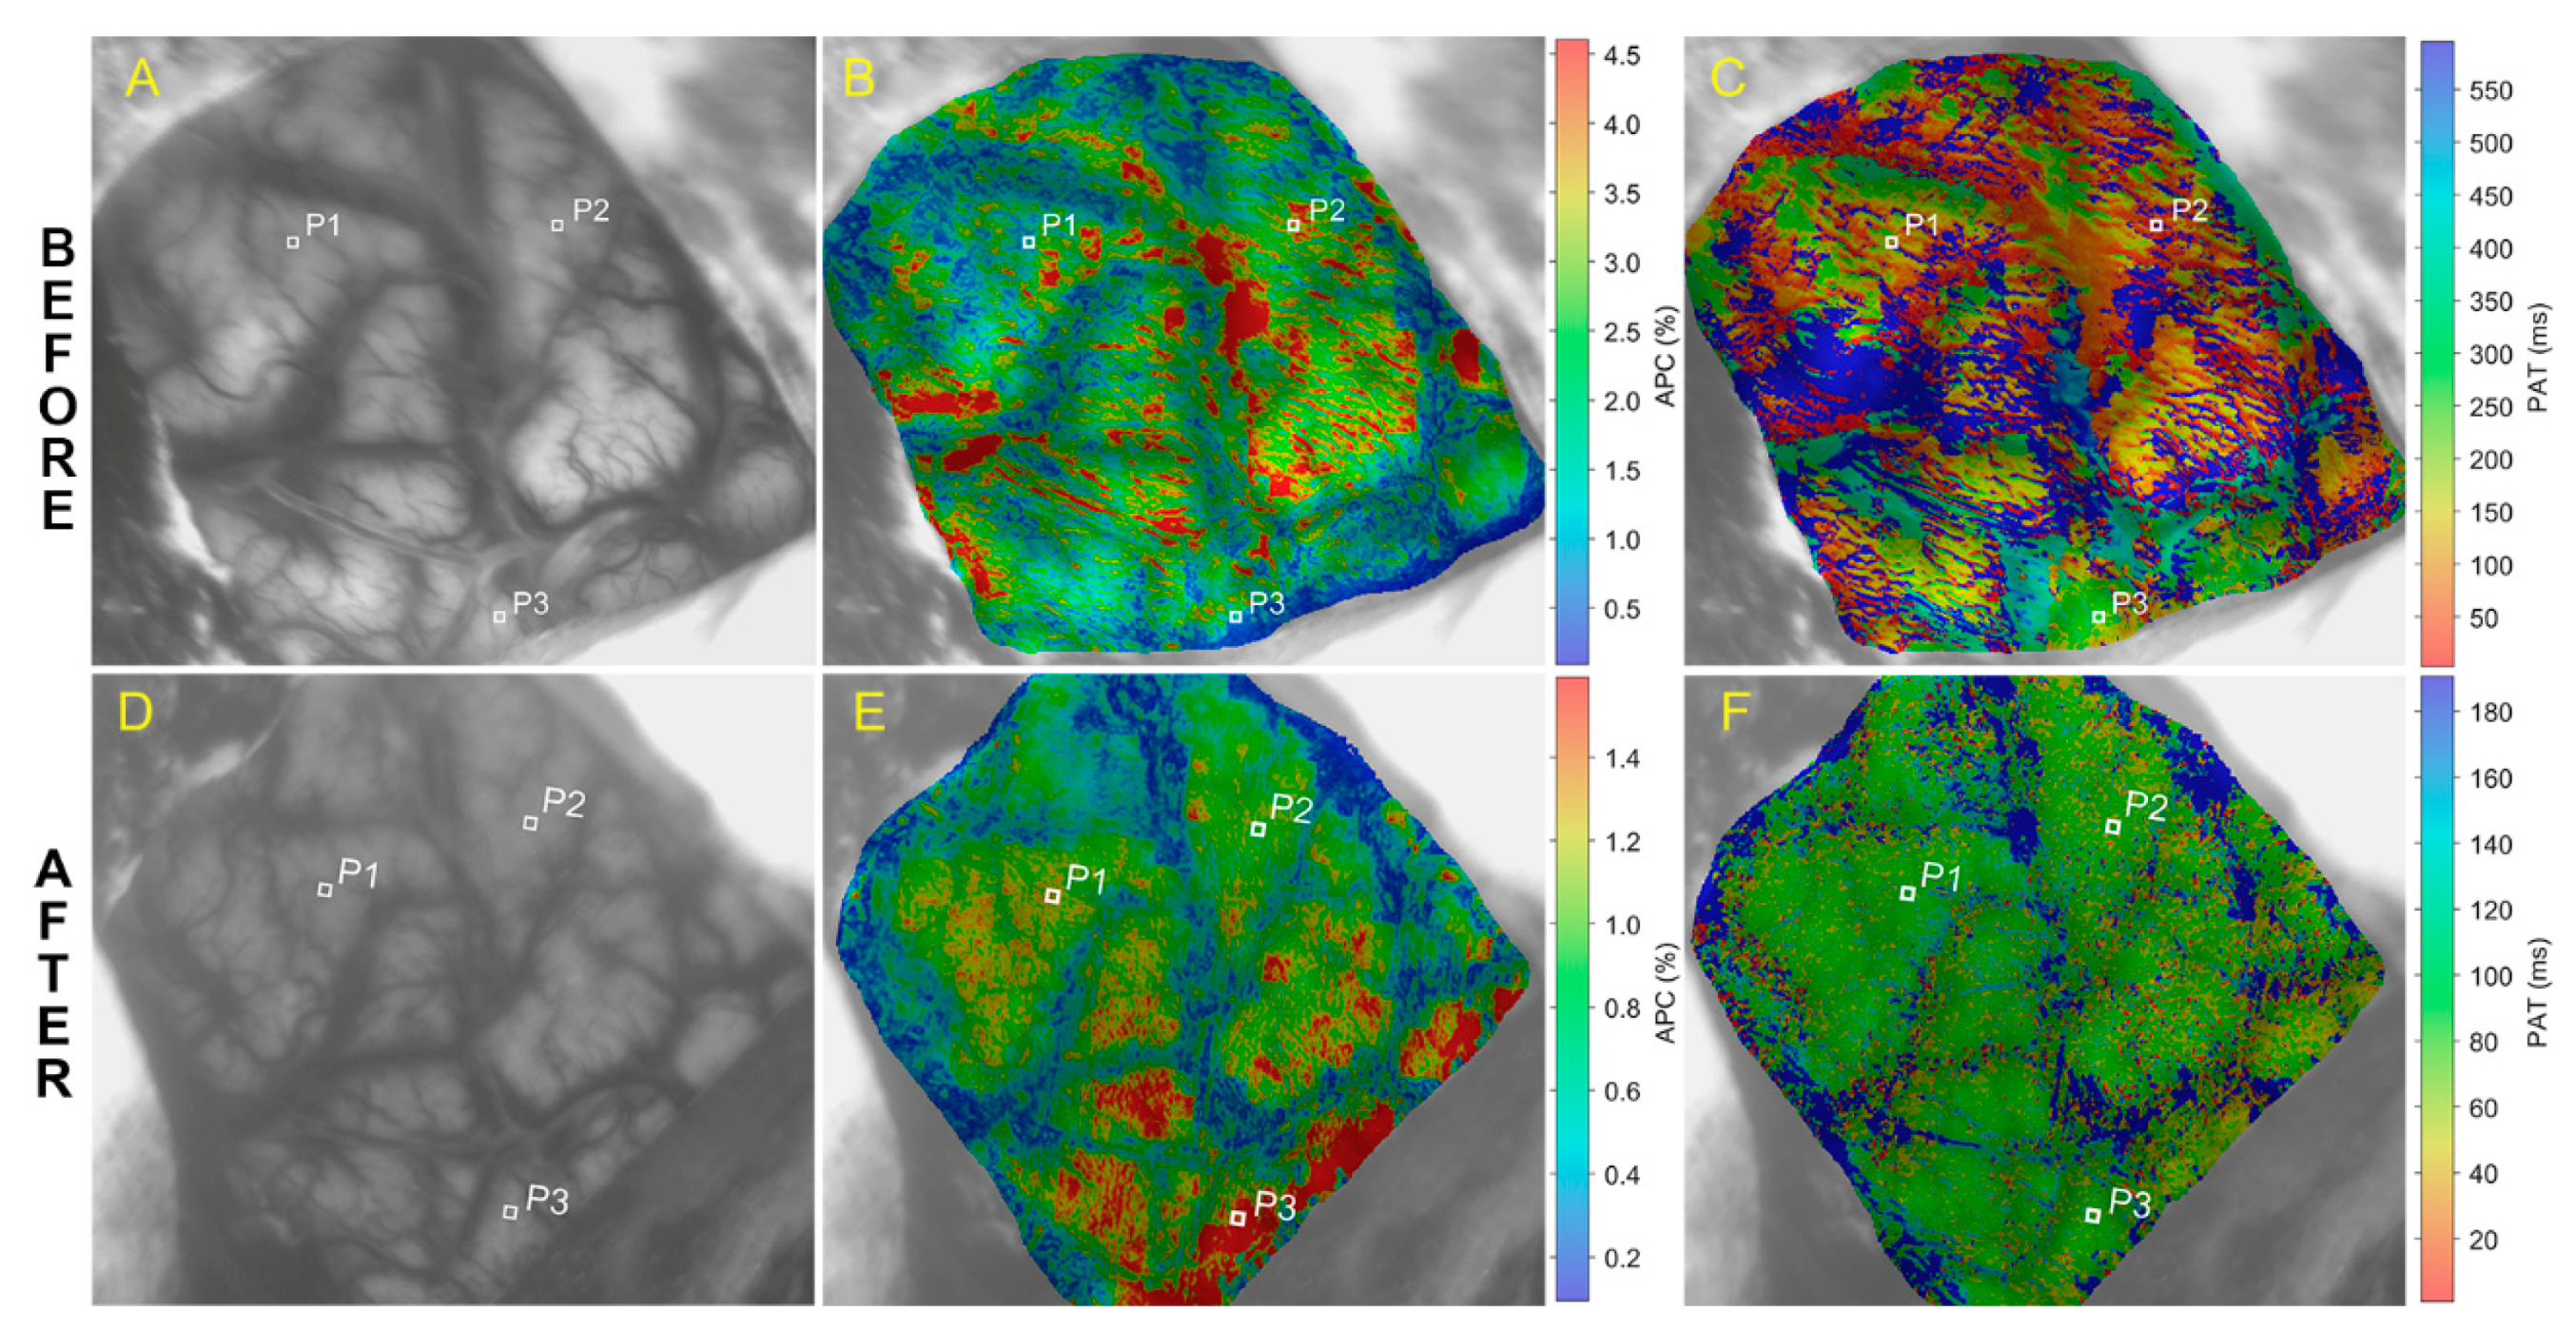
Another pilot experiment was carried out during surgical intervention of a patient with atherosclerotic occlusion of the internal carotid artery after ischemic stroke. The patient underwent an operation of extra-intracranial bypass grafting between the temporal artery and the middle cerebral artery in connection with clinical signs of chronic cerebral hypoperfusion against the background of extracranial occlusion of the internal carotid artery. Images of the open brain and the parameters of the pulsatile blood flow measured before and after applying anastomosis are shown in the upper and lower rows of Figure 3, respectively.
The anastomosis application resulted in significant diminishing of APC in the whole cortex as can be seen by comparing the maps of the parameter in Figure 3B,E (note the big difference in the color scale of these maps). The mean APCs in the whole cortex were 2.13 ± 0.50% and 0.80 ± 0.07% before and after the surgery, respectively. An increased amplitude of pulsations perhaps indicated a decreased vascular tone before surgery. Most likely, this was because blood supply to the brain was accomplished by the collateral artery while the functional vasodilator reserve was maximally involved. With impaired blood supply, the mechanism of cerebral autoregulation did not work due to exhaustion of the limits of vasodilation. We hypothesize that the observed decrease in APC after anastomosis is caused by an increase in the volumetric blood-flow velocity, which, through the autoregulation mechanism, increases the vascular tone, ensuring the constancy of cerebral perfusion. A similar decrease in APC in the cerebral cortex of animals was recently observed in response to an increase in systemic arterial pressure [20].
The assumption about a change in the pathways of the brain’s blood supply was confirmed by comparing the spatial distributions of the PAT parameter before and after anastomosis (Figure 3C vs. Figure 3F). Prior to surgery, PAT had extremely heterogeneous distribution, and its magnitude varied from zero to values, exceeding the cardiac cycle duration (note the limits of the color scale in Figure 3C). After anastomosis, the travel time of the pulse wave turned out to be uniformly distributed (see Figure 3F) with more realistic value of about 140 ms. The prolonged arrival time of the pulse wave before anastomosis was caused by the brain’s supply via the collateral artery. The mean PATs in the whole cortex were 407 ± 137 ms and 147 ± 117 ms before and after the surgery, respectively.
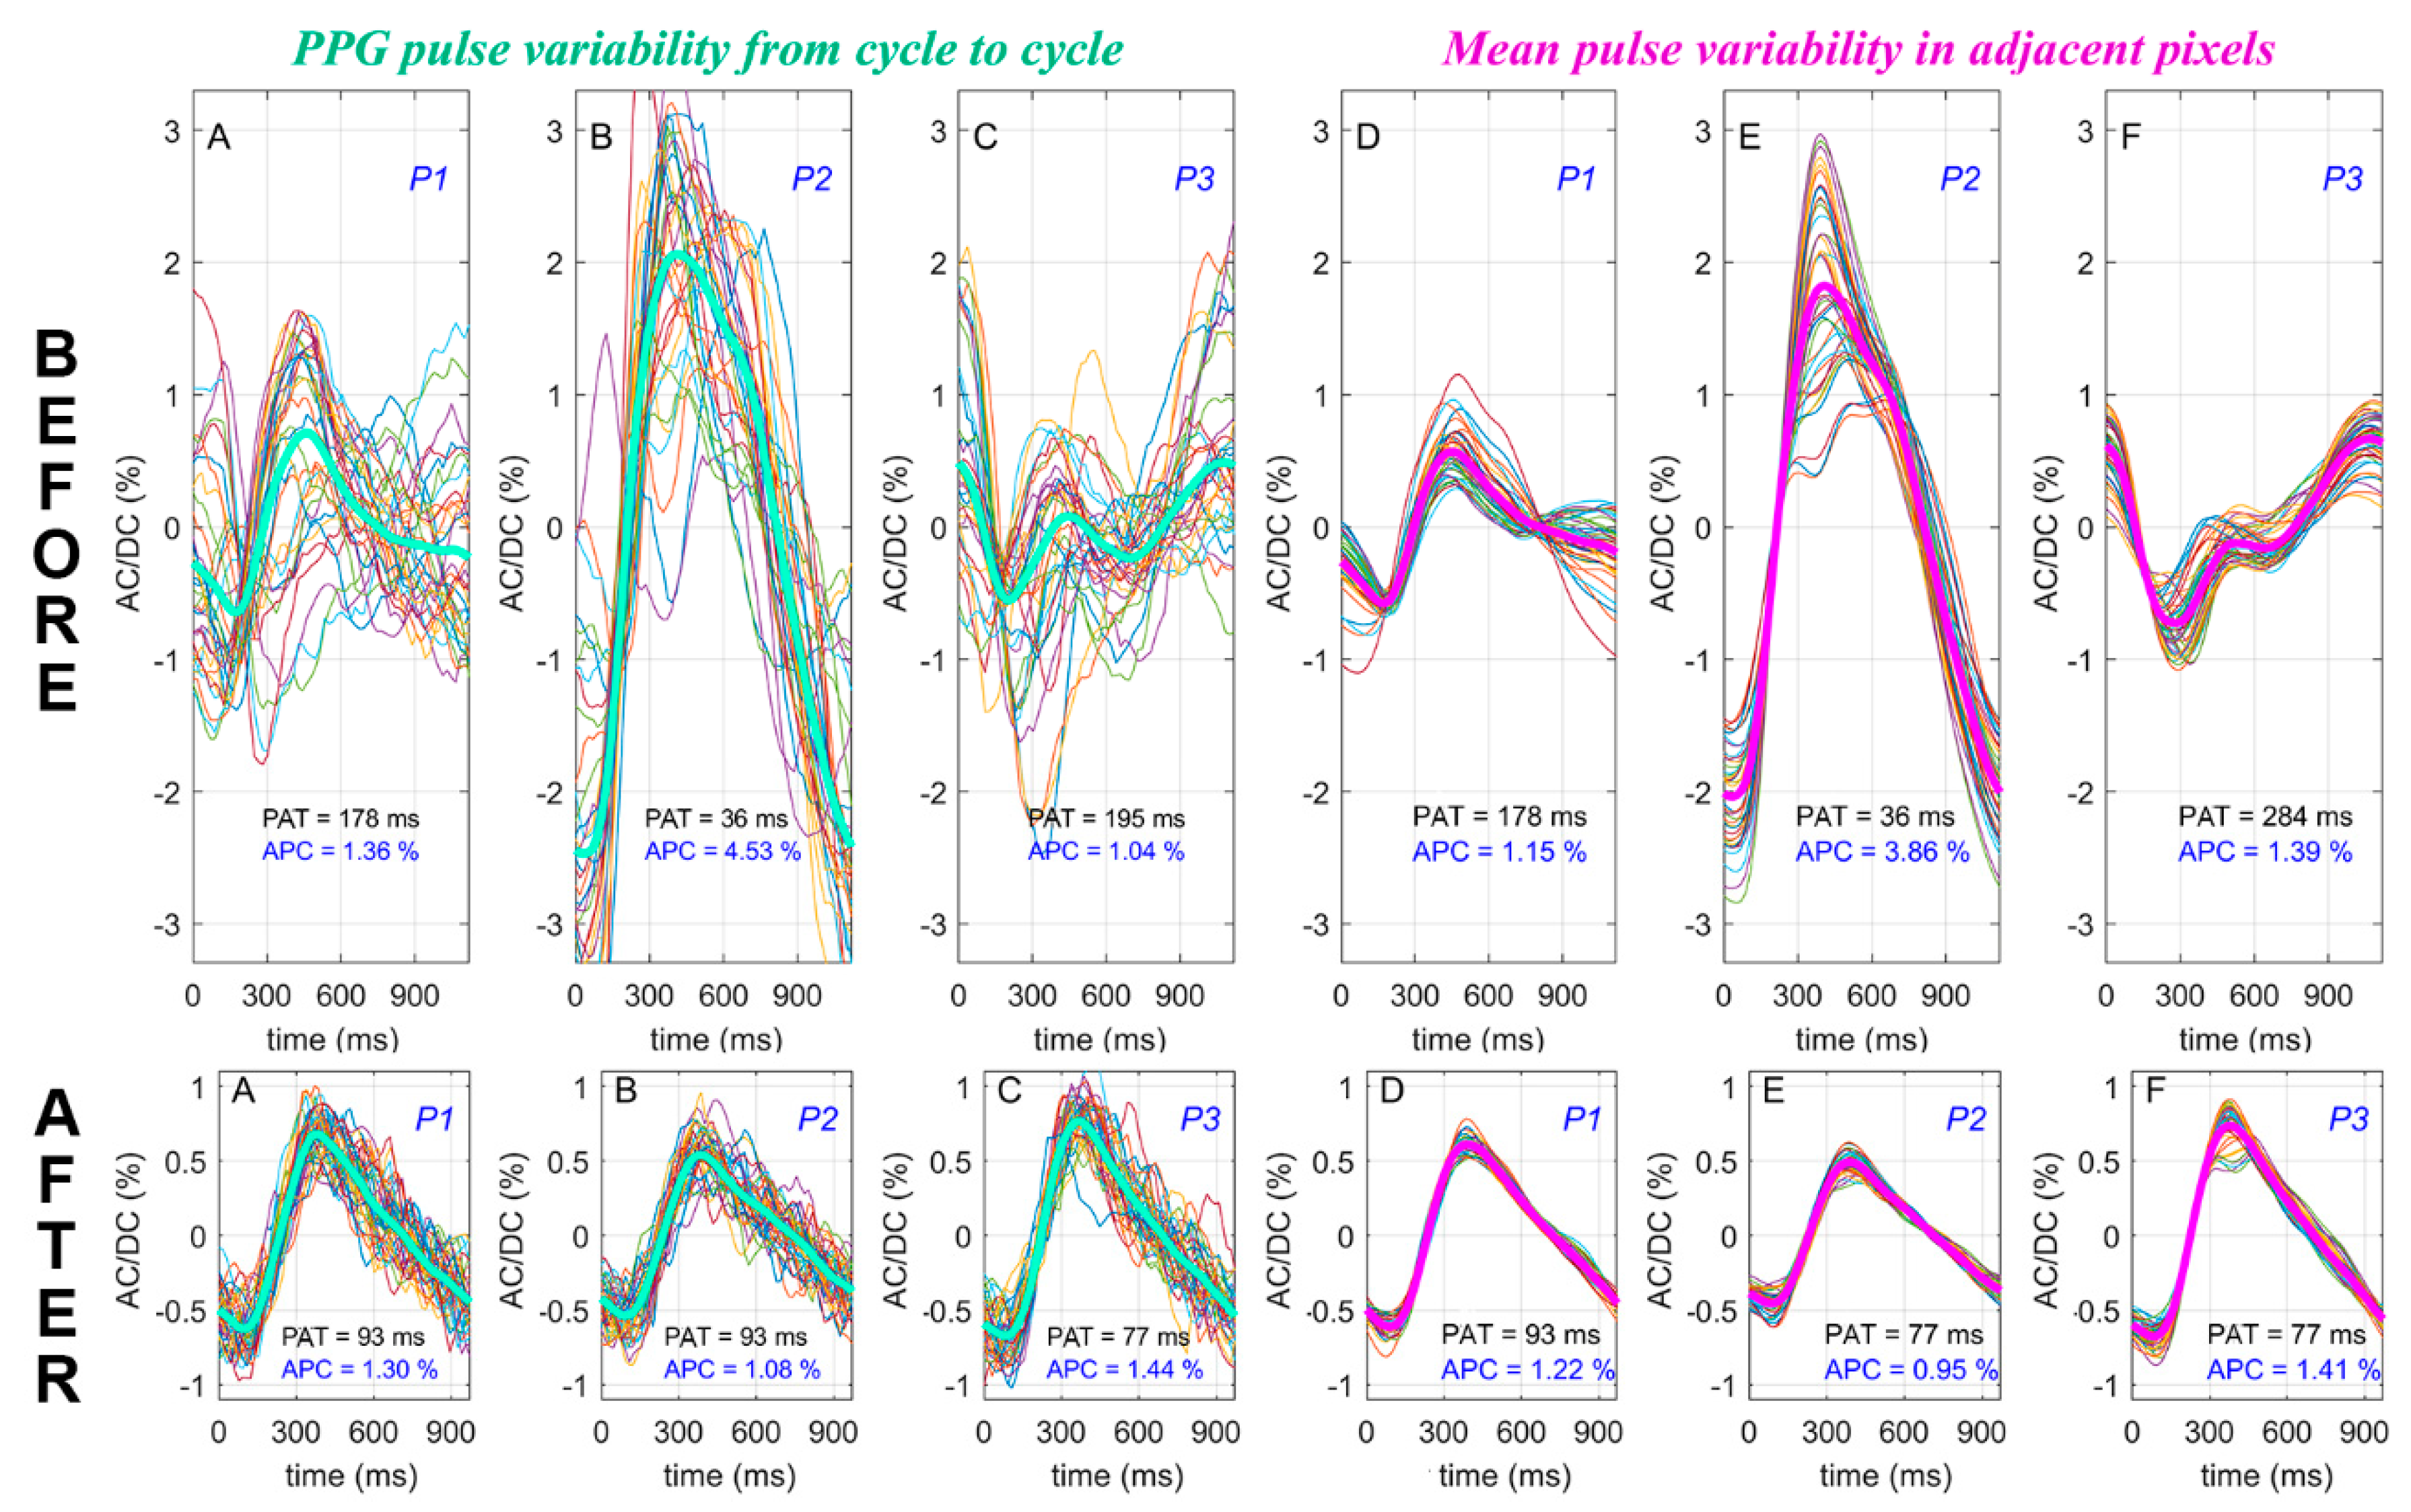
The difference in hemodynamics before and after anastomosis is even more evident in the stability of the PPG-pulse shape. While the upper row in Figure 4 shows variability of the pulse shape in three representative ROIs before surgery, the graphs in the lower row demonstrate the shape variability of PPG pulses in the same ROIs both in time (A–C) and in space (D–F) after anastomosis. As can be seen from the graphs of the upper row in Figure 4, the PPG pulse shape is extremely unstable before surgery. Nevertheless, despite a significant decrease in the amplitude of pulsations, revascularization leads to considerable stabilization of the pulse waveform and recovery of the usual PAT value, as can be seen from the lower row of the graphs.
We hypothesize that atherosclerotic occlusion is the main reason for the observed instability of the blood-pressure wave reaching the cortex, enforcing blood flow to be additionally supplied via various circumferential routes. The observed stabilization of the pulse shape after anastomosis is a consequence of recovery of the direct pathway of blood supply to the cerebral cortex.
4. Discussion
Good quality and highly resolved spatial distributions of hemodynamic parameters APC and PAT were obtained in all studied cases. As evident from Figure 1 and Figure 3, a surgical intervention leads to significant changes in both parameters differently in different areas. As we discuss below, these parameters reveal important information about the spatiotemporal dynamics of cerebral blood flow.
We used an advanced cbPPG system [24] to acquire two-dimensional distribution of the pulsatile blood-flow parameters in the open cortex. All measurements were carried out using incoherent polarized green light (530 ± 30 nm). Since RBCs strongly absorb green light, its penetration depth into the skin tissue does not exceed 0.6 mm [29]. Considering a higher density of blood vessels in the cortex, we suppose that green light penetrates at even smaller depths into the cortex, thus interacting mainly with upper microvessels. Beside this, we have to consider the difference in the anatomical and physiological structures of blood vessels in the cortex and skin [19]. Cortical vessels are organized in the principle of reverse radial branching: from the cerebral cortex to the subcortical structures. Arteries and arterioles are situated at the upper surface of the cortex, whereas capillaries are located inside and have an additional layer of glial cells that also absorb green light. Since the green light first interacts with pulsatile arteries, its heart-related modulation in the case of interaction with the cortex stems from periodical modulation of the blood volume in these vessels. However, the detailed mechanism of light modulation has not yet been established. Obviously, the source of the variable component is not only medium-sized arteries but also smaller vessels, which branch to a minimum size before penetrating through the cortex to the underlying sections (cortical arteries), thus becoming unresolved in the current camera resolution. This is indicated by the continuous distribution of pulsating areas outside the regions with distinct vascular structure.
Nevertheless, we cannot completely exclude the presence of light modulation due to periodical mechanical compression of brain tissue by large pulsating arteries [14]. Signs of the latter modulation mechanism can be seen while comparing the APC maps before and after revascularization (Figure 3B,E). If small arteries are well resolved in Figure 3B, being highlighted by red because of the higher amplitude of the blood volume pulsations, the APC is more uniformly distributed within areas bounded by blue-highlighted, non-pulsating veins in Figure 3E. The relationship between both modulation mechanisms has not yet been established. It is possible that it has a complex, nonlinear character. The contribution to the pulsatile component of wide pulsating veins is less probable, since the APC of these vessels is several times lower than the surroundings in all maps. At the same time, venous blood flow can determine the DC component of the PPG waveform due to the significant volume of blood in these vessels.
Regardless of the theoretical model of light modulation in blood vessels, the APC parameter in cbPPG systems describes the relative change of blood flow arteries of medium and small caliber, as it is seen comparing APC maps (Panels B and E in Figure 1 and Figure 3) before and after surgical intervention. The feature of cbPPG to visualize blood flow simultaneously in the whole cortex favorably distinguishes this system from other intraoperative imaging techniques in open neurovascular surgery. It should be noted that, in our pilot experiments, we did not intend to reach the highest possible resolution to visualize the smallest pulsatile arteries. Nevertheless, it can be readily achieved by zooming in the camera lens and/or by using a camera matrix with higher pixel numbers. Recent video-capillaroscopy experiments showed feasibility of resolving PPG waveforms in the smallest skin capillaries [18,30]. In addition, a relatively simple algorithm for processing PPG data allows software to be developed to obtain results in real time, with a delay of about 10 seconds, necessary to accumulate information about several cardiac cycles.
In our experiments, the variations of the light intensity reemitted from the cortical microvessels were recorded synchronously with ECG, thus allowing for accurate measurements of the time needed for the blood-pressure wave to travel from the heart to the cortex (PAT) [24]. This is valuable feature for brain-pathology assessment and prognosis because pulsatile, heart-related variations in blood pressure and flow play an important role in homeostasis [31]. It should be noted that there are only two noninvasive methods that allow for full-field imaging of microcirculation pulsatility: (i) LSCI [32], and (ii) cbPPG presented in this study. Despite the fact that both systems are based on processing of data obtained by a digital camera, technically they are fundamentally different. While LSCI fundamentally requires the use of coherent light [33], cbPPG operates at incoherent illumination [24]. This difference makes the latter method more advantageous. (i) LEDs used in cbPPG are more stable and reliable light sources providing more uniform illumination than can be done by a laser-diode needed for LSCI. (ii) LSCI uses high-speed cameras (114 frames per second, [32]) in contrast to the conventional camera (30–40 frames per second) in cbPPG. (iii) Intensity of the brain illumination in the LSCI system was several times higher than (20 mW/cm2 in versus 3 mW/cm2). An advanced feature of the cbPPG system is simultaneous, spatially resolved (in every pixel) assessment of PAT in the full field of view of the cortex. Since the heart is the only generator of a blood-pressure wave in the cardiovascular system, we suppose that the relative difference in PAT observed in adjacent areas of the cortex indicates a difference in the method of blood supply. It should be underlined that surgical intervention has changed significantly the spatial distribution of the PAT parameter in all our experiments. In addition, the shape of PPG pulses and its variability in space and time (see Figure 2 and Figure 4) bears important information about the processes of blood supply to cerebral microvessels.
Intraoperative video recording of the cerebral cortex illuminated with green light and subsequent processing of recorded images synchronously with ECG made it possible to assess the parameters of blood pulsations in cortical microvessels in most of the regions accessible for observation with high spatial and temporal resolution. In the case of the patient without a significant lesion of the cerebral arteries, the APC and PAT parameters were rather evenly distributed over the cortex in the preoperative period (see Figure 1B,C). However, postoperative maps (Figure 1E,F) clearly revealed an area of pia mater damage associated with transcortical access to the underlying structures of the brain. In this area, the PPG waveforms are distorted as seen in panels C and F of the lower row in Figure 2 that probably corresponded to temporal violation of microvessel blood flow in this region of the cortex. It is worth noting that our experiments revealed high sensitivity of PPG-pulse-shape variability to changes in hemodynamics. Recently reported experimental observation of significant increases in variability of PPG-pulse shape measured at the facial area of patients with systemic sclerosis [34] may have similar physiological reasons.
In the case of vascular lesion, APC in the preoperative period was also distributed rather evenly (Figure 3B). In contrast, the PAT map (Figure 3C) was highly heterogeneous, which was the result of high instability and asynchronicity of PPG waveforms shown in the upper row in Figure 4. Revascularization of the middle cerebral artery led to restoration of blood pulsation synchronism in cortical microvessels (the lower row in Figure 4). After surgical intervention, the spatial distribution of both APC and PAT became uniform (Figure 3E,F). The observed postoperative decrease in the APC parameter is mainly due to a decrease in the amplitude of the heart-related alternating component. We hypothesize that more efficient blood supply to previously hypoperfused areas caused by anastomosis triggers the compensatory mechanism that increases the tone of arterial vessels, thus increasing regional vascular resistance. Accordingly, the amplitude of arterial lumen oscillations decreases, leading to a paradoxical drop in APC. A deeper study of basic reasons for light interaction with blood vessels, including animal experiments, will certainly offer a reliable interpretation of the observations.
It is worth noting that the PPG technique cannot provide accurate quantitative evaluation of the volumetric velocity of cerebral blood flow. However, the proposed system can obviously be useful for a semiquantitative analysis of the dynamics of such indicators such as vascular tone and functional reserve of cerebral blood flow. These indicators are very important for both assessing the effectiveness of surgery and revealing the regions of critical circulatory disorders by using vasodilators (e.g., carbonic anhydrase inhibitors) or by analyzing the correlation between APC and systemic arterial pressure. The parameters PAT, pulse shape, and their variability can indicate areas of the cerebral cortex with the most significant change in cerebral blood supply.
In conclusion, we showed that the green-light cbPPG system offers a new approach to objective assessment of the blood-flow changes in cerebral microvessels during surgical intervention. Synchronous recording of video and ECG allowed us to obtain highly resolved spatial distributions of three parameters of the blood flow in cerebral microvessels (APC, PAT, and shape of PPG pulses) that provides useful information for maximizing positive surgical outcome and minimizing risk. The low cost of the components of the developed cbPPG system, the high information content and noninvasive nature of the method, as well as its ease of use determine great prospects for its wide application in clinical practice.
Author Contributions
Conceptualization, O.V.M., A.V.S., and A.A.K.; data curation, A.A.K.; formal analysis, O.V.M.; funding acquisition, A.A.K. and R.V.R.; investigation, O.V.M. and A.V.S.; methodology, O.V.M. and A.V.S.; project administration, O.V.M. and A.A.K.; resources, A.V.S.; software, A.A.K. and R.V.R.; visualization, A.A.K.; writing—original draft, A.A.K.; writing—review and editing, O.V.M., A.V.S., A.A.K., and R.V.R. All authors have read and agreed to the published version of the manuscript.
Funding
This study was funded by the Ministry of Science and Higher Education of the Russian Federation, grant No. 075-15-2020-800.
Conflicts of Interest
The authors declare no conflict of interest.
References
- Fredrickson, V.L.; Russin, J.J.; Strickland, B.A.; Bakhsheshian, J.; Amar, A.P. Intraoperative imaging for vascular lesions. Neurosurg. Clin. N. Am. 2017, 28, 603–613. [Google Scholar] [CrossRef]
- Sutherland, B.A.; Rabie, T.; Buchan, A.M. Cerebral Angiogenesis, Laser Doppler Flowmetry to Measure Changes in Cerebral Blood Flow; Milner, R., Ed.; Methods in Molecular Biology; Humana Press: New York, NY, USA, 2014; Volume 1135, pp. 237–248. ISBN 978-1-4939-0319-1. [Google Scholar]
- Raabe, A.; Beck, J.; Gerlach, R.; Zimmermann, M.; Seifert, V. Near-infrared indocyanine green video angiography: A new method for intraoperative assessment of vascular flow. Neurosurgery 2003, 52, 132–139. [Google Scholar]
- Dunn, A.K. Laser speckle contrast imaging of cerebral blood flow. Ann. Biomed. Eng. 2012, 40, 367–377. [Google Scholar] [CrossRef] [Green Version]
- Parthasarathy, A.B.; Fox, D.J.; Dunn, A.K.; Weber, E.L.; Richards, L.M. Laser speckle contrast imaging of cerebral blood flow in humans during neurosurgery: A pilot clinical study. J. Biomed. Opt. 2010, 15, 66030. [Google Scholar] [CrossRef]
- Hecht, N.; Woitzik, J.; Dreier, J.P.; Vajkoczy, P. Intraoperative monitoring of cerebral blood flow by laser speckle contrast analysis. Neurosurg. Focus 2009, 27, E11. [Google Scholar] [CrossRef] [PubMed]
- Zakharov, P.; Völker, A.C.; Wyss, M.T.; Haiss, F.; Calcinaghi, N.; Zunzunegui, C.; Buck, A.; Scheffold, F.; Weber, B. Dynamic laser speckle imaging of cerebral blood flow. Opt. Express 2009, 17, 13904–13917. [Google Scholar] [CrossRef] [PubMed] [Green Version]
- Kazmi, S.M.S.; Richards, L.M.; Schrandt, C.J.; Davis, M.A.; Dunn, A.K. Expanding applications, accuracy, and interpretation of laser speckle contrast imaging of cerebral blood flow. J. Cereb. Blood Flow Metab. 2015, 35, 1076–1084. [Google Scholar] [CrossRef] [PubMed] [Green Version]
- Kazmi, S.M.S.; Faraji, E.; Davis, M.A.; Huang, Y.-Y.; Zhang, X.; Dunn, A.K. Flux or speed? Examining speckle contrast imaging of vascular flows. Biomed. Opt. Express 2018, 6, 2588–2608. [Google Scholar] [CrossRef] [Green Version]
- Lapi, D.; Colantuoni, A. Remodeling of cerebral microcirculation after ischemia-reperfusion. J. Vasc. Res. 2015, 52, 22–31. [Google Scholar] [CrossRef]
- Allen, J.; Howell, K. Microvascular imaging: Techniques and opportunities for clinical physiological measurements. Physiol. Meas. 2014, 35, R91–R141. [Google Scholar] [CrossRef]
- Hertzman, A.B. The blood supply of various skin areas as estimated by the photoelectric plethysmograph. Am. J. Physiol. 1938, 124, 328–340. [Google Scholar] [CrossRef]
- Mannheimer, P.D. The light-tissue interaction of pulse oximetry. Anesth. Analg. 2007, 105, S10–S17. [Google Scholar] [CrossRef] [PubMed]
- Kamshilin, A.A.; Nippolainen, E.; Sidorov, I.S.; Vasilev, P.V.; Erofeev, N.P.; Podolian, N.P.; Romashko, R.V. A new look at the essence of the imaging photoplethysmography. Sci. Rep. 2015, 5, 10494. [Google Scholar] [CrossRef] [PubMed] [Green Version]
- Moço, A.V.; Stuijk, S.; de Haan, G. New insights into the origin of remote PPG signals in visible light and infrared. Sci. Rep. 2018, 8, 8501. [Google Scholar] [CrossRef] [Green Version]
- Wukitsch, M.W.; Petterson, M.T.; Tobler, D.R.; Pologe, J.A. Pulse oximetry: Analysis of theory, technology, and practice. J. Clin. Monit. Comput. 1988, 4, 290–301. [Google Scholar] [CrossRef]
- Verkruysse, W.; Svaasand, L.O.; Nelson, J.S. Remote plethysmographic imaging using ambient light. Opt. Express 2008, 16, 21434–21445. [Google Scholar] [CrossRef] [Green Version]
- Volkov, M.V.; Margaryants, N.B.; Potemkin, A.V.; Volynsky, M.A.; Gurov, I.P.; Mamontov, O.V.; Kamshilin, A.A. Video capillaroscopy clarifies mechanism of the photoplethysmographic waveform appearance. Sci. Rep. 2017, 7, 13298. [Google Scholar] [CrossRef]
- Nonaka, H.; Akima, M.; Nagayama, T.; Hatori, T.; Zhang, Z.; Ihara, F. Microvasculature of the human cerebral meninges. Neuropathology 2003, 23, 129–135. [Google Scholar] [CrossRef]
- Lyubashina, O.A.; Mamontov, O.V.; Volynsky, M.A.; Zaytsev, V.V.; Kamshilin, A.A. Contactless assessment of cerebral autoregulation by photoplethysmographic imaging at green illumination. Front. Neurosci. 2019, 13, 1235. [Google Scholar] [CrossRef]
- Kamshilin, A.A.; Sidorov, I.S.; Babayan, L.; Volynsky, M.A.; Giniatullin, R.; Mamontov, O.V. Accurate measurement of the pulse wave delay with imaging photoplethysmography. Biomed. Opt. Express 2016, 7, 5138–5147. [Google Scholar] [CrossRef] [Green Version]
- Fleischhauer, V.; Ruprecht, N.; Zaunseder, S. Camera-based spatial assessment of perfusion upon stimuli. Curr. Dir. Biomed. Eng. 2019, 5, 105–108. [Google Scholar] [CrossRef]
- Kamshilin, A.A.; Miridonov, S.V.; Teplov, V.; Saarenheimo, R.; Nippolainen, E. Photoplethysmographic imaging of high spatial resolution. Biomed. Opt. Express 2011, 2, 996–1006. [Google Scholar] [CrossRef] [PubMed] [Green Version]
- Kamshilin, A.A.; Krasnikova, T.V.; Volynsky, M.A.; Miridonov, S.V.; Mamontov, O.V. Alterations of blood pulsations parameters in carotid basin due to body position change. Sci. Rep. 2018, 8, 13663. [Google Scholar] [CrossRef] [PubMed]
- Kearney, J.K.; Thompson, W.B.; Boley, D.L. Optical flow estimation: An error analysis of gradient-based methods with local optimization. IEEE Trans. Pattern Anal. Mach. Intell. 1987, PAMI-9, 229–244. [Google Scholar] [CrossRef] [PubMed] [Green Version]
- Allen, J. Photoplethysmography and its application in clinical physiological measurement. Physiol. Meas. 2007, 28, R1–R39. [Google Scholar] [CrossRef] [PubMed] [Green Version]
- Reisner, A.; Shaltis, P.A.; McCombie, D.; Asada, H.H. Utility of the photoplethysmogram in circulatory monitoring. Anesthesiology 2008, 108, 950–958. [Google Scholar] [CrossRef] [PubMed] [Green Version]
- Hemon, M.C.; Phillips, J.P. Comparison of foot finding methods for deriving instantaneous pulse rates from photoplethysmographic signals. J. Clin. Monit. Comput. 2016, 30, 157–168. [Google Scholar] [CrossRef] [Green Version]
- Bashkatov, A.N.; Genina, E.A.; Kochubey, V.I.; Tuchin, V.V. Optical properties of human skin, subcutaneous and mucous tissues in the wavelength range from 400 to 2000 nm. J. Phys. D. Appl. Phys. 2005, 38, 2543–2555. [Google Scholar] [CrossRef]
- Margaryants, N.B.; Sidorov, I.S.; Volkov, M.V.; Gurov, I.P.; Mamontov, O.V.; Kamshilin, A.A. Visualization of skin capillaries with moving red blood cells in arbitrary area of the body. Biomed. Opt. Express 2019, 10, 4896–4906. [Google Scholar] [CrossRef]
- Wagshul, M.E.; Eide, P.K.; Madsen, J.R. The pulsating brain: A review of experimental and clinical studies of intracranial pulsatility. Fluids Barriers CNS 2011, 8, 5. [Google Scholar] [CrossRef] [Green Version]
- Postnov, D.D.; Erdener, E.; Kilic, K.; Boas, D.A. Cardiac pulsatility mapping and vessel type identification using laser speckle contrast imaging. Biomed. Opt. Express 2018, 9, 6388–6397. [Google Scholar] [CrossRef] [PubMed]
- Postnov, D.D.; Cheng, X.; Erdener, S.E.; Boas, D.A. Choosing a laser for laser speckle contrast imaging. Sci. Rep. 2019, 9, 2542. [Google Scholar] [CrossRef] [PubMed] [Green Version]
- Mamontov, O.V.; Krasnikova, T.V.; Volynsky, M.A.; Anokhina, N.A.; Shlyakhto, E.V.; Kamshilin, A.A. Novel instrumental markers of proximal scleroderma provided by imaging photoplethysmography. Physiol. Meas. 2020, 41, 44004. [Google Scholar] [CrossRef] [PubMed]
Figure 1.
Mapping the blood pulsations parameters in the brain cortex in the case of a patient with a tumor: The upper and lower rows of images of the open brain were obtained before and after tumor resection, respectively. Panels (A) and (D) show photographs of the open brain with the dissection area indicated by a yellow line and three selected regions of interest (ROIs) marked as P1, P2, and P3. Spatial distributions of amplitude of the pulsatile component (APC) and pulse arrival time (PAT) overlaid with still images of the open brain cortex are shown in (B), (E) and (C), (F), respectively. The color scales on the right side of images (B) and (E) show APC in percent, whereas that of images (C) and (F) is PAT in milliseconds.

Figure 2.
Variations of the photoplethysmography (PPG)-pulse shape in time and space in the case of a tumor: Thin color lines in (A–C) show PPG pulses of 43 consecutive cardiac cycles calculated in the central pixel of a region of interest (ROI) marked by P1, P2, and P3, respectively. The positions of these ROIs in the cortex are shown in Figure 1. Thick green lines in these graphs are PPG pulses averaged over the cardiac cycles. The thin color lines in graphs (D–F) show the mean PPG pulses calculated in each of 49 neighboring pixels within respective ROIs marked by P1, P2, or P3. The thick pink lines in these graphs are the waveforms averaged over all pixels within the ROI. The upper and lower rows show the graphs before and after surgery, respectively.

Figure 3.
Parameters of pulsatile blood flow in an open brain cortex before (upper row) and after (lower row) anastomosis application: The maps of the APC and PAT in panels (B), (C) and (E), (F) are overlaid with still images shown in photographs (A) and (D) of the cortex before and after surgery, respectively. The color scales on the right side of images (B) and (E) show APC in percent, whereas that of images (C) and (F) is PAT in milliseconds. Small white scares with markers P1, P2, and P3 indicate the position of three representative ROIs with size of 7 × 7 pixels.

Figure 4.
Variations of PPG-pulse shape in time and space in the case of carotid artery revascularization: The thin color lines in (A−C) show PPG pulses of 35 consecutive cardiac cycles calculated in the central pixel of ROIs marked by P1, P2, and P3, respectively. The positions of these ROIs in the cortex are shown in Figure 3. The thick green lines in these graphs are PPG pulses averaged over the cardiac cycles. The thin color lines in graphs (D−F) show the mean PPG pulses calculated in each of 49 neighboring pixels within respective ROIs marked by P1, P2, or P3. The thick pink lines in these graphs are the waveforms averaged over all pixels within the ROI. The upper and lower rows show the graphs before and after surgery, respectively.

© 2020 by the authors. Licensee MDPI, Basel, Switzerland. This article is an open access article distributed under the terms and conditions of the Creative Commons Attribution (CC BY) license (http://creativecommons.org/licenses/by/4.0/).
Share and Cite
MDPI and ACS Style
Mamontov, O.V.; Shcherbinin, A.V.; Romashko, R.V.; Kamshilin, A.A. Intraoperative Imaging of Cortical Blood Flow by Camera-Based Photoplethysmography at Green Light. Appl. Sci. 2020, 10, 6192. https://doi.org/10.3390/app10186192
AMA Style
Mamontov OV, Shcherbinin AV, Romashko RV, Kamshilin AA. Intraoperative Imaging of Cortical Blood Flow by Camera-Based Photoplethysmography at Green Light. Applied Sciences. 2020; 10(18):6192. https://doi.org/10.3390/app10186192
Chicago/Turabian StyleMamontov, Oleg V., Anton V. Shcherbinin, Roman V. Romashko, and Alexei A. Kamshilin. 2020. "Intraoperative Imaging of Cortical Blood Flow by Camera-Based Photoplethysmography at Green Light" Applied Sciences 10, no. 18: 6192. https://doi.org/10.3390/app10186192
Note that from the first issue of 2016, this journal uses article numbers instead of page numbers. See further details here.