Content Adaptation and Depth Perception in an Affordable Multi-View Display


UpnaLab, Universidad Pública de Navarra, Encinas, Campus Arrosadia, 31006 Pamplona, Spain
*
Authors to whom correspondence should be addressed.
Appl. Sci. 2020, 10(20), 7357; https://doi.org/10.3390/app10207357
Submission received: 16 September 2020
/
Revised: 13 October 2020
/
Accepted: 14 October 2020
/
Published: 21 October 2020
(This article belongs to the Special Issue Computer Graphics and Virtual Reality)
Abstract
:We present SliceView, a simple and inexpensive multi-view display made with multiple parallel translucent sheets that sit on top of a regular monitor; each sheet reflects different 2D images that are perceived cumulatively. A technical study is performed on the reflected and transmitted light for sheets of different thicknesses. A user study compares SliceView with a commercial light-field display (LookingGlass) regarding the perception of information at multiple depths. More importantly, we present automatic adaptations of existing content to SliceView: 2D layered graphics such as retro-games or painting tools, movies and subtitles, and regular 3D scenes with multiple clipping z-planes. We show that it is possible to create an inexpensive multi-view display and automatically adapt content for it; moreover, the depth perception on some tasks is superior to the one obtained in a commercial light-field display. We hope that this work stimulates more research and applications with multi-view displays.

1. Introduction
From old black and white televisions to 3D cinemas and virtual reality, displays have revolutionized the way we learn, work and entertain ourselves; they are present in almost every aspect of our life. Visual displays target our most developed sense, leveraging our inherent skills to interpret shapes and depth. However, most displays do not take advantage of all the features of our vision.
Common displays like the monitor from a computer or the touch-screen from a mobile phone can provide static monocular cues such as occlusion, distance-size relationship, shadows or texture gradients [1]. However, oculomotor cues such as binocular disparity, accommodation of the focal point or convergence cannot be generated.
Head Mounted Displays (HMD) or glasses render different images for each eye, but current commercial products cannot provide oculomotor cues. Furthermore, they require wearing an extra device that can burden some interactions, disable the “come and interact” paradigm, or produce motion sickness. Volumetric and lightfield displays are capable of providing most of the visual cues, but creating content for them is more complicated; they are also not as affordable or widespread as regular displays.
The main contribution of this paper is providing guidelines and software to adapt existing content to a multilayered display with proof-of-concept applications such as a 2D painting software, a 3D scene renderer, a volumetric data visualizer, a retro-gaming emulator and subtitled video.
Secondly, we introduce SliceView, a simple and affordable multi-layered display inspired by the Pepper’s Ghost illusion [2,3]. The original Pepper’s Ghost relies on projecting the image of a person in a translucent surface, which is superimposed with the real-world behind the surface. Instead of using a single reflector sheet, we use multiple reflector sheets at different depths: each sheet reflects different images that stack and are viewed additively. We made SliceView as simple as possible to enable everyone to build it using a regular computer screen and basic materials.
Finally, a user study comparing SliceView with a commercial lightfield display (LookingGlass) revealed that 3D charts and text can be correctly perceived and analyzed at different depths when using SliceView.
2. Related Work
Multiple display technologies have been developed to provide the same visual cues that we perceive from the real world.
2.1. Wearables and Head-Mounted Displays
Wearables and HMDs provide depth information by showing different images to each eye and creating binocular disparity. Nowadays, Oculus Rift or Valve Index are widely commercially available. However, even novel HMDs can cause motion sickness [4,5] and they are relatively uncomfortable to wear. Furthermore, each user needs their own head-mounted display to observe the same scene.
2.2. Autostereoscopic Displays
On the other hand, autostereoscopic displays also provide binocular disparity without the need to wear any device [6]; they are commonly divided into volumetric displays and multi-view displays.
2.2.1. Volumetric Displays
A volumetric display emits points of light from each position within a volume. Swept volumetric displays, such as the Perspectra [7] or Voxon Photonics VX1 [8] use high-speed moving parts which can be noisy, expensive and dangerous. Plasma displays induce electric breakdown in mid-air using a powerful focused laser [9]; they involve severe dangers and have limitations in the size, resolution or color gamut of the graphics that can be displayed. Other approaches to volumetric displays have been studied, such as projecting on a vibrating bubble [10] or using a fast-moving particle held with optical [11] or acoustic [12] tweezers, but all of them present important challenges to rendering colorful, high-resolution, fast-changing images. Volumetric displays provide all the visual cues without the need to wear a device. However, when compared to common displays, most of them are complex, expensive and scarce.
2.2.2. Multi-View and Lightfield Displays
In a multi-view display, two-dimensional projections such as photographs or synthetic images are projected in different directions. Depth is implicitly encoded as positional disparity between different projections [6]. The most common type of multi-view displays are the light-field displays, in which microlens arrays direct individual pixels into different directions, producing different points of view of the graphics. Commercial models such as LookingGlass [13] or FOVI3D [14] are available. Multi-view displays suffer from a dramatic loss of resolution [15] as they use the same display to provide multiple views (e.g., 48 different views in the case of the LookingGlass), and most of these displays only offer horizontal parallax with a limited viewing angle [6]. Lightfield displays are not easy to scale up and require precise alignment of their micro-lens arrays or their multiple projectors. Tensor displays [16] provide better resolution, but they need complex software and alignment of the multiple Liquid Crystal Displays and lenses.
2.2.3. Projection-Based Displays
Projection-based displays emit different images at different planes. The Virtual Showcase [17] is a truncated pyramid of half-silvered mirrors that merges real and virtual content using stereo shutter glasses and head tracking. Pepper’s Cone [18] uses a curved transparent surface to reflect a pre-distorted image. DepthCube [19] consists of a high-speed projector and a stack of liquid crystal panels that can switch between a transparent and light-scattering state; this concept has also been applied to mixed reality [20]. Projection-based displays based on stacking require calibration between the slices for complex scenes and are affected by ambient light; the background should be rendered in black, as shadow-casting objects can hinder the projections, and can suffer from the cardboard effect [21].
2.2.4. Pepper’s Ghost
Previous work has explored extensions of Pepper’s Ghost which use multiple layers instead of a single one. Using two layers in a large scale display can put the presenter between the layers and present information in two differentiated levels [22]. A head-mounted display was designed such that each eye would have a set of three translucent layers reflecting at different depths [23]; the speed at which the eye can focus at different depths was studied. Differently, SliceView is a desktop display focused on ease of assembly and the automatic adaptation of existing content. The conducted studies, user studies, target higher-level activities, namely, text readability and chart analysis at different depths.
3. System Description
3.1. Hardware
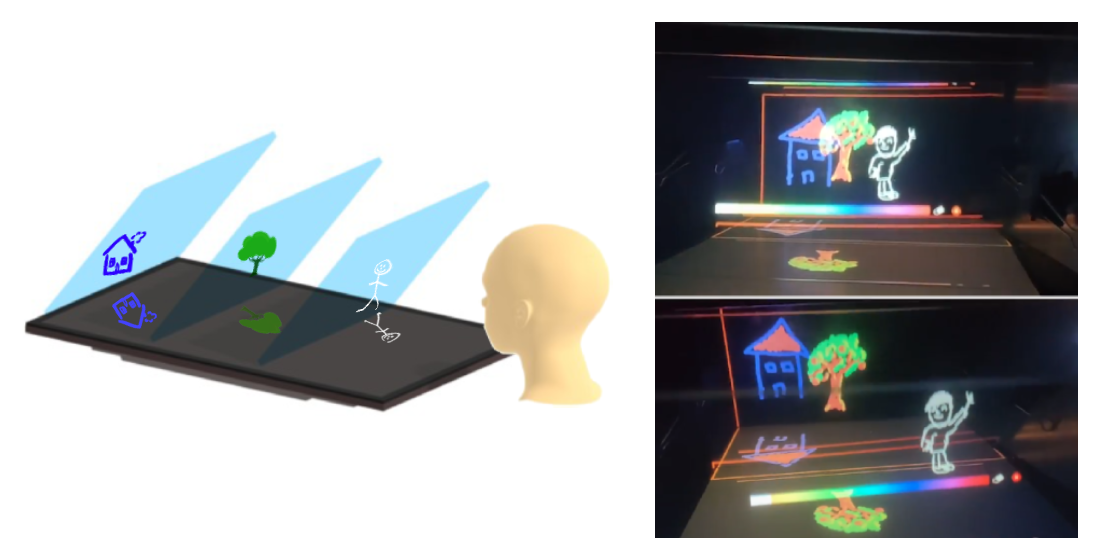
SliceView does not contain moving parts and is a down-to-up projection-based auto-stereoscopic display that consists of two main components: a regular computer monitor acting as the light-source and a multi-planar optical element composed of tilted translucent sheets placed at different depths. A scene is sliced by our software into layers, then they are transformed and mirrored, and each slice is projected into a translucent sheet. The light from the monitor below is reflected on each sheet and directed towards the user’s eyes, which perceives the accumulated images. A diagram of a SliceView is shown in Figure 1. It must be noted that the image on the first slice is reflected directly into the user, but light reflected on the other sheets refracts on the slices in front of it until reaching the user.
We use a Lenovo L2251p Wide TFT 22” monitor screen and three 297 × 210 × 2 mm acrylic-polyethylene transparent sheets. Sheets should be ideally placed at 45° degrees to maximize projection area and maintain image proportions. However, they can be used at wider angles with more layers stacked to provide more depth levels in the displayed graphics, with the downside of reducing resolution along one of the planar axis. This reduction occurs because the image of the projecting monitor needs to be split into different slices, i.e., if the original monitor has a resolution of 1920 × 1200 and is divided into three slices, the resolution for each slice would be 640 × 1200. Pre-rendering transformations are needed to maintain proportions and avoid distortions in the perceived graphics; they are detailed later and shown in Section 3.2.
A regular PC (i5 with 8GB of RAM) is used to render the 3D scenes, and a mouse and keyboard are situated in front of SliceView when user interaction is required. Alternative USB-powered interaction devices like a graphic tablet or a gaming controller are used for some applications.
All the applications are rendered in real time at 60 Hz. With the hardware used, no rendering speed differences were perceived between the original content and the automatically adapted content. Furthermore, the required image transformation operations were achievable within this 60 Hz.
3.2. Software
We modified and employed different libraries (see Figure 2). Following our low-cost and easily accessible automatic content adaptation objective, the software is open-source and cross-platform. More explanations and images are provided in Section 6.
SliceViewer is a ThreeJS component that slices the 3D scene at different depths, and renders the final images to be projected by the monitor. Different settings can be tuned, such as the number of layers, perspective of the camera, and occlusion behaviour. It can run on multiple devices through a web browser. SlicePainter is a web browser multi-depth canvas painting software developed with the P5JS library. We have modified the MegaDrive (aka Genesis) emulator Helios so that it renders each layer of the videogames separately, therefore many of the video games are suitable to be played in SliceView. VLC Media Player has been configured to test the use of overlaid subtitles at different depths into video.
Some basic transformations are required to correctly render the final image (see Figure 3). Firstly, the layers are mirrored vertically to counter the image inversion from the reflective sheets. Secondly, as the layers are not completely parallel, there could be misalignment and deformations in the projected images, so keystone correction was employed in such cases. Afterwards, it is necessary to re-scale the layers proportionally to their distance. We made calibration templates to facilitate end-users’ assembly of their SliceView. OBS Studio is used to apply transformations and calibration into the slices. The use of an OBS plugin known as StreamFX provides mirror and keystone transformations.
Stretch deformation is required when layers are not placed at 45° over the screen. When placing them at narrower angles, the projected images should be vertically shrunk. Conversely, when placing the layers at wider angles to stack more layers on the same surface area, images should be enlarged vertically.
4. Technical Evaluation
In this section, we measure the light reflection and light transmission of sheets of different thicknesses. SliceView takes advantage of the characteristics of the employed monitor, i.e., color range, refresh ratio, size and resolution depends on the monitor used, although an important amount of the emitted light is lost in the form of refracted and residual light (Figure 1).
The amount of reflected light varies depending on the thickness and material chosen for the semitransparent sheets. As shown in Figure 4, reflectors that are too thick result in double reflections, which reduce the sharpness of the perceived image; using 2-mm thickness sheets produces minor double reflections. On the other hand, sheets which are too thin are hard to place uniformly stretched; our prototypes using 0.5-mm and 1-mm acetate sheets resulted in wobbly images, as shown in Figure 4 and Figure 5. Using 2-mm sheets provides a good balance between image quality and ease of assembly.
Light transmission and reflection was tested on the two most promising translucent sheets. The light source was a 1-mW red laser attenuated with a ND36 filter. The reflective sheet is placed at 45° in front of the laser. A white surface is placed in front of the sheet to receive the transmitted light and another surface is placed to receive the reflected light. Transmitted and reflected light are captured using a camera (GM1903) with manual settings (f/1.75, 1/100s, ISO-400). The results are shown in Figure 6.
In both cases, most light traverses the sheet and only a small fraction is reflected back to the user. In a 4-mm sheet, the brightness of the reflected light is 20% of the transmitted one; this ratio is 30% for a 2-mm sheet. Therefore, using a 2-mm sheet instead of a 4-mm sheet still means enough light is reflected and reduces double reflections, resulting in sharper images and brighter colours. Double reflections are almost nonexistent on 0.25-mm sheets, but the projection surface suffers from distortion caused by the non-uniform stretching of the sheet, as shown in Figure 5. All configurations are affected by environmental light; more discussion of this issue is present in Section 7 of this paper.
5. User Studies
We want to compare SliceView with a commercial lightfield display regarding the performance of tasks that require observation of information at multiple depths. We selected LookingGlass 8.9” (the Looking Glass Factory, NY, USA [13]) since it is the most popular and available lightfield display. We acknowledge that SliceView may have advantages over LookingGlass in the selected tasks, since they are based on discrete depths, but the obtained results are only intended to serve as a baseline. Additionally, the results of these tasks are transferable to multiple application scenarios, like the ones exemplified in Section 6. Finally, we also note that none of the tasks could be completed on a regular monitor with a static camera.
The tasks are the analysis of 3D scatterplots and the reading of overlapping texts placed at different depths. A within-subject design with two conditions (SliceView and LookingGlass) was employed, and the order was counterbalanced.
5.1. Participants
A total of 22 participants (six females and 16 males) aged between 21 and 44 years (M = 28.3, SD = 6.46) took part in this study. All of them had perfect or corrected vision. The participants had experience using computers but had no previous knowledge in visualisation design or the use of autostereoscopic displays. Before the experiment, they were instructed to sit on a chair, in front of the setup table and conduct the experiment in a comfortable position after receiving an explanation of the evaluation method and the experimental procedure (see Figure 7).
5.2. Conditions
SliceView was assembled using a regular computer monitor, three acrylic sheets and a dark enclosure; the resulting dimensions were 25 × 18 cm and 47 cm depth. LookingGlass was used as-is on its 8’9” Development Kit. The users were seated during the experiment, in a dimly lit environment, with their eyes slightly above the displays. Both devices were connected to the same computer and keyboard. A paper questionnaire was provided for each task to be filled out with answers by the participants during the challenges. To obtain completion times, participants were requested to press a key to pass onto the next trial each time they answered a question. No camera movement or interaction with the 3D scene was allowed, since we were interested in the inherent perception of depth.
5.3. Tasks
5.3.1. 3D Chart Analysis
For the Chart Analysis task, scatterplots were displayed on both conditions by using similar ThreeJS scenes rendered through perspective cameras. The charts were comprised of six horizontal columns and three depth rows. Rows were color-coded (i.e., red, green and blue) based on the row they were being displayed. Spheres were randomly placed at different continuous heights between 0 and 100. All the axes scales were removed, since we are not interested in the absolute values but in relative estimations. A yellow cuboid wireframe enclosing the chart was also rendered as a helper to identify maximum and minimum possible values. The employed datasets were randomly generated but manually inspected to ensure that they were adequate for the task. An example of this task, both in SliceView and LookingGlass, can be seen in Figure 8.
The different subtasks for this task were derived from Jansen et al. in [24] that compared the exploration of a 3D-printed physical chart with a digital version of it. The subtasks are:
- Order task: Order the values in ascending order for a given column (i.e., three values at different depths);
- Range task: Estimate the range of the values of a given column;
- Compare task: A pair of values (column and color) are given and the user must determine which one is larger.
5.3.2. Overlapped Text Readability
For the readability task, different pairs of short sentences (between four and seven words) were rendered overlapping at different depths. For both conditions, the same text type, font, and color (white Arial 24 pt = 0.848 cm height) was used to render each sentence over a black background. We used the first and third layers of SliceView for this task (see Figure 9). In the case of LookingGlass, the text was placed at 20% distance from the closest and furthest depths. We introduced word substitution errors on both conditions, i.e., between zero and two words were replaced by similar but incoherent words on each sentence. All words used for substitutions rhymed with the original word. The texts were designed and curated by an individual to be as similar as possible between conditions. The same number of substitutions were introduced in both conditions, providing a similar challenge. The task of the users was to read several pairs of overlapping sentences at different depths and detect any substituted words in each of them. We decided to take this approach to analyse readability as well as comprehension [25]. Additionally, we based this task on Jankowski et al.’s study on overlapped text readability for traditional displays [26].
5.4. Procedure
The participants were asked to read the initial instructions and forms, then the different tasks and conditions were presented. Before starting each condition, participants were asked to do a test trial to ensure that they understood the tasks and what was allowed in both systems. After the tasks, participants filled in the answers using a paper questionnaire attached to the setup table. To summarize, the study involved 22 participants × 2 conditions × 5 scatter plot datasets = 220 scatter plot datasets and, therefore, 220 sorting tasks, 220 ranging tasks, and 220 × 4 = 880 comparison tasks. Regarding readability, the study involved the same 22 participants × 2 conditions × 10 pairs of sentences = 440 pairs of sentences. We recorded Task Completion Time and accuracy for each trial. Additionally, after completing all the tasks on both conditions, the participants filled in the System Usability Scale (SUS) [27] and NASA TLX [28] questionnaires, since they are standard questionnaires which are widely applied for human–computer-interaction evaluations.
5.5. Results
Each participant took an average of 50 min to perform the evaluation and complete the questionnaires. We performed t-paired test on objective measures of user performance, i.e., Task Completion Time (TCT) and Accuracy between the two conditions (SliceView and LookingGlass) split by task and subtask. Wilcoxon tests were performed on the subjective reportings from the questionnaires SUS and NASA TLX score.
5.5.1. Task Completion Time
Task completion times are displayed in Figure 10 split by condition and subtask. In the Order subtask, completion time was 18.33 s (SD = 11.03) for SliceView display and 17.04 s (SD = 8.94) for LookingGlass; no significant difference was found (t(19) = 0.668, p = 0.512). In the Range subtask, it was 15.18 s (SD = 3.88) for SliceView and 15.79 s (SD = 4.81) for LookingGlass; the difference was not significant (t(19) = −0.569, p = 0.576). In the Comparison subtask, it was 11.44 s (SD = 3.06) for SliceView and 11.44 s (SD = 3.65) for LookingGlass; no significant difference was found (t(19) = 0.007, p = 0.994). In the Readability task, completion time was 22.66 s (SD = 12.06) for SliceView and 32.11 s (SD = 2.45) for LookingGlass; there was a significant difference (t(19) = −3.768, p = 0.001).
Tasks completion times were similar in both conditions when performing chart analysis subtasks, but significant differences were observed in the readability tasks. This difference could be explained by the different depth-placing capabilities of both devices: SliceView has a larger depth span and LookingGlass suffers from severe loss of resolution when items are placed next to its front or back display area.
5.5.2. Accuracy
Error rate is shown in Figure 10, split by condition and subtask. In the Order task, accuracy was 3.4% (SD = 7.56) for SliceView and 3.4% (SD = 11.1) for LookingGlass; no significant difference was found (t(21) = 0.015, p = 0.988). In the Range task, it was 9.2 (SD = 3.61) for SliceView and 10.31 (SD = 6.07) for LookingGlass; the difference was not significant (t(21) = −1.046, p = 0.307). In the Compare task, it was 2.04% (SD = 3.98) for SliceView and 10.9% (SD = 4.53) for Looking Glass; there was a significant difference (t(21) = −7.492, p =< 0.001). In the Readability task, it was 0.95% (SD = 0.95) for SliceView and 1.22% (SD = 1.02) for Looking Glass; the difference was not significant (t(21) = −1.567, p = 0.137).
Accuracy was similar in both conditions when performing ranging and ordering subtasks, but significant differences were observed when performing the comparing subtasks. We hypothesise that these differences may be caused by the differences in resolution between both displays and by the capabilities of both devices when providing vertical motion parallax.
5.5.3. Subjective Questionnaires
The System Usability Scale (SUS) [29] questionnaire had seven questions to be answered in a 5-point Likert scale; we selected the ones relevant to our evaluation, removing the ones related to interaction. Q1: I think that I would like to use this system frequently, Q2: I found the system unnecessarily complex, Q3: I thought the system was easy to use, Q4: I think that I would need the support of a technical person to be able to use this system, Q5: I would imagine that most people would learn to use this system very quickly, Q6: I found the system very cumbersome to use, and Q7: I felt very confident using the system. The average results can be seen in Figure 11.
Wilcoxon tests were Q1 (W = 46, p = 0.264), Q2 (W = 52, p = 0.014), Q3 (W = 34.5, p = 0.151), Q4 (W = 16, p = 0.292), Q5 (W = 7, p = 0.269), Q6 (W = 112, p = 0.003) and Q7 (W = 3.5, p = 0.710). There were significant differences in Q2 and Q6, meaning that the users found SliceView more complicated to use than LookingGlass. We could explain these differences by the displayed visual aspect, as the users were only requested to observe the displays, and not to directly interact with them. SliceView is made with cardboard and affordable materials, whereas LookinGlass is a sleek final commercial product.
The NASA TLX questionnaire [28] had six questions. The participants were asked to give a numerical value from 0 to 20 for their Q1: Mental demand, Q2: Physical demand, Q3: Temporal Demand, Q4: Perceived performance, Q5: Effort, and Q6: Frustration. The average values are shown in Figure 11. Wilcoxon tests were Q1 (W = 45.5, p = 0.251), Q2 (W = 11, p = 1), Q3 (W = 11, p = 0.408), Q4 (W = 41.5, p = 0.872), Q5 (W = 27.5, p = 0.376) and Q6 (W = 20.5, p = 0.284). The difference was not significant for any question.
6. Potential Applications
In this section, we exemplify some applications that can take advantage of SliceView. These potential applications have been partially developed and automatically adapt to existing content and applications to take advantage of the discrete multi-depth capabilities of SliceView.
6.1. Slicepainter: Layer-Based Painting Tool
SlicePainter is a painting tool based on the layer system commonly used in image manipulation software, such as Photoshop or Gimp, providing a more physical representation of the layers. The user can use different colors and brush sizes to draw on different layers. The user can set the number of layers in order to then hide, show, and select them individually. This was developed in Javascript with the P5.JS library so it can run on regular internet browsers.
SlicePainter can be used with a keyboard, a mouse or a drawing tablet. The keyboard is used to navigate through layers and change their opacity, the right-click is used to choose color or paint, and the left-click is the eraser. With the tablet, the layer navigation is done with the pen buttons and the tablet active area is mapped onto the current layer.
SlicePainter offers some novel experiences. The parallax effect can be exploited to create innovative drawings and optical illusions. Scenes can be painted to be perceived from different points of view (Figure 12) and explore color-mixing, as light from the layers is accumulated.
6.2. Retro-Gaming Platform
We have modified an open-source MegaDrive (Genesis) emulator to render each 2D layer separately. The chosen emulator is Helios, coded in Java.
The original MegaDrive employs five layers in which games draw their tiles and sprites; these layers are Background, Plane B, Plane A, Sprites, and Window. We exploit this feature and instead of combining all the layers in the screen, we render each layer at different slices and depths. The resulting parallax effect is appropriate for most retro games and provides a novel experience of classic games.
Many Megadrive games can be played in SliceView, but some were not completely adaptable. Some games employ a sprite priority mechanism that switches the rendering order of specific parts of the layers. On some occasions, layers contain glitchy graphics because they are not meant to be seen, since they are totally occluded by a layer on top. Sometimes, background elements are much brighter than foreground elements, making foreground colors and details difficult to perceive. As light is perceived cumulatively, brighter colors can severely bleed into darker ones. To mitigate these problems, we implemented two different approaches. Firstly, background dimming and foreground brightening can be applied to enhance the important game elements. Secondly, we added an option to mask in black, in a layer, the silhouette of the layers on top of it. This option solves the background layers with glitchy graphics and improves the final image quality, but leaves gaps when the display is not directly observed from the front (see Figure 13).
Videogames that do not use the pixel priority system have a horizontal-scroll gameplay, dark backgrounds and bright foregrounds, and implement some parallax effect between layers working better in SliceView. Ghosts’N Goblins™ is an example that has all these characteristics (Figure 14).
6.3. Text Overlay: Subtitles
SliceView can be used as a video player with some advantages when overlaying content such as subtitles. We used a VLC Media Player with settings configured to play synched videos and subtitles at different areas of the screen, which will be projected onto different layers.
In general, black backgrounds are used with white subtitles, occluding the original image behind them. Sometimes, subtitles are displayed with partial opacity. Professionally made subtitles render specific phrases at different coordinates to avoid occluding important information, but most subtitles are always rendered centred at the bottom. When using SliceView, the whole video is always visible, as subtitles are rendered in a different layer (see Figure 15). The viewer can change its point of view and focal point to reveal areas.
Subtitles could be developed to be rendered at different depths, visually representing the distance from the speaker, or superimposing different phrases when two or more speakers are arguing on the scene.
6.4. Sliceviewer: Browser-Based 3d Scenes Renderer
We developed a specific 3D scene renderer for SliceView. The user can choose a pre-made 3D scene or implement a new one, and SliceViewer will render the scene adapted to SliceView. After setting the number of layers, the perspective, and the occlusion mode, the scene is sliced at different depths and rendered at the monitor (see Figure 16). When a slice cuts through a mesh, we can choose not to render its interior faces so they will not interfere with the layers below. SliceViewer was developed in ThreeJS so that it can run directly on most web browsers.
Scenes with bright foregrounds and dark backgrounds are perceived better, and orthographic cameras show a more reliable alignment between layers. Scenes that have elements at different discrete depths, without them being cut in-between slices, provide better visualization results.
7. Discussion
SliceView suffers from some of the same problems exposed by Pepper’s Cone [18], such as not being suitable for bright outdoor environments, and ambient light reducing contrast and the perceived image quality due to the highlighted dust, scratches and imperfections on the projection surfaces. However, a regular LCD monitor is bright enough to offer an acceptable experience. Dark areas behind the display provide the best viewing conditions, therefore, we suggest enclosing SliceView inside a dark cardboard box (see Figure 17).
Bright contrasted images are, in general, better suited to SliceView, whilst dark colors should only be used on backgrounds or unimportant areas. White cannot be fully blocked by other layers, therefore, full opacity on a layer is not achievable and light emitted from aligned pixels at different depths is perceived cumulatively. A dark foreground in front of a bright background is almost invisiblel one solution is masking the foreground silhouette in black on the background layer. This considerably improves the final image quality, but leaves gaps when the display is not directly observed from the front. We consider that interesting color-mixing can be achieved by exploiting this to provide an ethereal effect.
Layer thickness has a critical role in image quality. (See Figure 4 and Figure 5). When using sheets of more than 1-mm thickness, there are perceivable double reflections, and text is difficult to read when using sheets thicker than 2 mm. Double reflections also produce less sharp images. When using thinner sheets, the lack of rigidity results in wobbly artefacts and the assembly of SliceView is more complicated. The use of more rigid and reflective materials, such as tempered glass or silica glass, could avoid these problems, but these materials may be harder to obtain and increase the cost.
SliceView does not provide a 360° field of view; the comfortable field of view is approximately 90°. It would be possible to obtain a 360° FOV by using multiple concentric cones, i.e., mixing Pepper’s cone [18] and SliceView concepts. However, back reflections from the opposite sections and reduced spatial resolution would reduce image quality significantly.
Despite being easy to build, SliceView is not plug&play, some basic calibration is needed after assembling it. As shown in Figure 3, transformations and sheet angle tuning are required to obtain optimal results. To ease this process, calibration templates are provided.
Adding more layers to increase depth resolution reduces planar resolution, because the same screen is used to project light onto each layer. However, we reckon that with monitors increasing in resolution (1080 p, 4 K and so on), using more than five layers is feasible.
Increasing the size of SliceView can be limited by the size of the monitor. TV or PC monitor screens are available in larger sizes but at an increased price. Projector technologies may be more suited for a large-scale SliceView.
Like most projection-based displays, SliceView also exhibits the cardboard effect [21]. This can be slightly reduced by increasing the number of layers, at the cost of losing planar resolution. Most of our proposed applications do not avoid, but take advantage of, this effect.
When using a low number of layers, empty spaces are available between them, in which we could place real objects to be mixed with the virtual scene in a diorama-like style, something unachievable on the LookingGlass or Pepper’s Cone alternatives. Touch sensors could also be placed at or between different layers to provide some kind of direct interaction. Nevertheless, as each layer is completely solid, they could be only reached through the top or sides. This is not possible when using a black box enclosing the display to increase perceived brightness.
8. Conclusions
We have presented custom software that can adapt existing content to take advantage of multi-depth displays. Namely, a paint application, a retro-game emulator, a video player with subtitles and a 3D scene web-browser are presented and provided with this paper. We also presented a simple and affordable multi-depth display named SliceView, and performed a comparison of this display with a commercially available light-field display regarding the perception of information at different depths. We hope that SliceView encourages people to further explore multi-view displays.
Author Contributions
Conceptualization, I.E. and A.M. methodology, I.E., A.M. and A.A.; software, I.E. and A.M.; validation, O.A. and A.O.; data curation, I.E. and A.A.; writing—original draft preparation, I.E. and A.M.; writing—review and editing, O.A. and A.O.; supervision, A.M.; funding acquisition, A.M. All authors have read and agreed to the published version of the manuscript.
Funding
This work has been funded by Government of Navarre (FEDER) 0011-1365-2019-000086; and by Jovenes Investigadores UPNA PJUPNA1923.
Acknowledgments
We thank all the participants of the study for their time and useful comments.
Conflicts of Interest
The authors declare no conflict of interest.
Abbreviations
The following abbreviations are used in this manuscript:
| 3D | Three dimensions |
| FOV | Field Of View |
| HMD | Head Mounted Display |
| Hz | Hertz |
| LCD | Liquid Crystal Display |
| M | Mean |
| NASA-TLX | National Aeronautics and Space Administration Task Load Index |
| ND filter | Neutral-Density filter |
| OBS | Open Broadcaster Software |
| PC | Personal Computer |
| RAM | Random Access Memory |
| SD | Standard Deviation |
| SUS | System Usability Scale |
| TCT | Task Completion Time |
| TV | Television |
| USB | Universal Serial Bus |
References
- Goldstein, E.B.; Brockmole, J. Sensation and Perception, Perceiving Depth and Size; Cengage Learning: Belmont, CA, USA, 2009; Volume 7, pp. 97–105. [Google Scholar]
- O’connell, I.; Rock, J. Projection Apparatus and Method for Pepper’s Ghost Illusion. U.S. Patent 7,883,212, 8 February 2011. [Google Scholar]
- Greenslade, T.B., Jr. Pepper’s Ghost. Phys. Teach. 2011, 49, 338–339. [Google Scholar] [CrossRef]
- Munafo, J.; Diedrick, M.; Stoffregen, T.A. The virtual reality head-mounted display Oculus Rift induces motion sickness and is sexist in its effects. Exp. Brain Res. 2017, 235, 889–901. [Google Scholar] [CrossRef] [PubMed]
- Sharples, S.; Cobb, S.; Moody, A.; Wilson, J.R. Virtual reality induced symptoms and effects (VRISE): Comparison of head mounted display (HMD), desktop and projection display systems. Displays 2008, 29, 58–69. [Google Scholar] [CrossRef]
- Halle, M. Autostereoscopic displays and computer graphics. In ACM SIGGRAPH 2005 Courses; ACM SIGGRAPH: Los Angeles, CA, USA, 2005; p. 104. [Google Scholar]
- Cossairt, O.S.; Napoli, J.; Hill, S.L.; Dorval, R.K.; Favalora, G.E. Occlusion-capable multiview volumetric three-dimensional display. Appl. Opt. 2007, 46, 1244–1250. [Google Scholar] [CrossRef] [PubMed] [Green Version]
- Manuel, L. The technology behind the Voxon 3D Volumetric Display. Available online: https://voxon.co/technology-behind-voxon-3d-volumetric-display/ (accessed on 19 October 2020).
- Saito, H.; Kimura, H.; Shimada, S.; Naemura, T.; Kayahara, J. Laser-plasma scanning 3D display for putting digital contents in free space National Institute of Advanced Industrial Science and Technology. In Proceedings of the Stereoscopic Displays and Applications XIX International Society for Optics and Photonics, San Jose, CA, USA, 28–30 January 2008; pp. 1–10. [Google Scholar]
- Hayasaki, Y.; Kumagai, K. Volumetric bubble display. Opt. Infobase Conf. Pap. 2018, 113, 3–7. [Google Scholar]
- Smalley, D.; Nygaard, E.; Squire, K.; Van Wagoner, J.; Rasmussen, J.; Gneiting, S.; Qaderi, K.; Goodsell, J.; Rogers, W.; Lindsey, M.; et al. A photophoretic-trap volumetric display. Nature 2018, 553, 486. [Google Scholar] [CrossRef] [PubMed]
- Fushimi, T.; Marzo, A.; Drinkwater, B.W.; Hill, T.L. Acoustophoretic volumetric displays using a fast-moving levitated particle. Appl. Phys. Lett. 2019, 115. [Google Scholar] [CrossRef]
- Looking Glass Factory. Looking Glass; Looking Glass Factory: New York, NY, USA, 2020. [Google Scholar]
- Fovi3D. FOVI3D. 2020. Available online: http://www.fovi3d.com/ (accessed on 19 October 2020).
- Hackett, M.; Proctor, M. Three-Dimensional Display Technologies for Anatomical Education: A Literature Review. J. Sci. Educ. Technol. 2016, 25, 641–654. [Google Scholar] [CrossRef]
- Wetzstein, G.; Lanman, D.; Hirsch, M.; Raskar, R. Tensor Displays: Compressive Light Field Synthesis Using Multilayer Displays with Directional Backlighting; ACM: New York, NY, USA, 2012. [Google Scholar]
- Bimber, O.; Fröhlich, B.; Schmalstieg, D.; Miguel Encarnação, L. The virtual showcase. IEEE Comput. Graph. Appl. 2001, 21, 48–55. [Google Scholar] [CrossRef] [Green Version]
- Luo, X.; Lawrence, J.; Seitz, S.M. Pepper’s Cone: An Inexpensive Do-It-Yourself 3D Display. In Proceedings of the 30th Annual ACM Symposium on User Interface Software and Technology, Quebec City, QC, Canada, 22–25 October 2017; pp. 623–633. [Google Scholar]
- Sullivan, A. DepthCube solid-state 3D volumetric display. In Proceedings of the Stereoscopic displays and virtual reality systems XI. International Society for Optics and Photonics, Bellingham, WA, USA, 22–24 January 2004; pp. 279–284. [Google Scholar]
- Sidharta, R.; Hiyama, A.; Tanikawa, T.; Hirose, M. The Development of Multi-Depth Pepper’s Ghost Display for Mixed Reality System. In Proceedings of the 16th International Conference on Artificial Reality and Telexistence—Workshops (ICAT’06), Hangzhou, China, 29 November–1 December 2006; pp. 115–118. [Google Scholar]
- Yamanoue, H.; Okui, M.; Yuyama, I. A study on the relationship between shooting conditions and cardboard effect of stereoscopic images. IEEE Trans. Circuits Syst. Video Technol. 2000, 10, 411–416. [Google Scholar] [CrossRef]
- Kim, M.; Lee, J.; Stuerzlinger, W.; Wohn, K. HoloStation: Augmented visualization and presentation. In Proceedings of the SIGGRAPH Asia 2016 Symposium on Visualization, Macao, China, 5–8 December 2016; pp. 1–9. [Google Scholar]
- Akeley, K.; Watt, S.J.; Girshick, A.R.; Banks, M.S. A stereo display prototype with multiple focal distances. ACM Trans. Graph. 2004, 23, 804–813. [Google Scholar] [CrossRef] [Green Version]
- Jansen, Y.; Dragicevic, P.; Fekete, J.D. Evaluating the efficiency of physical visualizations. In Proceedings of the SIGCHI Conference on Human Factors in Computing Systems, Paris, France, 27 April–2 May 2013; pp. 2593–2602. [Google Scholar]
- Dillon, A. Reading from paper versus screens: A critical review of the empirical literature. Ergonomics 1992, 35, 1297–1326. [Google Scholar] [CrossRef]
- Jankowski, J.; Samp, K.; Irzynska, I.; Jozwowicz, M.; Decker, S. Integrating text with video and 3D graphics: The effects of text drawing styles on text readability. Conf. Hum. Factors Comput. Syst. 2010, 2, 1321–1330. [Google Scholar] [CrossRef]
- Bangor, A.; Kortum, P.T.; Miller, J.T. An empirical evaluation of the system usability scale. Intl. J. Hum. Comput. Interact. 2008, 24, 574–594. [Google Scholar] [CrossRef]
- Hart, S.G. NASA-task load index (NASA-TLX); 20 years later. In Human Factors and Ergonomics Society Annual Meeting; Sage Publications Sage CA: Los Angeles, CA, USA, 2006; Volume 50, pp. 904–908. [Google Scholar]
- Brooke, J. SUS: A retrospective. J. Usability Stud. 2013, 8, 29–40. [Google Scholar]
Figure 1.
(a) Ray diagram on SliceView: the image emitted from a part of the monitor is reflected on the slice above it, then it refracts on the slices in front of it until it reaches the user. Primary refractions, secondary reflections and residuals are lost and reduce the final intensity. (b) Schematic diagram of a SliceView rendering a layered videogame (SNES Super Mario World™).

Figure 2.
Component diagram showing modified and employed software.

Figure 3.
(a) Vertical mirroring. (b) Size mismatch when no z-based scale correction is applied. (c) Calibration templates for three layers.
Figure 3.
(a) Vertical mirroring. (b) Size mismatch when no z-based scale correction is applied. (c) Calibration templates for three layers.

Figure 4.
(a) Double reflections ray diagram. (b) Double reflection effect on a 2-mm PE sheet. (c) Wobbly effect on a 0.25-mm acetate sheet.
Figure 4.
(a) Double reflections ray diagram. (b) Double reflection effect on a 2-mm PE sheet. (c) Wobbly effect on a 0.25-mm acetate sheet.

Figure 5.
Calibration template (a) captured under the same conditions (b) from the monitor and (c) reflected on a 2-mm sheet and reflected on a 0.25-mm sheet.
Figure 5.
Calibration template (a) captured under the same conditions (b) from the monitor and (c) reflected on a 2-mm sheet and reflected on a 0.25-mm sheet.

Figure 6.
Transmitted and reflected beam profiles: directly from the source and through an acrylic sheet of 2 mm and 4 mm thickness placed at 45°.
Figure 6.
Transmitted and reflected beam profiles: directly from the source and through an acrylic sheet of 2 mm and 4 mm thickness placed at 45°.

Figure 7.
(a) Participant using SliceView to perform several tasks. (b) Participant using LookingGlass to perform several tasks.
Figure 7.
(a) Participant using SliceView to perform several tasks. (b) Participant using LookingGlass to perform several tasks.

Figure 8.
(a) 3D chart task on a SliceView device. (b) On a LookingGlass device observed from two different angles.
Figure 8.
(a) 3D chart task on a SliceView device. (b) On a LookingGlass device observed from two different angles.

Figure 9.
(a) Overlapped text readability task on SliceView with 316-mm of depth separation between sentences. (b) Overlapped text readability task on Looking Glass with 238-mm of virtual depth separation between sentences (physical depth of the device 98 mm).
Figure 9.
(a) Overlapped text readability task on SliceView with 316-mm of depth separation between sentences. (b) Overlapped text readability task on Looking Glass with 238-mm of virtual depth separation between sentences (physical depth of the device 98 mm).

Figure 10.
Task Completion Time and Accuracy split by condition and subtask. (** refers to p-value ; *** refers p-value ).
Figure 10.
Task Completion Time and Accuracy split by condition and subtask. (** refers to p-value ; *** refers p-value ).

Figure 11.
SUS and NASA TLX questionnaires split by question and condition. (* refers to p-value ; ** refers p-value ).
Figure 11.
SUS and NASA TLX questionnaires split by question and condition. (* refers to p-value ; ** refers p-value ).

Figure 12.
User painting in SlicePainter at different layers; depending on the point of view, the layers align differently and provide different interpretations.
Figure 12.
User painting in SlicePainter at different layers; depending on the point of view, the layers align differently and provide different interpretations.

Figure 13.
Masking the foreground silhouette in black in background layers. (a) observed from the front. (b) gaps are revealed when SliceView is observed from a different angle. (Megadrive Sonic the Hedgehog™).
Figure 13.
Masking the foreground silhouette in black in background layers. (a) observed from the front. (b) gaps are revealed when SliceView is observed from a different angle. (Megadrive Sonic the Hedgehog™).

Figure 14.
User playing to Ghosts’N Goblins™ videogame sliced on multiple layers.

Figure 15.
(a) Traditional subtitles on a regular screen. (b) Using SliceView to render subtitles at different depths, enabling the user to change the focal point to reveal partially occluded areas.
Figure 15.
(a) Traditional subtitles on a regular screen. (b) Using SliceView to render subtitles at different depths, enabling the user to change the focal point to reveal partially occluded areas.

Figure 16.
User interacting with a 3D scene sliced into three layers.

Figure 17.
(a) SliceView on a completely dark environment, (b) under a regular household light bulb, and (c) under an LED spotlight.
Figure 17.
(a) SliceView on a completely dark environment, (b) under a regular household light bulb, and (c) under an LED spotlight.

Publisher’s Note: MDPI stays neutral with regard to jurisdictional claims in published maps and institutional affiliations. |
© 2020 by the authors. Licensee MDPI, Basel, Switzerland. This article is an open access article distributed under the terms and conditions of the Creative Commons Attribution (CC BY) license (http://creativecommons.org/licenses/by/4.0/).
Share and Cite
MDPI and ACS Style
Ezcurdia, I.; Arregui, A.; Ardaiz, O.; Ortiz, A.; Marzo, A. Content Adaptation and Depth Perception in an Affordable Multi-View Display. Appl. Sci. 2020, 10, 7357. https://doi.org/10.3390/app10207357
AMA Style
Ezcurdia I, Arregui A, Ardaiz O, Ortiz A, Marzo A. Content Adaptation and Depth Perception in an Affordable Multi-View Display. Applied Sciences. 2020; 10(20):7357. https://doi.org/10.3390/app10207357
Chicago/Turabian StyleEzcurdia, Iñigo, Adriana Arregui, Oscar Ardaiz, Amalia Ortiz, and Asier Marzo. 2020. "Content Adaptation and Depth Perception in an Affordable Multi-View Display" Applied Sciences 10, no. 20: 7357. https://doi.org/10.3390/app10207357
Note that from the first issue of 2016, this journal uses article numbers instead of page numbers. See further details here.