Article

Spectroscopy and Near-Infrared to Visible Upconversion of Er3+ Ions in Aluminosilicate Glasses Manufactured with Controlled Optical Transmission

1
Laboratorio de Óptica, Centro de Investigación en Óptica y Nanofísica, Campus Espinardo, Universidad de Murcia, 30100 Murcia, Spain
2
Instituto de Nanociencia y Materiales de Aragón, Universidad de Zaragoza-CSIC, 50018 Zaragoza, Spain
3
R&D Department, Icer Rail (Knorr-Bremse Group), 31013 Pamplona, Spain
*
Author to whom correspondence should be addressed.
Appl. Sci. 2021, 11(3), 1137; https://doi.org/10.3390/app11031137
Submission received: 23 December 2020 / Revised: 20 January 2021 / Accepted: 22 January 2021 / Published: 26 January 2021
(This article belongs to the Special Issue Laser Spectroscopy)

Abstract

:
In this work we report on the spectroscopic properties and the near-infrared to visible upconversion of Er3+ ions in aluminosilicate glasses manufactured by directionally solidification with the laser floating zone technique. Glasses were manufactured in a controlled oxidizing atmosphere to provide them with high optical transmission in the visible spectral range. Absorption and emission spectra, and lifetimes were assessed in both the visible and the near infrared spectral range. Green upconversion emissions of the 2H11/24I15/2 and 4S3/24I15/2 transitions at 525 nm and 550 nm attributed to a two-photon process were observed under excitation at 800 nm. Mechanisms responsible for the upconversion luminescence were discussed in terms of excited state absorption and energy transfer upconversion processes. Excitation spectra of the upconverted emission suggest that energy transfer upconversion processes are responsible for the green upconversion luminescence.

1. Introduction

In recent years rare-earth-doped glasses have been subject of intense research as host materials because of their significant optical properties, which make them adequate as infrared and upconversion lasers, optical amplifiers, and active photonic devices [1,2,3,4,5,6,7,8,9]. In particular, silicate and aluminosilicate glasses present excellent thermal and mechanical properties, and corrosion resistance to be used in practical applications [10,11,12,13,14,15,16,17]. In addition, their maximum phonon energy (~1050 cm−1) is much lower than that of phosphate and borate glasses, ~1300 cm−1 and ~1350 cm−1, respectively, so that quantum efficiency is less influenced by multiphonon relaxation processes [16,17,18,19].
Er3+ ions are among the most interesting active centers to be studied because of its potential applications in the field of infrared optical amplification related to the radiative efficiency of the 4I13/24I15/2 emission at around 1.55 µm [1,2,20]. Furthermore, the rich energy level structure of this rare-earth allows the excitation of the 2H11/24I15/2, 4S3/24I15/2, and 4F9/24I15/2 upconversion emission bands centered at around 530, 550, and 665 nm using wavelengths in the near infrared spectral regions [1,2,21,22]. NIR-to-visible energy conversion mechanism involves the conversion of low-excitation-energy photons into high-energy emitted light in the visible range through non-linear anti-Stokes processes. In addition, these ions can also be used as local ordering probe because of the close relation between their spectroscopic properties and the local structure and bonding at the ion site [23,24,25,26,27].
In a previous work, we reported on how to control the optical transmission of aluminosilicate glasses manufactured departing from commercial glass-ceramics by means of the Laser Floating Zone (LFZ) technique [28]. This technique utilizes an infrared laser source to create a molten zone in the material from which, by controlling the solidification rates, a new material with controlled microstructure is produced. Surrounding medium during the fabrication process, in terms of oxidizing or reducing atmosphere, can also be controlled. We reported that when the fabrication of these aluminosilicate glasses took place in an oxidizing atmosphere, Ti3+ centers contained in the glass turned into Ti4+ ions, giving rise to colorless glasses, the transmittance of which ranged 80% in the visible spectral range. Therefore, it was possible to tailor the resulting optical transmission. In this work we have taken advantage of this feature to fabricate erbium-doped glasses in oxidizing atmosphere to give rise to optical active glasses of high optical transmission. Spectroscopic and NIR-to-visible upconversion properties have been studied and the possible excitation mechanisms responsible for this upconversion luminescence were discussed.

2. Materials and Methods

2.1. Sample Fabrication

Glass-ceramic powder was obtained from a commercial glass-ceramic, Ceran Suprema®, manufactured by Schott. Next, 1 wt% and 4 wt% of Er2O3, ultra-pure 99.99% (Sigma-Aldrich, St. Louis, MO, USA) were mixed and isostatically pressed at 200 MPa for 3 min and sintered at 1200 °C for 12 h to obtain the precursor rods. Glass samples were obtained departing from these erbium-doped glass-ceramic precursors by means of the laser floating zone (LFZ) technique. This manufacturing technique has been described elsewhere [29,30,31]. Glass samples were obtained at a growth rate of 300 mm/h, which provided both high axial and radial cooling gradients to manufacture glass samples. In addition, the manufacturing process was carried out in a semi-sealed chamber, which allowed working in different atmospheres such as oxygen, nitrogen, and air. Specifically, Er-doped glasses were fabricated in oxygen atmosphere to obtain samples with high optical transmission. Taking into account the theoretical weight percentage the samples were doped with, from now on they will be named as Er1 and Er4.

2.2. Characterization Techniques

Composition of glasses was determined by means of field emission scanning electron microscopy microscope (FESEM) with energy dispersive X-ray detector (EDX) (Carl Zeiss, Jena, Germany). EDX technique allows the determination of most elements present in concentration above 0.1% with an estimated accuracy of ±5%.
Absorption spectra were recorded with a Cary 5 spectrophotometer. Steady-state emission were obtained by exciting the sample with an argon laser and a Ti-sapphire ring laser (0.4 cm−1 linewidth) in the 770–920 nm spectral range. The fluorescence was analyzed with a 0.25 m Jobin-Ybon monochromator (Horiba, Kyoto, Japan), and the signal was detected by a Hamamatsu R928 photomultiplier and finally amplified by a standard lock-in technique. Infrared emission at 1.5 µm was detected with an extended IR Hamamatsu R5509-72 photomultiplier (Hamamatsu, Hamamatsu-city, Japan).
Lifetime measurements were performed by exciting the samples with a dye laser pumped by a pulsed nitrogen laser and a Ti-sapphire laser, pumped by a pulsed frequency doubled Nd:YAG laser (9 ns pulsewidth) (Coherent, Santa Clara, USA), and detecting the emission with Hamamatsu R928 and R5509-72 photomultipliers (Hamamatsu, Hamamatsu-city, Japan). Data were processed by a Tektronix MDO3104 oscilloscope (Tektronix-Inc, Beaverton, OR, USA).

3. Results

3.1. Compositional Characterization

The composition of the Er-doped glass samples after the fabrication process in an oxygen atmosphere was carried out by EDX microanalysis. Table 1 shows the composition for both the samples. It can be observed that SiO2 and Al2O3 were the majority components of the samples, which also included low percentages of NaO, MgO, TiO2, ZrO2, and Er2O3. The content of Er3+ ions in both glasses was calculated accounting the measured content of Er2O3 and the density of both glasses, 2.35 g/cm3 and 2.36 g/cm3 for Er1 and Er4, respectively, resulting in 7.92 × 10¹⁹ at/cm3 for Er1 and 2.71 × 10²⁰ at/cm3 for Er4.

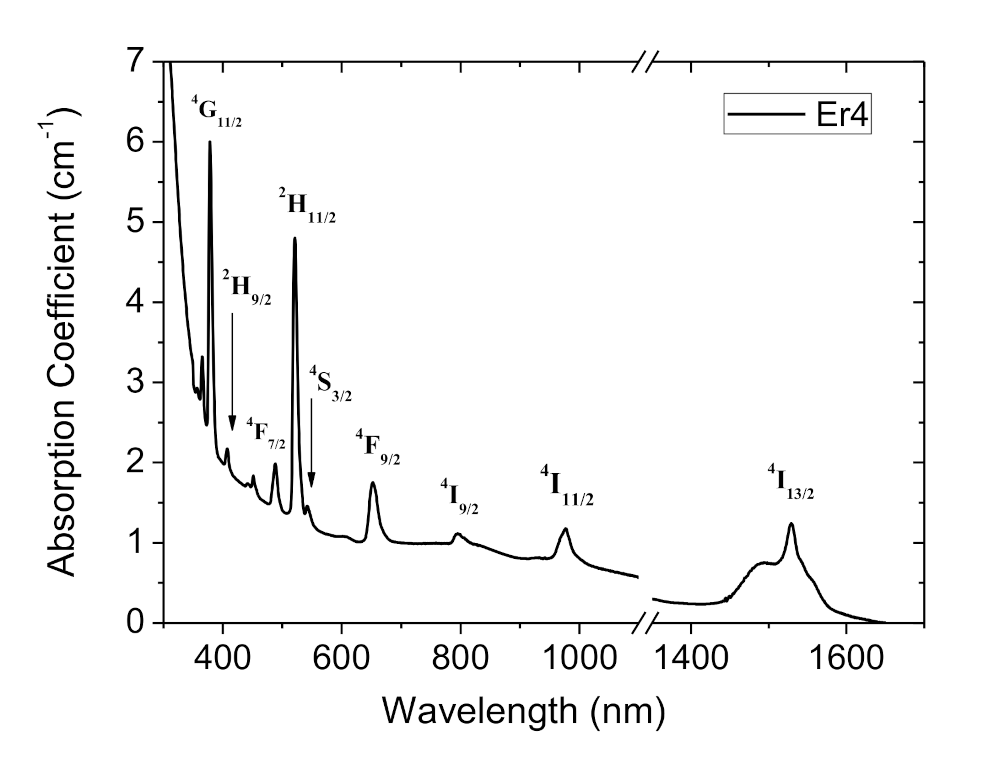
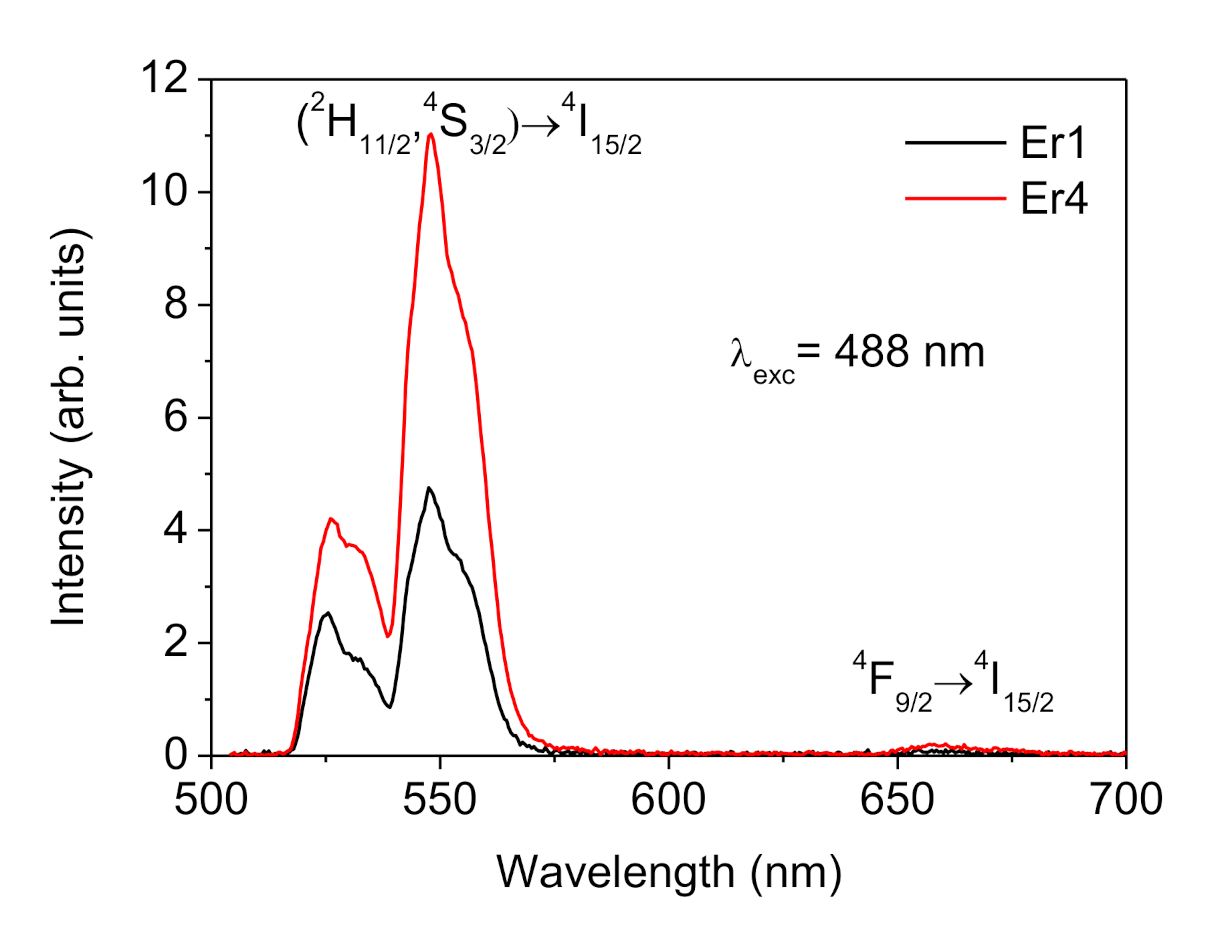
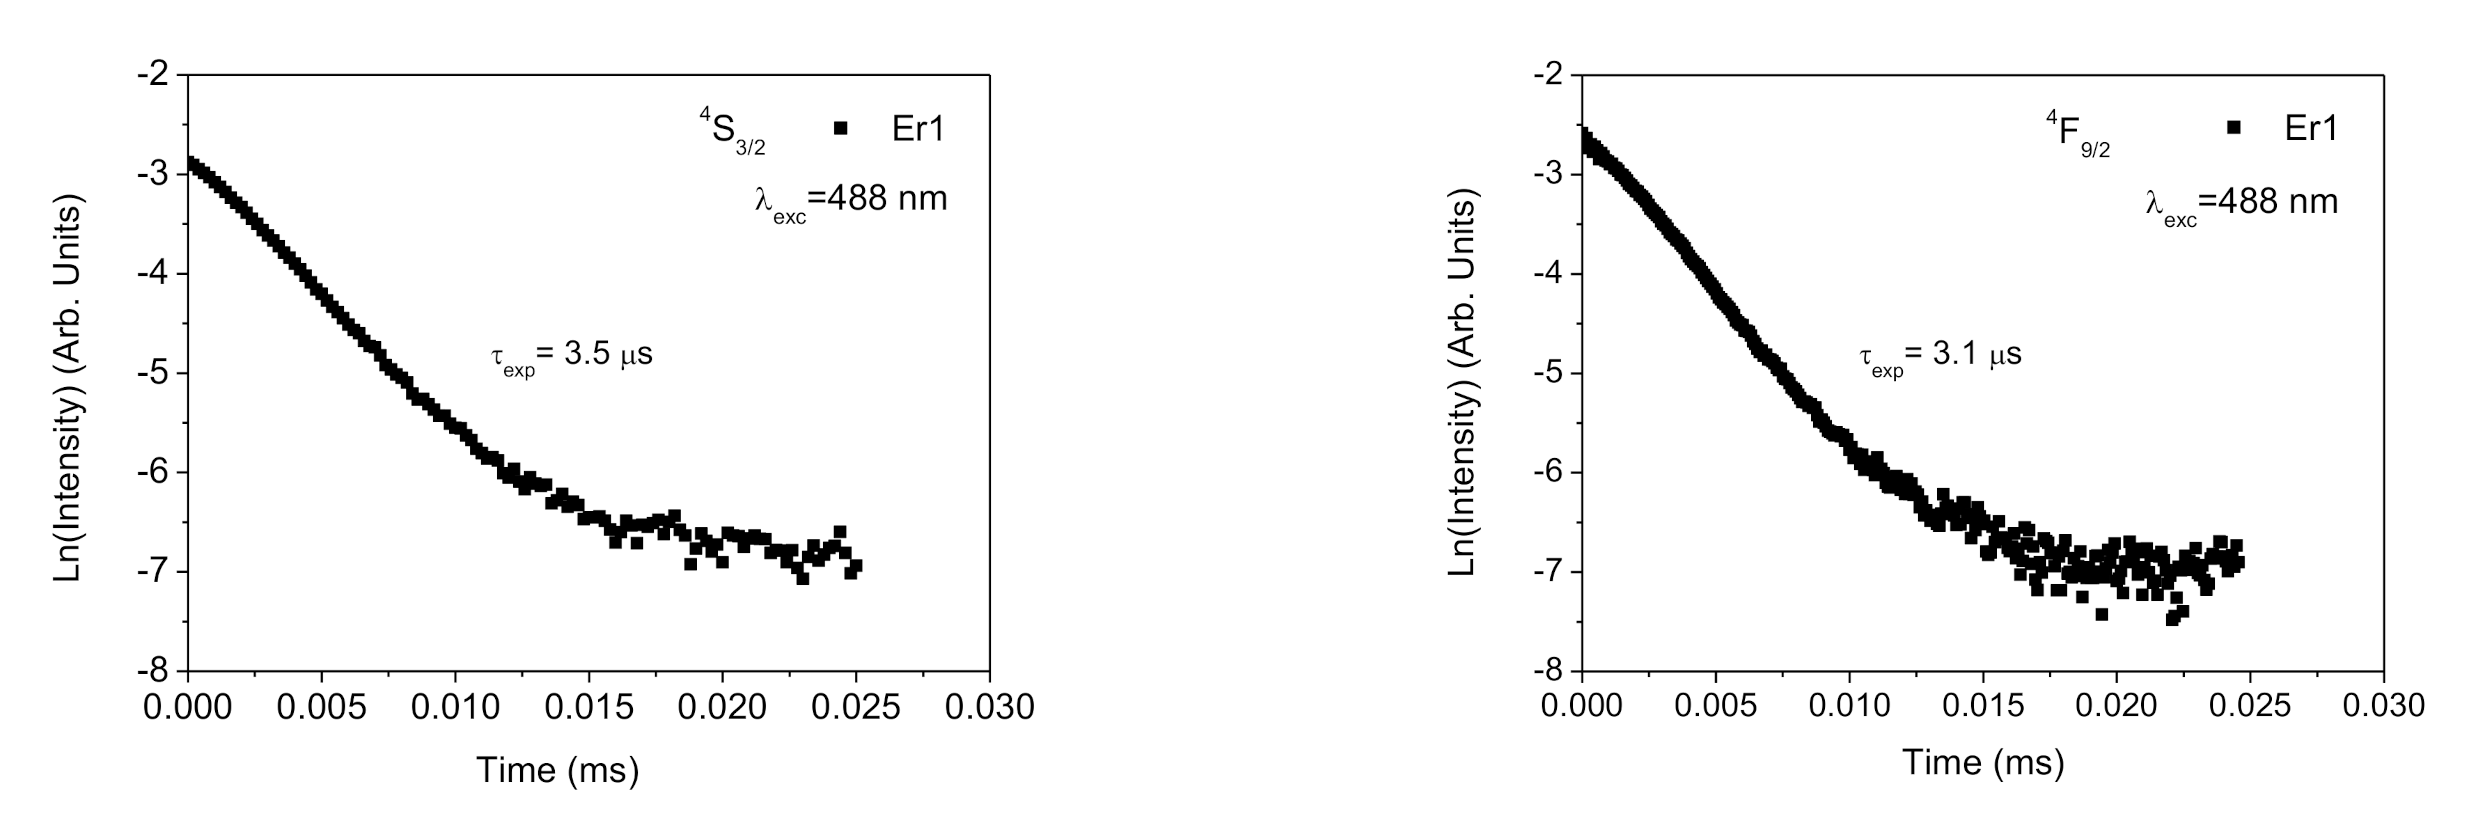
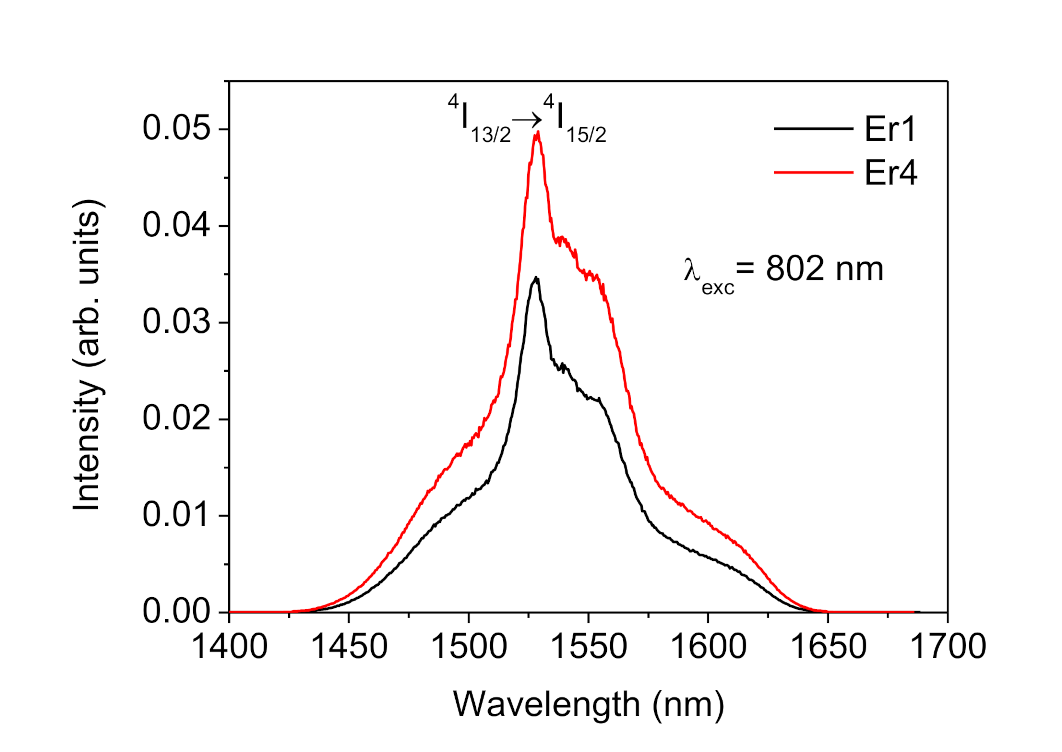
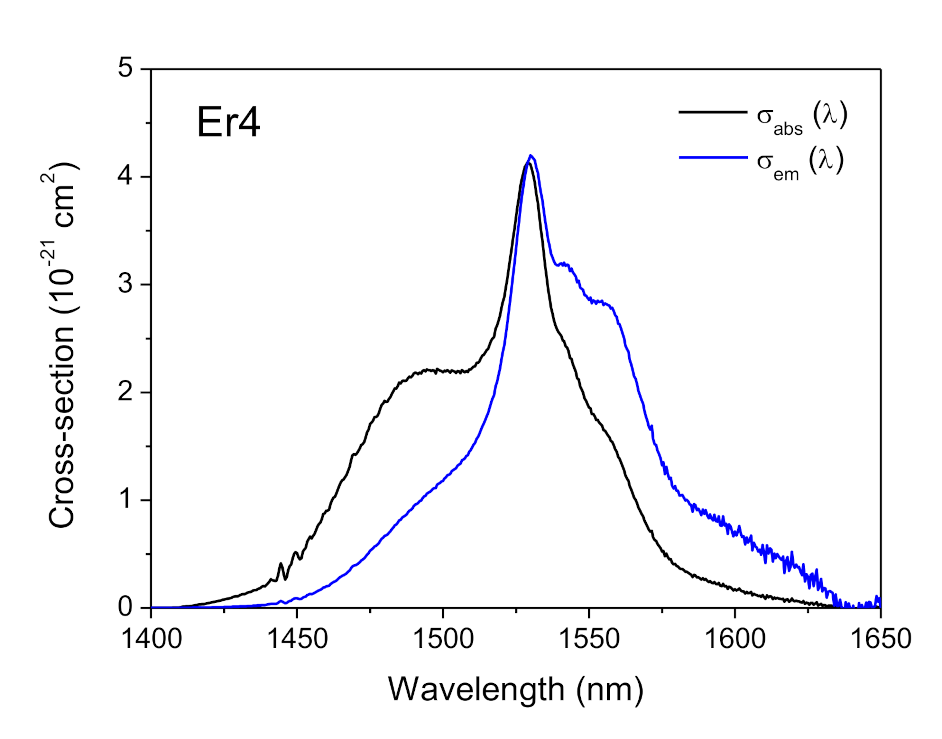
3.2. Absorption and Emission Properties

The room temperature absorption spectra were obtained for both samples in the 300–1700 nm range. As an example, Figure 1 shows the absorption spectra as a function of the wavelength for the sample doped with a 4 wt% of Er2O3. The spectrum consists of 10 absorption bands corresponding to the transition from the 4I15/2 ground state to the 4G11/2, 2H9/2, 4F3/2,5/2, 4F7/2, 2H11/2, 4S3/2, 4F9/2, 4I9/2, 4I11/2, and 4I13/2 of Er3+ excited states ions [1].
Visible emission spectra were obtained at room temperature under excitation of the 4F7/2 level at 488 nm. Multiphonon relaxation processes populated the lower levels resulting in the emission bands observed at around 530, 548, and 660 nm which corresponded to transitions from the 2H11/2, 4S3/2, and 4F9/2 levels to the ground state. Figure 2 shows the emission spectra of both glasses. The main emission corresponded to the (2H11/2, 4S3/2)→4I15/2 transition. A weak red emission was also observed from the 4F9/2 level. This level was populated through multiphonon relaxation processes from the 4S3/2 level.
The experimental decays of the luminescence from 4S3/2 and 4F9/2 levels were obtained at room temperature for both glasses under excitation at 488 nm. Table 2 shows the values obtained by a fit to a single exponential function. It can be observed that lifetimes of these levels were found to be similar for both glasses, with values slightly higher for the glass doped with a 1 wt% of Er2O3. As an example, Figure 3 shows the experimental decays from the 4S3/2 and 4F9/2 levels under excitation at 488 nm for the sample doped with 1 wt%. Lifetime was also measured at room temperature for the 4I13/2 level under excitation at 800 nm corresponding to the level 4I9/2. It was also found that lifetime was slightly higher for the glass doped with a 1 wt% of Er2O3. The decay from the 4I13/2 level was found to behave like a perfect single exponential, whereas decays from 4S3/2 and 4F9/2 excited levels slightly deviated from a perfect exponential behavior. The observed lifetimes were in the same order of magnitude than those reported for other silicate and aluminosilicate glasses [10,11,32].
The fluorescence spectra at room temperature corresponding to the 4I13/24I15/2 transition were measured by exciting the samples at 802 nm. As shown in Figure 4 both samples presented a maximum at around 1528 nm. Effective bandwidth (Δλeff) was measured according to
Δ λ e f f = I λ d λ I m a x ,
where I(λ) is the intensity of the emission spectrum as a function of the wavelength and Imax is the peak intensity. It was found that the effective bandwidth increased from 62.5 nm for the sample doped with 1 wt% to 66.3 nm for the sample doped with 4 wt% of Er2O3. These values are larger than those obtained for other silicate and phosphate glasses, the bandwidth of which ranges from 30–40 nm for silicate and 46 nm for phosphate glasses, respectively [33]. This feature is highly significant since broadband amplifiers and tunable lasers require large bandwidth.
In addition to the bandwidth, the stimulated emission cross-section, σem, is another important parameter that provides information about the optical amplification. This parameter was estimated from the absorption spectra by using the McCumber approach [34], in which the absorption and emission cross-section are related according to
σ e m υ = σ a b s υ e x p ε h υ K T ,
where σem and σabs are the stimulated emission and absorption cross-section, respectively, υ is the photon frequency, h is the Planck constant, K is the Boltzmann constant, and ε is the net free energy required to excite one Er3+ ion from states 4I15/2 to 4I13/2 at temperature T. The absorption cross-section was experimentally obtained and ε was determined by using the simplified procedure provided by Miniscalco [35]. The maximum emission cross-sections were found to be 3.51 × 10⁻²¹ cm2 and 4.19 × 10⁻²¹ cm2 at 1530 nm for the samples doped with 1 wt% and 4 wt% of Er2O3, respectively. These values were similar to those found in other aluminosilicate glasses [32]. As an example, Figure 5 shows the absorption and emission cross-section for the sample doped with 4 wt% of Er2O3.

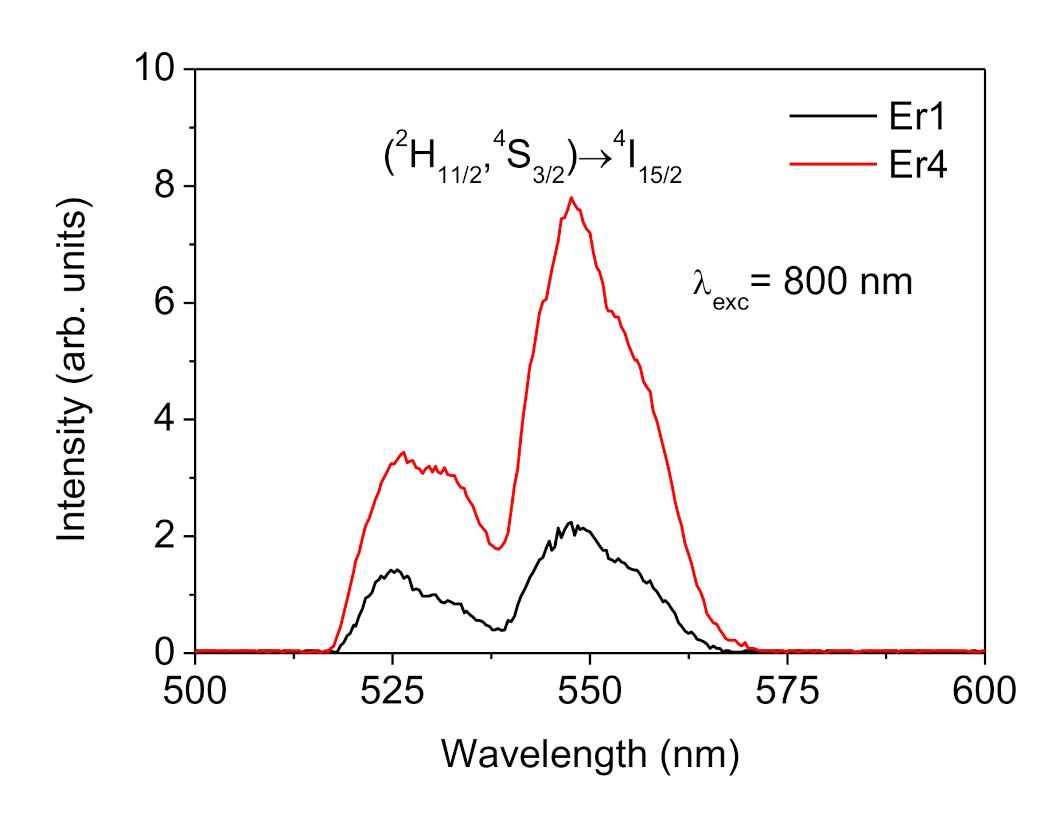
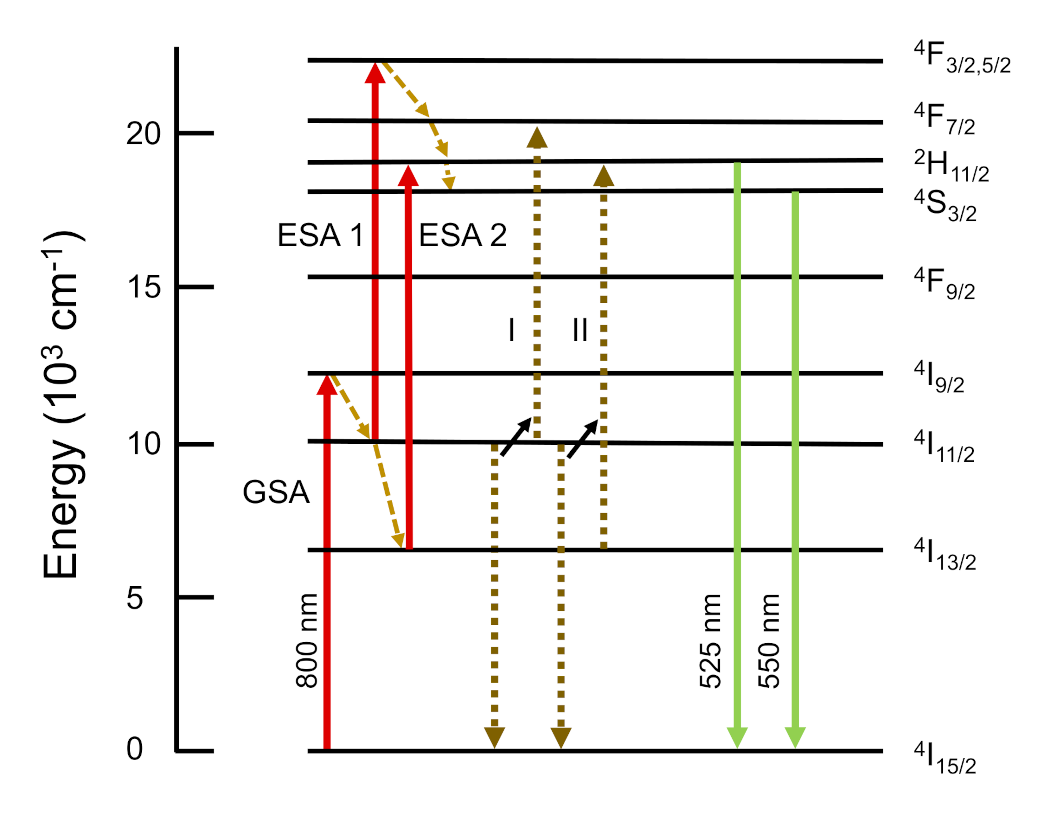
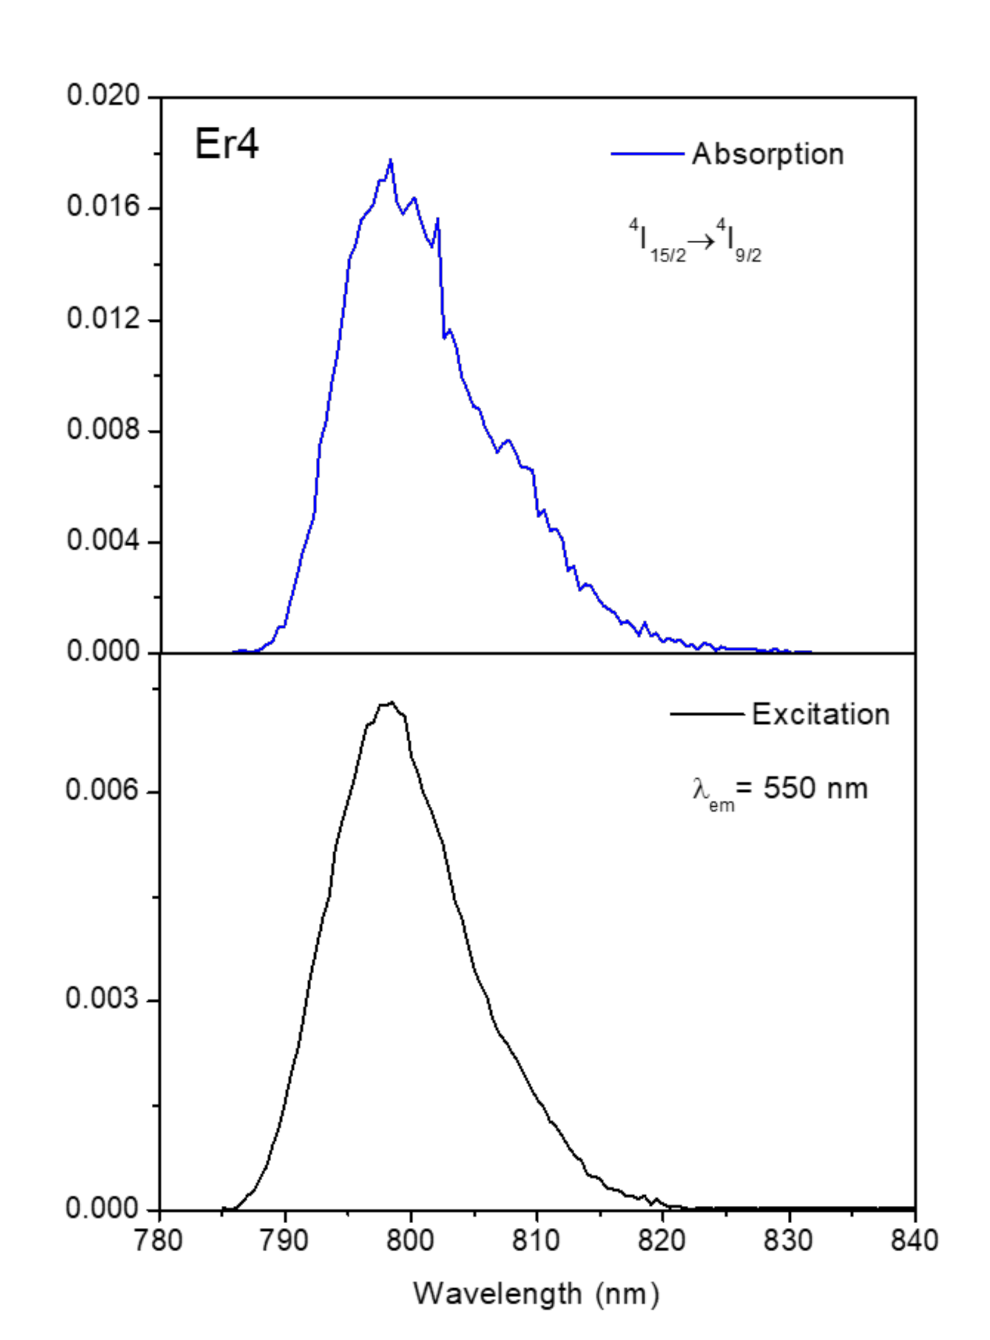
3.3. Infrared to Visible Upconversion

Visible upconversion at room temperature was observed in both samples under continuous laser excitation in resonance with the 4I9/2 level, as shown in Figure 6. The observed green emissions correspond to 2H11/24I15/2 and 4S3/24I15/2 transitions of Er3+ ions, which were located approximately at 525 nm and 550 nm, respectively. Nevertheless, red emission corresponding to the 4F9/24I15/2 transition was not observed in these glasses. This is due to the fact that the energy gap between levels 4F9/2 and 4I9/2 is 2264 cm−1 and the maximum phonon energy is 1000 cm−1 approximately [32].
Excited state absorption (ESA) and energy transfer upconversion (ETU) are the main processes associated to the upconversion emission of rare-earth ions [36]. Excitation mechanisms for populating the 2H11/2 and 4S3/2 levels under NIR excitation were investigated by studying the upconversion emission intensity Iup as a function of the infrared excitation power IIR. It is well-known that upconversion emission intensity increases proportionally to the nth power of the infrared excitation power according to the relation Iup k ∝ (IIR)n, where n is the number of photons involved in the pumping mechanism. Figure 7 shows the logarithmic plot of the green upconversion intensity Iup compared to the excitation power IIR under excitation at 800 nm for both glass samples. Linear fit allowed determining the n-values, resulting in 1.47 and 1.52 for Er1 and Er4, respectively. Slope values below two indicates a saturation of the intermediate levels [37]. These results confirm that a two-photon step was involved in the upconversion process to populate the emitting levels.
Possible mechanisms accounting for green upconversion emission under 800 nm excitation is presented in Figure 8. Green upconverted emission requires the population of levels with at least the energy of the 2H11/2 level or higher. The 4I9/2 level is resonantly excited by the pumping wavelength at 800 nm. Next, the thermalized levels 2H11/2 and 4S3/2 can be populated by means of two ESA processes or two ETU. On the first ESA, labelled as ESA1, a non-radiative relaxation from the 4I9/2 level to the lower 4I11/2 level is produced, from which the absorption of one photon populates the 4F3/2,5/2 level, followed by a non-radiative de-excitation to the 2H11/2 and 4S3/2 levels. On the second ESA, labelled as ESA2, an additional non-radiative relaxation from the 4I11/2 level to the 4I13/2 level is produced. Then, the absorption of one photon promotes the Er3+ ions to the 2H11/2 and 4S3/2 levels. These two processes involve only one Er3+ ion. Nevertheless, two upconversion mechanisms involving the interaction of two nearby Er3+ ions in the 4I11/2 level and entailing an energy transfer are possible. In the first ETU, denoted as I, the mechanism can be described as Er3+(4I11/2) + Er3+(4I11/2) → Er3+(4I15/2) + Er3+(4F7/2), followed by a non-radiative de-excitation to the 2H11/2 and 4S3/2 levels. The second ETU, denoted as II, can be described as Er3+(4I11/2) + Er3+(4I13/2) → Er3+(4I15/2) + Er3+(2H11/2, 4S3/2).
A method to distinguish between ESA and ETU mechanisms is provided by the excitation spectra of the upconverted luminescence [38]. In ESA processes upconversion excitation spectra are the result of excited state absorption and the one photon absorption. In ETU, excitation spectra are proportional to the square of the ground state absorption. Hence, excitation spectra of the upconversion green emission were performed in the 4S3/24I15/2 transition at 550 nm in both Er-doped aluminosilicate glasses. Figure 9 shows these spectra for the sample doped with a 4 wt%. It can be observed that both excitation and absorption spectra are similar. This behavior was also observed for the sample doped with a 1 wt%. Consequently, upconversion mechanisms were due to energy transfer upconversion processes.

4. Conclusions

Directionally solidified Er-doped aluminosilicate glasses were manufactured by the laser floating zone in a controlled oxidizing atmosphere to provide them with a high optical transmission in the visible spectral range. The infrared and visible emissions were assessed at room temperature. Infrared emission corresponding to the 4I13/24I15/2 transition at 1528 nm presented an effective bandwidth nearly 30 nm broader than other silicate glasses, which makes them suitable for broadband amplifiers. The visible emission was dominated by the green emission corresponding to the 2H11/2 and 4S3/2 levels. Lifetimes from levels 4S3/2 and 4F9/2 at room temperature under excitation at 488 nm were found to be similar for both glasses, whereas lifetime from the 4I13/2 level was found to be shorter for the glass with the higher content of Er3+ ions.
NIR-to-visible upconversion of Er3+ ions in these glasses under excitation at 800 nm presented intense green emissions corresponding to 2H11/24I15/2 and 4S3/24I15/2 transitions placed at 525 nm and 550 nm which were attributed to a two-photon process. Nevertheless, red upconversion emission for the 4F9/24I15/2 transition was not observed due to the high maximum phonon energy. Excitation spectra of the upconverted luminescence from the 4S3/2 level suggests the energy transfer upconversion as the mechanism responsible for the upconversion process in these glasses.

Author Contributions

D.S. conceived and planned the experiments. D.S., A.M., and E.A.-E. carried out the experiments. D.S., A.M. and E.A.-E., J.I.P. contributed to the interpretation of the results and provided critical feedback. D.S. wrote the paper with input from all authors. All authors have read and agreed to the published version of the manuscript.

Funding

This research was funded by the PIT2 program of the University of Murcia’s own research plan. Fundación Séneca grant No 20647/JLI/18 and European Union’s Horizon 2020 research and innovation programme under the Marie Skłodowska-Curie IF No 795630 are also acknowledged.

Institutional Review Board Statement

Not applicable.

Informed Consent Statement

Not applicable.

Data Availability Statement

All data generated or analyzed during this study are included in this published article. Presented data are also available on request from the corresponding author.

Conflicts of Interest

The authors declare no conflict of interest.

References

  1. Henderson, B.; Imbusch, G.F. Optical Spectroscopy of Inorganic Solids; Oxford University Press: Oxford, UK, 1989. [Google Scholar]
  2. Hirao, K.; Mitsuyu, T.; Si, J.; Qiu, J. Active Glass for Photonic Devices: Photoinduced Structures and Their Application; Springer: Berlin/Heidelberg, Germany, 2001. [Google Scholar]
  3. Campbel, J.H.; Hayden, J.S.; Marker, A.J. High-power solid-state lasers from a laser glass perspective. Int. J. Appl. Glass Sci. 2011, 2, 3. [Google Scholar] [CrossRef]
  4. Sola, D.; Balda, R.; Peña, J.I.; Fernández, J. Site-selective laser spectroscopy of Nd3+ ions in 0.8CaSiO3-0.2Ca3(PO4)2 biocompatible eutectic glass-ceramics. Opt. Express 2012, 20, 10701–10711. [Google Scholar] [CrossRef] [PubMed] [Green Version]
  5. Sola, D.; Martínez de Mendibil, J.; Vázquez de Aldana, J.R.; Lifante, G.; Balda, R.; de Aza, A.H.; Pena, P.; Fernández, J. Stress-induced buried waveguides in the 0.8CaSiO3-0.2Ca3(PO4)2 eutectic glass doped with Nd3+ ions. Appl. Surf. Sci. 2013, 278, 289. [Google Scholar] [CrossRef]
  6. Wang, Y.; Xu, W.; Cui, S.; Xu, S.; Yin, Z.; Song, H.; Zhou, P.; Liu, X.; Xu, L.; Cui, H. Highly improved upconversion luminescence in NaGd(WO4)2:Yb3+/Tm3+ inverse opal photonic crystals. Nanoscale 2015, 7, 1363. [Google Scholar] [CrossRef] [PubMed]
  7. Martínez de Mendivil, J.; Sola, D.; Vazquez de Aldana, J.R.; Lifante, G.; de Aza, A.H.; Pena, P.; Peña, J.I. Ultrafast direct laser writing of cladding waveguides in the 0.8CaSiO3-0.2Ca3(PO4)2 eutectic glass doped with Nd3+ ions. J. Appl. Phys. 2015, 117, 4906963. [Google Scholar] [CrossRef]
  8. Martín Rodríguez, E.; López-Peña, G.; Montes, E.; Lifante, G.; García Solé, J.; Jaque, D.; Díaz-Torres, L.A.; Salas, P. Persistent luminescence nanothermometer. Appl. Phys. Lett. 2017, 111, 91901. [Google Scholar] [CrossRef]
  9. Carvalho, D.O.; Kassab, L.R.P.; Del Cacho, V.D.; da Silva, D.M.; Alayo, M.I. A review on pedestal waveguides for low loss optical guiding, optical amplifiers and nonlinear optics applications. J. Lumin. 2018, 203, 135. [Google Scholar] [CrossRef] [Green Version]
  10. Devarajulu, G.; Ravi, O.; Reddy, C.M.; Ali Ahamed, S.Z.; Raju, B.D.P. Spectroscopic properties and upconversion studies of Er3+-doped SiO2-Al2O3-Na2CO3-SrF2-CaF2 oxyfluoride glasses for optical amplifier applications. J. Lumin. 2018, 194, 499. [Google Scholar] [CrossRef]
  11. Lifante, G.; Martínez de Mendívil, J.; He, R.; Cantelar, E.; Ortega San Martín, L.; Sola, D. Transition probabilities of Er3+ ions in alumino-silicate glasses. J. Lumin. 2018, 203, 305–312. [Google Scholar] [CrossRef]
  12. Kohli, J.; Shelby, J.E. Rare-earth Aluminosilicate Glasses. J. Am. Ceram. Soc. 1990, 73, 39–42. [Google Scholar]
  13. Hyatt, M.J.; Day, D.E. Glass properties in the yttria-alumina-silica system. J. Am. Ceram. Soc. 1987, 70, 283–287. [Google Scholar] [CrossRef]
  14. Vomacka, P.; Babushkin, O. Yttria-alumina—silica glasses with addition of zirconia. J. Eur. Ceram. Soc. 1995, 15, 921–928. [Google Scholar] [CrossRef]
  15. Lin, S.L.; Hwang, C.S. Structures of CeO2-Al2O3-SiO2 glasses. J. Non-Cryst. Solids 1996, 202, 61–67. [Google Scholar] [CrossRef]
  16. Erbe, E.M.; Day, D.E. Properties of Sm2O3-Al2O3-SiO2 glasses for in vivo applications. J. Am. Ceram. Soc. 1990, 73, 2708–2713. [Google Scholar] [CrossRef]
  17. Sainz, M.A.; Osendi, M.I.; Miranzo, P. Protective Si–Al–O–Y glass coatings on stainless steel in situ prepared by combustion flame spraying. Surf. Coat. Technol. 2008, 202, 1712–1717. [Google Scholar] [CrossRef]
  18. Cao, R.; Lu, Y.; Tian, Y.; Huang, F.; Xu, S.; Zhang, J. Spectroscopy of thulium and holmium co-doped silicate glasses. Opt. Mater. Express 2016, 6, 2252. [Google Scholar] [CrossRef]
  19. Li, M.; Guo, Y.; Bai, G.; Tian, Y.; Hu, L.; Zhang, J. 2 µm luminescence and energy transfer characteristics in Tm3+/Ho3+ co-doped silicate glass. J. Quant. Spectrosc. Radiat. 2013, 127, 70. [Google Scholar] [CrossRef]
  20. Dorosz, D.; Zmojda, J.; Kochanowicz, M. Investigation on broadband near-infrared emission in Yb3+/Ho3+ co-doped antimony-silicate glass and optical fiber. Opt. Mater. 2013, 35, 2577. [Google Scholar] [CrossRef]
  21. Rodriguez-Mendoza, U.R.; Lalla, E.A.; Cáceres, J.M.; Rivera-López, F.; León-Luís, S.F.; Lavín, V. Optical characterization, 1.5 µm emission and IR-to-visible energy upconversion in Er3+-doped fluorotellurite glasses. J. Lumin. 2011, 131, 1239–1248. [Google Scholar] [CrossRef]
  22. Carnall, W.T.; Fields, P.R.; Rajnak, K. Electronic energy levels in the trivalent lanthanide aquo ions. I. Pr3+, Nd3+, Pm3+, Sm3+, Dy3+, Ho3+, Er3+, and Tm3+. J. Chem. Phys. 1968, 49, 4424. [Google Scholar] [CrossRef]
  23. Weber, M.J. Glass for Neodymium glasses. J. Non-Cryst. Solids 1980, 42, 189. [Google Scholar] [CrossRef]
  24. Tanabe, S.; Ohyagi, T.; Soga, N.; Hanada, T. Compositional dependence of Judd-Ofelt parameters of Er3+ ions in alkali-metal borate glasses. Phys. Rev. B 1992, 46, 3305. [Google Scholar] [CrossRef] [PubMed]
  25. Ebendor-Heidepriem, H.; Ehrt, D.; Bettinelli, M.; Speghini, A. Effect of glass composition on Judd-Ofelt parameters and radiative decay rates of Er3+ in fluoride phosphate and phosphate glasses. J. Non-Cryst. Solids 1998, 240, 66. [Google Scholar] [CrossRef]
  26. Quintas, A.; Majérus, O.; Lenoir, M.; Caurant, D.; Klementiev, K.; Webb, A. Effect of alkali and alkaline-earth cations on the neodymium environment in a rare-earth rich aluminoborosilicate glass. J. Non-Cryst. Solids 2008, 354, 98. [Google Scholar] [CrossRef] [Green Version]
  27. Sola, D.; Conejos, D.; de Mendivil, J.M.; Ortega-San-Martín, L.; Lifante, G.; Peña, J.I. Directional solidification, thermo-mechanical and optical properties of (MgxCa1-x)3Al2Si3O12 glasses doped with Nd3+ ions. Opt. Express 2015, 23, 26356. [Google Scholar] [CrossRef] [Green Version]
  28. Arias-Egido, E.; Sola, D.; Pardo, J.A.; Martínez, J.I.; Cases, R.; Peña, J.I. On the control of optical transmission of aluminosilicate glasses manufactured by the laser floating zone technique. Opt. Mater. Express 2016, 6, 2413–2421. [Google Scholar] [CrossRef] [Green Version]
  29. Llorca, J.; Orera, V.M. Directionally-solidified eutectic ceramic oxides. Prog. Mater. Sci. 2006, 51, 711–809. [Google Scholar] [CrossRef]
  30. Sola, D.; Ester, F.J.; Oliete, P.B.; Peña, J.I. Study of the stability of the molten zone and the stresses induced during the growth of Al2O3-Y3Al5O12 eutectic composite by the laser floating zone technique. J. Eur. Ceram. Soc. 2011, 31, 1211–1218. [Google Scholar] [CrossRef]
  31. Ester, F.J.; Sola, D.; Peña, J.I. Thermal stresses in the Al2O3-ZrO2(Y2O3) eutectic composite during the growth by the laser floating zone technique. Bol. Soc. Esp. Ceram. 2008, 47, 352–357. [Google Scholar] [CrossRef]
  32. Balda, R.; Merino, R.I.; Peña, J.I.; Orera, V.M.; Arriandiaga, M.A.; Fernández, J. Spectroscopic properties and frequency upconversion of Er3+-doped 0.8CaSiO3-0.2Ca3(PO4)2 eutectic glass. Opt. Mater. 2009, 31, 1105–1108. [Google Scholar] [CrossRef]
  33. Ding, Y.; Jiang, S.; Hwang, B.; Luo, T.; Peyghambariana, N.; Himei, Y.; Ito, T.; Miura, Y. Spectral properties of erbium-doped lead halotellurite glasses for 1.5 μm broadband amplification. Opt. Mater. 2000, 15, 123–130. [Google Scholar] [CrossRef]
  34. McCumber, D. Einstein Relations Connecting Broadband Emission and Absorption Spectra. Phys. Rev. 1964, 136, 957. [Google Scholar] [CrossRef]
  35. Miniscalco, W.J.; Quimby, R.S. General procedure for the analysis of Er3+ cross sections. Opt. Lett. 1991, 16, 258–260. [Google Scholar] [CrossRef] [PubMed]
  36. Wright, J.C. Up-conversion and excited state energy transfer in rare-earth doped materials. In Radiationless Processes in Molecules and Condensed Phases; Springer: Berlin/Heidelberg, Germany, 1976; pp. 239–295. [Google Scholar]
  37. Pollnau, M.; Gamelin, D.R.; Lüthi, S.R.; Güdel, H.U. Power dependence of upconversion luminescence in lanthanide and transition-metal-ion systems. Phys. Rev. B 2000, 61, 3337–33346. [Google Scholar] [CrossRef]
  38. Balda, R.; Garcia-Adeva, A.J.; Voda, M.; Fernández, J. Upconversion processes in Er3+-doped KPb2Cl5. Phys. Rev. B 2004, 69, 205203-1–205203-8. [Google Scholar] [CrossRef]
Figure 1. Room temperature absorption spectrum of Er3+ in the aluminosilicate glass doped with 4 wt% Er2O3.
Applsci 11 01137 g001
Figure 2. Room temperature emission spectra of the Er-doped aluminosilicate glasses with 1 wt% and 4 wt% under excitation at 488 nm.
Applsci 11 01137 g002
Figure 3. Experimental decays of the 4S3/2 and 4F9/2 levels of the Er-doped aluminosilicate glasses with 1 wt% under excitation at 488 nm.
Applsci 11 01137 g003
Figure 4. Emission spectra of the 4I13/24I15/2 transition for Er-doped aluminosilicate glasses with 1 wt% and 4 wt% under excitation at 802 nm.
Applsci 11 01137 g004
Figure 5. Absorption and emission cross-section for the aluminosilicate glass doped with 4 wt% of Er2O3.
Applsci 11 01137 g005
Figure 6. Upconversion emissions at room temperature for Er3+ ions in aluminosilicate glasses under excitation at 800 nm.
Applsci 11 01137 g006
Figure 7. Dependence of green upconversion emission intensity on excitation power for Er3+ ions under excitation at 800 nm.
Applsci 11 01137 g007
Figure 8. Energy level of Er3+ ions in aluminosilicate glass and possible upconversion mechanisms under excitation at 800 nm.
Applsci 11 01137 g008
Figure 9. Excitation spectra of upconverted green emission from the 4S3/2 level and square of the one photon absorption spectra of the aluminosilicate glass doped with 4 wt% Er2O3.
Applsci 11 01137 g009
Table 1. Compositional analysis in at% of the Er-doped samples manufactured in an oxygen atmosphere.
NaMgAlSiTiZrEr
Er10.701.8128.1165.992.000.980.41
Er40.861.7528.1265.111.840.891.43
Table 2. Lifetimes at room temperature of the 4S3/2 and 4F9/2 levels obtained under excitation at 488 nm and 4I13/2 levels obtained under excitation at 800 nm.
548 nm (4S3/2) (λexc = 488 nm)660 nm (4F9/2) (λexc = 488 nm)1528 nm (4I13/2) (λexc = 800 nm)
Er13.60 ± 0.11 μs3.06 ± 0.09 μs4.91 ± 0.12 ms
Er43.20 ± 0.07 μs3.17 ± 0.03 μs3.01 ± 0.06 ms
Publisher’s Note: MDPI stays neutral with regard to jurisdictional claims in published maps and institutional affiliations.

