
Fluctuations of Tracks and Layers during Aluminium Laser Powder-Bed Fusion


1
Department of Engineering Sciences and Mathematics, Luleå University of Technology, 97187 Luleå, Sweden
2
Department of Mechanical Engineering, Politecnico di Milano, Via G. La Masa 1, 20156 Milano, Italy
*
Author to whom correspondence should be addressed.
Appl. Sci. 2021, 11(7), 3132; https://doi.org/10.3390/app11073132
Submission received: 26 February 2021
/
Revised: 18 March 2021
/
Accepted: 26 March 2021
/
Published: 1 April 2021
(This article belongs to the Special Issue Latest Advances in Laser-Based Manufacturing Technologies)
Abstract
:Laser Powder-Bed Fusion (LPBF) is one method in Additive Manufacturing where layer-wise complex structures can be built. However, although the LPBF machines produce promising parts, the efficiency and process speed are typically still low, which can make the process expensive and uneconomical. Recent research showed that volume elements in the parts can be melted several times, while only a small material volume is added, which indicates a high loss of energy. In order to understand the process better, in this work, theoretical modeling and smart powder-bed experiments were designed to explain the impact on the track dimensions based on the previously built tracks and layers. It was found that the powder availability varies for each track and has an alternating character within and between layers. The comparison of the simulation and experimental results indicates that the powder pick-up from neighboring powder volumes is the main reason for the variations of the powder availability.
1. Introduction
Laser Powder Additive Manufacturing contains two main process variants. Processing blown powder is named Direct Energy Deposition, Direct Metal Deposition or Laser Metal Deposition, while building structures with pre-placed powder is named Selective Laser Melting, Laser Metal Fusion or Laser Powder-Bed Fusion (LPBF). The LPBF process uses laser beams that locally melt the pre-placed powder of the powder bed. Layer by layer, complex shaped parts are possible to produce. The LPBF process is industrially used for applications where usually high-cost material and complex structures are necessary to be produced. The LPBF process enables the production of high-quality parts using several powder materials, including Ni [1,2], Fe- [3] and Ti-alloys [4]. In addition, certain aluminium alloys are more widely used in LPBF, showing advantages in part performances due to lightweight design possibilities [5]. For the typically used AlSi10Mg alloy, studies showed that single and overlapping tracks can be produced using different scan speeds, showing a homogeneous distribution of alloying elements and no porosity, while, however, a higher layer thickness is not recommended to use due to the increased risk of defect formation [6]. Almost fully dense structures could be created with the alloys AlMg3, AlMgSi0.5, AlSi12 and AlSi10Mg [7]. Due to the higher thermal conductivity of aluminium, higher laser power and/or slower processing speeds are required compared to other metals like many steel grades [8].
Defects can occur that can influence the resulting part properties [9]. Therefore, a minimum of defects is usually required [10]. Typical defects during LPBF are, e.g., solidification cracks [11] or pores due to incomplete densification [12,13]. Further possible origins of the pores and voids were identified to be the space in the bulk powder and trapped gases [14]. The part density is defined as the percentage of fully molten and connected material without interruptions of defects, while typically a density of 100% is desired. The processing parameters influence the occurrence of defects. In general, at constant process parameters, a larger hatch distance (distance between two consecutive tracks) and higher powder layers increase the risk of forming defects [14]. Oxidation effects are the main issue to consider during processing of aluminium alloys along with the low melting temperatures. The effects of oxidation can be seen already during laser beam absorption, while aluminium surfaces show in general a high reflectivity. In addition, the laser beam illuminates different surfaces, namely, the oxide layer on the melt pool and partly the aluminium melt. During solidification, the oxide layer forms, while the aluminium is still liquid, which results in the tendency to lower the wetting on the base structure and can even lead to balling effects [15]. Also, process spatter was found to show increased oxide layers when processing AlSi10Mg powder, while no oxides were found in the bulk material [15]. The chemical composition of the aluminium alloy plays an important role regarding the process result. Element variations can lead to increased crack susceptibility, e.g., when changing from AlSi10Mg to Al-Cu systems [16]. Defect occurrence can be reduced by proper process parameter selection [17].
When observing the laser process, the energy input by the laser defines the shape of the single tracks and must melt the powder and a part of the material underneath to ensure metallurgical bonding [18]. In case the laser beam energy is too low, voids can remain due to insufficient melting of the powder material [14]. However, Mishra et al. [19] found that machine parameters are often set very conservatively to avoid voids. This typically results in multiple remelting of the same volume, which decreases the process efficiency. Volpp et al. [20] developed an analytical model that considers the powder availability for different tracks within one layer and observed that tracks can be completely remelted and are partly not even visible anymore in the cross section. It was further shown that the track shapes can significantly vary due to different amounts of available powder material for each single track. The reason for the variations is assumed to originate from the loss of powder due to spattering [20] and denudation effects [21]. Two dynamic processes were observed that led to a loss of material for building the tracks. Spattering was observed, denoting melt pool ejections that reduce the amount of molten volume for the track. In addition, powder in the vicinity of the processing zone is blown away. Both spatters and powder loss lead to a loss or redistribution of powder and agglomerates on the powder bed. Agglomerations of spatter even lead to larger particles on the powder, where following tracks will be built, which can alter the processing. Denudation effects were observed in X-ray analyses [22] and fluid dynamic calculations [23], while the Bernoulli Effect was suggested to be the main driver for powder particle movement on the powder bed before the laser interaction [24].
Even though the LPBF process is working in practice, there is still limited knowledge about the process fundamentals and, in particular, the impact of the track dimensions based on the previously built tracks and layers and powder availability variations. A deeper knowledge about the influences of process behaviors on the track and layer development would help to increase the process efficiency/speed and decrease powder loss by applying only the energy needed to enable the melting of the powder material with a slight but sufficient melting the previously built structure. Given this scenario, the present work is aimed to investigate the impact of the actual powder availability on the track and layer formation in LPBF. Track and layer appearances were modelled at different hatch distances and compared to experimental results. Possible influencing factors on the varying powder availability are discussed.
2. Materials and Methods
2.1. Experimental Setup
In order to gain insight into the track occurrence during LPBF, AlSi10Mg single/multiple tracks and layers were built in a Renishaw AM250 system, equipped with the Reduced Built Volume device. The printer operates with a pulsed 200 W single-mode fiber laser with an estimated beam diameter at focal point of 75 μm. Laser melting was performed by discrete and partially overlapped laser spots in a sealed chamber under Argon atmosphere, which is the typical industrial setup. No preheating was applied to the build plate. Multiple layers were produced by keeping the scanning direction (90°) constant after each layer completion. Although conventional LPBF machines usually scan different layers in different directions to reduce material anisotropy, for this investigation the tracks and layers were built in one direction in order to investigate the full cross section of the single tracks. The commonly used AlSi10Mg powder with particle size between 20 and 63 μm was produced by IMR Metal Powder Technologies GmbH (Table 1). Optimisation of LPBF parameters was performed in order to evaluate the effect of scanning speed and hatch distance on the material density. Table 2 reports the set of process parameters that led to the highest density with hatch distance of 100 μm (99.57% ± 0.06). Not all results of process parameters optimization are reported in this work.
The process parameters used for the experiments are shown in Table 2.
During the experiments, the hatch distance h was varied between 80 µm (A), 100 µm (B) and 120 µm (C). In order to be able to investigate the tracks and layers before they get remelted by subsequent laser scans, single track, multiple tracks and multiple layers were progressively built onto the top of an additively manufactured AlSi10Mg substrate, as shown in the schematics of Figure 1.
2.2. Microstructure Analysis
Samples were cut for transversal cross-section analysis. Microstructural observations were conducted with a Nikon Eclipse LV150NL light optical microscope and with Zeiss Sigma 500 field emission scanning electron microscope (FE-SEM), equipped with electron backscattered diffraction detector (EBSD). Samples were mounted, grinded, polished and etched with Keller’s reagent to evaluate the geometrical and microstructural features of the built structures. EBSD analyses were conducted to investigate grain size and orientation. Specimens were prepared for EBSD analysis with emery paper up to 2500 grit and diamond pastes. A final polishing step was performed by silica in a Struers Tegramin-25 machine. Results of microstructure analysis were compared for the different hatch distances.
2.3. Simulation
In order to simulate the tracks and layer appearances, a model was established in MATLAB (Version R2017a). The model is based on previous work of the authors [19,20]. The model calculates the molten cross-sectional area based on a moving Gaussian heat source, while the resulting temperature field was used to find the melting line and describe the lower part of the melt pool shape. Material parameters, such as the absorptivity, thermal diffusivity, melting temperature and the latent heat of melting were used as temperature-independent variables [19]. In the model, it is assumed that the laser beam illuminates the theoretical available powder area (Figure 2a) and integrates 30% of the neighbor areas in addition [25]. For the following tracks (Figure 2b), varying powder amounts are available to build the tracks. This leads to different track occurrences. The track shapes were calculated based on the heat input assuming an absorption of 15% on the aluminium flat melt pool surface (based on [26]). The upper parts of the tracks were simulated as circle sections. Due to the powder densification during processing, a shrinkage of 60% was assumed [27]. A higher powder availability leads therefore to higher tracks.
In addition, several layers were modeled considering the actual powder availability. For the first layer, the powder layer height is defined by the user (Figure 2c). When applying, e.g., the second powder layer, the volume above the previous first layer is larger than theoretically assumed due to the shrinkage of the material. Calculations of the track position and heights were conducted according to the actual powder availability for each track in 5 layers.
For validation of the model, the resulting track dimensions were evaluated and compared to the experimentally derived track geometry of a single track. Figure 3 shows the simulated tracks. Table 3 shows the comparison between the simulated and experimentally derived values.
The depth of the track is slightly underestimated due to neglecting effects of the structure being heated from previously built tracks that occur in the experiments that lead to a processing at higher temperatures of the previously built structures. However, the evaluation in the current work is focused on relative fluctuations of the tracks, which are possible to derive from the simulation results. Modelled track geometries and fluctuations were compared to the experimental observations in order to conclude about the origin and mechanisms of the observed track fluctuations.
3. Results
3.1. Simulation Results
For the different investigated hatch distances, the simulated tracks are given in Figure 4, while all parameters show no risk of voids due to the sufficient overlap of tracks and layers, as also observed in other works, where a hatch distance >70% of the laser beam diameter was necessary to produce voids [7].
Based on the simulated available powder for each track, the maximum heights of the single tracks were derived and plotted for each layer. The heights of the tracks in each layer show fluctuations, while the characteristics in each layer vary (Figure 5).
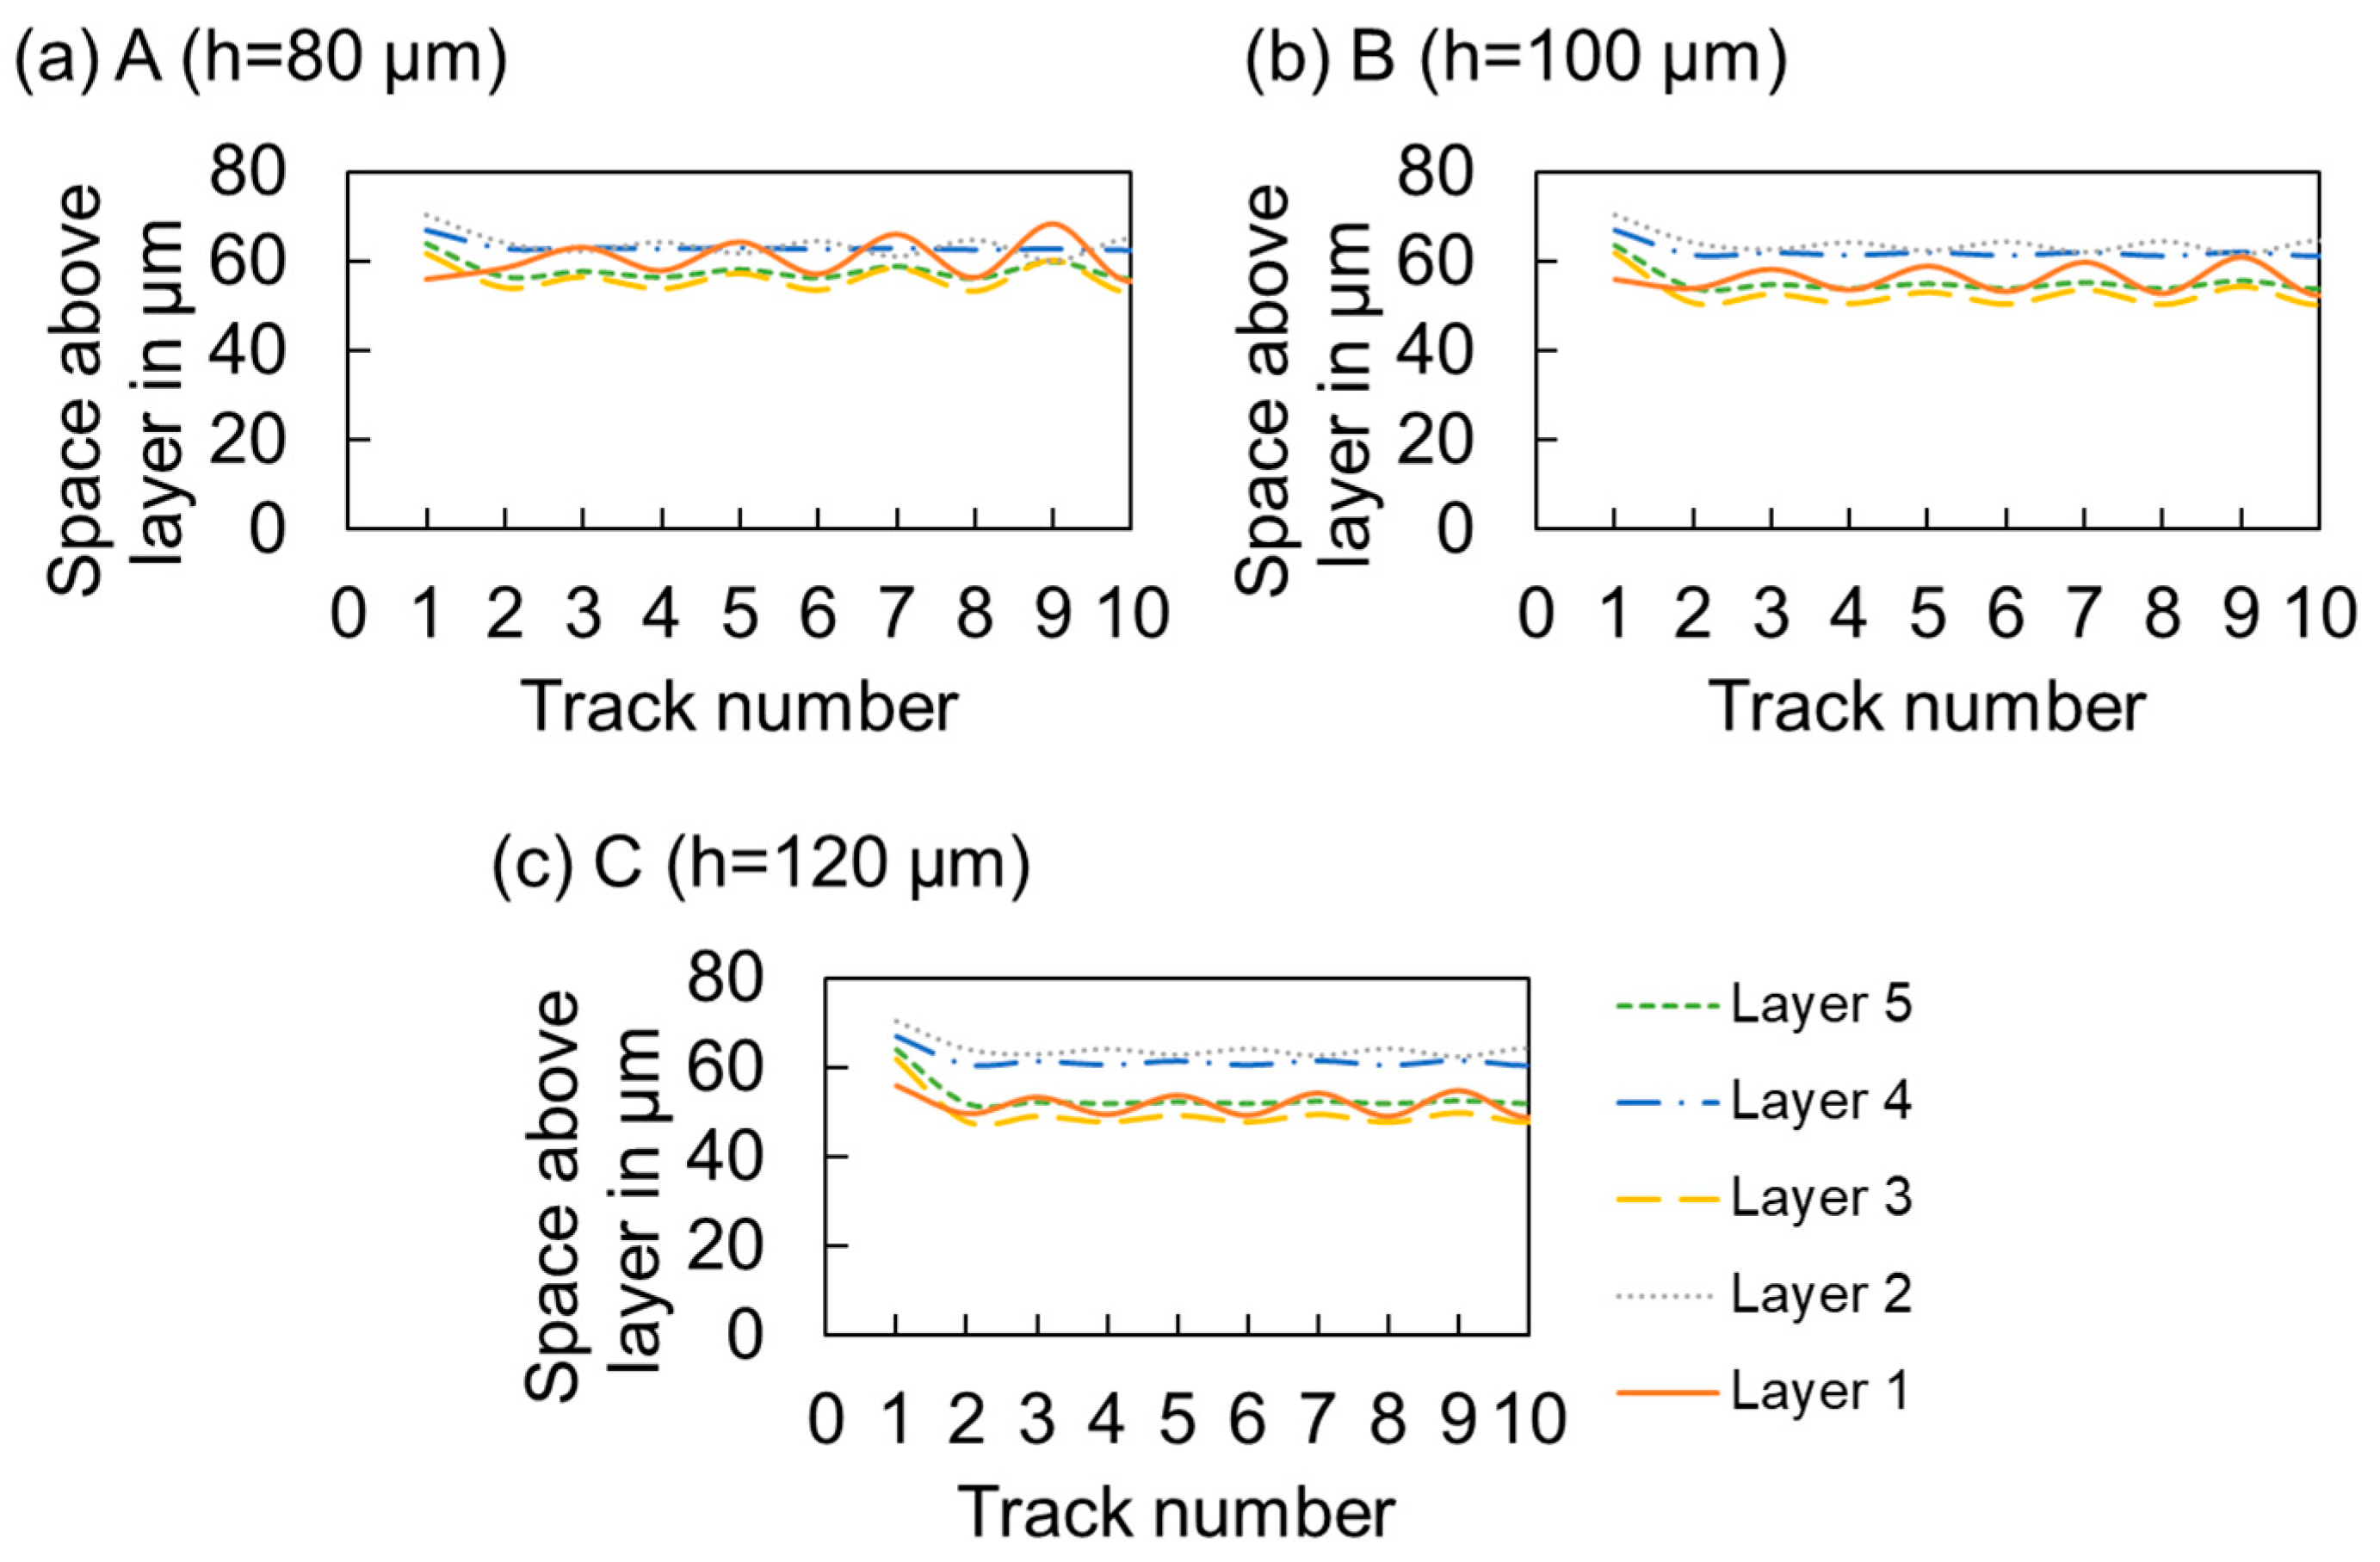
In order to derive how much space there is above the already built structure to the height where the new powder layer is applied, this calculated space was plotted in Figure 6. Although there is a powder layer height programmed of 40 µm, the actual applied powder layers have around 45 µm to 60 µm powder layer thicknesses depending on the actual track height. The increased space can be related to reduced amounts of available powder and densification effects.
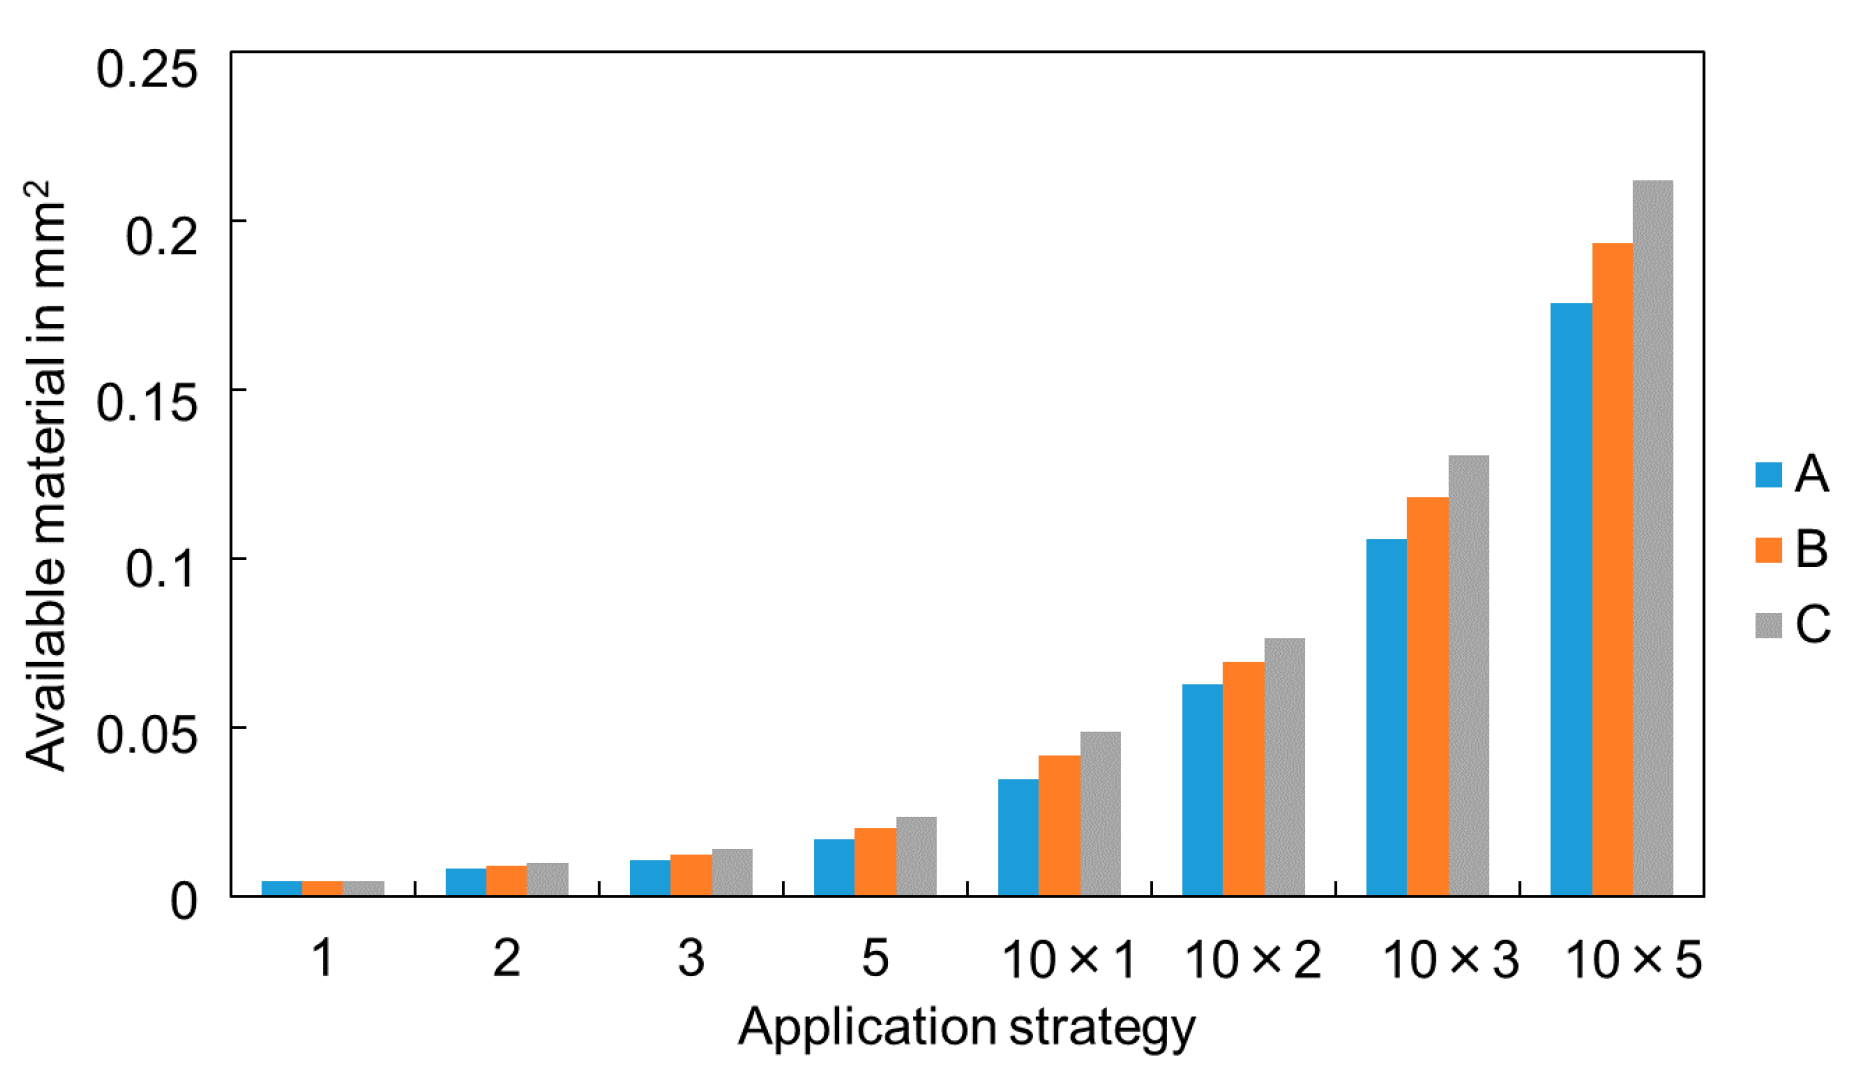
The simulations enabled to calculate the accumulated material available for each built structure (Figure 7), which is the sum of all available powder material for all tracks built for each application strategies. For all application strategies, the available amount of powder increases at larger hatch distances.
3.2. Cross-Section Evaluation
Figure 8 shows a cross-sectional view of two consecutively built tracks on top of a base structure. A fish-scale pattern generated by solidified melt pools is visible in Light Optical Microscope images collected on as-built samples (Figure 8a). EBSD analyses were performed on the cross section of laser tracks and the orientation map of α-Al phase and Inverse Pole Figures are reported in Figure 8b and Figure 8c, respectively. Grains slightly elongated towards the center of the melt pool are visible. Fine grains are also noticeable at the boundary of the solidified melt pools (Figure 8b); it is likely that their growth was hindered by grains with more favorable orientation to the thermal gradients. Figure 8c shows a <001> texture both along the scanning direction and building direction (z-direction and y-direction in the EBSD reference system, respectively). Indeed, epitaxial and competitive growth of grains occurs during the solidification of the melt pool, leading to the formation of a strong <001> texture along the maximum heat flow directions.
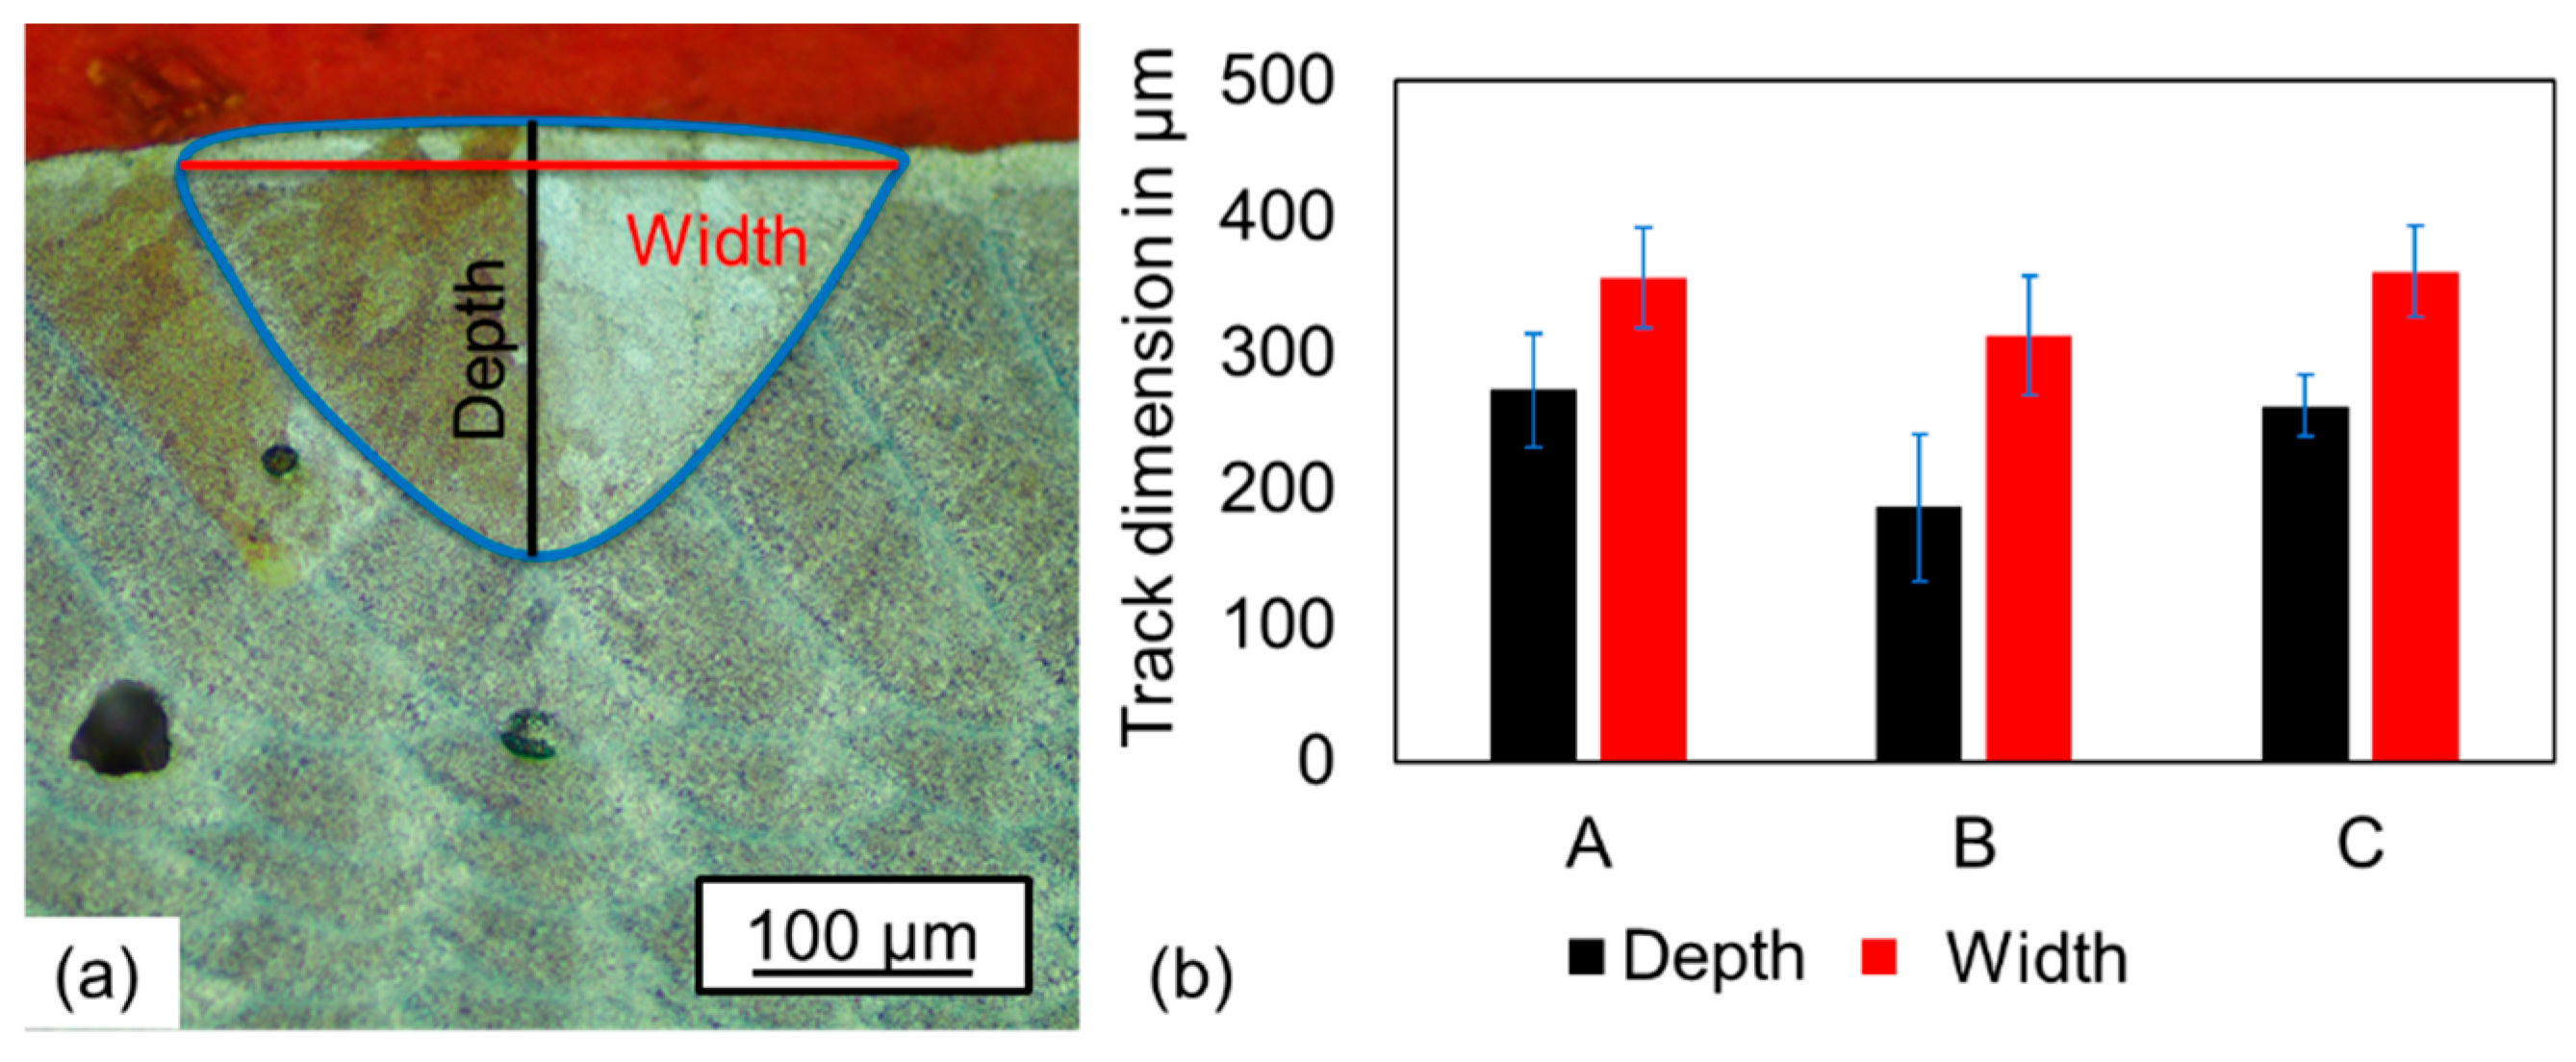
In the cross sections of the evaluated tracks, the widths and depths of the lastly built tracks were measured (Figure 9a). The average of the values at the different hatch distances are shown in Figure 9b.
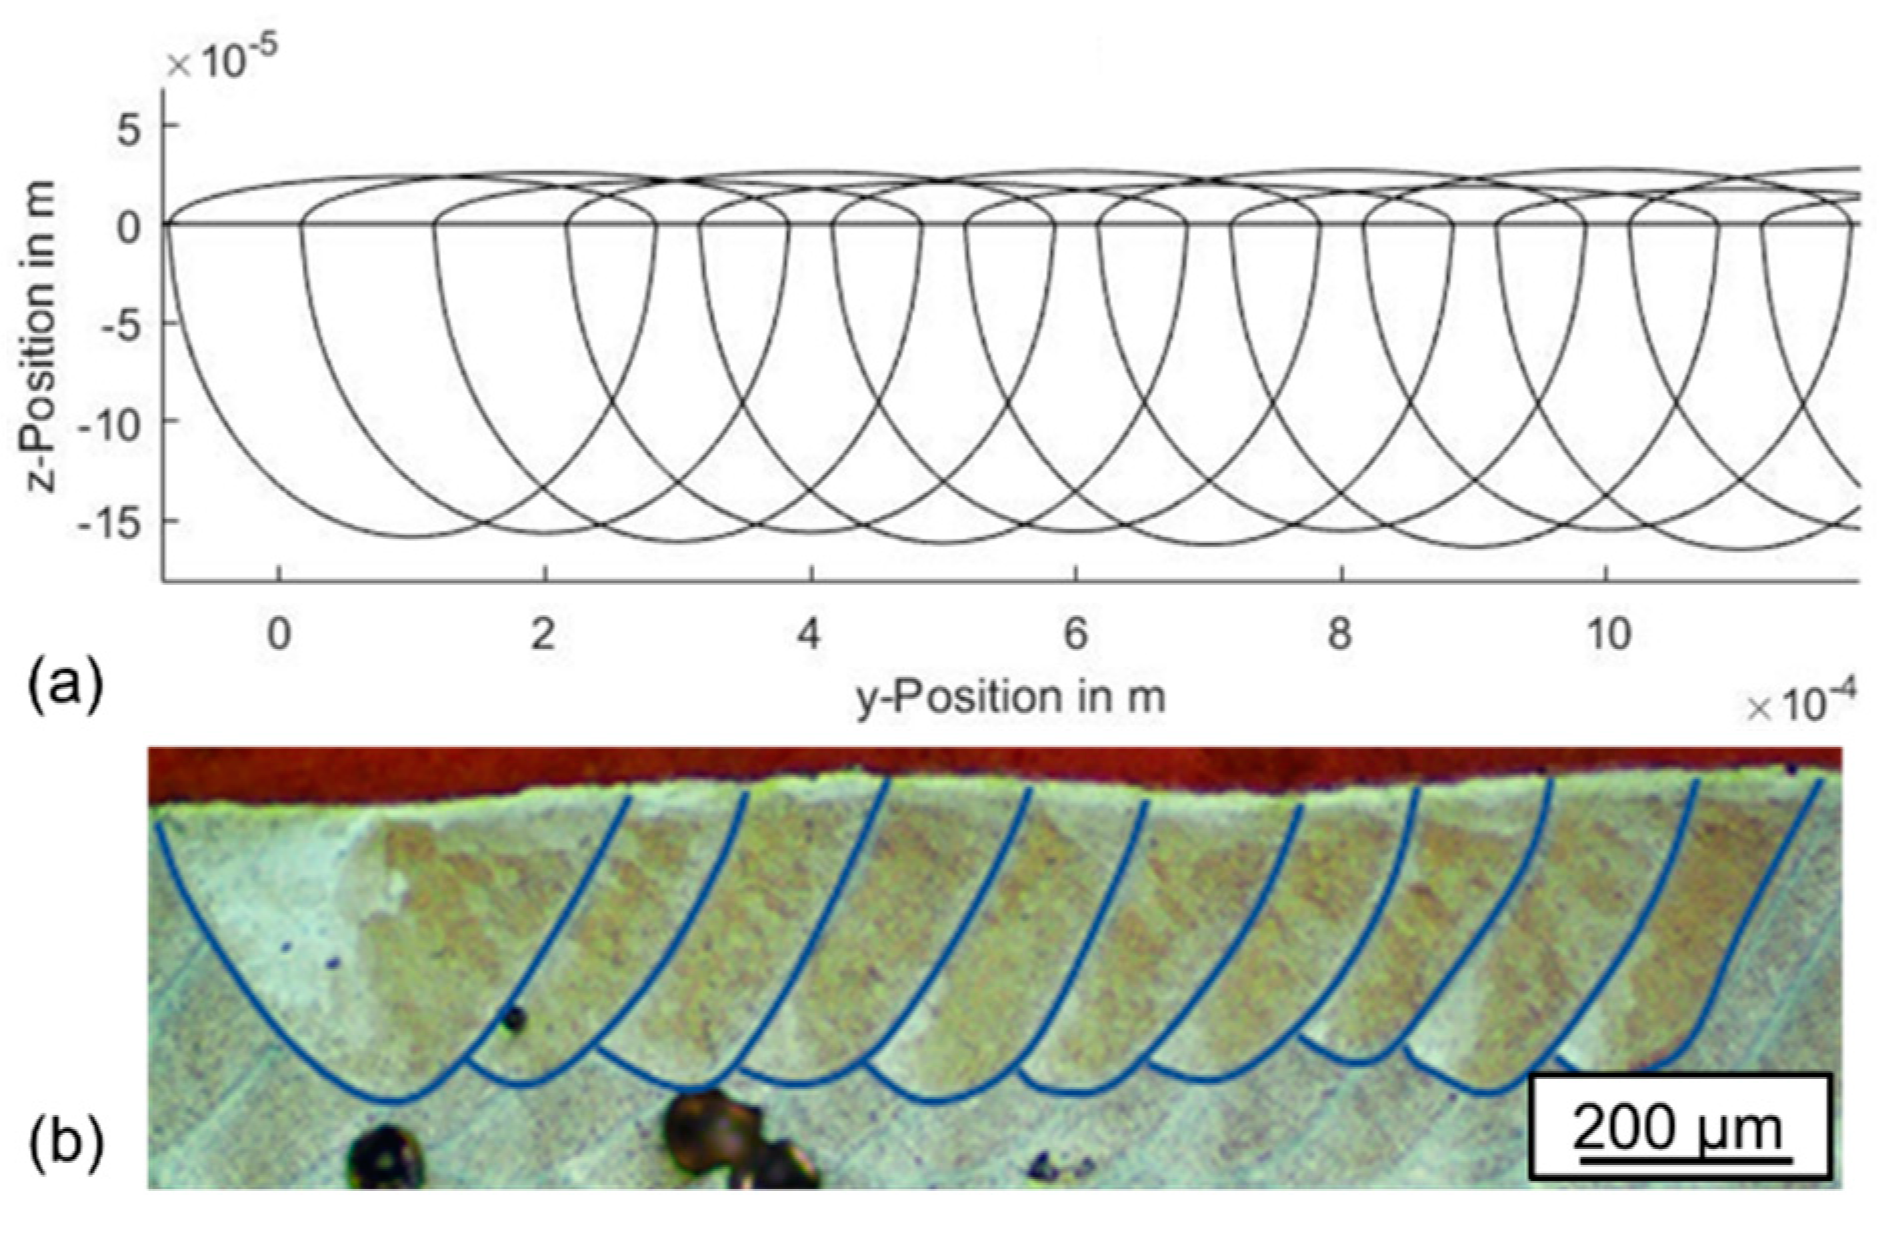
Example track occurrence at different hatch distances are shown in Figure 10. The dotted red line surrounds the added material by the tracks.
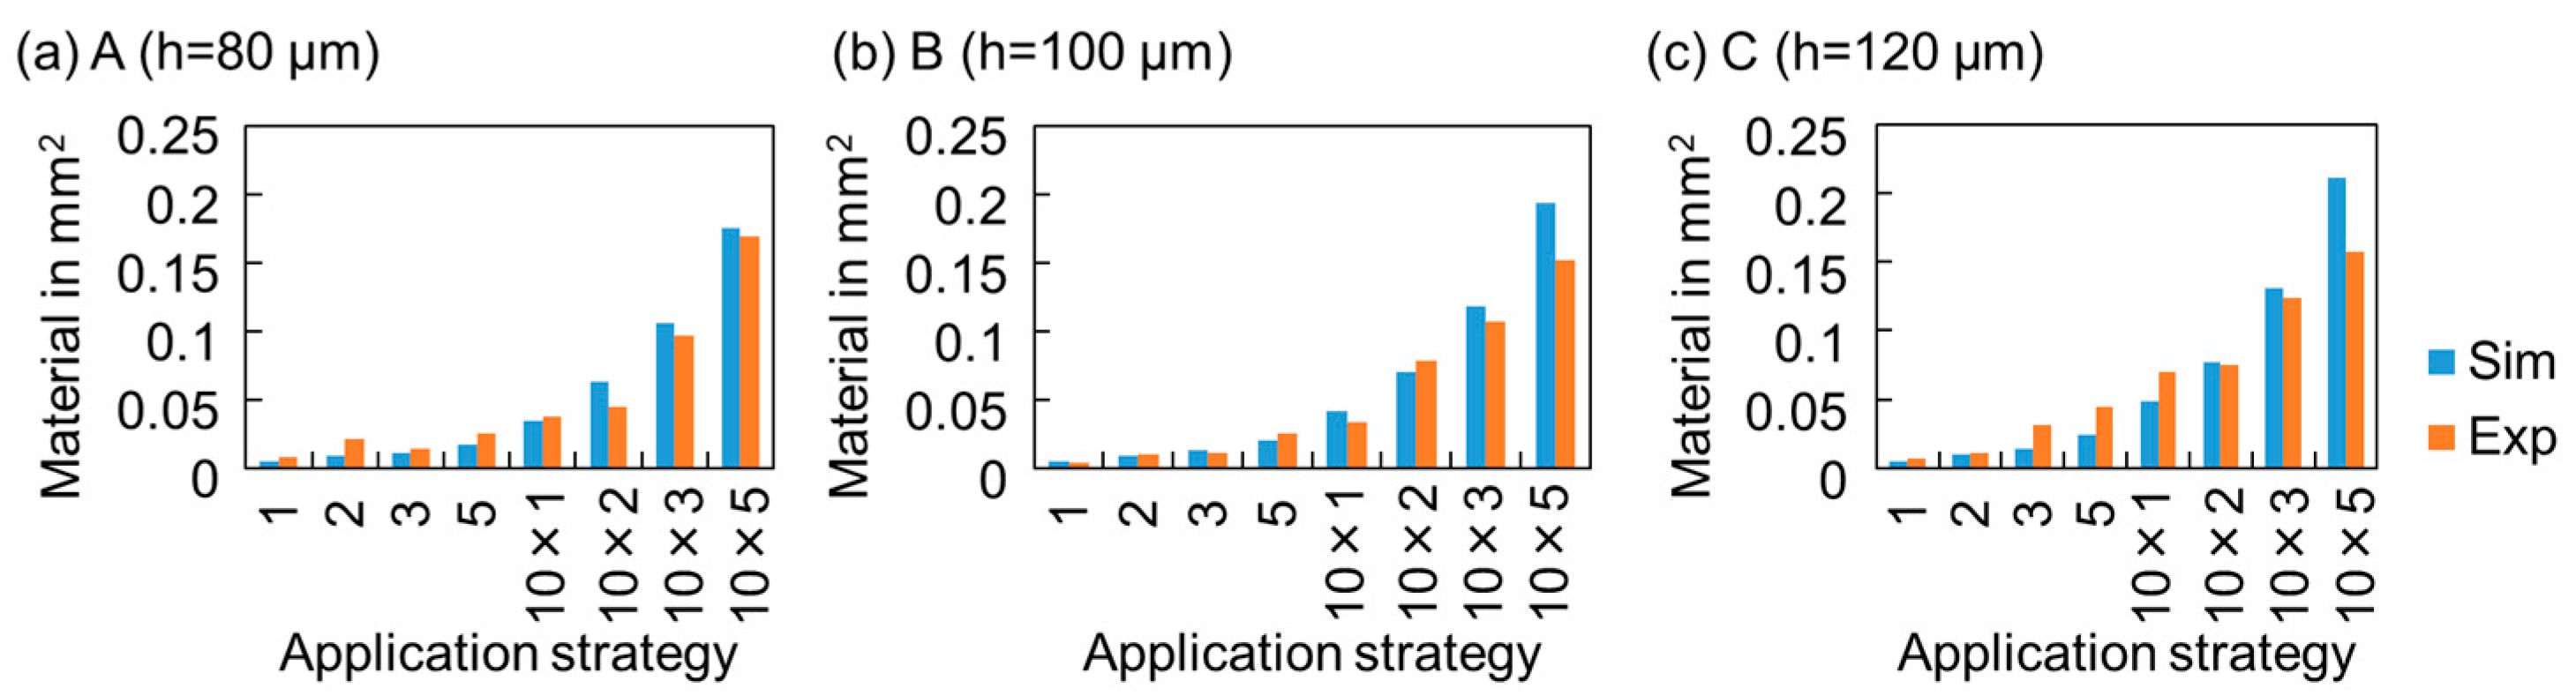
The area of these zones was measured for all experiments. Figure 11 shows the evaluation of used material (as cross-sectional area) for the different applied structures in the cross sections compared to the simulated material additions. In general, the simulated results are in good agreement with the measured values. In particular, for hatch distances of 100 µm and 120 µm, the simulation shows the tendency to predict larger material addition when applying more layers.
An exemplary comparison of simulated and experimentally derived tracks shows that the model gives a surface bulging that represents the additionally applied material, while the experimentally created tracks partly show no rounded caps (Figure 12).
When applying more layers, round surfaces occur. The bulging occurs with a low structure going into a maximum and a minimum in the center and back to a maximum leading into a low structure at the end (Figure 13).
4. Discussion
A comparison of experimental and simulated results of different tracks and layers reveals new insights into LPBF processes. The simulation and experimental results show in a wide range comparable tendencies. Therefore, the simple model is considered feasible to explain certain effects occurring during powder-bed processing.
4.1. Fluctuations within One Layer
The cross-sectional views of the built structures (Figure 9) confirmed that the single tracks show large depths compared to the added material, which shows that the energy input is large compared to the desired volume to melt, which is a typical trend for LPBF processes to use conservative process parameters to avoid defects [27]. Similar trends were seen in [18], where volume elements were seen to be melted several times, which requires a lot of energy but creates no additional value, since material is not added.
It was observed that fluctuations occur in track appearance within one layer, as was also documented in [20] or [28], where variations of the track depths were observed. The simulation results showed that variations of available powder occur due to the varying powder available for the single tracks. An alternating characteristic was found (Figure 5) in the observed modelled tracks within one layer. Since the model is based on assumptions about powder availability and powder pick-up from neighboring sections, the varying availability of powder can explain the observed variations. This confirms that the powder availability model predicts the material availability well.
At higher layers, the simulation overestimates the material addition compared to the experimentally measured ones for all hatch distances (Figure 11), while when building only a few tracks, the simulation prediction and experiments are similar or even the experimental material usage is slightly higher. The deviations are possibly related to effects that were not considered in the simple model: there is, e.g., a potential powder particle loss during the processing by induced gas flows [29] from the vapor plume [22]. Additionally, spattering can happen, which is induced by the melt pool dynamics [30] or resonant melt pool waves [31], denoting material losses. High-speed images could show that non-melted particles and agglomerations of powder particles are ejected from the processing zone [20]. This effect, in combination with the powder pick-up from neighboring sections, leads to the denudation zone and reduces the amount of available powder for the subsequent tracks.
The amplitudes of the fluctuations vary within one layer. When less space above the previous track was available, the layer became smoother. This observation is another hint that the denudation effect is different for each track. The first layer shows quite different boundary conditions compared to the subsequent layers. In the first layer, the first track sees a comparably high amount of powder, since no denudation zone was created before the processing (Figure 5). However, the track heights within the layer show large fluctuations in the simulations (Figure 5) and experiments (Figure 13) compared to higher layers. The denudation effects seem to have a larger impact on the powder availability and lead to more variations. In higher layers, the track height variations within one layer were reduced (Figure 5). The environment consisting of powder seems to support the powder to remain closer to the processing zone. Also, the observation that, at higher hatch distances, the powder availability is in general higher (Figure 7), indicates that the effect of particles that are blown away by induced gas flows is the minor effect compared to the powder pick-up from neighboring sections.
4.2. Fluctuations between Layers
In theory, the machine movement providing a constant stepwise movement of a defined distance before applying the next powder layer provides always the same powder layer thickness. However, in reality, the powder layer thicknesses vary in different layers. Only the first layer sees the programmed value, while due to denudation effects and densification, the subsequent powder layer thicknesses show larger heights (Figure 6). This might be a reason why LPBF machines use quite conservative parameters to ensure the melting of the tracks to the structure even when higher amounts of powder must be processed [27]. The knowledge about the process behavior can help to reduce the energy input where, e.g., less powder is available and the energy input would just mainly remelt the previous structure.
The observed layer fluctuations (Figure 5) show higher track additions in the uneven layers compared to the even-numbered layers, which was seen in the simulation and experimental results. Possible reasons can be the varying powder amount above the previous layer or surface tension effects that locally deform the structure compared to the expected structure.
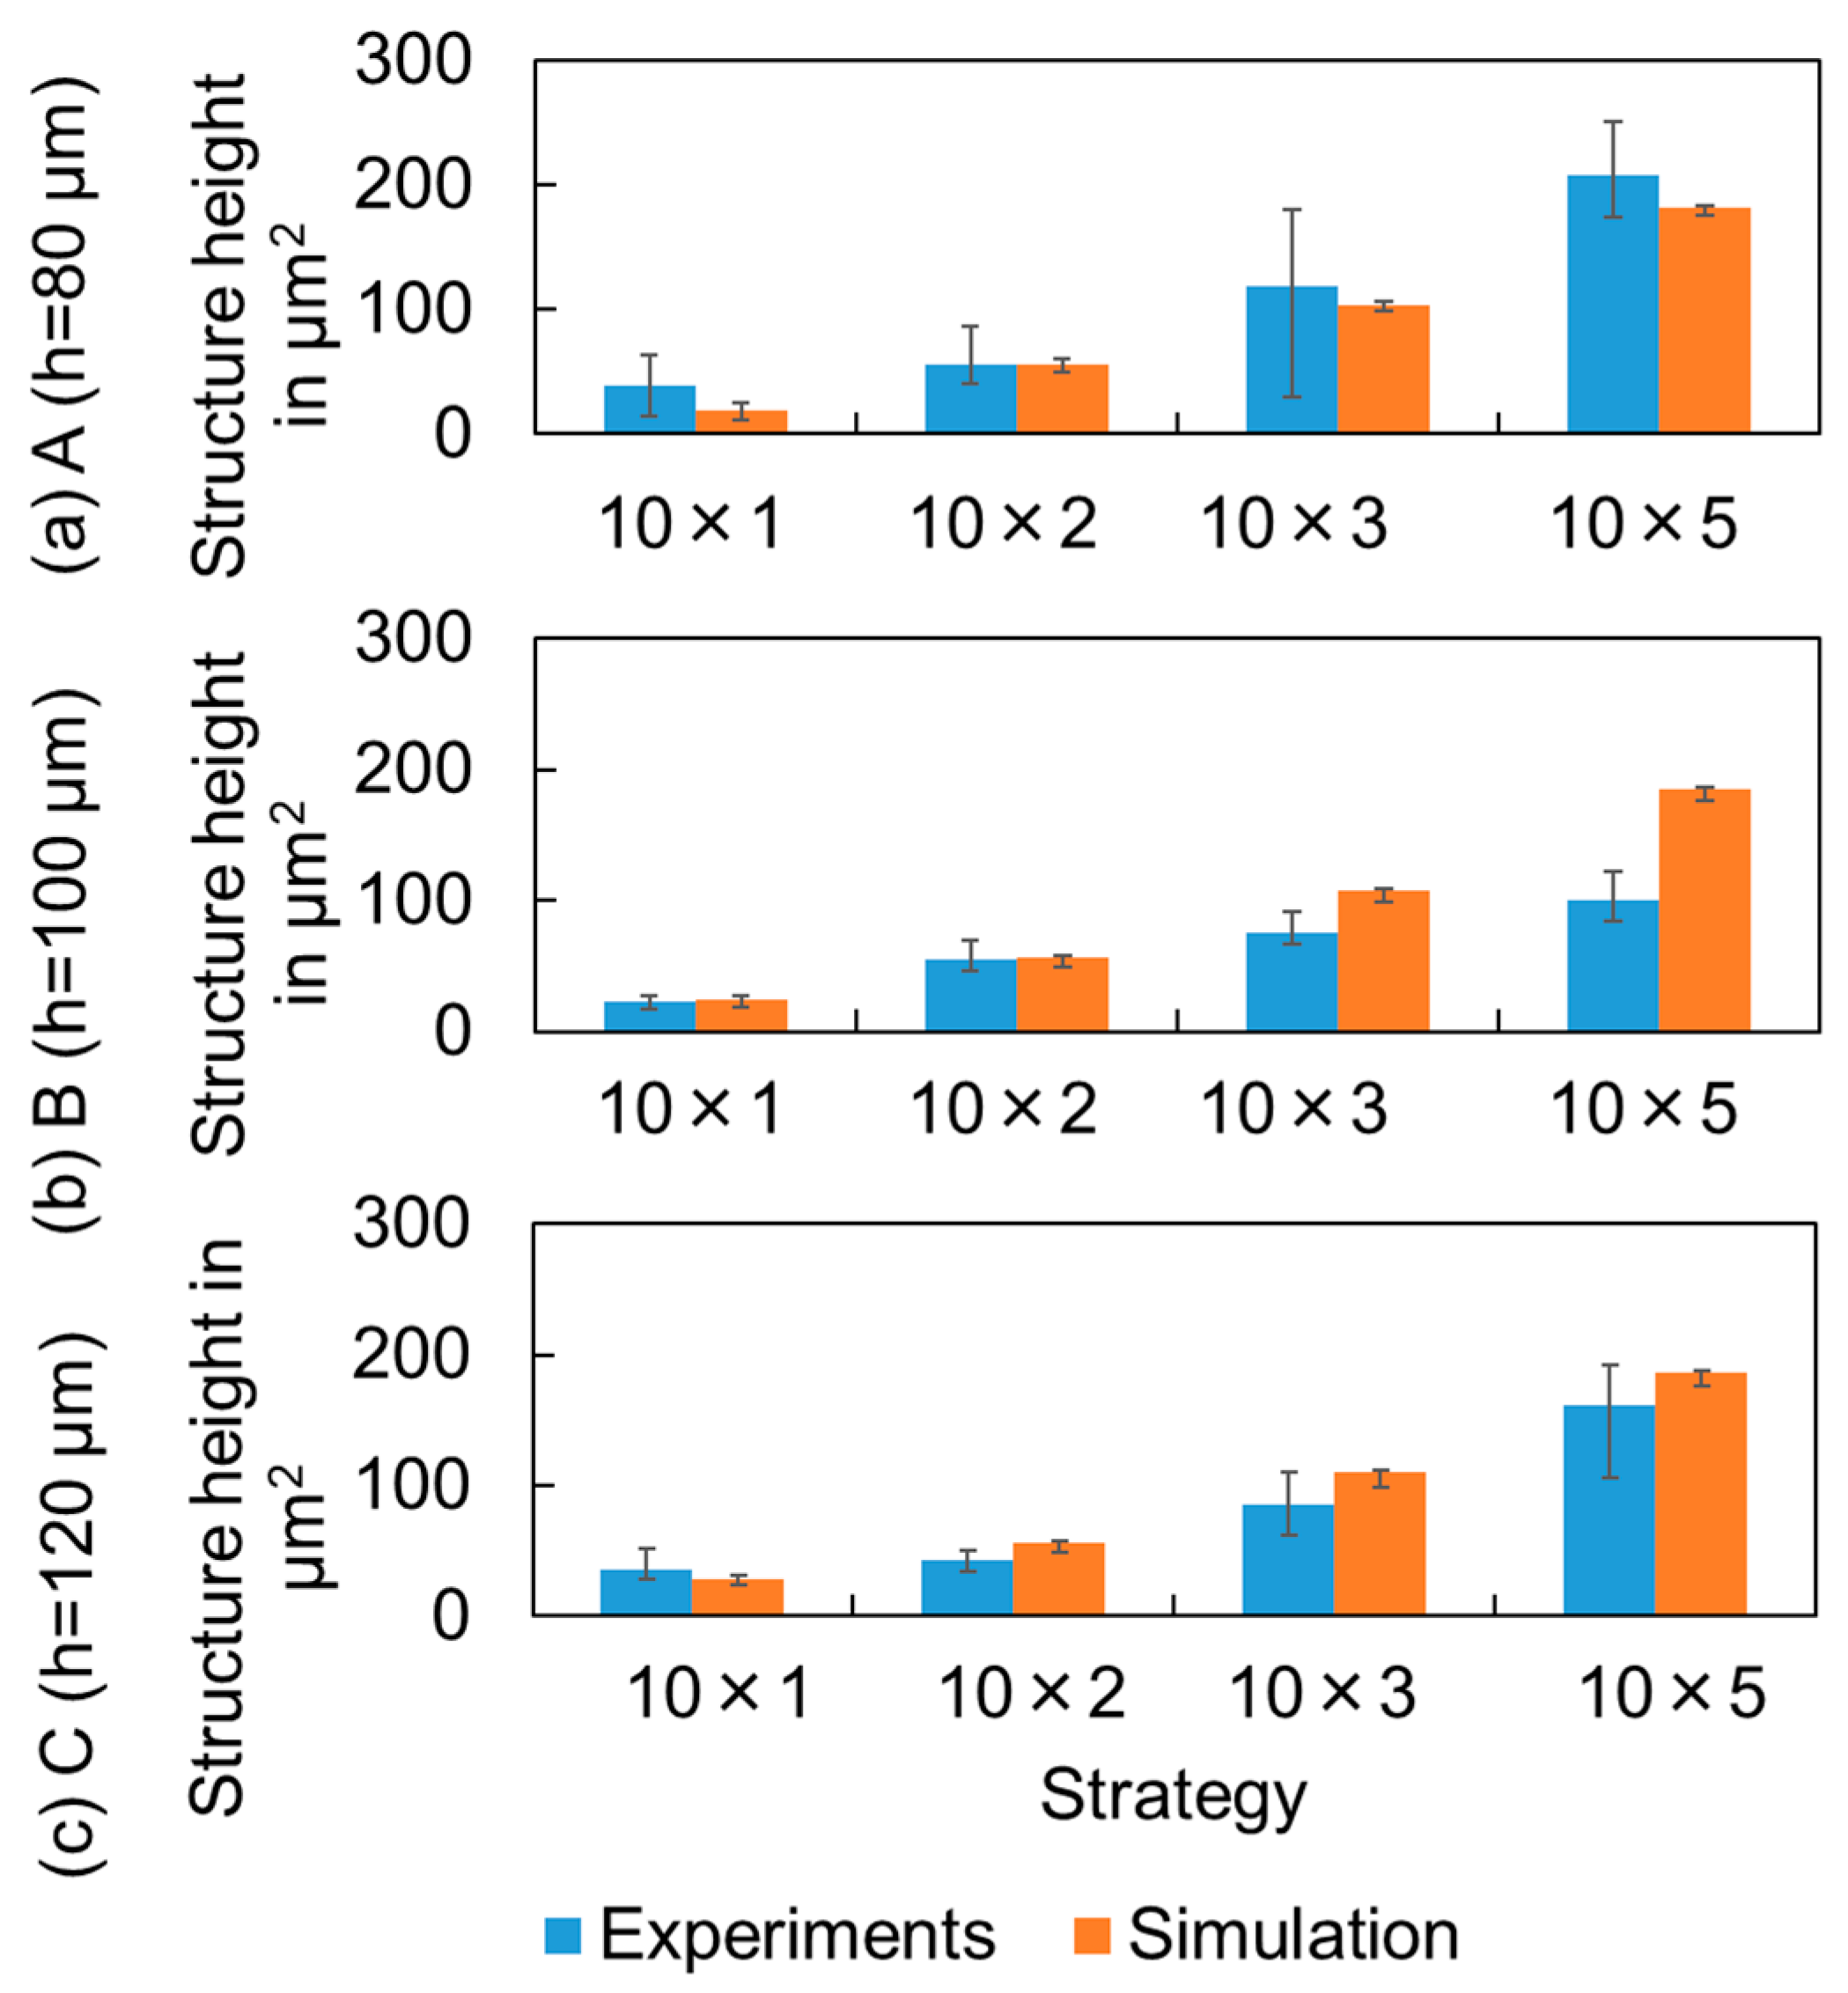
A comparison between simulated and experimentally measured structure heights in different layers (Figure 14) shows that the model predictions of the layer material additions are quite close to the experimental values. At large hatch distances (h = 100 µm and h = 120 µm), the simulation predicts slightly larger structure heights, which can be explained by the previous discussion about additional effects that occur in reality and were not considered in the model. Considering those effects would make the model more precise. However, the quantitative values of some of these effects are not yet known, e.g., the amount of material loss due to spattering. An implementation of those effects requires additional assumptions, which might reduce the possibility of finding possible explanations for the observed effects when the single impacts of too many parameters are present.
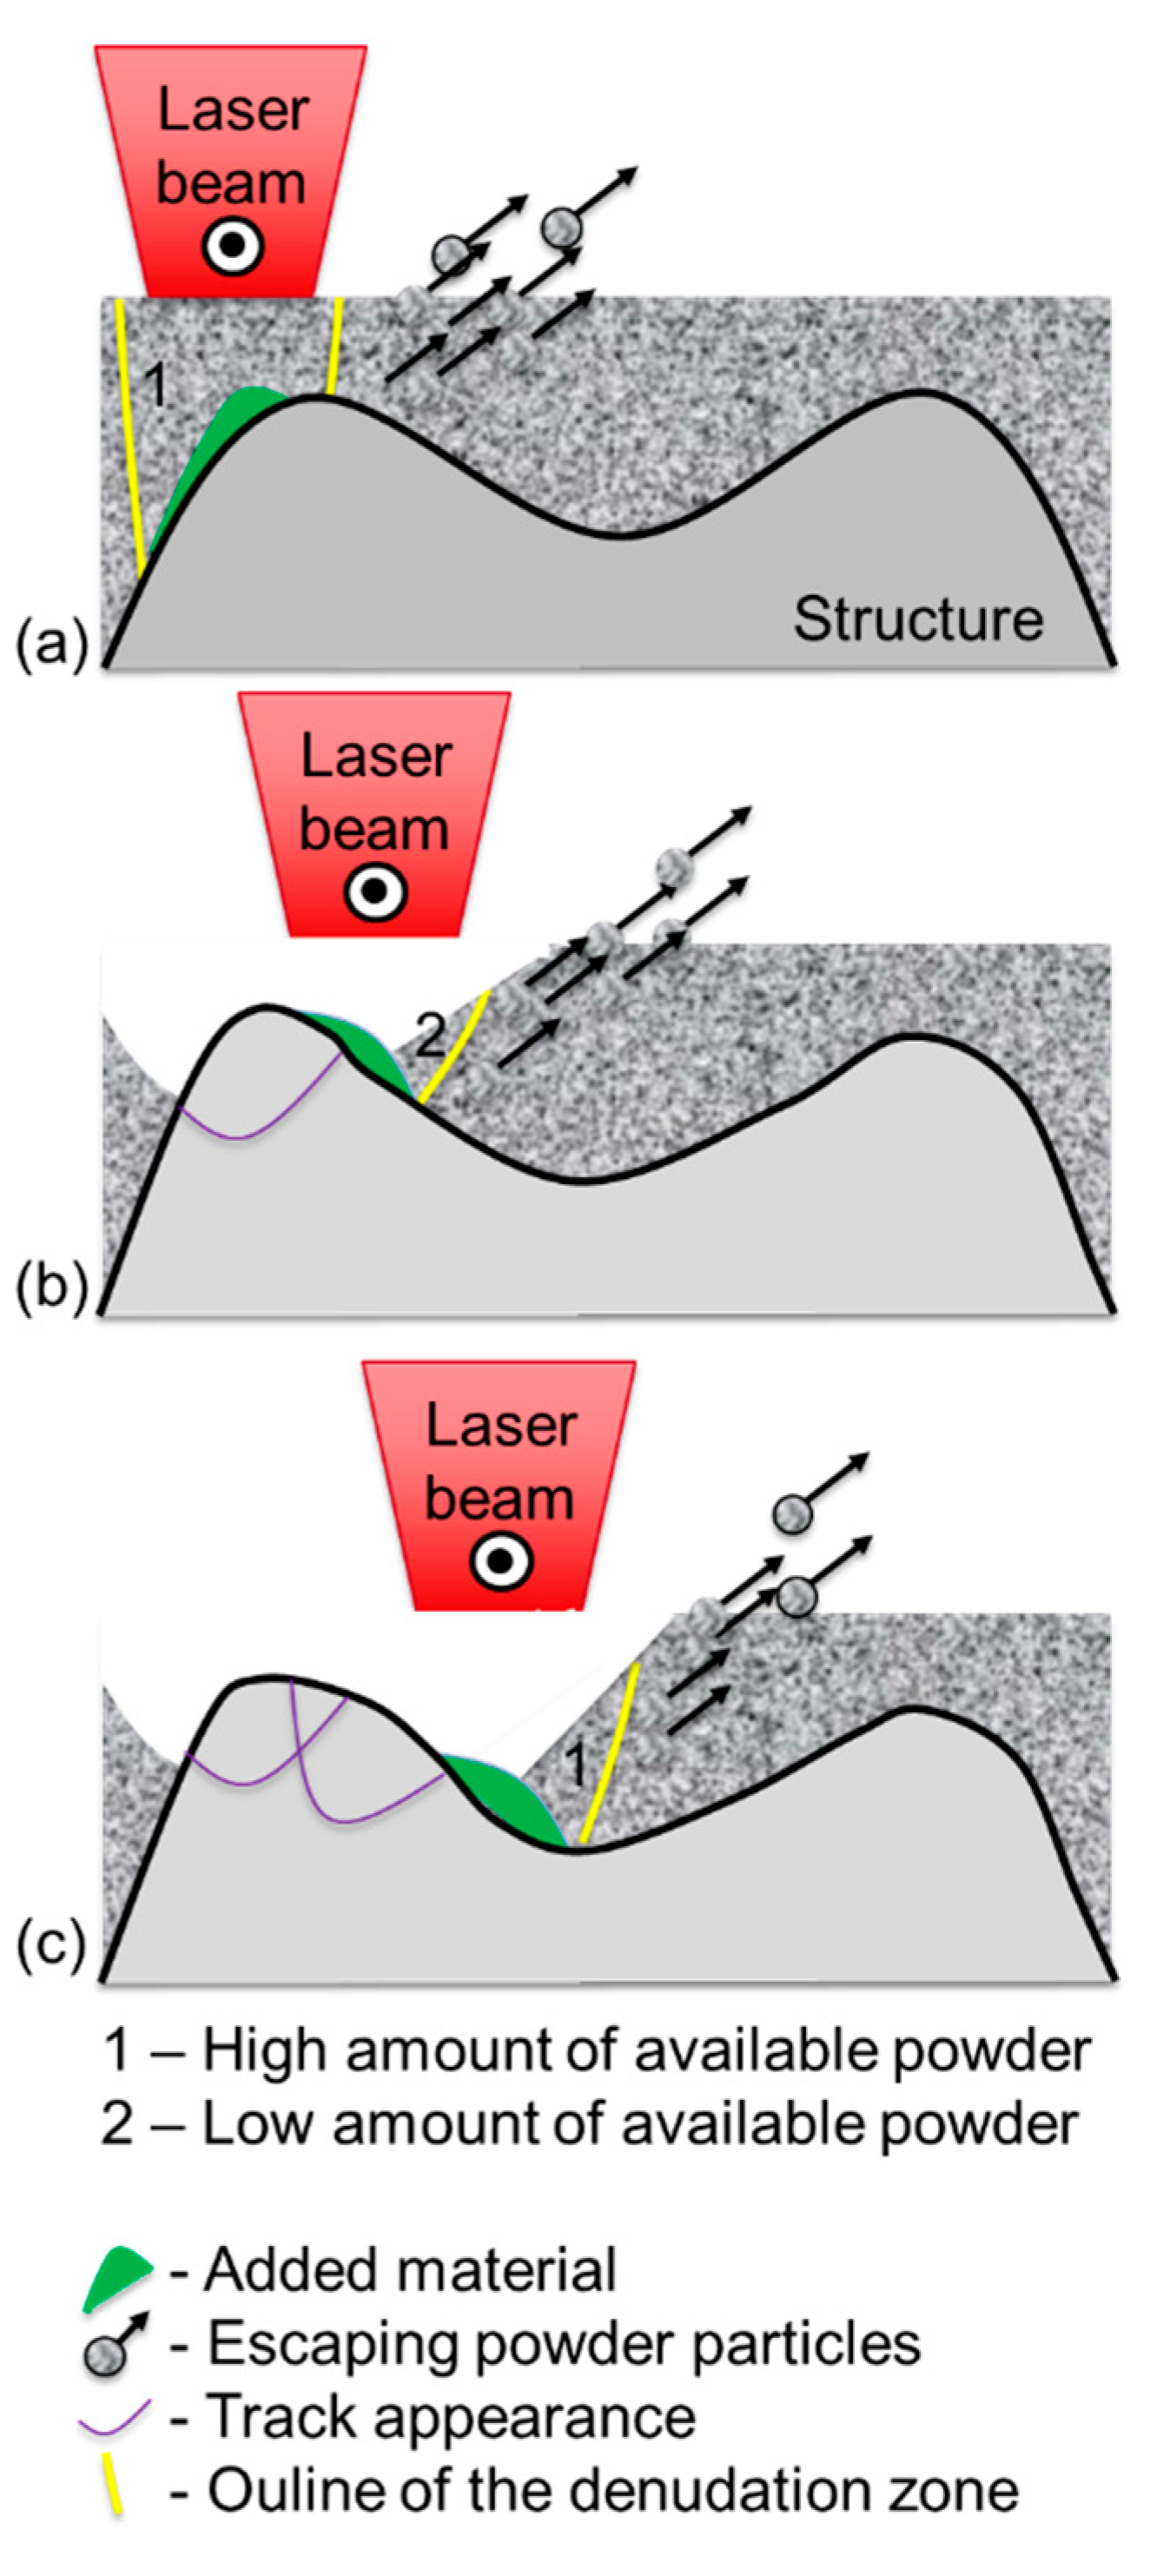
The large variations of the structure height are reflected as large error bars in Figure 14. When building higher layers, the surface tension effect leads to an accumulation of material around the edges after the beginning and before the end of the layers. This leads to larger heights and a minimum in the center. However, also the very first track (Figure 15a) sees a large amount of powder, which is available for incorporation into the structure, which increases the already extensively grown structure size. Therefore, this geometrical effect can alter the powder availability for the tracks and layers in addition to the denudation effects discussed before. Figure 15b shows that for the second (even) numbered tracks, less material is available and mainly the previous structure is remelted, which can support the formation of the surface tension-driven round structure, while only a minimum of material is available. Less powder will be available at the high-structure regions and more powder will be available in the structure center. There, the risk of incomplete melting can occur since the laser energy might not be sufficient anymore to melt the available powder to the structure. Interestingly, however, the lower surface in the center of the structure indicates that there was not much powder material available for building those tracks. In Figure 15c, slightly more powder is available compared to Figure 15b. However, the denudation effects reduce the amount of powder already before processing. Therefore, the powder availability is limited and the structure will remain low in the center region even though the material was available in the beginning of the layer processing. An additional problem to consider is that the laser beam is not focused as expected when hitting the actual powder surface. Typically, the laser beam focus is set on the top of the powder layer to guarantee high intensities, while the intensity is reduced in defocused position at larger laser spot sizes, which can alter the process.
It is indicated that, besides denudation effects, induced gas flows and geometrical characteristics of the built structure can alter the powder availability of tracks, which leads to variations of track and layer dimensions.
5. Conclusions
The developed simple analytical model predicts the tracks and layers in LPBF well. A comparison between simulation and experimental results led to the following conclusions:
- Applied powder layer heights vary for each track and each layer. Above the layers, powder layer thicknesses larger than the programmed machine increment must be expected due to shrinking effects.
- The powder availability varies from each track and between layers. A larger hatch distance can increase the powder usage efficiency due to the reduced powder pick-up from the surrounding and powder volumes denoted for subsequent tracks. The powder availability between layers fluctuates as seen in the simulations, which was shown to lead to similar tendencies of different distances between the layers in the experiments.
- The first track in one layer always (except for the first layer) has the most powder available since no powder was taken from other tracks. Afterwards, gas flows during processing and powder pick-up led to the reduction of available powder and denudation.
- Additional effects can alter the powder availability. It was seen that the effect of surface tension forms rounded structures in higher layers.
Author Contributions
Conceptualization, J.V. and R.C.; methodology, J.V. and R.C.; validation, F.B., J.V. and R.C.; formal analysis, F.B., J.V. and R.C.; investigation, F.B., J.V. and R.C.; writing—original draft preparation, J.V.; writing—review and editing, R.C.; visualization, J.V. and R.C.; project administration, J.V. and R.C. funding acquisition, J.V. and R.C. All authors have read and agreed to the published version of the manuscript.
Funding
The authors kindly acknowledge the funding of SAMOA-Sustainable Aluminium additive Manufacturing for high-performance Applications (EIT raw materials, No. 18079), SPAcEMAN-Sustainable Powders for AdditivE MANufacturing (EIT raw materials, No. 17070), SMART-Surface tension of Metals Above vapoRization Temperature (Vetenskapsrådet, 2020-04250). The Italian Ministry of Education, University and Research is also acknowledged for the support provided through the Project “Department of Excellence LIS4.0-Lightweight and Smart Structures for Industry 4.0”.
Institutional Review Board Statement
Not applicable.
Informed Consent Statement
Not applicable.
Data Availability Statement
Not applicable.
Acknowledgments
The authors kindly acknowledge the kind support and powder material supply by IMR Metal Powder Technologies GmbH.
Conflicts of Interest
The authors declare no conflict of interest.
References
- Hilal, H.; Lancaster, R.; Jeffs, S.; Boswell, J.; Stapleton, D.; Baxter, G. The influence of process parameters and build orientation on the creep behaviour of a laser powder bed fused Ni-based superalloy for aerospace applications. Materials 2019, 12, 1390. [Google Scholar] [CrossRef] [PubMed] [Green Version]
- Han, Q.; Gu, Y.; Setchi, R.; Lacan, F.; Johnston, R.; Evans, S.L.; Yang, S. Additive manufacturing of high-strength crack-free Ni-based Hastelloy X superalloy. Addit. Manuf. 2019, 30, 100919. [Google Scholar] [CrossRef]
- Lough, C.S.; Wang, X.; Smith, C.C.; Landers, R.G.; Bristow, D.A.; Drallmeier, J.A.; Brown, B.; Kinzel, E.C. Correlation of SWIR imaging with LPBF 304L stainless steel part properties. Addit. Manuf. 2020, 35, 101359. [Google Scholar]
- Yadroitsev, I.; Krakhmalev, P.; Yadroitsava, I. Titanium alloys manufactured by in situ alloying during laser powder bed fusion. JOM 2017, 69, 2725–2730. [Google Scholar] [CrossRef]
- Manfredi, D.; Calignano, F.; Krishnan, M.; Canali, R.; Paola, E.; Biamino, S.; Ugues, D.; Pavese, M.; Fino, P. Additive Manufacturing of Al Alloys and Aluminium Matrix Composites (AMCs). Light Met. Alloy. Appl. 2014, 11, 3–34. [Google Scholar] [CrossRef] [Green Version]
- Aboulkhair, N.T.; Maskery, I.; Tuck, C.; Ashcroft, I.; Everitt, N.M. On the formation of AlSi10Mg single tracks and layers in selective laser melting: Microstructure and nano-mechanical properties. J. Mater. Process. Technol. 2016, 230, 88–98. [Google Scholar] [CrossRef]
- Buchbinder, D.; Schleifenbaum, H.; Heidrich, S.; Meiners, W.; Bültmann, J.J.P.P. High power selective laser melting (HP SLM) of aluminum parts. Phys. Procedia 2011, 12, 271–278. [Google Scholar] [CrossRef]
- Buchbinder, D.; Meiners, W.; Wissenbach, K.; Müller-Lohmeier, K.; Brandl, E.; Skrynecki, N. Rapid Manufacturing of Aluminum Parts for Serial Production via Selective Laser Melting (SLM). In Proceedings of the International Conference on Rapid Manufacturing, Loughborough, UK, 8–9 July 2009. [Google Scholar]
- Gordon, J.V.; Narra, S.P.; Cunningham, R.W.; Liu, H.; Chen, H.; Suter, R.M.; Beuth, J.L.; Rollett, A.D. Defect structure process maps for laser powder bed fusion additive manufacturing. Addit. Manuf. 2020, 36, 101552. [Google Scholar] [CrossRef]
- Gunenthiram, V.; Peyre, P.; Schneider, M.; Dal, M.; Coste, F.; Fabbro, R. Analysis of laser–melt pool–powder bed interaction during the selective laser melting of a stainless steel. J. Laser Appl. 2017, 29, 022303. [Google Scholar] [CrossRef]
- Sabzi, H.E.; Maeng, S.; Liang, X.; Simonelli, M.; Aboulkhair, N.T.; Rivera-Díaz-del-Castillo, P.E. Controlling crack formation and porosity in laser powder bed fusion: Alloy design and process optimisation. Addit. Manuf. 2020, 34, 101360. [Google Scholar] [CrossRef]
- Dai, D.; Gu, D. Thermal behavior and densification mechanism during selective laser melting of copper matrix composites: Simulation and experiments. Mater. Des. 2014, 55, 482–491. [Google Scholar] [CrossRef]
- Simonelli, M.; Tuck, C.; Aboulkhair, N.T.; Maskery, I.; Ashcroft, I.; Wildman, R.D.; Hague, R. A study on the laser spatter and the oxidation reactions during selective laser melting of 316L stainless steel, Al-Si10-Mg, and Ti-6Al-4V. Metall. Mater. Trans. A 2015, 46, 3842–3851. [Google Scholar] [CrossRef]
- DebRoy, T.; Wei, H.L.; Zuback, J.S.; Mukherjee, T.; Elmer, J.W.; Milewski, J.O.; Beese, A.M.; Wilson-Heid, A.; De, A.; Zhang, W. Additive manufacturing of metallic components–process, structure and properties. Prog. Mater. Sci. 2018, 92, 112–224. [Google Scholar] [CrossRef]
- Maamoun, A.H.; Xue, Y.F.; Elbestawi, M.A.; Veldhuis, S.C. The effect of selective laser melting process parameters on the microstructure and mechanical properties of Al6061 and AlSi10Mg alloys. Materials 2019, 12, 12. [Google Scholar] [CrossRef] [PubMed] [Green Version]
- Cordova, L.; Bor, T.; de Smit, M.; Carmignato, S.; Campos, M.; Tinga, T. Effects of powder reuse on the microstructure and mechanical behaviour of Al–Mg–Sc–Zr alloy processed by laser powder bed fusion (LPBF). Addit. Manuf. 2020, 36, 101625. [Google Scholar] [CrossRef]
- Wang, W.; Ning, J.; Liang, S.Y. Prediction of lack-of-fusion porosity in laser powder-bed fusion considering boundary conditions and sensitivity to laser power absorption. Int. J. Adv. Manuf. Technol. 2021, 112, 61–70. [Google Scholar] [CrossRef]
- Matthews, M.; Trapp, J.; Guss, G.; Rubenchik, A. Direct measurements of laser absorptivity during metal melt pool formation associated with powder bed fusion additive manufacturing processes. J. Laser Appl. 2018, 30, 032302. [Google Scholar] [CrossRef]
- Mishra, P.; Ilar, T.; Brueckner, F.; Kaplan, A. Energy efficiency contributions and losses during selective laser melting. J. Laser Appl. 2018, 30, 032304. [Google Scholar] [CrossRef]
- Volpp, J.; Brueckner, F.; Kaplan, A.F. Track geometry variations in selective laser melting processes. J. Laser Appl. 2019, 31, 022310. [Google Scholar] [CrossRef]
- Heeling, T.; Gerstgrasser, M.; Wegener, K. Investigation of selective laser melting spatter characteristics for single-and multi-beam strategies using high speed imaging. In Proceedings of the Lasers in Manufacturing Conference (LiM 2017), Munich, Germany, 26–29 June 2017; Wissenschaftliche Gesellschaft Lasertechnik eV (WLT): Hannover, Germany, 2017. [Google Scholar]
- Guo, Q.; Zhao, C.; Escano, L.I.; Young, Z.; Xiong, L.; Fezzaa, K.; Everhart, W.; Brown, B.; Sun, T.; Chen, L. Transient dynamics of powder spattering in laser powder bed fusion additive manufacturing process revealed by in-situ high-speed high-energy x-ray imaging. Acta Mater. 2018, 151, 169–180. [Google Scholar] [CrossRef]
- Matthews, M.J.; Guss, G.; Khairallah, S.A.; Rubenchik, A.M.; Depond, P.J.; King, W.E. Denudation of metal powder layers in laser powder bed fusion processes. Acta Mater. 2016, 114, 33–42. [Google Scholar] [CrossRef] [Green Version]
- Volpp, J. Spattering effects during selective laser melting. J. Laser Appl. 2020, 32, 022023. [Google Scholar] [CrossRef]
- Yadroitsev, I.; Smurov, I. Surface morphology in selective laser melting of metal powders. Phys. Procedia 2011, 12, 264–270. [Google Scholar] [CrossRef] [Green Version]
- Boley, C.D.; Mitchell, S.C.; Rubenchik, A.M.; Wu, S.S.Q. Metal powder absorptivity: Modeling and experiment. Appl. Opt. 2016, 55, 6496–6500. [Google Scholar] [CrossRef]
- Yap, C.Y.; Chua, C.K.; Dong, Z.L.; Liu, Z.H.; Zhang, D.Q.; Loh, L.E.; Sing, S.L. Review of selective laser melting: Materials and applications. Appl. Phys. Rev. 2015, 2, 041101. [Google Scholar] [CrossRef]
- Yadroitsev, I.; Thivillon, L.; Bertrand, P.; Smurov, I. Strategy of manufacturing components with designed internal structure by selective laser melting of metallic powder. Appl. Surf. Sci. 2007, 254, 980–983. [Google Scholar] [CrossRef]
- Bidare, P.; Bitharas, I.; Ward, R.M.; Attallah, M.M.; Moore, A.J. Fluid and particle dynamics in laser powder bed fusion. Acta Mater. 2018, 142, 107–120. [Google Scholar] [CrossRef]
- Katayama, S.; Kawahito, Y. Elucidation of phenomena in high power fiber laser welding and development of prevention procedures of welding defects. Proc. SPIE 2009, 7195, 71951. [Google Scholar]
- Weberpals, J.-P. Nutzen und Grenzen guter Fokussierbarkeit beim Laserschweißen. In Laser in der Materialbearbeitung, Forschungsberichte der IFSW; Graf, T., Ed.; Herbert Utz: Munich, Germany, 2010. [Google Scholar]
Figure 1.
Schematic of the tracks and multiple-layer strategy. Three builds were printed setting a hatch distance h of 80 µm, 100 µm and 120 µm.
Figure 1.
Schematic of the tracks and multiple-layer strategy. Three builds were printed setting a hatch distance h of 80 µm, 100 µm and 120 µm.

Figure 2.
Sketch of the modeling boundary conditions for (a) the first track, (b) the second track and (c) the second layer.
Figure 2.
Sketch of the modeling boundary conditions for (a) the first track, (b) the second track and (c) the second layer.

Figure 3.
Simulated tracks at an absorption of 15%.

Figure 4.
Simulated appearance of tracks of 5 consecutive layers at hatch distances h of (a) 80 µm, (b) 100 µm and (c) 120 µm.
Figure 4.
Simulated appearance of tracks of 5 consecutive layers at hatch distances h of (a) 80 µm, (b) 100 µm and (c) 120 µm.

Figure 5.
Simulated track heights in different layers at hatch distances of (a) 80 µm, (b) 100 µm and (c) 120 µm.
Figure 5.
Simulated track heights in different layers at hatch distances of (a) 80 µm, (b) 100 µm and (c) 120 µm.

Figure 6.
Calculated space above the single layers for the subsequent powder application at hatch distances of (a) 80 µm, (b) 100 µm and (c) 120 µm.
Figure 6.
Calculated space above the single layers for the subsequent powder application at hatch distances of (a) 80 µm, (b) 100 µm and (c) 120 µm.

Figure 7.
Simulated available material for the different structures and hatch distances (A: h = 80 µm; B: h = 100 µm; C: h = 120 µm).
Figure 7.
Simulated available material for the different structures and hatch distances (A: h = 80 µm; B: h = 100 µm; C: h = 120 µm).

Figure 8.
(a) Cross section of an exemplary structure with two additional tracks at a hatch distance of 100 µm. (b) EBSD orientation map of α-Al phase and (c) Inverse Pole Figures obtained by EBSD analyses performed on the vertical section of a two-track specimen.
Figure 8.
(a) Cross section of an exemplary structure with two additional tracks at a hatch distance of 100 µm. (b) EBSD orientation map of α-Al phase and (c) Inverse Pole Figures obtained by EBSD analyses performed on the vertical section of a two-track specimen.

Figure 9.
(a) Measurement of the depths and widths of single tracks in cross-sections and (b) evaluation at different hatch distances (A: 80 µm; B: 100 µm; C: 120 µm).
Figure 9.
(a) Measurement of the depths and widths of single tracks in cross-sections and (b) evaluation at different hatch distances (A: 80 µm; B: 100 µm; C: 120 µm).

Figure 10.
Example of layer occurrence (black solid lines) at 3-track-addition at different hatch distances h including added area (red dotted lines).
Figure 10.
Example of layer occurrence (black solid lines) at 3-track-addition at different hatch distances h including added area (red dotted lines).

Figure 11.
Experimentally evaluated and simulated material used for building the structures at hatch distances h of (a) 80 µm, (b) 100 µm and (c) 120 µm.
Figure 11.
Experimentally evaluated and simulated material used for building the structures at hatch distances h of (a) 80 µm, (b) 100 µm and (c) 120 µm.

Figure 12.
Comparison of (a) simulation and (b) experimental results of building 10 consecutive tracks (hatch distance h = 100 µm).
Figure 12.
Comparison of (a) simulation and (b) experimental results of building 10 consecutive tracks (hatch distance h = 100 µm).

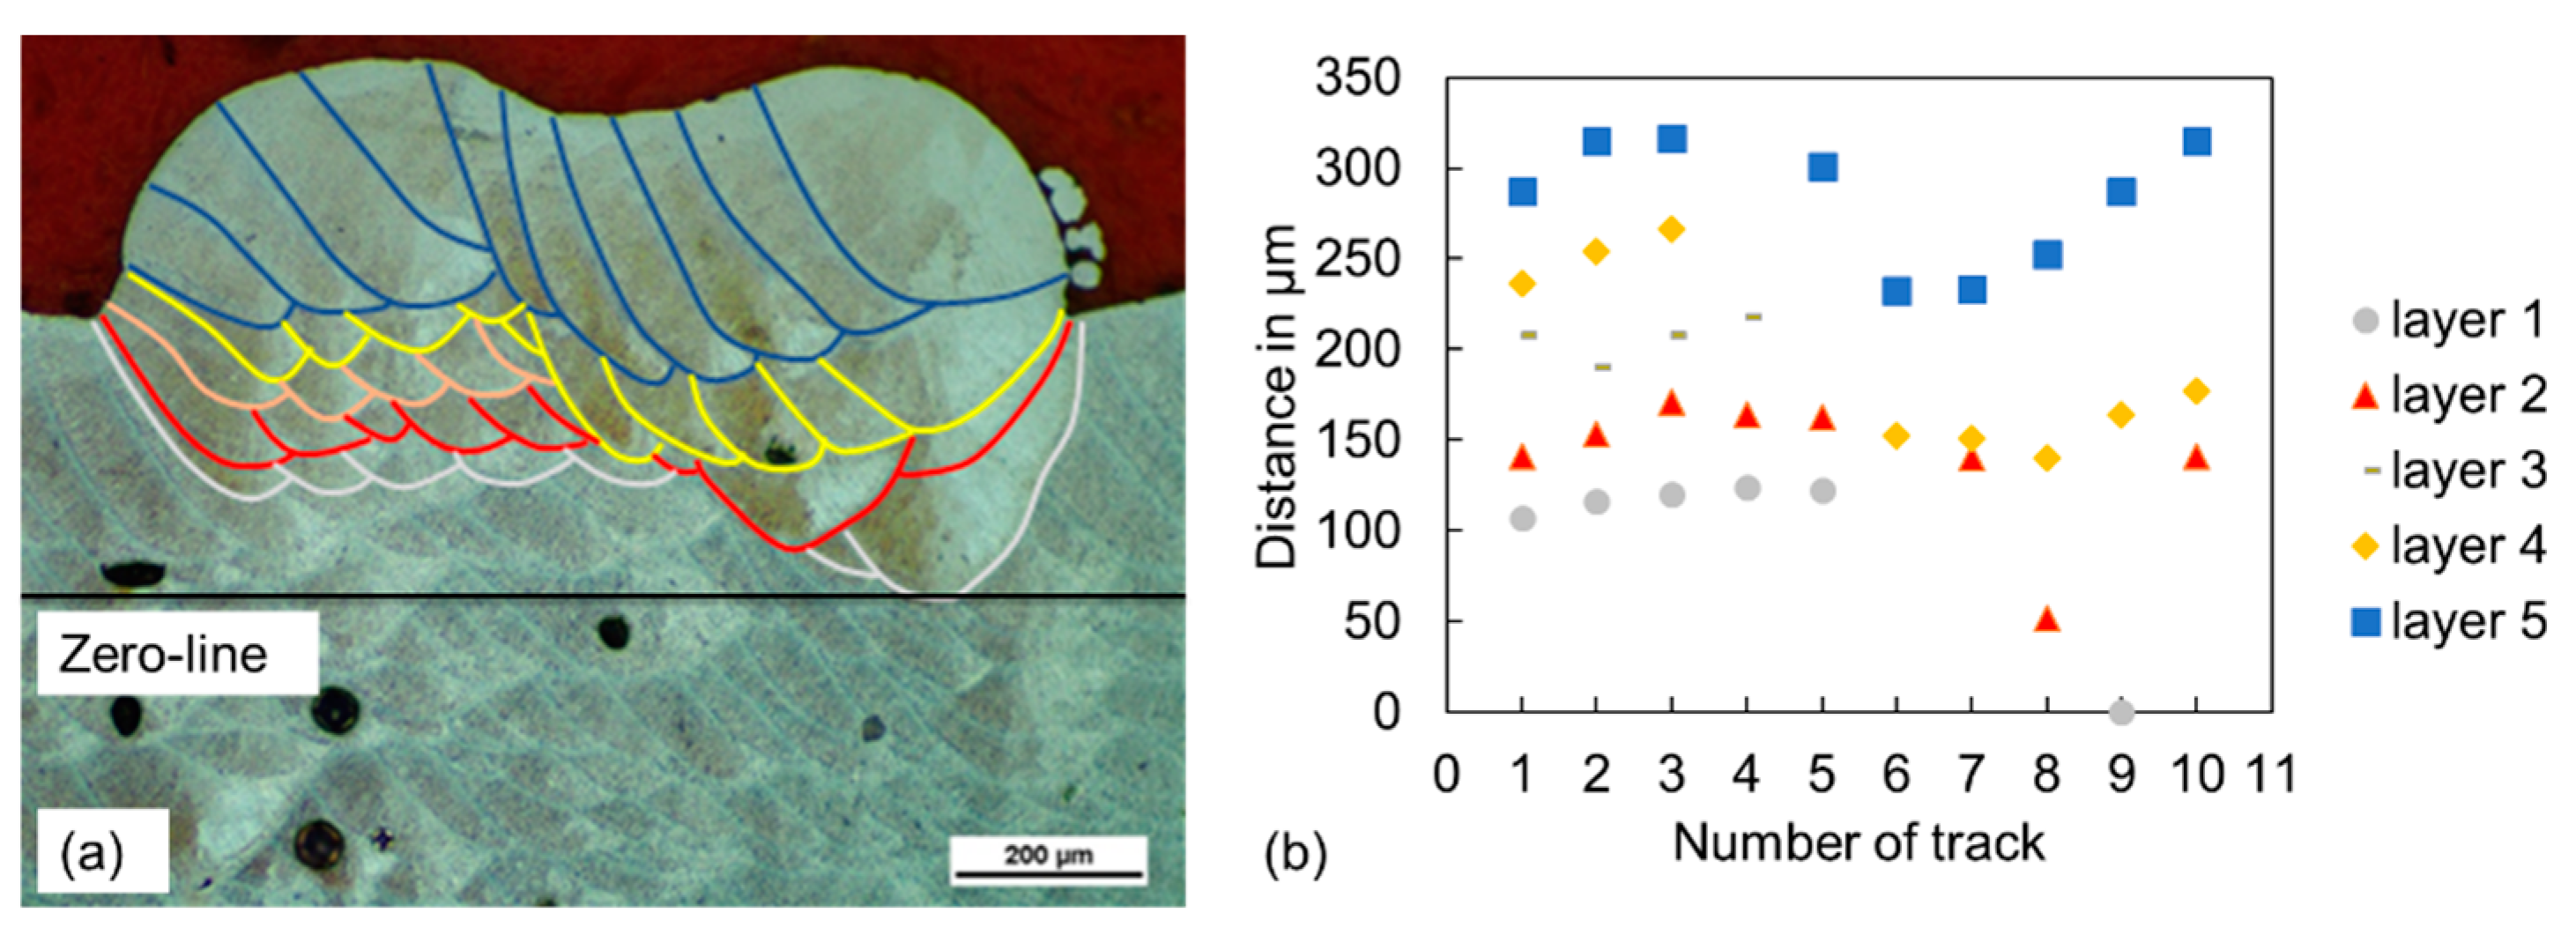
Figure 13.
(a) Cross section of a 10 × 5 structure (hatch distance h = 80 µm) and (b) derived distances of the lowest point of the single tracks measured from the zero line.
Figure 13.
(a) Cross section of a 10 × 5 structure (hatch distance h = 80 µm) and (b) derived distances of the lowest point of the single tracks measured from the zero line.

Figure 14.
Comparison of experimental and simulated structure heights (5 measurements within one layer) at hatch distances of (a) 80 µm, (b) 100 µm and (c) 120 µm.
Figure 14.
Comparison of experimental and simulated structure heights (5 measurements within one layer) at hatch distances of (a) 80 µm, (b) 100 µm and (c) 120 µm.

Figure 15.
Sketch of effects during higher-layer application in LPBF at (a) the first track, (b) the second track and (c) the third track.
Figure 15.
Sketch of effects during higher-layer application in LPBF at (a) the first track, (b) the second track and (c) the third track.


Table 1.
Chemical composition of the used AlSi10Mg powder material in wt %.
| Al | Cu | Mg | Si | Fe | Mn | Ni | Zn | Ti | |
|---|---|---|---|---|---|---|---|---|---|
| AlSi10Mg | Bal. | <0.01 | 0.36 | 9.7 | 0.12 | <0.01 | <0.01 | <0.01 | <0.01 |
Table 2.
Process parameters.
| Parameter | Value | Unit |
|---|---|---|
| Laser power | 200 | W |
| Laser beam spot diameter | 75 | µm |
| Exposure time | 224 | µs |
| Scanning speed | 268 | mm/s |
| Powder layer thickness | 40 | µm |
| Point distance | 60 | µm |
| Hatch distances h | (A) 80 (B) 100 (C) 120 | µm µm µm |
Table 3.
Comparison of simulated and experimentally derived track dimensions.
| Parameter | Simulation | Experiment |
|---|---|---|
| Width in µm | 360 | 343 (±37.02) |
| Depth in µm | 190 | 240 (±41.28) |
Publisher’s Note: MDPI stays neutral with regard to jurisdictional claims in published maps and institutional affiliations. |
© 2021 by the authors. Licensee MDPI, Basel, Switzerland. This article is an open access article distributed under the terms and conditions of the Creative Commons Attribution (CC BY) license (https://creativecommons.org/licenses/by/4.0/).
Share and Cite
MDPI and ACS Style
Volpp, J.; Belelli, F.; Casati, R. Fluctuations of Tracks and Layers during Aluminium Laser Powder-Bed Fusion. Appl. Sci. 2021, 11, 3132. https://doi.org/10.3390/app11073132
AMA Style
Volpp J, Belelli F, Casati R. Fluctuations of Tracks and Layers during Aluminium Laser Powder-Bed Fusion. Applied Sciences. 2021; 11(7):3132. https://doi.org/10.3390/app11073132
Chicago/Turabian StyleVolpp, Joerg, Filippo Belelli, and Riccardo Casati. 2021. "Fluctuations of Tracks and Layers during Aluminium Laser Powder-Bed Fusion" Applied Sciences 11, no. 7: 3132. https://doi.org/10.3390/app11073132
Note that from the first issue of 2016, this journal uses article numbers instead of page numbers. See further details here.