Article

Phenotypical and Functional Characteristics of Human Regulatory T Cells during Ex Vivo Maturation from CD4+ T Lymphocytes

by
Varvara G. Blinova
1,
Natalia S. Novachly
1,2,
Sofya N. Gippius
1,
Abdullah Hilal
1,
Yulia A. Gladilina
1,
Daria D. Eliseeva
3 and
Dmitry D. Zhdanov
1,2,*
1
Institute of Biomedical Chemistry, Pogodinskaya St. 10/8, 119121 Moscow, Russia
2
Department of Biochemistry, Peoples Friendship University of Russia (RUDN University), Miklukho-Maklaya St. 6, 117198 Moscow, Russia
3
Research Center of Neurology, Volokolamskoe Shosse, 80, 125367 Moscow, Russia
*
Author to whom correspondence should be addressed.
Appl. Sci. 2021, 11(13), 5776; https://doi.org/10.3390/app11135776
Submission received: 20 May 2021 / Revised: 14 June 2021 / Accepted: 17 June 2021 / Published: 22 June 2021
(This article belongs to the Special Issue Evolution of Modern Molecular Biology Applications)

Abstract

:
Regulatory T cells (Tregs) participate in the negative regulation of inflammatory reactions by suppressing effector cells. In a number of autoimmune disorders, the suppressive function and/or the number of Tregs is compromised. The lack of active functioning Tregs can be restored with adoptive transfer of expanded ex vivo autologous Tregs. In our study, we traced the differentiation and maturation of Tregs CD4+CD25+FoxP3+CD127low over 7 days of cultivation from initial CD4+ T cells under ex vivo conditions. The resulting ex vivo expanded cell population (eTregs) demonstrated the immune profile of Tregs with an increased capacity to suppress the proliferation of target effector cells. The expression of the FoxP3 gene was upregulated within the time of expansion and was associated with gradual demethylation in the promotor region of the T cell-specific demethylation region. Real-time RT-PCR analysis revealed changes in the expression profile of genes involved in cell cycle regulation. In addition to FOXP3, the cells displayed elevated mRNA levels of Ikaros zinc finger transcription factors and the main telomerase catalytic subunit hTERT. Alternative splicing of FoxP3, hTERT and IKZF family members was demonstrated to be involved in eTreg maturation. Our data indicate that expanded ex vivo eTregs develop a Treg-specific phenotype and functional suppressive activity. We suggest that eTregs are not just expanded but transformed cells with enhanced capacities of immune suppression. Our findings may influence further development of cell immunosuppressive therapy based on regulatory T cells.

1. Introduction

Regulatory T cells (Tregs) suppress the immune response by inhibiting the activity of effector T, B and NK cells. Tregs are of great importance for the maintenance of peripheral tolerance and the constraint of diverse autoimmune effects [1]. Circulating Tregs in blood (peripheral Tregs, pTregs) consist of two subpopulations: natural Tregs and induced Tregs. Natural Tregs develop in the thymus and spread to peripheral lymph nodes during the first 3–4 days of neonatal life [2,3,4]. Induced Tregs are stimulated in the periphery from CD4+CD25 T cells by a number of factors, such as infectious agents [5]. The growth and differentiation of Tregs is driven by the transcription factor Forkhead box protein 3 (FoxP3), which is important for their maturation and proliferation and for the maintenance of suppressive functions [3,6]. The remarkable phenotypical consistency of Tregs is associated with stable demethylation in the CpG-rich specific demethylated region (TSDR) within the FoxP3 promoter, which promotes proliferation and differentiation of Tregs [7,8]. IKAROS family zinc member transcription factors [9], along with reactivation of telomerase [10], also have well-documented roles in the development of immune cell populations, and the process of alternative splicing of their pre-mRNA has a significant impact on cellular biology [11,12,13].
A number of studies have examined the various suppressive functions of Tregs and how these mechanisms work to maintain immune tolerance. One of the most promising targets is the inhibitory molecule CTLA-4. CTLA-4 makes contact with the costimulatory molecules CD80 and CD86 and outcompetes the activating receptor CD28 for binding with these two ligands, thereby abrogating the activating signal in effector cells [14,15]. The CD4-related protein LAG-3 (CD223) has been implicated in suppressive functions of Tregs via direct interactions with Tregs and effector cells and via the modulation of antigen-presenting cells [16,17]. Another mechanism by which Tregs implement their suppressive activity is the induction of endonuclease G-mediated alternative splicing of the pre-mRNA of the telomerase main catalytic subunit that leads to target cell senescence [18,19]. The results of the present study provide evidence that human Treg cells suppress telomerase activity and induce target cell senescence in a contact-independent manner. We also show that telomerase activity inhibition in target cells is associated with EndoG-induced hTERT alternative splicing.
Tregs are defective in many autoimmune diseases, including rheumatoid arthritis, systemic lupus erythematous and type 1 diabetes [20,21,22,23,24,25]. Tregs are either dysfunctional or unstable, especially in the inflamed peripheral site where self-reactivity occurs. Restoration of Treg function could inhibit the onset and progression of autoimmune diseases [26,27,28,29,30]. Several approaches have been explored to obtain large amounts of ex vivo expanded Tregs (eTregs). The most widely applied method is T cell receptor (TCR) stimulation in the presence of a large amount of exogenous interleukin-2 (IL-2). Combined alloantigen and polyclonal stimulation with anti-CD3 and anti-CD28 antibodies has been applied to increase antigen specificity [31]. However, this protocol requires a complicated method of cell separation and long-term culture for 2–4 weeks. Repeated stimulation with anti-CD3 and anti-CD28 antibodies, together with a high dose of IL-2, causes polyclonal proliferation of CD4+CD25high T cells and their 40,000-fold expansion within 3–4 weeks [32]. CD28 costimulation appears to be necessary for the large-scale expansion of functional human Tregs [33]. Our short-term polyclonal stimulation protocol allows us to obtain high numbers of mature ex vivo eTregs CD4+CD25+FoxP3+CD127low over 7 days of cultivation from initial CD4+ T cells. The aim of this work was to examine the phenotypical and functional characteristics of eTregs during ex vivo maturation.

2. Materials and Methods

2.1. Treg Ex Vivo Expansion

This study was approved by the local Ethical Committee at the Institute of Biomedical Chemistry and was conducted according to the Declaration of Helsinki ethical standards. Written informed consent was obtained from all participants. Blood from healthy 18–45-year-old donors was collected in Vacuette K3EDTA tubes (Greiner Bio-One, Kremsmünster, Austria). To obtain autologous serum, blood was collected in Vacuette Z Serum Sep Clot Activator tubes (Greiner Bio-One, Kremsmünster, Austria) and centrifuged at 300× g for 15 min. The serum was heat-inactivated at 56 °C for 40 min. Fresh peripheral blood mononuclear cells (PBMCs) were isolated using Lympholite-H (Cedarlane, Burlington, ON, Canada) density gradient centrifugation. CD4+ T cells were purified from PBMCs using a CD4 MicroBeads Human Isolation Kit (Miltenyi Biotec, Bergisch Gladbach, Germany), according to the manufacturer’s instructions. Cells were cultivated according to a previously described protocol [34]. Briefly, CD4+ T cells were seeded at 5 × 10⁵ cells/mL and cultured in 25 cm2 flasks in RPMI 1640 cell medium supplemented with 10% autologous serum. Cells were stimulated with 2 mg/mL anti-CD28 (eBiosciences Inc., San Diego, CA, USA), 5 mg/mL anti-CD3 mAbs (MedBioSpectr, Moscow, Russia), TGF-beta 5 ng/mL and 100 U/mL rHu IL-2 (R&D Systems, Minneapolis, MN, USA). After 4 days of expansion, the cells were split at 5 × 10⁵ cells/mL in fresh medium supplemented with anti-CD3, anti-CD28, TGF-beta and 100 U/mL rHu IL-2 for another 5 days. Cell imaging was assessed using a Leica DMI 300B (Leica Microsystems, Wetzlar, Germany). Cell viability was measured by a dye exclusion test using Trypan Blue Solution according to the manufacturer’s protocol using Cell Viability Analyzer Vi-Cell XR (Beckman Coulter, Brea, CA, USA).

2.2. Flow Cytometry Analysis

MACSQuant Analyzer 10 (Miltenyi Biotec, Bergisch Gladbach, Germany) was used for flow cytometry analysis. To measure cell surface markers, Tregs or PBMCs were stained with CD4-PerCp, CD25-PE, CD127-Vio770, CD152-APC, CD39-FITC and CD223-APC antibodies (all from Miltenyi Biotec, Bergisch Gladbach, Germany), according to the manufacturer’s protocol. To measure FoxP3 and Helios protein content, PBMCs or eTregs were treated with CD4-FITC, CD25-APC (all from Miltenyi Biotec, Bergisch Gladbach, Germany), FoxP3-PE or Helios-PE antibodies (BD Pharmingen, San Diego, CA, USA) followed by flow cytometry analysis according to the manufacturer’s protocol. Mean fluorescence intensity (MFI) was used to determine intracellular protein expression of FoxP3 and Helios. To measure cell proliferation, isolated CD4+ cells were labeled with the vital dye CFSE (5-(and 6-)carboxyfluorescein diacetate succinimidyl ester, eBioscience Inc., San Diego, CA, USA) and analyzed by flow cytometry every 24 h during expansion. The proportion of proliferated cells was determined as the proportion of cells with reduced CFSE signal. Alternatively, a CD4+CD25+ regulatory T cell isolation kit, human (Miltenyi Biotec), was used to obtain pTregs as a comparison group for functional tests (FOXP3 promoter methylation, gene expression and in vitro immunosuppression assays).

2.3. RNA Isolation and Real-Time RT-PCR

A previously described protocol was followed [35]. Briefly, total RNA from cells was extracted using a PureLink RNA mini kit (Life Technologies, Carlsbad, CA, USA). Five micrograms of total RNA were reverse-transcribed using the MMLV RT Kit (Evrogen, Moscow, Russia) in a 25 mL reaction mixture, followed by real-time RT PCR using DTprime5 (DNA Technology, Protvino, Russia). The reaction mix was prepared using qPCR mix-HS SYBR (Evrogen, Moscow, Russia) according to manufacturer recommendations using the primers listed in Table S1 in the Supplementary Materials. Two-temperature annealing/extension cycles were used. Fluorescence was measured at the end of the annealing step. Melting curve analyses were performed at the end of the reaction (after the 35th cycle) between 60 °C and 95 °C to assess the quality of the final PCR products. The threshold cycles and C(t) values were calculated by fixing the basal fluorescence at 300 units. The standard curve of the reaction effectiveness was performed using serially diluted mixtures (1:40, 1:80, 1:160, 1:320 and 1:640) of all experimental cDNA samples in duplicate for each gene and 18S RNA separately. Calculation of the relative RNA concentration was performed using DTPrime5 software. Data were presented as ratios of mRNA/18S mRNA. Analysis of cell cycle-involved gene expression was conducted with the Human Cell Cycle RT2 Profiler PCR Array (SA Biosciences, Qiagen, Valencia, CA, USA), according to the manufacturer’s recommendations, using an ABI 7900HT real-time PCR machine (Applied Biosystems, Foster City, CA, USA). The data were analyzed using SABiosciences PCR Array Data Analysis Software (Applied Biosystems, Foster City, CA, USA).

2.4. Quantitative DNA Methylation Analysis of FoxP3 TSDR

Methylation-specific PCR was performed to identify the methylation status of the FoxP3 TSDR. At the 0-day time point, pTregs were isolated from peripheral blood using a Treg CD4+CD25+ Isolation Kit (Miltenyi Biotec, Bergisch Gladbach, Germany), according to the manufacturer’s instructions. These cells were used as control peripheral Tregs. An EZ DNA Methylation-Direct™ Kit (Zymo Research, Irvine, CA, USA) was used, according to the manufacturer’s instructions, for the bisulfite conversion of DNA. Cell pellets were digested with proteinase K prior to bisulfite conversion. During DNA bisulfite treatment, unmethylated cytosines were converted into uracils, while methylated cytosines remained unmodified. After bisulfite treatment, the FoxP3 gene was amplified by real-time PCR in a 25-µL reaction using DTPrime5. The reaction mix was prepared using qPCR mix-HS SYBR, according to the manufacturer’s recommendations. Methylation-specific and demethylation-specific amplification primers and probes were chosen, as suggested by Wieczorek [36], and sequenced after amplification.

2.5. Telomerase Activity Assay

Telomerase activity was determined using the Telomeric Repeat Amplification Protocol (TRAP), as described elsewhere [37,38]. Cells were lysed in 10 mM Tris-HCl, pH 7.5, 1 mM MgCl2, 1 mM EGTA, 0.1 mM PMSF, 5 mM 2-mercaptoethanol, 0.5% CHAPS and 10% glycerol (all from Sigma-Aldrich), and centrifuged for 30 min at 12,000× g. The supernatants were stored at −80 °C. Elongation of the oligonucleotide substrate TS-primer (Telomerase Substrate primer) (5′-AATCCGTCGAGCAGAGTT-3′) and subsequent amplification were conducted in a 30 μL reaction mixture containing 67 mM Tris-HCl, pH 8.8, 16.6 mM (NH4)2SO4, 0.01% Tween-20, 1.5 mM MgCl2, 1 mM EGTA (all from Sigma-Aldrich), 0.25 mM dNTPs (Syntol, Moscow, Russia) and 2 μL of cell lysate (equivalent to 2000 cells). Elongation was performed for 30 min at 37 °C, followed by 10 min at 96 °C for telomerase inactivation. Then, 0.1 μL of CX primer (copy extended primer) (5′-CCCTTACCCTTACCCTTACCCTAA-3′) and 2.5 Units of Taq polymerase were added to the elongation mixture, followed by PCR using the following reaction conditions: (1) 94 °C for 5 min; (2) 30 cycles of 94 °C for 30 s, 50 °C for 30 s and 72 °C for 40 s; and (3) 72 °C for 5 min. PCR product visualization was performed by 12% nondenaturing PAAG electrophoresis with TBE buffer. Ten microliters of samples were added to each well from a gel comb. The gels were stained with SYBR Green I (Invitrogen, Grand Island, NY, USA), photographed under UV light in a ChemiDoc™ XRS imaging system (Bio-Rad, Hercules, CA, USA) and analyzed with GelAnalyzer 19.1 http://www.gelanalyzer.com (accessed on 20 December 2020).

2.6. Suppression Assay

All suppression assays were performed in 96-well round-bottom plates (Sigma-Aldrich, St. Louis, MO, USA) in a final volume of 200 µL/well. Responder CD4+CD25 T cells (Tresp) were obtained from the negative fraction during CD4+CD25+ cell purification and then labeled with CFSE. Labeled cells were cultured at 5 × 10⁴ cells/well with allogeneic mitomycin C (Kyowa Hakko Kirin, Tokyo, Japan)-treated PBMCs, with or without eTregs, in the presence of 5 µg/mL soluble anti-CD3 antibodies for 5 days at 37 °C and 5% CO2 in triplicate. For detection of suppression, CFSE-labeled Tresp cells were analyzed by a MACS Quant analyzer 10, and the number of proliferating cells was determined by the number of cells with a reduced CFSE signal. The proliferation index (PI) was estimated by the following equation: PI = [Tregs: Tresp cocultured/Tresp alone].

2.7. Statistics

Statistica 9.0 (StatSoft, Tulsa, OK, USA) software was used for statistical analysis. Student’s t-test was performed to assess differences between the individual groups against the control. Differences described as p ≤ 0.05 were considered significant. The results are presented as the mean ± standard error of the mean (SEM). Bonferroni modification of Student’s t-test was performed where appropriate.

3. Results

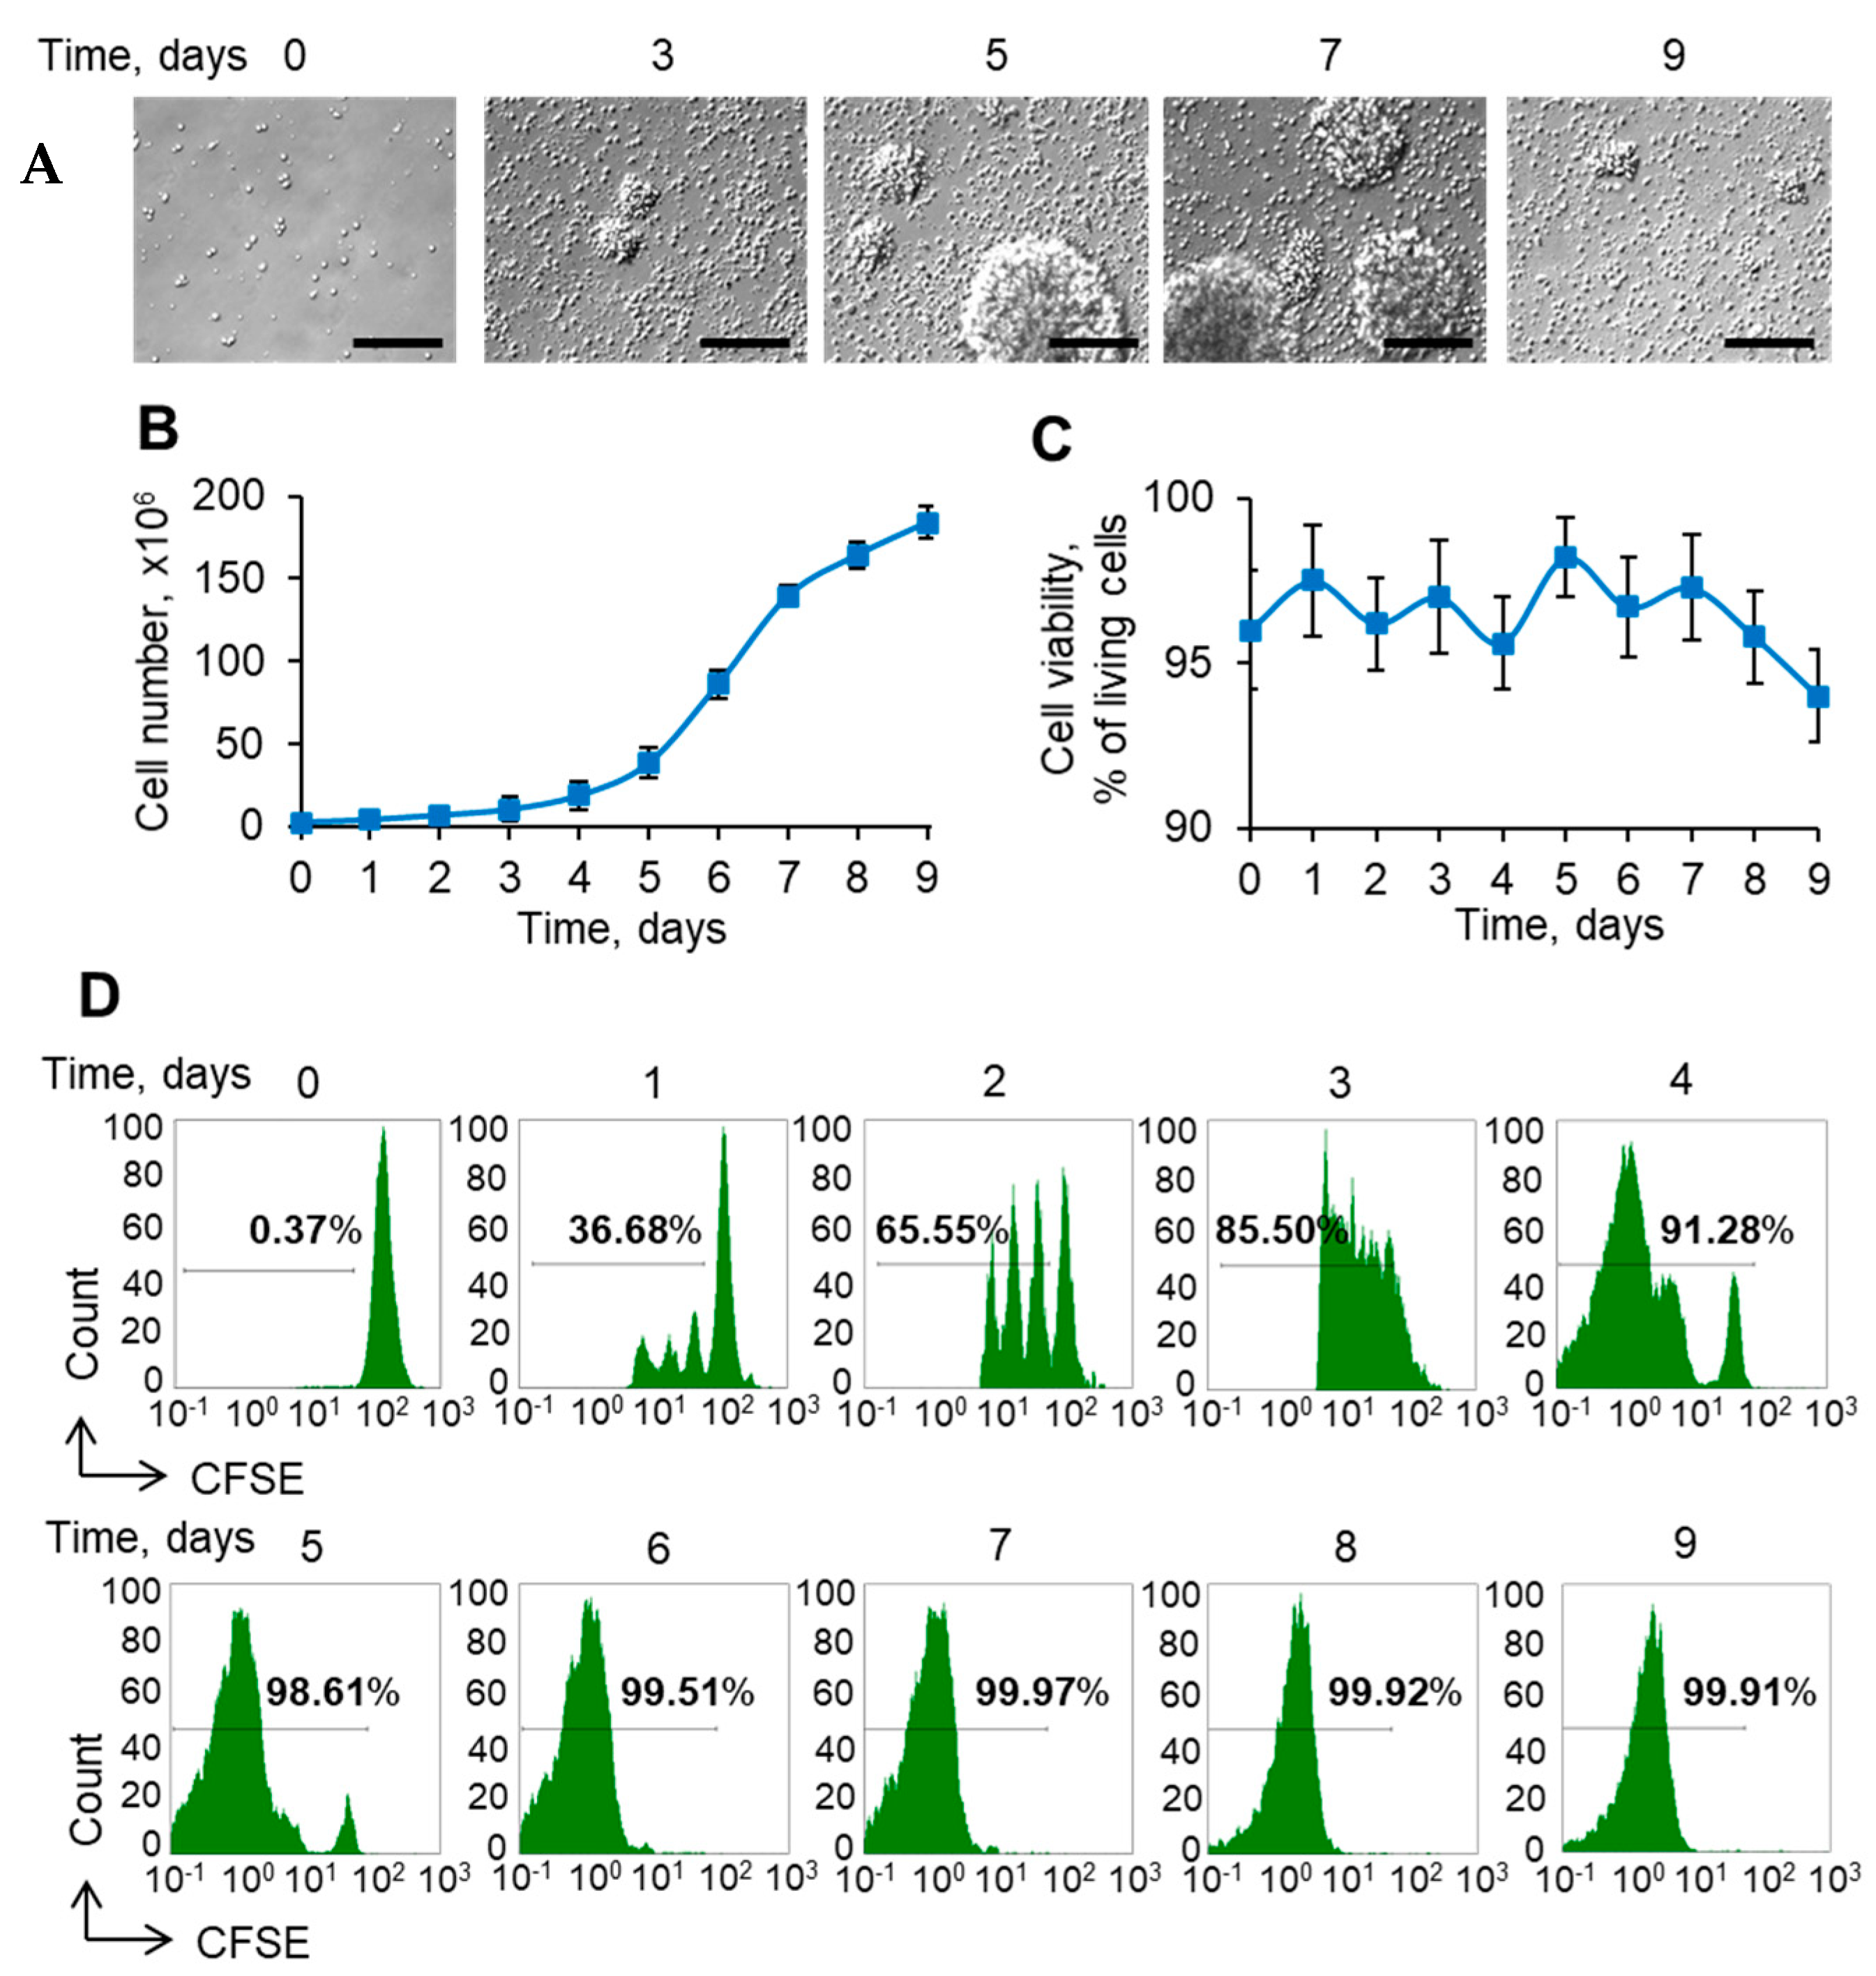
3.1. Expansion and Transformation Ex Vivo Is Associated with Increasing Amounts of Tregs

We studied the proliferative activity of the initial CD4+ T cells during cultivation in the presence of stimulating additives. Figure 1A shows that cells proliferate as aggregates or clusters at days 3 to 7. Cell numbers increased throughout the entire cultivation period; however, the most intensive growth was observed between days 5 and 7 (Figure 1B). After starting the culture with 5 × 10⁶ CD4+ T cells, the yield was 135–150 × 106 cells in 7 days. Cell viability measured by Trypan Blue was not lower than 95% during eight days of cultivation, and was slightly decreased at day 9 (Figure 1C).
In order to understand whether the entire starting CD4+ T cell population or only a part of the population was proliferating, we labeled cells with vital dye. The results showed that only 36.53 ± 2.12% of the initial CD4+ cell population underwent cycles of cell division after the first day of cultivation (Figure 1D). After five days of cultivation, almost all the precursor cells entered cell cycle division. Restimulation was performed after 4 days and supported active cell proliferation until day 7. Without further additional feeding and stimulation, cell proliferation decreased at day 9.

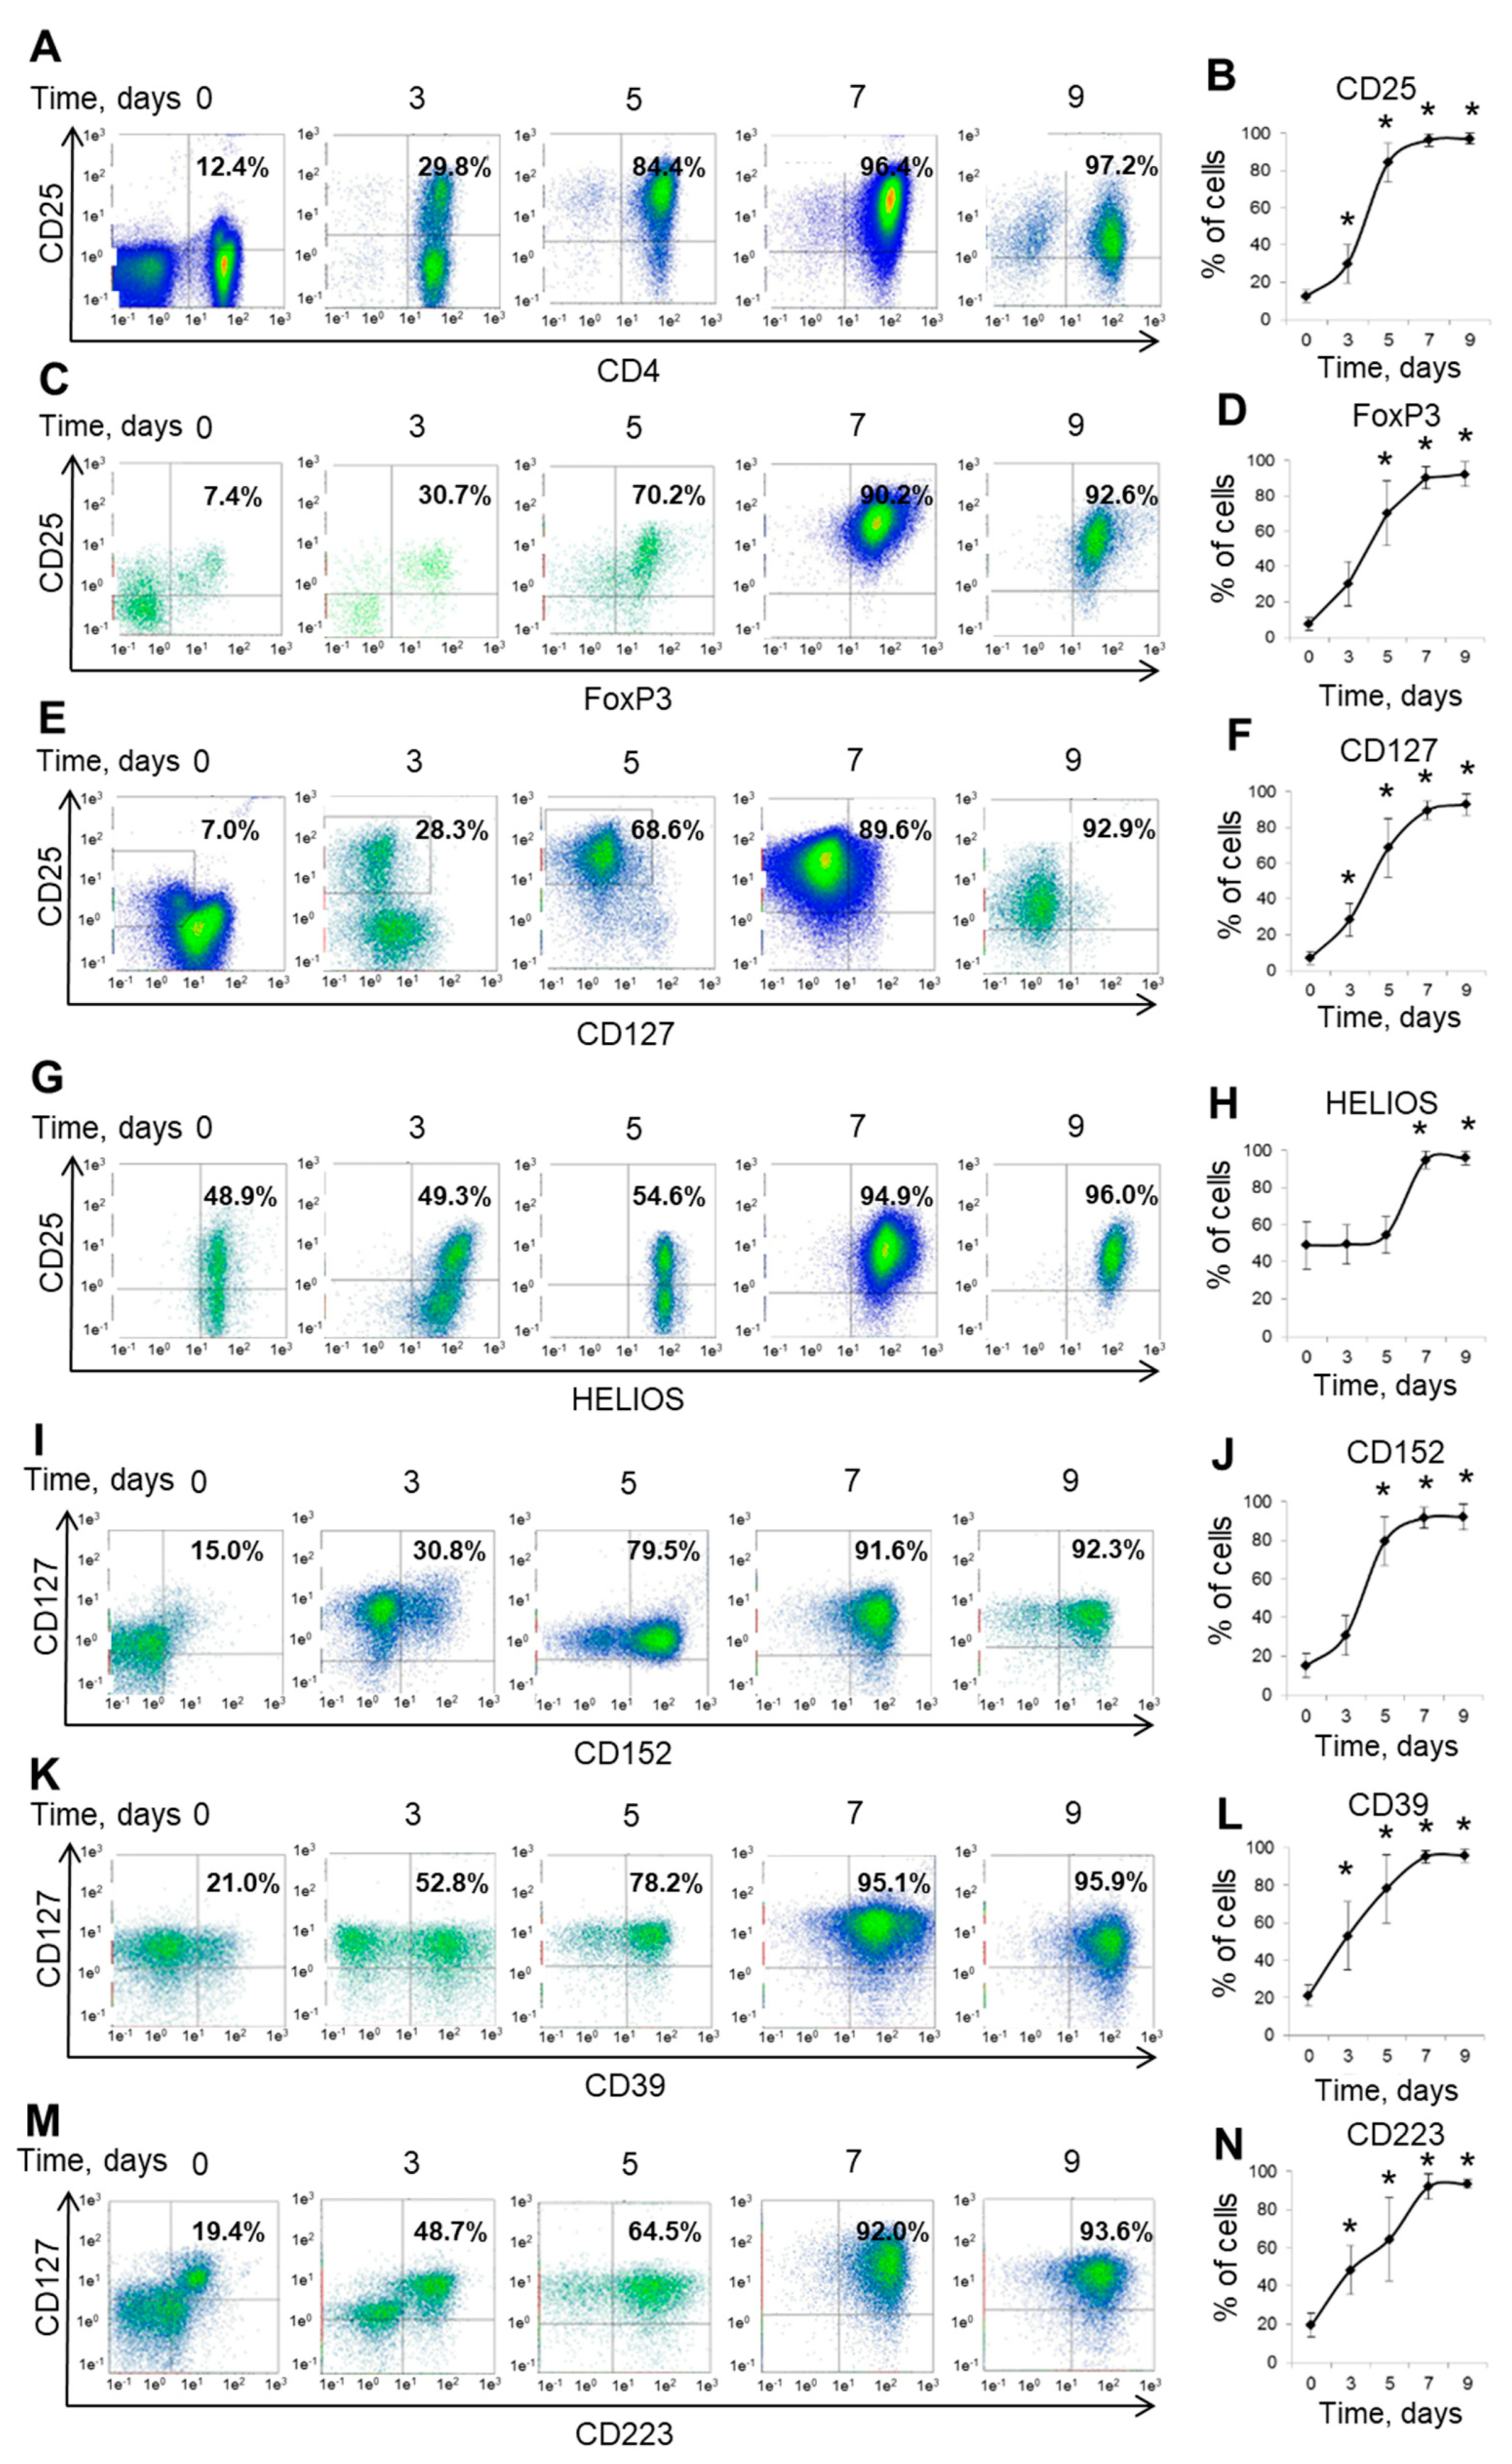
3.2. Expanded Ex Vivo Tregs Demonstrate the Mature Phenotype at Day Seven of Cultivation

To investigate the expression profile of functional molecules, proliferating cells were labeled with relevant antibodies and analyzed by flow cytometry. There was a significant increase in cells expressing the Treg markers CD4+CD25+FoxP3+CD127low (Figure 2A–F). Over the period of cultivation, the proportion of CD4+CD25+FoxP3+CD127low Tregs gradually increased, while the proportion of conventional CD4+CD25 T cells decreased. After 7 days of cultivation, 88.7–92.8% of cells had the common phenotype CD4+CD25+FoxP3+CD127low, which denotes homogeneity of expanded cells. Further cultivation did not increase the number of cells with a Treg phenotype. The proportion of cells expressing the transcription factor IKZF2 HELIOS, which is necessary for Treg maturation [39], also increased over the entire time of cell cultivation (Figure 2G,H). The expression of Helios remained stable during the first five days of cultivation and increased approximately twofold at day seven; 95.5–96.3% of mature eTregs expressed Helios. The proportion of cells expressing Treg functional molecules that participate in suppressive activity, cytotoxic molecules CD152 (cytotoxic T-lymphocyte associated protein 4, CTLA4) [40], CD39 (ectonucleoside triphosphate diphosphohydrolase 1, ENTPD1) [41] and CD223 (lymphocyte activating 3, LAG3) [42] increased in mature cells and reached maximal ratios at day 7 (Figure 2I,N), which also denotes the homogeneity of expanded cells. While the expression of CD152 increased on the fifth day and did not change during further cultivation, the expression of CD39 and CD223 increased gradually during seven days of Treg cultivation.

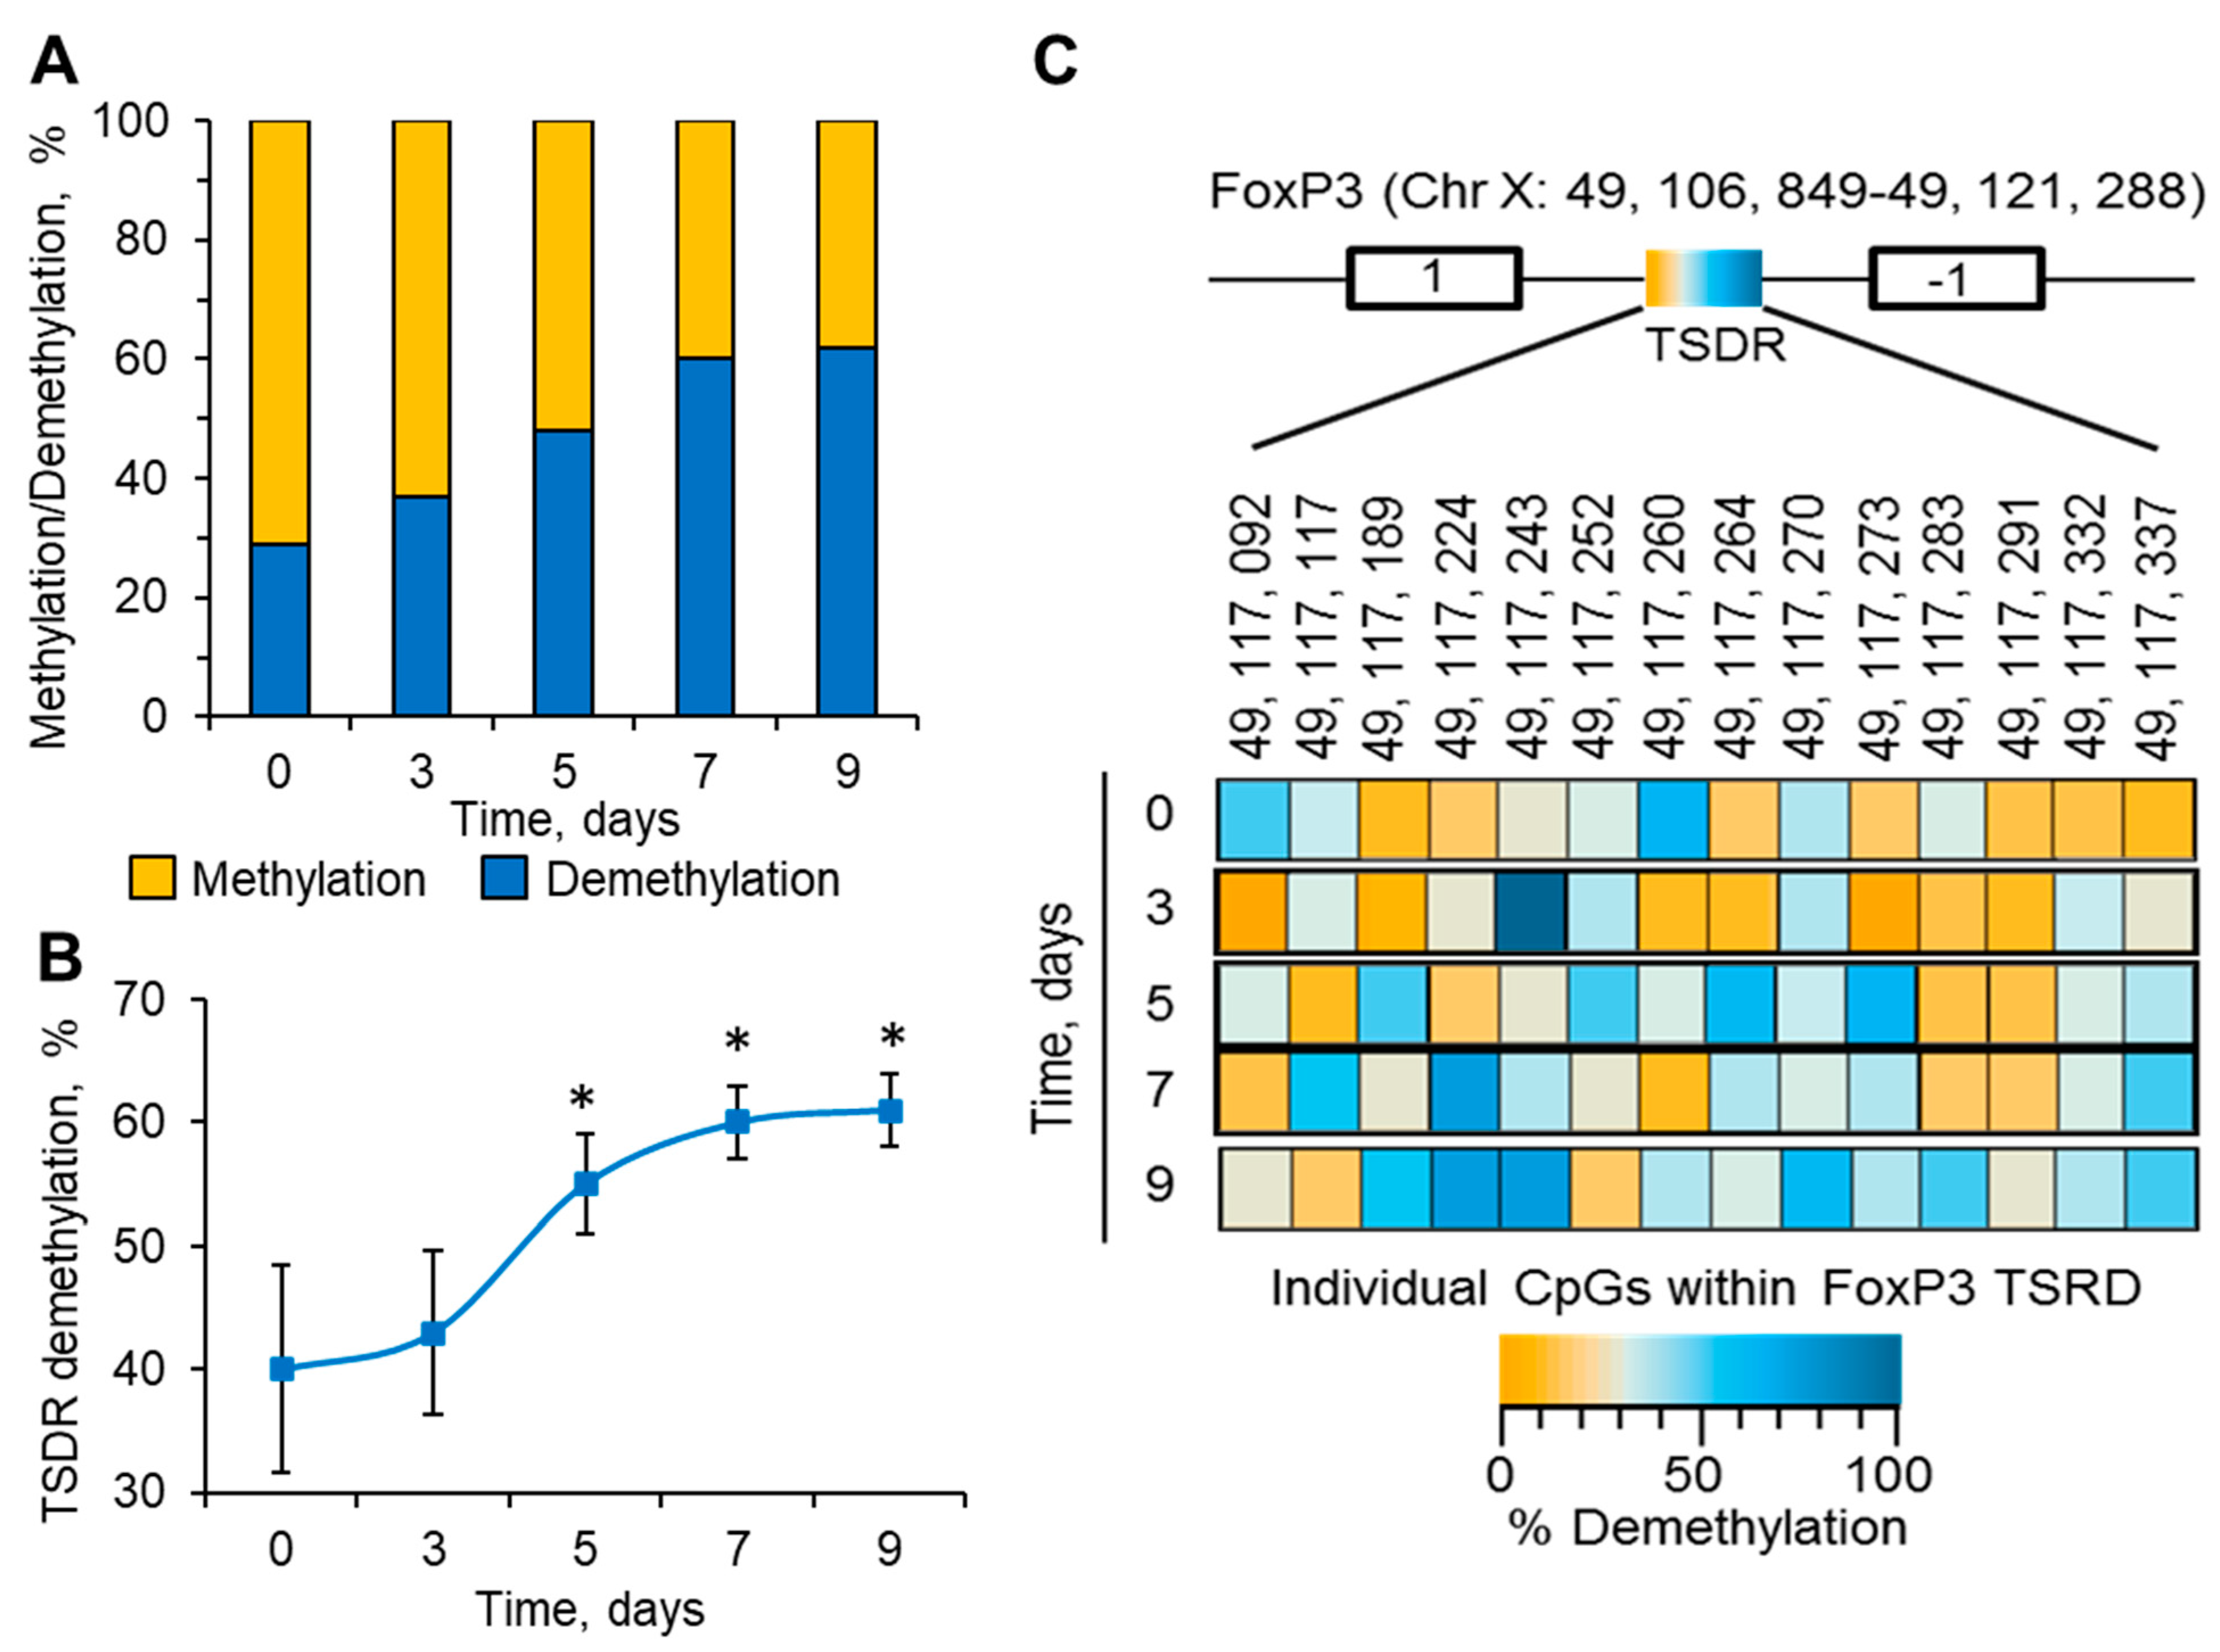
3.3. Stability of FoxP3 Expression Depends on the Demethylation Levels of TSDR in Its Promoter

Demethylation events in the FoxP3 TSDR promoter region are responsible for the stability of FoxP3 expression in mature cells. We studied changes in TSDR methylation/demethylation levels during the time of Treg expansion using methyl sensitive PCR. We found a gradual increase in demethylation during seven days of ex vivo expansion (Figure 3A,B). The demethylation level was 41.7 ± 8.3% (28.5; 49.5) in pTregs while, in seven-day expanded eTregs, it increased to 59.5 ± 5.4% (50.7; 65.6). There was no difference in the TSDR demethylation levels between cells at days seven and nine of cultivation. We analyzed the methylation of each CpG site at TSDR. Cells differed in the percentage of demethylation but we found no consistency in demethylation level differences at single positions (Figure 3C). These results demonstrate that mature Tregs have a higher degree of demethylation in the TSDR than initial cells, which is associated with increased expression of FoxP3.

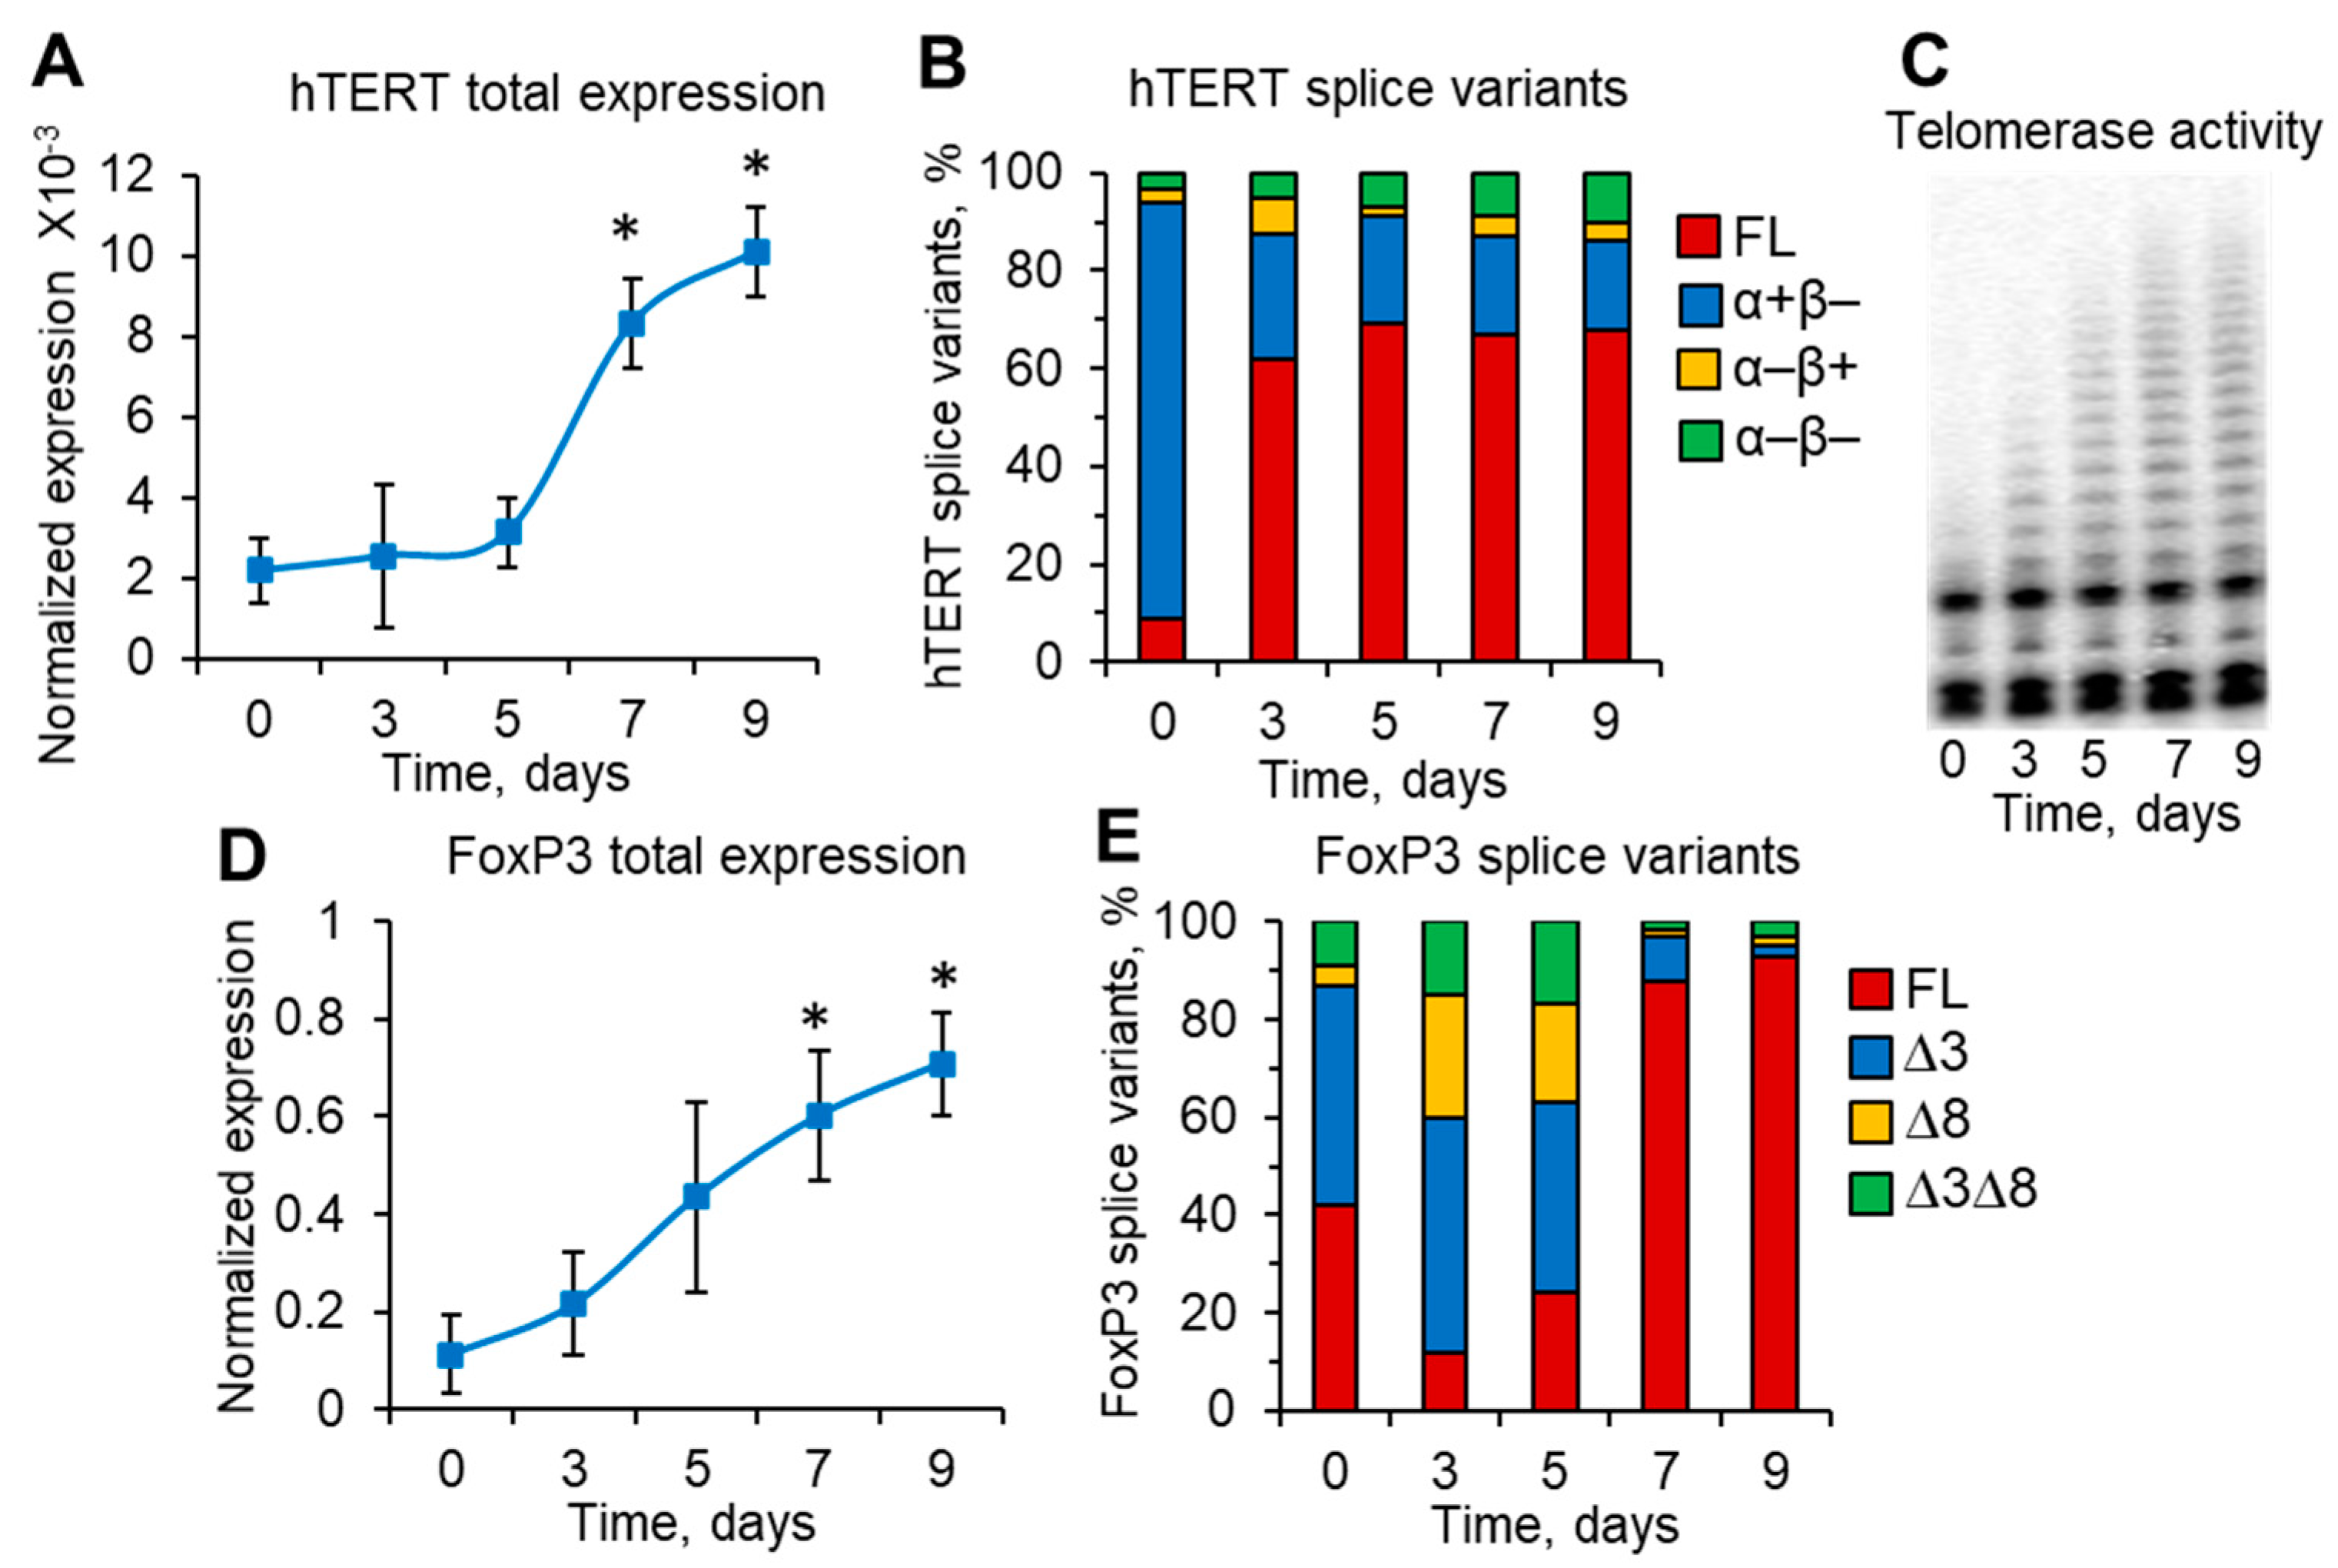
3.4. Induction of Telomerase and FoxP3 during Treg Expansion Is Associated with Changes in Their Splice Variants

High proliferation of T cells is supported by active telomerase, which is activated upon immune stimulation [43,44]. Telomerase activity in cells depends on the expression level of the telomerase main catalytic subunit hTERT [19,45], as well as on the predominance of the full-length α+β+ active splice variant [46,47]. We investigated the rate of hTERT expression in proliferating cells. In the first five days, hTERT expression was not different from that of the initial CD4+ cells; however, after day seven, a significant increase in hTERT expression was observed (Figure 4A). In freshly isolated initial CD4+ T cells (0-day time-point), the α+β– truncated splice variant comprised approximately 80% of total hTERT, while the ratio of the active full-length variant was only 10% (Figure 4B). Three days after cell stimulation with IL-2, TGF-beta and antibodies, the rate of the full-length variant increased up to 60%. No significant changes in the expression of the minor splice variants α–β+ and α–β– were observed within the entire time of cultivation. The increase in the active full-length variant was associated with an increase in telomerase activity, which was measured using a TRAP assay (Figure 4C). After day five of cultivation, no significant changes in the rates of hTERT splice variants were observed. However, telomerase activity gradually increased until day seven. This observation leads to the conclusion that, in the first five days of maturation, telomerase activity is induced by the shift in hTERT splicing patterns toward the full-length active variant while, after day five, the increase in total hTERT expression has a major impact on enhancing telomerase activity.
FoxP3 is considered to be a master regulator protein for Tregs that determines their differentiation and proliferation and their supports suppressive activity [48]. Splice variants of FoxP3 are involved in different biological processes [12]. We observed the gradual induction of total FoxP3 expression throughout eTreg ex vivo expansion (Figure 4D). However, a significant increase was achieved only on days seven and nine. A gradual increase in FoxP3 expression corresponded to an increase in the rate of TSDR demethylation (Figure 3) and the ratio of FoxP3-expressing cells measured by flow cytometry (Figure 2C,D). The proportions of FoxP3 splice variants demonstrated rather complex expression profiles (Figure 4E). The full-length variant was repressed 3–5 days after initial cell stimulation and demonstrated a significant increase at days 7 and 9. The splice variant with the deletion of exon 3 (∆3) remained unchanged in the first five days after the beginning of expansion and was detected at minor levels in mature eTregs at days 7 and 9. The expression of the splice variant with the deletion of exon 8 (∆8) demonstrated a significant increase of up to 21.6% in total FoxP3 mRNA at days 3 and 5 while, in mature eTregs, it was almost undetectable. Similar expression was observed for the variant with deletions of both exons 3 and 8 (∆3∆8). This splice variant demonstrated a small increase in expression at days 3 and 5 of up to 12.4% in total FoxP3 mRNA, and it was almost undetectable in mature eTregs.

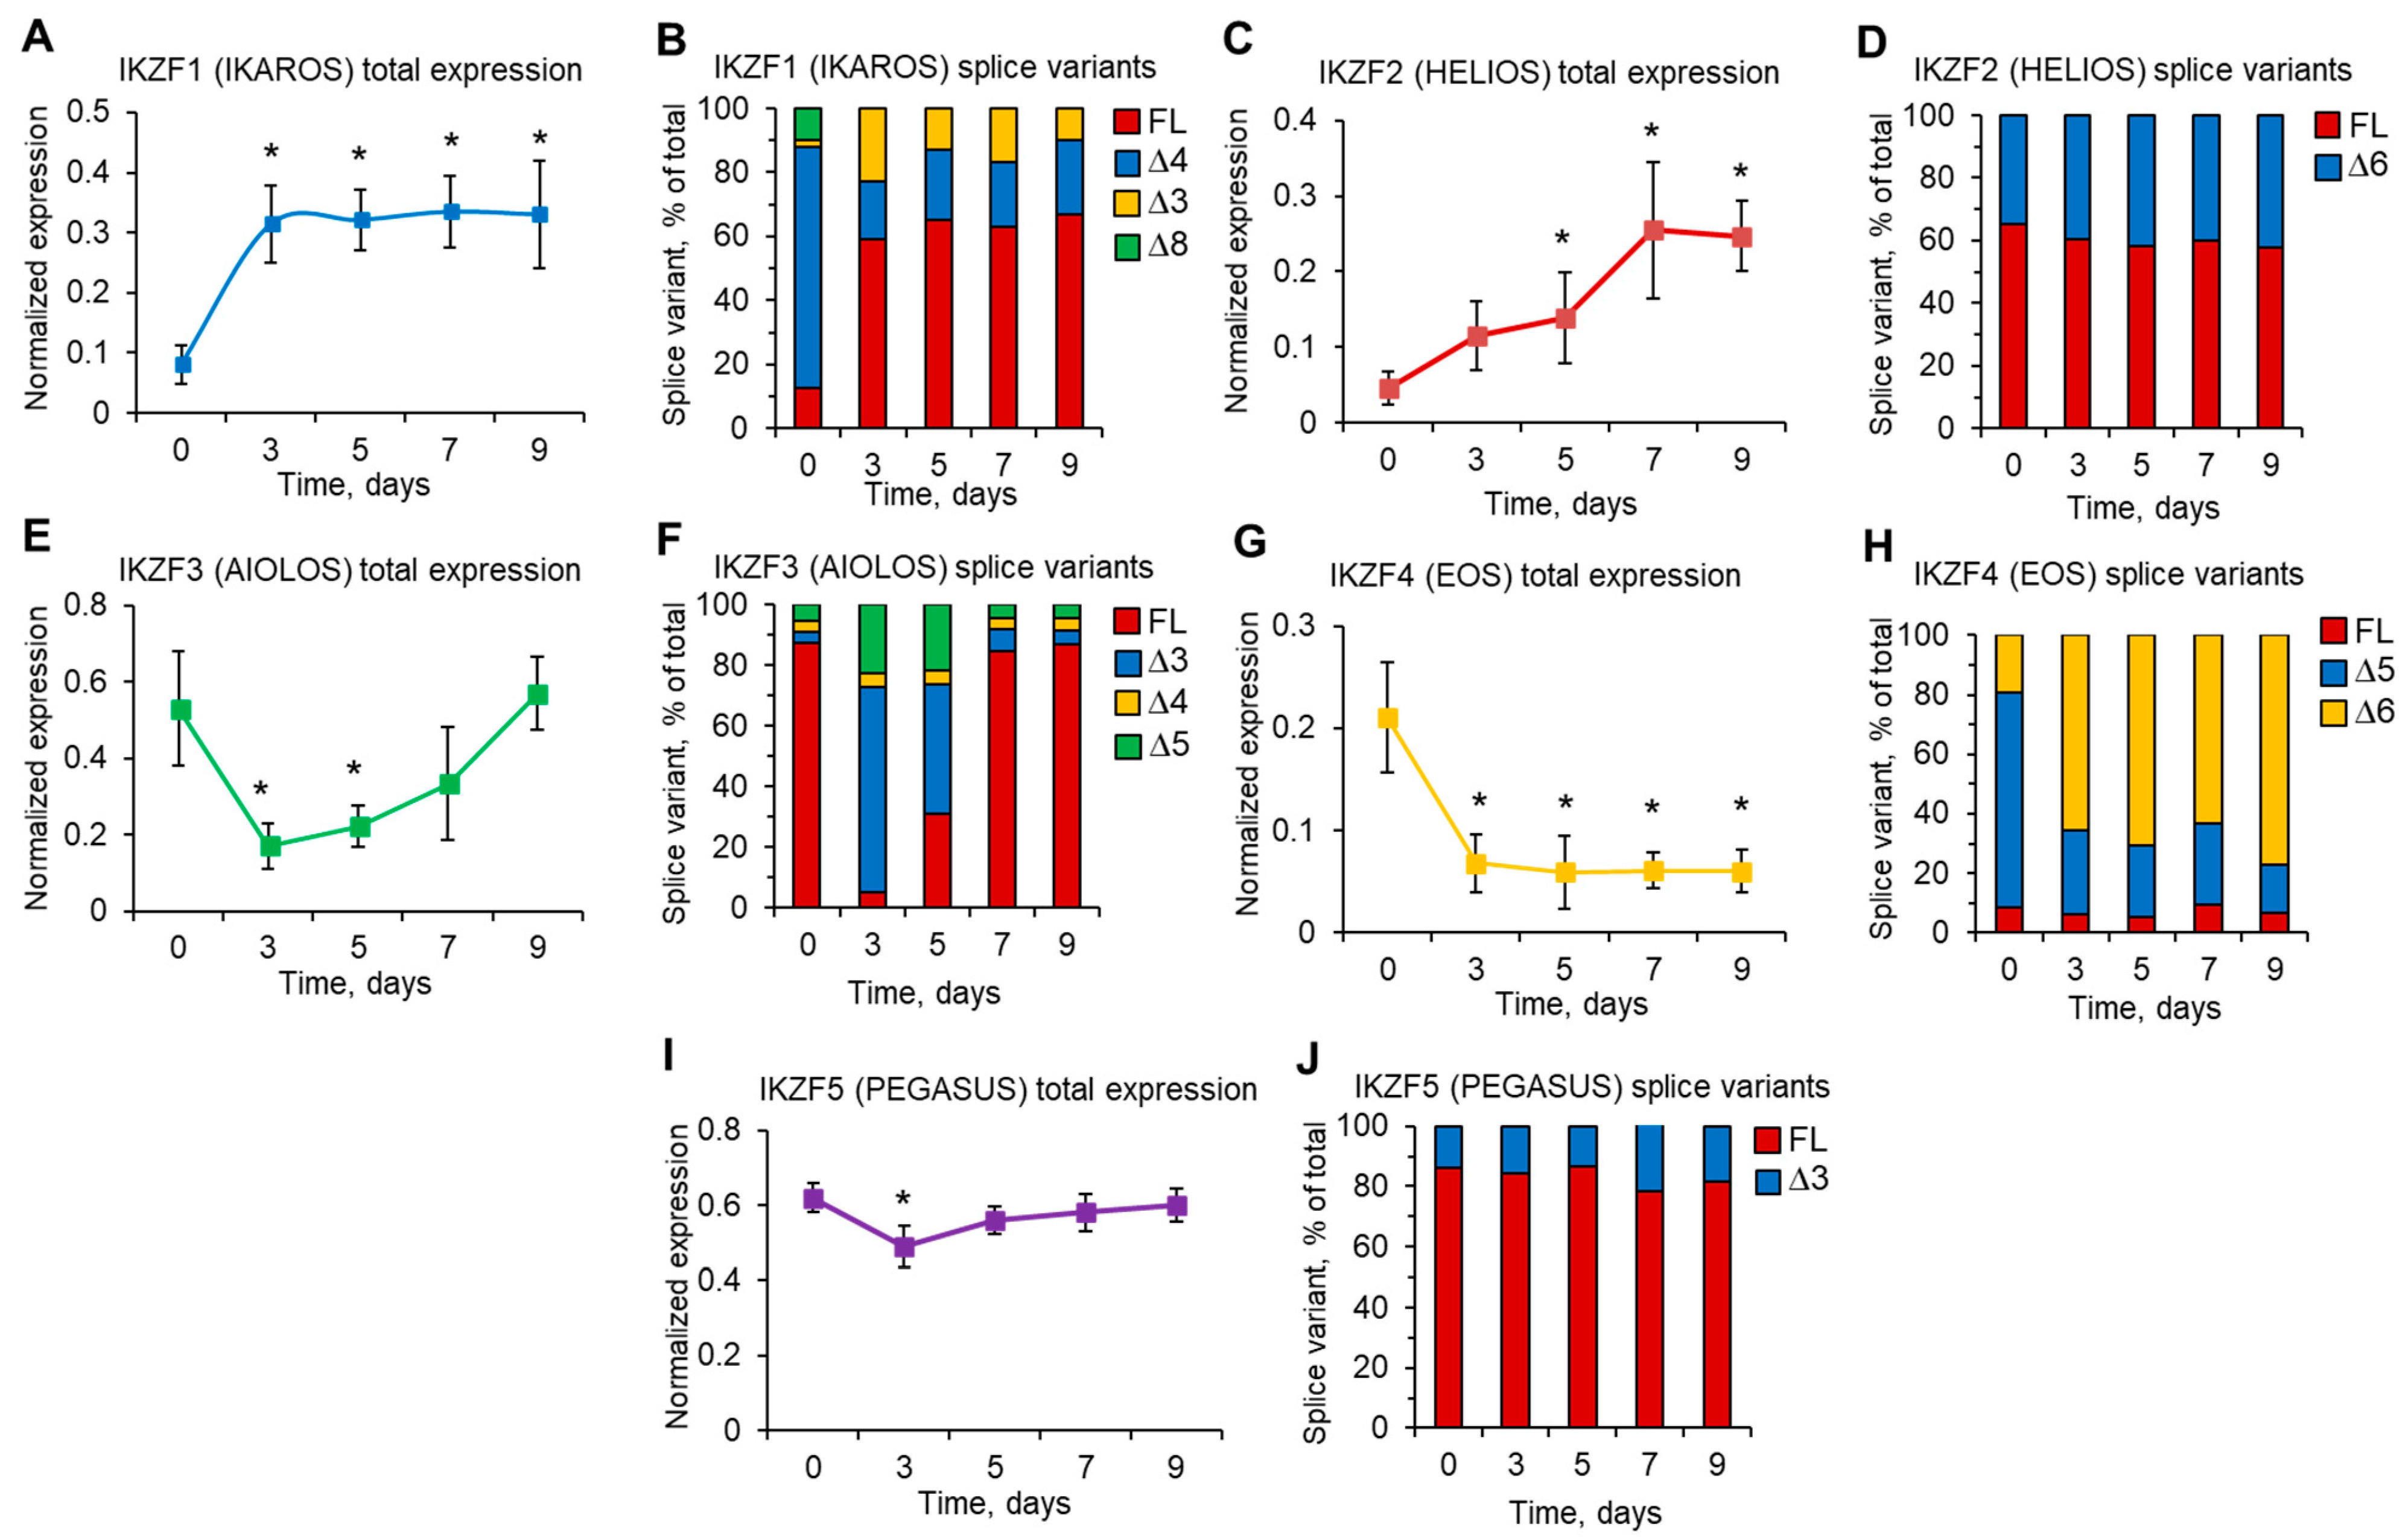
3.5. Ex Vivo eTreg Maturation Is Associated with Changes in the Expression of Ikaros Family Zinc Finger Gene Members and in the Levels of Their Splice Variants

Ikaros family zinc finger members (IKZF1–IKZF5) act as transcription factors and can cooperate with FoxP3 to support Treg development [49]. Multiple splice variants have been described for these five genes [50,51]; however, their involvement in Treg biology has not been investigated. Using real-time RT-PCR, we examined the expression levels of their splice variants during the entire time of eTreg maturation ex vivo. The expression of total IKZF1 (IKAROS) mRNA increased 3 days after initial cell stimulation and remained at a high level up to day 9 of expansion (Figure 5A). The full-length splice variant in initial CD4+ T cells was expressed at a level no more than 17.3% of total IKZF1 mRNA; however, its expression increased after cell stimulation by up to 64.7% in mature eTregs (Figure 5B). This result demonstrated that the increase in the full-length variant contributed the most to the increase in total mRNA. The opposite effect was observed for the IKZF1 splice variant with a deletion of exon 4 (∆4). In initial cells, it comprised the majority (up to 68.2%) of total mRNA and was significantly reduced in mature eTregs (19.8%). The variant with a deleted exon 3 (∆3) was expressed at a minimal rate (2.1%) in initial cells but increased up to 9.2% in mature cells. The splice variant with a deletion of exon 8 (∆8) comprised up to 10.0% of CD4+ T cells and unexpectedly failed to be detected in expanding cells after initial stimulation.
The expression of total IKZF2 (HELIOS) mRNA gradually increased over the entire time of eTreg expansion (Figure 5C), which corresponded to the increasing proportion of Helios-positive cells at days 7 and 9, as detected by flow cytometry (Figure 2G,H). We did not observe any significant changes in the two splice variants in cells upon stimulation (Figure 5D). The full-length variant and variant ∆6 comprised approximately 60% and 40% of the total throughout the time course of expansion, respectively.
The expression of total IKZF3 (AIOLOS) mRNA decreased in the first 5 days after initial stimulation; however, in mature eTregs, its expression increased and did not differ from that of starting CD4+ T cells (Figure 5E). In initial cells, the full-length splice variant comprised the majority (up to 88.9%) of total IKZF3 mRNA (Figure 5F). All the remaining splice variants were expressed at a rate no more than 11.1%. A dramatic decrease (up to 3.8%) in the full-length variant was observed after stimulation of the initial cells at day 3, which was gradually restored to initial levels upon eTreg maturation. The opposite effect was observed for variants ∆3 and ∆5. Their rates increased significantly 3 days after stimulation and then decreased to their initial levels in mature eTregs. The proportion of the variant with deleted exon 5 (∆5) remained unchanged (approximately 3.5%) throughout the cell cultivation period. These results demonstrate that the changes in the expression of the full-length variant contribute the most to the changes in total IKZF3 mRNA levels.
The expression of total IKZF4 (EOS) mRNA was reduced more than twofold in stimulated cells and remained at a low level in mature eTregs (Figure 5G). The full-length splice variant did not demonstrate any significant changes during cell expansion and remained the minor variant, at no more than 10% of total IKZF mRNA (Figure 5H). A significant decrease was observed in the proportion of splice variant ∆5. In the initial CD4+ T cell population, it comprised 69.6% while, in mature eTregs, its ratio was 19.3–24.7%. The opposite effect was demonstrated by splice variant ∆6, whose proportion increased from 19.5% in initial cells to 43.2–50.3% in mature eTregs.
The expression level of total IKZF5 (PEGASUS) mRNA did not change in cells upon maturation (Figure 5I). A significant but very slight decrease was observed on day 3 but not on other days. The proportion of full-length splice variants comprised the majority (87.5–79.6%) of total mRNA and did not change during eTreg maturation (Figure 5J). The proportion of splice variants with deletion of exon 3 (∆3) remained at 12.5–19.3%, and did not change upon cell cultivation.
The results of this experiment indicate the involvement of IKZ family member splice variants in the process of Treg maturation from initial CD4+ T lymphocytes.

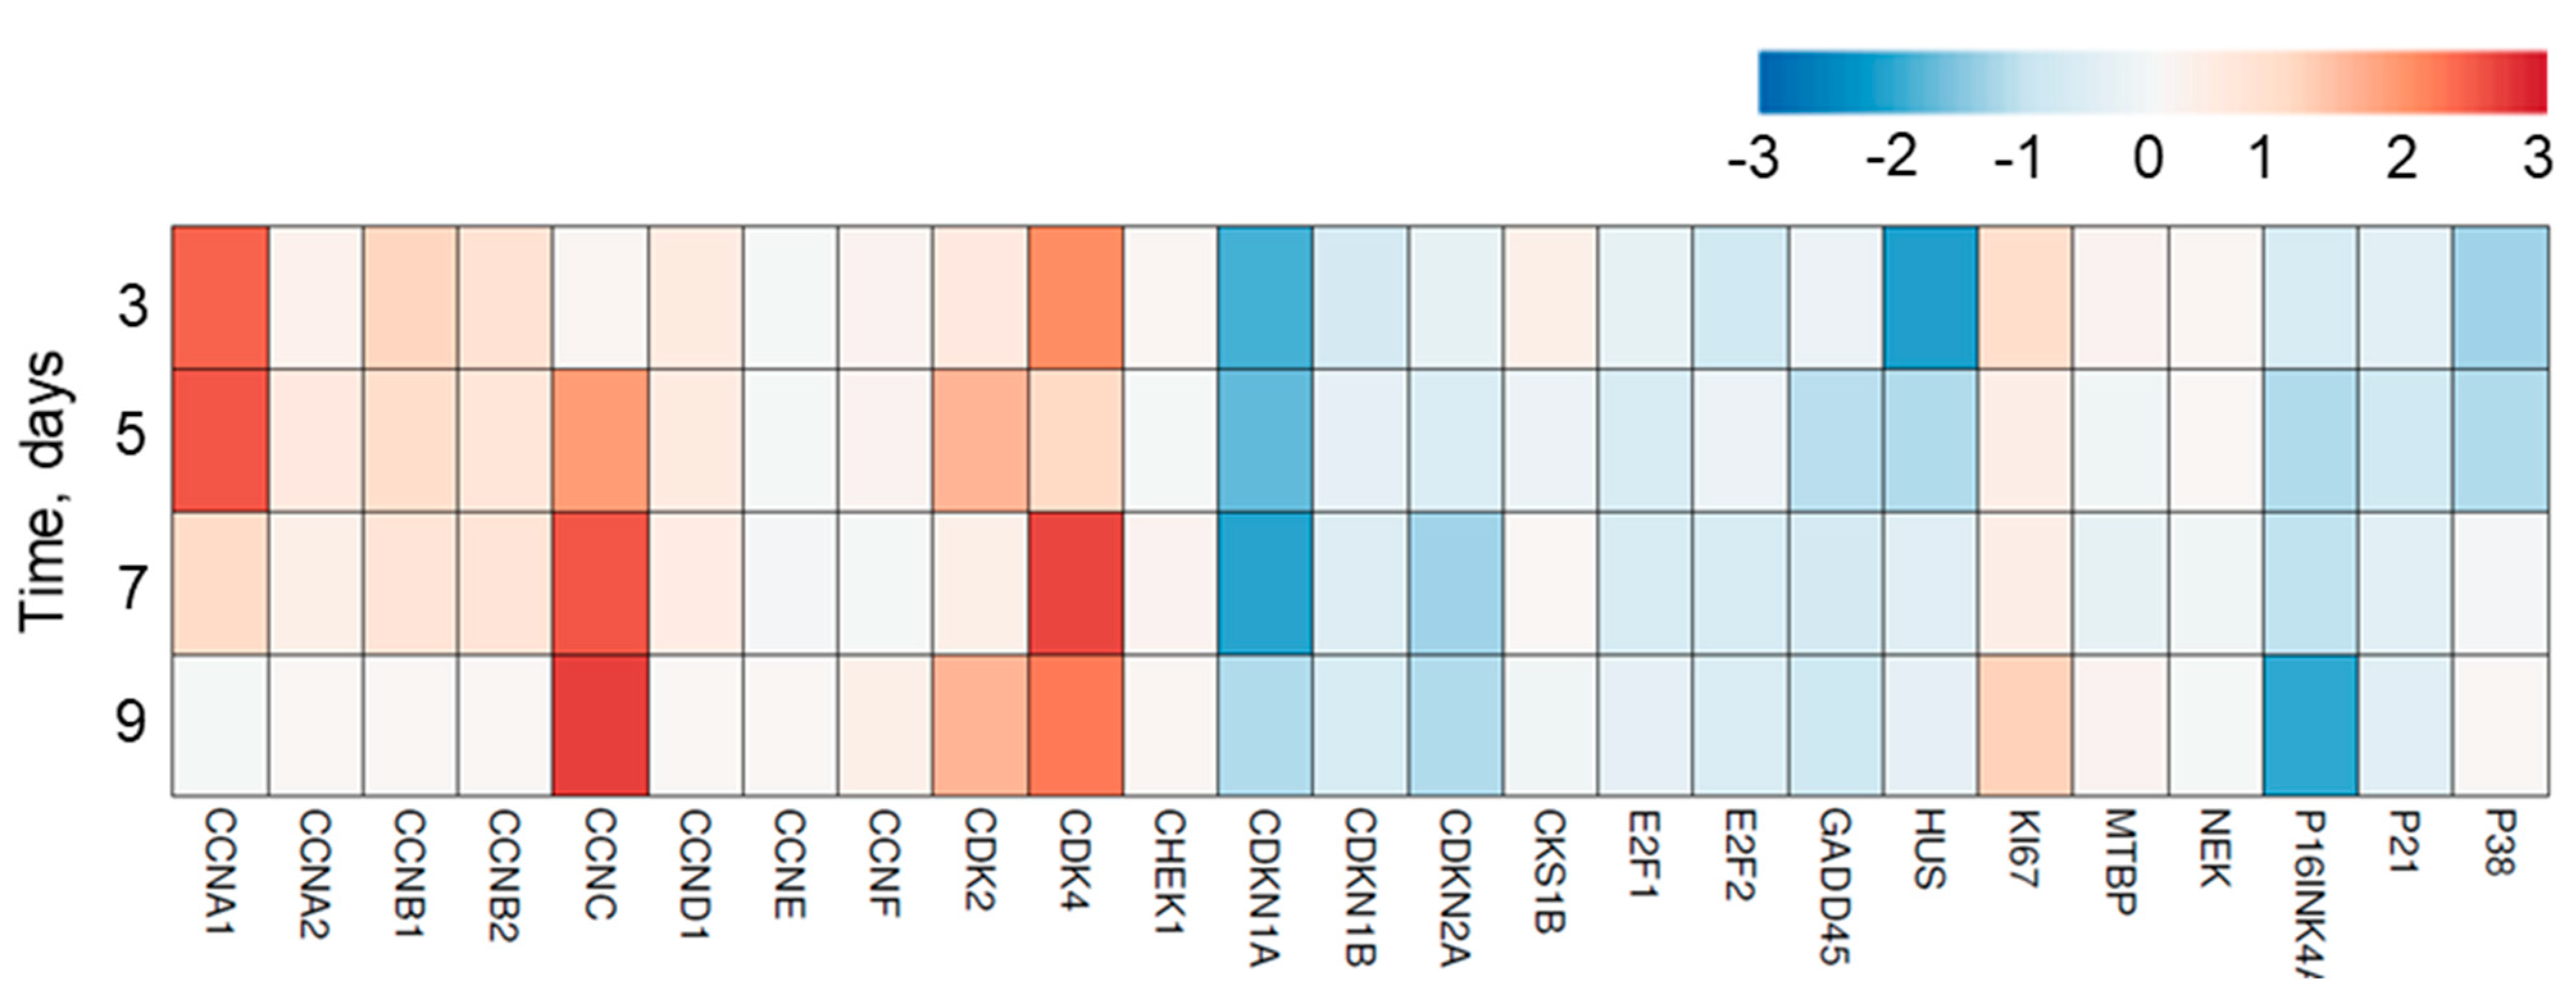
3.6. Cell Cycle Regulatory Genes Are Involved in the Proliferation of Tregs

Since a seven-day expansion of Tregs is necessary for their ex vivo maturation, we aimed to determine the possible proteins involved in cell cycle regulation. The expression levels of 28 genes in responder cells were analyzed using the Human Cell Cycle RT2 Profiler PCR Array. The expression levels of the investigated genes were measured at the time of cultivation against the expression of those in freshly isolated CD4+ T cells (Figure 6). Significant changes in expression levels were found in cyclin genes that promote transition through S and G2/M phases. CCNA1, CCNA2, CCNB1, CCNB2 and CCND1 were upregulated within the first 7 days, whereas G1 phase-associated CCNC appeared to be upregulated within 5–9 days of cultivation. The expression of CCNE, whose activity is required for cell cycle G1/S transition, and the F-box family protein CCNF, remained unchanged [52]. We found that the expression of two cyclin-dependent kinases (CDKs), CDK2 and CDK4, was upregulated in responder cells, and the inhibitors of CDK2 and CDK4, namely, CDKN1A, CDKN1B and CDKN2A, were subsequently reduced. The expression of the CDK/cyclin inhibitor proteins P16INK4A and P21 was downregulated as expected, since it was previously shown in proliferating lymphocytes [53]. Cell proliferation is associated with the inhibition of P53 and RB tumor suppressor pathways [54]. We found that P53 and RB genes were expectedly downregulated during the entire time of cultivation. Activation of p38 can induce p21-dependent cell cycle arrest [55]. Despite reduced P21 and P38 activator GADD45, the expression of P38 was downregulated only at the 3–5-day time points. Along with the reduced RB gene, we found the downregulation of RB transcription factors E2F1 and E2F2. A component of the cell cycle checkpoint complex that causes cell cycle arrest in response to bulky DNA lesions and DNA replication blockage of HUS1 [56] was also downregulated in proliferating cells. The expression of a nuclear protein associated with cellular proliferation of KI67 [57] was significantly upregulated. The expression of the serine/threonine-protein kinase genes NEK and CHEK1 [58,59], which are involved in mitotic regulation, and the MTBP protein, which regulates progression through the cell cycle, remained unchanged. Our results indicate that the maturation of Tregs during 9 days of ex vivo cultivation is associated with the modulation of cell cycle regulatory gene expression. Our results indicate that the expression profile of cell cycle-regulating genes was not significantly changed between days 7 and 9 of maturation.

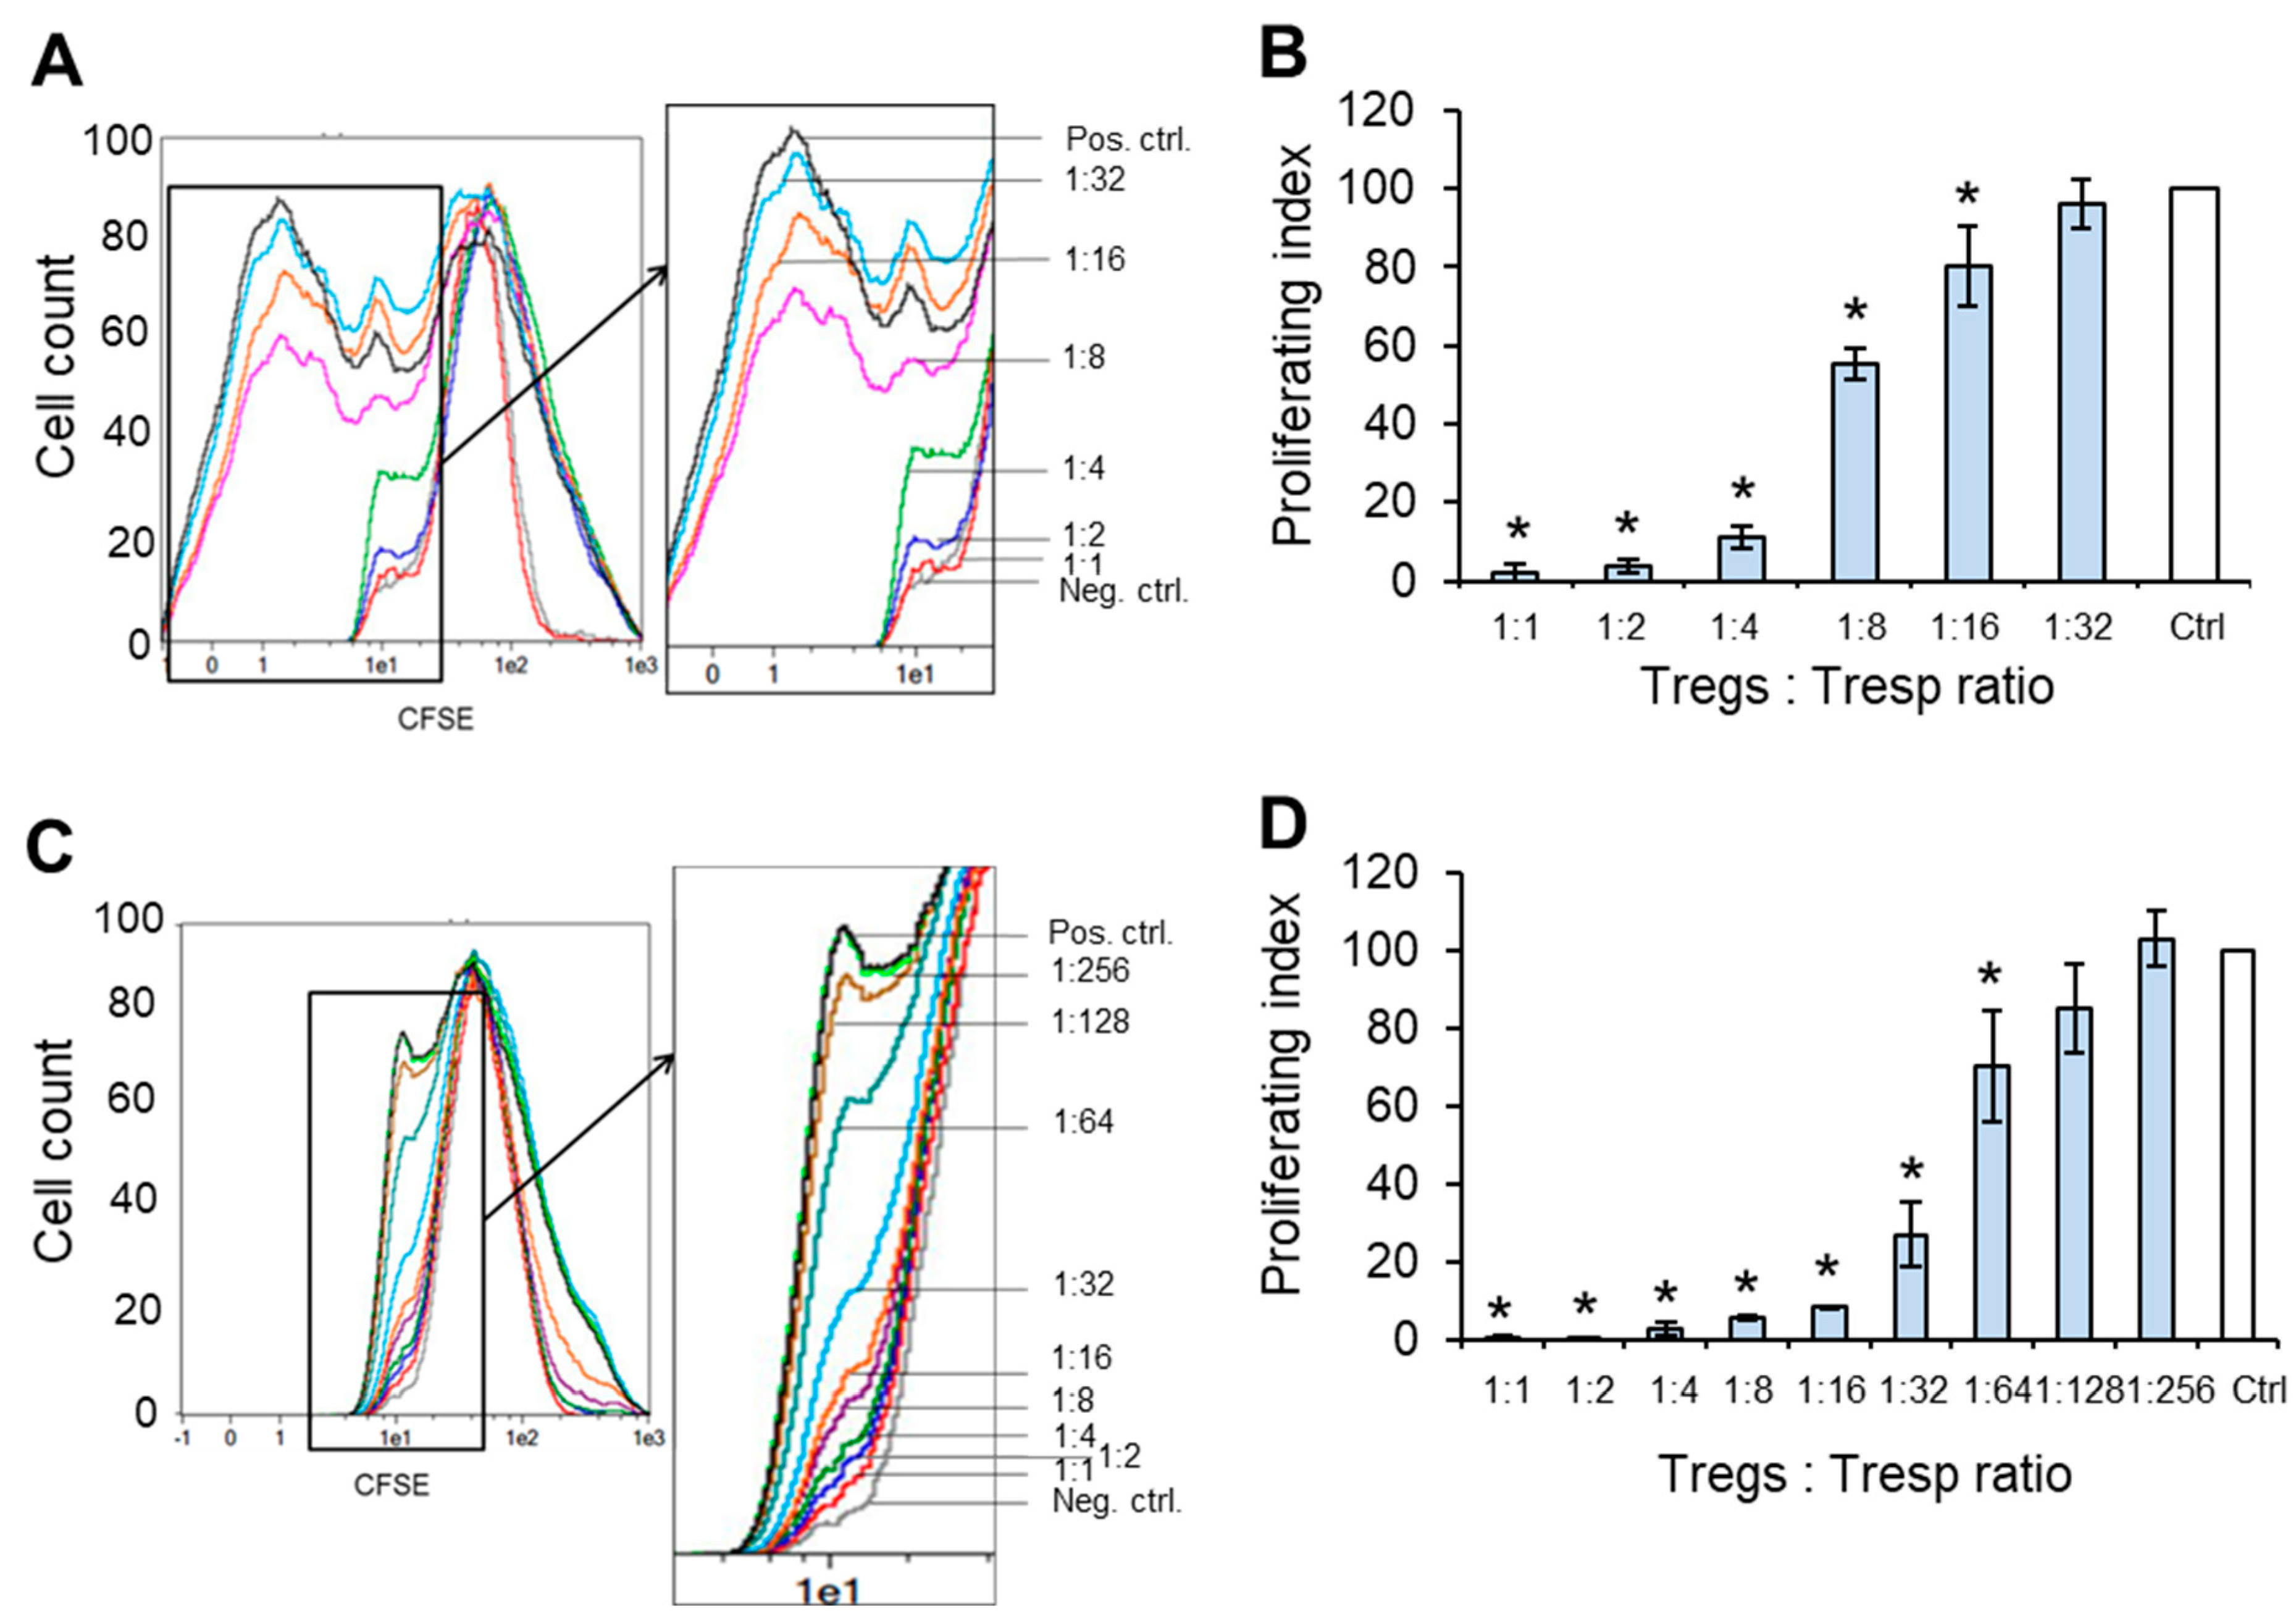
3.7. Matured eTregs Demonstrate High Suppressive Activity against Autologous CD4+CD25 Target Cells

A mixed lymphocyte reaction was performed to compare the functional suppressive activity of 7-day ex vivo expanded eTregs and freshly isolated pTregs from peripheral blood. The proliferative activity of responder CD4+CD25 T cells that were cocultured with pTregs or eTregs was measured. pTregs were able to inhibit the proliferation of target cells by almost 100% at ratios from 1:1 to 1:4 (Figure 7 A,B). PI in ratio of 1:8 was 55.2 ± 4.0. Higher dilutions of pTregs did not demonstrate suppressive activity. High suppressive activity was shown by eTregs, even at a ratio of 1:16 (Figure 7 C,D). PI in ratio of 1:32 was 27.1 ± 8.3. Higher dilutions of eTregs did not show statistically significant suppression. These results indicate an approximately two times higher activity of eTregs in comparison to pTregs.

4. Discussion

Despite the good reproducibility of Treg ex vivo induction protocols [60,61], these methods have certain limitations, including long cultivation times and relatively low yields of Tregs. Therefore, we developed a simple and rapid method for the ex vivo expansion of regulatory T cells based on selecting a starting cell population of CD4+ T cells. The resulting eTregs expressed all typical markers of Tregs CD4+CD25+FoxP3+CD127low. The starting population of CD4+ T cells contained approximately 7–12% Tregs; after seven days of ex vivo cultivation, approximately 98–99% of cells expressed typical markers of Tregs. According to our findings, almost all CD4+ cells undergo division, demonstrating that the proliferation of Tregs in the CD4+ population and the transformation of conventional CD4+CD25 T cells occur simultaneously.
Restimulation performed after 96 hours supports cell proliferation until day 7. Longer cultivation does not increase cell numbers; rather, it decreases cell viability, probably because of the lack of nutrients in growth media. Our protocol involves stimulation of initial cells with IL-2 and TGF-beta combined with TCR stimulation with anti-CD3 and anti-CD28 antibodies. IL-2-dependent conversion of the nonregulatory T cells into eTregs involves TGF-beta, which induces FoxP3 expression [62]. The costimulatory receptor CD28, as well as TCR and the IL-2 receptor, have been shown to participate in the transcriptional regulation of the FoxP3 gene [63]. Anti-CD3 and anti-CD28 antibodies and IL-2 have been used initially to stimulate the proliferation of precursor cells [64], and then TGF-beta has been used to induce the expression of the transcription factor FoxP3, which follows the emergence of both specific Treg markers and their potent suppressive function [65]. The engagement of TCRs (at least in some circumstances) is required to ensure the phenotypical stability of eTregs by inducing epigenetic changes, e.g., the establishment of T cell-specific CpG hypomethylation patterns [66].
In our experiments, the number of Tregs increased from 5 × 10⁶ to 150 × 106 during seven days of cultivation. The total number of cells was elevated 40–50 times, and the number of Tregs increased 400–450 times from the initial CD4+ T cells.
It is expected that such rapid cell growth should be accompanied by the activation of a number of cell proliferation genes. The investigation of gene expression within the time of ex vivo Treg proliferation and expansion revealed increased expression of genes responsible for cell cycle regulation.
FoxP3 is the master gene for Tregs. It is responsible for the suppressive activity of Tregs [3]. FoxP3 stabilizes and supports the growth and differentiation of Tregs. We compared the expression of FoxP3 in eTregs and in initial cells freshly isolated from peripheral blood. Expression was assessed by real-time RT-PCR and flow cytometry. The expression of FoxP3 in eTregs increased as much as two times in comparison with that in initial cells. FoxP3 gene expression is under the epigenetic control of the highly conserved CpG-rich TSDR region in the FoxP3 gene promoter, which is selectively demethylated in Tregs [7]. Molecular characterization of the TSDR revealed that this element has transcriptional enhancer activity and determines the stability of FoxP3 expression [67]. Our study confirms that ex vivo expansion of Tregs is characterized by the increased demethylation of FoxP3. Our data are not in accordance with the results obtained by Floess et al. [7], where it was shown that TGF-beta-induced Tregs in vitro demonstrate a much lower degree of demethylation compared to naturally occurring peripheral CD25+CD4+ Tregs. The difference in the results relies on the use of naïve CD4+ T cells for initial cells, which have a different initial status of TSDR demethylation.
In addition to FoxP3, T cell activation and proliferation are accompanied/caused by the expression of Ikaros family transcription factors [68]. Members of this family are DNA binding proteins containing two highly conserved zinc finger N-terminal domains and a protein binding domain (C-terminal) [69]. IKZF1 (IKAROS) may have dual effects and act as an enhancer or a silencer of gene expression [70]. Our results demonstrate that IKZF1 is significantly upregulated in mature eTregs. It is known that IKZF2 (HELIOS) upregulates FoxP3 by binding to the FoxP3 promoter [71]. Changes in IKZF2 expression determine changes in FoxP3 in Tregs [72]. We found upregulated expression of IKZF2 in eTregs which, together with upregulated demethylation, supports elevated FoxP3 expression. The activity of IKZF3 (AIOLOS) has the same effect in immune cells as IKZF1 [73]. In our experiments, the expression of IKZF3 in mature eTregs was not different from that in initial cells; however, its expression was reduced within the first 5 days of expansion. IKZF4 (EOS) has the opposite effect and can mediate Foxp3-dependent gene silencing in Tregs [74,75]. These data are in accordance with our results, where we demonstrated significant downregulation of IKZF4 in mature eTregs. The results of our study also demonstrate the changes in the expression profile of splice variants of FoxP3 and IKZF family members during eTreg maturation from initial CD4+ T cells. These results are very difficult to interpret, as the biological activities of such splice variants and their involvement in different processes are still poorly understood.
Rapid proliferation of activated lymphocytes is supported by active telomerase [43,44], and elevated activity was found in cells upon stimulation. Telomerase activity is known to be regulated by hTERT expression [76] and by alternative splicing of its mRNA [77,78]. The regulation of hTERT gene expression has been rather well investigated [79], whereas very little is known about telomerase regulation by hTERT. To date, 22 splice variants of hTERT have been described; however, only full-length hTERT is catalytically active [80]. Two splice variants comprise the major forms of total hTERT mRNA. Deletion of 36 nucleotides from exon 6 (α–variant) leads to the loss of a portion of the reverse transcriptase domain in the hTERT protein, and results in the loss of catalytic activity. Deletion of 182 nucleotides from exons 7 and 8 (β–variant) leads to a reading frame shift, and results in the formation of a premature stop codon in exon 10 and the synthesis of a truncated hTERT protein [81]. This hTERT splice variant acts as a dominant negative protein [82]. Our results demonstrated that, in the first five days of maturation, telomerase activity was induced by the shift in hTERT splicing patterns toward the full-length active variant while, after day five, the increase in total hTERT expression had a major impact on the enhancement of telomerase activity.

5. Conclusions

The results of the present study demonstrate that a short-term cultivation protocol allows for the production of rather large amounts of mature Tregs from an initial population of CD4+ T lymphocytes. Seven days of ex vivo expansion is necessary for a complete transformation of initial cells into eTregs, which have increased suppressive activity against autologous target lymphocytes. Our findings should facilitate research on the biology of Treg maturation and their use for regenerative purposes, especially for immunotherapy of autoimmune diseases.

Supplementary Materials

The following are available online at https://www.mdpi.com/article/10.3390/app11135776/s1, Table S1: List of primers used for real-time RT-PCR.

Author Contributions

D.D.Z. and V.G.B. contributed to the conception and design of the study. N.S.N., S.N.G., and A.H. conducted in vitro experiments. Y.A.G. and D.D.E. contributed to the data analysis and the interpretation of the data. A.H. and N.S.N. drafted the article. D.D.Z. critically reviewed and commented on the manuscript. All authors have read and agreed to the published version of the manuscript.

Funding

The work was performed in the framework of the Russian Federation fundamental research program for the long-term period for 2021–2030.

Institutional Review Board Statement

The study was conducted according to the guidelines of the Declaration of Helsinki, and approved by the Institutional Ethics Committee the Institute of Biomedical Chemistry, protocol 037 23 September 2020.

Informed Consent Statement

Informed consent was obtained from all subjects involved in the study. Informed consent for this study is available on request from the corresponding author. The statement is not publicly available due to ethical restrictions.

Data Availability Statement

The data presented in this study are available on request from the corresponding author. The data are not publicly available due to ethical restrictions.

Conflicts of Interest

The authors declare no conflict of interest.

References

  1. Su, H.; Longhi, M.S.; Wang, P.; Vergani, D.; Ma, Y. Human CD4+CD25(high)CD127 (low/neg) regulatory T cells. Methods Mol. Biol. 2012, 806, 287–299. [Google Scholar]
  2. Fontenot, J.D.; Rasmussen, J.P.; Williams, L.M.; Dooley, J.L.; Farr, A.G.; Rudensky, A.Y. Regulatory T cell lineage specification by the forkhead transcription factor foxp3. Immunity 2005, 22, 329–341. [Google Scholar] [CrossRef]
  3. Fontenot, J.D.; Gavin, M.A.; Rudensky, A.Y. Foxp3 programs the development and function of CD4+CD25+ regulatory T cells. Nat. Immunol. 2003, 4, 330–336. [Google Scholar] [CrossRef] [PubMed]
  4. Sakaguchi, S.; Sakaguchi, N.; Asano, M.; Itoh, M.; Toda, M. Immunologic self-tolerance maintained by activated T cells expressing IL-2 receptor alpha-chains (CD25). Breakdown of a single mechanism of self-tolerance causes various autoimmune diseases. J. Immunol. 1995, 155, 1151–1164. [Google Scholar]
  5. Chang, C.-F.; D’Souza, W.N.; Ch’en, I.L.; Pages, G.; Pouyssegur, J.; Hedrick, S.M. Polar opposites: Erk direction of CD4 T cell subsets. J. Immunol. 2012, 189, 721–731. [Google Scholar] [CrossRef] [Green Version]
  6. Williams, L.M.; Rudensky, A.Y. Maintenance of the Foxp3-dependent developmental program in mature regulatory T cells requires continued expression of Foxp3. Nat. Immunol. 2007, 8, 277–284. [Google Scholar] [CrossRef]
  7. Floess, S.; Freyer, J.; Siewert, C.; Baron, U.; Olek, S.; Polansky, J.; Schlawe, K.; Chang, H.-D.; Bopp, T.; Schmitt, E.; et al. Epigenetic control of the foxp3 locus in regulatory T cells. PLoS Biol. 2007, 5, e38. [Google Scholar] [CrossRef] [PubMed]
  8. Rossetti, M.; Spreafico, R.; Saidin, S.; Chua, C.; Moshref, M.; Leong, J.Y.; Tan, Y.K.; Thumboo, J.; van Loosdregt, J.; Albani, S. Ex Vivo-Expanded but Not In Vitro-Induced Human Regulatory T Cells Are Candidates for Cell Therapy in Autoimmune Diseases Thanks to Stable Demethylation of the FOXP3 Regulatory T Cell-Specific Demethylated Region. J. Immunol. 2014, 194, 113–124. [Google Scholar] [CrossRef] [PubMed]
  9. Powell, M.D.; Read, K.A.; Sreekumar, B.K.; Oestreich, K.J. Ikaros Zinc Finger Transcription Factors: Regulators of Cytokine Signaling Pathways and CD4(+) T Helper Cell Differentiation. Front. Immunol. 2019, 10, 1299. [Google Scholar] [CrossRef] [Green Version]
  10. Akbar, A.N.; Vukmanovic-Stejic, M. Telomerase in T lymphocytes: Use it and lose it? J. Immunol. 2007, 178, 6689–6694. [Google Scholar] [CrossRef] [Green Version]
  11. Plyasova, A.A.; Zhdanov, D.D. Alternative Splicing of Human Telomerase Reverse Transcriptase (hTERT) and Its Implications in Physiological and Pathological Processes. Biomedicines 2021, 9, 526. [Google Scholar] [CrossRef] [PubMed]
  12. Mailer, R.K.W. Alternative Splicing of FOXP3-Virtue and Vice. Front. Immunol. 2018, 9, 530. [Google Scholar] [CrossRef] [Green Version]
  13. Vshyukova, V.; Valochnik, A.; Meleshko, A. Expression of aberrantly spliced oncogenic Ikaros isoforms coupled with clonal IKZF1 deletions and chimeric oncogenes in acute lymphoblastic leukemia. Blood Cells. Mol. Dis. 2018, 71, 29–38. [Google Scholar] [CrossRef]
  14. Linsley, P.S.; Brady, W.; Urnes, M.; Grosmaire, L.S.; Damle, N.K.; Ledbetter, J.A. CTLA-4 is a second receptor for the B cell activation antigen B7. J. Exp. Med. 1991, 174, 561–569. [Google Scholar] [CrossRef] [PubMed] [Green Version]
  15. Wing, K.; Onishi, Y.; Prieto-Martin, P.; Yamaguchi, T.; Miyara, M.; Fehervari, Z.; Nomura, T.; Sakaguchi, S. CTLA-4 control over Foxp3+ regulatory T cell function. Science 2008, 322, 271–275. [Google Scholar] [CrossRef] [PubMed]
  16. Liang, B.; Workman, C.; Lee, J.; Chew, C.; Dale, B.M.; Colonna, L.; Flores, M.; Li, N.; Schweighoffer, E.; Greenberg, S.; et al. Regulatory T cells inhibit dendritic cells by lymphocyte activation gene-3 engagement of MHC class II. J. Immunol. 2008, 180, 5916–5926. [Google Scholar] [CrossRef] [PubMed] [Green Version]
  17. Camisaschi, C.; Casati, C.; Rini, F.; Perego, M.; De Filippo, A.; Triebel, F.; Parmiani, G.; Belli, F.; Rivoltini, L.; Castelli, C. LAG-3 expression defines a subset of CD4(+)CD25(high)Foxp3(+) regulatory T cells that are expanded at tumor sites. J. Immunol. 2010, 184, 6545–6551. [Google Scholar] [CrossRef] [PubMed] [Green Version]
  18. Zhdanov, D.D.; Gladilina, Y.A.; Pokrovsky, V.S.; Grishin, D.V.; Grachev, V.A.; Orlova, V.S.; Pokrovskaya, M.V.; Alexandrova, S.S.; Sokolov, N.N. Murine regulatory T cells induce death of effector T, B, and NK lymphocytes through a contact-independent mechanism involving telomerase suppression and telomere-associated senescence. Cell. Immunol. 2018, 331, 146–160. [Google Scholar] [CrossRef] [PubMed]
  19. Zhdanov, D.D.; Gladilina, Y.A.; Grishin, D.V.; Grachev, V.A.; Orlova, V.S.; Pokrovskaya, M.V.; Alexandrova, S.S.; Pokrovsky, V.S.; Sokolov, N.N. Contact-independent suppressive activity of regulatory T cells is associated with telomerase inhibition, telomere shortening and target lymphocyte apoptosis. Mol. Immunol. 2018, 101, 229–244. [Google Scholar] [CrossRef]
  20. Kukreja, A.; Cost, G.; Marker, J.; Zhang, C.; Sun, Z.; Lin-Su, K.; Ten, S.; Sanz, M.; Exley, M.; Wilson, B.; et al. Multiple immuno-regulatory defects in type-1 diabetes. J. Clin. Investig. 2002, 109, 131–140. [Google Scholar] [CrossRef]
  21. de Kleer, I.M.; Wedderburn, L.R.; Taams, L.S.; Patel, A.; Varsani, H.; Klein, M.; de Jager, W.; Pugayung, G.; Giannoni, F.; Rijkers, G.; et al. CD4+CD25bright regulatory T cells actively regulate inflammation in the joints of patients with the remitting form of juvenile idiopathic arthritis. J. Immunol. 2004, 172, 6435–6443. [Google Scholar] [CrossRef] [Green Version]
  22. Crispin, J.C.; Alcocer-Varela, J.; de Pablo, P.; Martínez, A.; Richaud-Patin, Y.; Alarcón-Segovia, D. Immunoregulatory defects in patients with systemic lupus erythematosus in clinical remission. Lupus 2003, 12, 386–393. [Google Scholar] [CrossRef]
  23. Valencia, X.; Yarboro, C.; Illei, G.; Lipsky, P.E. Deficient CD4+CD25high T regulatory cell function in patients with active systemic lupus erythematosus. J. Immunol. 2007, 178, 2579–2588. [Google Scholar] [CrossRef] [Green Version]
  24. Lyssuk, E.Y.; Torgashina, A.V.; Soloviev, S.K.; Nassonov, E.L.; Bykovskaia, S.N. Reduced number and function of CD4+CD25highFoxP3+ regulatory T cells in patients with systemic lupus erythematosus. Adv. Exp. Med. Biol. 2007, 601, 113–119. [Google Scholar]
  25. Venken, K.; Hellings, N.; Thewissen, M.; Somers, V.; Hensen, K.; Rummens, J.-L.; Medaer, R.; Hupperts, R.; Stinissen, P. Compromised CD4+ CD25(high) regulatory T-cell function in patients with relapsing-remitting multiple sclerosis is correlated with a reduced frequency of FOXP3-positive cells and reduced FOXP3 expression at the single-cell level. Immunology 2008, 123, 79–89. [Google Scholar] [CrossRef]
  26. Bach, J.F.; Chatenoud, L. Tolerance to islet autoantigens in type 1 diabetes. Annu. Rev. Immunol. 2001, 19, 131–161. [Google Scholar] [CrossRef] [PubMed]
  27. Kohm, A.P.; Carpentier, P.A.; Anger, H.A.; Miller, S.D. Cutting edge: CD4+CD25+ regulatory T cells suppress antigen-specific autoreactive immune responses and central nervous system inflammation during active experimental autoimmune encephalomyelitis. J. Immunol. 2002, 169, 4712–4716. [Google Scholar] [CrossRef] [PubMed] [Green Version]
  28. Wu, A.J.; Hua, H.; Munson, S.H.; McDevitt, H.O. Tumor necrosis factor-alpha regulation of CD4+CD25+ T cell levels in NOD mice. Proc. Natl. Acad. Sci. USA 2002, 99, 12287–12292. [Google Scholar] [CrossRef] [Green Version]
  29. Hoffmann, P.; Ermann, J.; Edinger, M.; Fathman, C.G.; Strober, S. Donor-type CD4(+)CD25(+) regulatory T cells suppress lethal acute graft-versus-host disease after allogeneic bone marrow transplantation. J. Exp. Med. 2002, 196, 389–399. [Google Scholar] [CrossRef] [PubMed] [Green Version]
  30. Mekala, D.J.; Geiger, T.L. Immunotherapy of autoimmune encephalomyelitis with redirected CD4+CD25+ T lymphocytes. Blood 2005, 105, 2090–2092. [Google Scholar] [CrossRef] [PubMed] [Green Version]
  31. Peters, J.H.; Koenen, H.J.P.M.; Hilbrands, L.B.; Joosten, I. Immunotherapy with regulatory T cells in transplantation. Immunotherapy 2009, 1, 855–871. [Google Scholar] [CrossRef]
  32. Hoffmann, P.; Eder, R.; Kunz-Schughart, L.A.; Andreesen, R.; Edinger, M. Large-scale in vitro expansion of polyclonal human CD4(+)CD25high regulatory T cells. Blood 2004, 104, 895–903. [Google Scholar] [CrossRef] [PubMed]
  33. Golovina, T.N.; Mikheeva, T.; Brusko, T.M.; Blazar, B.R.; Bluestone, J.A.; Riley, J.L. Retinoic acid and rapamycin differentially affect and synergistically promote the ex vivo expansion of natural human T regulatory cells. PLoS ONE 2011, 6, e15868. [Google Scholar] [CrossRef] [PubMed] [Green Version]
  34. Lifshitz, G.V.; Zhdanov, D.D.; Lokhonina, A.V.; Eliseeva, D.D.; Lyssuck, E.Y.; Zavalishin, I.A.; Bykovskaia, S.N. Ex vivo expanded regulatory T cells CD4(+)CD25(+)FoxP3(+)CD127(Low) develop strong immunosuppressive activity in patients with remitting-relapsing multiple sclerosis. Autoimmunity 2016, 49, 388–396. [Google Scholar] [CrossRef] [PubMed]
  35. Vasina, D.A.; Zhdanov, D.D.; Orlova, E.V.; Orlova, V.S.; Pokrovskaya, M.V.; Aleksandrova, S.S.; Sokolov, N.N. Apoptotic endonuclease EndoG inhibits telomerase activity and induces malignant transformation of human CD4+ T cells. Biochemistry 2017, 82, 24–37. [Google Scholar] [CrossRef] [PubMed]
  36. Wieczorek, G.; Asemissen, A.; Model, F.; Turbachova, I.; Floess, S.; Liebenberg, V.; Baron, U.; Stauch, D.; Kotsch, K.; Pratschke, J.; et al. Quantitative DNA methylation analysis of FOXP3 as a new method for counting regulatory T cells in peripheral blood and solid tissue. Cancer Res. 2009, 69, 599–608. [Google Scholar] [CrossRef] [Green Version]
  37. Kim, N.W.; Piatyszek, M.A.; Prowse, K.R.; Harley, C.B.; West, M.D.; Ho, P.L.; Coviello, G.M.; Wright, W.E.; Weinrich, S.L.; Shay, J.W. Specific association of human telomerase activity with immortal cells and cancer. Science 1994, 266, 2011–2015. [Google Scholar] [CrossRef]
  38. Zhdanov, D.D.; Vasina, D.A.; Orlova, E.V.; Orlova, V.S.; Pokrovskaya, M.V.; Aleksandrova, S.S.; Sokolov, N.N. Apoptotic endonuclease EndoG regulates alternative splicing of human telomerase catalytic subunit hTERT. Biochem. Suppl. Ser. B Biomed. Chem. 2017, 11, 154–165. [Google Scholar] [CrossRef]
  39. Chougnet, C.; Hildeman, D. Helios-controller of Treg stability and function. Transl. Cancer Res. 2016, 5, S338–S341. [Google Scholar] [CrossRef]
  40. Walker, L.S.K. Treg and CTLA-4: Two intertwining pathways to immune tolerance. J. Autoimmun. 2013, 45, 49–57. [Google Scholar] [CrossRef] [Green Version]
  41. Borsellino, G.; Kleinewietfeld, M.; Di Mitri, D.; Sternjak, A.; Diamantini, A.; Giometto, R.; Höpner, S.; Centonze, D.; Bernardi, G.; Dell’Acqua, M.L.; et al. Expression of ectonucleotidase CD39 by Foxp3+ Treg cells: Hydrolysis of extracellular ATP and immune suppression. Blood 2007, 110, 1225–1232. [Google Scholar] [CrossRef] [PubMed] [Green Version]
  42. Huang, C.-T.; Workman, C.J.; Flies, D.; Pan, X.; Marson, A.L.; Zhou, G.; Hipkiss, E.L.; Ravi, S.; Kowalski, J.; Levitsky, H.I.; et al. Role of LAG-3 in Regulatory T Cells. Immunity 2004, 21, 503–513. [Google Scholar] [CrossRef] [Green Version]
  43. Moro-García, M.A.; Alonso-Arias, R.; López-Larrea, C. Molecular mechanisms involved in the aging of the T-cell immune response. Curr. Genomics 2012, 13, 589–602. [Google Scholar] [CrossRef] [PubMed] [Green Version]
  44. Zhdanov, D.D.; Vasina, D.A.; Grachev, V.A.; Orlova, E.V.; Orlova, V.S.; Pokrovskaya, M.V.; Alexandrova, S.S.; Sokolov, N.N. Alternative splicing of telomerase catalytic subunit hTERT generated by apoptotic endonuclease EndoG induces human CD4 + T cell death. Eur. J. Cell Biol. 2017, 96, 653–664. [Google Scholar] [CrossRef] [PubMed]
  45. Nalobin, D.S.; Galiakberova, A.A.; Alipkina, S.I.; Glukhov, A.I. Regulation of Telomerase Activity. Biol. Bull. Rev. 2018, 8, 142–154. [Google Scholar] [CrossRef]
  46. Zhdanov, D.D.; Vasina, D.A.; Orlova, V.S.; Gotovtseva, V.Y.; Bibikova, M.V.; Pokrovsky, V.S.; Pokrovskayaa, M.V.; Aleksandrova, S.S.; Sokolov, N.N. Apoptotic endonuclease EndoG induces alternative splicing of telomerase catalytic subunit hTERT and death of tumor cells. Biochem. Suppl. Ser. B Biomed. Chem. 2016, 10, 310–321. [Google Scholar]
  47. Slusher, A.L.; Kim, J.J.J.; Ludlow, A.T. The role of alternative rna splicing in the regulation of htert, telomerase, and telomeres: Implications for cancer therapeutics. Cancers 2020, 12, 1514. [Google Scholar] [CrossRef]
  48. Haiqi, H.; Yong, Z.; Yi, L. Transcriptional regulation of Foxp3 in regulatory T cells. Immunobiology 2011, 216, 678–685. [Google Scholar] [CrossRef]
  49. Georgopoulos, K.; Winandy, S.; Avitahl, N. The role of the Ikaros gene in lymphocyte development and homeostasis. Annu. Rev. Immunol. 1997, 15, 155–176. [Google Scholar] [CrossRef]
  50. Zhao, W.; Li, Y.; Yao, C.; Zhang, G.; Zhao, K.Y.; Chen, W.; Ru, P.; Pan, X.; Tu, H.; Jones, D. Detection of Pathogenic Isoforms of IKZF1 in Leukemic Cell Lines and Acute Lymphoblastic Leukemia Samples: Identification of a Novel Truncated IKZF1 Transcript in SUP-B15. Cancers 2020, 12, 3161. [Google Scholar] [CrossRef]
  51. Matulić, M.; Paradzik, M.; Puskarić, B.J.; Stipić, J.; Antica, M. Analysis of Ikaros family splicing variants in human hematopoietic lineages. Coll. Antropol. 2010, 34, 59–62. [Google Scholar] [PubMed]
  52. Satyanarayana, A.; Kaldis, P. Mammalian cell-cycle regulation: Several Cdks, numerous cyclins and diverse compensatory mechanisms. Oncogene 2009, 28, 2925–2939. [Google Scholar] [CrossRef] [PubMed] [Green Version]
  53. Ye, J.; Huang, X.; Hsueh, E.C.; Zhang, Q.; Ma, C.; Zhang, Y.; Varvares, M.A.; Hoft, D.F.; Peng, G. Human regulatory T cells induce T-lymphocyte senescence. Blood 2012, 120, 2021–2031. [Google Scholar] [CrossRef]
  54. Campisi, J. Senescent Cells, Tumor Suppression, and Organismal Aging: Good Citizens, Bad Neighbors. Cell 2005, 120, 513–522. [Google Scholar] [CrossRef]
  55. Todd, D.E.; Densham, R.M.; Molton, S.A.; Balmanno, K.; Newson, C.; Weston, C.R.; Garner, A.P.; Scott, L.; Cook, S.J. ERK1/2 and p38 cooperate to induce a p21CIP1-dependent G1 cell cycle arrest. Oncogene 2004, 23, 3284–3295. [Google Scholar] [CrossRef] [Green Version]
  56. Balmus, G.; Lim, P.X.; Oswald, A.; Hume, K.R.; Cassano, A.; Pierre, J.; Hill, A.; Huang, W.; August, A.; Stokol, T.; et al. HUS1 regulates in vivo responses to genotoxic chemotherapies. Oncogene 2016, 35, 662–669. [Google Scholar] [CrossRef]
  57. Sun, X.; Kaufman, P.D. Ki-67: More than a proliferation marker. Chromosoma 2018, 127, 175–186. [Google Scholar] [CrossRef]
  58. Pelegrini, A.L.; Moura, D.J.; Brenner, B.L.; Ledur, P.F.; Maques, G.P.; Henriques, J.A.P.; Saffi, J.; Lenz, G. Nek1 silencing slows down DNA repair and blocks DNA damage-induced cell cycle arrest. Mutagenesis 2010, 25, 447–454. [Google Scholar] [CrossRef] [Green Version]
  59. Reissig, K.; Silver, A.; Hartig, R.; Schinlauer, A.; Walluscheck, D.; Guenther, T.; Siedentopf, S.; Ross, J.; Vo, D.-K.; Roessner, A.; et al. Chk1 Promotes DNA Damage Response Bypass following Oxidative Stress in a Model of Hydrogen Peroxide-Associated Ulcerative Colitis through JNK Inactivation and Chromatin Binding. Oxid. Med. Cell. Longev. 2017, 2017, 1–20. [Google Scholar] [CrossRef] [PubMed] [Green Version]
  60. Fantini, M.C.; Dominitzki, S.; Rizzo, A.; Neurath, M.F.; Becker, C. In vitro generation of CD4+ CD25+ regulatory cells from murine naive T cells. Nat. Protoc. 2007, 2, 1789–1790. [Google Scholar] [CrossRef] [PubMed]
  61. Ellis, G.I.; Reneer, M.C.; Vélez-Ortega, A.C.; McCool, A.; Martí, F. Generation of induced regulatory T cells from primary human naïve and memory T cells. J. Vis. Exp. 2012, 62, 3738. [Google Scholar]
  62. Davidson, T.S.; DiPaolo, R.J.; Andersson, J.; Shevach, E.M. Cutting Edge: IL-2 is essential for TGF-beta-mediated induction of Foxp3+ T regulatory cells. J. Immunol. 2007, 178, 4022–4026. [Google Scholar] [CrossRef] [Green Version]
  63. Polansky, J.K.; Schreiber, L.; Thelemann, C.; Ludwig, L.; Krüger, M.; Baumgrass, R.; Cording, S.; Floess, S.; Hamann, A.; Huehn, J. Methylation matters: Binding of Ets-1 to the demethylated Foxp3 gene contributes to the stabilization of Foxp3 expression in regulatory T cells. J. Mol. Med. 2010, 88, 1029–1040. [Google Scholar] [CrossRef] [Green Version]
  64. Zheng, S.G.; Wang, J.; Wang, P.; Gray, J.D.; Horwitz, D.A. IL-2 is essential for TGF-beta to convert naive CD4+CD25- cells to CD25+Foxp3+ regulatory T cells and for expansion of these cells. J. Immunol. 2007, 178, 2018–2027. [Google Scholar] [CrossRef] [PubMed] [Green Version]
  65. Fantini, M.C.; Becker, C.; Monteleone, G.; Pallone, F.; Galle, P.R.; Neurath, M.F. Cutting edge: TGF-beta induces a regulatory phenotype in CD4+CD25- T cells through Foxp3 induction and down-regulation of Smad7. J. Immunol. 2004, 172, 5149–5153. [Google Scholar] [CrossRef] [PubMed] [Green Version]
  66. Ohkura, N.; Hamaguchi, M.; Morikawa, H.; Sugimura, K.; Tanaka, A.; Ito, Y.; Osaki, M.; Tanaka, Y.; Yamashita, R.; Nakano, N.; et al. T cell receptor stimulation-induced epigenetic changes and Foxp3 expression are independent and complementary events required for Treg cell development. Immunity 2012, 37, 785–799. [Google Scholar] [CrossRef] [Green Version]
  67. Polansky, J.K.; Kretschmer, K.; Freyer, J.; Floess, S.; Garbe, A.; Baron, U.; Olek, S.; Hamann, A.; von Boehmer, H.; Huehn, J. DNA methylation controls Foxp3 gene expression. Eur. J. Immunol. 2008, 38, 1654–1663. [Google Scholar] [CrossRef]
  68. Gottschalk, R.A.; Corse, E.; Allison, J.P. Expression of Helios in peripherally induced Foxp3+ regulatory T cells. J. Immunol. 2012, 188, 976–980. [Google Scholar] [CrossRef] [Green Version]
  69. Georgopoulos, K.; Moore, D.D.; Derfler, B. Ikaros, an early lymphoid-specific transcription factor and a putative mediator for T cell commitment. Science 1992, 258, 808–812. [Google Scholar] [CrossRef] [PubMed]
  70. Yoshida, T.; Georgopoulos, K. Ikaros fingers on lymphocyte differentiation. Int. J. Hematol. 2014, 100, 220–229. [Google Scholar] [CrossRef] [PubMed] [Green Version]
  71. Getnet, D.; Grosso, J.F.; Goldberg, M.V.; Harris, T.J.; Yen, H.-R.; Bruno, T.C.; Durham, N.M.; Hipkiss, E.L.; Pyle, K.J.; Wada, S.; et al. A role for the transcription factor Helios in human CD4(+)CD25(+) regulatory T cells. Mol. Immunol. 2010, 47, 1595–1600. [Google Scholar] [CrossRef] [Green Version]
  72. Zabransky, D.J.; Nirschl, C.J.; Durham, N.M.; Park, B.V.; Ceccato, C.M.; Bruno, T.C.; Tam, A.J.; Getnet, D.; Drake, C.G. Phenotypic and functional properties of Helios+ regulatory T cells. PLoS ONE 2012, 7, e34547. [Google Scholar]
  73. Seng, A.; Yankee, T.M. The Role of the Ikaros Family of Transcription Factors in Regulatory T cell Development and Function. J. Clin. Cell. Immunol. 2017, 8, 495. [Google Scholar] [CrossRef] [PubMed] [Green Version]
  74. Hu, R.; Sharma, S.M.; Bronisz, A.; Srinivasan, R.; Sankar, U.; Ostrowski, M.C. Eos, MITF, and PU.1 recruit corepressors to osteoclast-specific genes in committed myeloid progenitors. Mol. Cell. Biol. 2007, 27, 4018–4027. [Google Scholar] [CrossRef] [Green Version]
  75. Pan, F.; Yu, H.; Dang, E.V.; Barbi, J.; Pan, X.; Grosso, J.F.; Jinasena, D.; Sharma, S.M.; McCadden, E.M.; Getnet, D.; et al. Eos mediates Foxp3-dependent gene silencing in CD4+ regulatory T cells. Science 2009, 325, 1142–1146. [Google Scholar] [CrossRef] [Green Version]
  76. Meyerson, M.; Counter, C.M.; Eaton, E.N.; Ellisen, L.W.; Steiner, P.; Caddle, S.D.; Ziaugra, L.; Beijersbergen, R.L.; Davidoff, M.J.; Liu, Q.; et al. hEST2, the putative human telomerase catalytic subunit gene, is up-regulated in tumor cells and during immortalization. Cell 1997, 90, 785–795. [Google Scholar] [CrossRef] [Green Version]
  77. Listerman, I.; Sun, J.; Gazzaniga, F.S.; Lukas, J.L.; Blackburn, E.H. The major reverse transcriptase-incompetent splice variant of the human telomerase protein inhibits telomerase activity but protects from apoptosis. Cancer Res. 2013, 73, 2817–2828. [Google Scholar] [CrossRef] [PubMed] [Green Version]
  78. Zhdanov, D.D.; Plyasova, A.A.; Gladilina, Y.A.; Pokrovsky, V.S.; Grishin, D.V.; Grachev, V.A.; Orlova, V.S.; Pokrovskaya, M.V.; Alexandrova, S.S.; Lobaeva, T.A.; et al. Inhibition of telomerase activity by splice-switching oligonucleotides targeting the mRNA of the telomerase catalytic subunit affects proliferation of human CD4+ T lymphocytes. Biochem. Biophys. Res. Commun. 2019, 509, 790–796. [Google Scholar] [CrossRef] [PubMed]
  79. Daniel, M.; Peek, G.W.; Tollefsbol, T.O. Regulation of the human catalytic subunit of telomerase (hTERT). Gene 2012, 498, 135–146. [Google Scholar] [CrossRef] [Green Version]
  80. Saebøe-Larssen, S.; Fossberg, E.; Gaudernack, G. Characterization of novel alternative splicing sites in human telomerase reverse transcriptase (hTERT): Analysis of expression and mutual correlation in mRNA isoforms from normal and tumour tissues. BMC Mol. Biol. 2006, 7, 26. [Google Scholar] [CrossRef] [Green Version]
  81. Ulaner, G.A.; Hu, J.F.; Vu, T.H.; Oruganti, H.; Giudice, L.C.; Hoffman, A.R. Regulation of telomerase by alternate splicing of human telomerase reverse transcriptase (hTERT) in normal and neoplastic ovary, endometrium and myometrium. Int. J. Cancer 2000, 85, 330–335. [Google Scholar] [CrossRef]
  82. Lydeard, J.R.; Jain, S.; Yamaguchi, M.; Haber, J.E. Break-induced replication and telomerase-independent telomere maintenance require Pol32. Nature 2007, 448, 820–823. [Google Scholar] [CrossRef] [PubMed]
Figure 1. Proliferative activity of Tregs during ex vivo expansion: (A) The increasing number of Tregs during ex vivo expansion. Images of proliferating cells. Precursor CD4+ T cells were seeded at 5 × 10⁵ cell/mL and cultivated as described in the Materials and Methods. Proliferation clusters at days 3, 5 and 7 are shown. At nine days of cultivation, the number and size of proliferation clusters decreased. Scale bar 100 µm. (B) Increasing amounts of Tregs during cultivation. Five million initial CD4+ cells were seeded at a concentration of 5 × 10⁵ cells/mL and cultivated as described in the Materials and Methods. The total number of cells was detected by the Trypan Blue exclusion test daily. (C) Viability of cultivated Tregs did not decrease during seven days of transformation. Cell sampling was performed daily during Treg expansion to estimate cell viability using the Trypan blue exclusion test. (D) Measurement of CFSE signal reduction every 24 h within the time of Treg expansion ex vivo. The population of starting CD4+ T cells was labeled with the vital dye CFSE and cultivated according to the protocol for Treg transformation. CD4+ T cells were taken to analyze the reduction in the CFSE signal by flow cytometry every 24 h.
Applsci 11 05776 g001
Figure 2. The expression of Treg markers reached a maximum ratio at day seven of ex vivo expansion. Initial CD4+ cells were cultured for 9 days to develop eTregs. Representative flow cytometry diagrams for cells labeled with the following antibodies: (A) CD25, (C) FoxP3, (E) CD127, (G) Helios, (I) CD152, (K) CD39, (M) CD223. (B,D,F,H,J,L,N) Mean expression of markers within the time of expansion. N = 5. * p ≤ 0.05 vs. initial cells at the 0-day time-point, measured by Bonferroni modification of Student’s t-test.
Applsci 11 05776 g002
Figure 3. The level of TSDR demethylation increases during ex vivo expansion of Tregs. TSDR methylation analysis was performed during the time of cell expansion: (A) Levels of TSDR methylation and demethylation during Treg ex vivo maturation. (B) Mean level of TSDR methylation during Treg expansion. (C) Representative result of demethylation percentage of each CpG site in the TSDR color-coded according to the legend. Each column corresponds to a single CpG site. Absolute coordinates according to the GRCh37/hg19 human genome assembly are indicated. n = 5. * p ≤ 0.05 vs. initial cells at the 0-day time-point.
Applsci 11 05776 g003
Figure 4. Upregulation of telomerase and FoxP3 is associated with the induction of alternative splicing of their mRNA: (A) Induction of total hTERT expression during the time of cell cultivation. (B) Changes in the proportion of hTERT splice variants. (C) Representative TRAP gel electrophoresis demonstrating elevated telomerase activity in Tregs upon maturation. (D) Gradual increase in FoxP3 gene expression during the time course of Treg maturation. (E) Changes in the proportion of FoxP3 splice variants. n = 4. * p ≤ 0.05 vs. initial cells at 0-day time-point. FL, full-length variant. α or β indicates corresponding splice variants (see main text). ∆ indicates the deletion of the relevant exon.
Applsci 11 05776 g004
Figure 5. Expression profiles of IKAROS family zinc finger gene members and their splice variants during the time course of eTreg maturation ex vivo. The expression levels of total (A) IKZF1 (IKAROS), (C) IKZF2 (HELIOS), (E) IKZF3 (AIOLOS), (G) IKZF4 (EOS) and (I) IKZF5 (PEGASUS) in proliferating cells. (B,D,F,H,J) Proportions of corresponding splice variants. n = 4. * p ≤ 0.05 vs. initial cells at 0-day time-point. ∆ indicates the deletion of the relevant exon.
Applsci 11 05776 g005
Figure 6. Cell cycle-associated gene expression in cells during ex vivo expansion. Total mRNA was isolated from cells, and mRNA levels were determined by real-time RT-PCR using the Human Cell Cycle PCR Array. The figure depicts a heat map diagram of gene expression in cells within the time of cultivation. Gene expression levels were normalized relative to the mean expression of four reference genes: 18S, GAPDH, HPRT1 and GUSB. The data are color-coded according to the legend and presented as fold change expression relative to initial cells at the 0-day time point. n = 3.
Applsci 11 05776 g006
Figure 7. Enhanced suppressive activity of eTregs: Representative proliferative diagram of (A) pTregs and (C) eTregs. CFSE-labeled CD4+CD25 responder cells were cocultured with accessory cells and pTregs or eTregs at various ratios. Results are shown as the percentage of proliferated target cells measured by reduction of the CFSE signal using flow cytometry. Neg. ctrl—negative control, CD4+CD25- cells only. Pos. ctrl—positive control, CD4+CD25 cells cocultured with accessory cells. Proliferation index of CD4+CD25- responder cells cocultured with accessory cells and (B) pTregs and (D) eTregs at various ratios. Ctrl—control, CD4+CD25 cells cocultured with accessory cells. n = 5. * p ≤ 0.05 vs. control cells.
Applsci 11 05776 g007
Publisher’s Note: MDPI stays neutral with regard to jurisdictional claims in published maps and institutional affiliations.

