
Silicon Compounds in Sponges
by
 ,
,
Anatoliy L. Drozdov
1,*, 
Lyudmila A. Zemnukhova
2,
Alexandr E. Panasenko
2,
Nataliya V. Polyakova
2,
Arseniy B. Slobodyuk
2,
Alexandr Yu. Ustinov
2,
Nina A. Didenko
2 and
Sergey A. Tyurin
1 1
A.V. Zhirmunsky National Scientific Center of Marine Biology, FEB RAS, St. 17, Palchevsky, 690041 Vladivostok, Russia
2
Institute of Chemistry FEB RAS, 159, pr-t 100-let Vladivostoku, 690022 Vladivostok, Russia
*
Author to whom correspondence should be addressed.
Appl. Sci. 2021, 11(14), 6587; https://doi.org/10.3390/app11146587
Submission received: 31 May 2021
/
Revised: 7 July 2021
/
Accepted: 7 July 2021
/
Published: 17 July 2021
(This article belongs to the Special Issue Advances in Biomimetic Materials 2021)
Abstract
:A comparative study of the microscopic morphology and chemical characteristics of spicules of Hexactinellids (Hexactinellida) with different structural features of the skeletons, as well as the freshwater Baikal sponge belonging to the class of common sponges (Demospongia), was carried out. The trace element composition of sponge spicules was determined by X-ray fluorescence spectrometry. The spicules of siliceous sponges contain many elements, arranged in decreasing order of concentration: Si, Ca, Fe, Cl, K, Zn, and others. It was shown that the surface layer of sea sponges contains mainly carbon (C), oxygen (O), and to a lesser extent nitrogen (N), silicon (Si), and sodium (Na). The spicules of the studied siliceous sponges can be divided into two groups according to the phase composition, namely one containing crystalline calcium compounds and one without them. Analysis of infrared absorption spectra allows us to conclude that the sponges Euplectella aspergillum, E. suberia and Dactylocalyx sp. contain silica partially bound to the organic matrix, while the silica skeleton of the sponges of the other group (Schulzeviella gigas, Sericolophus sp., Asconema setubalense, Sarostegia oculata, Farrea sp. and Lubomirskia baicalensis sp.) practically does not differ from the precipitated SiO2. This comparative study of the chemical composition of the skeletons of marine Hexactinellids and common freshwater sponge allows us to conclude that there are no fundamental differences in the chemical composition of spicules, and all of them can be used as a starting material for creating new composite silicon–organic functional materials.
1. Introduction
The important role of silicon in nature has now been reliably proven [1,2,3,4,5]. In terms of abundance in Earth’s crust, silicon ranks second after oxygen. In it, about 12% is occupied by the mineral–silica compounds based on silicon dioxide (quartz, quartzite, flint, feldspar), as well as silicates and aluminosilicates. In tissues of plants and animals, silicon is in the form of water-soluble compounds such as orthosilicic acid (H2SiO4), orthosilicic esters (R4SiO4, where R is an organic radical), as well as in the form of insoluble mineral polymers formed by polysilicic acids (nSiO2. mH2O) and amorphous silica (SiO2), and crystalline impurities [5]. The viability of all terrestrial organisms at ambient temperature is determined by the stability of cell membranes and the spatial structure of proteins-amino acids linked by peptide bonds (-C (O) NH-) in a certain order. Silicon can bind through the nitrogen atom with proteins, amino acids and amino sugars, and carbohydrates through the formation of the Si-O-C (N) bond; however, the biochemical aspects of silicon metabolism are still poorly understood [5].
Earlier, in the study of silica plants as a source of renewable raw materials for the production of amorphous silicon dioxide, which has a wide area of use depending on the physicochemical characteristics [6,7,8,9,10], we have identified some structural features of silica in samples isolated from different plants: rice, oats, horsetails, needles of larch, spruce, pine, and cedar, which in some parameters turned out to be comparable with the data obtained for the Asconema setubalense sea siliceous sponge [11]. It was interesting to compare the characteristics of plant silica samples with other types of marine and freshwater siliceous sponges.
In modern materials science, studies of natural composite organosilicon biominerals are in demand to create new structural functional biomimetic materials. The remarkable body structure of sea sponges serves as a model for biomimetic structure for tissue engineering applications [12,13,14,15,16,17,18,19,20,21,22,23,24,25]. The most common biomimetic approach, in which the object is previously disassembled into its constituent components. In addition to silicon, chitin and collagen were found in the spicules of the sponges. Then, some of them can be used in a new synthesis, supplemented with other components. Macro and microstructural characteristics of deep-sea sponges serve as bioinspired models for tissue engineering. The first nanostructured 3D composite spongin-atacamite model was created [26,27,28,29,30,31]. Skeletons of glass (Hyalospongia) or six-rayed sponges (Hexactinellida) are considered by many authors as a very promising material for biomimetics [21,22,23,32,33,34,35,36,37]. They have unique physical properties: good elastic light guides with properties of photonic crystals [21,26,33,36,37].
The kingdom of sponges includes about 7000 modern species. Of these, about 600 belong to the class glass sponges (Hyalospongia) or six-rayed sponges (Hexactinellida). They vary greatly in shape, size and age, and their skeletons are extremely diverse: several types can be distinguished (Figure 1).
Earlier, based on spicules of glass sponges, we managed to create both flat and three-dimensional three-dimensional silicon–organic composite material in laboratory conditions without their preliminary destruction [39]. Since the silicon–organic skeletons of six-rayed sponges (Hexactinellida) are very diverse (Figure 1), and in the spicules of ordinary sponges (Demospongia), the silicon–organic rods are surrounded by an extensive clutch of organic material, it was interesting to study the chemical composition of spicules of different organization. The results obtained allow us to conclude that there are no fundamental differences in the chemical composition of spicules, and all of them can be used as a starting material for the creation of new composite silicon–organic functional materials. The same silicon–organic material was found in fossil sponges [40]. Spicules of some species of silicon sponges can be a source for obtaining silicon, chitin and collagen-like material [18,20,21,22,23,24,29,30]. Consequently, natural resources can also be used as a source of technological raw materials. Thus, sponges with different silicon-containing skeletons, along with other marine biomaterials [41], can be valuable raw materials for the creation of biomimetic materials.
The chemical characteristics of silicon spicules from different systematic groups have not been previously studied. Since their morphology can differ significantly, it can be assumed that they have a different chemical composition, which in turn will determine their different physicochemical properties.
The aim of this work was a comparative study of the chemical characteristics of hexactinellid spicules with different structural features of the skeletons, as well as a freshwater Baikal sponge belonging to the common sponge type (Demospongia).
2. Materials and Research Methods
The objects of the study were samples of sea (1–8) and freshwater (9) sponges, presented in Table 1.
In appearance, the skeletons of the studied samples of sea sponges were subdivided into dictional bands, lissacinosan (with a free skeleton and a fused skeleton), farreoid, and small spicules of the Baikal sponge.
3. Research Methods
Elemental analysis. To determine the qualitative microelement composition of the sponges, we used the method of X-ray fluorescence analysis (spectrometers EDX 800 HS (Kyoto, Japan) and TXRF 8030C (Dreieich, Germany)), which makes it possible to perform express analysis of samples in a wide range of determined elements (from Si to U) and content in the sample from 10−4 to 100% of the mass.
The elemental composition of the sample surface and the valence state of the observed atoms from the value of the chemical shift were determined by X-ray photoelectron spectroscopy (XPS) on the SPECS spectral complex (Berlin, Germany) using MgKα radiation.
X-ray phase analysis of the samples was carried out on a DRON-2.0 X-ray diffractometer in Cu Kα radiation. When performing X-ray phase analysis, we used the data of chemical analysis (the presence of chemical elements), which are necessary when using the EVA program with a PDF-2 powder data bank for the identification of substances.
Infrared (IR) absorption spectra of the samples were recorded in the range 400–4000 cm−1 using a Shimadzu FTIR Prestige-21 Fourier spectrometer (Kyoto, Japan) at room temperature. Samples for recording spectra were prepared according to the standard technique by suspending in liquid paraffin or pressing the substance in KBr. Frequency determination accuracy ±1 cm−1.
29Si NMR spectra were recorded on a Bruker Avance AV-300 spectrometer using the magic angle sample rotation (MAS) technique; registration was performed by the method of echo Khan. Tetramethylsilane was used as a reference. The number of accumulations was 1024, the delay between impulses was 60 s.
Differential thermal analysis (DTA). The thermal properties of the samples under study were determined using a derivatograph system F. Paulik, I. Paulik and L. Erdey brand Q-1000 (Mateszalka, Hungary) in air at a temperature of 25–700 °C, with a heating rate of 5 deg/min.
4. Results and Discussion
Morphological feature and the ultrastructure of the spicules by SEM in silicon sponges were studied by many authors [18,20,24,29,30,34,37,38,39]. We only tried to research the comparative chemical composition in sponges with different spicule morphology. Spicules of two types are morphologically distinguished in glass sponges. Some of them are organized as if a cylinder in a cylinder: samples 1 (Schulzeviella gigas spinosum) (Figure 2), 2 (Sericolophus sp.) (Figure 3), 3 (Asconema setubalense) (Figure 4), 4 (Euplectella aspergillum) (Figure 5), 5 (Euplectella suberia) (Figure 6). Spicules of samples 6 (Dactylocalyx sp.) (Figure 7), 7 (Sarostegia oculata) (Figure 8), 8 (Farrea sp.) (Figure 9) show the coalescence of layers into a continuous monolithic aggregate. The spicules of the freshwater common sponge (Classis Demospongia) (sample 9 Lubomirskia baicalensis) from Lake Baikal are small monolithic spicules with a central channel (Figure 10).
4.1. The Elemental Composition
The elemental composition of the sponges was determined by the method of X-ray fluorescence spectrometry, a significant limitation of which is the impossibility of determining light elements (from H to Al), and for the quantitative determination of other elements, either the introduction of an internal standard with the transfer of the sample under study into a solution or the use of standard samples close in composition to objects under study, to build calibration graphs. Due to the small number of samples 1–8 and the absence of standards, it was not possible to quantitatively determine the elements; therefore, in this work, the semiquantitative elemental composition of the sponges under study was determined.
According to the results of the X-ray fluorescence analysis, performed on the TXRF 8030C spectrometer, the sea sponges (samples 1–8) contain the following elements, arranged in decreasing order of concentration: Si, Ca, Fe, Cl, K, Zn, Ti, Cr, Mn, Ni, As, Br, Pb, Cu, Y (traces). However, some specific features were revealed: in the spicules of Schulzeviella gigas spinosum (sample 1), the elements Cu, Pb, Cr and Ni are absent; arsenic (As) was not detected in samples Euplectella suberia (sample 5), Dactylocalyx sp. (sample 6) and Sarostegia oculata (sample 7), and chromium in Asconema setubalense (sample 3) and Farrea sp. (sample 8). The highest calcium (Ca) concentration was recorded in spicules of Dactylocalyx sp. (sample 6), and zinc (Zn)—in spicules of Euplectella aspergillum (sample 4). The nature of these features is not yet clear.
Analysis of the composition of the inorganic part of the skeleton of the common freshwater sponge 9 showed a similarity with sea sponges. The main element of sample 9 is silicon, but there are no elements characteristic of marine organisms: chlorine (Cl), bromine (Br), arsenic (As), and manganese (Mn).
The surface composition of sponge spicules was studied by X-ray photoelectron spectroscopy XPS for two samples—2 (Sericolophus sp.) And 7 (Sarostegia oculata). As follows from the analysis of X-ray photoelectron spectra (Table 2), the surface layer (~30 Å thick) of sample 7 contains mainly carbon (C), oxygen (O), to a lesser extent nitrogen (N), silicon (Si), and sodium (Na). Most of the observed carbon is, according to the values of the binding energy (Eb, Eb), of an aliphatic nature; the rest is in a more oxidized state. Oxygen (O) is partly part of hydroxyl groups, partly part of silicon dioxide (SiO2) and sodium oxide (Na2O). The oxidation state of silicon is +4. A noticeable content of nitrogen in the surface layer is also observed. XPS spectra of sample No. 2, the state of the elements and their content are similar to those described above.
4.2. X-ray Phase Analysis
X-ray phase analysis of samples 1–9 (Figure 11, Table 3) showed that the compounds included in their composition are in the amorphous (1, 2, 7, 9) and mixed amorphous state with the presence of the crystalline phases (3–8). Sponges differ in the composition of the crystalline phase. Therefore, halite was found only in 3, quartz—in 4 and 8. At the same time, sample 4, in addition to quartz, also contains another phase of silica—tridymite. Samples 4–6 contain calcium carbonate in different structural forms—in the form of calcite and aragonite. Cationically mixed calcium and magnesium carbonates (magnesian calcite) are present in samples 3–6. Zinc oxide was recorded only in sample 4. The data obtained agree with the results of elemental analysis.
Thus, the studied siliceous sponges by phase composition can be divided into two groups: containing calcium compounds (3–6) and not (1, 2, 7, 8, 9). The first group of sponges has an amorphous-crystalline state, the second is amorphous, except for sample 8, the crystalline phase of which corresponds to the presence of quartz.
4.3. Infrared (IR) Absorption Spectra
IR spectra of all studied sponge samples (Figure 12) are united by the presence of absorption bands characteristic of deposited silicon dioxide: 3289–3399 ν (O–H), 1630–1660 δ (O–H), 1090–1099 νas (Si–O–Si), 953–964 δ (Si–OH), 797–799 δ (Si–O–Si), 465–471 δ (Si–O–Si) [12,13,14]. At the same time, several differences are observed in the spectra, according to which the samples can be divided into two groups.
The first group includes samples 4, 5, and 6. A feature of their IR spectra is the presence of absorption bands in the region close to the absorption bands of petroleum jelly: ~1480 δas (CH3), δ (CH2) and ~1420 cm−1 δs (CH3), as well as bands at 876–878 and 856–858 cm−1, characteristic of vibrations of the Si–C bond, for example, in the Si–CH2 and Si–CH3 groups [15,16,17].
The second group includes samples of sponges 1, 2, 3, 7, 8, 9, the IR spectra of which in the range of 400–4000 cm–1 are practically identical to the spectrum of deposited amorphous SiO2·H2O, as in [11,12,13,14]. Apparently, this is due to the low content of organic matter relative to the silica skeleton.
The IR spectrum of the freshwater sponge Lubomirskia baicalensis (sample 9) is distinguished separately. A set of absorption bands 3289 ν (N–H), 1660 δ (N–H) and 1537 δ (N–H) + ν (C–N) (the “Amide II” band is a position characteristic of primary amides [15]) allows us to speak unambiguously about the high content of peptides.
Thus, the analysis of IR spectra allows us to conclude that the sponges of the first group (4–6) contain silica (SiO2), partially bound to the organic matrix, while the silica skeleton of the sponges of the second group (1–3, 7–9) practically does not differ from the precipitated SiO2. At the same time, a high content of peptides is identified in the spectrum of a freshwater sponge.
4.4. 29Si NMR Spectra
The 29Si NMR spectrum (Figure 13) was studied for sea sponge 3, which, according to XRD data, is in an X-ray amorphous state, in comparison with the spectra of amorphous silica samples (Table 4) obtained from rice husks by oxidative firing (SiO2, sample 1 *) and by precipitation from an alkaline hydrolyzate of husk (SiO2·nH2O, sample 2 *) [11], and reagent SiO2·nH2O obtained from mineral raw materials (sample 4 *).
The IR absorption spectrum of sea sponge 3 (Figure 12) is identical to the spectra of precipitated silica 2 * and 4 * [11] and indicates the presence in all samples of siloxane Si–O–Si (467, 797, 1092–1098 cm−1), silanol Si–OH bonds (957 cm–1) and OH groups (3182–3650 and ~1630–1640 cm–1), in contrast to the spectrum of sample 1 * [11], in which there are no vibrations of Si–OH and OH bonds.
The 29Si NMR spectra of the studied samples (Figure 3, Table 4) contain signals with a chemical shift (CS) equal to −112 ppm. and −102 ppm. (the latter, as a rule, in the form of a shoulder), which correspond to the SiO4 and SiO3OH groups), according to [26]. In samples 1 *, 2 *, 4 * and, possibly, in sample 3, there is also a weak signal with CS − 93 ppm, corresponding to the SiO2 (OH)2 group. The use of the Khan echo technique [26] makes it possible to obtain undistorted ratios of the concentrations of groups, based on the integral intensities of the components (Table 4). Sample 1 * has the highest content of the basic substance (SiO2).
Thus, the analysis of the 29Si NMR spectra shows that in the sea sponge sample (3), silicon is mainly as in the form of silicon dioxide SiO2, as in the sample 2 * precipitated from rice husk, and partially as in the samples 1 * and 4 * state of silicon corresponds to polysilicic acid SiO2·nH2O.
4.5. Thermal Properties
The thermal behavior of siliceous sponges was studied for two samples—1 and 9. Analysis of thermograms (Figure 14) shows that the decomposition of these samples in the region of 25–700 °C proceeds in three stages with some peculiarities, which will be considered in more detail.
Decomposition of sample 1 (Figure 4a), weight—130 mg. At the first stage (25–180 °C), water is removed and, probably, some organic component. The weight loss in this temperature range is 3.1%.
At the second stage (180–500 °C), first, thermal oxidative destruction occurs (above 180 °C), and at 410 and 440 °C there is a pronounced stepwise decomposition of individual inorganic compounds against the background of thermal oxidative destruction of organic substances. The decomposition temperatures suggest the presence of Mg(OH)2 in the sample under study, the decomposition of which occurs at 410 °C into MgO and H2O, and Ca(OH)2, which decomposes at 440 °C into CaO and H2O.
At the third stage (500–700 °C), the carbonated residue burns out at a maximum rate at 540 °C. The mass of the mineral residue is 88.5%.
The color of the residue is gray, irregular, with white needles. X-ray phase analysis of the remainder of sample 1 shows that it is X-ray amorphous (interplanar distance 3.96 Å), and the IR absorption spectrum (maxima of absorption bands (cm−1) at 470, 584, 798, 1103) corresponds to the spectrum of amorphous silica SiO2 obtained thermally, as, for example, sample 1 * in Table 4. Elemental analysis performed on a Shimadzu EDX 800 HS spectrometer confirms the formation of anhydrous silicon dioxide when sample 1 is heated to 700 °C. Thus, the content of water and organic components in sample 1 is 11.5%, and the content of the mineral residue is 88.5%.
Decomposition of sample 9 (Figure 4b), weight—130 mg. At the first stage (25–160 °C), the sample is dehydrated at a maximum rate at 80 °C. The endothermic effect is observed on the differential thermal curve (DTA). Above 80 °C, a broad, mild exo effect begins, accompanying the process of protein denaturation (decomposition), according to [27]. The mass loss is 7.7%, which is almost 2.5 times greater than during the decomposition of sea sponge 1.
At the second stage (160–390 °C), thermal oxidative destruction of protein components begins above 160 °C with a maximum rate at 260 and 290 °C. On DTA, this process is accompanied by an exo effect (shoulder at 290 °C and at 330 °C). Above 330 °C, thermal oxidative destruction of the formed new organic products and their carbonization occur, which proceeds up to about 390 °C. An inflection is observed on the TG weight loss curve. The total loss in the mass of volatile products at 390 °C is 36.2%, which is much higher than during the decomposition of sample 1.
At the third stage (390–700 °C), the decomposition of the carbonated residue above 390 °C occurs, which is accompanied on the DTA curve by a broad intense exothermic effect with maxima at 490, 550, and 630 °C. The total weight loss at 700 °C is 61.9%. The mass of the mineral residue is 38.1%, which is 2.4 times less than in the decomposition of sample 1.
The color of the residue is light gray, uniform. According to the X-ray phase analysis data, the residue, as with sample 1, is in the X-ray amorphous state, but with a slightly different position of the maximum of the amorphous peak (interplanar distance 4.00 Å). The IR absorption spectrum with the maxima of absorption bands (cm−1) at 470, 574, 800, 1099 is comparable with the spectrum of the residue of sample 1 and, as with the elemental analysis data, indicates the formation of anhydrous amorphous silica. Further heating of the remainder of sample 9 to 1000 °C for three hours showed that amorphous silica only partially crystallizes with the formation of tridymite and cristobalite phases (Figure 15b). In this case, weak bands are observed in the IR absorption spectrum in the region 586–611 cm−1.
Thus, the nature of the thermal decomposition of sea and freshwater sponges in the region of 25–700 °C is similar to each other. The composition of the final product is anhydrous amorphous silicon dioxide, but their mass varies significantly, which is associated with the content of organic substances, which are much more in the freshwater sponge.
5. Conclusions
Using X-ray fluorescence analysis, it has been showed that the following elements are contained in sea sponges (samples 1–8, in decreasing order of concentration): Si, Ca, Fe, Cl, K, Zn, Ti, Cr, Mn, Ni, As, Br, Pb, Cu, Y (traces) with interspecies variations. Freshwater sponge Lubomirskia baicalensis (sample 9) has similar composition of the skeleton, but it also contains silicon as the main element, but there are no elements characteristic of marine skeletal sponges: chlorine (Cl), bromine (Br), arsenic (As) and manganese (Mn). From this it follows that there are no fundamental differences in the elemental composition of the studied skeletons of glass (six-rayed) sponges (Hexactinellida) and common (Demospongia).
The surface of the studied spicules contains mainly carbon, oxygen, to a lesser extent nitrogen, silicon, and sodium. This indicates that in the body of the sponges, the spicules are surrounded by cells, which, when dried, turn out to be represented by dry organic matter. In the freshwater sponge Lubomirskia baicalensis, a large amount of nitrogen, a derivative of a significant amount of organic matter contained in the spicules, was found on the surface of the spicules. It surrounds a central rod formed by a silicon–organic composite material.
X-ray phase analysis of the samples showed that the compounds included in the skeletons are in the amorphous state or amorphous mixed with crystalline phases of calcium compounds or quartz. The IR spectra of all sponge samples studied indicate that the sponges contain silica partially associated with an organic matrix, or silica of itself. Meanwhile, according to 29Si NMR data, silicon is in the form of silicon dioxide SiO2, or polysilicic acid SiO2·nH2O.
Author Contributions
Conceptualization, A.L.D.; methodology, A.E.P.; investigation, A.L.D., N.V.P., A.B.S., A.Y.U., N.A.D. and S.A.T.; writing—original draft preparation, A.L.D.; writing—review and editing, A.L.D., A.E.P. and S.A.T.; project administration, L.A.Z. All authors have read and agreed to the published version of the manuscript.
Funding
This research received no external funding.
Institutional Review Board Statement
The study did not involve humans or animals.
Conflicts of Interest
The authors declare no conflict of interest.
References
- Voronkov, M.G.; Zelchan, G.I.; Lukevits, E.Y. Silicium und Leben. Biochemie, Toxikologie und Farmakologie der Verbindungen des Silicium; Akad. Verlag: Berlin, Germany, 1975; 587p. [Google Scholar]
- Voronkov, M.G.; Kuznetsov, I.G. An Amazing Element of Life; Vostochno-Sibirskoe Izd.: Irkutsk, Russian, 1983; p. 107. (In Russian) [Google Scholar]
- Voronkov, M.G.; Kuznetsov, I.G. Silicon in Nature; Science: Novosibirsk, Russian, 1984; 157p. [Google Scholar]
- Voronkov, M.G.; Baryshok, V.P. The influence of silatranes on the physiological functions of animals and birds. Rossiysk. khimich. zhurnal. 2005, 49, 86–94. [Google Scholar]
- Kolesnikov, M.P. Forms of silicon in plants. Adv. Biol. Chem. 2001, 41, 301–332. [Google Scholar]
- Sergienko, V.I.; Zemnukhova, L.A.; Egorov, A.G.; Shkorina, E.D.; Vasilyuk, N.S. Renewable sources of chemical raw materials: Integrated processing of rice and buckwheat production waste. Ros. Chem. J. Ros. Chem. Soc. 2004, XLVIII, 116–124. [Google Scholar]
- Zemnukhova, L.A.; Egorov, A.G.; Fedorishcheva, G.A.; Barinov, N.N.; Sokolnitskaya, T.A.; Botsul, A.I. Properties of amorphous silica produced from rice and oat processing waste. Inorg. Mater. 2006, 42, 24–29. [Google Scholar] [CrossRef]
- Zemnukhova, L.A.; Babushkina, T.A.; Ziatdinov, A.M.; Kholomeydik, A.N. Impurity paramagnetic centers Fe (III) and Mn (II) centers in samples of amorphous silica of different origin. J. Appl. Chem. 2012, 85, 1011–1016. [Google Scholar] [CrossRef]
- Zemnukhova, L.A.; Nikolenko, Y.M. Study of rice husks and products of its processing by X-ray photoelectron spectroscopy. Russ. J. Gen. Chem. 2011, 81, 694–700. [Google Scholar] [CrossRef]
- Zemnukhova, L.A.; Panasenko, A.E.; Artem’yanov, A.P.; Tsoy, E.A. Dependence of porosity of amorphous silicon dioxide prepared from rice straw on plant variety. BioResources 2015, 10, 3713–3723. [Google Scholar] [CrossRef] [Green Version]
- Zemnukhova, L.A.; Kholomeydik, A.N.; Slobodyuk, A.B. 29Si NMR spectra of amorphous silicon dioxide samples of different genetics. Abstracts of reports. In XVII International Scientific and Technical Conference "Priority Directions of Development of Science and Technology”; Publishing house Innovative technologies: Tula, Russian, 2015; pp. 40–43. (In Russian) [Google Scholar]
- Vlasova, A.G.; Florinskaya, V.A. (Eds.) Infrared Spectra of Inorganic Glasses and Crystals; Chemistry: Leningrad, Russian, 1972; 304p. [Google Scholar]
- Ocana, M.; Fornes, V.; Serna, C.J. The variability of the infrared powder spectrum of amorphous SiO2. J. Non-Cryst. Solids 1982, 107, 187–192. [Google Scholar] [CrossRef]
- Ocana, M.; Fornes, V.; Garcia-Ramos, J.V.; Serna, C.J. Polarization effects in the infrared spectra of α-quartz and α-cristobalite. Phys. Chem. Mater. 1987, 14, 527–532. [Google Scholar]
- Tarasevich, B.N. IR Spectra of the Main Classes of Organic Compounds; Lomonosov Moscow University: Moscow, Russian, 2012; 55p. (In Russian) [Google Scholar]
- Pretsch, E.; Bullmann, P.; Affolter, C. Structure Determination of Organic Compounds; (Tables of Spectra data); Mir: Moscow, Russian, 2006; 438p. (In Russian) [Google Scholar]
- Silverstein, R.; Webster, F.; Kiml, D. Spectrometric Identification of Organic Compounds; Binom: Moscow, Russian, 2011; 557p. (In Russian) [Google Scholar]
- Xu, A.; Ma, Y.; Colfen, H. Biomimetic mineralization. J. Mater. Chem. 2007, 17, 415–449. [Google Scholar] [CrossRef]
- Ehrlich, H.; Ereskovsky, A.V.; Drozdov, A.; Krylova, D.; Hanke, T.; Meissner, H.; Heinemann, S.; Worch, H. A modern approach to demineralisation of spicules in the glass sponges (Hexactinellida: Porifera) for the purpose of extraction and examination of the protein matrix. Russ. J. Mar. Biol. 2006, 32, 186–193. [Google Scholar] [CrossRef]
- Ehrlich, H.; Deutzmann, R.; Brunner, E.; Cappellini, E.; Koon, H.; Solazzo, C.; Yang, Y.; Ashford, D.; Thomas-Oates, J.; Lubeck, M.; et al. Mineralization of the metre-long biosilica structures of glass sponges is templated on hydroxylated collagen. Nat. Chem. 2010, 2, 1084–1088. [Google Scholar] [CrossRef] [PubMed]
- Ehrlich, H.; Maldonado, M.; Parker, A.R.; Kulchin, Y.N.; Schilling, J.; Köhler, B.; Skrzypczak, U.; Simon, P.; Reiswig, H.M.; Tsurkan, M.V.; et al. Supercontinuum Generation in Naturally Occurring Glass Sponges Spicules. Adv. Opt. Mater. 2016, 4, 1608–1613. [Google Scholar] [CrossRef] [Green Version]
- Ehrlich, H.; Wysokowski, M.; Żółtowska-Aksamitowska, S.; Petrenko, I.; Jesionowski, T. Collagens of poriferan origin. Mar. Drugs 2018, 16, 79. [Google Scholar] [CrossRef] [Green Version]
- Ehrlich, H. Enigmatic structural protein spongin. In Marine Biological Materials of Invertebrate Origin; Gorb, S.N., Ed.; Springer: Cham, Switzerland, 2019; pp. 161–170. [Google Scholar]
- Sanchez, C.; Arribart, H.; Guille, M.M.G. Biomimetism and bioinspiration as tools for the design of innovative materials and systems. Nat. Mater. 2005, 4, 277–288. [Google Scholar] [CrossRef]
- Nudelman, F.; Sommerdijk, N.A. Biomineralization as an inspiration for materials chemistry. Angew. Chem. Int. Ed. 2012, 51, 6582–6596. [Google Scholar] [CrossRef]
- Chevalier, Y.; Grillet, A.; Rahmi, M.-I.; Liere, C.; Masure, M.; Hemery, P.; Babonneau, F. The structure of porous silica-polysiloxane hybrid materials. Mater. Sci. Eng. 2002, 21, 143–150. [Google Scholar] [CrossRef]
- Lyubarev, A.E.; Kurganov, B.I. Study of irreversible thermal denaturation of proteins by differential scanning calorimetry. Adv. Biol. chem. 2000, 40, 43–84. [Google Scholar]
- Ehrlich, H.; Worch, H. Sponges as natural composites: From biomimetic potential to development of new biomaterials. In Porifera Research: Biodiversity, Innovation and Sustainability; Museu Nacional: Rio de Janeiro, Brasil, 2007; pp. 217–223. ISBN 978-85-7427-023-4. [Google Scholar]
- Wysokowski, M.; Jesionowski, T.; Ehrlich, H. Biosilica as a source for inspiration in biological materials science. Am. Mineral. 2018, 103, 665–691. [Google Scholar] [CrossRef]
- Szatkowski, T.; Wysokowski, M.; Lota, G.; Pęziak, D.; Bazhenov, V.V.; Nowaczyk, G.; Walter, J.; Molodtsov, S.L.; Stöcker, H.; Himcinschi, C.; et al. Novel nanostructured hematite-spongin composite developed using an extreme biomimetic approach. RSC Adv. 2015, 5, 79031–79040. [Google Scholar] [CrossRef] [Green Version]
- Szatkowski, T.; Siwínska-Stefánska, K.; Wysokowski, M.; Stelling, A.L.; Joseph, Y.; Ehrlich, H.; Jesionowski, T. Immobilization of titanium(IV) oxide onto 3D spongin scaffolds of marine sponge origin according to extreme biomimetics principles for removal of C.I. basic blue 9. Biomimetics 2017, 2, 4. [Google Scholar] [CrossRef] [Green Version]
- Aizenberg, J.; Sundar, V.C.; Yablon, A.D.; Weaver, J.C.; Chen, G. Biological glass fibers: Correlation between optical and structural properties. Proc. Natl. Acad. Sci. 2004, 101, 3358–3363. [Google Scholar] [CrossRef] [Green Version]
- Müller, W.E.G.; Grachev, M.A. Biosilica in Evolution, Morphogenesis, and Nanobiotechnology: Case Study Lake Baikal; Springer Science & Business Media: Berlin/Heidelberg, Germany, 2009; p. 421. [Google Scholar]
- Drozdov, A.L.; Andreykin, N.A.; Dorofeev, A.G. Structure and physico-chemical properties of organosilicon ike composite spicules of the glass sponge Hyalonema sieboldi. Mater. Res. Bull. 2018, 105, 372–376. [Google Scholar] [CrossRef]
- Monn, M.A.; Weaver, J.C.; Zhang, T.; Aizenberg, J.; Kesari, H. New functional insights into the internal architecture of the laminated anchor spicules of Euplectella aspergillum. Proc. Natl. Acad. Sci. USA 2015, 112, 4976–4981. [Google Scholar] [CrossRef] [Green Version]
- Fernandes, M.C.; Aizenberg, J.; Weaver, J.C.; Bertoldi, K. Mechanically robust lattices inspired by deep-sea glass sponges. Nat. Mater. 2020, 20, 237–241. [Google Scholar] [CrossRef]
- Kulchin, Y.N.; Bukin, O.A.; Voznesenskii, S.S.; Galkina, A.N.; Gnedenkov, S.V.E.; Drozdov, A.L.; Kuryavyi, V.G.; Mal’tseva, T.L.; Nagornyi, I.G.; Sinebryukhov, S.L.; et al. Optical fibres based on natural biological minerals—sea sponge spicules. Quantum Electron. 2008, 38, 51–55. [Google Scholar] [CrossRef]
- Drozdov, A.L.; Tabachnik, K.P.; Eckert, K.; Tyurin, S.A. The organization of the skeleton and the typology of the axial channels of the axial filaments of spicules in glass sponges. In Perspektivnyye Napravleniya Razvitiya Nanotekhnologiy v DVO RAN; Inst. Avtom. Prots. Uprav., Dal’nevost. Otd. Ross. Akad. Nauk: Vladivostok, Russian, 2009; Volume 2, pp. 87–99. (In Russian) [Google Scholar]
- Karpenko, A.A.; Drozdov, A.L. Skeletons of Glass Sponges as a Substrate for Creating Functional Composite Organosilicon Materials. J. Mat. App. 2019, 8, 20–27. [Google Scholar] [CrossRef]
- Drozdov, A.L.; Zhuravlev, A.Y.; Karpenko, A.A.; Kolesnikov, K.A.; Ivantsov, A.Y. Morphology and chemical composition of siliceous spicules from an early Cambrian sponge. Russ. J. Mar. Biol. 2021, 47, 6, in press. [Google Scholar]
- Khrunyk, Y.; Lach, S.; Petrenko, I.; Ehrlich, H. Progress in Modern Marine Biomaterials Research. Mar. Drugs 2020, 18, 589. [Google Scholar] [CrossRef]
- Mónica, A. Avaliação da Importância, Potencial e Constrangimentos da Designação do Banco Gorringe como Sítio de Interesse Comunitário. Master’s Thesis, Universidade de Lisboa, Lisboa, Portugal, 2014. [CrossRef]
- Gebruk, A.V.; Priede, I.G.; Fenchel, T.; Uiblein, F. Benthos of the sub-polar front area on the Mid-Atlantic Ridge: Results of the ECOMAR project. Mar. Biol. Res. 2013, 9, 443–446. [Google Scholar] [CrossRef] [Green Version]
- Van Soest, R.W.M.; Meesters, E.H.W.G.; Becking, L.E. Deep-water sponges (Porifera) from Bonaire and Klein Curaçao, Southern Caribbean. Zootaxa 2014, 3878, 401–443. [Google Scholar] [CrossRef] [Green Version]
- Hajdu, E.; Castello-Branco, C.; Lopes, D.A.; Paulo, S.Y.G.; Perez, J.A.A. Deep-sea dives reveal an unexpected hexactinellid sponge garden on the Rio Grande Rise (SW Atlantic). A mimicking habitat? Deep Sea Res. Part II Trop. Stud. Oceanogr. 2017, 146, 93–100. [Google Scholar] [CrossRef]
- MarineE-Tech Research Expedition Blog. Available online: http://marinee-tech.blogspot.com/2018/11 (accessed on 8 May 2021).
- Farrea, nr. Occa Erecta. Available online: https://www.ncei.noaa.gov/waf/okeanos-animal-guide/Farreidae015.html (accessed on 8 May 2021).
- Boury-Esnault, N.; Vacelet, J.; Dubois, M.; Goujard, A.; Fourt, M.; Perez, T.; Chevaldonne, P. New hexactinellid sponges from deep Mediterranean canyons. Zootaxa 2017, 4236, 118–134. [Google Scholar] [CrossRef] [PubMed]
- Ereskovsky, A.V.; Chernogor, L.I.; Belikov, S.I. Ultrastructural description of development and cell composition of primmorphs in the endemic Baikal sponge Lubomirskia baicalensis. Zoomorph 2016, 135, 1–17. [Google Scholar] [CrossRef]
Figure 1.
Types of skeletons of Hexactinellids: 1, 4—dictional strand, 2—farreoid, 3—euretoid, 5—aulocalicoid, 6—lychninisskosan, 7—fieldingioid, 8/9—lissacinosan (8—free skeleton, 9—fused form of free skeleton), 10—skeleton of the basal lamina, 11—skeleton of the base (pedoncle) (after [38]).
Figure 1.
Types of skeletons of Hexactinellids: 1, 4—dictional strand, 2—farreoid, 3—euretoid, 5—aulocalicoid, 6—lychninisskosan, 7—fieldingioid, 8/9—lissacinosan (8—free skeleton, 9—fused form of free skeleton), 10—skeleton of the basal lamina, 11—skeleton of the base (pedoncle) (after [38]).

Figure 2.
Schulzeviella gigasspinosum. Morphological feature (a) and the ultrastructure of the spicules by SEM (b,c). Scale: (a)—10 cm, (b)—400 μ, (c)—4 μ.
Figure 2.
Schulzeviella gigasspinosum. Morphological feature (a) and the ultrastructure of the spicules by SEM (b,c). Scale: (a)—10 cm, (b)—400 μ, (c)—4 μ.

Figure 3.
Sericolophus sp. Morphological feature (a,b) and the ultrastructure of the spicules by SEM (c,d). Scale: (a)—10 cm, (b)—5 cm, (c)—600 μ, (d)—10 μ.
Figure 3.
Sericolophus sp. Morphological feature (a,b) and the ultrastructure of the spicules by SEM (c,d). Scale: (a)—10 cm, (b)—5 cm, (c)—600 μ, (d)—10 μ.

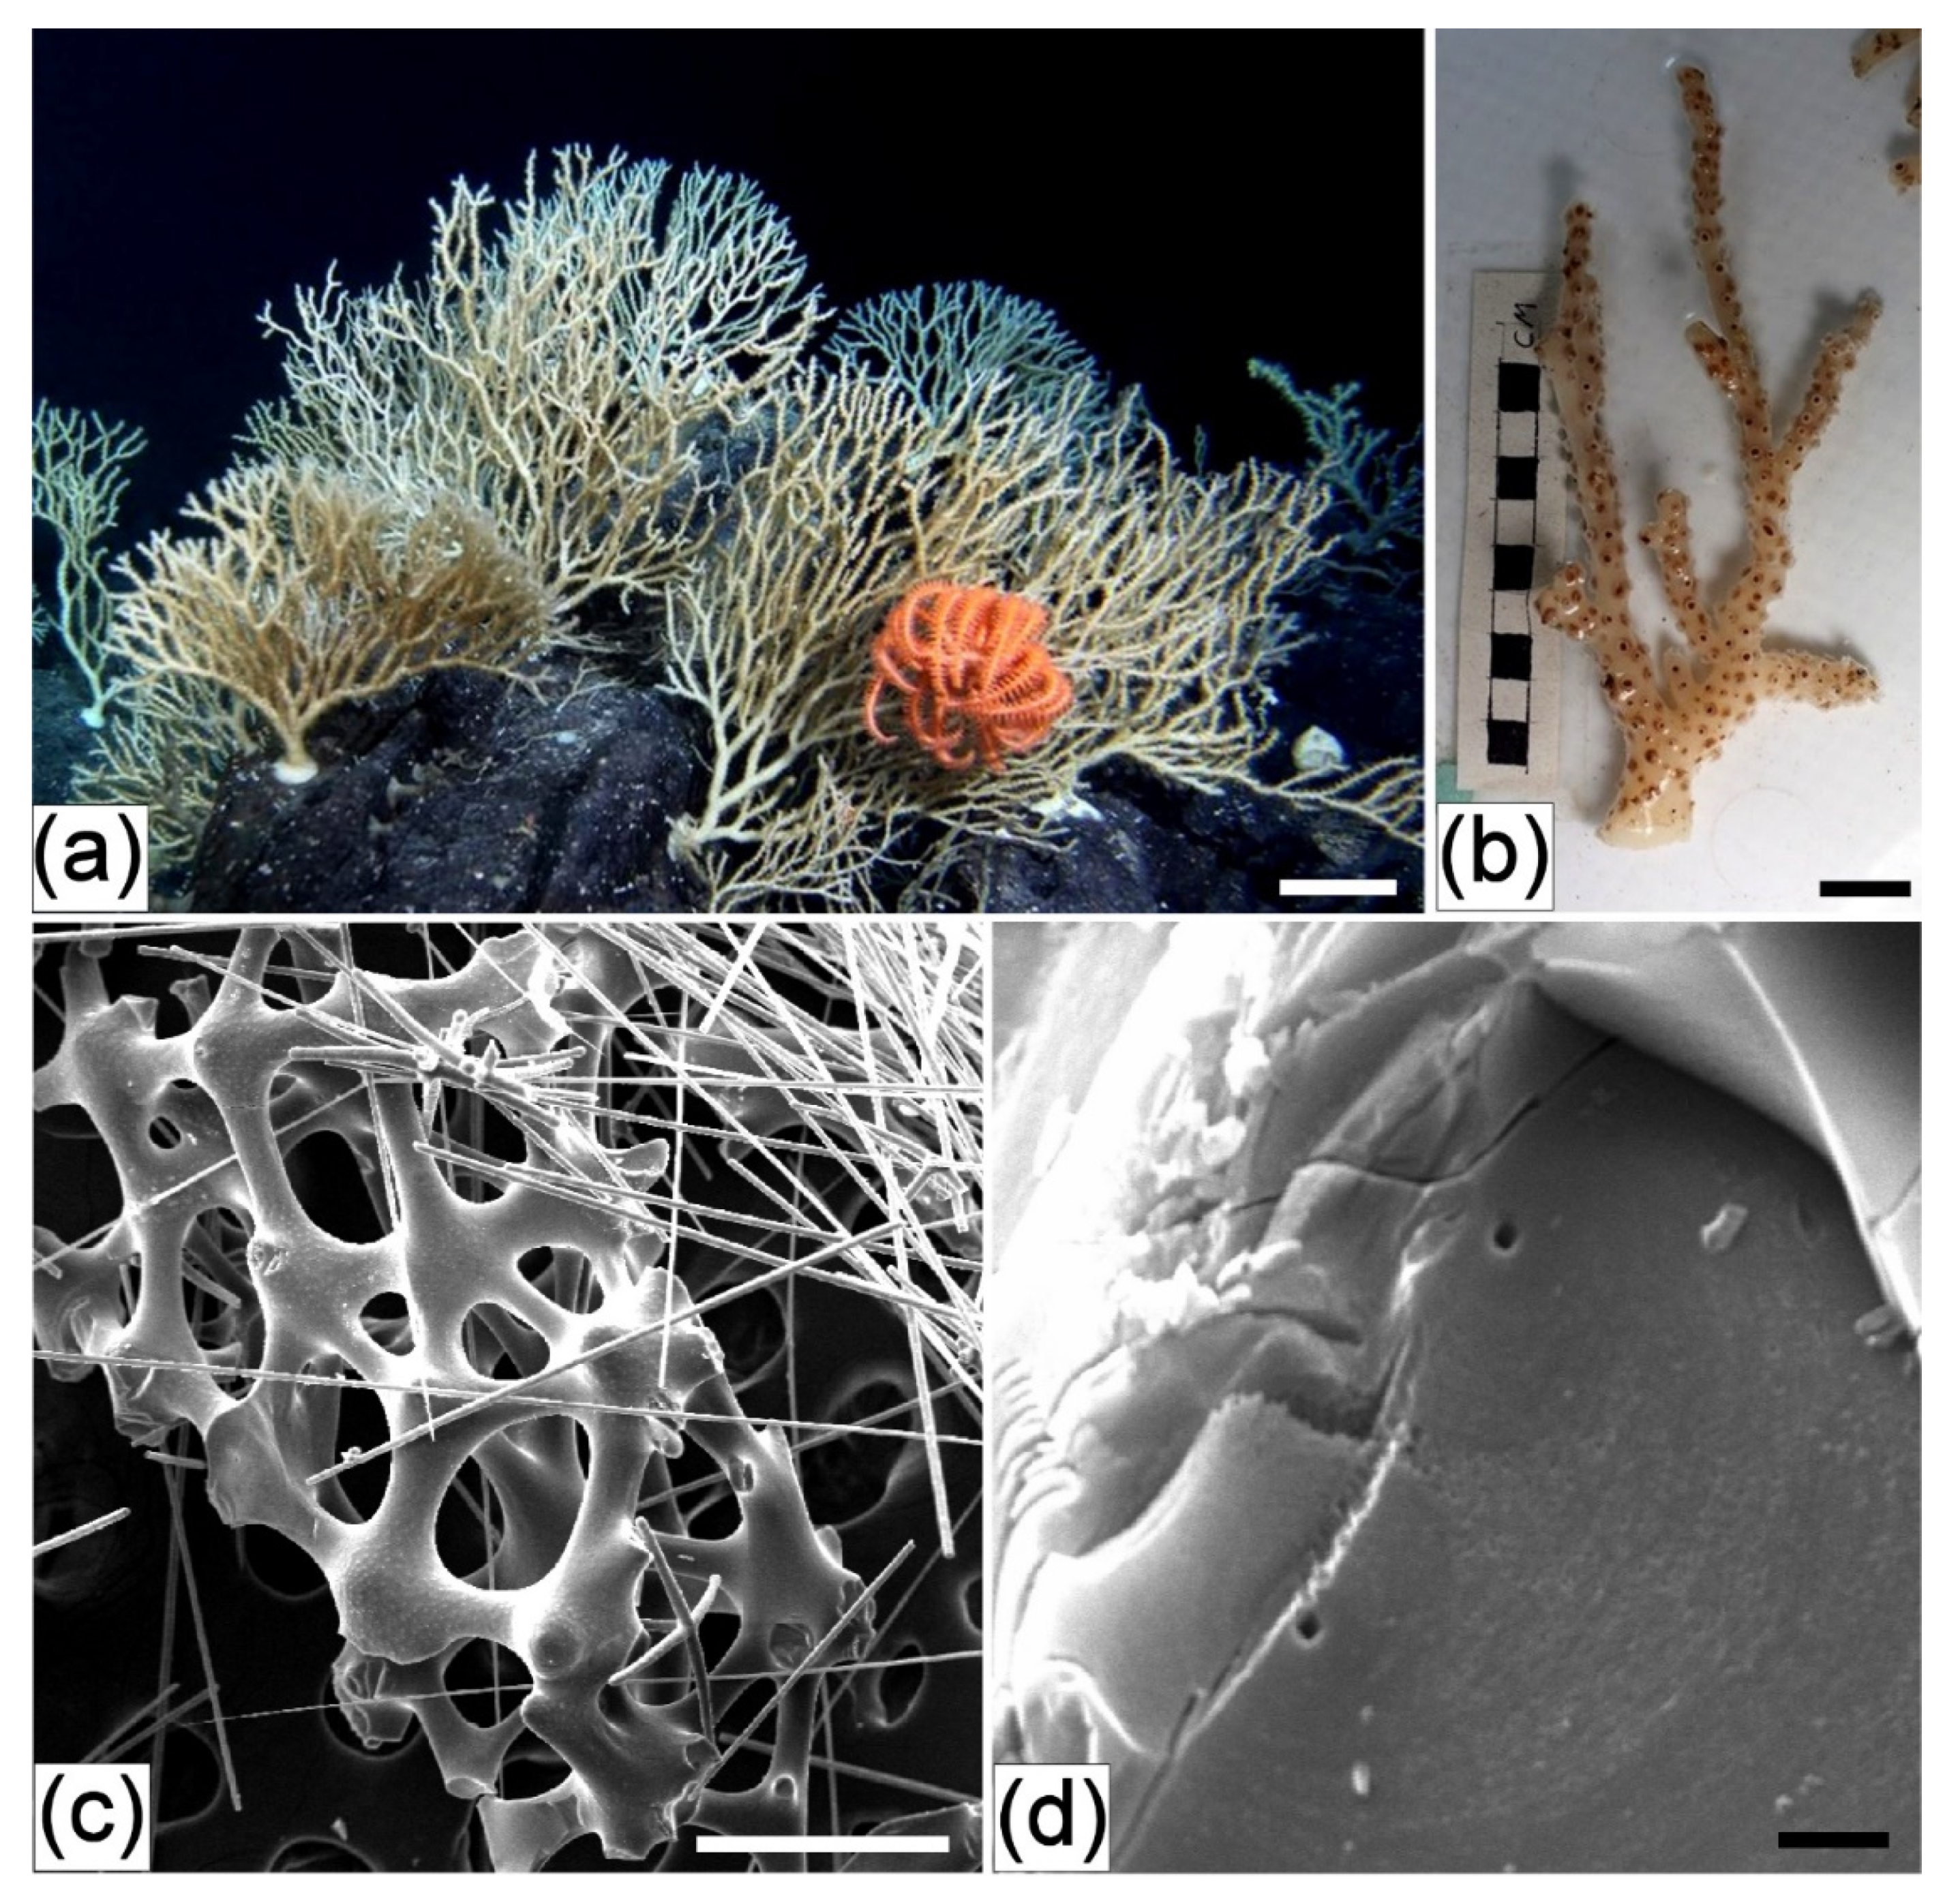
Figure 4.
Asconema setubalense. Morphological feature (a), dry felt (b), and the ultrastructure of the spicules by SEM (c,d). Scale: (a)—40 cm, (b)—30 mm, (c)—600 μ, (d)—20 μ.
Figure 4.
Asconema setubalense. Morphological feature (a), dry felt (b), and the ultrastructure of the spicules by SEM (c,d). Scale: (a)—40 cm, (b)—30 mm, (c)—600 μ, (d)—20 μ.

Figure 5.
Euplectella aspergillum. Morphological feature (a) and the ultrastructure of the spicules by SEM (b,c). Scale: (a)—2 cm, (b)—600 μ, (c)—6 μ.
Figure 5.
Euplectella aspergillum. Morphological feature (a) and the ultrastructure of the spicules by SEM (b,c). Scale: (a)—2 cm, (b)—600 μ, (c)—6 μ.

Figure 6.
Euplectella suberea. Morphological feature (a) and the ultrastructure of the spicules by SEM (b,c). Scale: (b)—2 mm, (c)—20 μ.
Figure 6.
Euplectella suberea. Morphological feature (a) and the ultrastructure of the spicules by SEM (b,c). Scale: (b)—2 mm, (c)—20 μ.

Figure 7.
Dactylocalyx sp. Morphological feature (a) and the ultrastructure of the spicules by SEM (b,c). Scale: (a)—2 cm, (b)—200 μ, (c)—4 μ.
Figure 7.
Dactylocalyx sp. Morphological feature (a) and the ultrastructure of the spicules by SEM (b,c). Scale: (a)—2 cm, (b)—200 μ, (c)—4 μ.

Figure 8.
Sarostegia oculata. Morphological feature (a,b) and the ultrastructure of the spicules by SEM (c,d). Scale: (a)—10 cm, (b)—2 cm, (c)—400 μ, (d)—4 μ.
Figure 8.
Sarostegia oculata. Morphological feature (a,b) and the ultrastructure of the spicules by SEM (c,d). Scale: (a)—10 cm, (b)—2 cm, (c)—400 μ, (d)—4 μ.

Figure 9.
Farrea sp. Morphological feature (a) and the ultrastructure of the spicules by SEM (b,c). Scale: (a)—4 cm, (b)—60 µ, (c)—20 µ.
Figure 9.
Farrea sp. Morphological feature (a) and the ultrastructure of the spicules by SEM (b,c). Scale: (a)—4 cm, (b)—60 µ, (c)—20 µ.

Figure 10.
Lubomirskia baicalensis. Morphological feature (a,b) and the ultrastructure of the spicules by SEM (c–f). Scale: (a)—15 cm, (b)—2 cm, (c)—40 μ, (d)—20 μ, (e)—20 μ, (f)—10 μ.
Figure 10.
Lubomirskia baicalensis. Morphological feature (a,b) and the ultrastructure of the spicules by SEM (c–f). Scale: (a)—15 cm, (b)—2 cm, (c)—40 μ, (d)—20 μ, (e)—20 μ, (f)—10 μ.

Figure 11.
X-ray diffractograms of the studied samples (numbers according to Table 1).
Figure 11.
X-ray diffractograms of the studied samples (numbers according to Table 1).

Figure 12.
FTIR spectra of the studied samples (numbers according to Table 1, R—reagent silicic acid aqueous GOST 4214-78).
Figure 12.
FTIR spectra of the studied samples (numbers according to Table 1, R—reagent silicic acid aqueous GOST 4214-78).

Figure 13.
NMR 29Si spectra: 1 and 2 are silica samples obtained from rice husk via thermal treatment and chemical precipitation correspondingly; 3—according to Table 1; 4—reagent silicic acid aqueous GOST 4214-78.
Figure 13.
NMR 29Si spectra: 1 and 2 are silica samples obtained from rice husk via thermal treatment and chemical precipitation correspondingly; 3—according to Table 1; 4—reagent silicic acid aqueous GOST 4214-78.

Figure 14.
Thermograms of the samples 1 (a) and 9 (b) (numbers according to Table 1).
Figure 14.
Thermograms of the samples 1 (a) and 9 (b) (numbers according to Table 1).

Figure 15.
X-Ray diffraction pattern (a) and FTIR spectrum (b) of the residue after thermal treatment at 1000 °C the Lubomiskia baicalensis sponge (sample 9); (c) FTIR spectrum of the amorphous SiO2 of plant origin (Table 4).
Figure 15.
X-Ray diffraction pattern (a) and FTIR spectrum (b) of the residue after thermal treatment at 1000 °C the Lubomiskia baicalensis sponge (sample 9); (c) FTIR spectrum of the amorphous SiO2 of plant origin (Table 4).


Table 1.
Samples of the investigated sponges.
| № * Samples | Class | Family | Species | Skeleton Type | Figure | Source |
|---|---|---|---|---|---|---|
| 1 | Hexactinellida | Pheronematidae | Schulzeviella gigas spinosum | Dictional strands | 2 | Orig. |
| 2 | Sericolophus sp. | Dictional strands | 3 | [21] | ||
| 3 | Rossellidae | Asconema setubalense | Dictional strands | 4 | [39,42] | |
| 4 | Euplectellida | Euplectella aspergillum | Dictional strands and lissacinosan | 5 | [35] | |
| 5 | Euplectella suberia | Dictional strands and lissacinosan | 6 | [43] | ||
| 6 | Dactylocalycidae | Dactylocalyx sp. | Lissacinosan | 7 | [44] | |
| 7 | Farreidae | Sarostegia oculata | Lissacinosan | 8 | [45,46] | |
| 8 | Farrea sp. | Pharreoid | 9 | [47,48] | ||
| 9 | Demospongiae | Lubomirskiidae | Lubomirskia baicalensis | Small spicules | 10 | [49] |
* Further in the text this numbering of the studied samples is used. Samples taken from collections of A.V. Zhirmunsky National Scientific Center of Marine Biology, FEB RAS, Vladivostok 690041, St.17, Palchevsky, Russia; P.P. Shirshov Institute of Oceanology, RAS, 117997, Moscow, Nakhimovsky Avenue, Russia; G.B. Elyakov Pacific Institute Bioorganic Chemistry FEB RAS, Russia.
Table 2.
Analysis data of X-ray photoelectron spectra.
| Sample No. According to Table 1 Element Content, % | O | N | C | Si | Na |
|---|---|---|---|---|---|
| 2 | 23.4 | n/d | 69.4 | 5.4 | 1.8 |
| 7 | 26.9 | 7.0 | 60.9 | 3.2 | 2.0 |
Table 3.
Results of X-ray phase analysis.
| Sample No According to Table 1 | Sample Status | Composition of the Crystal Phase |
|---|---|---|
| 1 (Schulzeviella gigas) | Amorphous | |
| 2 (Sericolophus sp.) | Amorphous | |
| 3 (Asconema setubalense) | Amorphous-crystalline | Halite (NaCl), magnesian calcite (Mg0.1CaO0.9CO3) |
| 4 (Euplectella aspergillum) | Tridymite (SiO2), quartz (SiO2), aragonite (CaCO3), calcite (CaCO3), magnesian calcite (Mg0.129CaO0.871CO3), zinc oxide (ZnO) | |
| 5 (Euplectella suberia) | Calcite (CaCO3), magnesian calcite (Mg0.129CaO0.871CO3), aragonite (CaCO3) | |
| 6 (Dactylocalyx sp.) | Calcite (CaCO3), magnesian calcite (Mg0.06CaO0.94CO3), aragonite (CaCO3) | |
| 7 (Sarostegia oculata) | Amorphous | |
| 8 (Farrea sp.) | Amorphous-crystalline | quartz (SiO2) |
| 9 (Lubomirskia baicalensis) | Amorphous |
Table 4.
Values of chemical shift (CS) and concentration (I) of silicon groups.
| Sample | Source, Silicon Dioxide Production Scheme | Q2 (SiO2(OH)2) | Q3 (SiO3OH) | Q4 (SiO4) | |||
|---|---|---|---|---|---|---|---|
| CS, ppm | I, % | CS, ppm | I, % | CS, ppm | I, % | ||
| 1 * | RH, scheme 1, 650 °C | - | n/f * | −103 | 8 | −112 | 91 |
| 2 * | RH, scheme 3 | −93 | 3 | −103 | 29 | −112 | 68 |
| 3 | Marine siliceous sponge Asconema setubalense | – | n/f | −103 | 30 | −112 | 70 |
| 4 * | Reagent “Water silicon acid” GOST 4214-78 | −93 | 9 | −102 | 33 | −111 | 58 |
* n/f—not found; RH (rice husk).
Publisher’s Note: MDPI stays neutral with regard to jurisdictional claims in published maps and institutional affiliations. |
© 2021 by the authors. Licensee MDPI, Basel, Switzerland. This article is an open access article distributed under the terms and conditions of the Creative Commons Attribution (CC BY) license (https://creativecommons.org/licenses/by/4.0/).
Share and Cite
MDPI and ACS Style
Drozdov, A.L.; Zemnukhova, L.A.; Panasenko, A.E.; Polyakova, N.V.; Slobodyuk, A.B.; Ustinov, A.Y.; Didenko, N.A.; Tyurin, S.A. Silicon Compounds in Sponges. Appl. Sci. 2021, 11, 6587. https://doi.org/10.3390/app11146587
AMA Style
Drozdov AL, Zemnukhova LA, Panasenko AE, Polyakova NV, Slobodyuk AB, Ustinov AY, Didenko NA, Tyurin SA. Silicon Compounds in Sponges. Applied Sciences. 2021; 11(14):6587. https://doi.org/10.3390/app11146587
Chicago/Turabian StyleDrozdov, Anatoliy L., Lyudmila A. Zemnukhova, Alexandr E. Panasenko, Nataliya V. Polyakova, Arseniy B. Slobodyuk, Alexandr Yu. Ustinov, Nina A. Didenko, and Sergey A. Tyurin. 2021. "Silicon Compounds in Sponges" Applied Sciences 11, no. 14: 6587. https://doi.org/10.3390/app11146587
Note that from the first issue of 2016, this journal uses article numbers instead of page numbers. See further details here.