Article

Overvoltage Prevention and Curtailment Reduction Using Adaptive Droop-Based Supplementary Control in Smart Inverters

1
Department of Electrical and Computer Engineering, North Dakota State University, Fargo, ND 58102, USA
2
Sandia National Laboratory, Albuquerque, NM 87123, USA
3
Department of Computer and Electrical Engineering and Computer Science, Florida Atlantic University, Boca Raton, FL 33431, USA
4
Pacific Northwest National Laboratory, Richland, WA 99354, USA
5
Department of Electrical Engineering and Computer Science, South Dakota State University, Brookings, SD 57007, USA
*
Author to whom correspondence should be addressed.
Appl. Sci. 2021, 11(17), 7900; https://doi.org/10.3390/app11177900
Submission received: 30 June 2021 / Revised: 13 August 2021 / Accepted: 17 August 2021 / Published: 27 August 2021
(This article belongs to the Special Issue Advancements for Large Scale Adoption of Smart-Inverters)

Abstract

:
Recent developments in the renewable energy sector have seen an unprecedented growth in residential photovoltaic (PV) installations. However, high PV penetration levels often lead to overvoltage problems in low-voltage (LV) distribution feeders. Smart inverter control such as active power curtailment (APC)-based overvoltage control can be implemented to overcome these challenges. The APC technique utilizes a constant droop-based approach which curtails power rigidly, which can lead to significant energy curtailment in the LV distribution feeders. In this paper, different variations of the APC technique with linear, quadratic, and exponential droops have been analyzed from the point-of-view of energy curtailment for a LV distribution network in North America. Further, a combinatorial approach using various droop-based APC methods in conjunction with adaptive dynamic programming (ADP) as a supplementary control scheme has also been proposed. The proposed approach minimizes energy curtailment in the LV distribution network by adjusting the droop gains. Simulation results depict that ADP in conjunction with exponential droop reduces the energy curtailment to approximately 50% compared to using the standard linear droop.

1. Introduction

Renewable energy sources (RES) have extended the capability of the grid to fulfill an ever-increasing load demand. The benefits of RES are reduced cost of energy production, increased generation capacity, reduction in energy curtailment, and improved voltage profile across the feeder [1]. However, inconsistency of photovoltaics (PV) generation accounts for numerous challenges in low voltage (LV) distribution networks [2]. Some of these challenges are sustained power interruptions, voltage regulation, harmonics, and voltage sags [3]. Smart inverters with appropriate control strategies can tackle these challenges to increase the profitability from RES like PV in LV grids.
Voltage regulation describes the ability of a system to maintain constant voltage under different load conditions. According to American National Standards Institute (ANSI) C84.1-2016 [4], voltage standards for service voltage limits are classified as Range A and Range B limits. The voltage between 0.950 p.u. and 1.050 p.u. of nominal voltage lies under Range A, and the voltage between 0.917 p.u. and 1.058 p.u. of nominal voltage for 240 V service voltage lies under Range B. Note that the voltage can be within Range B for only a short duration and frequency, and thus corrective measures are necessary to constrict the voltage level within Range A limits. When the voltage is subjected to beyond Range B, overvoltage conditions exists in the LV distribution network. Furthermore, the voltage limits usually provided for distributed generation (DG) protection spans from 0.88 p.u. to 1.10 p.u. of nominal voltage. Even though the feeder voltage surpasses Range B (1.058 p.u.), DG protection is not enabled unless voltage exceeds 1.10 p.u. This scenario leads to overvoltage conditions in the LV feeder. Even if the protection is enabled for voltages below 1.10 p.u., it results in complete outage of the given DG, which is undesirable. In such cases, overvoltage in the system causes high power consumption by the load, increase in transformer losses, and high power dissipation in induction machines [5]. Recent revisions in IEEE 1547 standard [6], smart inverter functions like Volt-Var and Volt-Watt control have been encouraged to mitigate the overvoltage problem. These functions controls active and reactive power for reducing voltage at the point of interconnection of DG.
In the literature, overvoltage in distribution systems has been dealt with different methods such as expanding the conductor size of the feeder, using voltage regulators, modification of the taps of LV transformers [7], integration of energy storage systems (ESSs) like batteries [8,9,10], and inverter control approaches like Volt-Watt (active power curtailment (APC)) and Volt-Var (reactive power compensation) methods [11,12,13,14,15,16]. Prior research has merged reactive power compensation with additional methods for overvoltage prevention [17,18] which tends to be expensive, increases losses in the system, and requires communication links between controllers. Using reactive power compensation, higher transformer and distribution system losses were reported in [19,20] compared to droop-based APC control in LV feeders. Overvoltage control from smart inverters using droop-based APC approach (Volt-Watt control) has been studied in residential feeders with high PV penetration in [21] and small-scale wind turbines in [22]. In the APC-based method, smart inverters curtail power locally to deal with overvoltage issues. A constant droop coefficient is set in this approach to control the voltage for worst condition. However, this leads to forced curtailment that reduces the power injection by PV inverters during irrelevant situations. To overcome this constrained curtailment, Wang et al. [23] proposed power control method by continuously predicting the bounds of active power to frequently calculate the droop values. Furthermore, Alyami et al. [24] proposed adaptively adjusting the curtailment for maintaining the voltage under bounds along with maximizing PV generation. The non-adaptability of droop-based voltage control has also been identified in many studies [25,26]. Most of these literature works only use a linear droop function and do not investigate some other droop function apart from linear droop. Moreover, unlike conventional droop techniques, adjusting droop values based on irradiance and/or loading conditions can limit the curtailment compared to constant droop-based techniques.
In this work, we propose a machine learning-based method named supplementary adaptive dynamic programming (ADP) controller to adjust the droop gains. The ADP is utilized for generating a supplementary signal that adjusts the droop value to minimize curtailment. In addition, the droop value is changed by small values based on the supplementary signal so that the system remains relatively stable and does not deviate from its normal operation. The control framework designed with ADP assists in establishing a robust and optimal control concurrently by solving the Hamilton–Jacobi–Bellman equations of optimal control iteratively using the reinforcement learning concept [27]. Similar techniques have been endorsed to tackle different power systems problems [28,29,30,31,32,33]. A preliminary study on implementation of APC method with constant droop and ADP control on a simplified distribution model has been presented in [34,35]. In this paper, we extend the ADP controller to quadratic and exponential droops on a typical suburban network in North America. The test system has been modeled for low-voltage PV clusters with solar irradiance profile as input. The controller will be tested in more complex benchmarks with a greater number of houses in different configurations as part of our future work.
The main contributions of the paper are twofold: First, we aim to study the impacts of different droop functions in APC-based inverter control for LV distribution networks with PV. Second, we aim to design the APC-based smart inverter control with different droop models and ADP as a supplementary controller for overvoltage prevention for reduced curtailment in the LV distribution network. The control methods are further compared on its outcome on overvoltage prevention, curtailed energy, and power curtailment. The paper is organized as follows: the control formulation of inverter based APC control and the proposed method with supplementary control are presented in Section 2. The description of the test system and base case scenario are given in Section 3. Section 4 presents the results and the conclusions are described in Section 6.

2. Control Formulation and Design

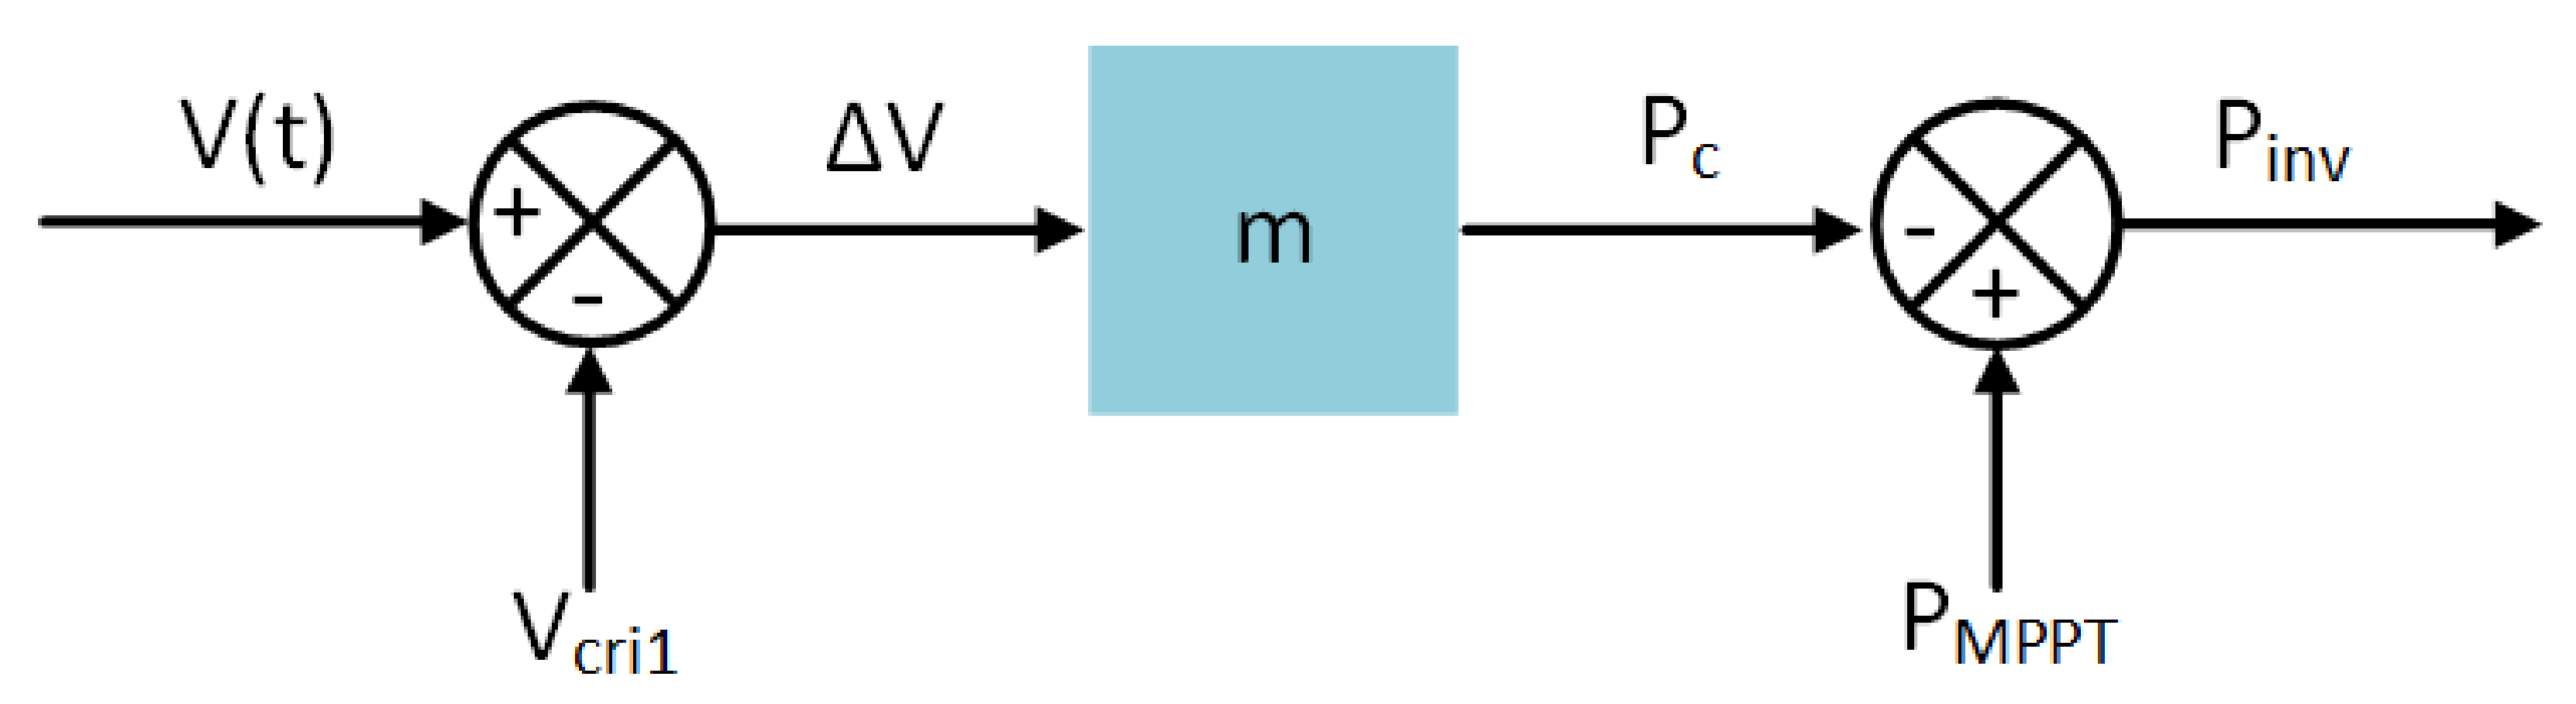
2.1. Droop Control for Active Power Curtailment

Overvoltage prevention using APC technique is more effective in comparison to reactive power compensation in LV distribution feeders [36]. Droop-based algorithms are well known for coordinating power curtailment in PV inverters to prevent overvoltage without any form of communication between those PV inverters [21]. Figure 1 illustrates how a droop-based controller works. The main objective of the controller in this work is to limit the voltage below the upper limit of Range B voltage denoted as V c r i 2 (1.058 p.u. of nominal voltage) and to curtail the power after the voltage exceeds the upper limit of Range A voltage, denoted as V c r i 1 (1.05 p.u. of nominal voltage). The power injected by the smart PV inverter P i n v into the grid with droop-based control is calculated using
P i n v = P M P P T m × m a x { 0 , V ( t ) V c r i 1 }
where P M P P T is maximum PV power output for a particular solar irradiance (kW), m is represented as droop coefficient (kW/V), and V ( t ) is measured voltage at point of connection (POC) of the PV with the LV feeder at time t. When the voltage at POC, V ( t ) operates in normal limits (Range A), i.e., V ( t ) < V c r i 1 , at that time the total PV generation is injected into the LV network, i.e., P i n v = P M P P T . When V ( t ) operates beyond the normal limits, i.e., V ( t ) > V c r i 1 , then PV power injected to LV feeder is reduced by a droop factor based on (1). During this condition, the power curtailment P c is calculated using
P c = P M P P T P i n v .
The droop coefficient obtained from (1) is a constant value, and the power curtailment occurs in a linear fashion with the droop coefficient as the slope of the function, as shown in Figure 2. As the voltage at POC exceeds V c r i 1 (1.050 p.u.), the droop-based APC begins to curtail PV power injection, until the voltage reaches V c r i 2 (1.058 p.u.), where maximum curtailment occurs. The same logic can be summarized using values in per unit form. When the voltage difference at the POC ( Δ V ) is 0, there is no power curtailment. Similarly, when the voltage difference at the POC ( Δ V ) is 0.008 p.u., the power curtailment is 1 p.u. Similarly, a set of Δ V and power curtailment values were created and used to obtain different functions by analytically solving the quadratic and exponential functions to have minimum and maximum curtailment at V c r i 1 and V c r i 2 , respectively. The quadratic droop and exponential droop function are given by (3) and (4), respectively.
P c , q u a d = 1.52 × 10 4 ( Δ V ) 2
P c , e x p = 0.00516 e 650 ( Δ V )

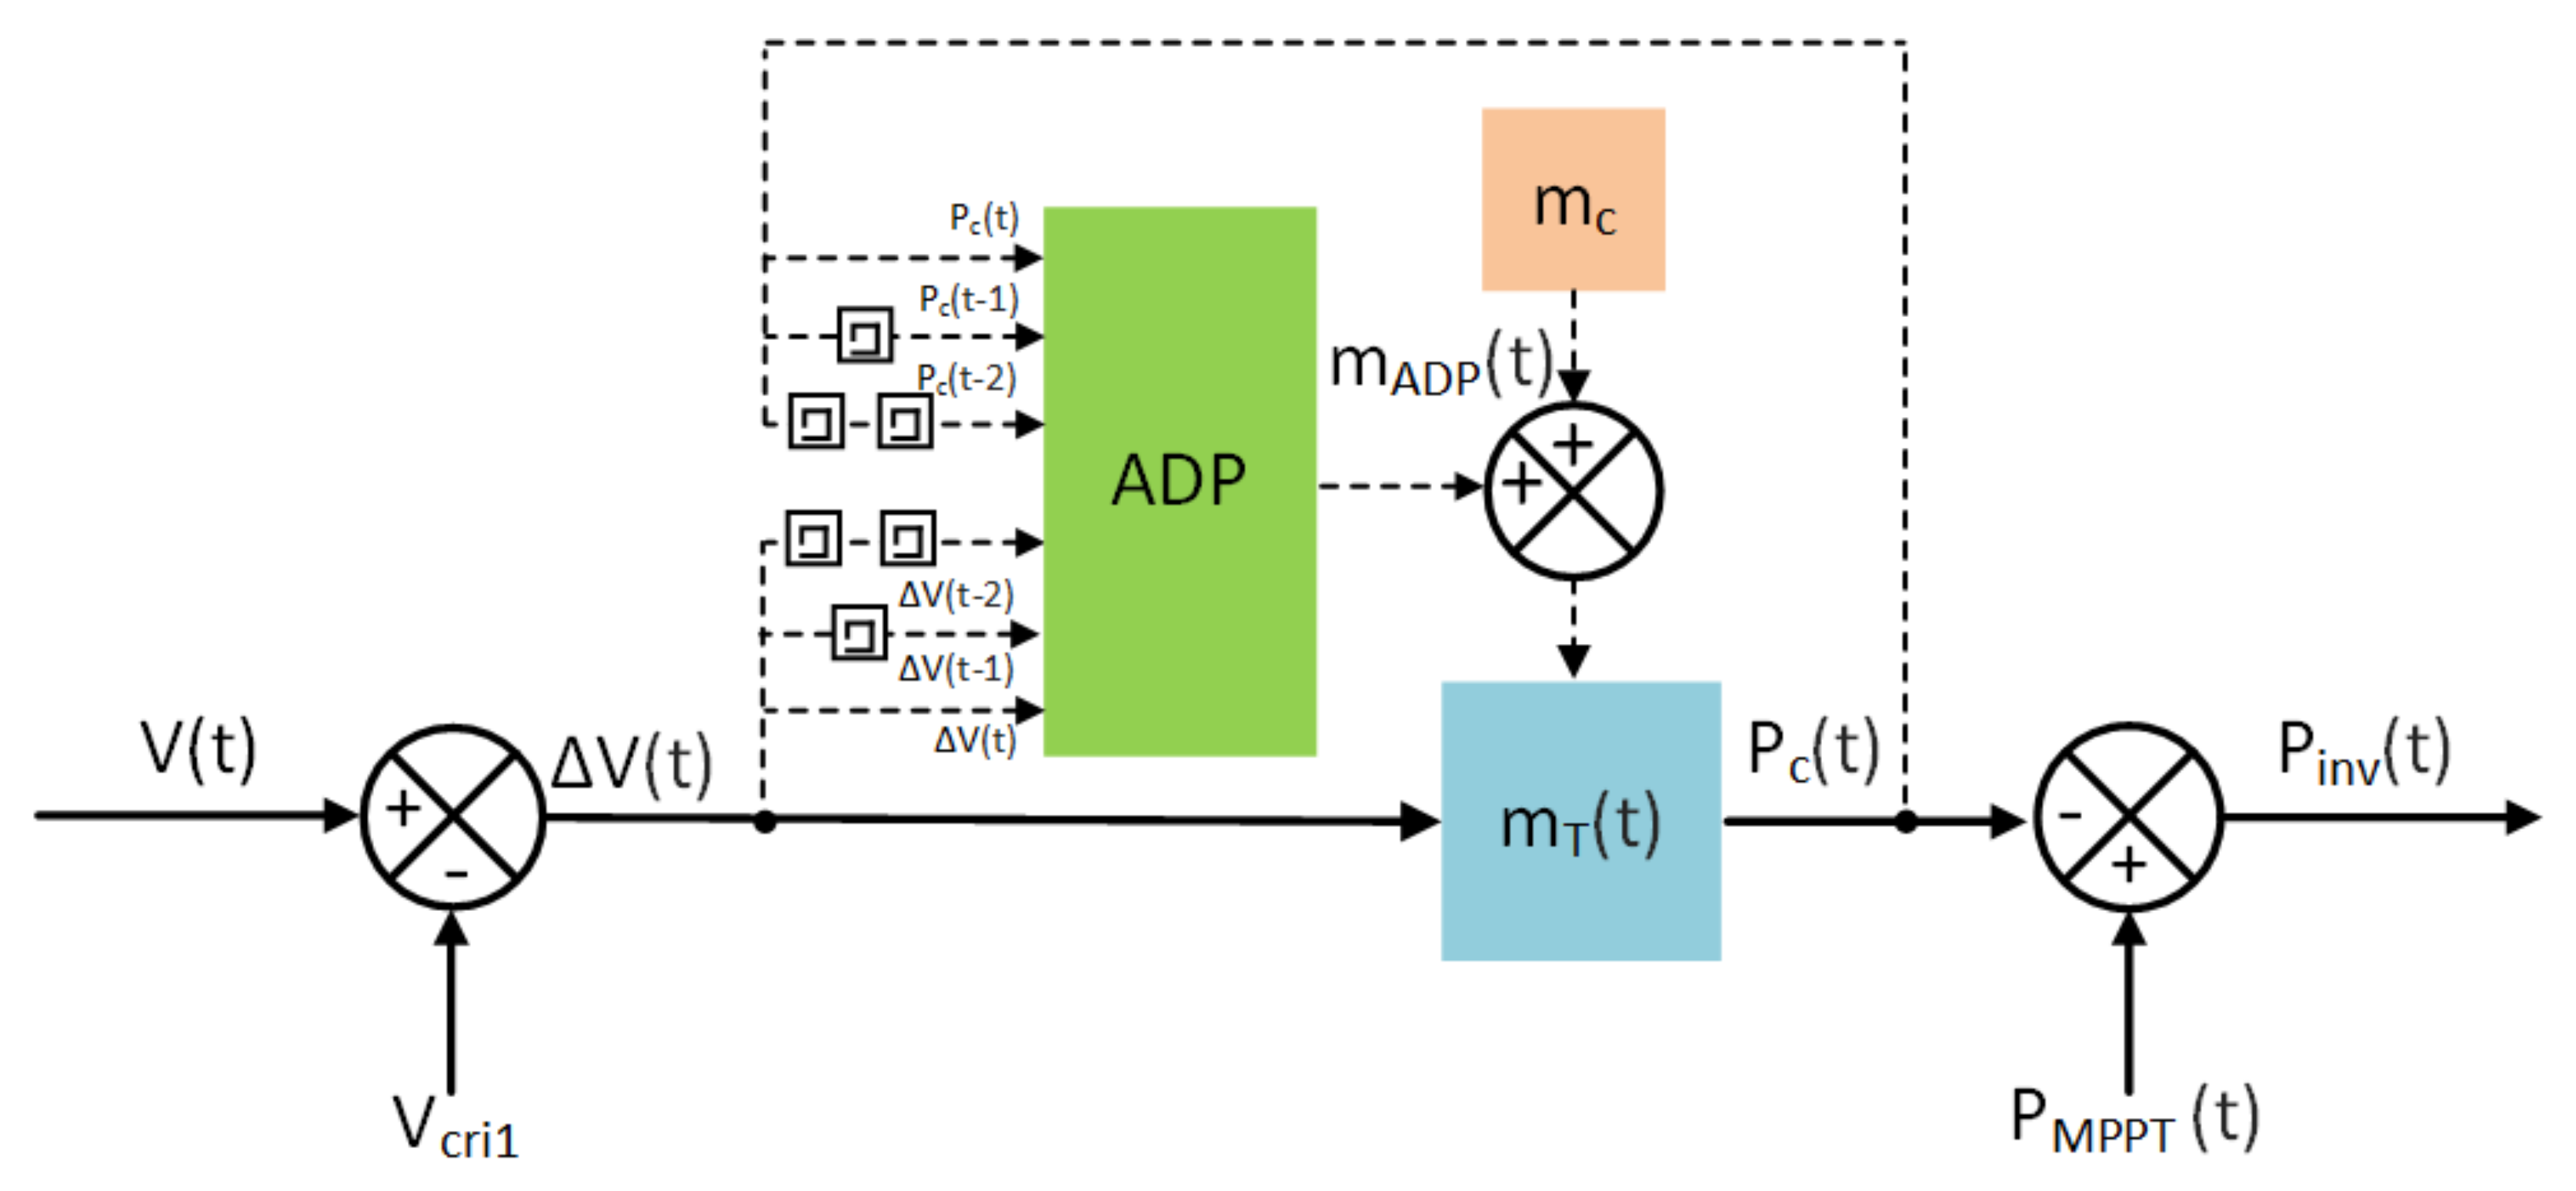
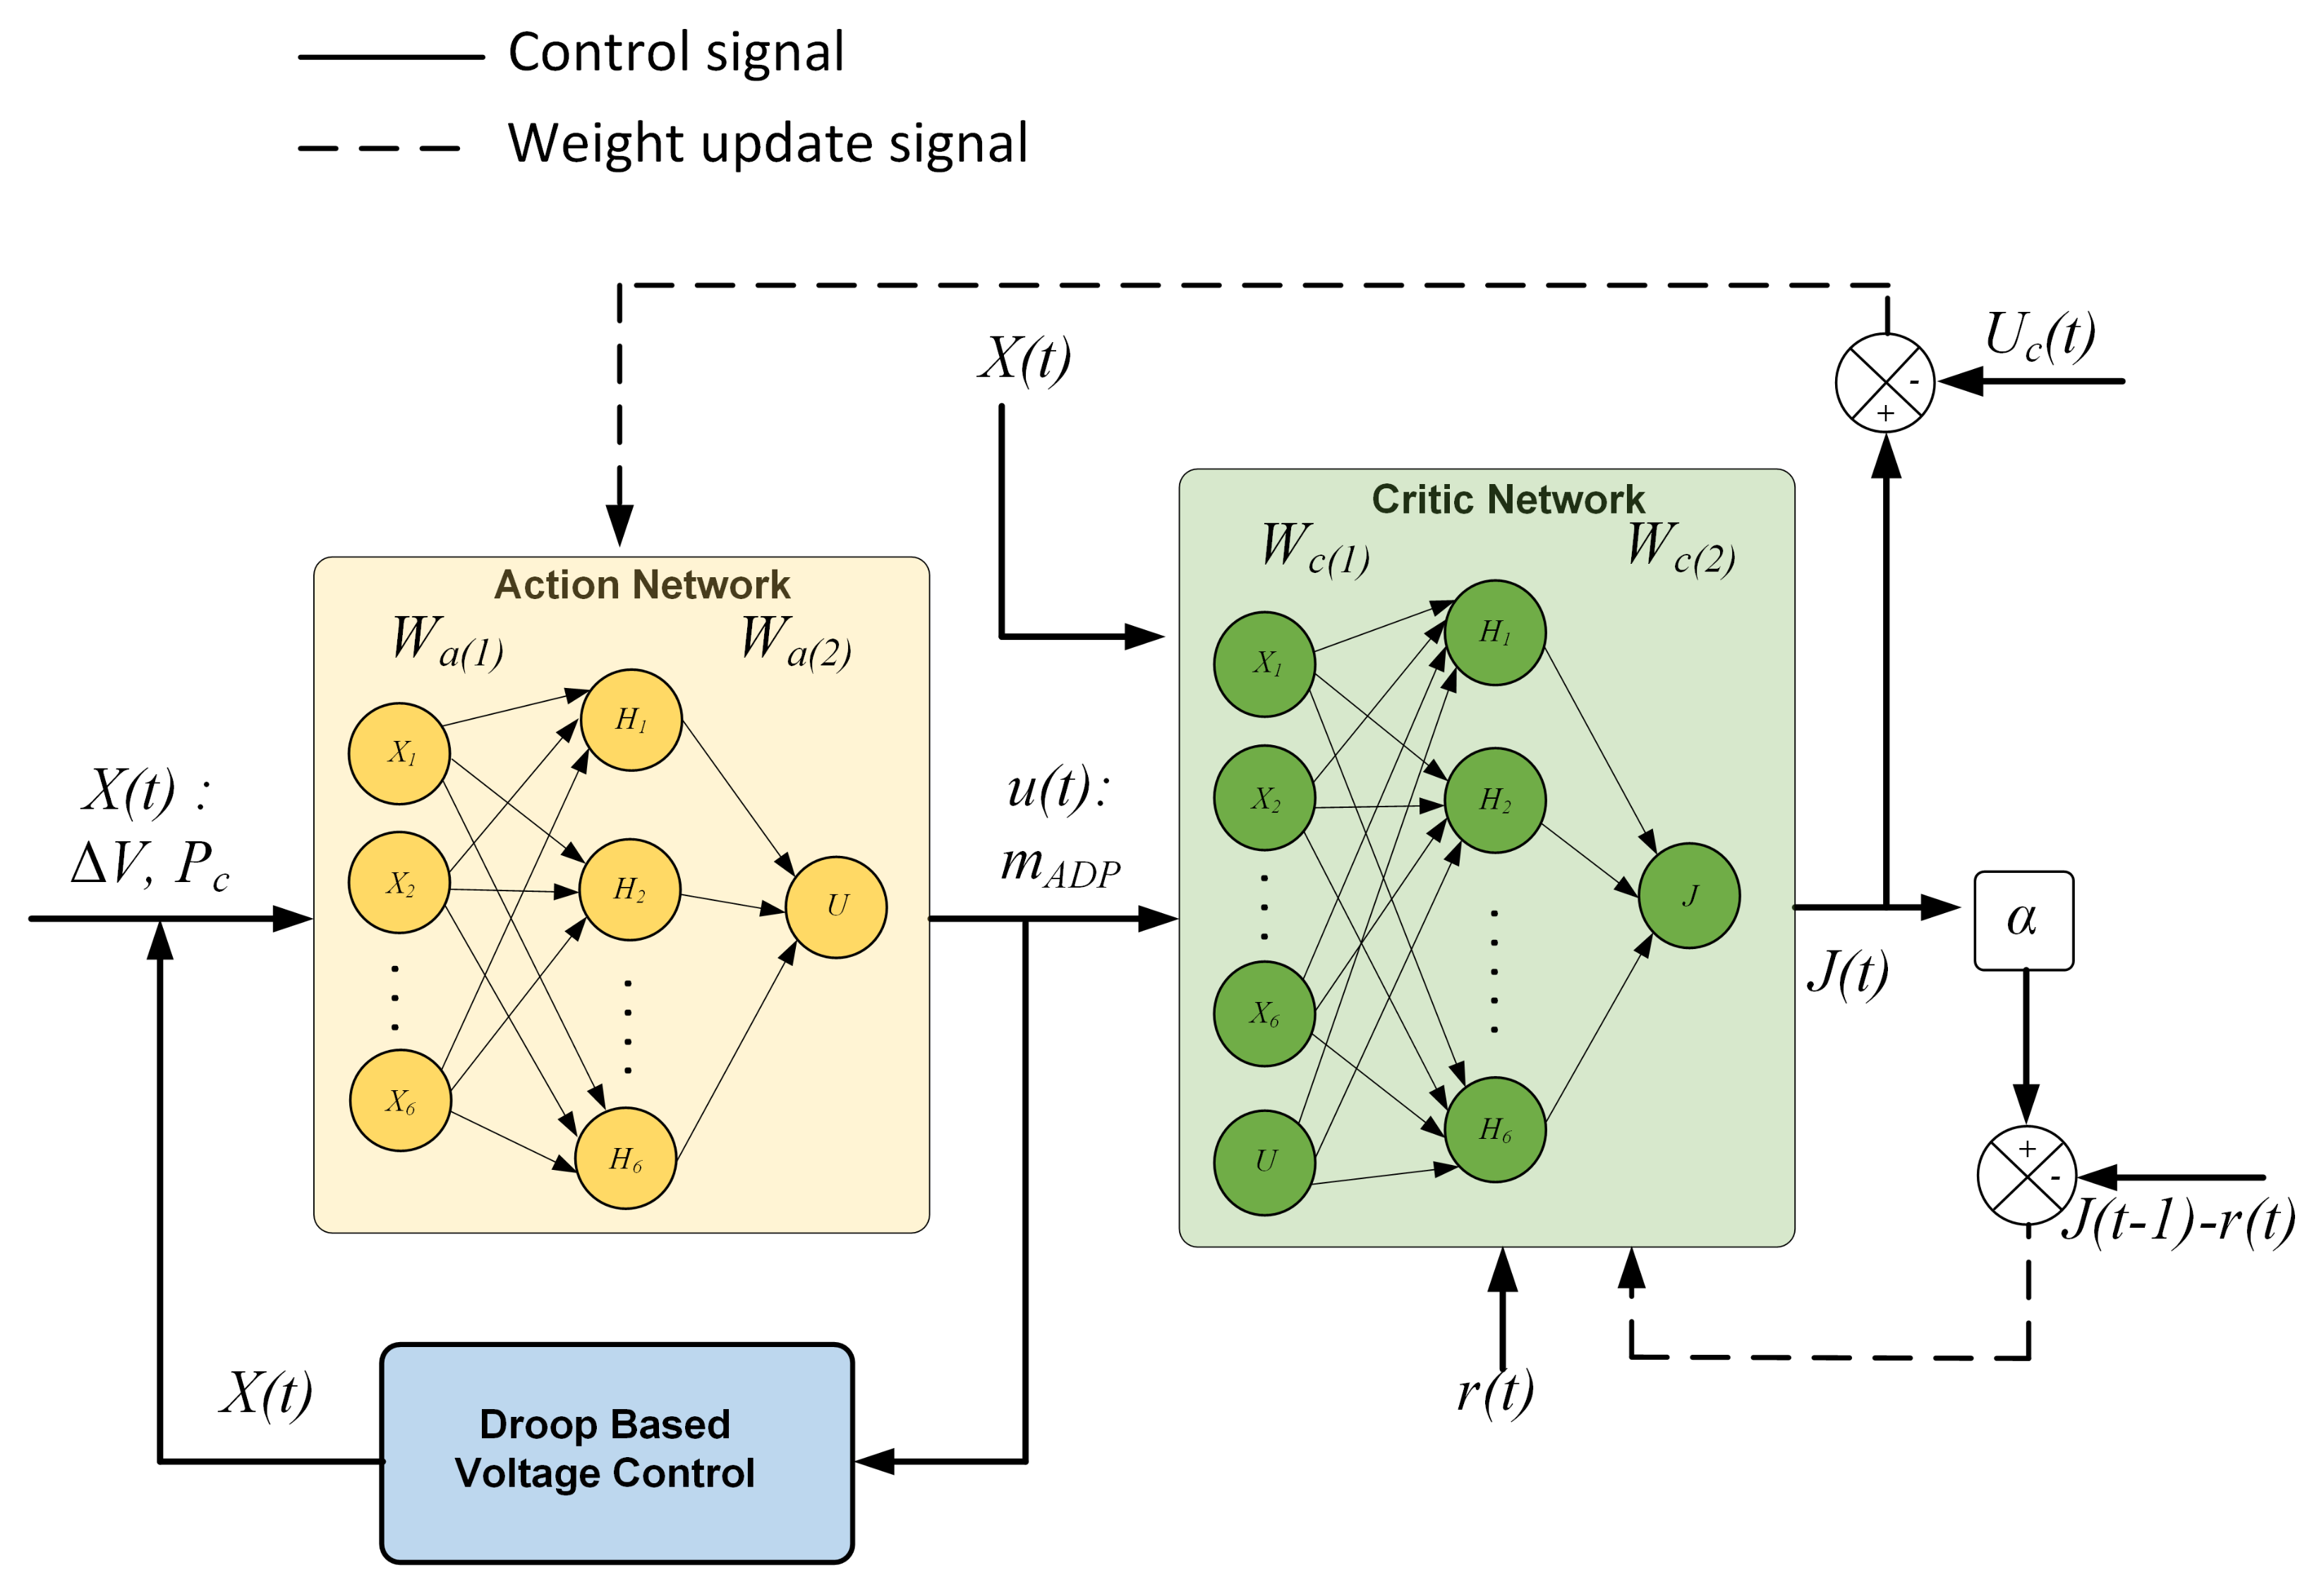
2.2. Proposed Adaptive Droop Control Design

The fixed droop-based inverter control curtails PV power based on a constant factor for all scenarios, leading to unnecessary PV power reduction [23]. The aim is to minimize the power curtailment (whenever possible), restricting the voltage within the boundary condition of overvoltage. For this, a supplementary controller based on ADP is proposed to adjust droop coefficient while decreasing PV power curtailment. Figure 3 shows the control strategy of ADP assisted droop-based power curtailment that adapts the droop value to minimize power curtailment, such that V ( t ) < V c r i 2 (1.058 p.u. of 240 V), and 0 < P i n v P M P P T . The input signals to ADP controller are voltage difference, power curtailment, and the time-delayed signals of voltage difference and power curtailment, which provides information on both objectives, i.e., the overvoltage prevention and the power curtailment minimization [31].
ADP is a machine learning-based approach to optimize the performance of dynamic systems over time [32,34]. Figure 4 shows the ADP controller with two neural network structures: the action network and the critic network. The action network generates the control action and the critic network optimizes the weights of the action network, based on a “reward” signal. In this case, the action network has a 6–6–1 structure with i x 1 ( t ) , x 2 ( t ) , x 3 ( t ) , x 4 ( t ) , x 5 ( t ) , and x 6 ( t ) as input signals. x 1 ( t ) is the p.u. value of the positive voltage difference between V ( t ) and V c r i 1 (1.050 p.u. of 240 V). x 2 ( t ) and x 3 ( t ) are the p.u. values of one-time step and two-time step delayed values of the voltage difference, respectively. Likewise, x 4 ( t ) is the p.u. value of the power curtailment. x 5 ( t ) and x 6 ( t ) are the p.u. values of one-time step and two-time step delayed signals of the power curtailment, respectively. The six hidden nodes are denoted as H 1 to H 6 , and the output node is denoted as u ( t ) . The output of the action network is the droop value, denoted as m A D P ( t ) which adjusts the constant droop coefficient m c to compute the total droop coefficient m T ( t ) for the proposed combined controller. The critic network has a 7–6–1 structure with seven inputs: x 1 ( t ) , x 2 ( t ) , x 3 ( t ) , x 4 ( t ) , x 5 ( t ) , x 6 ( t ) , and u ( t ) . Similar to the action network, it also has six hidden nodes H 1 to H 6 and an output node J ( t ) .
The critic network is formulated in such manner that optimal cost function J ( x ( t ) ) satisfies Bellman principle of optimality, such that
J ( x ( t ) ) = min u ( t ) { J ( x ( t + 1 ) ) + r ( x ( t ) ) U c }
where r ( x ( t ) ) is the immediate cost incurred by u ( t ) at time t, and U c is a heuristic term used to balance. The output of critic network updates the weight of action network, as the value of U c is set 0 for our design. The reward signal is defined in a binary format with 0 representing success, or 1 " representing failure. Here, the reward signal is defined as
r ( t ) = c ( a 1 x 1 2 + a 2 x 2 2 + a 3 x 3 2 + a 4 x 4 2 + a 5 x 5 2 + a 6 x 6 2 )
where c , a 1 , a 2 , a 3 , a 4 , a 5 , and a 6 are constants. The reward signal is devised to restrain the voltage from exceeding V c r i 2 at the same time minimizing the power curtailment. The value of c in the reward signal design is represented as 1 " for positive value of the voltage difference and the power curtailment. This would ensure a negative reward would be applied in the ADP algorithm until the minimum curtailment is achieved or the voltage crosses the limit. The reward signal updates the weights of the action network appropriately. The weighting constants for the voltage difference signals ( a 1 , a 2 , and a 3 ) were assigned equal weights of 0.1 . The highest weight of 0.4 was set to the power curtailment weight constant ( a 4 ) and similarly, the weight constants of one-time step and two-time step delayed signals of power curtailment ( a 5 and a 6 ) were set to values of 0.2 and 0.1 , respectively. Further details on the convergence and stability aspects of the ADP controller are briefly discussed in previous study [33].

3. Power Curtailment in LV Distribution Network

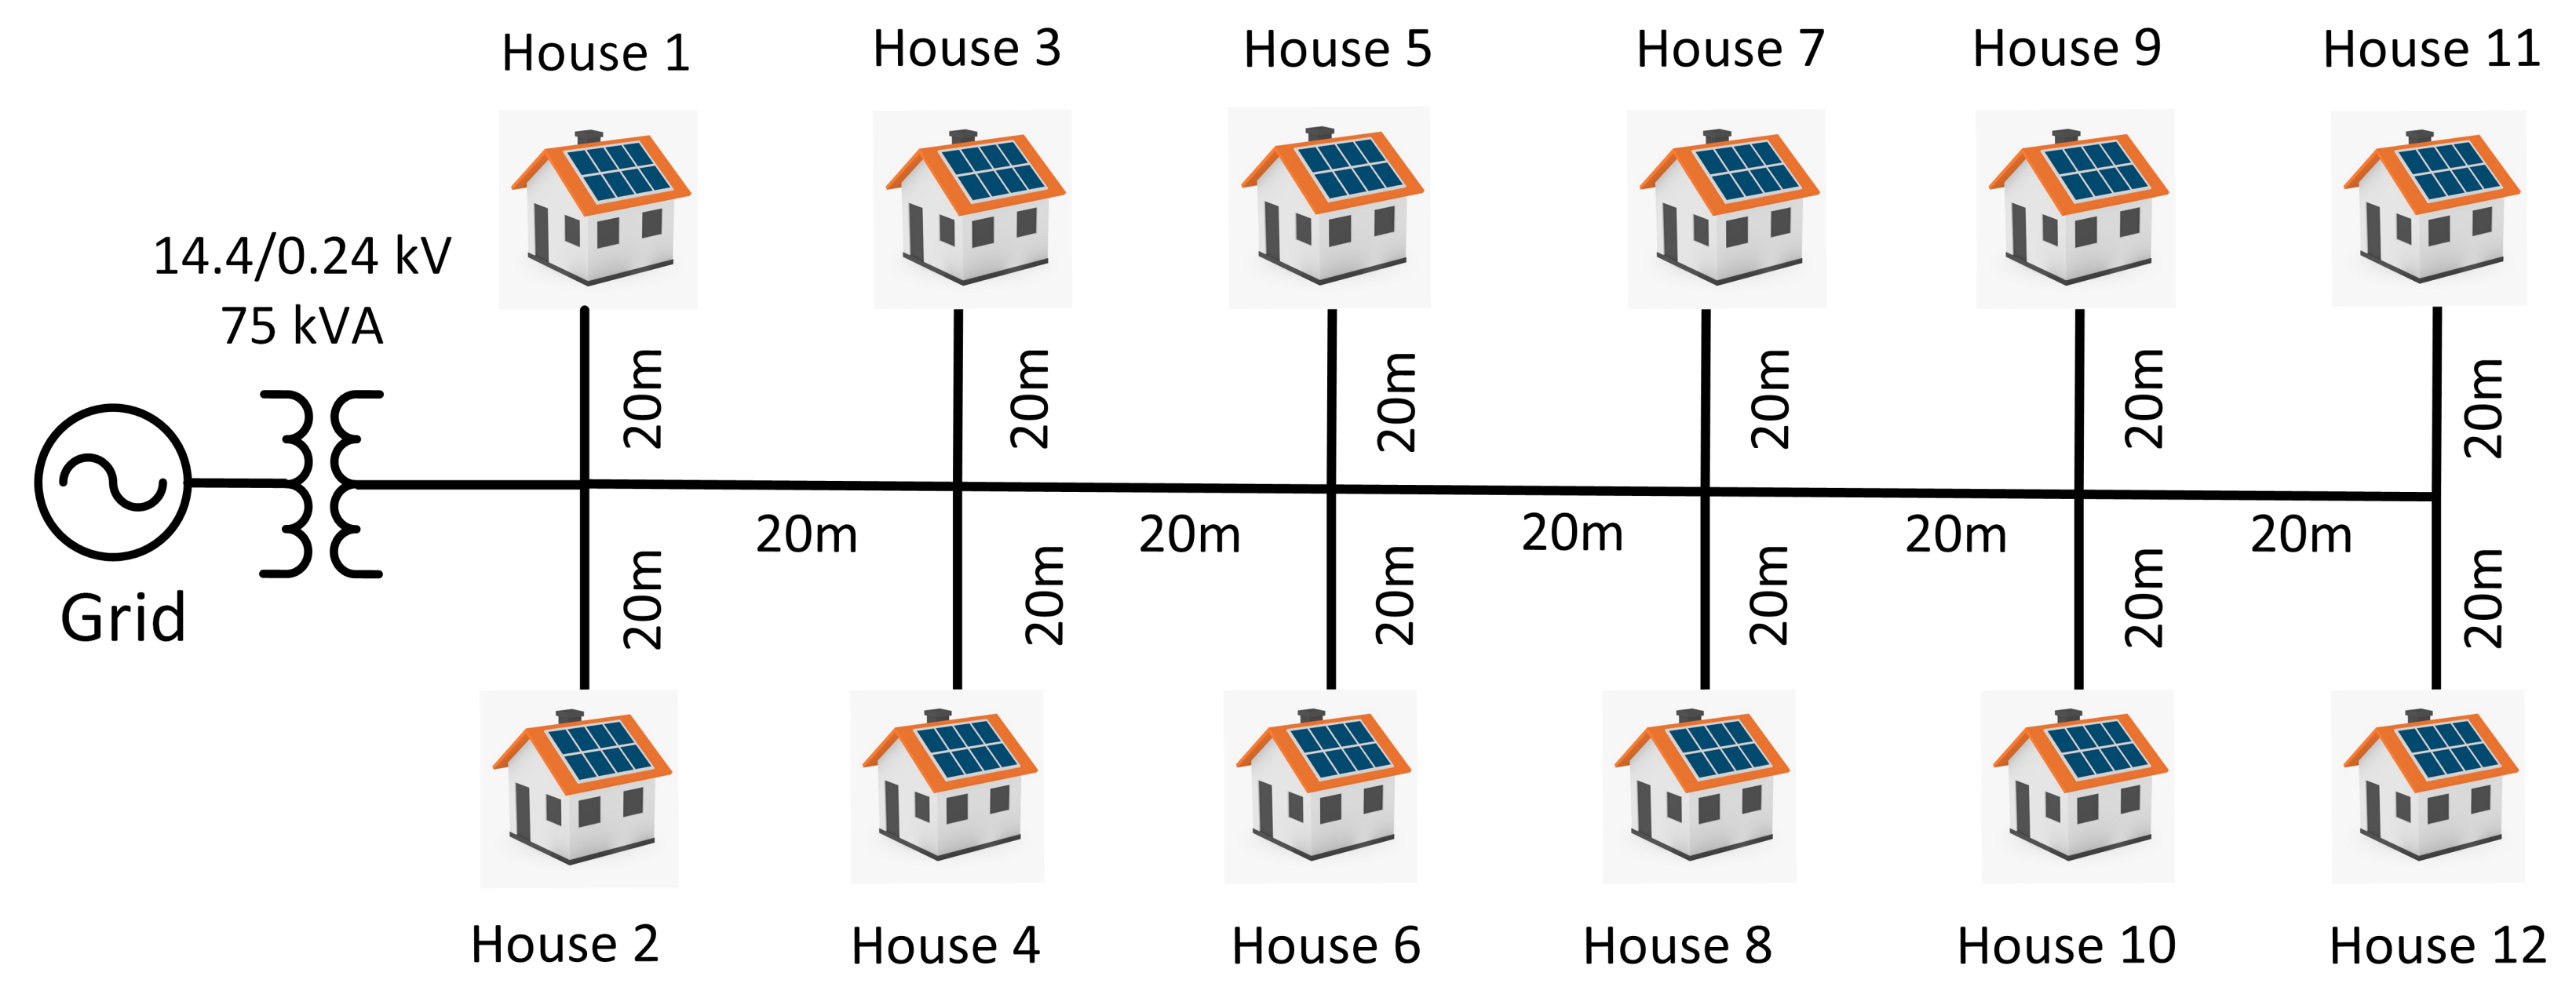
3.1. System Benchmark

The system model of a residential suburban LV distribution feeder given in [21], shown in Figure 5, was used in this work. The system consists of twelve houses with residential PV installations in each house. The feeder has a single-phase 75 kVA, 14.4/0.24 kV distribution transformer with split-phase supply at the secondary side that connects to the grid. The network has a 100 m long feeder line with each house connected by a 20 m long feeder line. Each house is capable of generating 5 k W p of electrical energy from PV, and the annual generation from these houses is ~14,892 kWh. Table A1 lists the LV transformer parameters, and Table A2 lists the parameters for single phase PI section line. The PV inverter, and the house load models are both modeled as voltage dependent current sources to depict the instantaneous power flow from and to the houses, and PVs.

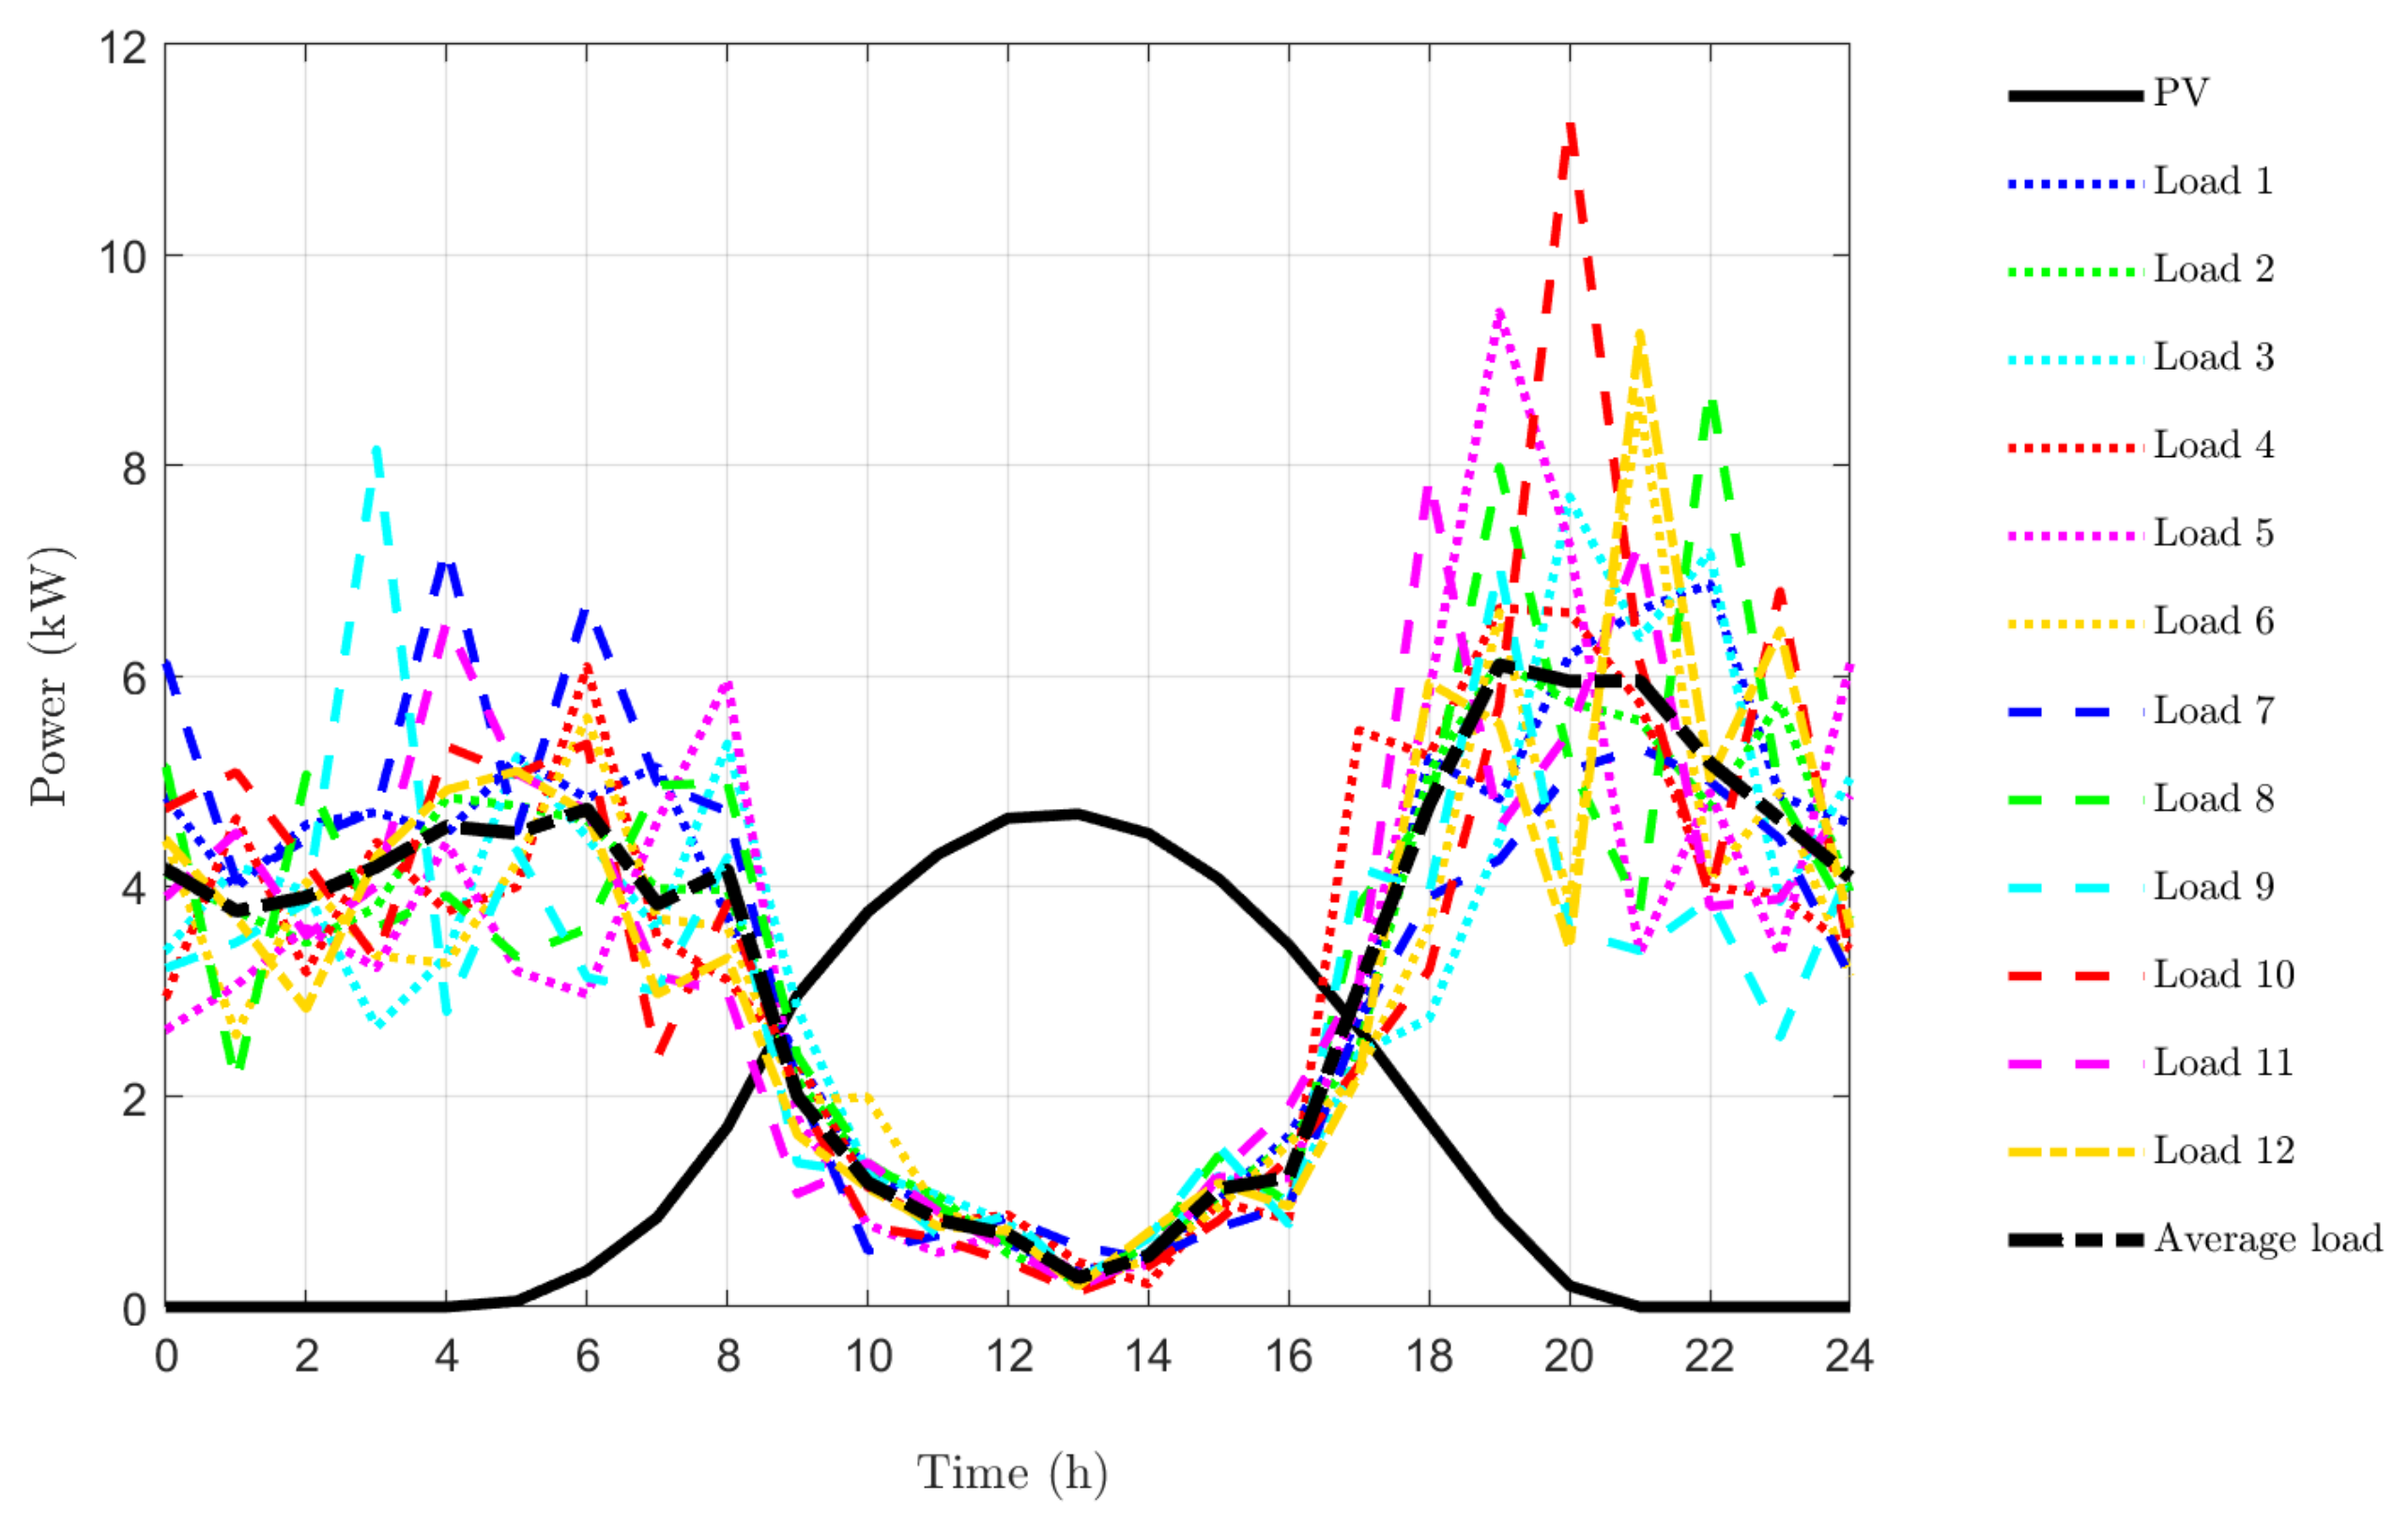
3.2. Solar Irradiance and Load Profile
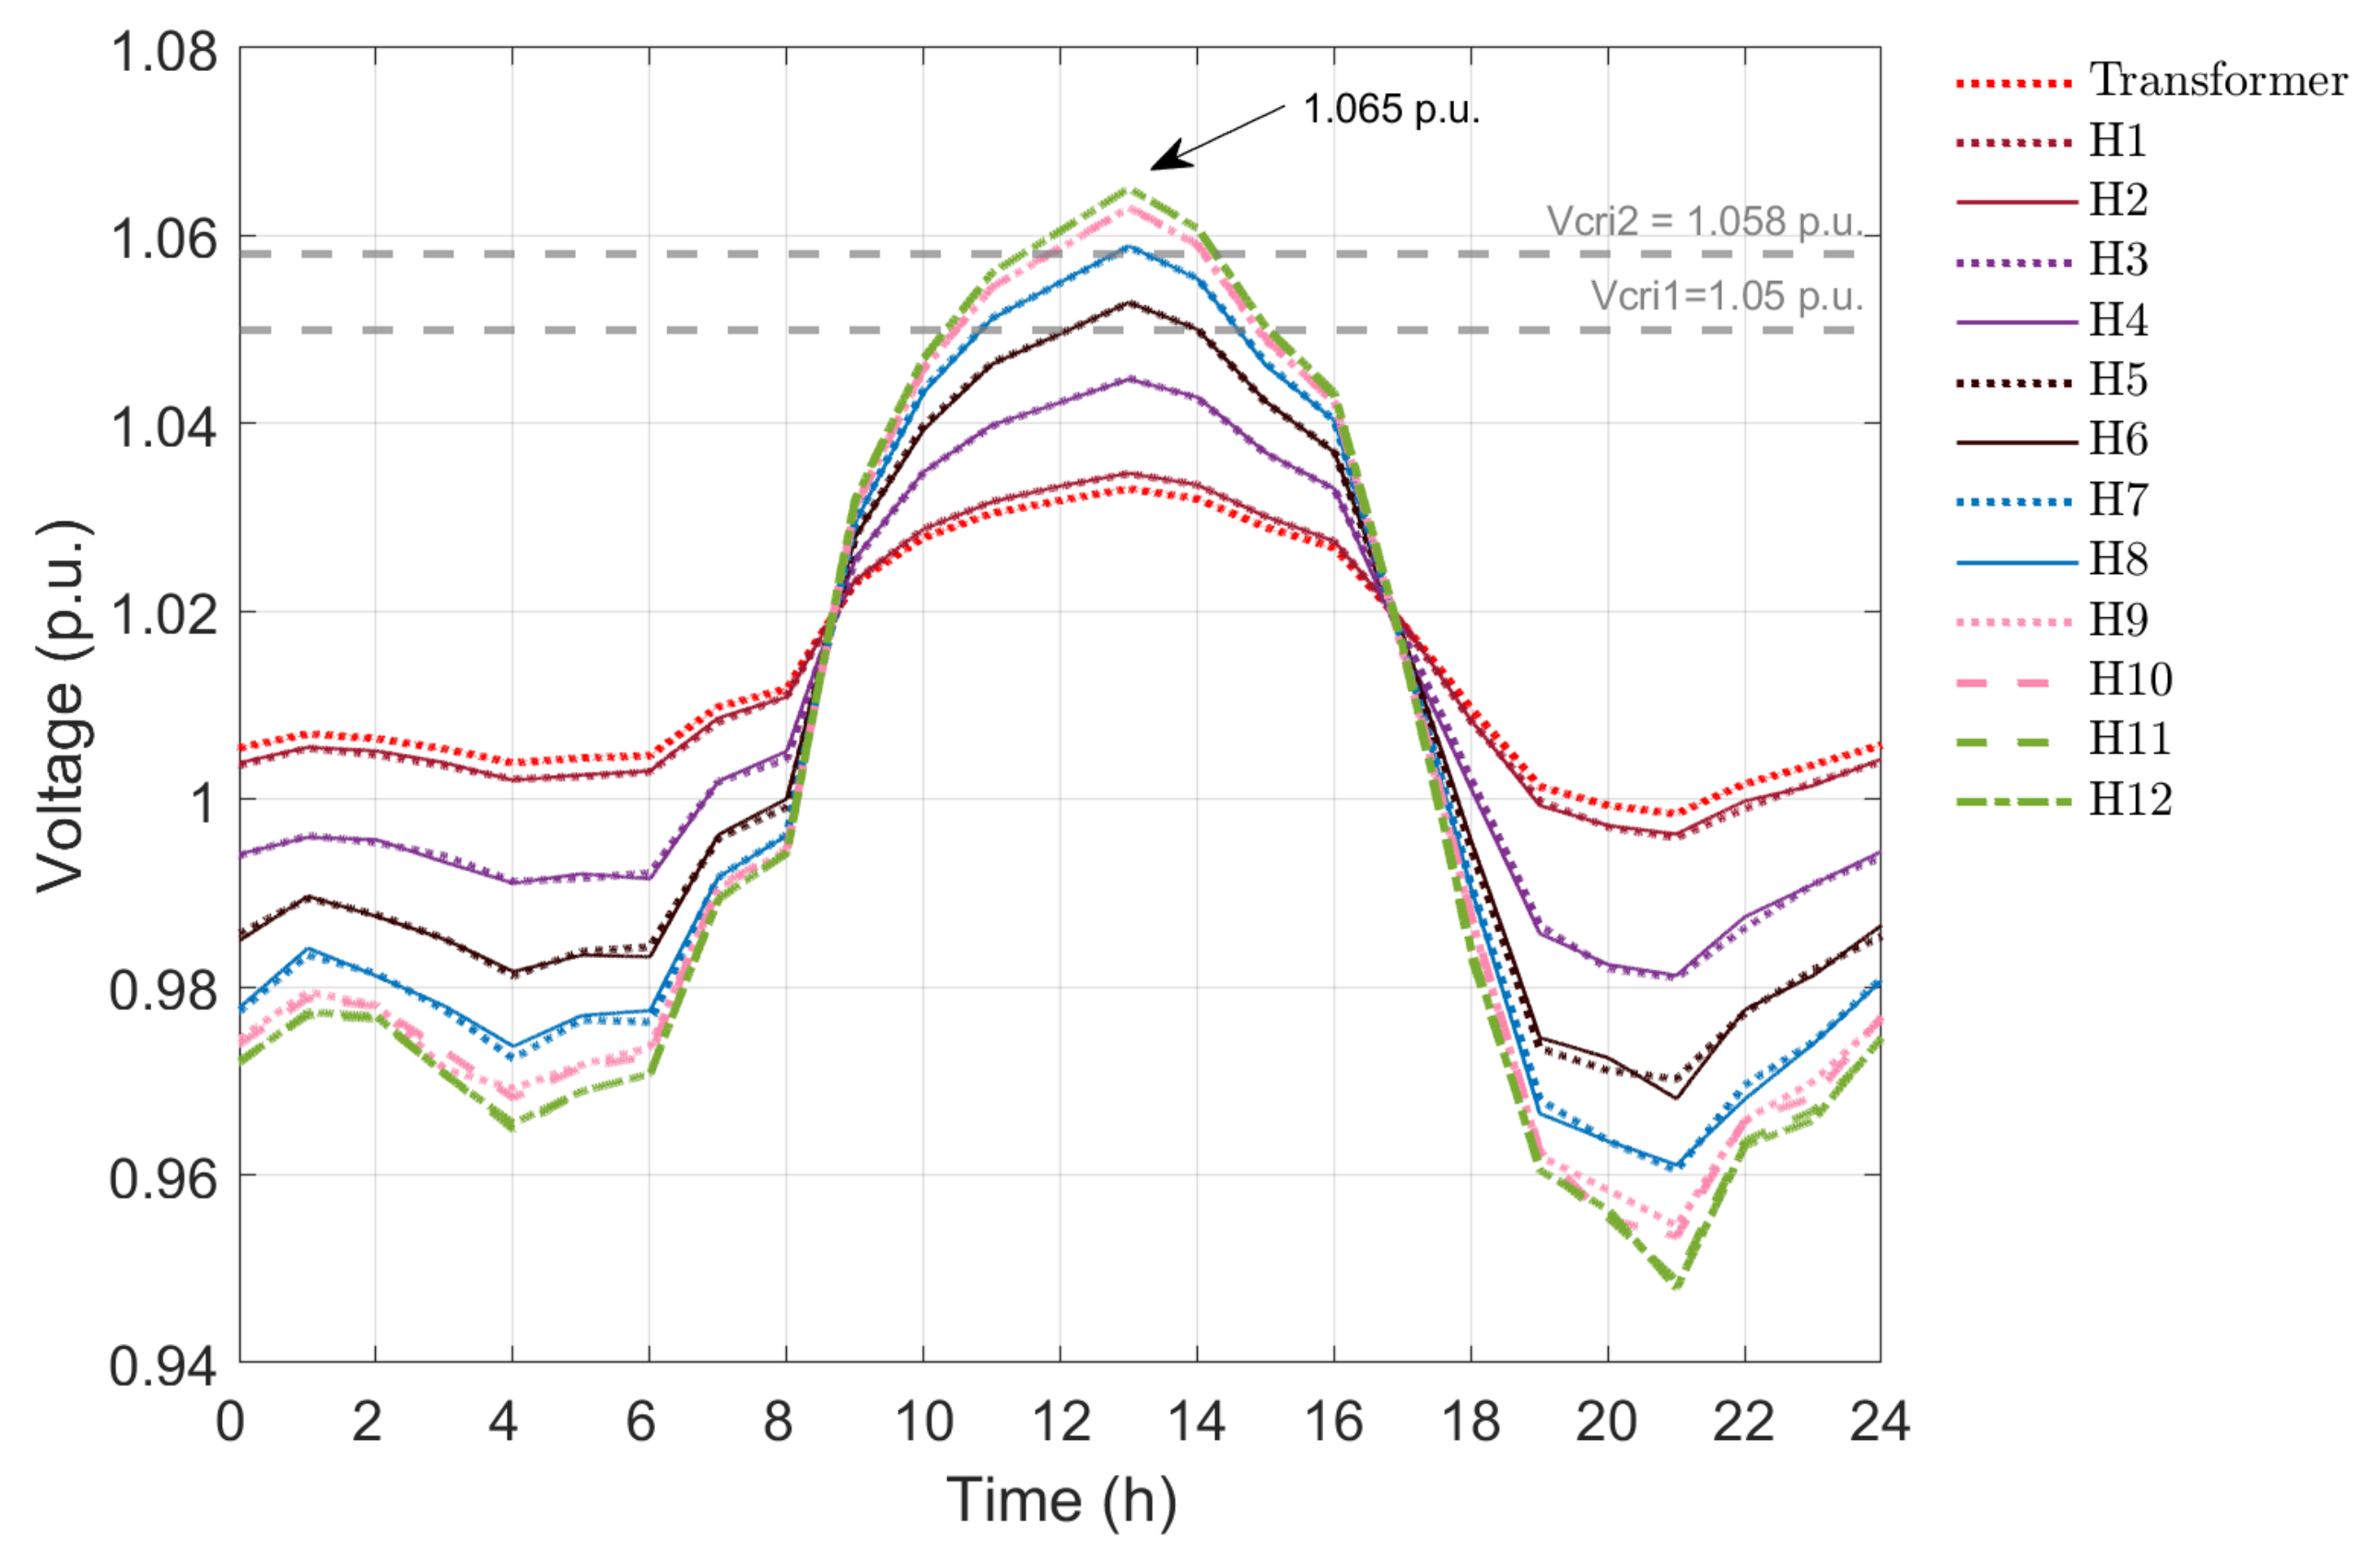
The model was developed in MATLAB/Simulink [37] with inputs as solar irradiance data and load profile. The solar irradiance data was taken from SAMS software for Minneapolis, Minnesota for a sunny day [38]. The PV size was 5 k W p for all the twelve houses. The household daily load profiles were estimated using Poisson process and Queue theory and this method of estimation has been presented in [38,39,40]. These techniques model the energy consumption profile for each household appliances based on their consumption pattern which is summed up to get the load profile of each house. Moreover, these profiles also have realistic variations in energy consumption between the houses. To generalize the different load profiles of the twelve houses, the average load is plotted in Figure 6, with solar irradiance data, and load profiles for a day. The resolution of one hour was taken for the solar irradiance data and load profiles, which is good enough to approximate steady state conditions. The profiles shows that high PV generation and low loading condition occurs at 1 pm in the modeled case.

3.3. Base Case

For the base case, the model was simulated without any inverter control where the PV inverters inject full maximum power point power until the voltage at POC reaches 1.10 p.u., after which the system shuts down if the voltage exceeds 1.10 p.u. Figure 7 shows the voltage for the base case simulation, without any droop control. The voltage profile for houses at the same POC of the LV distribution network are the same and equal in values. The maximum voltage of 1.065 p.u. occurred at 1 pm in houses 11 and 12, that was above V c r i 2 . Similarly, houses 7 to 12 undergo overvoltages, that is, the voltage exceeds V c r i 2 , during the 24 h simulation time period. The energy output from PV was computed by determining area under the power curve. The energy output from the PV inverters from all the houses summed up to be 489.60 kWh for the 24 h period.

4. Results

This section consists of results from the benchmark model with two case scenarios: a droop-based APC method with linear, quadratic, and exponential droop functions, and APC with the supplementary ADP controller added to each of the three different droop functions. All the cases have same PV power data and corresponding load profile for each house as described in the previous section.

4.1. Different Droop Functions in Active Power Curtailment Method
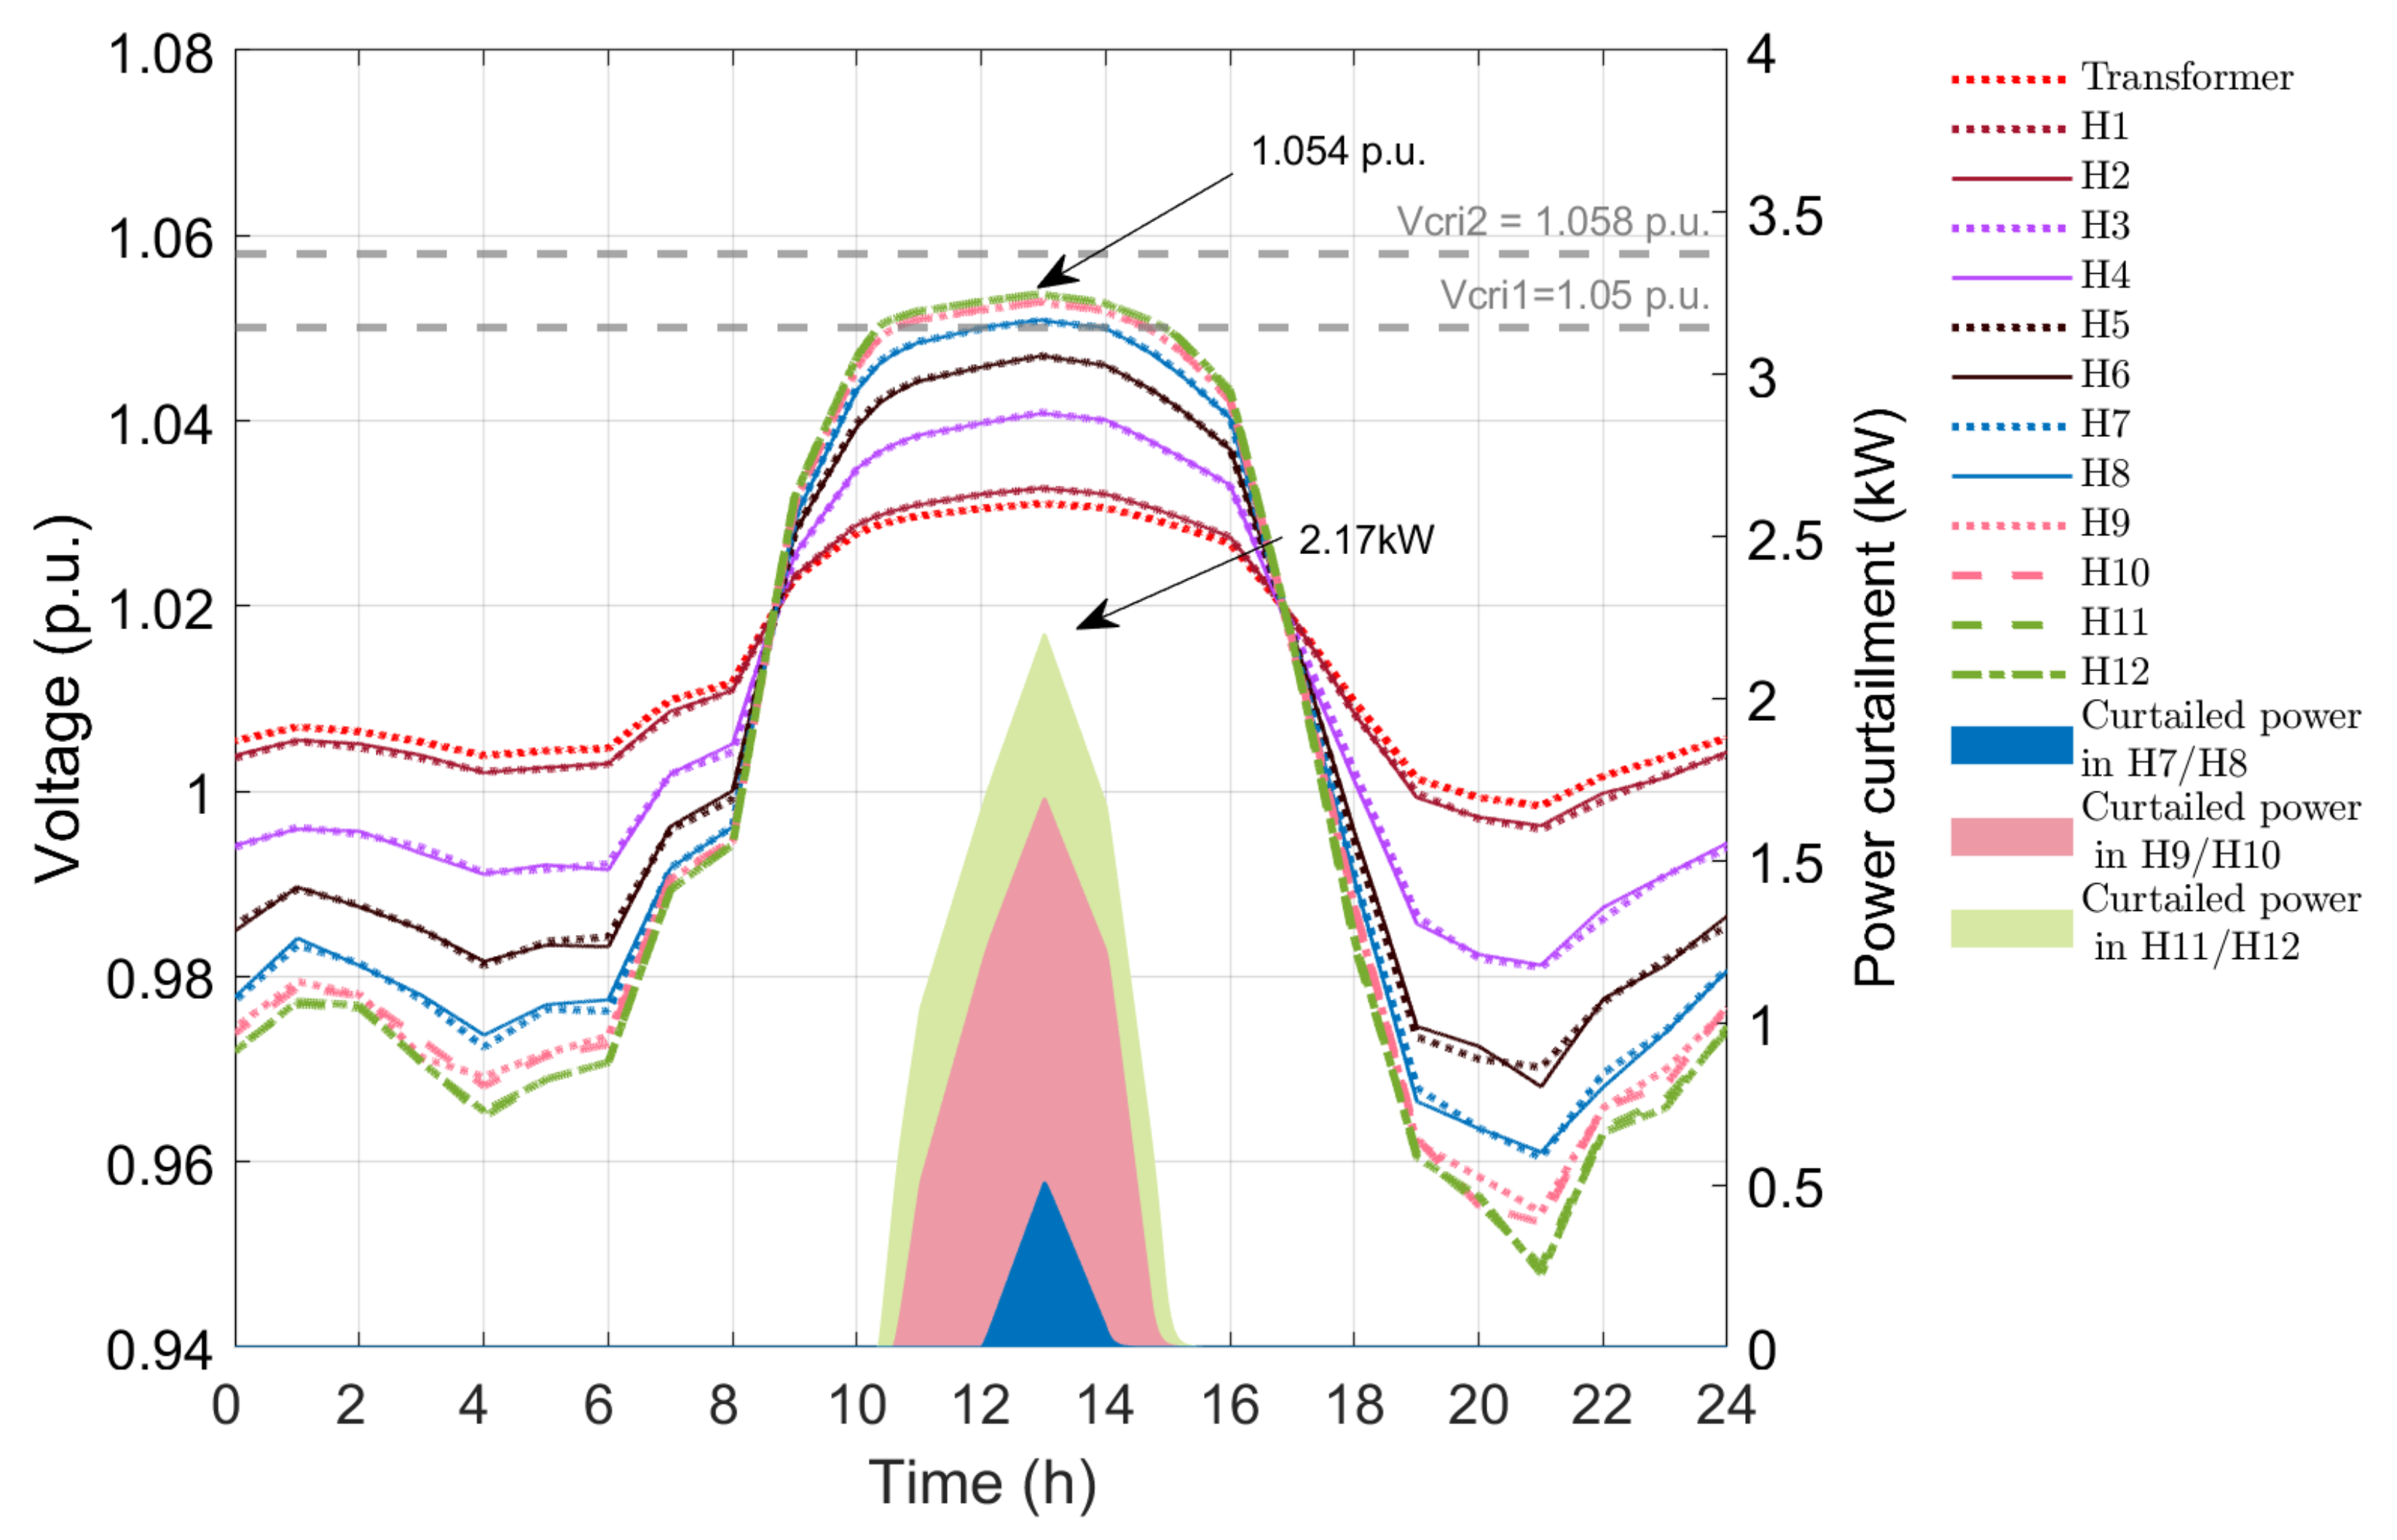
4.1.1. Linear Droop

This case represents the method in which all the PV inverters have linear droop-based APC control. All the PV inverters have same droop coefficient which linearly curtails power. The droop coefficient is calculated so that the curtailment occurs between critical voltages, i.e., 1.05 p.u. and 1.058 p.u. The droop coefficient was calculated as
m = P m a x ( V c r i 1 V c r i 2 ) = 2.5 kW V .
where P m a x is the required maximum power that needs to be curtailed by PV inverter to limit the voltage from V c r i 2 to V c r i 1 .
After applying droop-based APC control, the maximum voltage at houses 11 and 12 is reduced to 1.054 p.u. from 1.065 p.u of base case as shown in Figure 8, which is less than V c r i 2 . Similarly, none of the houses exceed the voltage limit of V c r i 2 . Figure 8 also shows the power curtailed during APC implementation with linear droop. The maximum power curtailed at 1 pm was 2.17 kW. However, due to the power curtailment, the total energy output from PV reduced from 489.60 kWh in the base case to 466.87 kWh with the linear droop-based APC. The total energy loss due to curtailment was 22.72 kWh.

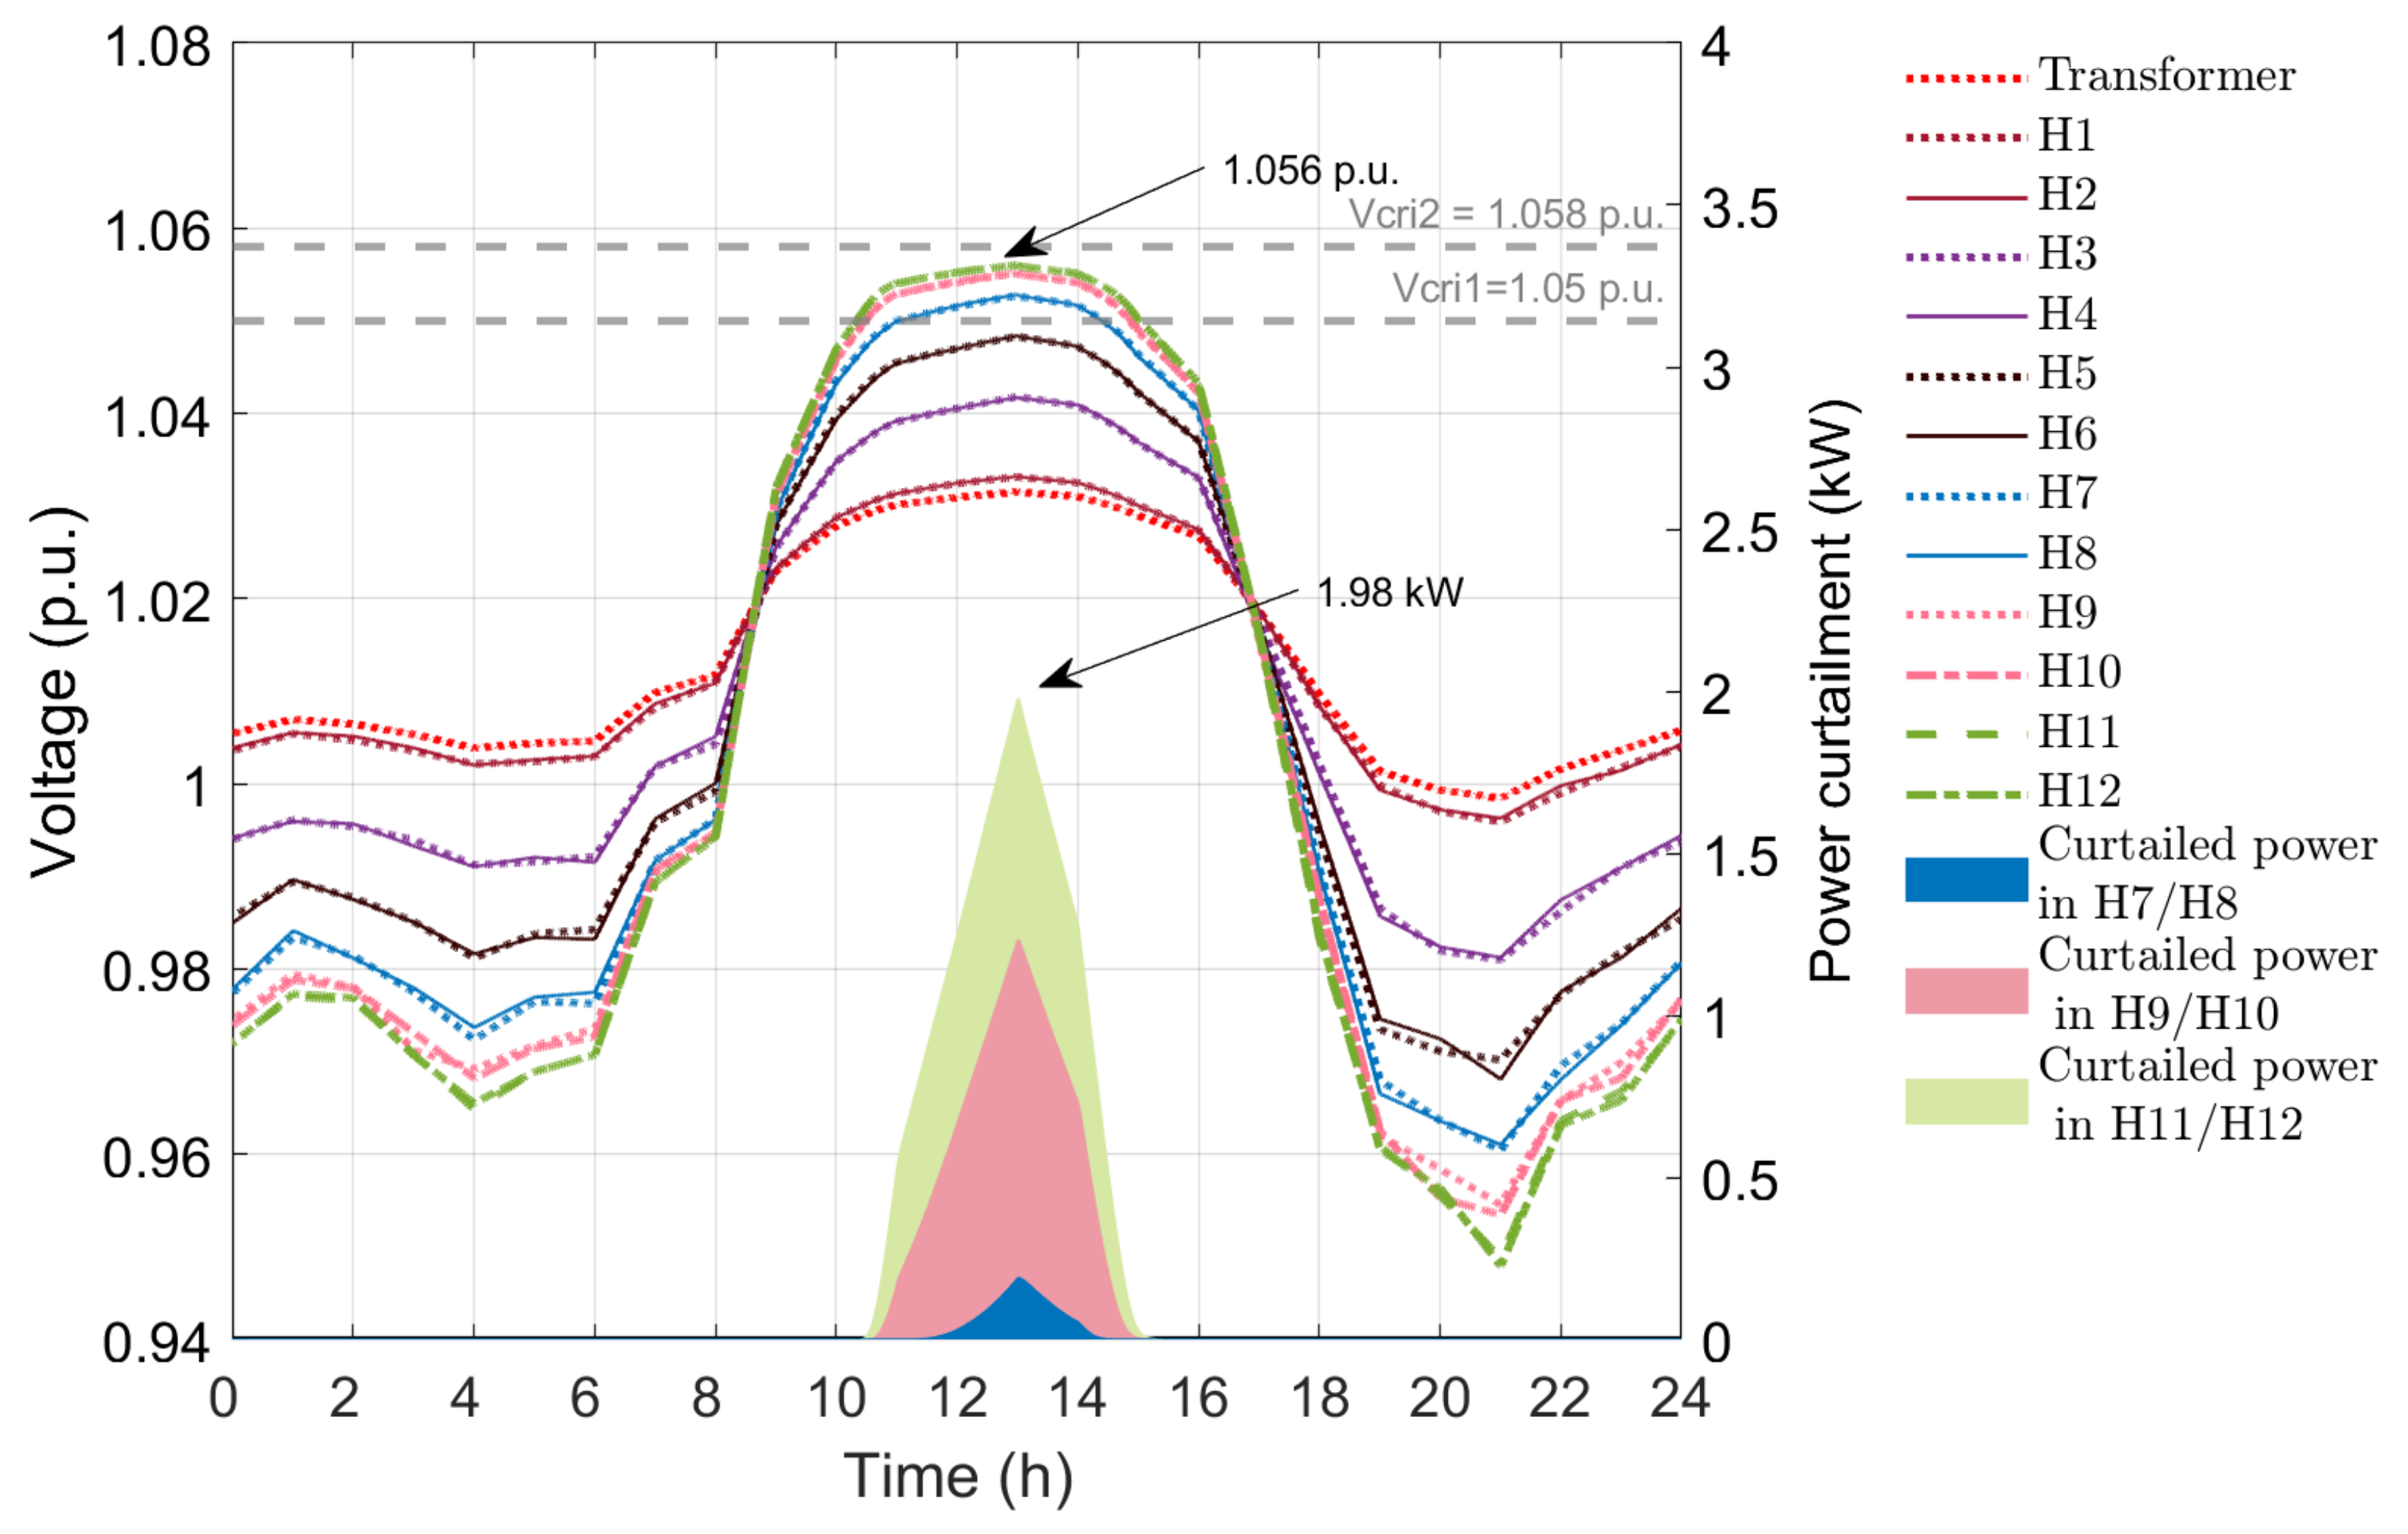
4.1.2. Quadratic Droop

In this case, the PV inverters are controlled with quadratic droop-based APC method, where the droop values are guided by a quadratic function.
Figure 9 shows the voltage profile of the twelve houses and the power curtailment with the droop-based APC method with a quadratic function. The maximum voltage of 1.056 p.u. occurs at 1 pm in houses 11 and 12, which does not exceed the critical value V c r i 2 (1.058 p.u.). The maximum voltages in houses from 7 to 12 is higher in the APC method with quadratic function than in APC method with linear droop. This happens because the droop function is guided by a quadratic function rather than a constant value, which better fits the objective to lower the curtailment. The voltages in houses are pushed to the boundary limits which facilitates lower curtailment. The maximum power curtailment is 1.98 kW at houses 11 and 12, which is less than that in constant droop-based APC method. The power curtailments for houses 7 to 12 are less than that of APC method with linear droop. The total energy loss due to PV curtailment is 15.27 kWh.

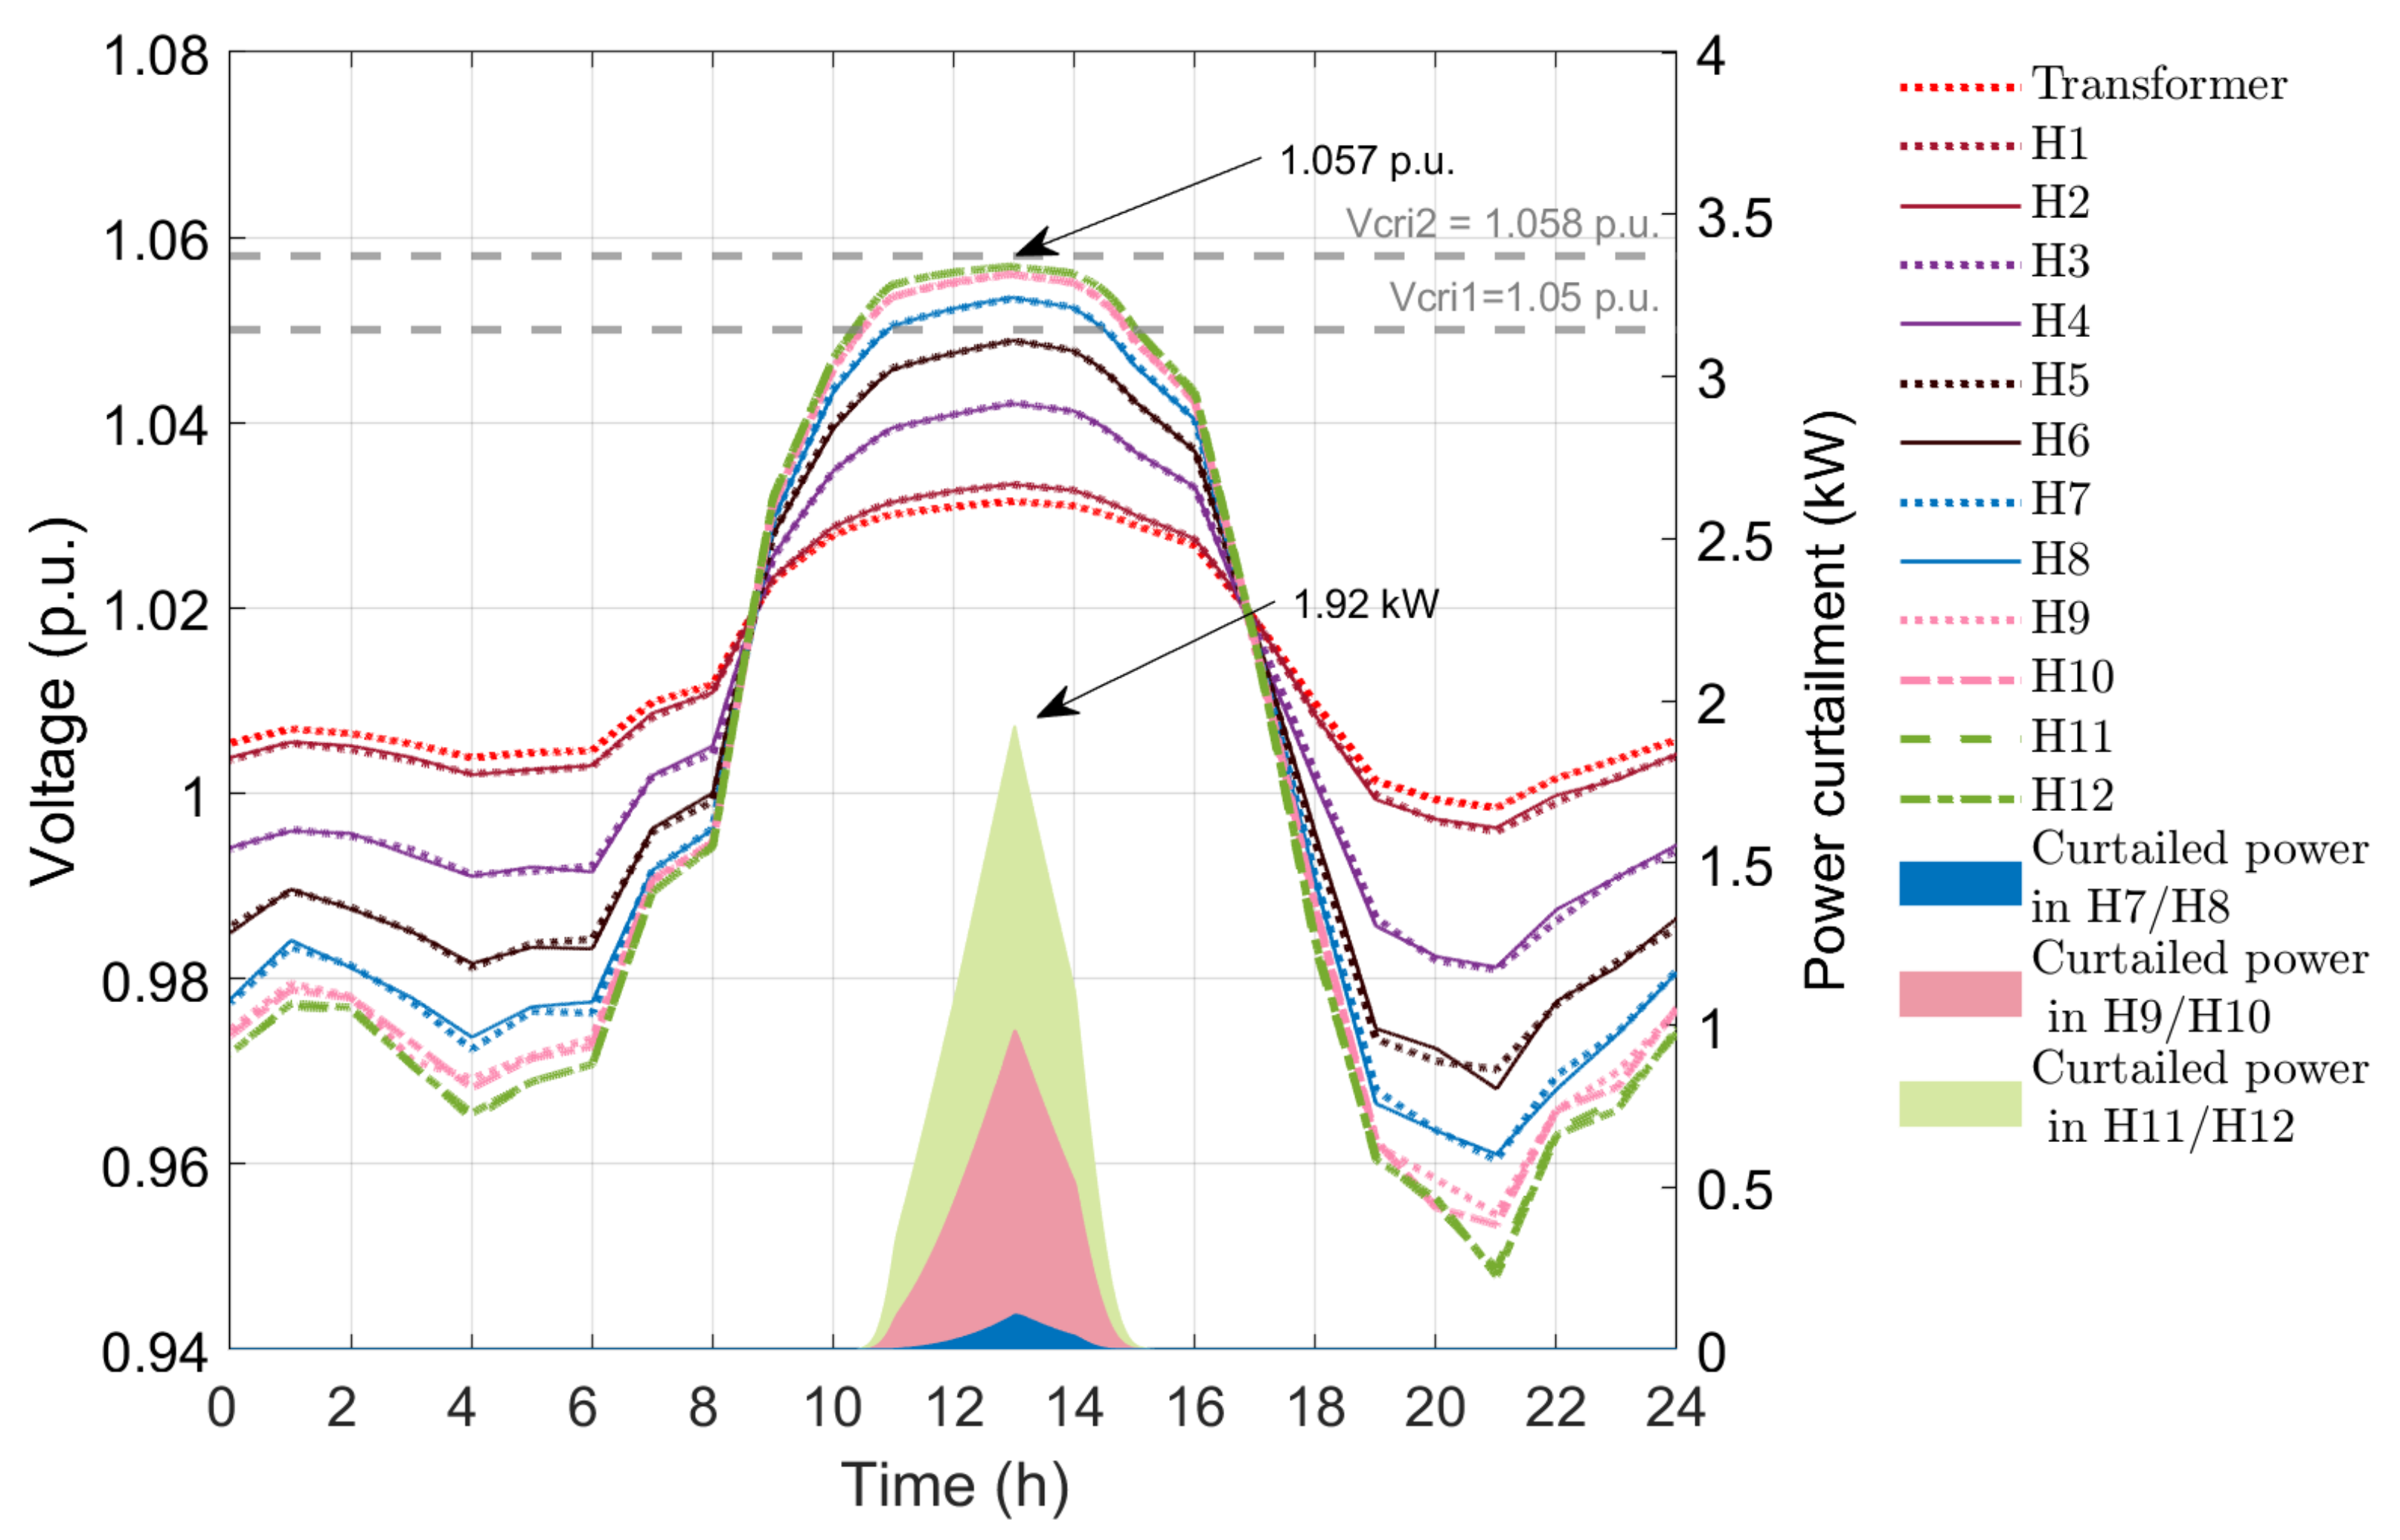
4.1.3. Exponential Droop

This case has droop-based controllers in PV inverters driven by an exponential droop function. Figure 10 presents the voltage profile of the twelve houses and power curtailment after using APC method using the exponential function. The maximum voltage at houses 9 to 12 is 1.057 p.u., which is less than V c r i 2 . Houses 9 to 12 do not experience overvoltage at any time during the 24 h period. The maximum power curtailment is 1.92 kW for houses 11 and 12, which is slightly less than that in APC method with quadratic droop. The curtailments from house 7 to 12 are the lowest in this method compared to above droop-based APC techniques as the function has the lowest curtailment for the same voltage difference among the three techniques. The energy loss in APC method with exponential droop is 12.40 kWh.

4.1.4. Discussion

From the above results, the efficacy of altering droop function from the fixed value is demonstrated which maintains the voltage profile of the farthest houses at the upper boundary of the operating condition. The power curtailment for overvoltage prevention decreases for each house in such approach as shown in Table 1. The energy output from the PV inverters increases and energy curtailment decreases as the fixed droop is changed to a quadratic or exponential function. The energy curtailed in each house decreases in both quadratic and exponential droops resulting in reduced overall energy loss than in linear droop. This proves that altering the droop coefficient can reduce unnecessary power curtailments in PV inverters in APC technique. Further, the numerical results with the proposed control strategy that can achieve the same objective are demonstrated.

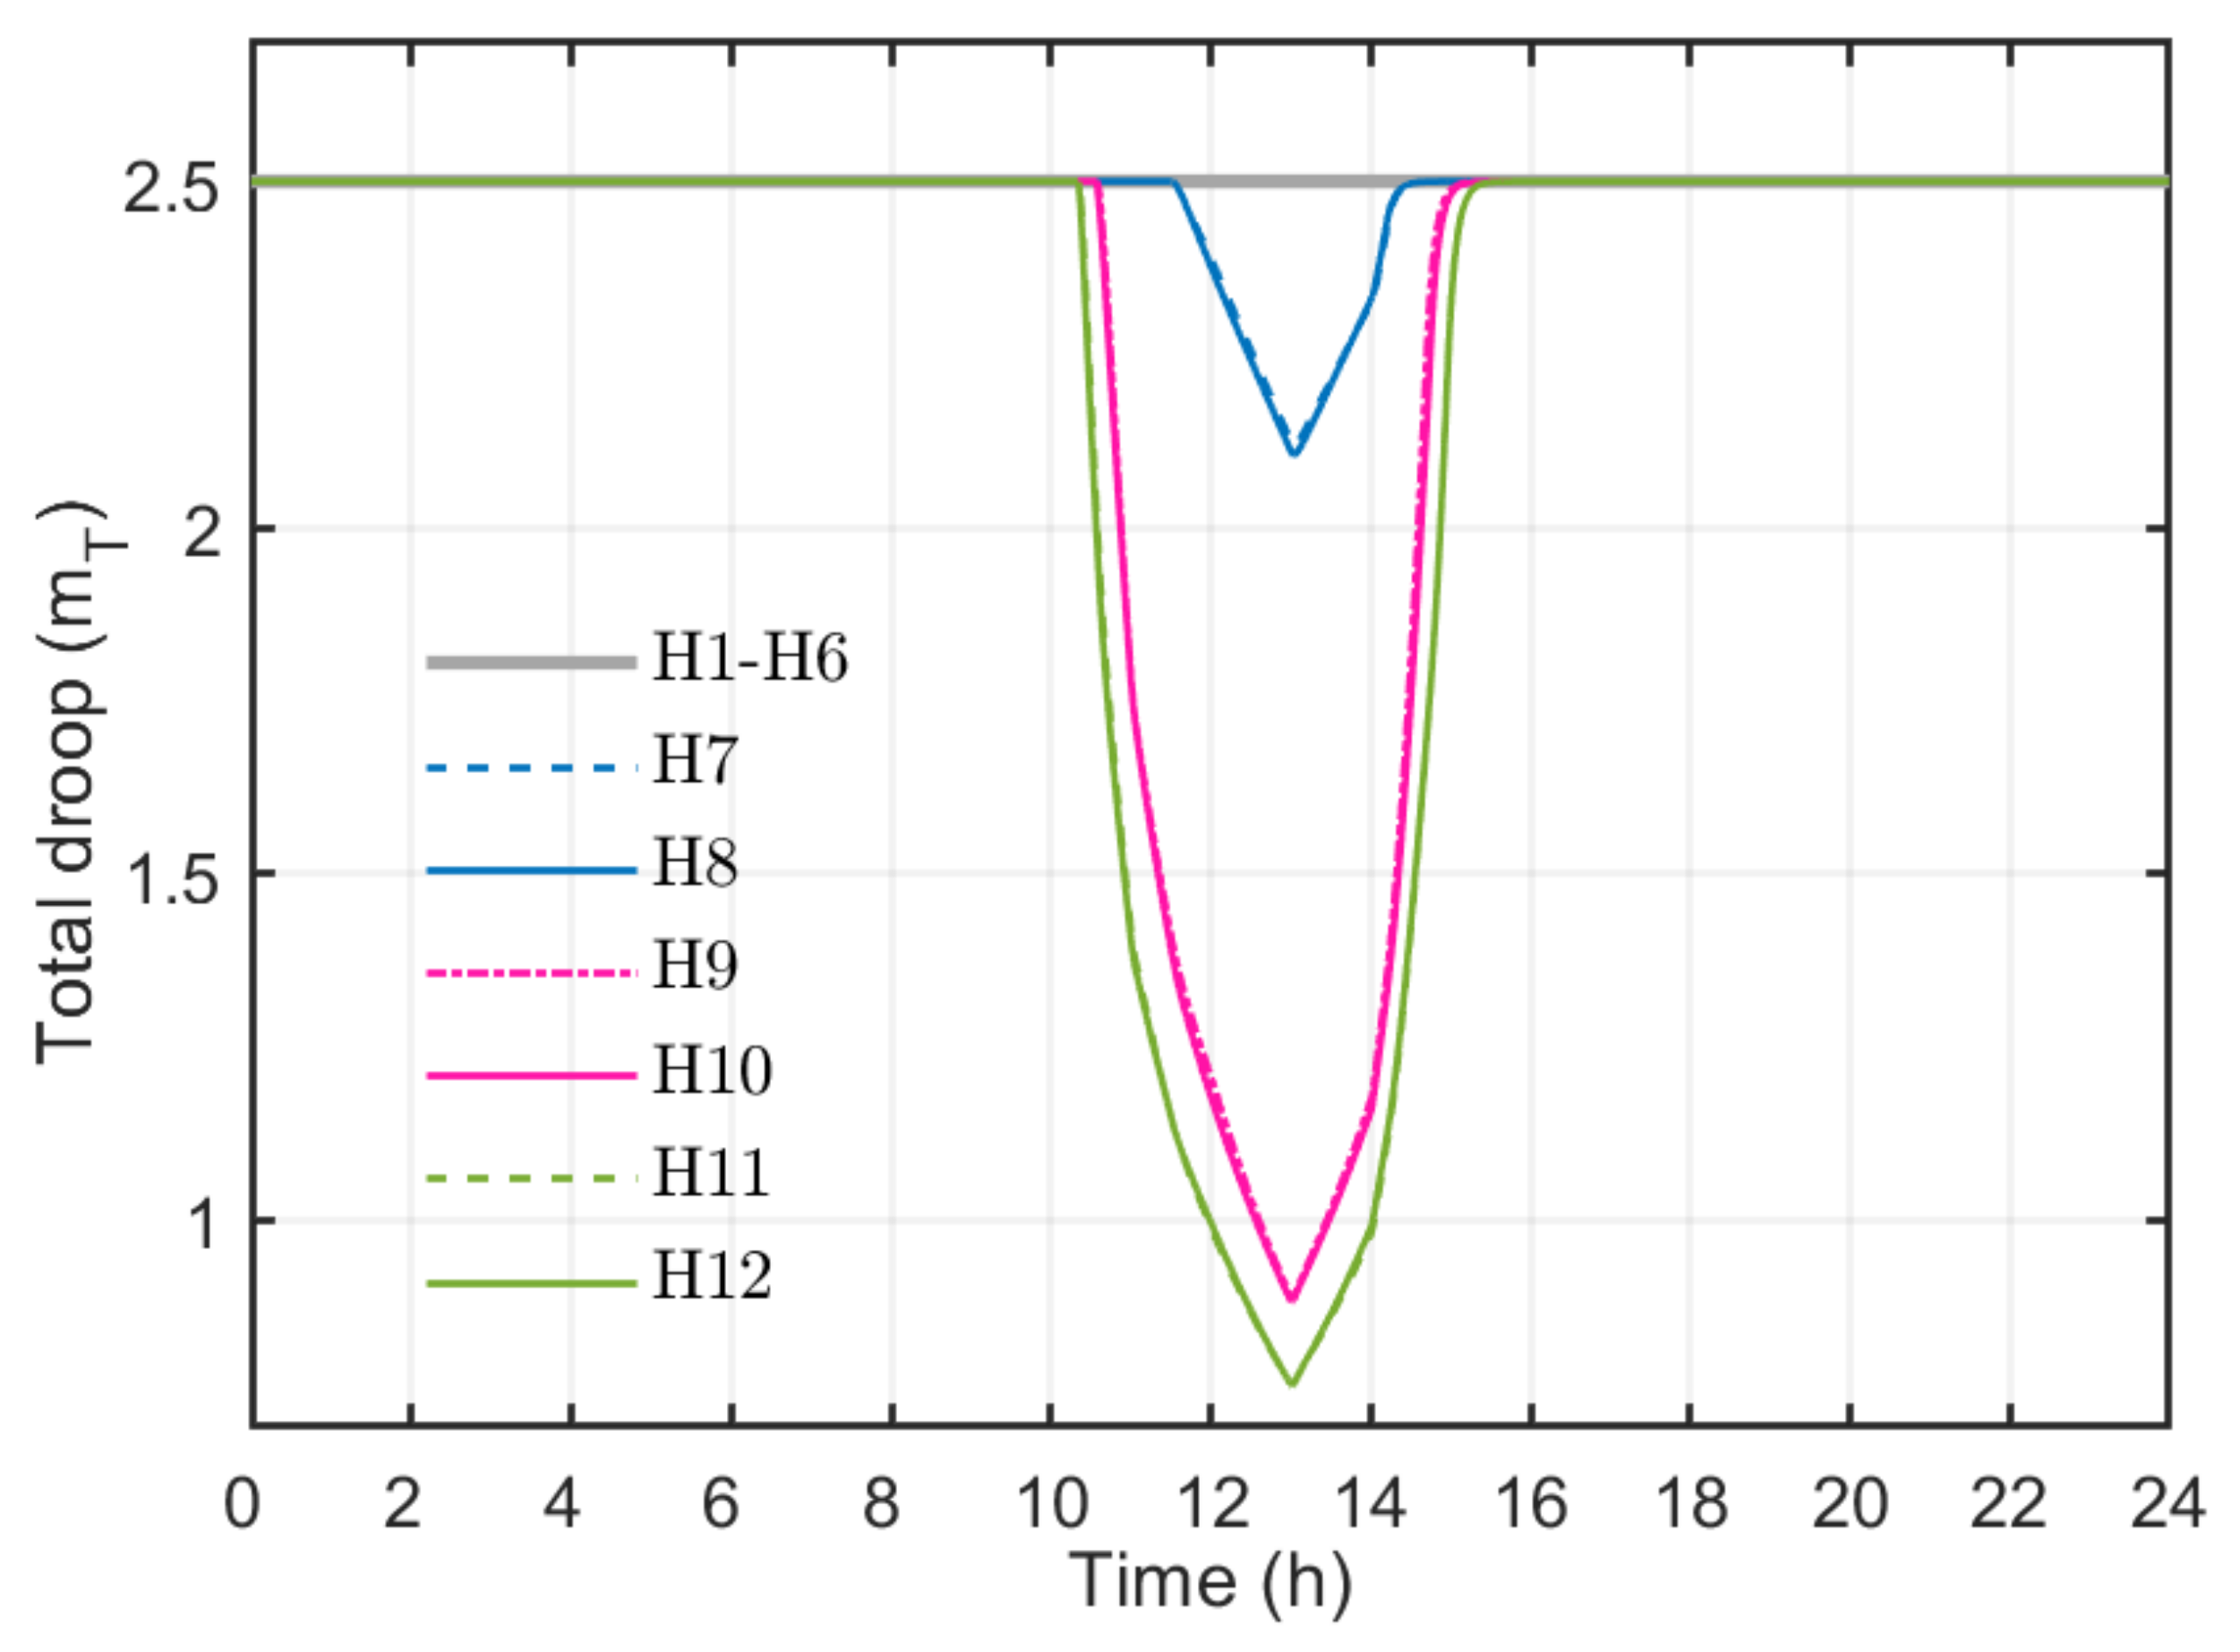
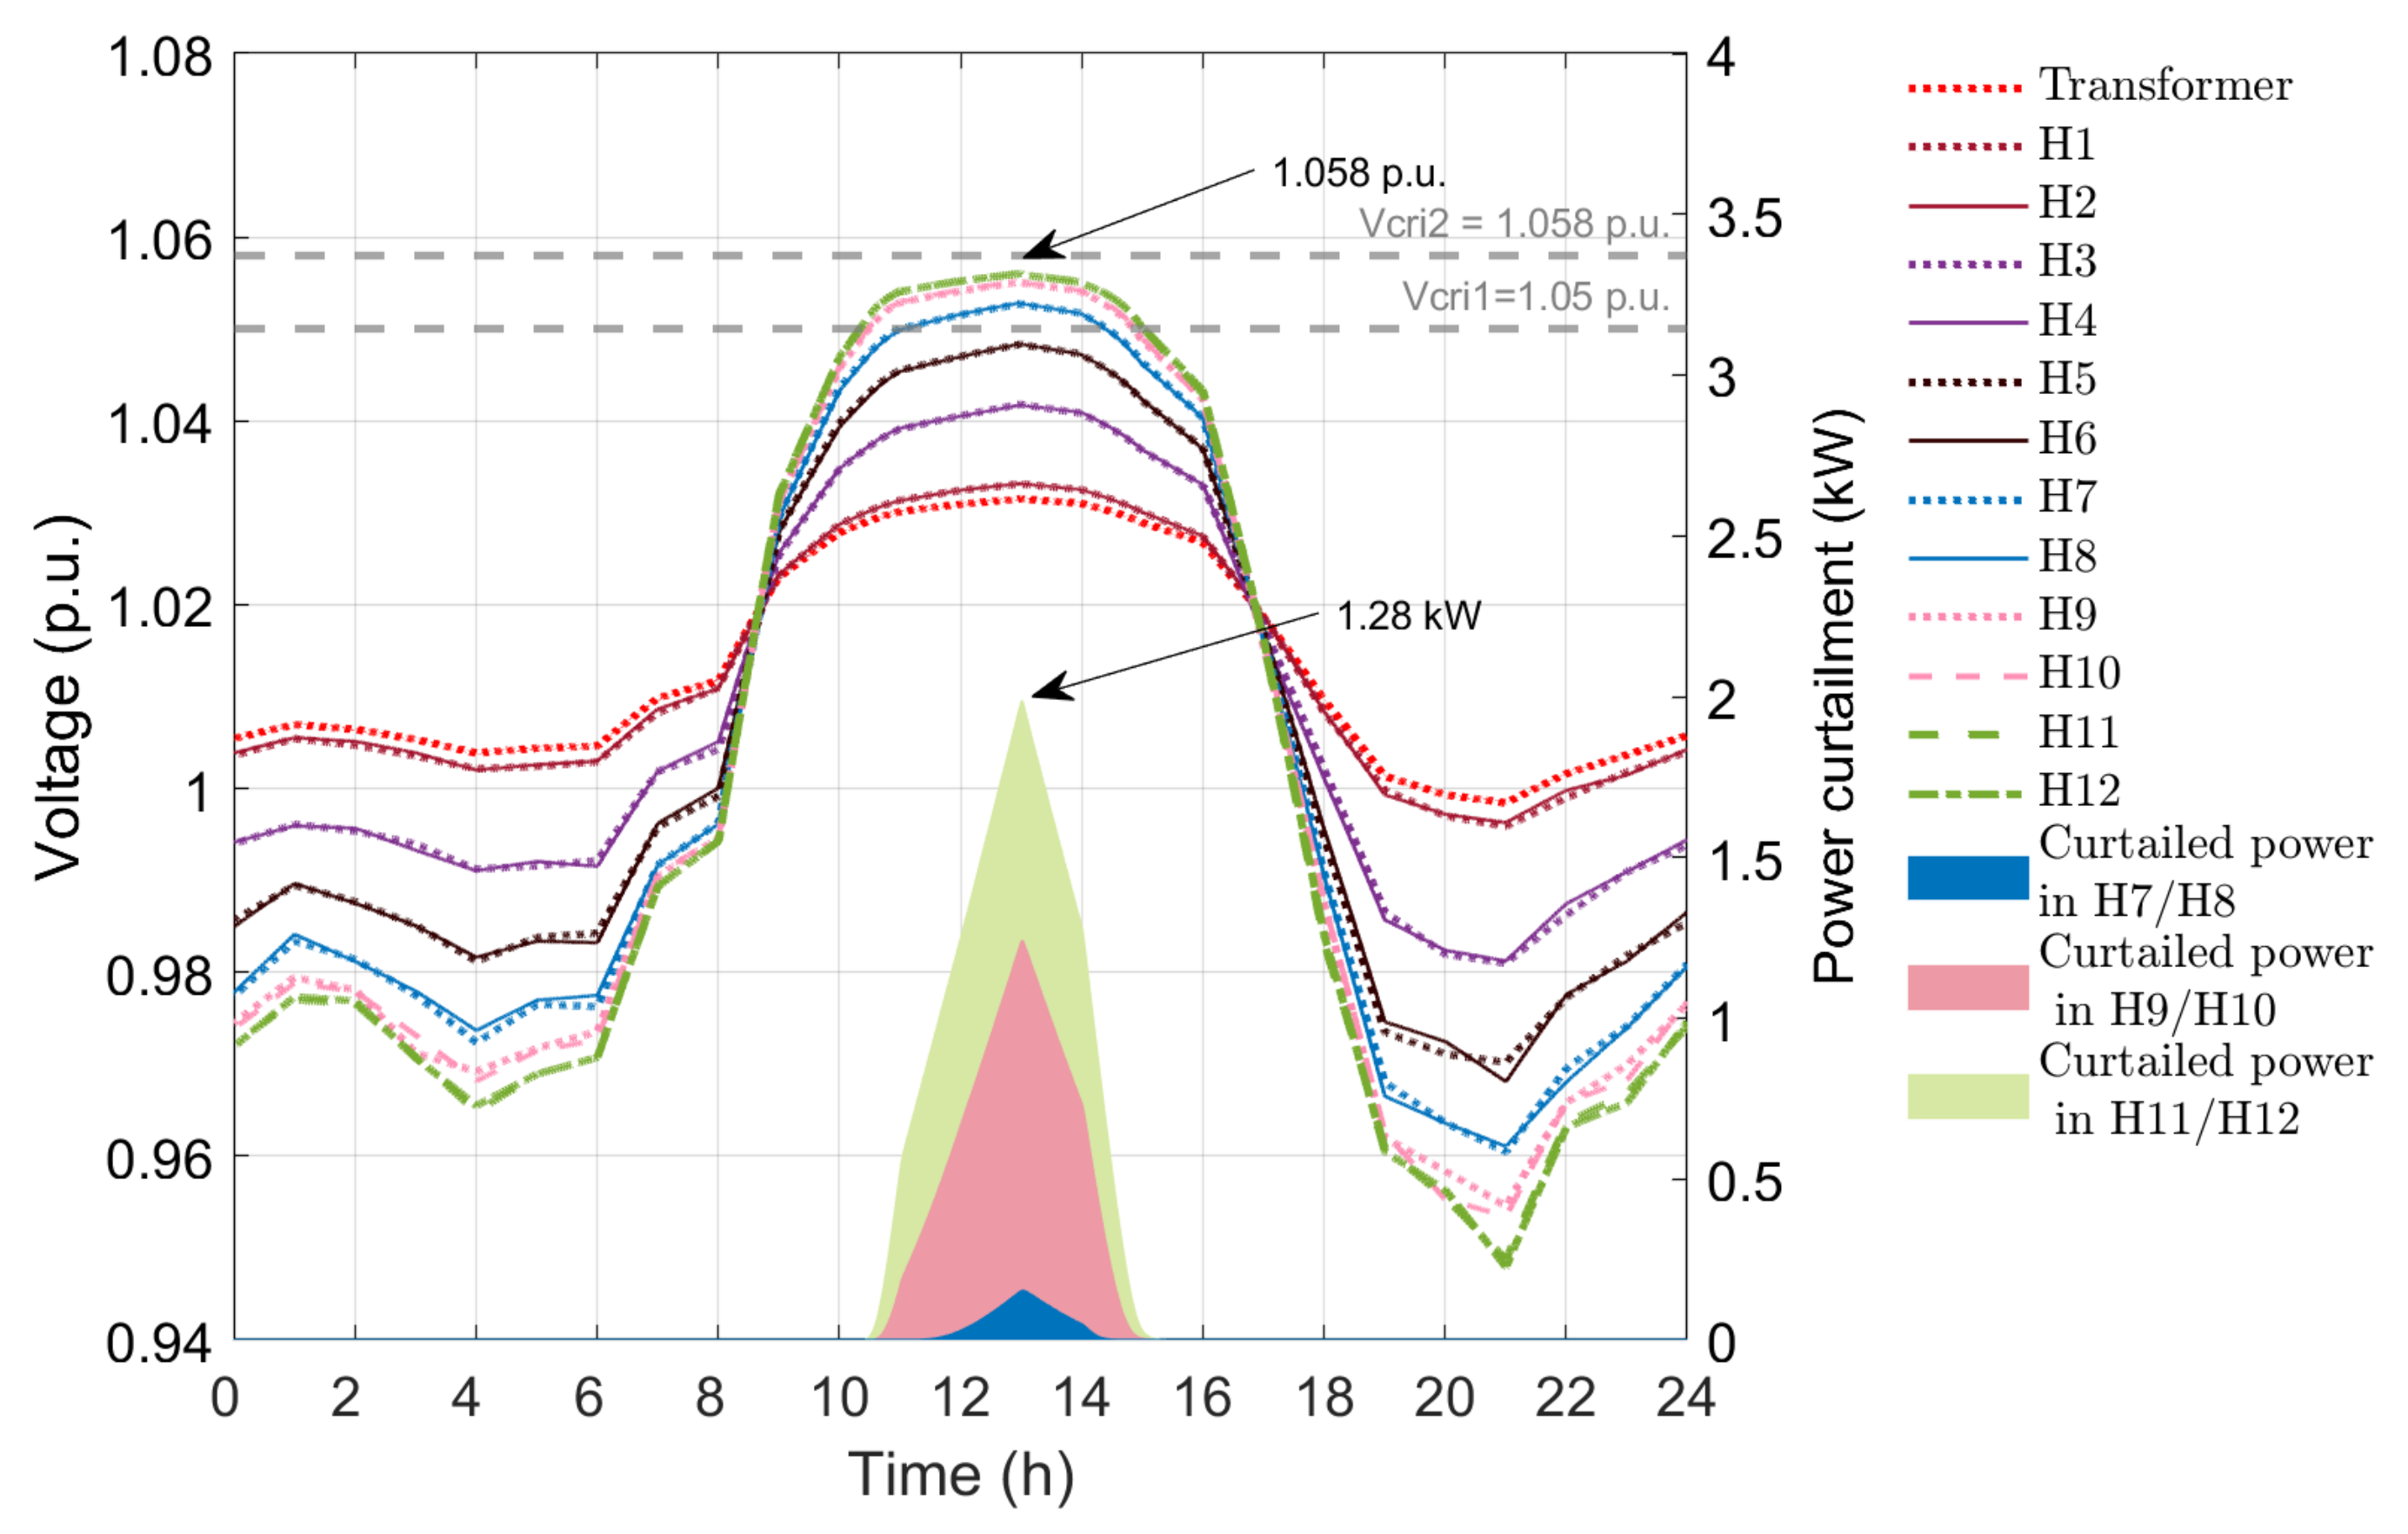
4.2. Proposed Supplementary Adaptive Droop Controller

4.2.1. Linear Droop Using ADP

The APC method with adaptive droop using ADP was implemented in each PV inverter of the twelve-house benchmark. The simulation time step was taken as 100 μ s, so the time delay for one time and two time-delayed feedback signal of frequency were 100 μ s and 200 μ s, respectively. The ADP was implemented using the s-function block of MATLAB/Simulink. The initial weights of the action and critic network of ADP were randomly initialized between 0.1 and 0.1 . The voltage at the POC and power curtailment were given as inputs in per unit form so that it can be used with any network parameters. The neural networks were then trained offline based on the procedure described in [29].
As the voltage at the POC is same for the symmetrical houses in every 20 m distance, a single ADP controller was used for each house pair to update the droop values during the training of the ADP. The network is assumed to have a simple communication link between each house pair for exchanging voltage, power curtailment, and droop coefficient values. The ADP controllers are used in odd numbered houses, and the average value of POC voltage and power curtailment of the houses in the house pair are used for training purpose. The adjustment for the droop values is sent to the even numbered houses by its house pair through the same communication link. The training was continued until reduced power curtailment was achieved with the voltage at POC being under allowable limits for all the houses. The proposed method was tested using the final trained weights. The testing phase for the ADP constitutes online learning, set up with a learning rate of 0.001. This procedure of reinforcement based learning aids in updating the control action, which leads to improved performance of the controller designed.
Figure 11 presents the voltage profile of the twelve houses and the power curtailment after using APC method using ADP. The maximum voltage at houses 9 to 12 is 1.057 p.u., which is less than V c r i 2 , and higher than in APC method with linear droop. The maximum power curtailment is 1.25 kW for houses 11 and 12. The maximum curtailments from house 7 to 10 are 1.11 kW. The adjusted droop after the action of supplementary control ADP is shown in Figure 12. The first six houses have constant droop function as calculated in Equation (7). This constant droop is adjusted for houses 9 to 12 by ADP, which leads to lower curtailment while allowing the voltage towards the upper bound limits. The energy output from PV inverters has increased to 470.83 kWh compared to 466.87 kWh in linear droop-based APC and energy curtailment has decreased to 18.77 kWh.

4.2.2. Quadratic Droop with ADP

The quadratic function in Equation (3) was used for designing adaptive droop using ADP. The neural network was trained and tested in similar manner as in the linear droop case. Figure 13 shows the voltage profile using quadratic droop APC method with ADP. The maximum voltage is in marginal boundary of 1.058 p.u. ( V c r i 2 ). The power curtailment for houses 11 and 12 increased slightly but decreased for houses 7 to 10. The total energy loss due to the PV curtailment has reduced to 12.98 kWh using the quadratic droop-based control with ADP.

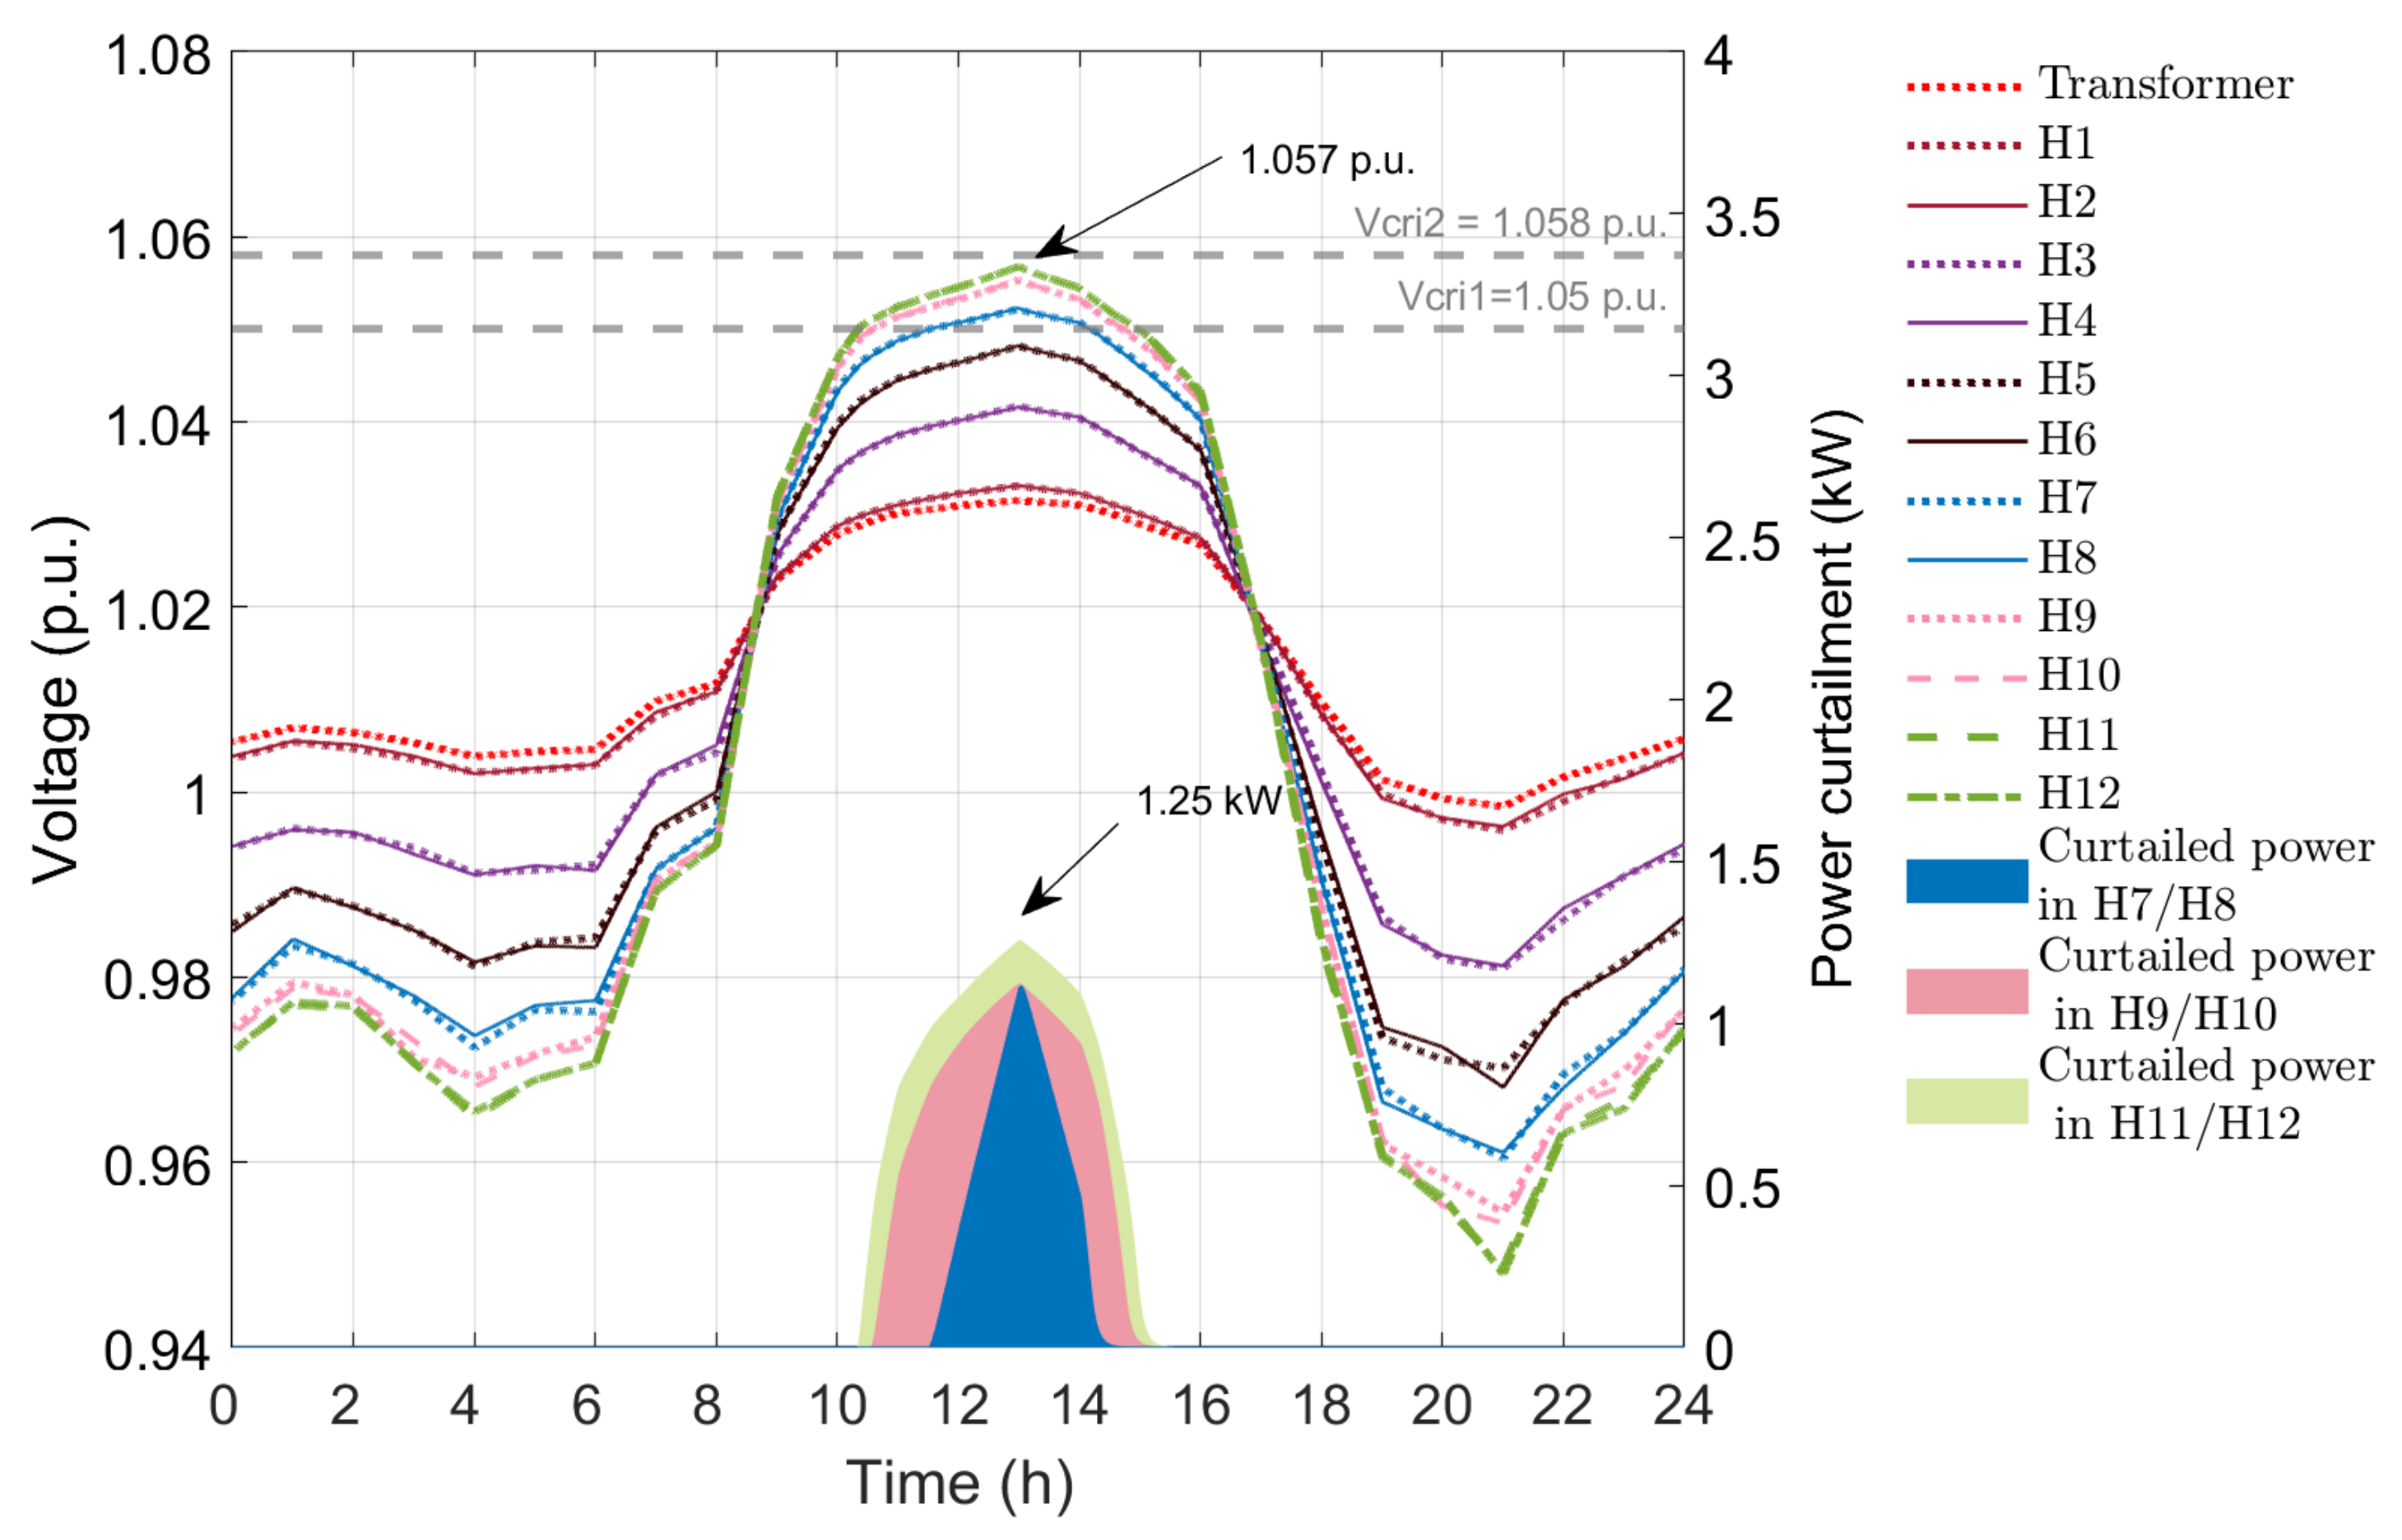
4.2.3. Exponential Droop with ADP

Likewise, the exponential function in Equation (4) was used for designing adaptive droop using ADP. Figure 14 shows the voltage profile using quadratic droop APC method with ADP. In this case also, the maximum voltage is in marginal boundary of 1.058 p.u. ( V c r i 2 ), which illustrates that the power curtailment in houses 7 to 10 has decreased to 10.86 kWh.

5. Comparisons of Performance

In this section, we compare the performance of different droop controllers established in the previous sections with and without the proposed supplementary controller. Table 2, Table 3 and Table 4 list the energy curtailed in each house using the droop-based techniques and the adaptive method using supplementary ADP. The energy curtailed in each house decrease in both quadratic and exponential droops than in linear droop-based APC method. This points out that changing droop coefficient can reduce unnecessary power curtailments in PV inverters in APC technique. It can been seen that using supplementary ADP in APC technique reduces the energy loss in the system in each of the droop-based technique. The proposed method reduced the total energy curtailment by about 17% with respect to base case using the linear droop, about 15% with respect to base case using the quadratic droop and about 12% with respect to base using the exponential droop-based methods. From a utility standpoint, it can be seen that the proposed method ensures better energy savings than existing droop-based method.

6. Conclusions

The APC method with both quadratic and exponential functions was able to reduce energy loss in the system, while maintaining the voltage profile within acceptable limits. Results indicate that adaptively changing the droop coefficient can significantly decrease the energy loss in individual houses, and the total energy loss in the overall system. Adaptively changing the droop coefficient using ADP reduced PV curtailment by 12–17%. Note that the proposed approach requires simple communication infrastructure for exchanging system parameters and control values within the houses at same POC. With the combination of exponential droop-based APC with ADP (total energy curtailment of 10.86 kWh), the results show excellent improved energy curtailment of approximately 50% less that in linear droop-based APC method (total energy curtailment of 22.72 kWh). The next step in this research would be to investigate the long-term impact on voltage regulation and PV curtailment. A detailed techno-economic analysis of the proposed control will be performed in this long-term impact study. Furthermore, the other area that can be explored is to incorporate reactive power compensation with combination of the proposed adaptive droop control to extend the applicability in LV distribution feeders.

Author Contributions

Conceptualization, M.M., U.T., Z.N. and R.T.; methodology, M.M. and U.T.; software, M.M.; validation, M.M., U.T. and R.T.; formal analysis, M.M., U.T., Z.N. and R.T.; investigation, M.M. and U.T.; resources, M.M.; data curation, M.M. and U.T.; writing—original draft preparation, M.M.; writing—review and editing, U.T., Z.N., B.B. and R.T.; visualization, M.M. and U.T.; supervision, R.T.; project administration, R.T.; funding acquisition, R.T. All authors have read and agreed to the published version of the manuscript.

Funding

This work is supported by the U.S. Department of Energy Office of Science, Office of Electricity Microgrid R&D Program, and Office of Energy Efficiency and Renewable Energy Solar Energy Technology Office under the EPSCoR grant number DE-SC0020281, National Science Foundation (NSF) MRI-1726964 and OAC-1949921. The work at Sandia (Ujjwol Tamrakar) is in part supported by the US Department of Energy Office, Office of Electricity, Energy Storage Program. Sandia National Laboratories is a multi-mission laboratory managed and operated by National Technology and Engineering Solutions of Sandia, LLC., a wholly owned subsidiary of Honeywell International, Inc., for the U.S. Department of Energy National Nuclear Security Administration under contract DE-NA-0003525. This paper describes objective technical results and analysis. Any subjective views or opinions that might be expressed in the paper do not necessarily represent the views of the U.S. Department of Energy or the United States Government. SAND NO.: SAND2021-10498J.

Data Availability Statement

The data presented in this study are available on request from the corresponding author.

Conflicts of Interest

The authors declare no conflict of interest.

Abbreviations

The following abbreviations are used in this manuscript:
APCActive Power Curtailment
ADPAdaptive Dynamic Programming
ANSIAmerican National Standards Institute
ESSEnergy Storage System
LVLow Voltage
POCPoint of Connection
PVPhotovoltaic

Appendix A

Table A1. Parameters for single phase LV transformer.
Transformer ParameterValue (p.u.)
Primary winding resistance0.006
Primary winding leakage inductance0.020
Secondary winding resistance0.012
Secondary winding leakage inductance0.025
Magnetizing resistance500
Magnetizing inductance500
Table A2. Parameters for single phase PI section line.
Line ParameterDrop LinePole-Pole Line
Resistance ( Ω /km)0.5490.346
Inductance (mH/km)0.2300.240
Capacitance ( μ F/km)0.0550.075

References

  1. Zubo, R.; Mokryani, G.; Rajamani, H.S.; Aghaei, J.; Niknam, T.; Pillai, P. Operation and planning of distribution networks with integration of renewable distributed generators considering uncertainties: A review. Renew. Sustain. Energy Rev. 2017, 72, 1177–1198. [Google Scholar] [CrossRef] [Green Version]
  2. Tonkoski, R.; Turcotte, D.; EL-Fouly, T.H.M. Impact of High PV Penetration on Voltage Profiles in Residential Neighborhoods. IEEE Trans. Sustain. Energy 2012, 3, 518–527. [Google Scholar] [CrossRef]
  3. Dugan, R.C.; McGranaghan, M.F.; Beaty, H.W. Electrical Power Systems Quality; McGraw-Hill: New York, NY, USA, 1996. [Google Scholar]
  4. National Electrical Manufacturers Association. American National Standard for Electric Power Systems and Equipment–Voltage Ratings (60 Hertz); ANSI Standard C84.1; NEMA: Arlington, VA, USA, 2016. [Google Scholar]
  5. Poudel, B. Overvoltage Prevention in Low Voltage Rural Distribution Network with High Penetration of Wind Energy. Master’s Thesis, Department of Electrical Engineering and Computer Science, South Dakota State University, Brookings, SD, USA, 2014. [Google Scholar]
  6. IEEE. IEEE Standard for Interconnection and Interoperability of Distributed Energy Resources with Associated Electric Power Systems Interfaces. In IEEE Std 1547-2018 (Revision of IEEE Std 1547-2003); IEEE: Piscataway, NJ, USA, 2018; pp. 1–138. [Google Scholar]
  7. Kabiri, R.; Holmes, D.G.; McGrath, B.P.; Meegahapola, L.G. LV Grid Voltage Regulation Using Transformer Electronic Tap Changing, With PV Inverter Reactive Power Injection. IEEE J. Emerg. Sel. Top. Power Electron. 2015, 3, 1182–1192. [Google Scholar] [CrossRef]
  8. Luthander, R.; Lingfors, D.; Widén, J. Large-scale integration of photovoltaic power in a distribution grid using power curtailment and energy storage. Sol. Energy 2017, 155, 1319–1325. [Google Scholar] [CrossRef]
  9. Nousdilis, A.I.; Kryonidis, G.C.; Kontis, E.O.; Christoforidis, G.C.; Papagiannis, G.K. An Exponential Droop Control Strategy for Distributed Energy Storage Systems Integrated with Photovoltaics. IEEE Trans. Power Syst. 2020, 36, 3317–3328. [Google Scholar] [CrossRef]
  10. Jannesar, M.R.; Sedighi, A.; Savaghebi, M.; Guerrero, J.M. Optimal placement, sizing, and daily charge/discharge of battery energy storage in low voltage distribution network with high photovoltaic penetration. Appl. Energy 2018, 226, 957–966. [Google Scholar] [CrossRef] [Green Version]
  11. Ghasemi, M.A.; Parniani, M. Prevention of distribution network overvoltage by adaptive droop-based active and reactive power control of PV systems. Electric Power Syst. Res. 2016, 133, 313–327. [Google Scholar] [CrossRef]
  12. Juamperez, M.; Yang, G.; Kjær, S.B. Voltage regulation in LV grids by coordinated volt-var control strategies. J. Mod. Power Syst. Clean Energy 2014, 2, 319–328. [Google Scholar] [CrossRef] [Green Version]
  13. Mai, T.T.; Haque, A.N.M.; Vergara, P.P.; Nguyen, P.H.; Pemen, G. Adaptive coordination of sequential droop control for PV inverters to mitigate voltage rise in PV-Rich LV distribution networks. Electr. Power Syst. Res. 2021, 192, 106931. [Google Scholar] [CrossRef]
  14. Shi, Q.; Feng, W.; Zhang, Q.; Wang, X.; Li, F. Overvoltage Mitigation through Volt-VAR Control of Distributed PV Systems. In Proceedings of the 2020 IEEE/PES Transmission and Distribution Conference and Exposition (T&D), Chicago, IL, USA, 12–15 October 2020; pp. 1–5. [Google Scholar]
  15. Almeida, D.; Pasupuleti, J.; Ekanayake, J.; Karunarathne, E. Mitigation of overvoltage due to high penetration of solar photovoltaics using smart inverters volt/var control. Indones. J. Electr. Eng. Comput. Sci. 2020, 19, 1259–1266. [Google Scholar] [CrossRef]
  16. Safayet, A.; Fajri, P.; Husain, I. Reactive Power Management for Overvoltage Prevention at High PV Penetration in a Low-Voltage Distribution System. IEEE Trans. Ind. Appl. 2017, 53, 5786–5794. [Google Scholar] [CrossRef]
  17. Olivier, F.; Aristidou, P.; Ernst, D.; Cutsem, T.V. Active Management of Low-Voltage Networks for Mitigating Overvoltages Due to Photovoltaic Units. IEEE Trans. Smart Grid 2016, 7, 926–936. [Google Scholar] [CrossRef] [Green Version]
  18. Ghosh, S.; Rahman, S.; Pipattanasomporn, M. Distribution Voltage Regulation Through Active Power Curtailment With PV Inverters and Solar Generation Forecasts. IEEE Trans. Sustain. Energy 2017, 8, 13–22. [Google Scholar] [CrossRef]
  19. Mahat, R.; Duwadi, K.; dos Reis, F.B.; Fourney, R.; Tonkoski, R.; Hansen, T.M. Techno-Economic Analysis of PV Inverter Controllers for Preventing Overvoltage in LV Grids. In Proceedings of the 2020 International Symposium on Power Electronics, Electrical Drives, Automation and Motion (SPEEDAM), Sorrento, Italy, 24–26 June 2020; pp. 502–507. [Google Scholar]
  20. Duwadi, K.; Foutney, R.; Tonkoski, R.; Hansen, T.M. Sustainability Metrics for Inverter-based Voltage Regulation Methods in PV-rich Low Voltage Grids. In Proceedings of the 2019 IEEE International Conference on Electro Information Technology (EIT), Brookings, SD, USA, 20–22 May 2019; pp. 441–446. [Google Scholar]
  21. Tonkoski, R.; Lopes, L.A.C.; El-Fouly, T.H.M. Coordinated Active Power Curtailment of Grid Connected PV Inverters for Overvoltage Prevention. IEEE Trans. Sustain. Energy 2011, 2, 139–147. [Google Scholar] [CrossRef]
  22. Chalise, S.; Atia, H.R.; Poudel, B.; Tonkoski, R. Impact of Active Power Curtailment of Wind Turbines Connected to Residential Feeders for Overvoltage Prevention. IEEE Trans. Sustain. Energy 2016, 7, 471–479. [Google Scholar] [CrossRef]
  23. Wang, Y.; Zhang, P.; Li, W.; Xiao, W.; Abdollahi, A. Online Overvoltage Prevention Control of Photovoltaic Generators in Microgrids. IEEE Trans. Smart Grid 2012, 3, 2071–2078. [Google Scholar] [CrossRef]
  24. Alyami, S.; Wang, Y.; Wang, C.; Zhao, J.; Zhao, B. Adaptive Real Power Capping Method for Fair Overvoltage Regulation of Distribution Networks With High Penetration of PV Systems. IEEE Trans. Smart Grid 2014, 5, 2729–2738. [Google Scholar] [CrossRef]
  25. Sun, H.; Guo, Q.; Qi, J.; Ajjarapu, V.; Bravo, R.; Chow, J.; Li, Z.; Moghe, R.; Nasr-Azadani, E.; Tamrakar, U.; et al. Review of Challenges and Research Opportunities for Voltage Control in Smart Grids. IEEE Trans. Power Syst. 2019, 34, 2790–2801. [Google Scholar] [CrossRef] [Green Version]
  26. Singhal, A.; Ajjarapu, V.; Fuller, J.; Hansen, J. Real-time local volt/var control under external disturbances with high PV penetration. IEEE Trans. Smart Grid 2018, 10, 3849–3859. [Google Scholar] [CrossRef] [Green Version]
  27. Si, J.; Wang, Y.T. Online learning control by association and reinforcement. IEEE Trans. Neural Netw. 2001, 12, 264–276. [Google Scholar] [CrossRef]
  28. Shrestha, D.; Tamrakar, U.; Malla, N.; Ni, Z.; Tonkoski, R. Reduction of energy consumption of virtual synchronous machine using supplementary adaptive dynamic programming. In Proceedings of the 2016 IEEE International Conference on Electro Information Technology (EIT), Grand Forks, ND, USA, 19–21 May 2016; pp. 0690–0694. [Google Scholar]
  29. Malla, N.; Shrestha, D.; Ni, Z.; Tonkoski, R. Supplementary control for virtual synchronous machine based on adaptive dynamic programming. In Proceedings of the 2016 IEEE Congress on Evolutionary Computation (CEC), Vancouver, BC, Canada, 24–29 July 2016; pp. 1998–2005. [Google Scholar]
  30. Guo, W.; Liu, F.; Si, J.; He, D.; Harley, R.; Mei, S. Online Supplementary ADP Learning Controller Design and Application to Power System Frequency Control With Large-Scale Wind Energy Integration. IEEE Trans. Neural Netw. Learn. Syst. 2016, 27, 1748–1761. [Google Scholar] [CrossRef]
  31. Tang, Y.; He, H.; Ni, Z.; Wen, J.; Sui, X. Reactive power control of grid-connected wind farm based on adaptive dynamic programming. Neurocomputing 2014, 125, 125–133. [Google Scholar] [CrossRef]
  32. Ni, Z.; He, H.; Wen, J. Adaptive learning in Tracking Control Based on the Dual Critic Network Design. IEEE Trans. Neural Netw. Learn. Syst. 2013, 24, 913–928. [Google Scholar]
  33. Malla, N.; Tamrakar, U.; Shrestha, D.; Ni, Z.; Tonkoski, R. Online Learning Control for Harmonics Reduction based on Current Controlled Voltage Source Power Inverters. IEEE/CCA J. Autom. Sin. 2017, 4, 447–457. [Google Scholar] [CrossRef]
  34. Maharjan, M.; Tamrakar, U.; Malla, N.; dos Reis, F.B.; Ni, Z.; Hansen, T.M.; Tonkoski, R. Adaptive droop-based active power curtailment method for overvoltage prevention in low voltage distribution network. In Proceedings of the 2017 IEEE International Conference on Electro Information Technology (EIT), Lincoln, NE, USA, 14–17 May 2017; pp. 1–6. [Google Scholar]
  35. Maharjan, M. Voltage Regulation of Low Voltage Distribution Networks; South Dakota State University: Brookings, SD, USA, 2017. [Google Scholar]
  36. Tonkoski, R.; Lopes, L.A.C. Voltage Regulation in Radial Distribution Feeders with High Penetration of Photovoltaic. In Proceedings of the 2008 IEEE Energy 2030 Conference, Atlanta, GA, USA, 17–18 November 2008; p. 7. [Google Scholar]
  37. MATLAB Matlab User’s Guide; The Mathworks Inc.: Natick, MA, USA, 2015.
  38. Atia, H.R.; Shakya, A.; Tandukar, P.; Tamrakar, U.; Hansen, T.M.; Tonkoski, R. Efficiency analysis of AC coupled and DC coupled microgrids considering load profile variations. In Proceedings of the 2016 IEEE International Conference on Electro Information Technology (EIT), Grand Forks, ND, USA, 19–21 May 2016; pp. 0695–0699. [Google Scholar]
  39. dos Reis, F.B.; Tonkoski, R.; Hansen, T.M. Synthetic residential load models for smart city energy management simulations. IET Smart Grid 2020, 3, 342–354. [Google Scholar] [CrossRef]
  40. Hansen, T.M.; Chong, E.K.; Suryanarayanan, S.; Maciejewski, A.A.; Siegel, H.J. A partially observable markov decision process approach to residential home energy management. IEEE Trans. Smart Grid 2018, 9, 1271–1281. [Google Scholar] [CrossRef]
Figure 1. Droop-based active power curtailment (APC) method for LV distribution networks with PV systems.
Applsci 11 07900 g001
Figure 2. Linear, quadratic, and exponential droop for APC method.
Applsci 11 07900 g002
Figure 3. Adaptive dynamic programming (ADP) controller for adaptive droop control with droop-based APC technique.
Applsci 11 07900 g003
Figure 4. Structure of ADP controller with two neural network structures: action and critic network.
Applsci 11 07900 g004
Figure 5. Benchmark of the suburban residential voltage distribution network.
Applsci 11 07900 g005
Figure 6. Solar PV power and house load profile (House 1 to House 12) for a day.
Applsci 11 07900 g006
Figure 7. Voltage profile of twelve houses (House 1 to House 12) in the base case.
Applsci 11 07900 g007
Figure 8. Voltage profile of twelve houses (House 1 to House 12) and curtailed power in APC method with linear droop.
Applsci 11 07900 g008
Figure 9. Voltage profile of twelve houses (House 1 to House 12) and curtailed power in APC method with quadratic droop.
Applsci 11 07900 g009
Figure 10. Voltage profile of twelve houses (House 1 to House 12) and curtailed power in APC method with exponential droop.
Applsci 11 07900 g010
Figure 11. Voltage profile of twelve houses (House 1 to House 12) and curtailed power in linear droop-based APC method using ADP.
Applsci 11 07900 g011
Figure 12. Droop values of twelve houses (House 1 to House 12) in linear droop-based APC method using ADP. Total droop ( m T ) for each house is the sum of constant droop ( m = 2.5 kW/V) and droop adjustment from ADP ( m A D P ).
Applsci 11 07900 g012
Figure 13. Voltage profile of twelve houses (House 1 to House 12) and curtailed power in quadratic droop-based APC method using ADP.
Applsci 11 07900 g013
Figure 14. Voltage profile of twelve houses (House 1 to House 12) and curtailed power in exponential droop-based APC method using ADP.
Applsci 11 07900 g014
Table 1. Maximum power curtailment and energy curtailed for different droop functions.
Droop FunctionMaximum Power Curtailment (kW)Total Energy Curtailed (kWh)
H7/H8H9/H10H11/H12
Linear0.441.662.1722.72
Quadratic0.171.201.9515.27
Exponential0.110.951.9212.40
Table 2. Energy curtailed (kWh) for twelve houses with Linear droop.
Linear DroopH1–H6H7H8H9H10H11H12Total
(kWh)
APC00.480.544.184.366.596.5922.72
APC with ADP01.651.713.373.444.294.2918.77
Table 3. Energy curtailed (kWh) for twelve houses with Quadratic droop.
Quadratic
Droop
H1–H6H7H8H9H10H11H12Total
(kWh)
APC00.220.232.492.634.874.8115.27
APC with ADP00.510.532.342.463.573.5412.98
Table 4. Energy curtailed (kWh) for twelve houses with Exponential droop.
Exponential
Droop
H1–H6H7H8H9H10H11H12Total
(kWh)
APC00.150.161.791.904.244.1612.40
APC with ADP00.240.261.811.923.333.2710.86
Publisher’s Note: MDPI stays neutral with regard to jurisdictional claims in published maps and institutional affiliations.

