
Study of the Phenolic Compound Profile of Arbutus unedo L. Fruits at Different Ripening Stages by HPLC-TQ-MS/MS


Department of Chemical and Environmental Technology, E.S.C.E.T, Rey Juan Carlos University, C/Tulipán s/n, 28933 Móstoles, Madrid, Spain
*
Author to whom correspondence should be addressed.
Appl. Sci. 2021, 11(24), 11616; https://doi.org/10.3390/app112411616
Submission received: 22 October 2021
/
Revised: 29 November 2021
/
Accepted: 1 December 2021
/
Published: 7 December 2021
(This article belongs to the Special Issue Novel Research on Safety Detection and Quality Control of Food)
Abstract
:Arbutus unedo L. berries have traditionally been used as edible and medicinal fruits in folk medicine for the treatment of some pathologies. Besides their good nutritional properties, these berries are rich in bioactive compounds. Accordingly, a HPLC-triple quadrupole (TQ)-MS/MS method was developed and validated for the first time to characterize the changes produced in the phenolic composition profile of A. unedo L. fruits through three ripening stages. Several hydroxycinnamic and hydroxybenzoic acids were detected, gallic acid being the highest phenolic acid quantified. Quercetin, quercetin-3-β-glucoside, rutin, and kaempferol were found in similar amounts at the different maturity stages. High amounts of (+)-catechin, procyanidin B2, epigallocatechin, and (−)-epigallocatechin gallate were observed in the unripe fruits. Naringin and vitexin were also quantified. Stilbenes, such as trans-resveratrol and trans-piceid, were identified for the first time in these fruits. Total phenolic compounds, total anthocyanin compounds, and radical scavenging activity were also determined in the fruits harvested at different years in several locations of the Iberian Peninsula at different ripening stages. The results confirmed that these fruits are an excellent source of these bioactive compounds (mainly flavanols) with high antioxidant activity, which could be used as a new source for preparation of nutraceutical or functional foods.

1. Introduction
Arbutus unedo L., also known as the strawberry tree, is a widespread evergreen shrub native to the Mediterranean region and North Africa, belonging to the Ericaceae family. Its fruits are a dark red drupe or berry with a spherical shape of approximately 2 cm in diameter and that is only tasty in late autumn when they are fully ripe. Traditionally, the consumption of fresh strawberry tree berries has been rare, and instead they are commonly used for the production of alcoholic beverages, such as wines, liqueurs, and brandies, or for the elaboration of prepared foods, such as jellies, compotes, and jams [1,2,3]. These wild berries have excellent nutritional value [4,5,6,7] and are rich in bioactive components like phenolic compounds (PC), vitamins, and carotenoids, which are directly related to many beneficial health effects thanks to their high antioxidant capacity [5,8,9]. In fact, the leaves and berries of A. unedo L. are used in natural medicine as antiseptics, diuretics, and laxatives [2,10,11], as well as in the treatment of cardiovascular diseases, such as hypertension, arteriosclerosis, and thrombosis [12,13,14]. These pharmacological effects can be associated with the bioactive compounds previously mentioned, mainly the PC.
Plant PC are a wide group of secondary metabolites and common constituents of fruits and vegetables, which are considered an important class of antioxidant natural substances [15,16,17]. Their potent antioxidant capacity gives them a wide range of pharmacological properties, including anti-inflammatory, antiallergic, antibacterial, and anticancer activities [18,19]. In addition, they also reduce the risk of diseases mediated by oxidative stress, such as cardiovascular disease [20,21]. There are many families and types of PC. The flavonoid family (flavones, flavonols, flavanols, flavanones, anthocyanins, and isoflavonoids) is the most common and widely distributed [22]. In a characterization study of PC in wild fruits, it was stated that catechin was the most abundant compound in A. unedo L., which also presented the highest concentration of flavanols in comparison to the rest of the wild fruits analyzed, such as blackthorn, among others [23]. Some flavonols, such as quercetin and myricetin, have also been quantified in these fruits [2]. Anthocyanins have also been described in the phenolic composition of the strawberry tree fruits. Indeed, they play a fundamental role, since they provide the characteristic red color of the berries, as well as high antioxidant activity [24]. Regarding phenolic acids, some of them, such as gallic, protocatechuic, p-hydroxybenzoic and vanillic, among others, have also been identified in the strawberry tree fruits [4]. Furthermore, the strawberry tree berry is one of the richest fruits in PC with high antioxidant activity, as demonstrated by García-Alonso et al. [25]. However, the chemical composition and antioxidant activity of strawberry tree fruits is highly influenced by the ripening stage and the environmental and climatic conditions. In this sense, Oliveira et al. studied the influence of the ripening stage on the chemical composition and antioxidant activity of the strawberry tree berry by using spectrophotometric methods [26]. They observed that the total PC (TPC) was higher in the unripe and intermediate stages of ripeness. On the other hand, Ruiz-Rodriguez et al. provided original data on the nutritional value of wild strawberry tree fruits, studying the variation of some nutritional parameters and the changes in the concentration of some bioactive compounds of fruits harvested in different years from two different Spanish areas [27]. Nevertheless, these works have a limited number of analyzed samples and/or compounds, and no data have been published about the variation of the PC profile determined by HPLC-MS/MS to date.
Based on these previous works, and in order to gain broad knowledge about the phenolic composition of strawberry tree berries, this work proposes a HPLC-TQ-MS/MS method to identify and quantify 21 PC, including phenolic acids (hydroxybenzoic and hydroxycinnamic acids), flavonoids (flavonols, flavanols, flavanones, flavones), and stilbenes. The chromatographic method was applied to characterize, for the first time, the changes in the phenolic composition profile of strawberry tree berries at three ripening stages (unripe, intermediate, and ripe). For this purpose, the optimization of the extraction conditions of the PC in the strawberry tree berry samples was carried out, including the selection of the extraction solvent, the type and time of stirring, the extraction cycles and, finally, the sample/solvent ratio. In addition, the changes of the TPC, the total anthocyanin compounds (TAC), and the radical scavenging activity (RSA) experimented by strawberry tree fruits harvested in different years from different areas of the Iberian peninsula at different ripening stages (unripe, intermediate, and ripe) was also evaluated by spectrophotometric techniques. The results obtained in this work may help to determine the best growing and maturation conditions for this wild fruit to be adequately used for the development of dietary supplements or functional foods in the food industry because of its high concentration of phenolic compounds.
2. Materials and Methods
2.1. Chemicals, Reagents and Standard Solutions
Folin-Ciocalteu Reagent (FCR), 2,2-diphenyl-1-picrylhydrazyl (DPPH•), and 6-hydroxy-2,5,7,8-tetramethylchromane-2-carboxylic acid (Trolox) were purchased from Sigma-Aldrich (Madrid, Spain). Potassium chloride analysis grade, hydrochloric acid (37%), ethanol (EtOH), methanol (MeOH), and acetonitrile (ACN) LC-MS grade were purchased from Scharlau (Barcelona, Spain). Ammonium acetate and formic acid LC-MS grade were purchased from Fluka (Busch, Switzerland). Sodium acetate, acetic acid, and anhydrous sodium carbonate analysis grade were obtained from Panreac Quimica (Barcelona, Spain). Water (resistivity 18.2 MΩ cm) was obtained from a Millipore Milli-Q-System (Billerica, MA, USA).
All analytical standards were of high purity grade (≥90%). Gallic acid, protocatechuic acid, syringic acid, vanillic acid, p-coumaric acid, chlorogenic acid, caffeic acid, caftaric acid, quercetin, quercetin 3-β-glucoside, rutin, kaempferol, (+)-catechin, (−)-epigallocatechin gallate, epigallocatechin, procyanidin B2, naringin, vitexin (apigenin-β-C-glucoside), trans-piceid, and trans-resveratrol were from Sigma-Aldrich (St. Louis, MO, USA), whereas 4-hydroxybenzoic acid was obtained from Acros Organics (Geel, Belgium).
Stock standard solutions (1000 mg/L) were prepared by diluting adequate amounts of each compound in MeOH and stored at −18 °C. Working solutions (10–100 mg/L) were prepared by appropriate dilution of the stock solutions with MeOH and stored at −18 °C. Mixed standard solutions (1–25 mg/L) were prepared daily by dilution of suitable volumes of working solutions with MeOH.
2.2. Samples
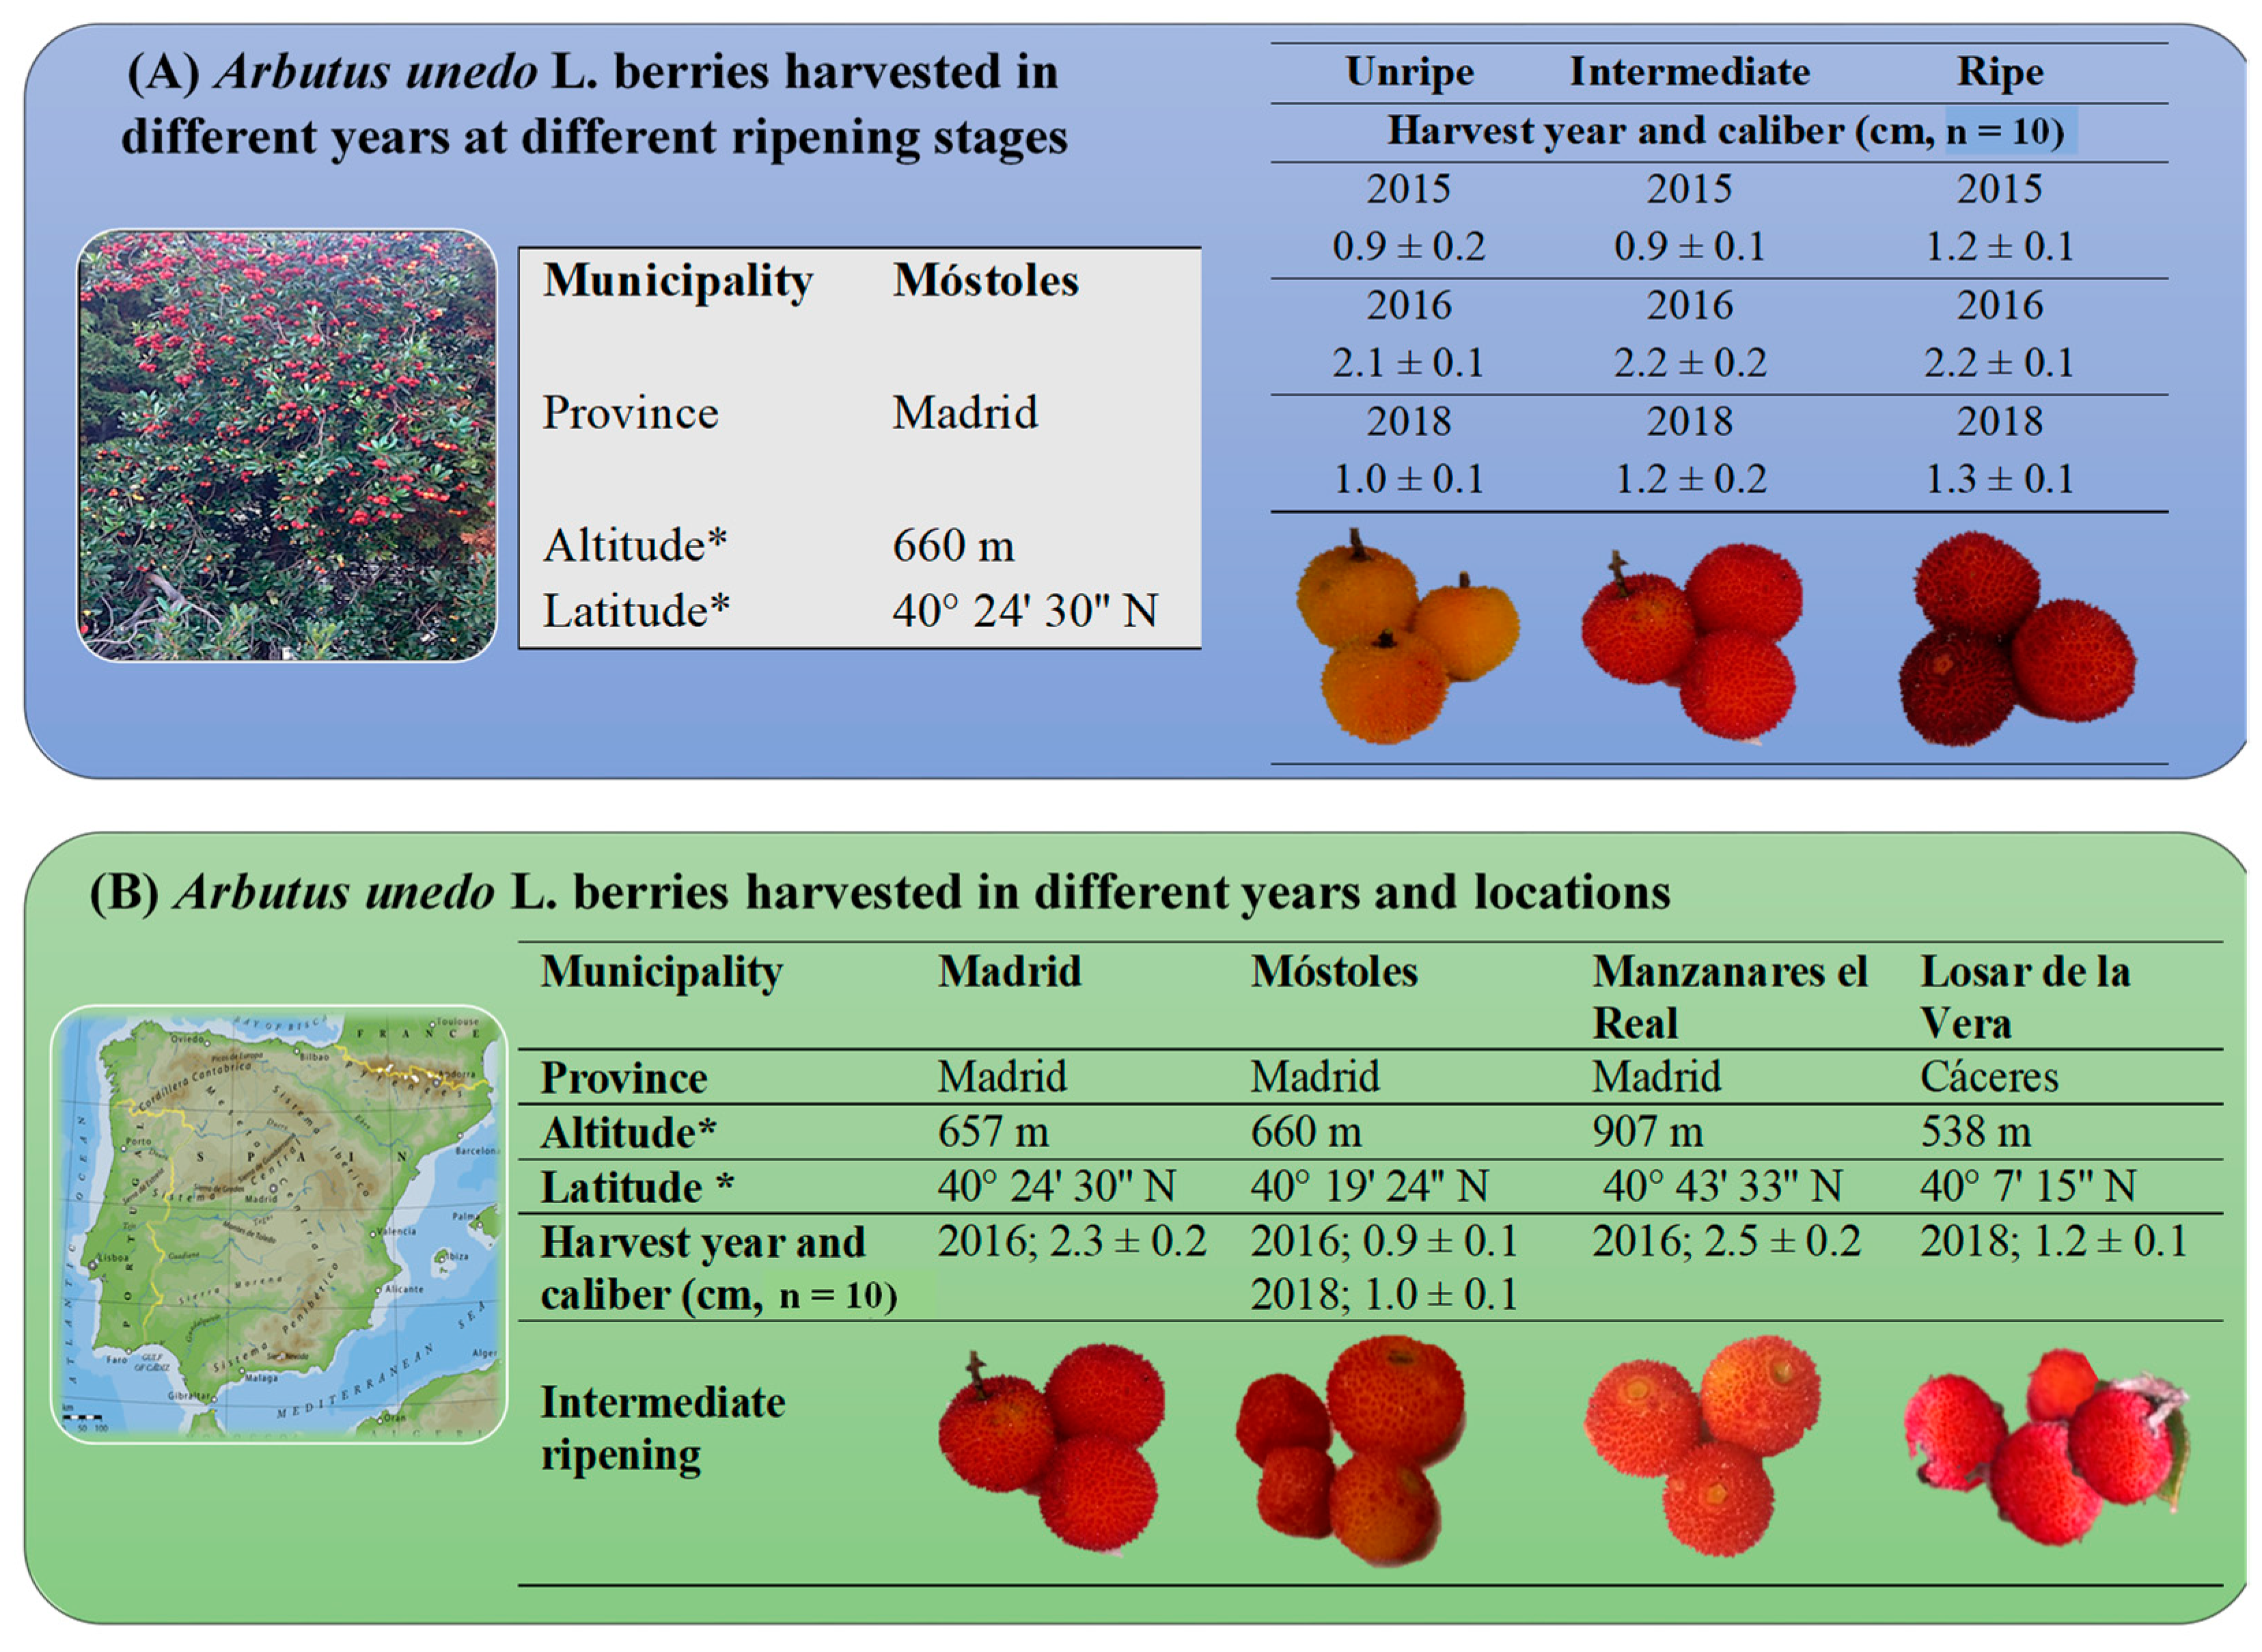
The fruits of A. unedo L. were collected at two different areas of Spain (Figure 1): (a) Comunidad de Madrid (center of the Iberian Peninsula), where berries were harvested at three different localities: Madrid (center), Móstoles (southwest), and Manzanares el Real (northwest), and (b) Extremadura (southwest of the Iberian Peninsula), where berries were harvested at Losar de la Vera (Cáceres). Likewise, three lots of berries of each ripening stage (unripe, intermediate, and ripe) were randomly collected in Móstoles across three consecutive years (Figure 1a). On the other hand, three lots of berries at the intermediate ripening stage were collected in both Spanish provinces in two consecutive years (Figure 1b). The ripeness degree of A. unedo L. berries was visually established using the collector’s criteria based on the color and texture, according to growth conditions and the month of the year. Thus, the unripe berries were collected in the second week of November, the intermediate ones in the second week of December, and the ripe fruits in the second week of January. All the selected berries presented a healthy external appearance, and samples were immediately taken to the laboratory and frozen at −20 °C for subsequent analysis. In order to obtain comparable data, the moisture content of the strawberry tree fruits was determined by desiccation to constant weight at 100 ± 2 °C, following the AOAC procedure with slight modifications [28]. Additionally, the caliber of the samples was also measured: 10 samples (n = 10) were measured in height and width, and the mean of both values was performed for each sample. The caliber of each strawberry tree berry sample collected is shown in Figure 1.
2.3. Conditions Used for the Optimization of the Extraction Procedure
Firstly, in order to optimize the extraction conditions of the PC from the samples, different assays were performed, including the selection of the extraction solvent, the type and time of stirring, the number of extraction cycles and, finally, the sample/solvent ratio. These studies were carried out with ripe strawberry tree berries and the TPC, the free radical DPPH• scavenging activity, and the TAC of the strawberry tree extracts were determinate in each study.
2.3.1. Total Phenolic Compounds (TPC)
The concentration of PC in the sample extracts was determined according to the Folin-Ciocalteu method [29] with some modifications: 75 μL aliquot of the sample extract was mixed with 645 μL of Milli-Q water and 30 μL of FCR. Then, 75 μL of 20% (w/v) sodium carbonate and 675 μL of Milli-Q water were added, and the total solution was mixed briefly in the vortex. The mixture was incubated for 60 min at room temperature in darkness. Each sample extract was incubated in duplicate (n = 4). At the end of the incubation period, the absorbance was measured in triplicate using a UV-Vis spectrophotometer (Cary 60, Agilent, Santa Clara, CA, USA) at a wavelength of 725 nm. A standard calibration curve was prepared with gallic acid at a concentration range of 10–500 mg/L (w/v) (y = 0.0033x + 0.0498; R2 = 0.99). The results were expressed as mg gallic acid equivalents (GAE)/100 g of fresh weight (FW).
2.3.2. Free Radical DPPH• Scavenging Activity (RSA)
The RSA of grape berry extracts was evaluated by a modified colorimetric method proposed by Brand-Williams et al. [30]. In order to estimate the RSA, firstly, a DPPH• solution (40 ppm, w/v) was freshly prepared in MeOH. Then, 3.9 mL of this DPPH• solution was mixed with 0.1 mL of a 1:10 (v/v) extract sample or with 0.1 mL of MeOH (for blank samples), and the mixture was shaken in a Vortex. The reaction mixture was left for 60 min at room temperature in the dark. Each sample extract was incubated in duplicate (n = 4). After the incubation period, the absorbance was measured in triplicate at 517 nm to determine the concentration of remaining DPPH• radical. Therefore, RSA (%) was calculated using the following equation:
where ADPPH is the absorbance of the DPPH• radical in the MeOH solution (blank) and Asample is the absorbance of the DPPH• radical in the berry extract (sample). A standard calibration curve was prepared with Trolox at a concentration range of 0.5–400 mg/L (w/v) (y = 0.1894x + 0.864; R2 = 0.99). Finally, the RSA of the samples was expressed as mg Trolox equivalents (TE)/100 g of FW.
RSA (%) = (ADPPH − Asample)/ADPPH × 100,
2.3.3. Total Anthocyanin Compounds (TAC)
The total monomeric anthocyanin content of the sample extracts was determined by using the pH-differential method proposed by Giusti and Wrolstad [31], with some modifications: 0.15 mL aliquot of the sample extract was mixed with 1.35 mL of hydrochloric acid-potassium chloride buffer (0.025 M, pH 1.0) or with 1.35 mL of acetic acid-sodium acetate buffer (0.4 M, pH 4.5). Then, the absorbance of the extracts was measured in triplicate at two wavelengths, 510 nm and 700 nm, against a blank cell filled with Milli-Q water. The TAC was calculated and expressed as mg cyanidin-3-glucoside equivalents (cyn-3-glu)/100 g of FW. Accordingly, the total absorbance of the extracts was determined by Equation (2), and the TAC was calculated by Equation (3):
where MW = 449.2 g/mol, ε = 26900 L/mol·cm for cyn-3-glu, and DF = dilution factor.
Atotal = (A510-A700)pH 1.0 − (A510-A700)pH 4.5
TAC = (Atotal × MW × DF × 1000)/(ε × 1),
2.4. Sample Preparation
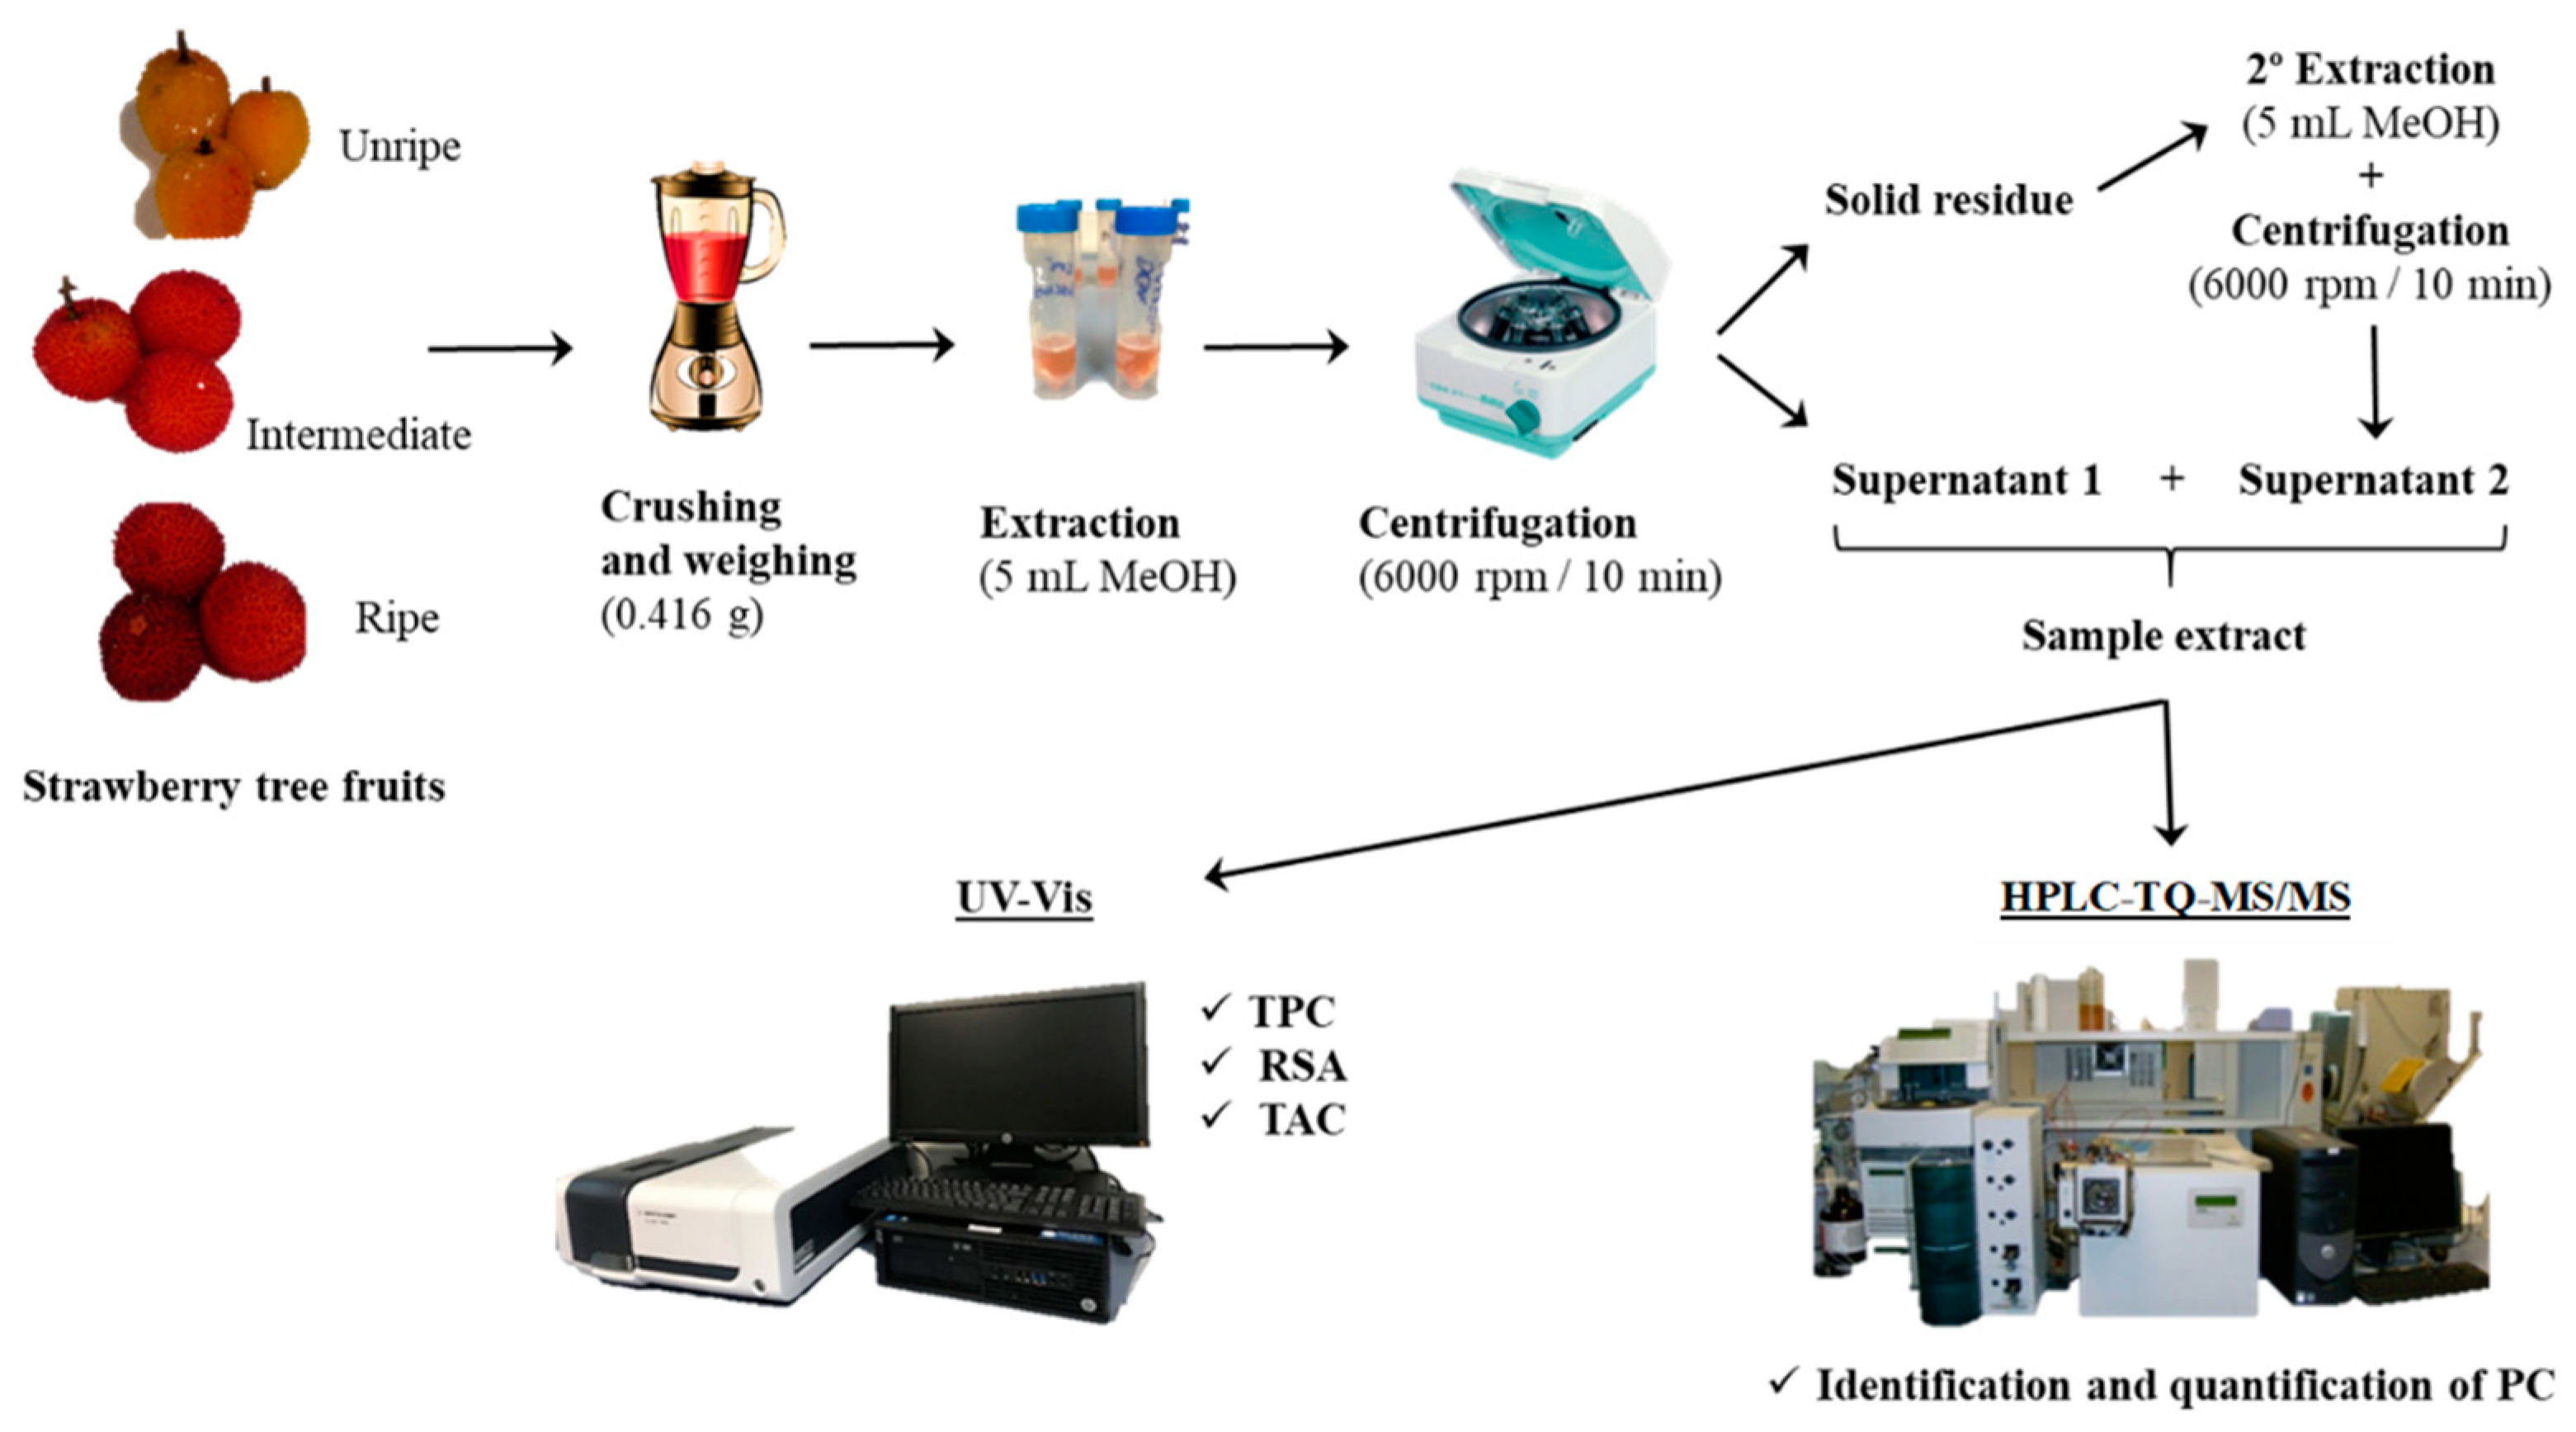
After the optimization of the sample preparation, the final extraction protocol was as follows: 20 g of berries were defrosted and crushed in a grinder to obtain a homogeneous paste. Then, around 0.4 g were weighed by duplicate in falcon tubes where the extraction process took place. For this purpose, 5 mL of the extraction solvent (MeOH) was added (sample/solvent ratio 1:12, w/v), and the mixture was stirred for 1 min in a vortex (Rx3, Velp Scientifica, Usmate, Italy). Then, the samples were centrifuged (Rotofix 32, Hettich zentrifugen, Tuttlingen, Germany) at 6000 rpm for 10 min. Afterwards, a second extraction of the resulting pellets was completed using the same volume of MeOH, and the supernatants of both extraction cycles were combined and filtered through 0.45 μm nylon membrane filters and, finally, kept at −20 °C until analysis. The strawberry tree berry extracts were analyzed in duplicated using spectrophotometric techniques (UV-Vis) to determine the TPC, the RSA, and the TAC. Likewise, the sample extracts were also analyzed in triplicate by HPLC-TQ-MS/MS to quantify the PC. Figure 2 shows a scheme of the procedure followed for sample preparation and analysis.
2.5. Chromatographic Analysis by HPLC-TQ-MS/MS and Analytical Parameters
The HPLC system consisted of a Varian 1200/1200L LC/MS-MS containing two solvent delivery modules ProStar 210/215, a ProStar 410 autosampler (equipped with a 20 μL loop), a thermostatic column compartment, and a 1200L TQ triple quadrupole mass spectrometry detector with an electrospray ionization (ESI) ion source (data acquisition system MS Workstation version 6.3.). The chromatographic separation of the analytes was achieved on a Kromaphase 100 C18 column (150 × 2.0 mm I.D., 3.5 μm particle size) from Scharlau (Barcelona, Spain). The mobile phase consisted of ACN (A) and Milli Q water (B), both containing 2 mM ammonium acetate and 0.1% formic acid in a gradient elution program: t = 0 min 95% B, t =18 min 0% B, and t =20 min 95% B (2 min). The total run-time of the method was 22 min. The flow rate was 0.2 mL/min, the column temperature 30 °C, and the injection volume 10 µL. The TQ was operated using the ESI ion source in negative ion mode. Nitrogen was used as both drying and nebulizer gas, whereas argon was used as collision gas under the following conditions: the drying and nebulizer gas was set at 300 °C with 21 and 63 psi, respectively; the capillary voltage was held at −4500 V, and shield at 600 V. Collision gas was set at 2.20 mTorr, and the detector operated at 1395 V. The ESI source parameters were initially optimized by direct infusion of standard solutions of each analyte (5 mg/L) at a flow rate of 10 µL/min selecting the molecular ion at −40 V cone voltage and optimizing the collision cell voltage to obtain the product ions. Multiple reaction monitoring (MRM) mode was employed for all analytes (mass peak width Q1 2.5 uma; mass peak width Q3 1.5 uma; scan width in MRM 0.70 uma).
Analytical parameters of the HPLC-TQ-MS/MS method were determined, including linearity, detection (LOD) and quantification (LOQ) limits, and precision. Linearity was evaluated for each analyte according to the sensitivity of the HPLC-TQ-MS/MS system. Calibration curves were constructed by linear regression analysis, plotting peak area versus analyte concentration. Regression coefficients (R2) were calculated, and the criterion for good linearity was considered R2 > 0.99. The LOD and LOQ of each analyte were calculated considering the concentration that produces a signal-to-noise ratio (S/N) of 3 and 10, respectively, for the chromatographic response obtained from the lowest concentration of the calibration curve. Precision (expressed as relative standard deviation, %RSD) was evaluated in terms of intra-day (repeatability, six replicates on the same day) and inter-day (reproducibility, three replicates analyzed three different days) precision for an intermediate fortification level.
The PCs found in the strawberry tree berry samples were identified according to their retention times and mass spectra (precursor and product ions), which were compared with the ones obtained with standard solutions. For the quantification of each analyte, the peak area was interpolated in the corresponding calibration curve, considering the matrix effect produced in the analysis. The matrix effect was studied through the comparison of the peak areas of the standards in solvent with the peak areas of the spiked sample extracts at the same concentration of each standard (subtracting the analyte peak area when it was presented in the sample).
2.6. Statistical Analysis
For each sample, two independent extractions were performed, and all the assays were carried out in duplicate for each extraction. The evaluation and analysis of the data were performed by SPSS for Windows software version 26.0 (IBM, Chicago, IL, USA). All dependent variables were analyzed using a one-way analysis of variance (ANOVA) with or without Welch correction, depending on whether the requirement of the homogeneity of variances was fulfilled or not. The main factors studied were the influence of the berry maturation stage on the TPC, the RSA, the TAC, and the type of PC, as well as the influence of the localization of the trees on the TPC, the RSA, and the TAC of the fruits. Significant differences or statistically significant effects among samples were determined using Tukey’s Honest Significant Difference (HSD) test or Dunnett T3 test, depending on whether equal variances could be assumed or not. All statistical tests were performed at a 5% significance level, so p ≤ 0.05 was considered significant in all tests. All data were reported as mean values and standard deviation.
3. Results and Discussion
3.1. Optimization of the Extraction Procedure of Phenolic Compounds
In order to optimize the extraction conditions of the PC from the samples, different assays were performed, including the selection of the extraction solvent, the type and time of stirring, the number of extraction cycles and, finally, the sample/solvent ratio. These studies were carried out with ripe strawberry tree berries. A compromise between the values obtained for the TPC, the TAC, the RSA, the time, and the consumption of reagents in the extraction procedure was considered to select the most suitable extraction conditions.
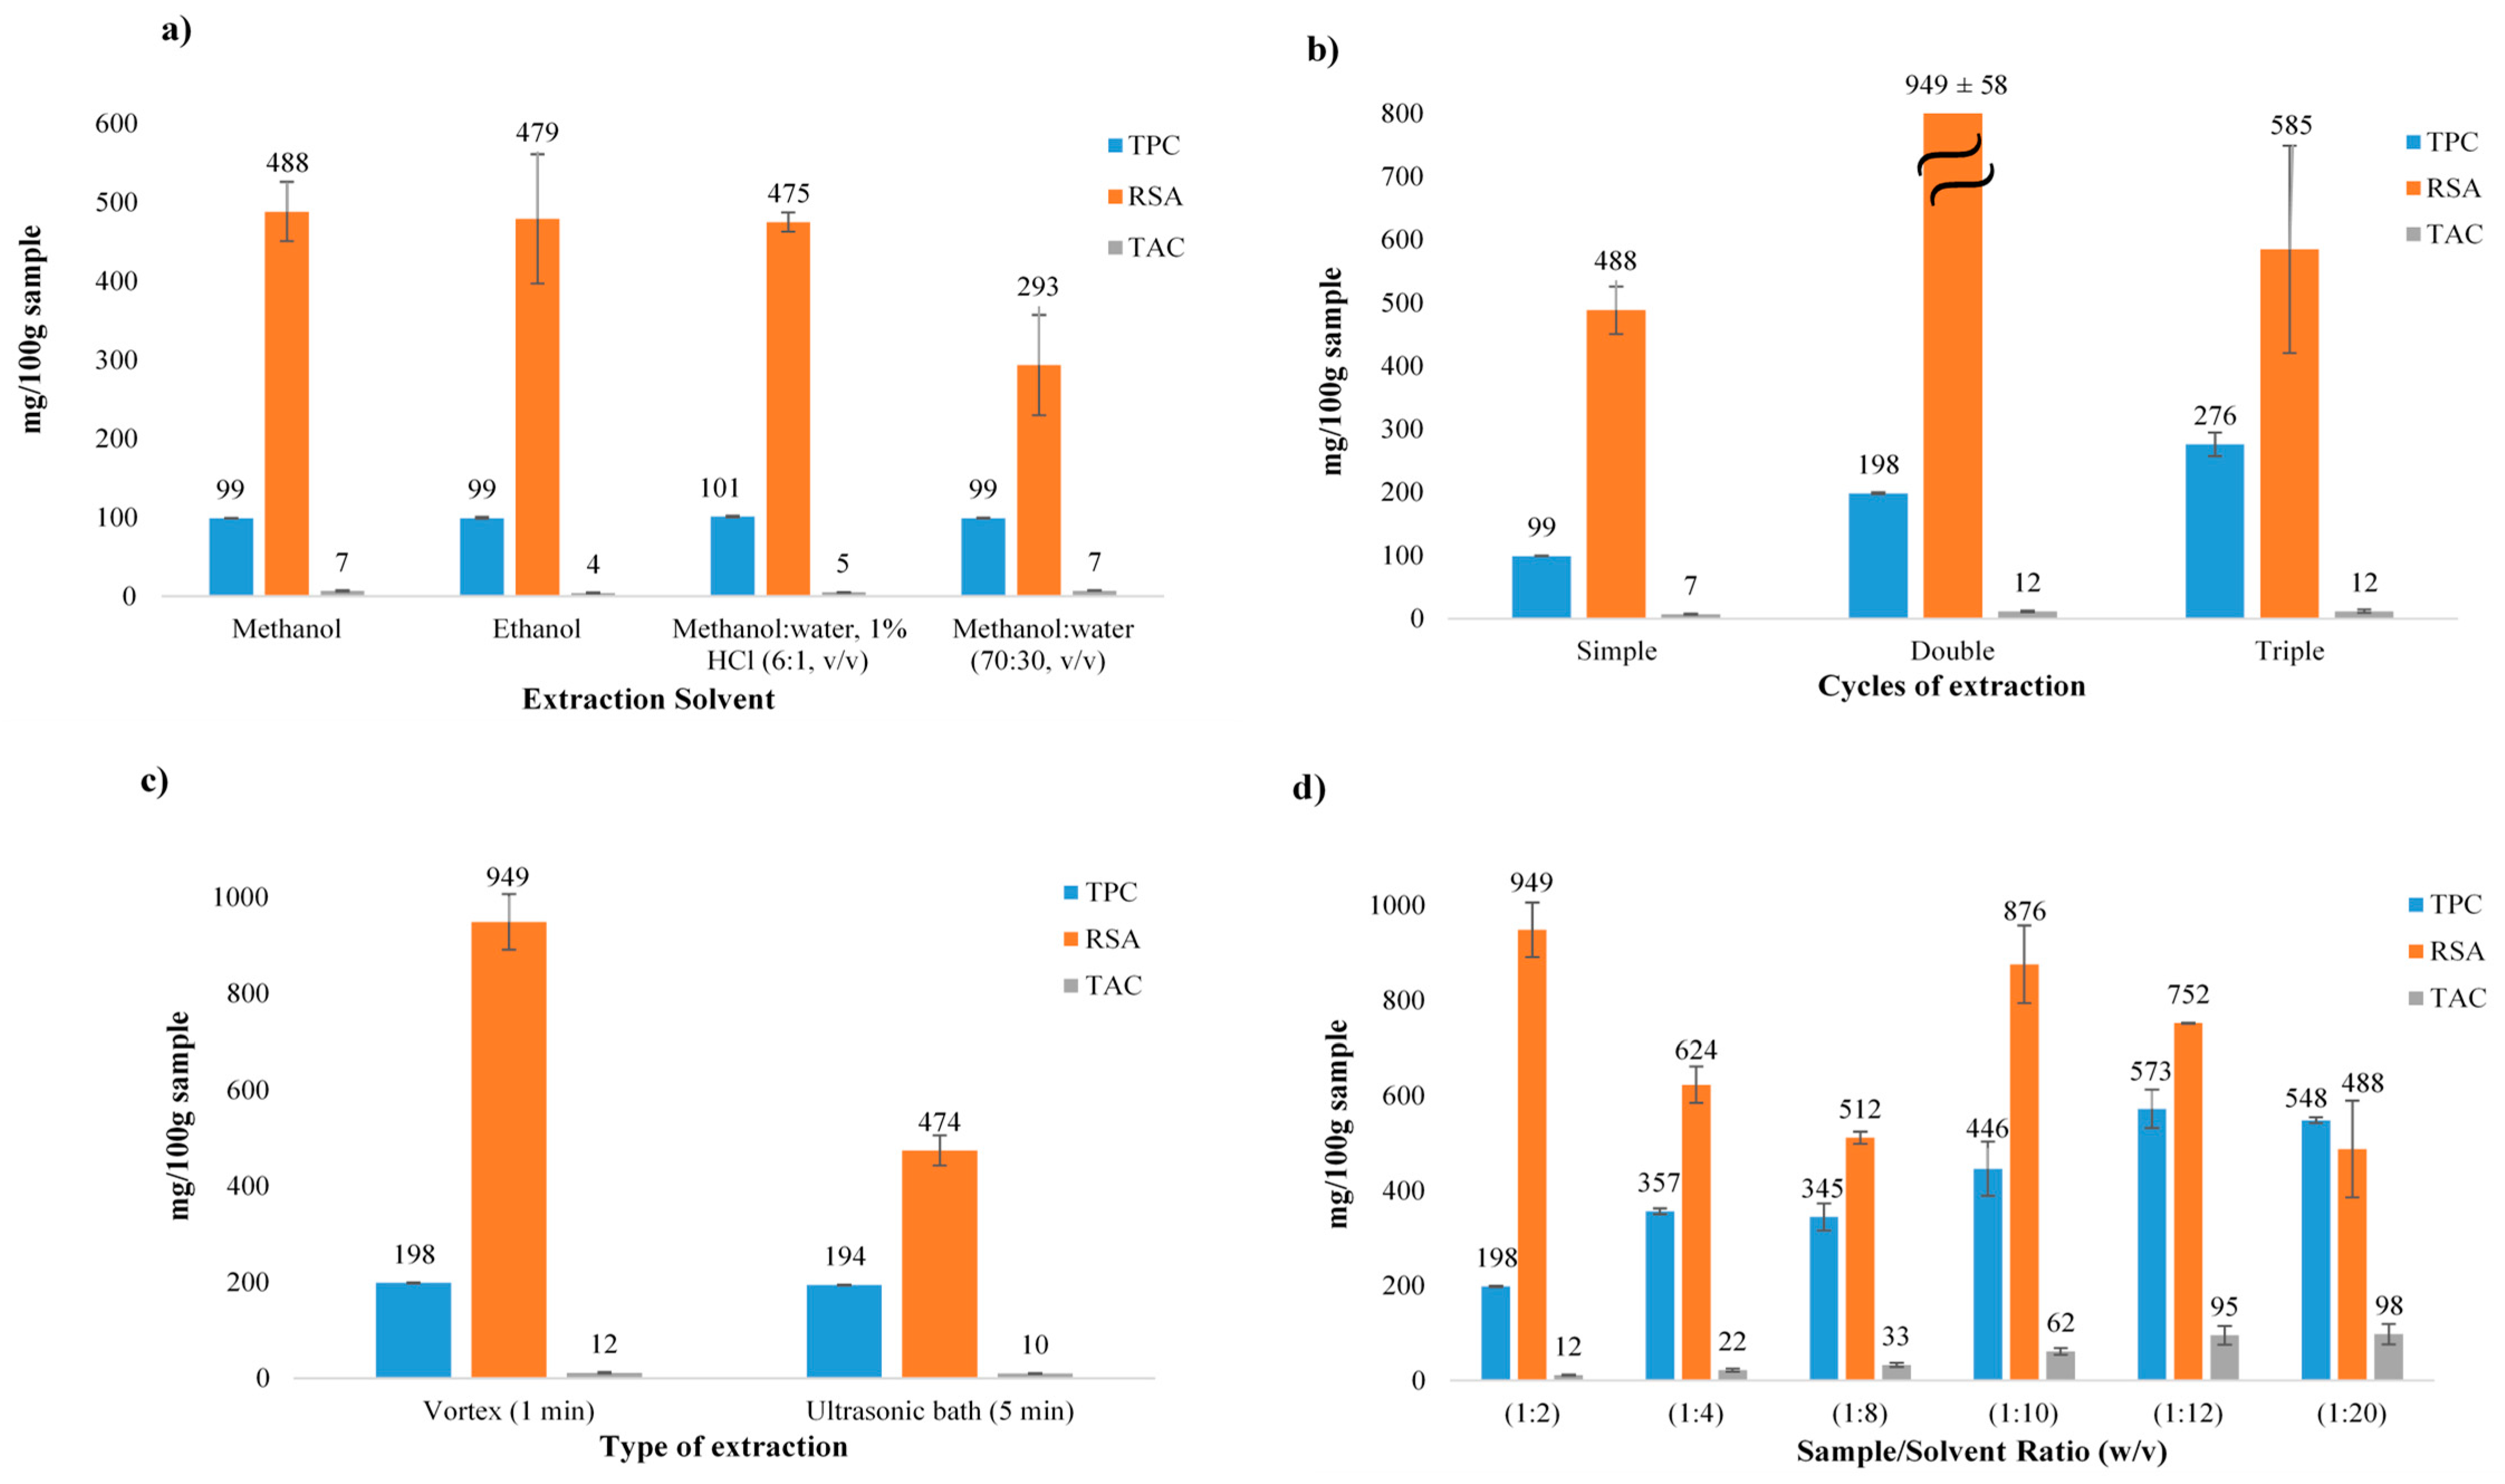
Firstly, the extraction solvent was evaluated under the following conditions: one extraction cycle, vortex stirring (1 min), and a 1:2 (w/v) sample/solvent ratio. The solvents tested were MeOH, EtOH, MeOH: H2O 1% HCl (6:1, v/v) and MeOH:water (70:30, v/v). These solvents were chosen according to the solubility of the analytes in organic and acidified media, with the aim of increasing the extraction of the PC. The results obtained (Figure 3a) showed values of TPC that were very similar for all the solvents tested, without significant differences among them. The RSA values achieved were also similar, except for the solvent MeOH:water (70:30, v/v), in which the RSA achieved was lower. For this reason, this solvent was directly discarded. The differences observed in the RSA values may be due to the extraction of non-phenolic constituents in the fruit sample extracts that can also show antioxidant activities, such as water-soluble vitamins. On the other hand, phenolic compounds can show different antioxidant activities depending on their structure, synergistic action, or concentration [17]. Consequently, the different solvents used in the extraction may be able to extract different types of phenolic compounds that influence the RSA. Among the other three solvents tested (MeOH, EtOH, and MeOH: H2O 1% HCl (6:1, v/v)), MeOH was selected as the extraction solvent for further analysis, because although it provided similar extraction efficiency of TPC and RSA values than the other solvents, it seemed to provide slightly better extraction of TAC. Moreover, it was easier to use MeOH than the MeOH:water 1% HCl (6:1, v/v) solvent, which required more preparation to be used. The next assay was carried out to verify whether successive extraction cycles with MeOH could increase the extraction yield of the PC. It was observed that with two successive extraction cycles, the results for TPC, RSA, and TAC improved (Figure 3b). On the other hand, with three extraction cycles, only the values of TPC were significantly improved, whereas the RSA values decreased. Using three extraction cycles implied more consumption of reagents, as well as the possibility of the phenolics to be degraded, since performing three extraction cycles also increases the time of the assay, which may lead to higher exposure of the analytes to time and light. This can produce oxidation processes, so the analytes may consequently lose their antioxidant activity. Additionally, agitation with an ultrasonic bath (Elmasonic S 30, Elma, Singen, Germany) was tested for 5 min (Figure 3c). Although TPC values were similar, worse results were found for RSA when the ultrasound extraction was used, so vortex stirring for 1 min was selected as the optimal condition for agitation. The observed decrease in the RSA values in the ultrasound extraction may be due to the heat generated during the 5 min of extraction, which may have affected the RSA of the analytes. According to the results obtained, higher stirring times were not tested to avoid heating and oxidation, which may have led to the degradation of the PC. Finally, different sample/solvent ratios (1:2, 1:4, 1:8, 1:10, 1:12, and 1:20, w/v) were evaluated to determine which was the most suitable to obtain higher extraction efficiency. As can be seen in Figure 3d, the best results were found for the 1:12 (w/v) sample/solvent ratio, reaching a compromise between the TPC, the RSA, and the TAC.
To the best of our knowledge, the extraction procedure of PC from strawberry tree berries has not been optimized in other previous published works and, in all of them, a very high volume of organic solvents was used, which implies a greater environmental impact and a more expensive extraction methodology. For example, Barros et al. used 2 × 50 mL of MeOH for the extraction of 1 g of sample during 12 h [5]. Oliveira et al. extracted 1.5 g of sample with 25 mL of 96% EtOH for 30 min [25], and Ruiz-Rodríguez et al. employed 20 mL of acidic MeOH:water (50:50, v/v; pH 2) and 20 mL of acetone/water (70:30, v/v) in a second extraction cycle for 0.5 g of sample [26]. More recently, Guimaraes et al. used 3 × 30 mL of MeOH:water (80:20, v/v) to extract 1 g of sample during 1 h, followed by a purification step by solid-phase extraction (SPE) with C-18 SepPakVac 3 cc cartridges prior to HPLC analysis to remove sugars and other polar substances [23]. Therefore, the extraction procedure proposed in this work provides an improvement over other previous protocols, since a lower volume of organic solvent (5 mL) and less extraction time (1 min) are needed to obtain the extraction of PC, leading to a reduction of the environmental impact, the cost, and the time consumption of the process.
3.2. TPC, RSA and TAC of Strawberry Tree Berries at Different Ripening Stages, Harvested in Different Years and at Different Geographical Locations
The strawberry berries collected at three ripening stages in different years and in different geographical locations (Figure 1) were analyzed to determine their TPC, RSA, and TAC. Firstly, the moisture percentage was determined in all samples (Table 1). As it can be observed, the average water content was between 67.2–74.3% and 72.3–78.1% (w/w) for unripe and ripe fruits, respectively. This suggests the moisture content slightly increases with the maturation stage. The small differences observed in the moisture content during the three years evaluated are probably due to different annual environmental conditions, such as rain or temperatures, which contribute to fruit drying. In the ripe strawberry tree fruits, the moisture content was similar or slightly higher than those previously reported for samples collected in Portugal and Spain by other authors [5,27]. These variations are probably due to the different environmental and climatic conditions of the different geographical locations, such as water availability, rain, temperatures, sunlight, or wind exposure. In addition, these results confirmed that, similarly to other wild fruits, the moisture content of the strawberry tree berries is lower than for most conventional fruits (in general, between 80–95%).
As shown in Table 1, the highest values of TPC and RSA were observed in the unripe berries in all the years evaluated. Conversely, the lowest TPC and RSA values were provided by the strawberry tree fruits collected at an intermediate ripening stage, whereas a slight increase was observed when the berries reached their ripe stage. Good correlation between the TPC and the RSA in the three ripening stages was observed, suggesting that the high antioxidant activity of A. unedo L. berries is related to its PC content. These results agree with the ones reported by Oliveira et al., who showed lower TPC values in ripe berries than in unripe berries [26]. On the other hand, the TAC values considerably increased as the berries ripened, from around 20 mg cyn-3-glu/100 g of DW in unripe berries to approximately 350 mg cyn-3-glu/100 g of DW in ripe fruits through all the three years evaluated (Table 1). To the best of our knowledge, this is the first time that the effect of the strawberry tree fruit ripening stage has been evaluated on the TAC, although Guimarães et al. [23] and Pawlowska et al. [1] previously quantified cyanidin 3-O-glucoside as the main anthocyanin found in the fruit’s ripe stage. Regarding the results obtained in the berries harvested in different years, very similar data of TPC, RSA and TAC were found at the three ripening states (Table 1). Most differences were observed in the unripe fruits, mainly in the initial stage of growth, probably due to the specific environmental conditions of each harvesting year, which may affect the composition of bioactive compounds of the berries. As it can be seen in Table 1, it is evidenced that the strawberry tree fruit is a good source of PC, with high TPC (2671–3612 mg of GAE/100 g DW) and RSA (2719–3568 mg TE/100g DW) in its unripe stage, and with high TAC (345–380 mg cyn-3-glu/100 g of DW) in its ripe stage.
Likewise, strawberry tree fruits collected at an intermediate ripening stage in different years and from different Spanish areas were analyzed (Figure 1b) to check if there were differences caused by the agroclimatic conditions of origin (Table 2). Regarding the strawberry tree fruits harvested in 2018, the ones collected in Móstoles (in the center of the Iberian Peninsula) provided lower TPC and RSA values (p ≤ 0.05) than the ones collected in Losar de la Vera (in the southwest of the Iberian Peninsula). This variation may be due to the soil composition and the weather conditions where the strawberry tree fruits have grown. In Móstoles the weather is warm, with more precipitations in winter than in summer (average annual temperature 13.8 °C, rainfall average 437 mm). On the other hand, in Losar de la Vera there is a local steppe climate, with little rainfall throughout the year (average temperature 16.0 °C, rainfall average 387 mm). However, comparing the results obtained for the fruits harvested in 2016 from three different locations of the center of the Iberian Peninsula (Figure 1B and Table 2), TPC values were similar in the three locations (p ≤ 0.05), while lower RSA and TAC (p ≤ 0.05) were observed in the strawberry tree berries from Manzanares el Real (northwest of Comunidad de Madrid). This is probably because the three locations have similar weather (warm temperatures), but the average annual temperature is lower in Manzanares el Real (11.9 °C) than in Madrid (13.7 °C, center) and Móstoles (13.8 °C, southwest). In general, the results showed an increase in the PC when the fruits were grown in regions with a steppe climate or with warm weather with not very low average annual temperatures (Table 1 and Table 2). However, it would be necessary to collect more different samples, through different years at different geographical areas, to provide more data and increase knowledge. Nevertheless, these results may help to reinforce the strawberry tree crop, as well as its consumption, as an alternative to other fruits, or even to be considered a good source of bioactive compounds for the development of dietary supplements or functional foods.
3.3. Analysis of Phenolic Compounds by HPLC-TQ-MS/MS
3.3.1. Development of the HPLC-TQ-MS/MS Method
Firstly, the fragmentation patterns of the 21 target PC were determined by direct infusion of pure standard solutions of each compound in the ESI source. The analyte signals exhibited higher intensities in negative, than in positive ion mode. Therefore, all compounds were ionized in negative ion mode. A cone voltage of 40 V was used to generate the precursor ion ([M-H]−1) of each compound. The predominant ion was selected as the precursor ion to obtain the product ion spectra. The collision energy to generate each product ion was also optimized. Table 3 shows the precursor ion, product ions, and optimal collision energy for each compound. To enhance detection sensitivity, the most intense product ion obtained for each analyte (in MRM mode) was used for quantification (Table 3), while the other product ions were monitored for confirmatory purposes to improve detection specificity. Moreover, for confirmation, it was also checked that the relation of product ions in the mass spectra of the samples was maintained in comparison with the mass spectra of the standard solutions. Additionally, the retention time was also used as a confirmation parameter.
Secondly, different elution gradients using ACN as organic solvent and Milli-Q water (both containing 2 mM ammonium acetate and 0.1% formic acid) were evaluated to achieve the chromatographic separation of the 21 target PC. For this purpose, the mobile phase elution gradient started with a high aqueous content (90% of water) and the organic solvent gradually increased up to 100% of ACN in 25 min. With this gradient elution, most of the analytes presented good peak symmetry, but eluted between 12–14 min (except gallic acid that eluted at 2.7 min but with a very wide and low-symmetrical peak). Therefore, the gradient elution was optimized to improve the separation of the compounds. In this sense, the initial organic composition of the mobile phase started with 5% of ACN, then increased linearly to 100% in the first 18 min, and finally returned to initial conditions in 2 min. With this elution gradient, gallic acid eluted at 8.8 min with good peak symmetry, and good separation between the compounds was achieved, as it is shown in Table 3 and Figure S1.
The linear concentration ranges and calibration curves obtained for each analyte are shown in Table 3. Good linear regression was achieved for all PC, with R2 > 0.99. LODs and LOQs ranged from 0.003–0.075 mg/L and 0.01–0.25 mg/L, respectively, except for procyanidin B2 (1.5 mg/L and f 5 mg/L, respectively). Precision was assessed in terms of repeatability and reproducibility at an intermediate concentration level, and satisfactory results were achieved with RSD values lower than 9% and 14%, respectively. From the above results, it can be concluded that the proposed method can be successfully used for the quantification of PC.
3.3.2. Profile of Phenolic Compounds at Different Ripening Stages
The results obtained for the 21 target PC analyzed in the A. unedo L. fruits at different ripening stages are shown in Table 4. As it can be seen, several families of phenolic compounds were identified and quantified in the strawberry tree berry extracts, including phenolic acids, different kinds of flavonoids (flavonols, flavanols, flavanones, and flavones) and, for the first time in these fruits, stilbenes such as trans-resveratrol and trans-piceid.
Different hydroxycinnamic and hydroxybenzoic acids were detected. Gallic acid and 4-hydroxybenzoic acid were quantified in the three ripening stages, while other acids, such as syringic and chlorogenic, could only be quantified in the ripe stage of the berries. Gallic acid was the phenolic acid with the highest concentration quantified (Figure S2). It was observed that its concentration increased as the degree of ripening of the strawberry tree fruits increased, appreciating statistical significance between the different ripening stages of the berries (1.4, 2.1 and 4.7 mg gallic acid/100 g of DW for unripe, intermediate, and ripe berries, respectively) (Table 4). In the edible parts of plants, the amount of hydroxybenzoic acids is usually low, while hydroxycinnamic acids are more abundant. Nevertheless, high concentrations of hydroxybenzoic acids can also be detected in certain red fruits, as it is the case of gallic acid in strawberry tree fruits [32]. Hydroxycinnamic acids are essential for the synthesis of other very important compounds, such as stilbenes [32]. P-coumaric acid, one of the main hydroxycinnamic acids, was identified in all the ripening stages of the berries and was quantified in the unripe fruits. Many of the hydroxycinnamic acids are found as esters of quinic acid [15]. This is the case for chlorogenic acid, which was identified in all the ripening stages, and 0.676 mg chlorogenic acid/100 g of DW was quantified in the ripe strawberry tree fruits. This may explain why caffeic acid was not detected in any of the samples analyzed, since chlorogenic acid is an ester formed between caffeic and quinic acids [33]. The occurrence of flavonols in fruits, as it happens in the majority of PC, is highly influenced by environmental conditions and other factors. All the flavonols that were analyzed (quercetin, quercetin-3-β-glucoside, rutin, and kaempferol) were identified and quantified in the three ripening stages with similar amounts. Among these flavonols, quercetin-3-β-glucoside was the analyte that presented the highest concentration values (2.3, 1.7 and 2.6 mg of quercetin-3-β-glucoside/100 g of DW in unripe, intermediate, and ripe berries, respectively) (Figure S3). Flavanols or flavan-3-ols derived from flavans can exist as monomeric forms (catechin being the most representative monomeric flavanol), or as condensed polymers (also so-called proanthocyanidins) [15]. Catechins and proanthocyanidins are common and abundant in a wide range of fruits (e.g., grapes, apples, plums, kiwi, red fruits), cereals, seeds, spices and aromatic plants, and to a lesser extent, in vegetables and foods of plant origin [34,35]. High amounts of (+)-catechin, procyanidin B2, epigallocatechin and (−)-epigallocatechin gallate were found in the samples analyzed (Figure S3), particularly in the unripe strawberry tree fruits (149, 49, 26, and 1.83 mg/100 g of DW, respectively). In the intermediate and ripe stages, the amount of these compounds decreased, being similar in both ripening stages and finding statistical significance with respect to the unripe strawberry tree berries (Table 4). This trend observed for flavanols during the maturation stage agrees with the results obtained for the TPC and RSA, obtaining the highest values in the unripe fruits (Table 1 and Table 2). Naringin, which belongs to the flavanones group, was identified and quantified at a small amount (0.35 ± 0.01 mg/100 g of DW) in the fruits with intermediate ripening. On the other hand, vitexin (a flavone) was quantified in the unripe, intermediate, and ripe fruits (around 0.9 mg of vitexin/100 g of DW at three ripening stages). Finally, stilbenes as trans-resveratrol and trans-piceid were identified in all the ripening stages of the samples (Figure S3). To the best of our knowledge, this is the first time that these stilbenes have been analyzed and identified in the strawberry tree fruit.
3.4. Comparison of the Phenolic Composition Profile with Other Fruits
Table 5 collects some results reported for the amount of phenolic compounds quantified by other authors in different types of fruits and those obtained for strawberry tree berries in this work. When the results are compared, it can be noticed that the amount of gallic acid is much higher in the strawberry tree berries at all the ripening stages than in other red berries, such as blueberries. Conversely, the amount of 4-hydroxybenzoic acid, chlorogenic acid, and kaempferol is significantly lower than in the different types of blueblerries, particularly in the case of chlorogenic acid. However, the amount of quercetin in the strawberry tree fruits is similar to the one found in blueberries, and higher than the one reported for passionfruit. On the other hand, the amount of (+) catechin in the strawberry tree berries is very high, mainly in the unripe stage. However, the amounts found in the intermediate and ripe stages are similar to the ones found in apricot, some types of blueberries (e.g., pink lemonade, florida rose, and US 2117), and in gooseberry, strawberry, and cherry. The amount of procyanidin B2 in strawberry tree berries is also, in general, higher than for the rest of the other fruits included in Table 5, except for apple, and similar to that of blackberries, plum, and apricot. In fact, the higher content of procyanidin B2 in the strawberry tree fruits stands out compared to other red berries, such as blueberries, cranberries, currant, gooseberry, and cherry (Table 5).
5. Conclusions
This research reported the first comprehensive study of the phenolic composition profile of strawberry tree berries at three ripening stages, using an optimized and validated methodology by HPLC-TQ-MS/MS. The results obtained endorse the strawberry tree fruit as an excellent source of phenolic compounds, highlighting large amounts of flavanols in its unripe stage, such as catechin, which has a much higher value than other fruits and fruit berries with which it has been compared. Therefore, the strawberry tree fruit could be considered by the food industry as a good source of phenolic compounds that can be extracted and used for the production of dietary supplements or functional foods, which are in high demand by consumers nowadays.
Supplementary Materials
The following are available online at https://www.mdpi.com/article/10.3390/app112411616/s1, Figure S1: Extracted ion chromatograms for the most intense product ion of each target phenolic compound with the optimized detection and chromatographic conditions Figure S2: Extracted ion chromatograms for the most intense product ion and product ion spectra of gallic acid obtained in the samples extracts of Arbutus unedo L. berries at three ripening stages, Figure S3: (A) Total ion chromatogram and (B) extracted ion chromatograms for the most intense product ion of quercetin-3-β-glucoside, (C) (+)-catechin, (D) procyanidin B2 and (E) trans-resveratrol obtained in the samples extracts of Arbutus unedo L. berries at three ripening stages.
Author Contributions
Conceptualization, S.M.-Z.; methodology, S.M-Z.; software, S.I.; validation, S.M.-Z. and S.I.; formal analysis, S.M.-Z. and S.I.; investigation, S.M.-Z. and S.I.; resources, S.M.-Z., S.I., N.C. and I.S.; data curation, S.M.-Z. and S.I.; writing—original draft preparation, S.M.-Z., S.I. and N.C.; writing—review and editing, S.M-Z, N.C. and I.S.; visualization, S.M.-Z.; supervision, S.M.-Z.; project administration, I.S.; funding acquisition, I.S. All authors have read and agreed to the published version of the manuscript.
Funding
This research was funded by the Comunidad of Madrid and European funding from FEDER program, project S2018/BAA-4393, AVANSECAL-II-CM.
Conflicts of Interest
The authors declare no conflict of interest.
References
- Pawlowska, A.M.; de Leo, M.; Braca, A. Phenolics of Arbutus unedo L. (Ericaceae) fruits: Identification of anthocyanins and gallic acid derivatives. J. Agr. Food Chem. 2006, 54, 10234–10238. [Google Scholar] [CrossRef]
- Pallauf, K.; Rivas-Gonzalo, J.C.; del Castillo, M.D.; Cano, M.P.; de Pascual-Teresa, S. Characterization of the antioxidant composition of strawberry tree (Arbutus unedo L.) fruits. J. Food Compos. Anal. 2008, 21, 273–281. [Google Scholar] [CrossRef] [Green Version]
- Simonetti, M.; Damiani, F.; Gabrielli, L.; Cossignani, L.; Blasi, F.; Marini, F.; Montesano, D.; Maurizi, A.; Ventura, F.; Bosi, A.; et al. Characterization of triacylglycerols in arbutus unedo L. seeds. Ital. J. Food Sci. 2008, 20, 49–56. [Google Scholar]
- Ayaz, F.A.; Kucukislamoglu, M.; Reunanen, M. Sugar, non-volatile and phenolic acids composition of strawberry tree (Arbutus unedo L. var. ellipsoidea) fruits. J. Food Compos. Anal. 2000, 13, 171–177. [Google Scholar] [CrossRef]
- Barros, N.; Carvalho, A.M.; Morais, J.S.; Ferreira, I.C.F.R. Strawberry-tree, blackthorn and rose fruits: Detailed characterization in nutrients and phytochemicals with antioxidant properties. Food Chem. 2010, 120, 247–254. [Google Scholar] [CrossRef]
- Miguel, M.G.; Faleiro, M.L.; Guerreiro, A.C.; Antunes, M.D. Arbutus unedo L.: Chemical and biological properties. Molecules 2014, 19, 15799–15823. [Google Scholar] [CrossRef] [PubMed] [Green Version]
- Özcan, M.M.; Hacıseferoğulları, H. The strawberry (Arbutus unedo L.) fruits: Chemical composition, physical properties and mineral contents. J. Food Eng. 2007, 78, 1022–1028. [Google Scholar] [CrossRef]
- Albuquerque, B.R.; Prieto, M.A.; Barreiro, M.F.; Rodrigues, A.; Curran, T.P.; Barros, L.; Ferreira, I.C.F.R. Catechin-based extract optimization obtained from Arbutus unedo L. fruits using maceration/microwave/ultrasound extraction techniques. Ind. Crop. Prod. 2017, 95, 404–415. [Google Scholar] [CrossRef] [Green Version]
- Guimarães, R.; Barros, L.; Calhelha, R.C.; Carvalho, A.M.; Queiroz, M.J.R.P.; Ferreira, I.C.F.R. Bioactivity of different enriched phenolic extracts of wild fruits from Northeastern Portugal: A comparative study. Plant Food Hum. Nutr. 2014, 69, 37–42. [Google Scholar] [CrossRef] [PubMed]
- Bnouham, M.; Merhfour, F.Z.; Legssyer, A.; Mekhfi, H.; Maallem, S.; Ziyyat, A. Antihyperglycemic activity of Arbutus unedo, Ammoides pusilla and Thymelaea hirsuta. Pharmazie 2007, 62, 630–632. [Google Scholar] [CrossRef]
- Ziyyat, A.; Boussairi, E. Cardiovascular effects of Arbutus unedo L. in spontaneously hypertensive rats. Phytother. Res. 1998, 12, 110–113. [Google Scholar] [CrossRef]
- El Haouari, M.; López, J.J.; Mekhfi, H.; Rosado, J.A.; Salido, G.M. Antiaggregant effects of Arbutus unedo extracts in human platelets. J. Ethnopharmacol. 2007, 113, 325–331. [Google Scholar] [CrossRef] [PubMed]
- El Haouari, M.; Mekhfi, H. Anti-platelet aggregation effects of extracts from Arbutus unedo leaves. Plant Sci. Today 2017, 4, 68–74. [Google Scholar] [CrossRef] [Green Version]
- Mekhfi, H.; ElHaouari, M.; Bnouham, M.; Aziz, M.; Ziyyat, A.; Legssyer, A. Effects of extracts and tannins from Arbutus unedo leaves on rat platelet aggregation. Phytother. Res. 2006, 20, 135–139. [Google Scholar] [CrossRef] [PubMed]
- Lucci, P.; Saurina, J.; Núñez, O. Trends in LC-MS and LC-HRMS analysis and characterization of polyphenols in food. Trac Trends Anal. Chem. 2017, 88, 1–24. [Google Scholar] [CrossRef] [Green Version]
- Casado, N.; Morante-Zarcero, S.; Pérez-Quintanilla, D.; Câmara, J.S.; Sierra, I. Two novel strategies in food sample preparation for the analysis of dietary polyphenols: Micro-extraction techniques and new silica-based sorbent materials. Trends Food Sci. Technol. 2020, 98, 167–180. [Google Scholar] [CrossRef]
- Ali, A.; Wu, H.; Ponnampalam, E.N.; Cottrell, J.J.; Dunshea, F.R.; Suleria, H.A.R. Comprehensive Profiling of Most Widely Used Spices for Their Phenolic Compounds through LC-ESI-QTOF-MS2 and Their Antioxidant Potential. Antioxidants 2021, 10, 721. [Google Scholar] [CrossRef] [PubMed]
- Bravo, L. Polyphenols: Chemistry, dietary sources, metabolism, and nutritional significance. Nutr. Rev. 1998, 56, 317–333. [Google Scholar] [CrossRef]
- Carocho, M.; Ferreira, I.C.F.R. The role of phenolic compounds in the fight against cancer- a review. Anti Cancer Agents Med. Chem. 2013, 13, 1236–1258. [Google Scholar] [CrossRef] [PubMed]
- He, F.J.; Nowson, C.A.; MacGregor, G.A. Fruit and vegetable consumption and stroke: Metaanalysis of cohort studies. Lancet 2006, 367, 320–326. [Google Scholar] [CrossRef]
- Hertog, M.G.L.; Kromhout, D.; Aravanis, C.; Blackburn, H.; Buzina, R.; Fidanza, F.; Giampaoli, S.; Jansen, A.; Menotti, A.; Nedeljkovic, S.; et al. Flavonoid intake and long-term risk of coronary heart disease and cancer in the seven countries study. Arch. Intern. Med. 1995, 155, 381–386. [Google Scholar] [CrossRef] [PubMed]
- Veitch, N.C.; Grayer, R.J. Flavonoids and their glycosides, including anthocyanins. Nat. Prod. Rep. 2011, 28, 1626–1695. [Google Scholar] [CrossRef] [PubMed]
- Guimarães, R.; Barros, L.; Dueñas, M.; Carvalho, A.M.; Queiroz, M.J.R.P.; Santos-Buelga, C.; Ferreira, I.C.F.R. Characterisation of phenolic compounds in wild fruits from Northeastern Portugal. Food Chem. 2013, 141, 3721–3730. [Google Scholar] [CrossRef] [PubMed] [Green Version]
- García-Alonso, M.; Rimbach, G.; Sasai, M.; Nakahara, M.; Matsugo, S.; Uchida, Y.; Rivas-Gonzalo, J.C.; De Pascual-Teresa, S. Electron spin resonance spectroscopy studies on the free radical scavenging activity of wine anthocyanins and pyranoanthocyanins. Mol. Nutr. Food Res. 2005, 49, 1112–1119. [Google Scholar] [CrossRef] [PubMed]
- García-Alonso, M.; De Pascual-Teresa, S.; Santos-Buelga, C.; Rivas-Gonzalo, J.C. Evaluation of the antioxidant properties of fruits. Food Chem. 2004, 84, 13–18. [Google Scholar] [CrossRef]
- Oliveira, I.; Baptista, P.; Malheiro, R.; Casal, S.; Bento, A.; Pereira, J.A. Influence of strawberry tree (Arbutus unedo L.) fruit ripening stage on chemical composition and antioxidant activity. Food Res. Int. 2011, 44, 1401–1407. [Google Scholar] [CrossRef]
- Ruiz-Rodríguez, B.-M.; Morales, P.; Fernández-Ruiz, V.; Sánchez-Mata, M.; Cámara, M.; Díez-Marqués, C.; Pardo-de-Santayana, M.; Molina, M.; Tardío, J. Valorization of wild strawberry-tree fruits (Arbutus unedo L.) through nutritional assessment and natural production data. Food Res. Int. 2011, 44, 1244–1253. [Google Scholar] [CrossRef]
- Horwitz, W.; Latimer, G.W. Official Methods of Analysis of AOAC International, 18th ed.; EEUU: Gaithersburg, MD, USA, 2005. [Google Scholar]
- Singleton, V.L.; Orthofer, R.; Lamuela-Raventos, R.M. Analysis of total phenols and other oxidation substrates and antioxidants by means of Folin-Ciocalteu reagent. Method Enzymol. 1999, 299, 152–178. [Google Scholar] [CrossRef]
- Brand-Williams, W.; Cuvelier, M.E.; Berset, C. Use of a free radical method to evaluate antioxidant activity. LWT Food Sci. Technol. 1995, 28, 25–30. [Google Scholar] [CrossRef]
- Giusti, M.; Wrolstad, R.E. Anthocyanins. Characterization and Measurement with UV-Visible Spectroscopy. In Current Protocols in Food Analytical Chemistry; (F1.2.1–F1.2.13); Wrolstad, R.E., Ed.; John Wiley & Sons, Inc.: New York, NY, USA, 2001. [Google Scholar]
- Sharma, P. Cinnamic acid derivatives: A new chapter of various pharmacological activities. J. Chem. Pharm. Res. 2011, 3, 403–423. [Google Scholar]
- Boerjan, W.; Ralph, J.; Baucher, M. Lignin biosynthesis. Annu. Rev. Plant Biol. 2003, 54, 519–546. [Google Scholar] [CrossRef] [PubMed]
- Gu, L.; Kelm, M.A.; Hammerstone, J.F.; Beecher, G.; Holden, J.; Haytowitz, D.; Gebhardt, S.; Prior, R.L. Concentrations of proanthocyanidins in common foods and estimations of normal consumption. J. Nutr. 2004, 134, 613–617. [Google Scholar] [CrossRef] [PubMed]
- Guyot, S. Flavan-3-Ols and proanthocyanidins. In Handbook of Analysis of Active Compounds in Functional Foods; Nollet, N.M.L., Toldrá, F., Eds.; CRC Press: Boca Raton, FL, USA, 2012. [Google Scholar]
- Rzeppa, S.; Von Bargen, C.; Bittner, K.; Humpf, H.U. Analysis of Flavan-3-ols and Procyanidins in Food Samples by Reversed Phase High-Performance Liquid Chromatography Coupled to Electrospray Ionization Tandem Mass Spectrometry (RP-HPLC-ESI-MS/MS). J. Agric. Food Chem. 2011, 59, 10594–10603. [Google Scholar] [CrossRef] [PubMed]
- Rotta, E.M.; Rodrigues, C.A.; Jardim, I.C.S.F.; Maldaner, L.; Visentainer, J.V. Determination of phenolic compounds and antioxidant activity in passion fruit pulp (Passiflora spp.) using a modified QuEChERS method and UHPLC-MS/MS. LWT Food Sci. Technol. 2019, 100, 397–403. [Google Scholar] [CrossRef]
- Grace, M.H.; Xiong, J.; Esposito, D.; Ehlenfeldt, M.; Lila, M.A. Simultaneous LC-MS quantification of anthocyanins and non-anthocyanin phenolics from blueberries with widely divergent profiles and biological activities. Food Chem. 2019, 277, 336–346. [Google Scholar] [CrossRef] [PubMed]
- Ayaz, F.A.; Hayirlioglu-Ayaz, S.; Gruz, J.; Novak, O.; Strnad, M. Separation, characterization, and quantitation of phenolic acids in a little-known blueberry (Vaccinium arctostaphylos L.) fruit by HPLC-MS. J. Agric. Food Chem. 2005, 53, 8116–8122. [Google Scholar] [CrossRef]
Figure 1.
(a) A. unedo L. fruits harvested in different years at different ripening stages and (b) A. unedo L. fruits at an intermediate ripening stage collected from different Spanish locations.
Figure 1.
(a) A. unedo L. fruits harvested in different years at different ripening stages and (b) A. unedo L. fruits at an intermediate ripening stage collected from different Spanish locations.

Figure 2.
Scheme of the sample preparation of A. unedo L. berries analyzed by UV-Vis and HPLC-TQ-MS/MS at three ripening stages.
Figure 2.
Scheme of the sample preparation of A. unedo L. berries analyzed by UV-Vis and HPLC-TQ-MS/MS at three ripening stages.

Figure 3.
Evaluation of (a) solvent, (b) cycles of extraction, (c) type and time of agitation, and (d) sample/solvent ratio to optimize the strawberry tree berry extraction conditions. The TPC is expressed as mg GAE/100 g FW, the RSA is expressed as mg TE/100 g FW, and the TAC is expressed as mg cyn-3-glu/100 g FW.


Table 1.
Total phenolic compounds (TPC), total anthocyanin compounds (TAC), and radical scavenging activity (RSA) for A. unedo L. berries harvested in Móstoles at different ripening stages and different years *.
Table 1.
Total phenolic compounds (TPC), total anthocyanin compounds (TAC), and radical scavenging activity (RSA) for A. unedo L. berries harvested in Móstoles at different ripening stages and different years *.
| Harvest Year | Ripening Stage | Moisture (%) | TPC mg GAE/100g DW | RSA mg TE/100g DW | TAC mg Cyn-3-glu/100g DW |
|---|---|---|---|---|---|
| 2018 | Unripe | 71.9 ± 0.5 b | 3473 ± 77 e | 4281 ± 23 cd | 22 ± 7 a |
| Intermediate | 72.5 ± 0.8 b | 1309 ± 99 a | 2258 ± 212 a | 76 ± 8 a | |
| Ripe | 72.9 ± 0.3 b | 2206 ± 129 c | 3568 ± 166 b,c | 380 ± 53 b | |
| 2016 | Unripe | 74.3 ± 0.2 b,c | 2671 ± 335 d | 7476 ± 419 e | 19 ± 7 a |
| Intermediate | 76.1 ± 0.9 c,d | 2018 ± 60 b,c | 4800 ± 161 d | 69 ± 2 a | |
| Ripe | 78 ± 1 d | 2164 ± 176 c | 3446 ± 604 b,c | 348 ± 25 b | |
| 2015 | Unripe | 67.2 ± 0.6 a | 3612 ± 21 e | 29531 ± 288 f | 26 ± 3 a |
| Intermediate | 72 ± 1 b | 1705 ± 23 b | 3093 ± 104 a,b | 84 ± 22 a | |
| Ripe | 72 ± 1 b | 2071 ± 146 b,c | 2719 ± 4 a,b | 345 ± 72 b |
* Data are expressed as mean ± standard deviation (n = 4); DW: Dry weigh; GAE: Gallic acid equivalents; TE: Trolox equivalents; Cyn-3-glu: Cyanidin-3-glucoside equivalents; a,b,c,d,e,f,g mean values within a column followed by different superscript letters are significantly different when subjected to statistical analysis (p ≤ 0.05).
Table 2.
Total phenolic compounds (TPC), total anthocyanin compounds (TAC), and radical scavenging activity (RSA) for A. unedo L. berries harvested at an intermediate ripening stage in different years and from different geographical locations *.
Table 2.
Total phenolic compounds (TPC), total anthocyanin compounds (TAC), and radical scavenging activity (RSA) for A. unedo L. berries harvested at an intermediate ripening stage in different years and from different geographical locations *.
| Origin | Harvest year | Moisture (%) | TPC mg GAE/100g DW | RSA mg TE/100g DW | TAC mg Cyn-3-glu/100g DW |
|---|---|---|---|---|---|
| Móstoles | 2018 | 72.5 ± 0.8 b | 1309 ± 99 a | 2258 ± 212 a | 76 ± 8 ab |
| Losar de la Vera | 2018 | 69.6 ± 0.5 a | 1965 ± 96 b | 3256 ± 281 b | 91 ± 27 b |
| Móstoles | 2016 | 76.1 ± 0.9 c | 2018 ± 60 b | 4800 ± 161 c | 69 ± 2 ab |
| Madrid | 2016 | 77.1 ± 0.9 c | 1943 ± 62 b | 4730 ± 151 c | 72 ± 8 ab |
| Manzanares el Real | 2016 | 71.0 ± 0.5 ab | 1895 ± 25 b | 2338 ± 82 a | 50 ± 12 a |
* Data are expressed as mean ± standard deviation (n = 4); DW: Dry weigh; GAE: Gallic acid equivalents; TE: Trolox equivalents; Cyn-3-glu: Cyanidin-3-glucoside equivalents; a,b,c,d,e,f,g mean values within a column followed by different superscript letters are significantly different when subjected to statistical analysis (p ≤ 0.05).
Table 3.
Mass spectrum and analytical parameters for the HPLC-TQ-MS/MS method developed for the determination of the target polyphenols.
Table 3.
Mass spectrum and analytical parameters for the HPLC-TQ-MS/MS method developed for the determination of the target polyphenols.
| Class | Analyte | Rt (min) | Molecular Ion; Product Ions (Coll. Energy, eV) (m/z) | Linear Range (mg L−1) | Linearity; R2 | LOD (mg L−1) | LOQ (mg L−1) |
|---|---|---|---|---|---|---|---|
| Hydroxybenzoic acids | 4-hydroxybenzoic acid | 10.6 | 136.8; 92.9*(16V) | 0.025–10.0 | y = 2.39E8x + 1.71E6; 0.999 | 0.008 | 0.025 |
| Gallic acid | 8.8 | 168.9; 124.7*(14V)/166.7(10V) | 0.05–10.0 | y = 1.90E8 x − 1.16E7; 0.995 | 0.015 | 0.050 | |
| Protocatechuic acid | 8.8 | 152.7; 106.7(26V)/108.7*(14V)/151.6(5V) | 0.025–10.0 | y = 2.27E8x – 7.78E6; 0.999 | 0.008 | 0.025 | |
| Syringic acid | 9.5 | 197.0; 195.7(8V)/180.7*(16V)/158.2(14V)/121.7 (16V) | 0.1–10.0 | y = 6.26E6x – 3.21E5; 0.999 | 0.030 | 0.100 | |
| Vanillic acid | 9.5 | 167.0; 165.7(5V)/151.7*(14V)/122.8(12V) | 0.25–10.0 | y = 8.61E6x – 8.81E5; 0.999 | 0.075 | 0.250 | |
| Hydroxycinnamic acids | p-coumaric acid | 9.9 | 163.0; 160.8(10V)/118.8*(16V)/92.4(32V) | 0.01–10.0 | y = 3.62E8x + 3.08E7; 0.998 | 0.003 | 0.010 |
| Chlorogenic acid | 8.9 | 353.1; 190.7*(16V)/189.5(20V) | 0.025–10.0 | y = 1.43E8x – 7.52E6; 0.999 | 0.008 | 0.025 | |
| Caffeic acid | 9.4 | 178.9; 178.6(8V)/134.7*(16V) | 0.05–10.0 | y = 2.94E8x + 4.86E7; 0.997 | 0.015 | 0.050 | |
| Caftaric acid | 8.8 | 310.9; 178.8(14V)/148.8*(12V)/134.6(26V) | 0.1–10.0 | y = 9.96E7x – 3.64E7; 0.997 | 0.030 | 0.100 | |
| Flavonols | Quercetin | 12.5 | 300.9; 178.6(18.0V)/150.6*(22V) | 0.1–10.0 | y = 2.04E8x + 2.01E7; 0.998 | 0.030 | 0.100 |
| Quercetin 3-β-glucoside | 10.1 | 463.1; 301.0(20V)/299.7*(26V)/270.9(45V) | 0.025–10.0 | y = 3.85E7x – 5.71E6; 0.998 | 0.008 | 0.025 | |
| Rutin | 10.7 | 609.5; 300.1*(34V)/271.3(45V)/150.2(40V) | 0.025–10.0 | y = 5.13E7x + 3.82E6; 0.997 | 0.008 | 0.025 | |
| Kaempferol | 13.4 | 284.9; 283.7(14V)/226.3*(30V) | 0.01–10.0 | y = 3.21E8x + 7.22E6; 0.999 | 0.003 | 0.010 | |
| Flavanols | (+) Catechin | 9.3 | 288.9; 244.7(12V)/108.8*(22V) | 0.1–10.0 | y = 2.14E7x + 9.58E4; 0.999 | 0.030 | 0.100 |
| (−)-Epigallocatechin gallate | 9.6 | 457.1; 168.5(18V)/124.4*(36V) | 0.1–10.0 | y = 6.11E7x – 1.06E7; 0.999 | 0.030 | 0.100 | |
| Epigallocatechin | 8.9 | 304.9; 178.7(14V)/218.4(16V)/166.8(16V)/164.6*(20V) | 0.25–10.0 | y = 6.20E6x – 1.26E6; 0.999 | 0.075 | 0.250 | |
| Procyanidin B2 | 9.3 | 577.2; 425.2(16V)/407.2(22V)/288.8*(24V) | 5.0–200.0 | y = 4.59E6x – 5.26E6; 0.999 | 1.500 | 5.000 | |
| Flavanones | Naringin | 10.5 | 579.1; 270.8(36V)/151.0*(45V) | 0.01–10.0 | y = 2.76E7x – 7.45E5; 0.999 | 0.003 | 0.010 |
| Flavones | Vitexin | 10.0 | 431.1; 429.9(12V)/311.1*(22V)/282.8(34V) | 0.05–10.0 | y = 6.48E6x – 5.88E5; 0.999 | 0.015 | 0.050 |
| Stilbenes | trans-Resveratrol | 11.4; 13.1 (cis) | 226.9; 184.8(12V)/142.8*(32V) | 0.25–10.0 | y = 1.83E7x – 8.94E5; 0.999 | 0.075 | 0.250 |
| trans-Piceid | 10.7; 11.4 (cis) | 390.0; 227.4*(20V) | 0.1–10.0 | y = 1.18E7x – 9.17E4; 0.999 | 0.030 | 0.100 |
* Product ions used for quantification. Chromatographic conditions with the optimized gradient elution: t = 0 min 5% A – 95% B, t = 18 min 100% A, t = 20 min 5% A – 95% B (2 min) (ACN as mobile phase A and H2O as mobile phase B, both containing 0.1% formic acid and 2 mM ammonium acetate). The flow rate was 0.2 mL min−1.
Table 4.
Content of phenolic compounds in A. unedo L. berries * at different ripening stages analyzed by HPLC-TQ-MS/MS.
Table 4.
Content of phenolic compounds in A. unedo L. berries * at different ripening stages analyzed by HPLC-TQ-MS/MS.
| Class | Analyte ([M-H]−1/MS 2,‡) | mg 100 g−1 DW | ||
|---|---|---|---|---|
| Unripe | Intermediate | Ripe | ||
| Hydroxybenzoic acids | 4-hydroxybenzoic acid (136.8/92.9) | 0.50 ± 0.03 a | 0.34 ± 0.02 b | 0.37 ± 0.02 b |
| Gallic acid (168.9/124.7) | 1.4 ± 0.1 a | 2.1 ± 0.2 b | 4.7 ± 0.4 c | |
| Protocatechuic acid (152.7/108.7) | X | X | X | |
| Syringic acid (197.0/180.7) | ✓ | ✓ | 0.63 ± 0.04 | |
| Vanillic acid (167.0/151.7) | X | X | X | |
| Hydroxycinnamic acids | p-coumaric acid (163.0/118.8) | ✓ | ✓ | ✓ |
| Chlorogenic acid (353.1/190.7) | ✓ | ✓ | 0.676 ± 0.005 | |
| Caffeic acid (178.9/134.7) | X | X | X | |
| Caftaric acid (310.9/148.8) | ✓ | ✓ | ✓ | |
| Flavonols | Quercetin (300.9/150.6) | 0.79 ± 0.01 a | 0.84 ± 0.01 a | 0.84 ± 0.01 a |
| Quercetin 3-β-glucoside (463.1/299.7) | 2.3 ± 0.2 a | 1.7 ± 0.1 b | 2.6 ± 0.2 a | |
| Rutin (609.5/300.1) | 0.43 ± 0.03 a | 0.54 ± 0.04 b | 0.57 ± 0.04 b | |
| Kaempferol (284.9/226.3) | 0.74 ± 0.08 a | 0.39 ± 0.04 b | 0.73 ± 0.09 a | |
| Flavanols | (+) Catequin (288.9/108.8) | 149 ± 19 a | 29 ± 4 b | 28 ± 5 b |
| (-)-Epigallocatechin gallate (457.1/124.4) | 1.83 ± 0.04 | ✓ | ✓ | |
| Epigallocatechin (304.9/164.6) | 26 ± 2 a | 10 ± 1 b | 11 ± 1 b | |
| Procyanidin B2 (577.2/288.8) | 49 ± 2 a | 41 ± 2 b | 36 ± 2 c | |
| Flavanones | Naringin (579.1/151.0) | ✓ | 0.35 ± 0.04 | ✓ |
| Flavones | Vitexin (431.1/311.1) | 0.911 ± 0.004 a | 0.980 ± 0.004 a | 0.895 ± 0.005 a |
| Stilbenes | trans-Resveratrol (226.9/142.8) | ✓ | ✓ | ✓ |
| trans-Piceid (390.0/227.4) | ✓ | ✓ | ✓ | |
* A. unedo L. berries harvested in Madrid in 2016. ‡ Product ions used for quantification; X: not detected; ✓: detected but not quantified; a,b,c, mean values within a row followed by different superscript letters are significantly different when subjected to statistical analysis (p ≤ 0.05).
Table 5.
Quantitative analytical results of phenolic compounds in different fruits and fruit berries analyzed by LC-MS (mg 100 g-1 DW) *.
Table 5.
Quantitative analytical results of phenolic compounds in different fruits and fruit berries analyzed by LC-MS (mg 100 g-1 DW) *.
| Fruit | Hydroxybenzoic acid | Hydroxycinnamic acids | Flavonols | Flavanols | Ref | ||||||
|---|---|---|---|---|---|---|---|---|---|---|---|
| GA | 4-HbA | SA | ChA | Q | K | R | C | Ec | PB2 | ||
| Apple | - | - | - | - | - | - | - | 8.5 ± 0.7 | 47 ± 1 | 70 ± 4 | [36] |
| Apricot | - | - | - | - | - | - | - | 21.12 ± 0.06 | 39 ± 2 | 26 ± 2 | [36] |
| Peach | - | - | - | - | - | - | - | 14.4 ± 0.8 | 0.70 ± 0.05 | 0.45 ± 0.01 | [36] |
| Pear | - | - | - | - | - | - | - | 3.64 ± 0.05 | 38 ± 1 | 16 ± 1 | [36] |
| Passion fruit | - | - | - | - | - | - | - | 0.06 ± 0.01 | 4.0 ± 0.4 | 0.15 ± 0.01 | [36] |
| - | 0.044 ± 0.004 | - | 0.07 ± 0.01 | 0.149 ± 0.002 | - | 0.08 ± 0.01 | - | - | - | [37] | |
| Blackberry | - | - | - | - | - | - | - | 6.7 ± 0.6 | 152 ± 2 | 37 ± 2 | [36] |
| Blueberry | - | - | - | - | - | - | - | 5.1 ± 0.2 | 21.7 ± 0.9 | 21 ± 1 | [36] |
| - Pink-lemonade | 0.54 ± 0.03 | 7 ± 1 | - | 331 ± 3 | 1.54 ± 0.02 | - | - | 26.0 ± 0.5 | - | 6.6 ± 0.3 | [38] |
| - Pink-Champagne | 0.33 ± 0.01 | 3.7 ± 0.2 | - | 149 ± 2 | 0.56 ± 0.01 | - | - | 13.1 ± 0.7 | - | 5.4 ± 0.1 | [38] |
| - Florida Rose | 0.28 ± 0.03 | 6.3 ± 0.4 | - | 270 ± 3 | 0.75 ± 0.03 | 44 ± 3 | - | 20.3 ± 0.2 | - | 9.9 ± 0.4 | [38] |
| - US 2117 | 0.26 ± 0.01 | 5.1 ± 0.6 | - | 259 ± 4 | 1.31 ± 0.01 | 27.1 ± 0.7 | - | 20.4 ± 0.6 | - | 5.10 ± 0.05 | [38] |
| - US 2211 | 0.01 ± 0.01 | 5.2 ± 0.2 | - | 208.8 ± 2.6 | 0.78 ± 0.05 | 7.95 ± 0.04 | - | 17.9 ± 0.4 | - | 3.0 ± 0.1 | [38] |
| - US 2235 | 0.15 ± 0.02 | 3.9 ± 0.1 | - | 302 ± 3 | 0.57 ± 0.03 | 47 ± 4 | - | 13.93 ± 0.07 | - | 2.51 ± 0.01 | [38] |
| - Lowbush | 0.35 ± 0.05 | 7 ± 1 | - | 415 ± 8 | 1.22 ± 0.04 | - | - | 11.8 ± 0.3 | - | 7.2 ± 0.4 | [38] |
| - V. arctostaphylos L. | 0.05 ± 0.01 | 0.49 ± 0.01 | 0.90 ± 0.02 | - | - | - | - | - | - | - | [39] |
| Cranberry | - | - | - | - | - | - | - | 4.06 ± 0.08 | 32 ± 1 | 25 ± 1 | [36] |
| Currant | - | - | - | - | - | - | - | 8.5 ± 0.5 | 3.13 ± 0.04 | 0.78 ± 0.02 | [36] |
| Gooseberry | - | - | - | - | - | - | - | 18 ± 1 | 4.23 ± 0.08 | 2.5 ± 0.1 | [36] |
| Raspberry | - | - | - | - | - | - | - | 4.7 ± 0.3 | 52 ± 2 | - | [36] |
| Strawberry | - | - | - | - | - | - | - | 39 ± 2 | 1.27 ± 0.05 | - | [36] |
| Cherry | - | - | - | - | - | - | - | 35 ± 2 | 36.6 ± 0.6 | 20.4 ± 0.4 | [36] |
| Plum | - | - | - | - | - | - | - | 17 ± 1 | 26.2 ± 0.9 | 29 ± 2 | [36] |
| Pomegranate | - | - | - | - | - | - | - | 10.0 ± 0.4 | 0.51 ± 0.03 | 0.23 ± 0.02 | [36] |
| Grape | - | - | - | - | - | - | - | 9.7 ± 0.6 | 2.02 ± 0.09 | 0.80 ± 0.02 | [36] |
| Unripe SWT | 1.4 ± 0.1 | 0.50 ± 0.03 | - | - | 0.79 ± 0.01 | 0.74 ± 0.08 | 0.43 ± 0.03 | 149 ± 19 | - | 49 ± 2 | This work |
| Intermediate SWT | 2.1 ± 0.2 a | 0.34 ± 0.02 | - | - | 0.84 ± 0.01 | 0.39 ± 0.04 | 0.54 ± 0.04 | 29 ± 4 | - | 41 ± 2 | This work |
| Ripe SWT | 4.7 ± 0.4 b | 0.37 ± 0.02 | 0.63 ± 0.04 | 0.676 ± 0.005 | 0.84 ± 0.01 | 0.73 ± 0.09 | 0.57 ± 0.04 | 28 ± 5 | - | 36 ± 2 | This work |
* Values given as the mean ± SD (n = 3). GA: Gallic acid; 4-HbA: 4-Hydroxybenzoic acid; SA: Syringic acid; ChA: Chlorogenic acid; Q:Quercetin; K: Kaempferol; R: Rutin; C: Catechin; Ec: Epicatechin; PB2: Procyanidin B2; SWT: strawberry tree.
Publisher’s Note: MDPI stays neutral with regard to jurisdictional claims in published maps and institutional affiliations. |
© 2021 by the authors. Licensee MDPI, Basel, Switzerland. This article is an open access article distributed under the terms and conditions of the Creative Commons Attribution (CC BY) license (https://creativecommons.org/licenses/by/4.0/).
Share and Cite
MDPI and ACS Style
Izcara, S.; Morante-Zarcero, S.; Casado, N.; Sierra, I. Study of the Phenolic Compound Profile of Arbutus unedo L. Fruits at Different Ripening Stages by HPLC-TQ-MS/MS. Appl. Sci. 2021, 11, 11616. https://doi.org/10.3390/app112411616
AMA Style
Izcara S, Morante-Zarcero S, Casado N, Sierra I. Study of the Phenolic Compound Profile of Arbutus unedo L. Fruits at Different Ripening Stages by HPLC-TQ-MS/MS. Applied Sciences. 2021; 11(24):11616. https://doi.org/10.3390/app112411616
Chicago/Turabian StyleIzcara, Sergio, Sonia Morante-Zarcero, Natalia Casado, and Isabel Sierra. 2021. "Study of the Phenolic Compound Profile of Arbutus unedo L. Fruits at Different Ripening Stages by HPLC-TQ-MS/MS" Applied Sciences 11, no. 24: 11616. https://doi.org/10.3390/app112411616
Note that from the first issue of 2016, this journal uses article numbers instead of page numbers. See further details here.