Article

Impact Damage Detection of a Glass Fabric Composite Using Carbon Fiber Sensors with Regard to Mechanical Loading

1
Department of Mechanics, Biomechanics and Mechatronics, Faculty of Mechanical Engineering, Czech Technical University in Prague, Technická 4, 16000 Prague, Czech Republic
2
CC Smart Composites, Department of Mechanical, Automotive and Aeronautical Engineering, University of Applied Sciences Munich, Lothstrasse 34, 80335 Munich, Germany
3
Department of Aerospace Engineering, Faculty of Mechanical Engineering, Czech Technical University in Prague, Karlovo Náměstí 13, 12000 Prague, Czech Republic
4
Department of Machining, Process Planning and Metrology, Faculty of Mechanical Engineering, Czech Technical University in Prague, Technická 4, 16000 Prague, Czech Republic
*
Author to whom correspondence should be addressed.
Appl. Sci. 2022, 12(3), 1112; https://doi.org/10.3390/app12031112
Submission received: 31 December 2021 / Revised: 14 January 2022 / Accepted: 18 January 2022 / Published: 21 January 2022
(This article belongs to the Special Issue Non-Destructive Testing of Materials and Structures)

Abstract

:
Structural Health Monitoring (SHM) of composite structures leads to greater safety during operation and reduces the cost of regular inspections. Impact damage detection is an important SHM task. Since impact damage can significantly reduce the lifetime of composite structures, sensors for impact damage are of great interest. Carbon Fiber Sensors (CFSs) can be used to detect composite damage. CFSs are lightweight and compact, and they can be integrated during the manufacturing process. In our study, CFSs were manufactured from three types of carbon fiber tows and were integrated into different layers of the lay-up in order to investigate the influence on impact damage detection. The effect of mechanical loading and temperature change on the measured electrical resistance was investigated during cyclic flexural tests. It was revealed that, it is possible to distinguish between changes in measured signals due to impact and due mechanical loading. The change in the measured electrical signal caused by temperature can be eliminated. CFSs can be used for impact damage detection of a glass fabric composite. A combination of thermography and CFSs as an active heating element also provides good results in the field of impact damage detection

1. Introduction

Applications of composite materials are nowadays spreading from the aircraft and marine industry to the manufacturing industry and sports equipment. In almost all applications, composites are exposed to cyclic mechanical loading. In addition, various types of impacts can occur during the lifetime of the product. Impacts on composite can be visible or barely visible (very difficult to visual inspection or not possible to detect by visual inspection) [1,2]. Although visible impacts cause greater damage to the material (visible surface dents, fiber breakage, matrix cracking, and multiple delaminations between plies) and bigger loss of compression and tension strength than barely visible impact damage (BVID), they can be revealed by visual inspection and by other methods easier than BVID. Barely visible impacts cause delamination of the composite material, which leads to buckling and a significant decrease of compressive strength of the composite [3]. The internal damage of the composite material in form of delamination also grows under cyclic loading and can lead to fatal damage [2,4]. Detection of BVID in composites is therefore of great interest.
There are many Non-Destructive Testing (NDT) methods that can reveal the damage. However, NDT methods mostly require the structure to be taken out of service (ultrasonic C-scan, speckle techniques, X-ray micro-computed tomography), which is costly [3,4,5]. New sensors and new approaches are therefore being developed to reveal damage to composite materials. NDT methods are also being modified for in-situ monitoring [6,7,8,9]. Monitoring in construction materials can also be carried out using the non-destructive self-acoustic method [10] with which it is possible to detect structure deformation.
There are two different approaches to the inspection of impact damage to composite materials in-situ. The first approach is to monitor the response of the material itself (contact ultrasonic inspection, acoustic emission, eddy current, electromechanical impedance, ultrasonic guided waves, speckle interferometry, thermography, etc.) [11,12]. For self-sensing purposes, the electrical conductivity of the fibers (carbon-fiber composites) [9,13,14,15], or the electrical conductivity of the matrix can be used by adding conductive particles to the matrix, e.g., carbon nanotubes [16,17]. The second approach is to perform in-situ monitoring with the use of sensors embedded during manufacturing or attached sensors (fiber Bragg grating, crack propagation gauges, comparative vacuum monitoring, crack wire, carbon fiber sensors, carbon nanotube thread sensor, etc.) [7,18,19,20].
It is not possible to say which inspection method is the best, because each application has different requirements, and each inspection method has some advantages and some weaknesses. Ideal, the method should be of high resolution, good localization, quick, easy to operate, and cost-effective. Methods, which give precise information about the size and nature of the damage, are time demanding and often need laboratory conditions (e.g., immersion, taking part out of service, etc.). Between high precision methods, we can classify ultrasonic immersion C-scan, X-ray radiography, X-ray micro-computed tomography, and speckle techniques. Other methods are applicable for in-field impact damage detection [3] but are also time demanding such as visual inspection, mechanical impedance inspection, in-field ultrasonic inspection, shearography (heat/vacuum method), thermography. Detection Techniques based on guided waves are also very effective in the identification of impact damage [12,21]. Monitoring methods based on the electric conductivity of the composite material were successfully so far on small scale coupons (100 mm × 100 mm) [13,16]. Impact damage detection using optical fibers with Bragg gratings for BVID was presented [22], the drawback of the optical fibers is their quite high cost and difficulties during manufacturing due to the handling of the optical fibers themselves.
In this paper, we present an investigation of impact damage detection using Carbon Fiber Sensors (CFSs). Publications dealing with CFSs have presented good results on mechanical strain monitoring [23,24,25], microcracks monitoring, and delamination monitoring [26]. Our previous published work has also shown good prospects for impact damage monitoring [27]. Compared to other SHM methods CFS detects damages along the sensor fiber. Therefore, this method has a high potential to be used for impact loaded leading edges, etc. Müller et al. used CFS to detect microcracking along the length of the fiber, which was wrapped around pressure vessels [26]. An advantage of this type of sensor is also the possibility to integrate the sensor into the material during manufacturing. The sensor does not compromise the integrity of the material. Another aspect compared to other monitoring system are the costs of the measuring systems. Since the CFS is a piezoresistive sensor cost effective electronic devices can be applied compared to optical systems (i.e., fiber Bragg grating) or piezoelectric SHM systems. CFSs can be possibly used for remote monitoring. The CFSs should work as an indicator of impact damage.
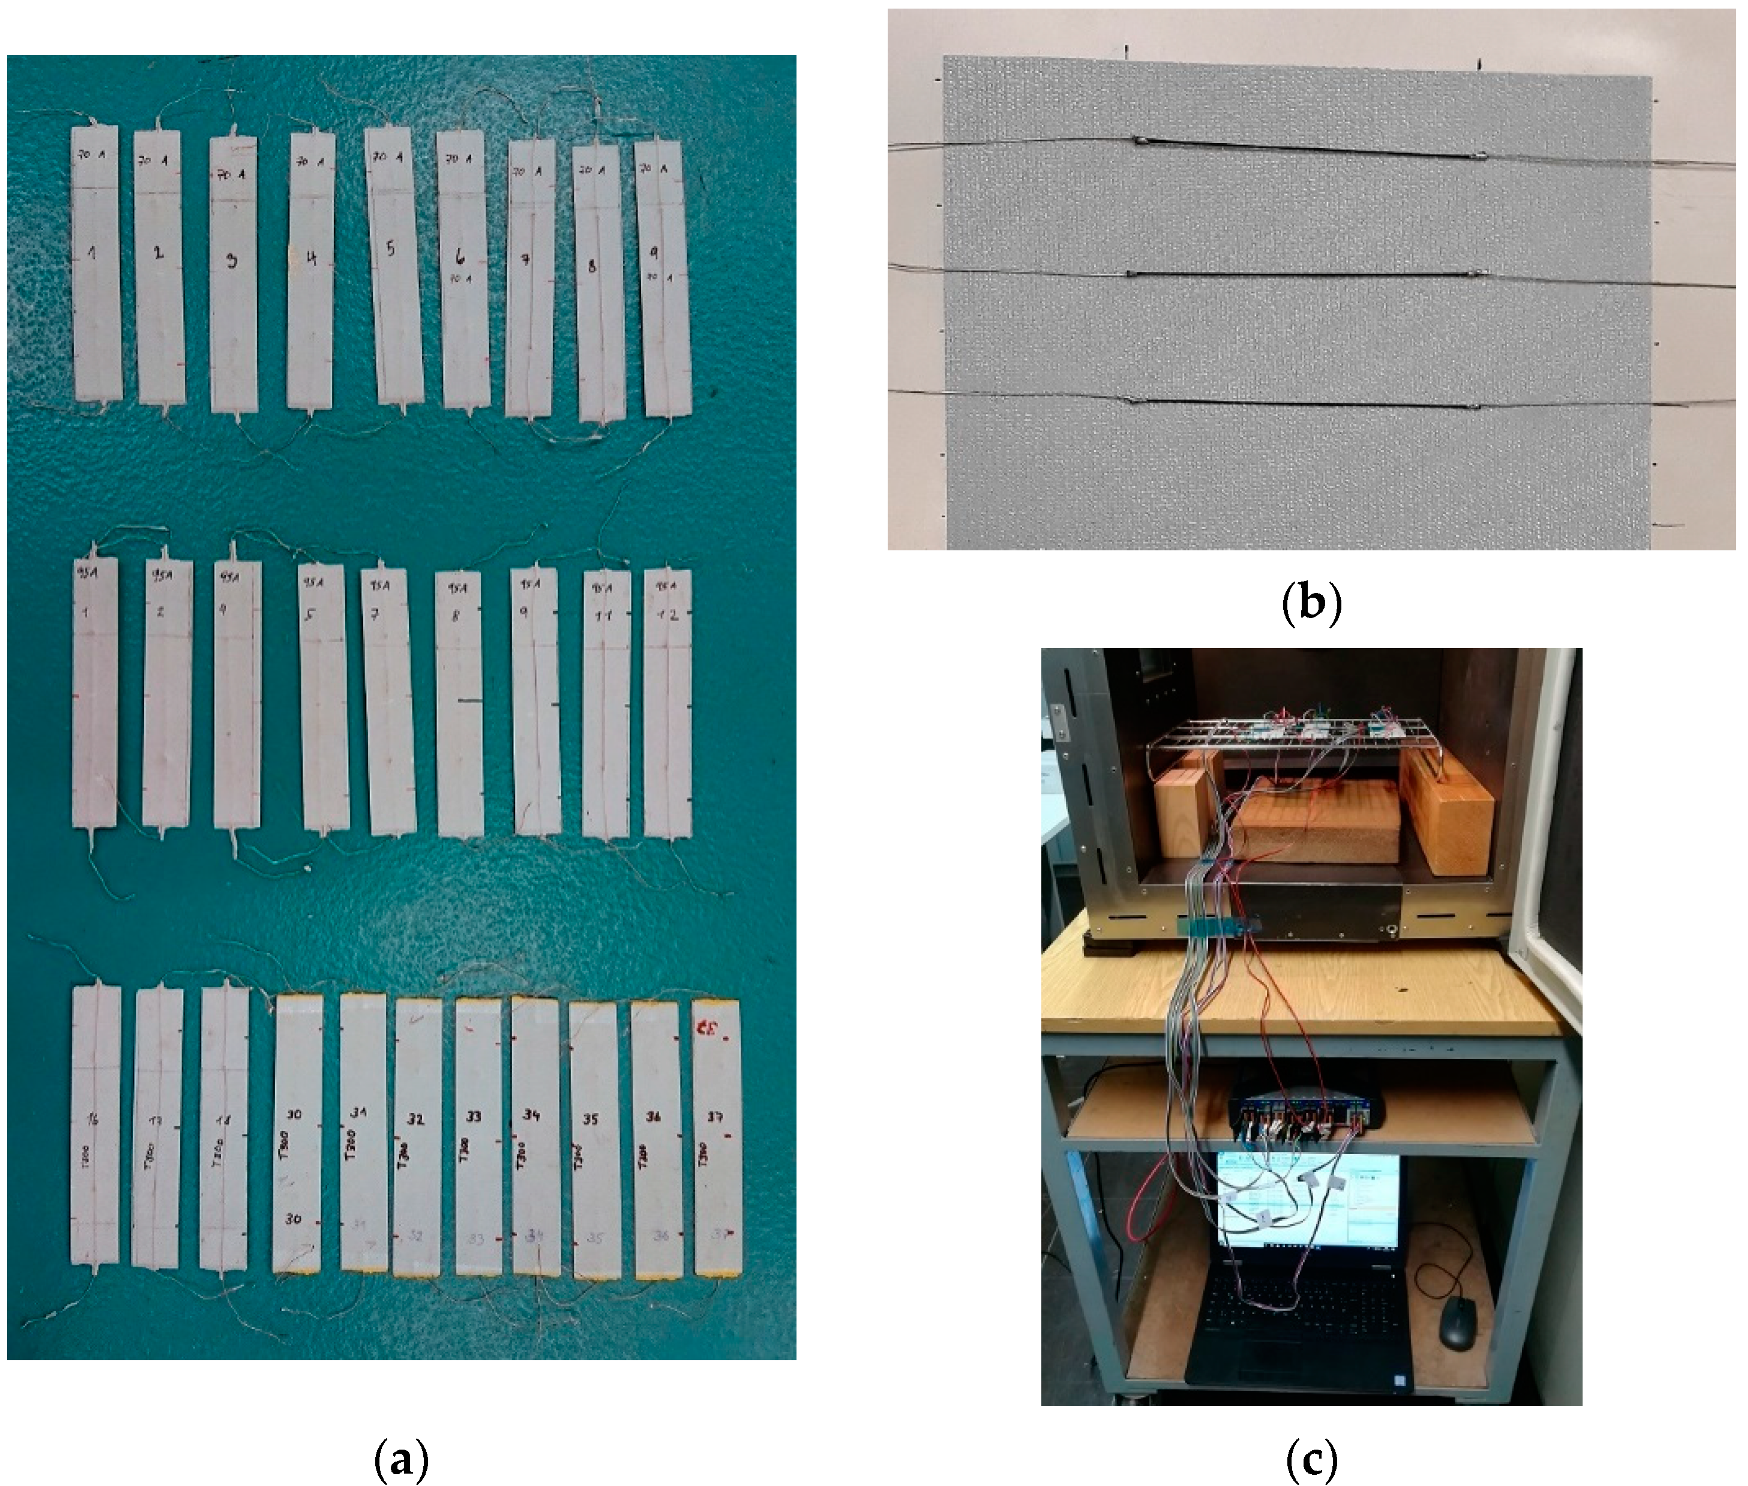
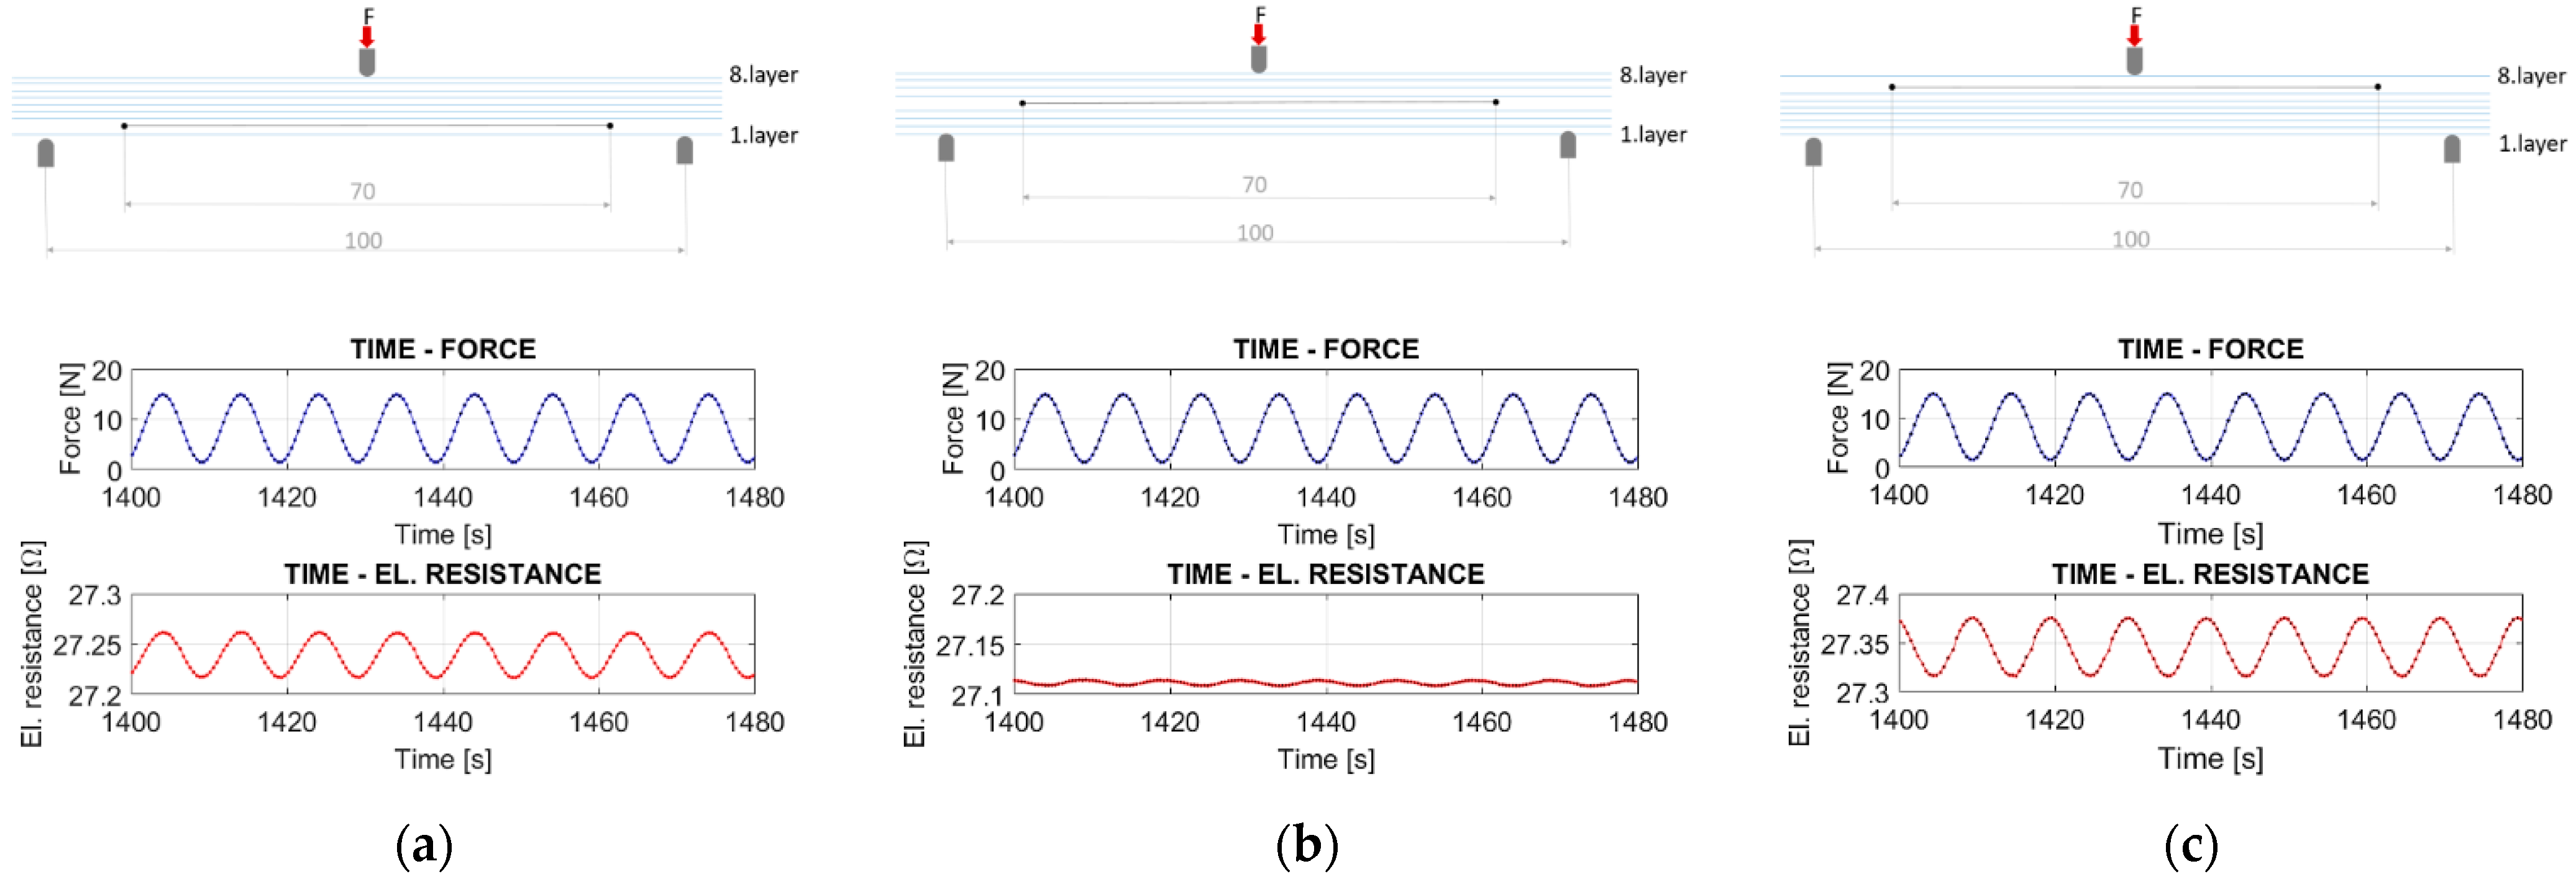
The work presented here reports on a comparative study of CFSs made of three different carbon fiber tow. The CFSs were integrated into specimens made of standard prepreg material and were manufactured using autoclave technology. Flat specimens made of 8 layers of woven glass prepreg sheets were manufactured with embedded CFSs. The CFSs were embedded in three different positions (close to the top of the specimen, close to the bottom of the specimen, and in the middle of the lay-up). The specimens were exposed to cyclic flexural loading before and after impact loading. An inspection of the specimens was carried out using thermographic inspection and computer tomography (CT).
The influence of the ultimate elongation of the material on impact damage detection is studied. The relationship between the mechanical loading and the measured electrical resistance of the CFSs is also investigated. The effects of the arrangement of the CFS in the composite lay-up are discussed.

2. Materials and Methods

2.1. Sample Preparation

The specimens were made of glass woven fabric prepreg sheets used in the aerospace industry. The autoclave curing technique was chosen. Specimens were prepared in LA Composite, s.r.o. in Prague, Czech Republic. Laminate lay-up [+45/0/-45/90]sym was used for preparing the specimens. Prepreg material made of woven fabric with epoxy resin HexPly 1454 GM/50%/1035 (Hexcel Composites SASU, Bouguenais Cedex, France) was chosen. The following curing process was applied according to the manufacturer’s recommendation: 125 °C for 90 min, 6 bar. The specimens were cut into strips with dimensions of 140 mm × 23 mm and were 1.3 mm in thickness, see Figure 1.
Three different integration arrangements were applied. The carbon fiber sensors were placed between the first and second layer, between the fourth and fifth layer, and between the seventh and eighth layer. Table 1 presents an overview of the specimens for the mechanical tests and the different CFS materials that were used.

2.2. Carbon Fiber Sensors (CFSs)

The carbon fiber sensors were made of three different fiber tows. The manufacturing process is described in [25]. The material properties of each material are given in Table 2. The materials for the preparation of the CFSs were selected in such a way that the influence of the ultimate elongation on the impact damage detection could be assessed.
The aim was to find whether an impact can damage the sensor fiber, and how the damage to the sensor influences the signal. The T300 1000-50A PAN tow that was chosen had already been used for another comparative study and also for various sensing applications [23,24,25,26,27].

2.3. Mechanical Testing and Impact Loading

All specimens were exposed to a three-point bending (3PB) test. This type of cyclic flexural test was chosen in order to prevent damage in the area of electrical contacts. The configuration of the loading shown in Figure 2 results in tension/compression loading of the sensor fiber, due to its non-symmetrical integration (see also Figure 8). The cyclic loading was performed by the hydraulic testing system MTS Mini Bionix (MTS, Eden Prairie, MN, USA).
The specimens were loaded with a loading force of 1.5–15 N (load ratio = 0.1) at a frequency of 0.1 Hz. The maximum loading force was established during the preliminary test. During this test, a strain-gage was installed in the middle part of the outer surface of the specimen. The maximum loading force of 15 N corresponds to a measured longitudinal strain of 3200 μm/m during the preliminary test. This strain level corresponds to a maximal loading level in many applications to avoid intralaminar matrix cracks. The specimens were exposed to 200 load cycles before impact loading and to 200 load cycles after impact loading. Measurements of the changes in electrical resistance were performed using a Keysight 344401A multimeter. The 4-wire resistance measurement method was used in order to eliminate test lead resistances and contact resistances.
The possibility of detecting impact damage using CFSs was investigated by a simple drop weight impact test using an impact device made in-house according to ASTM D 7136. The specimens were fixture to the supports according to Figure 3. The groove in the supports was made in order to prevent damage to the sensor during clamping of the specimen. The configuration of the impact test is shown in Figure 3. An impactor 16 mm in diameter and 410 g in weight (m) was used. The height (h) for the drop impact test was 0.5 m, so the impact energy was 2 J. The impact energy was calculated according to Formula (1).
E = m·g·h.
There was no visible damage to the impacted side of the specimen (the mold side of the specimen was impacted) after the 2 J impact. There were damages to the opposite side of the specimens which could be also detected by visual inspection for some specimens.
Specimens T300-32, T300-33, T300-36, T300-37 were impacted twice because the first impact was outside the area of the CFS. Specimens T300-34 and T300-35 were not subjected to impact loading.

2.4. Temperature Loading

Several specimens with integrated CFSs were manufactured for the experimental study on the influence of temperature on the electrical resistance of CFSs made of different materials (see Table 3). The CFSs were embedded between the same layers for all specimens (between the first and the second layer). The HBM QuantumX MX 1615 measuring amplifier was used at a 50 Hz sampling rate. The CFS-probes were connected by a 2-wire resistance measuring circuit. In addition, two PT-100 temperature sensors (Heraeus Nexensos M222, tolerance: F 0.1) were connected by a 4-wire resistance measurement (see Figure 1). One PT-100 temperature sensor was placed in such a way that the flowing air could pass freely. The other sensor was attached to the surface of the specimen to measure the temperature near the inertia of the specimen. The temperature of the oven (Zwick temperature chamber EC75A) was incremented with 20 °C temperature steps with a hold time of 30 min to a maximum temperature of 120 °C. After the maximum temperature was reached, the door of the oven was opened for a cool down period of 60 min.

2.5. Non-Destructive Testing

The FLIR A325sc infrared camera was employed for an active thermographic inspection of all specimens using the sensor fiber as heating element. All specimens were inspected after they were manufactured and after drop-weight impact testing. Several specimens were also inspected after 200 cycles of flexural loading and before the impact test.
The inspection was applied on the mold side of the specimen (=impacted side = outer surface during the cyclic flexural test). An electric current was applied to the CFSs integrated in the specimens during the thermographic inspection for 10 min via a direct current source (Agilent E3631A). The type T300 CFSs were subjected to an electric current of 0.09 A. An electric current of 0.3 A was used for CFS type 95 A, and an electric current of 0.24 A was used for CFSs type 70 A.
Zeiss Metrotom 1500 Computer Tomography (CT) was employed to evaluate the impact-induced damage to the composite laminates. A detector resolution of the CT was 2048 × 2048 px, 1950 frames were taken during scanning. Specimens that were investigated using CT are written in bold in Table 1. The specimens were investigated using CT after all mechanical tests had been completed.

3. Results and Discussion

3.1. Temperature Loading

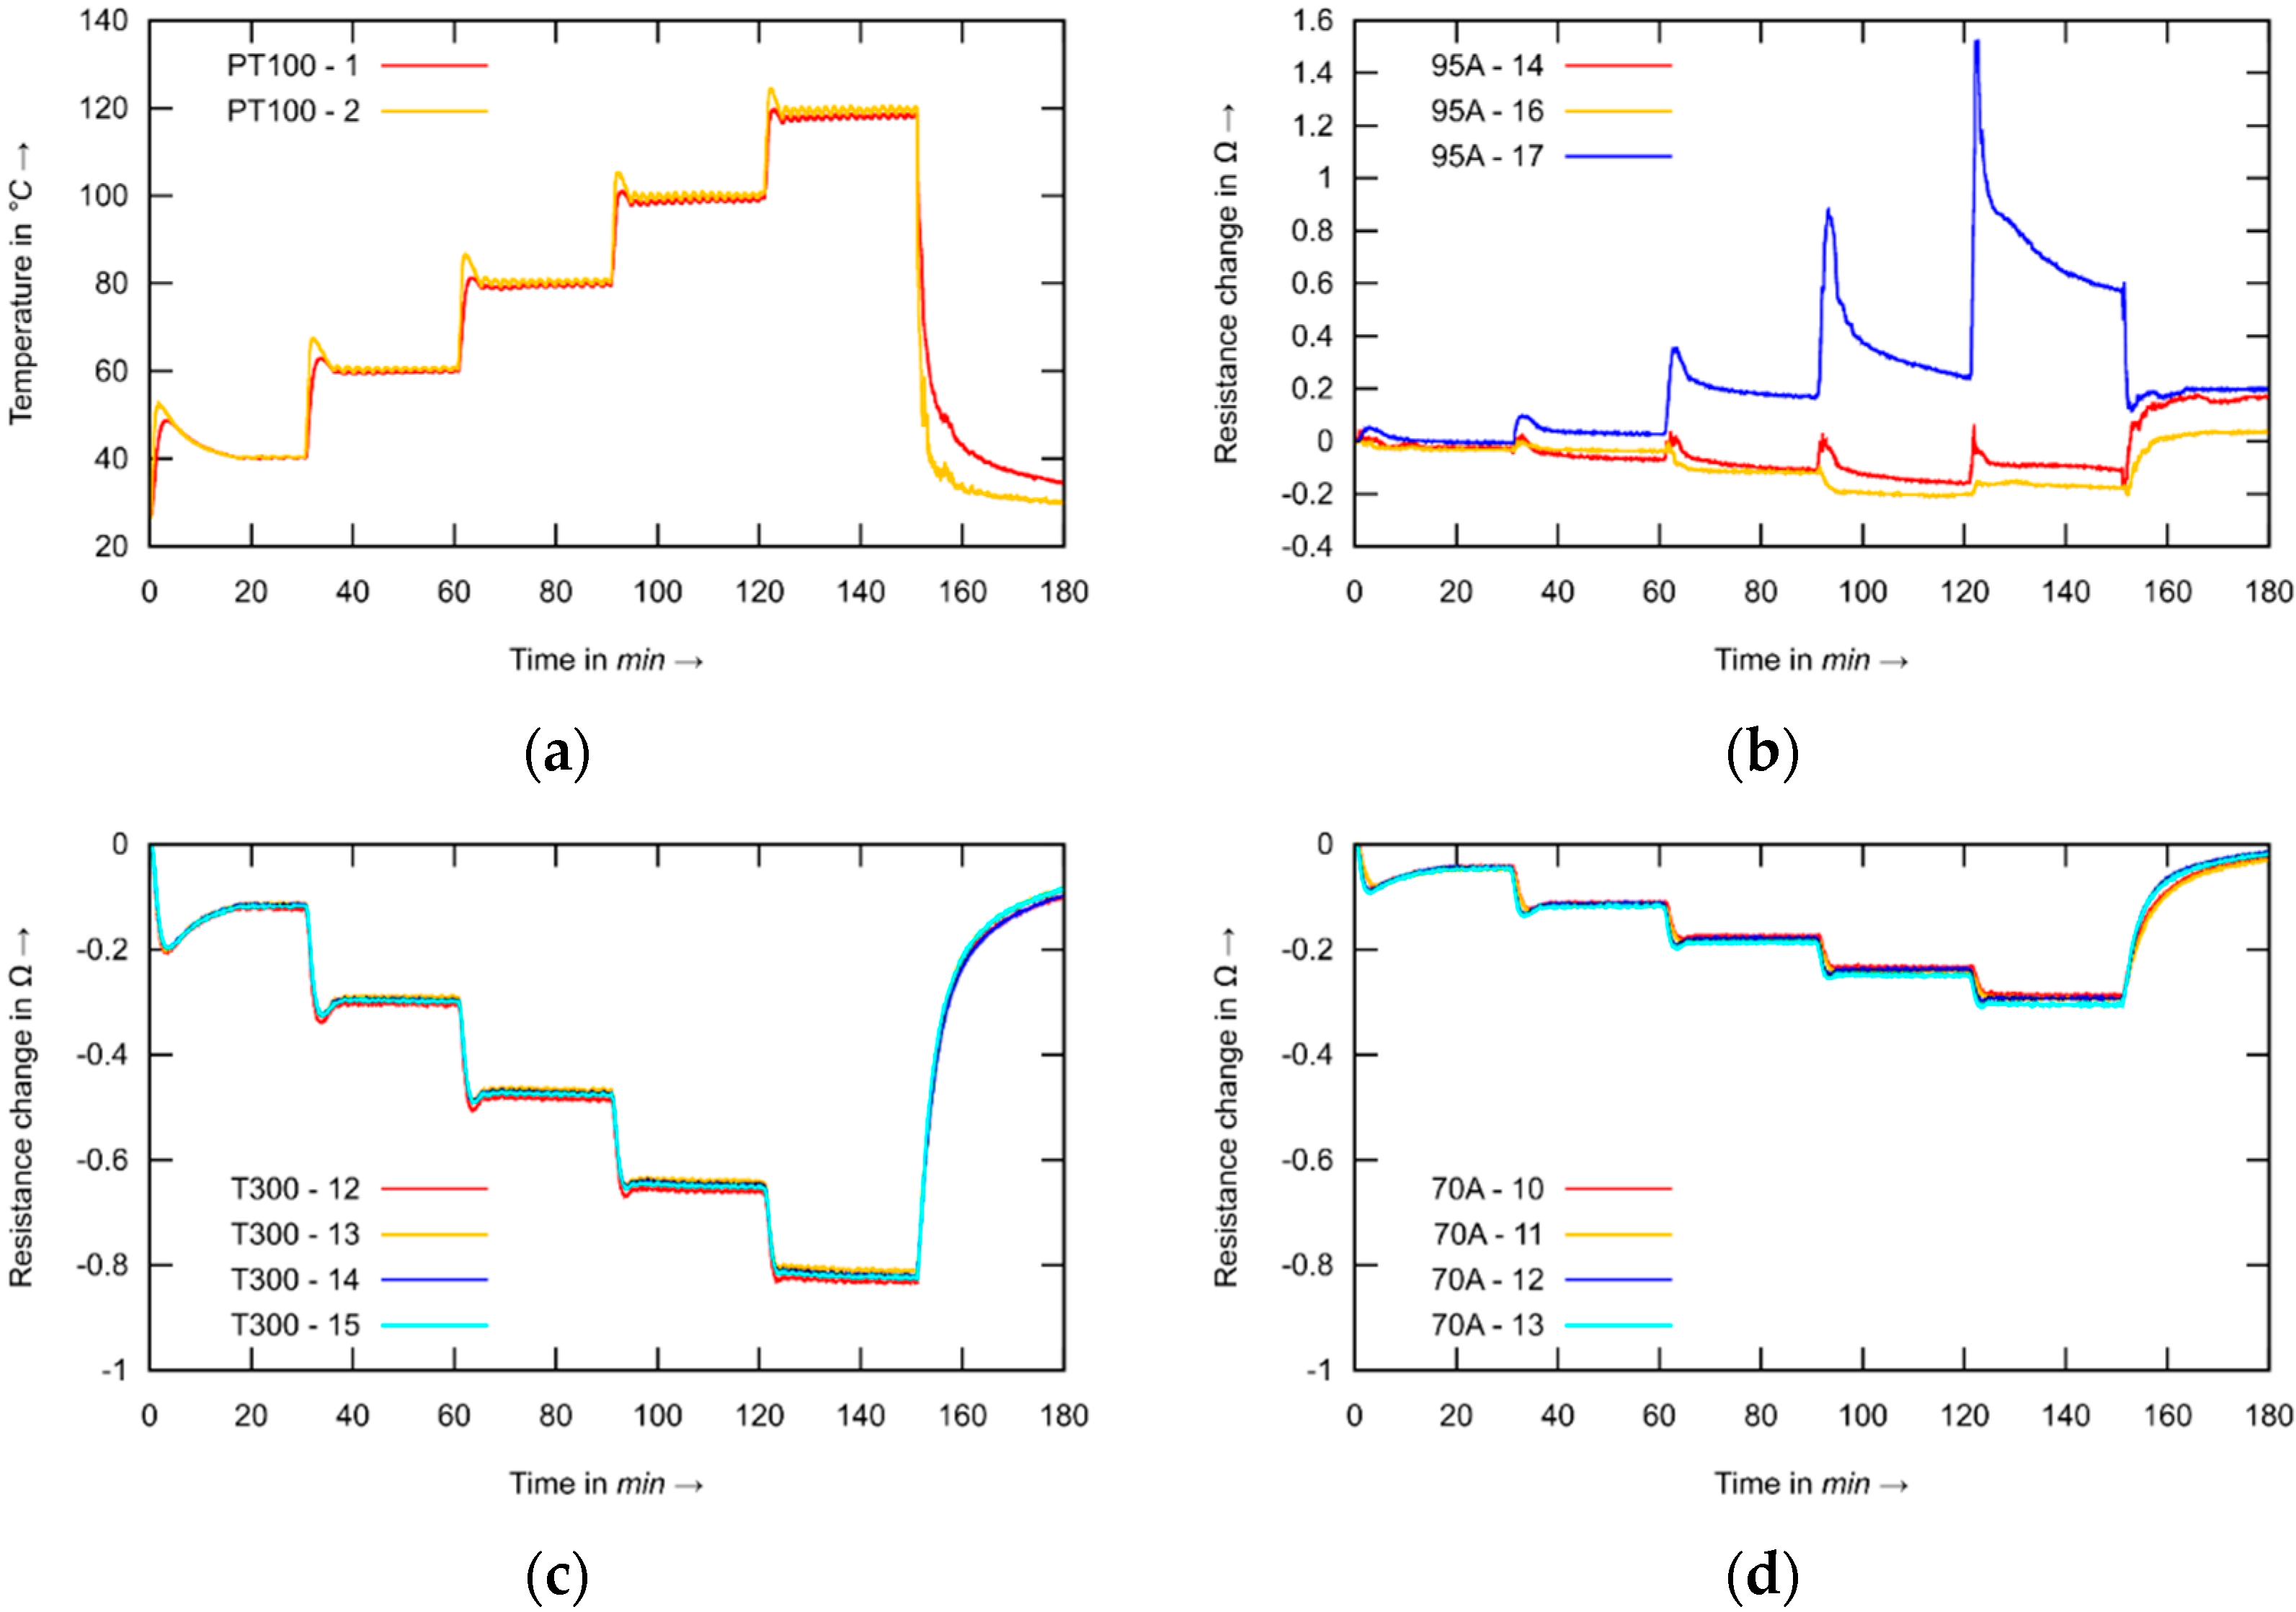
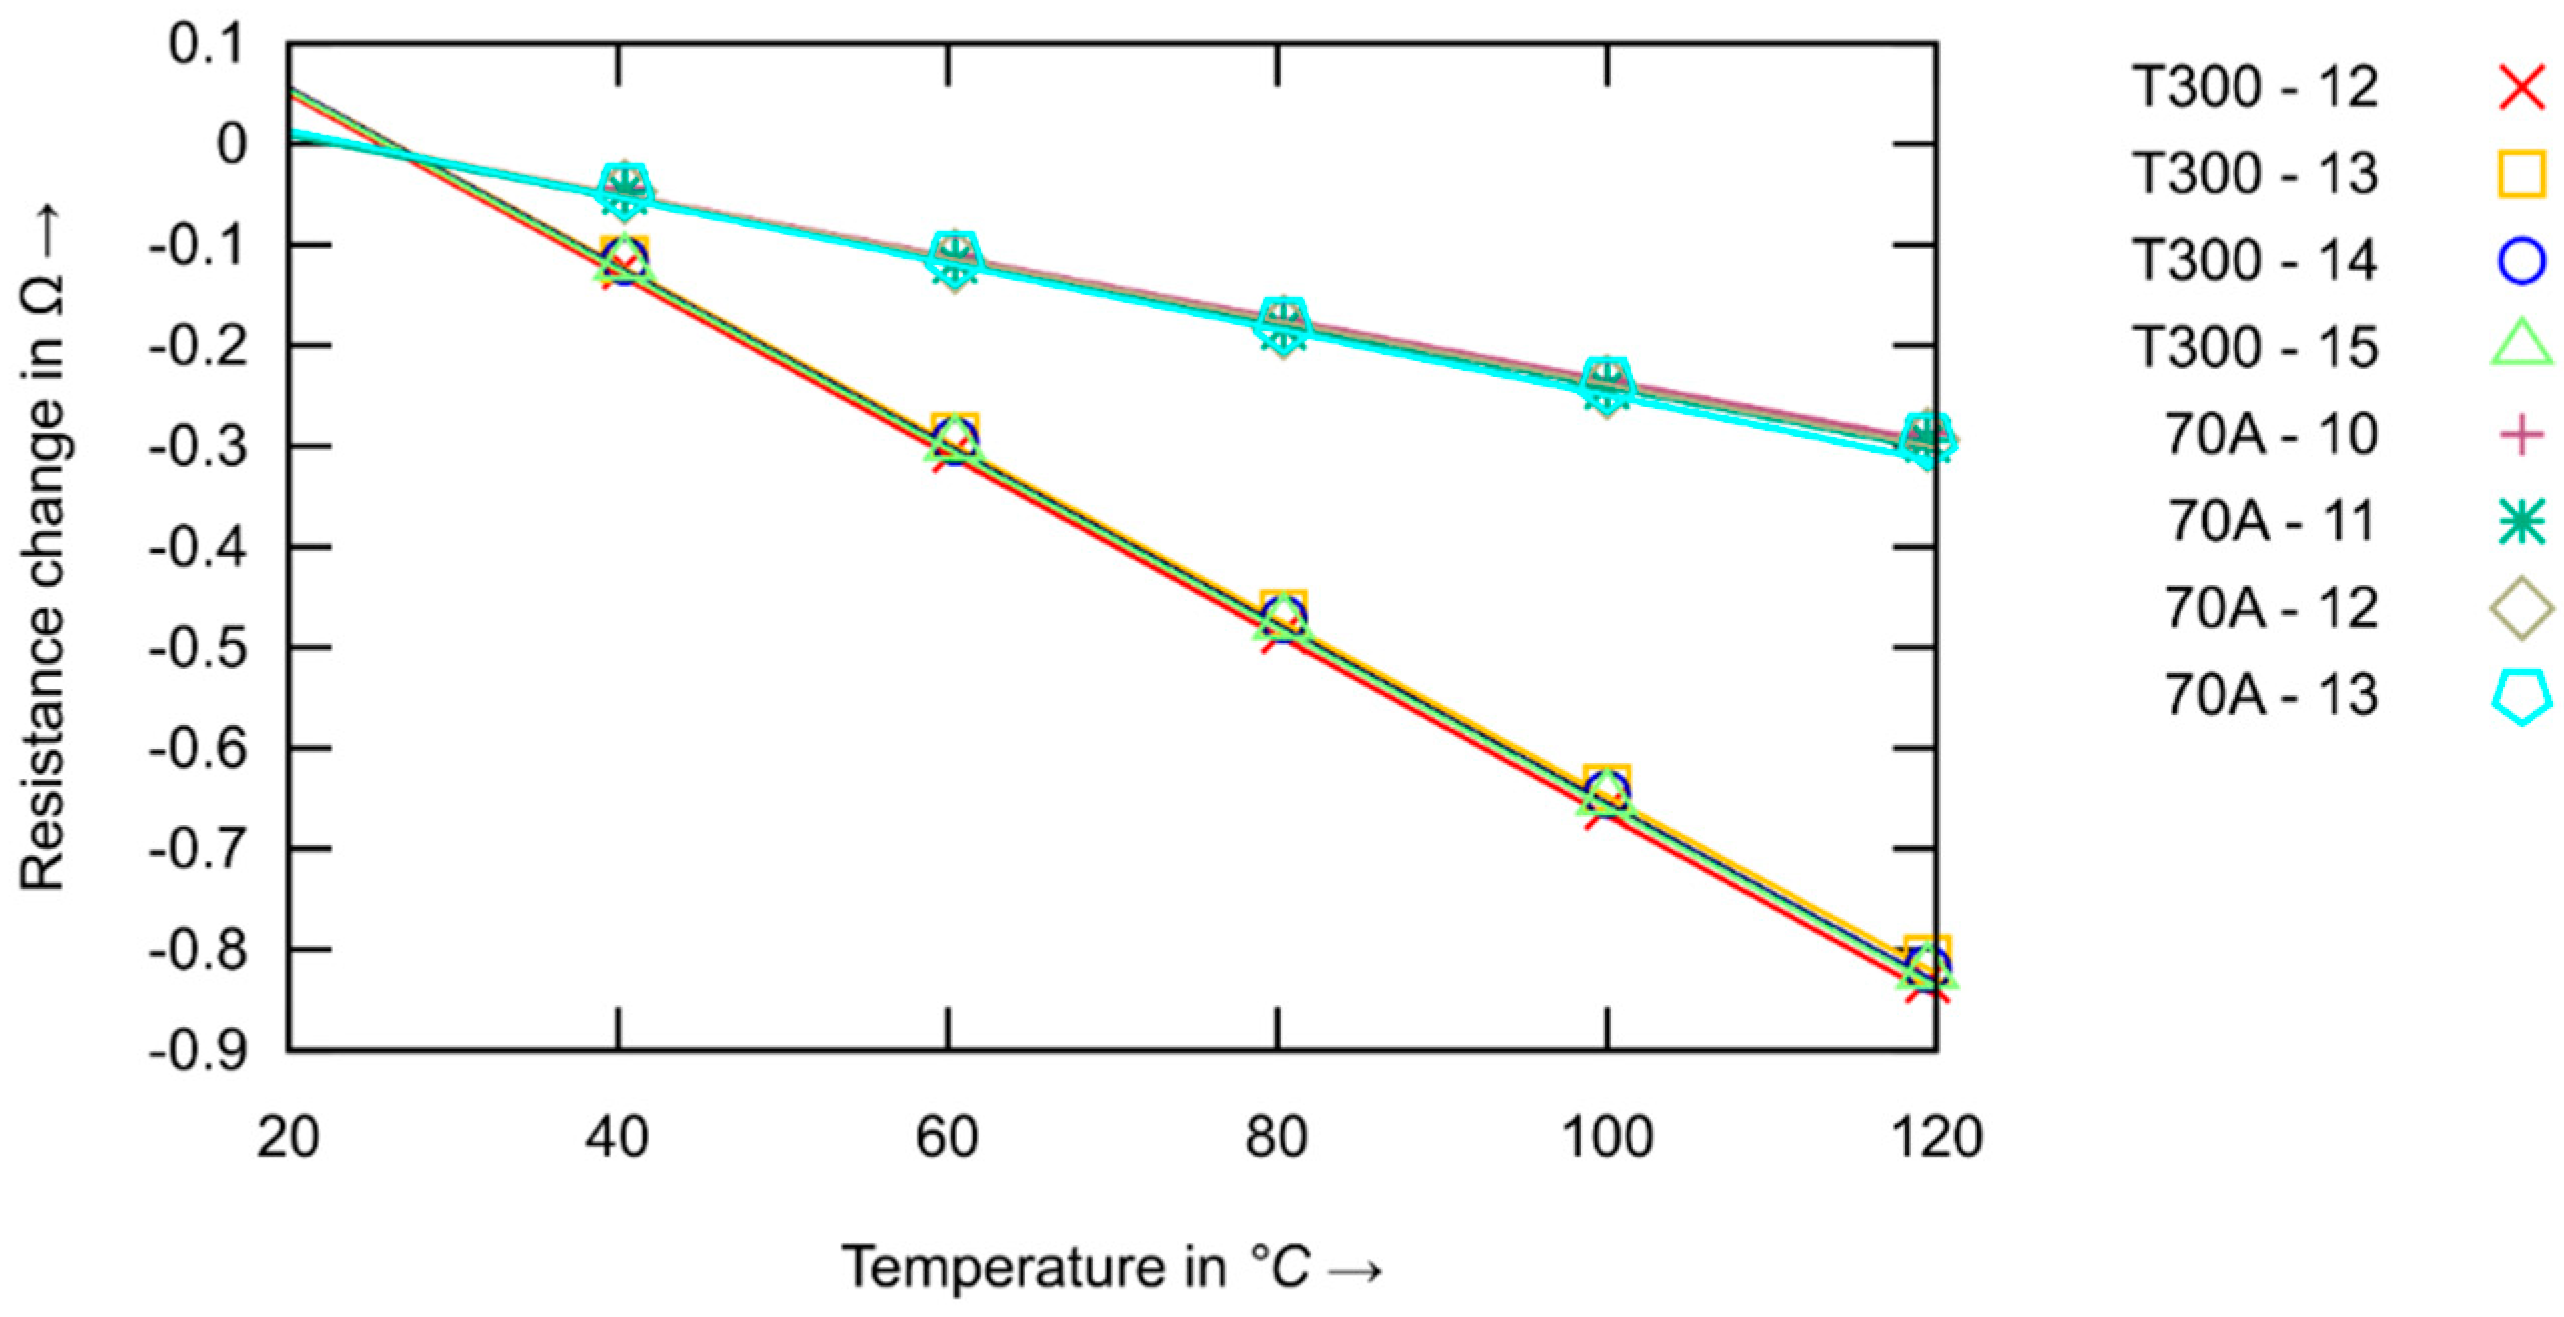
Figure 4 presents the raw measured values. In Figure 4a, the measured temperatures show the behavior of the temperature control of the oven. After a new temperature value has been set, the oven needs up to 15 min to reach a constant temperature level. The differences between the PT100 sensors just after a new temperature has been set due to the airflow inside the oven and the different location of the temperature sensor. At lower temperatures, the two PT100 sensors show a difference in the measured values of about 0.02 °C, which increases to about 1.97 °C or 1.64% at 120 °C. For further evaluation, the data of the sensor attached to the surface of the specimen was used.
Figure 4c presents the measured values of the T300 ex-PAN samples. The curve looks like an upside down version of the curves in Figure 4a since the CFSs reduce their resistance with increasing temperatures. An offset of the resistance values of about 0.02 Ω can be seen. The curves in Figure 4d of the 70 A ex-pitch CFS show quite similar behavior to the curves in Figure 4a. The measured values are smaller since the ex-pitch CFSs have a much lower resistance of about 3.1 Ω in comparison with the 27.3 Ω resistance of the T300 CFS.
An increase in resistance with an increase in temperature can be observed for the 95 A CFS in Figure 4d. This effect is more pronounced with higher resistance values before the temperature measurement and can probably be attributed to pre-damage at the electrical contact point during manufacturing (see Section 3.3). No further examination was made of 95A-CFS.
The T300 samples show a resistance drop of 3% (0.8 Ω) while the 70 A samples show a drop of 8.5% (0.3 Ω) at a temperature level of 120 °C. This means that the effect of the temperature on the fiber resistance is greater for 70 A than for T300-CFS.
For practical applications, it is necessary to calculate the linear fit model from the measured data. For this purpose, the measured values were taken between 15 min after setting a new temperature and the next increase in temperature. For each temperature level, the mean values of the measured temperature were calculated and were used for the linear fit model (see Figure 5).
A linear fit model was chosen, seen Equation (2), with the slope of the linear fit m, the resistance at 0 °C of the CFS R0°C, and the measured resistance of the CFS RT.
TCFS = (RTR0°C)/m.
The calculated coefficients of the linear model, and also the R2 and root mean squared error (RMSE) values, are summarized in Table 4. The high R2 values show, that the CFS signals show good linear behavior. The RMSE values show the magnitude of the error between the linear fit function and the measured mean values of the CFS samples.
For an evaluation of the cyclic experiments and also for the possible practical utilization of the CFSs, it is necessary to evaluate a possible ±3 °C change in temperature. This corresponds to an increase of ±0.1% in the relative electrical resistance for a CFS made of T300 material and of ±0.3% for a CFS made of 70 A material (calculated for an averaged value of m and R0°C from the measured data).

3.2. Mechanical Testing

Most composite structures for which impact damage detection is an intending aspect are also exposed to cyclic loading. The influence of cyclic mechanical loading on the measured signal of impact sensors is therefore of great interest. The purpose of the mechanical testing was to describe the response of the measured signal of the investigated sensors with regard to:
  • Number of cycles;
  • The positioning of the CFS in the composites lay-up;
  • Influence of different materials on the CFS signal.
Specimens with integrated sensors were exposed to cyclic flexural loading before and after impact loading. During mechanical loading, the room temperature was measured in order to exclude this influence. The influence of a change in temperature on the measured signal of CFSs is described in Section 3.1.
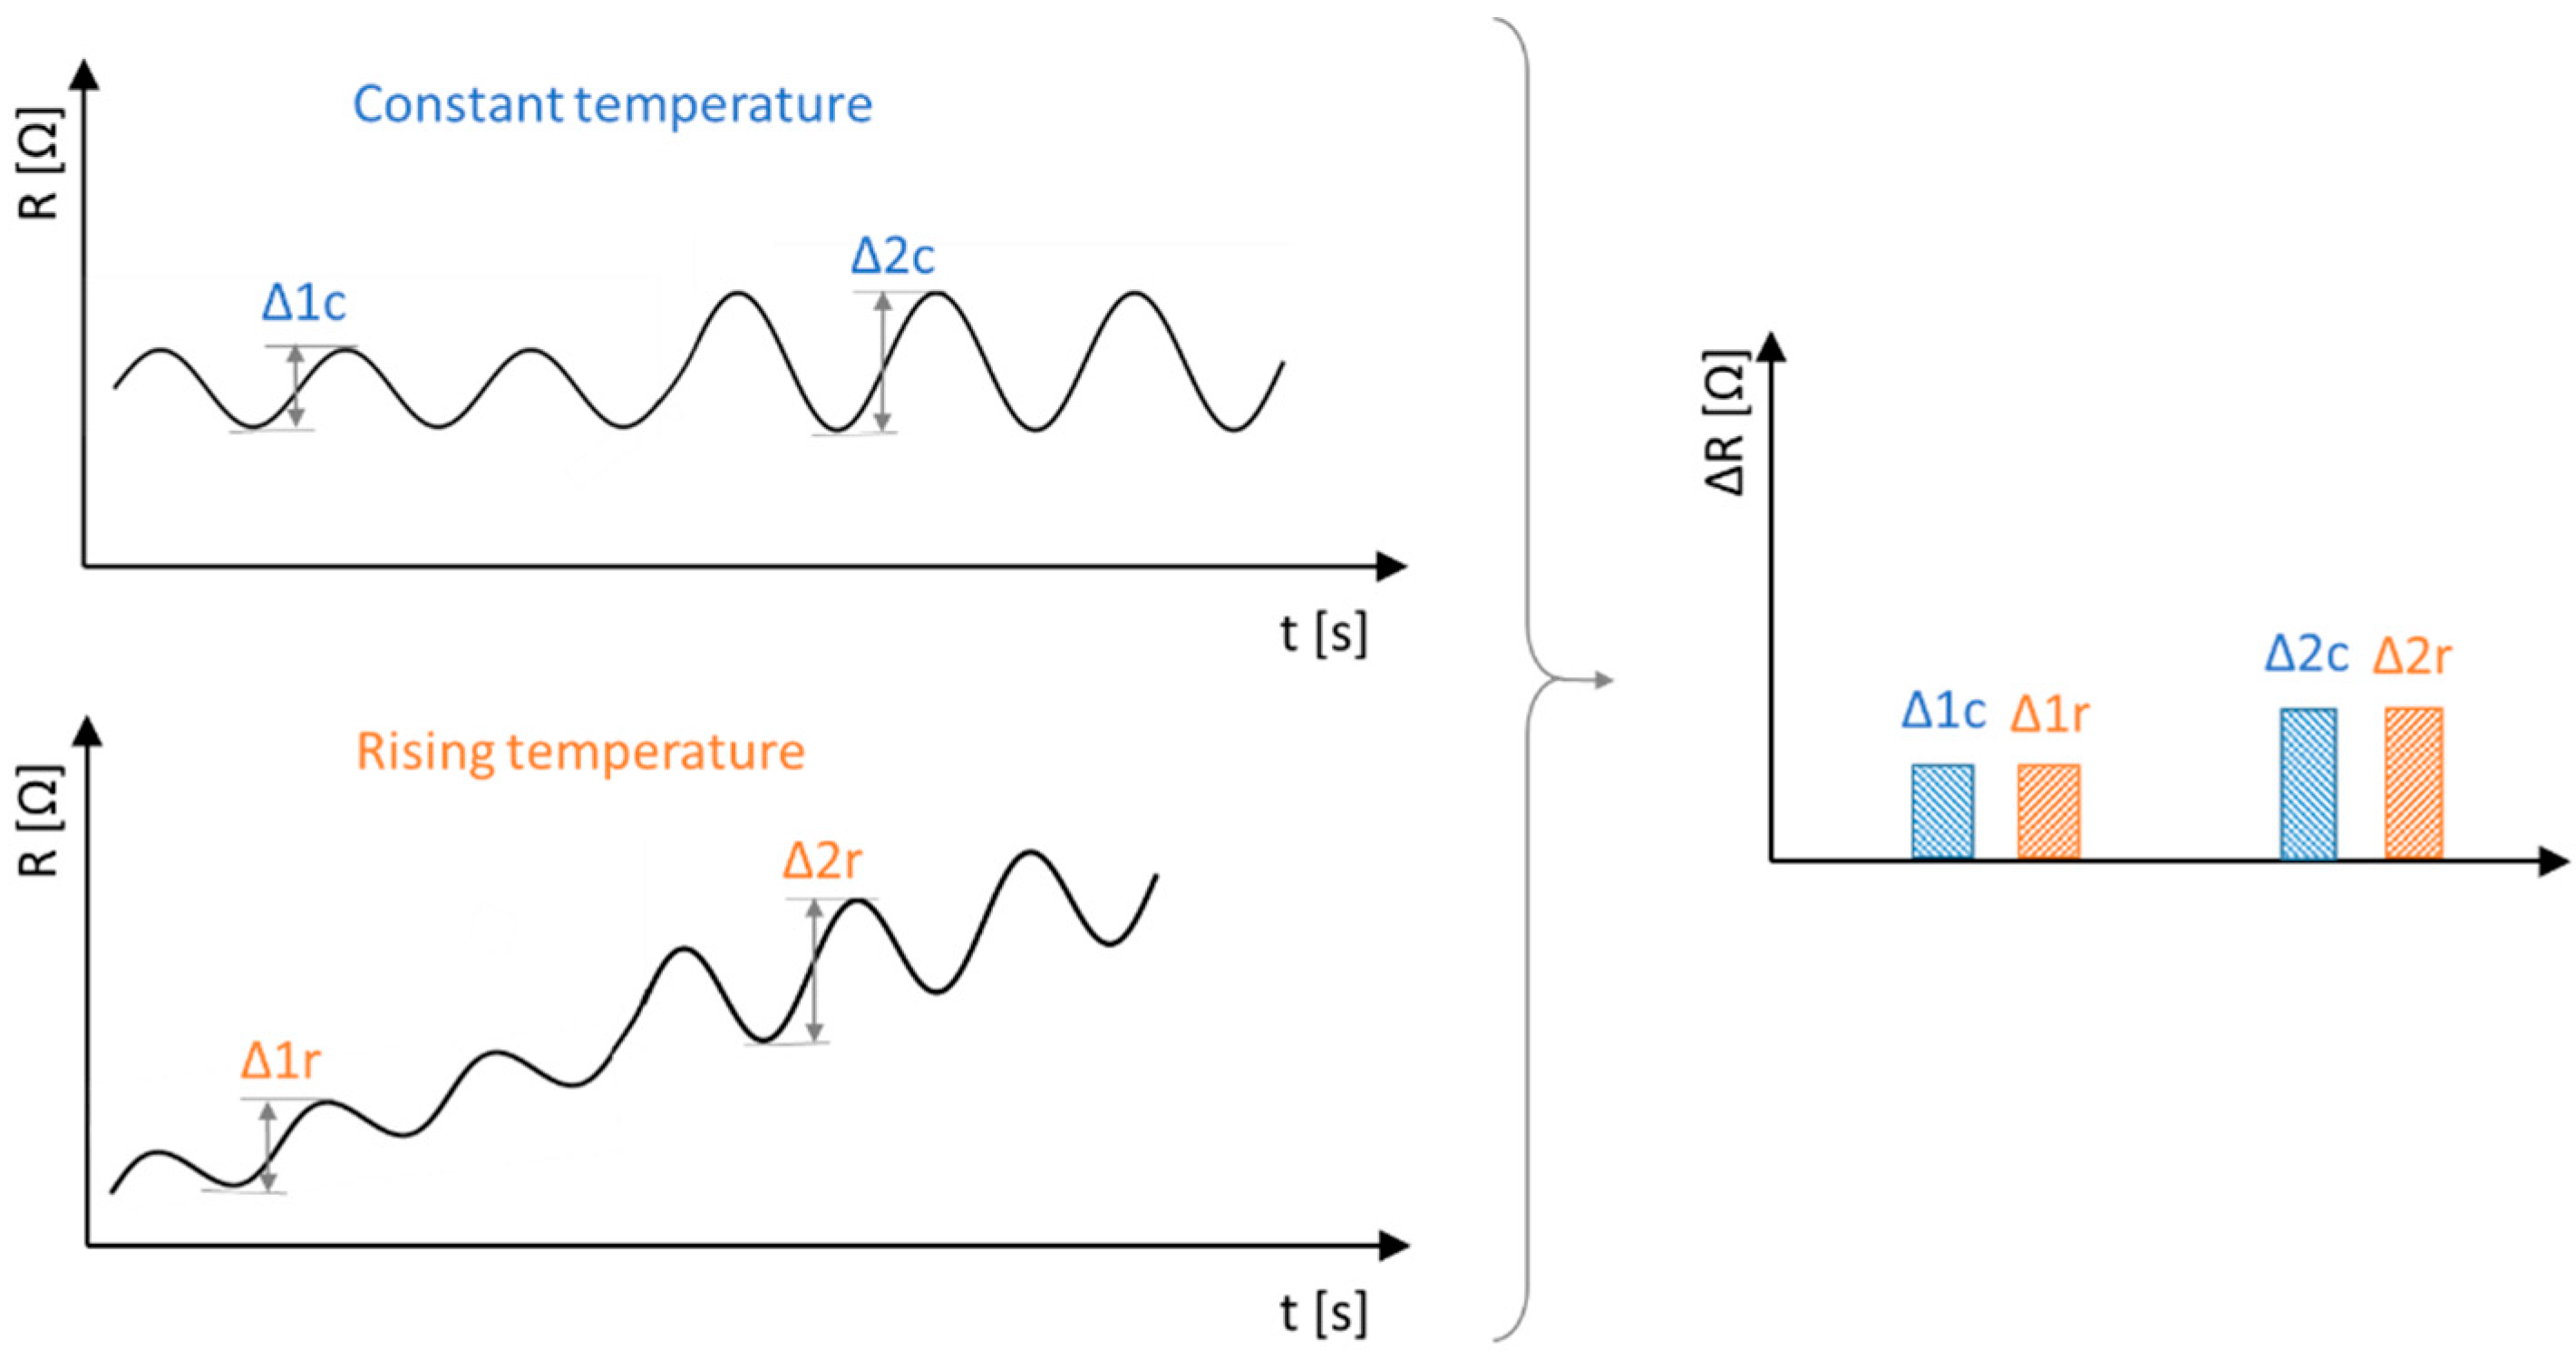
In practical applications, it is not always possible to make temperature measurements simultaneously at the position where impact detection is needed. It is possible to use temperature compensation of the half-bridge circuit as used, for instance for strain-gauges [28]. Another option is to evaluate the peak-to-peak values of the cyclic loading [29] (see Figure 6). The schematic representation shows the evaluation procedure applied for the two signals. In the upper part of the figure is depicted an example of a signal from CFS during measurement under constant temperature. The first three cycles show signal before impact loading and the next three cycles represent signal after impact loading under cyclic loading and constant temperature. In the lower part of the figure depicts a graph of the measured signal from CFS under rising temperature before and after impact loading. We assume, that the rising of the temperature is much slower than the change of mechanical strain applied during cyclic loading. This is often the case in practical applications. The graph on the right side show measured peak to peak values of electrical resistance for constant and rising temperature. When using this procedure, temperature measurements are not needed.
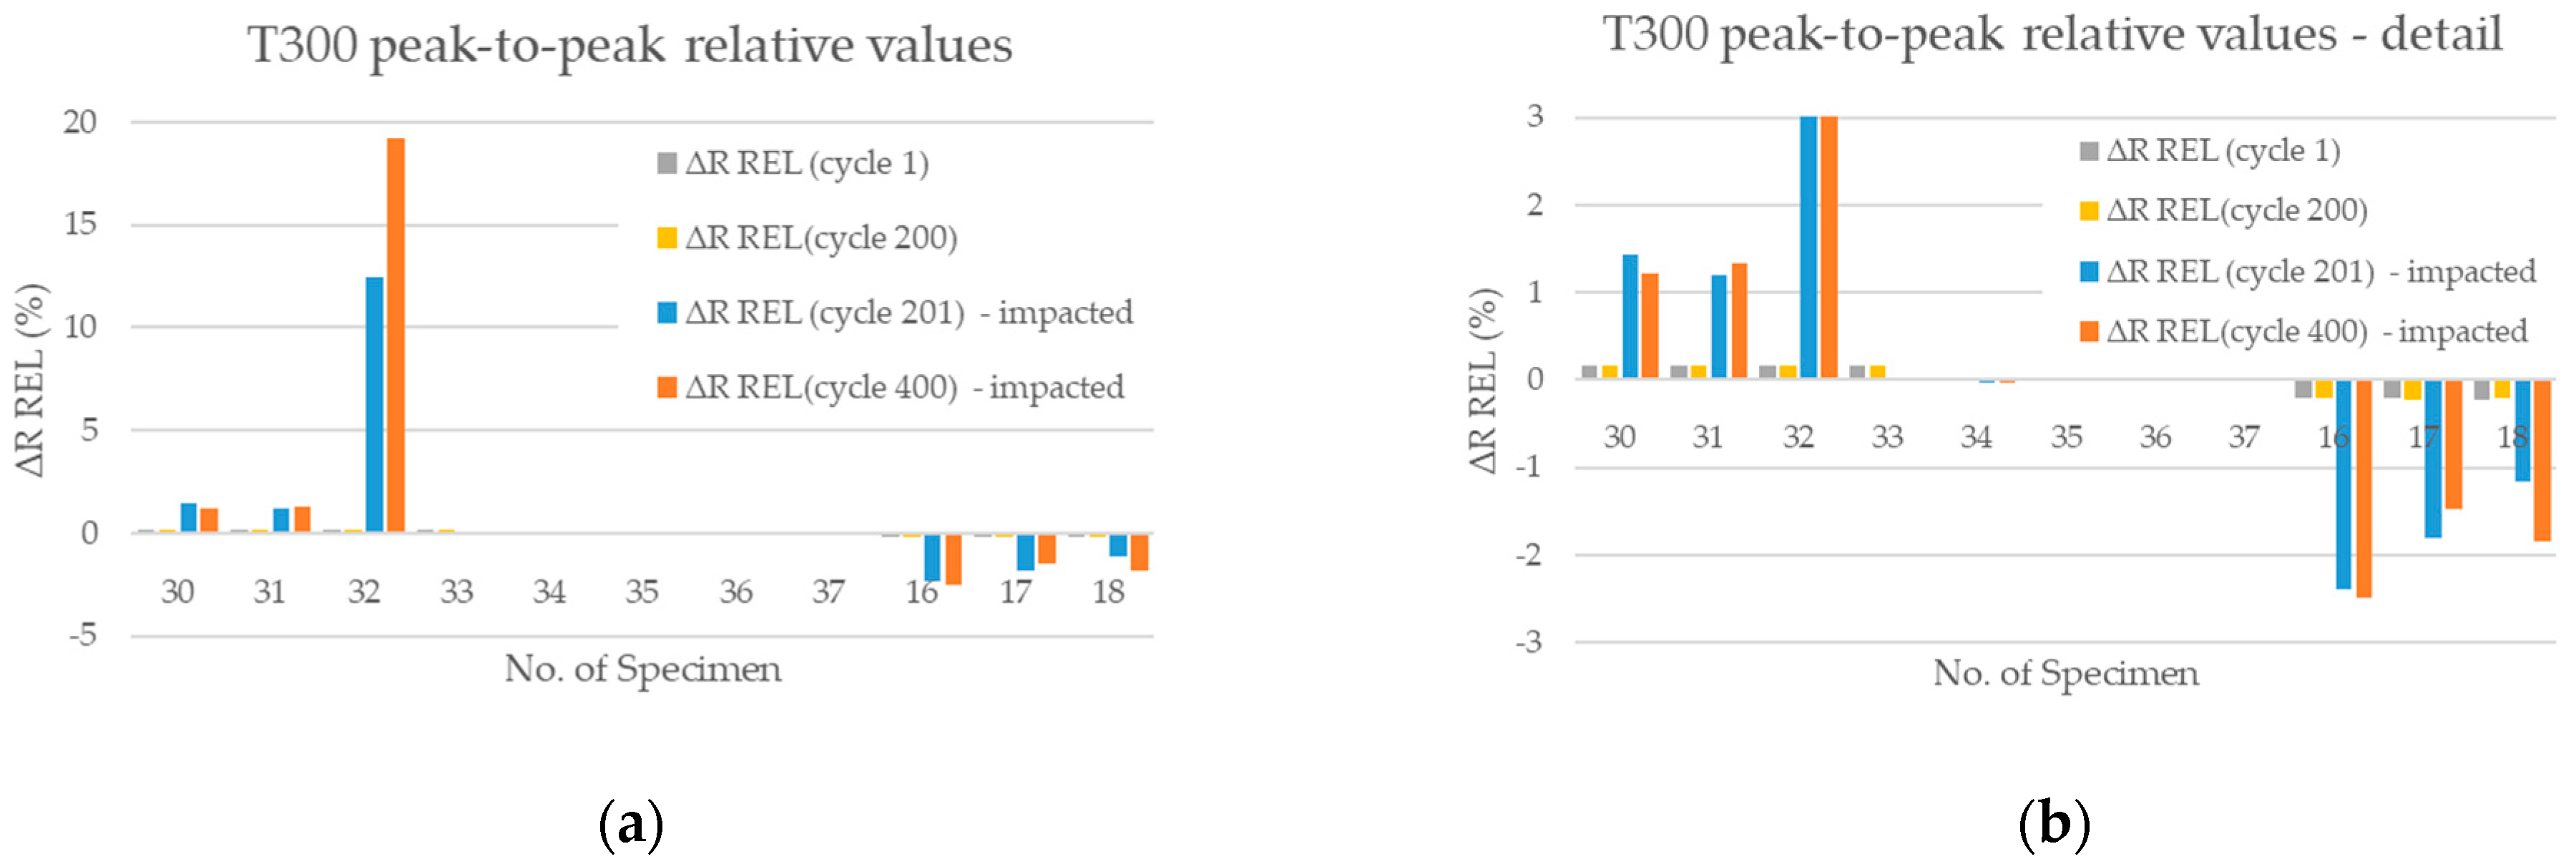
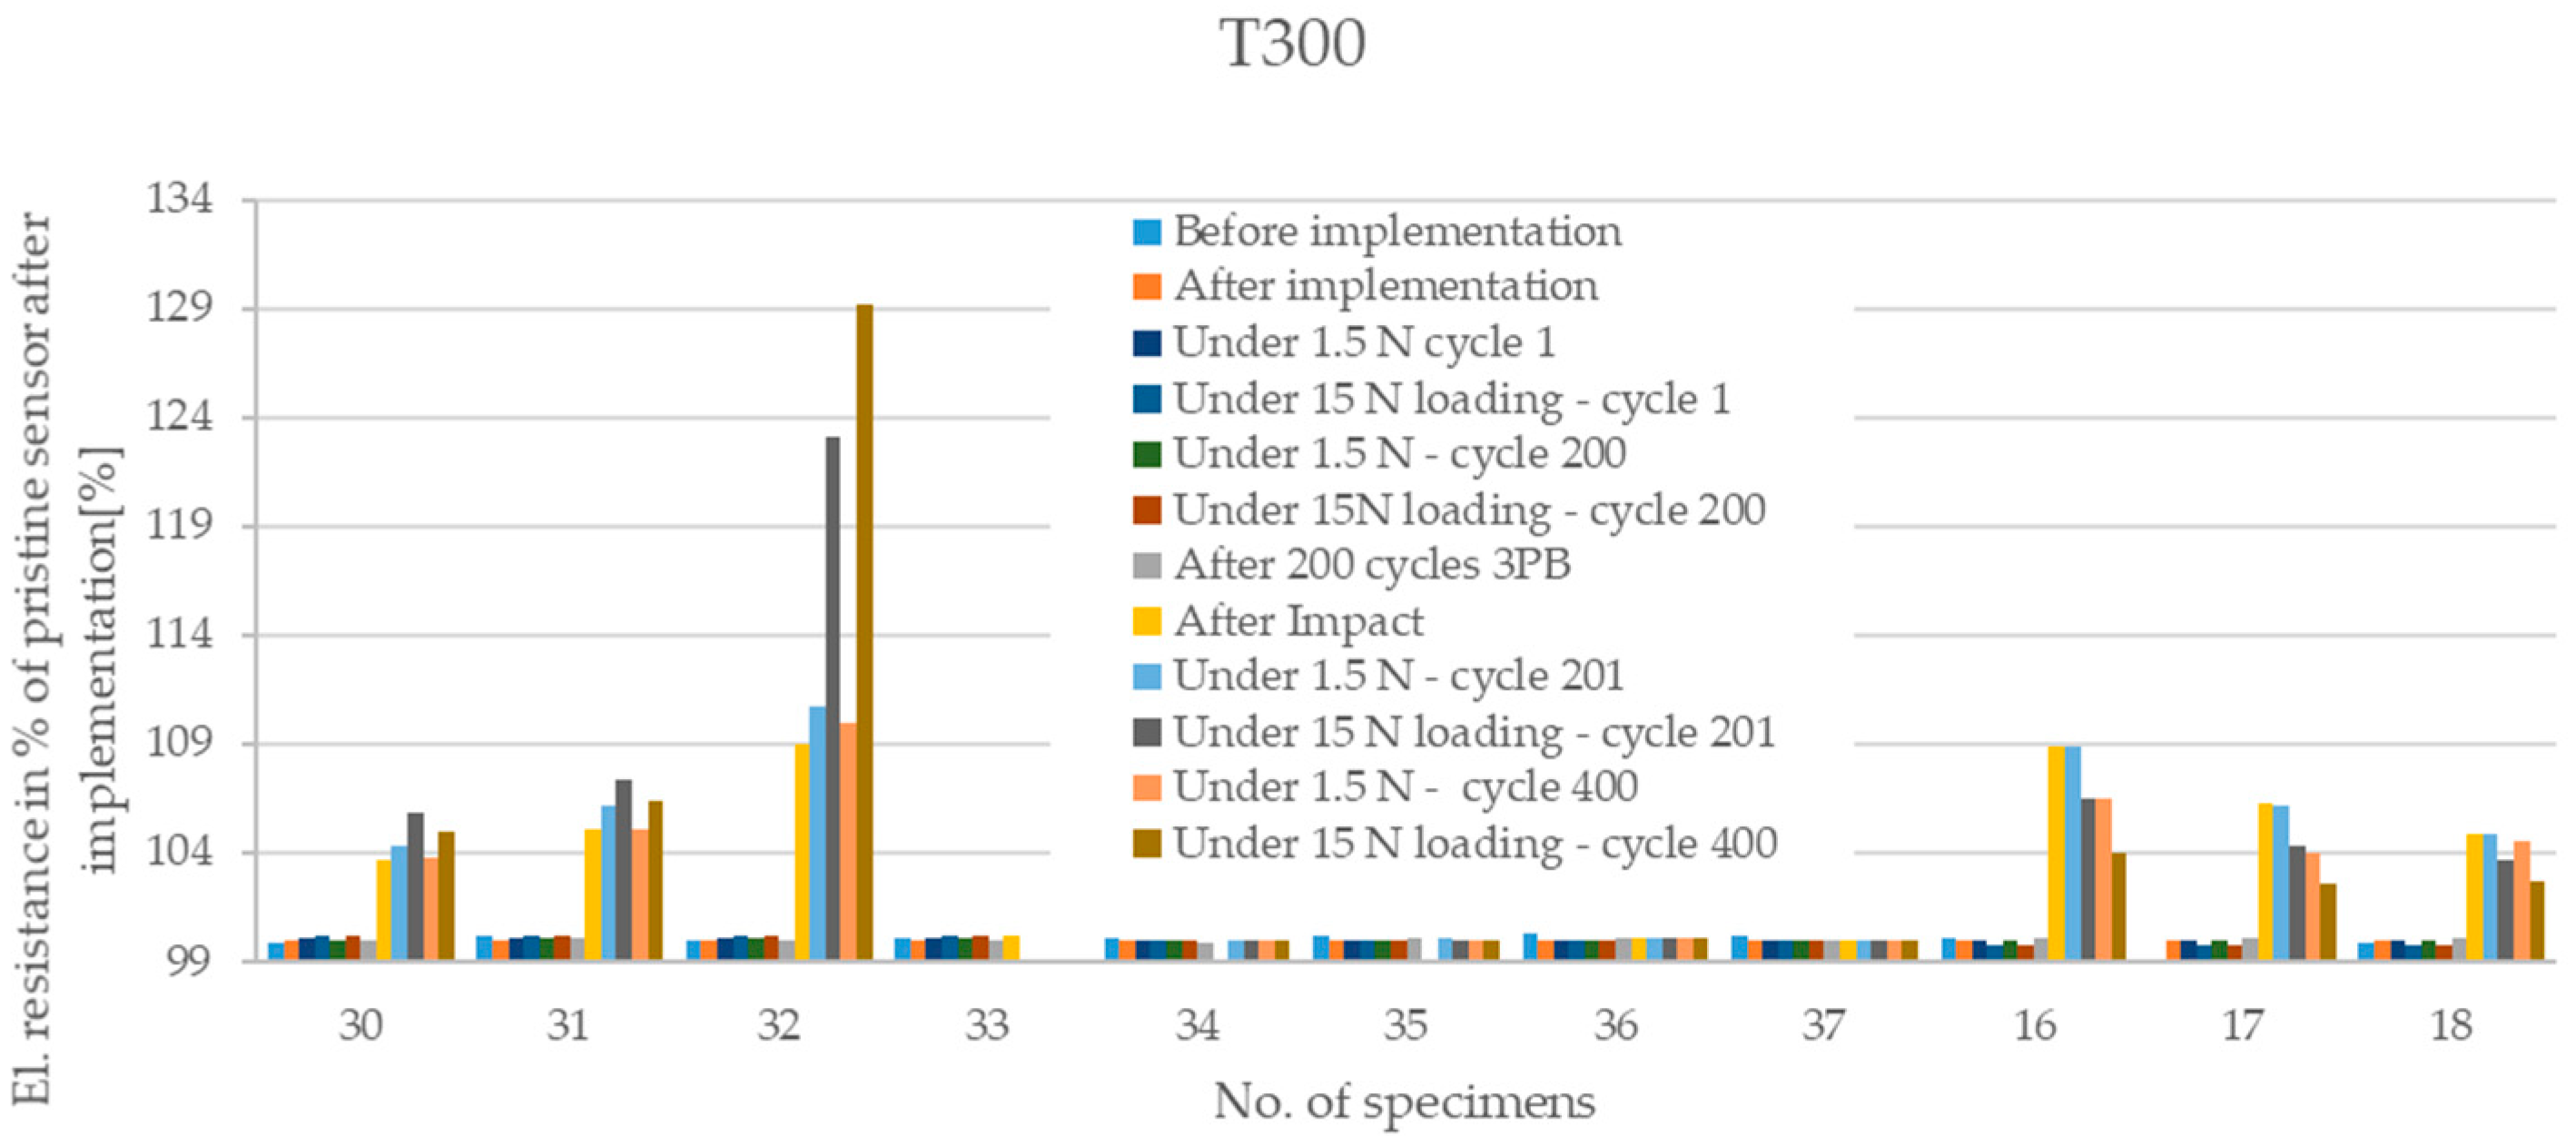
Figure 7 presents the peak-to-peak relative values of the measured electrical resistance for all specimens that underwent mechanical and impact loading.
The relative values were determined to allow an easier comparison of sensors made of different carbon fiber tows. The peak-to-peak relative values were determined for the first and last cycle before impact loading (cycle 1 and cycle 200) and for the first and last cycle after impact loading (cycle 201 and cycle 400). The peak-to-peak values were related to the measured value of the electrical resistance of the sensor after implementation. For the Xth cycle of the loading the equation is as follows:
R R E L ( C Y C L E   X ) = R 15 N ( C Y C L E   X ) R 1 , 5 N ( C Y C L E   X ) R a f t e r   i m p l e m e n t a t i o n .
According to the measured data, it is evident, that all types of carbon fiber tows investigated here show piezoresistive behavior. A positive change in measured electrical resistance was observed for specimens, in which the sensor was integrated on the tension side of the specimen (between layers 1 and 2), see Figure 7 and Figure 8.
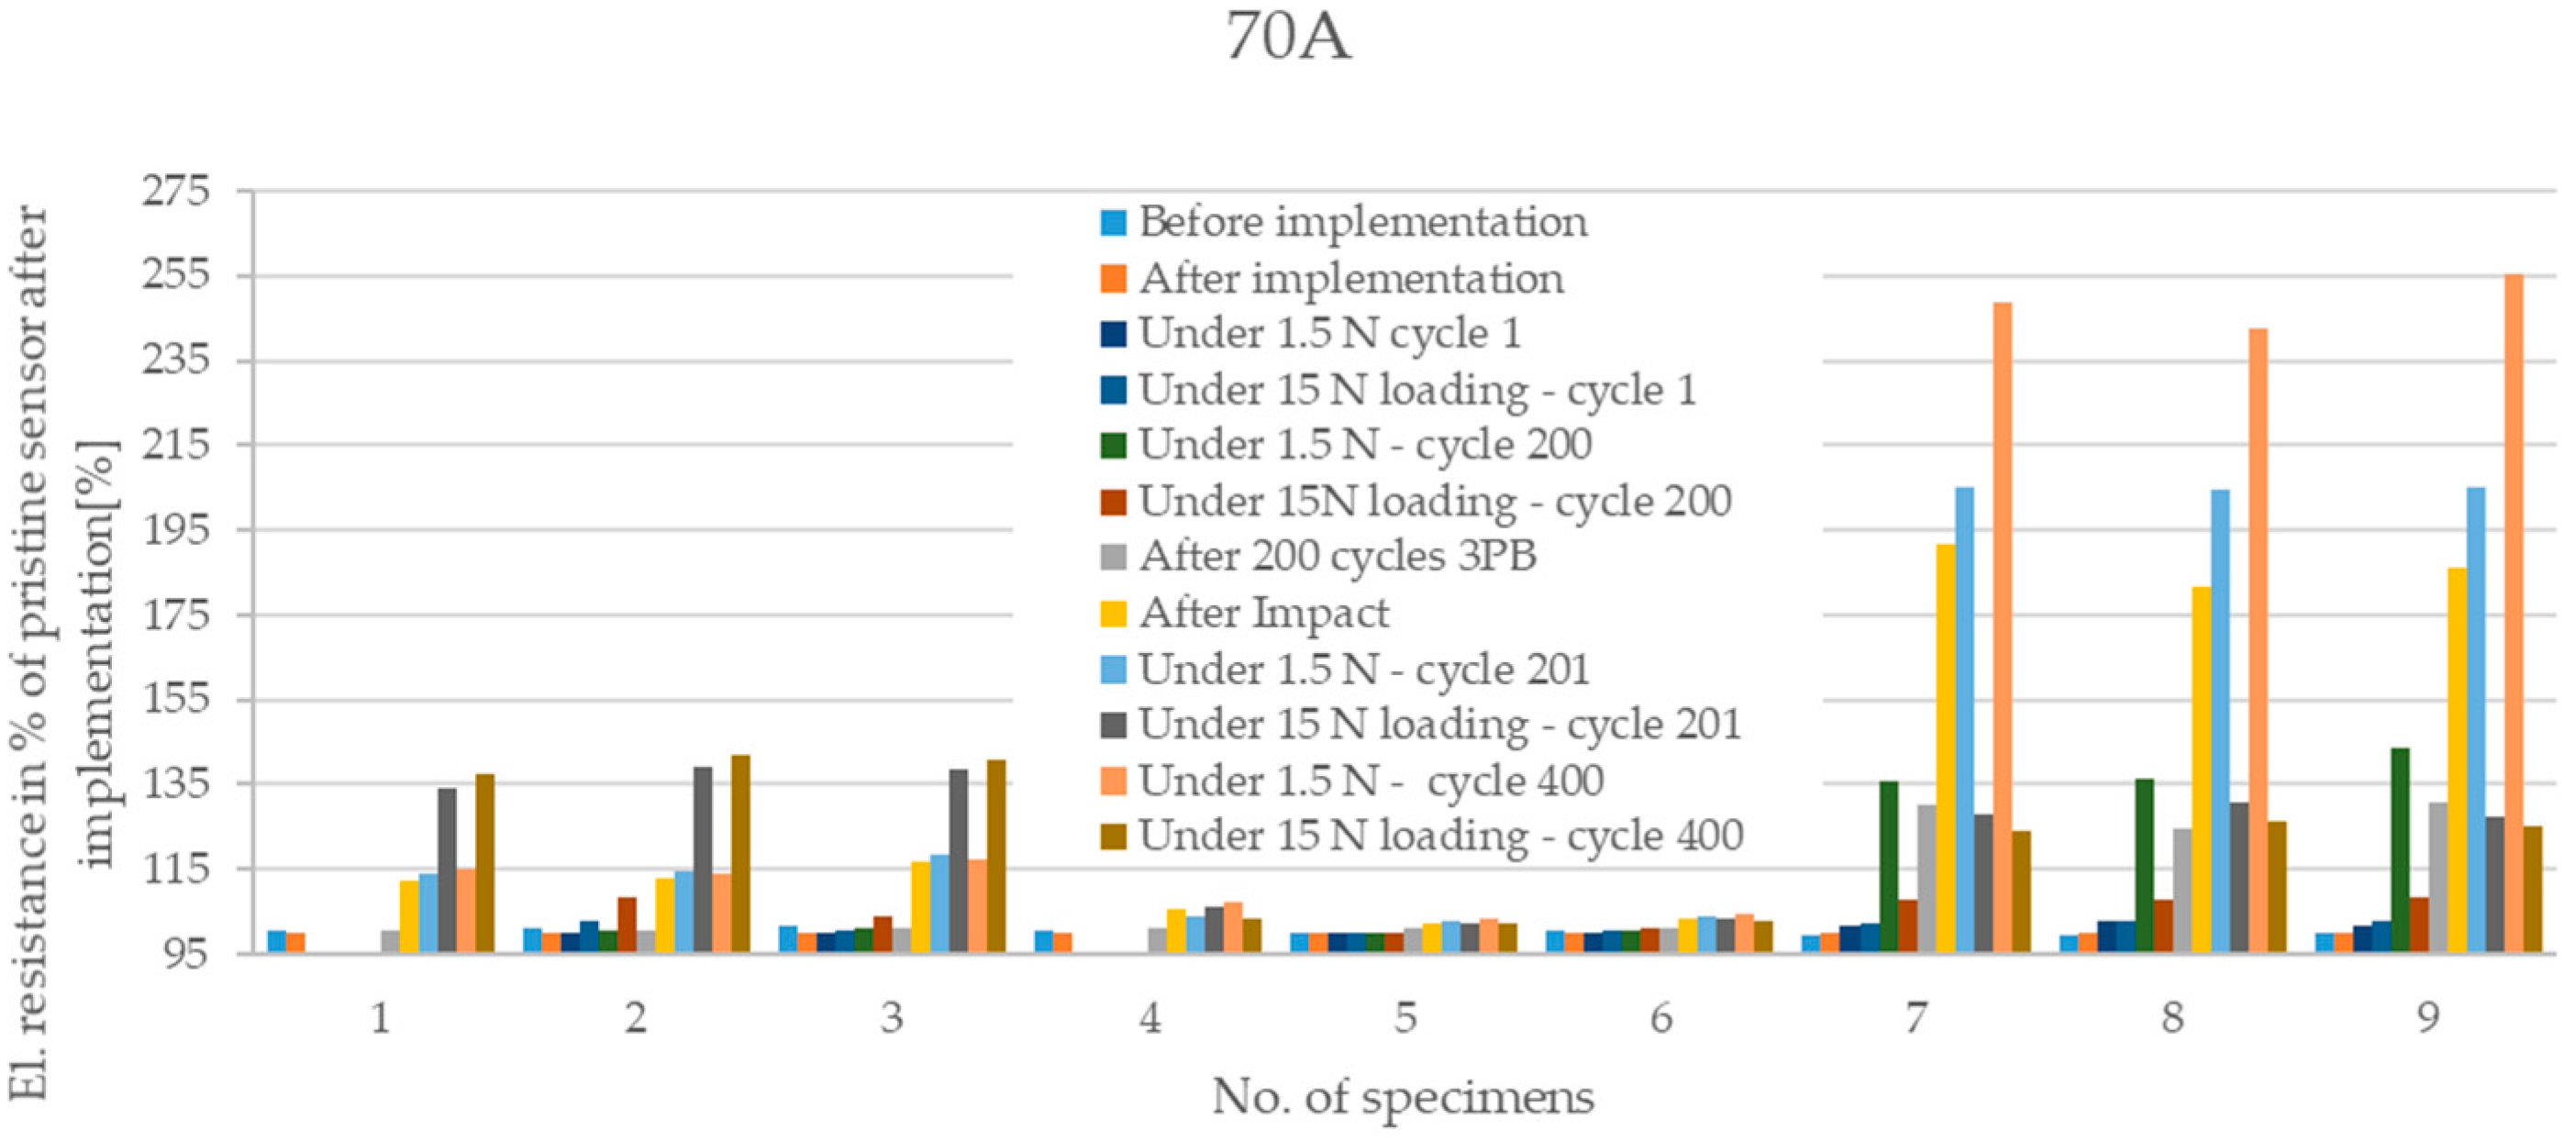
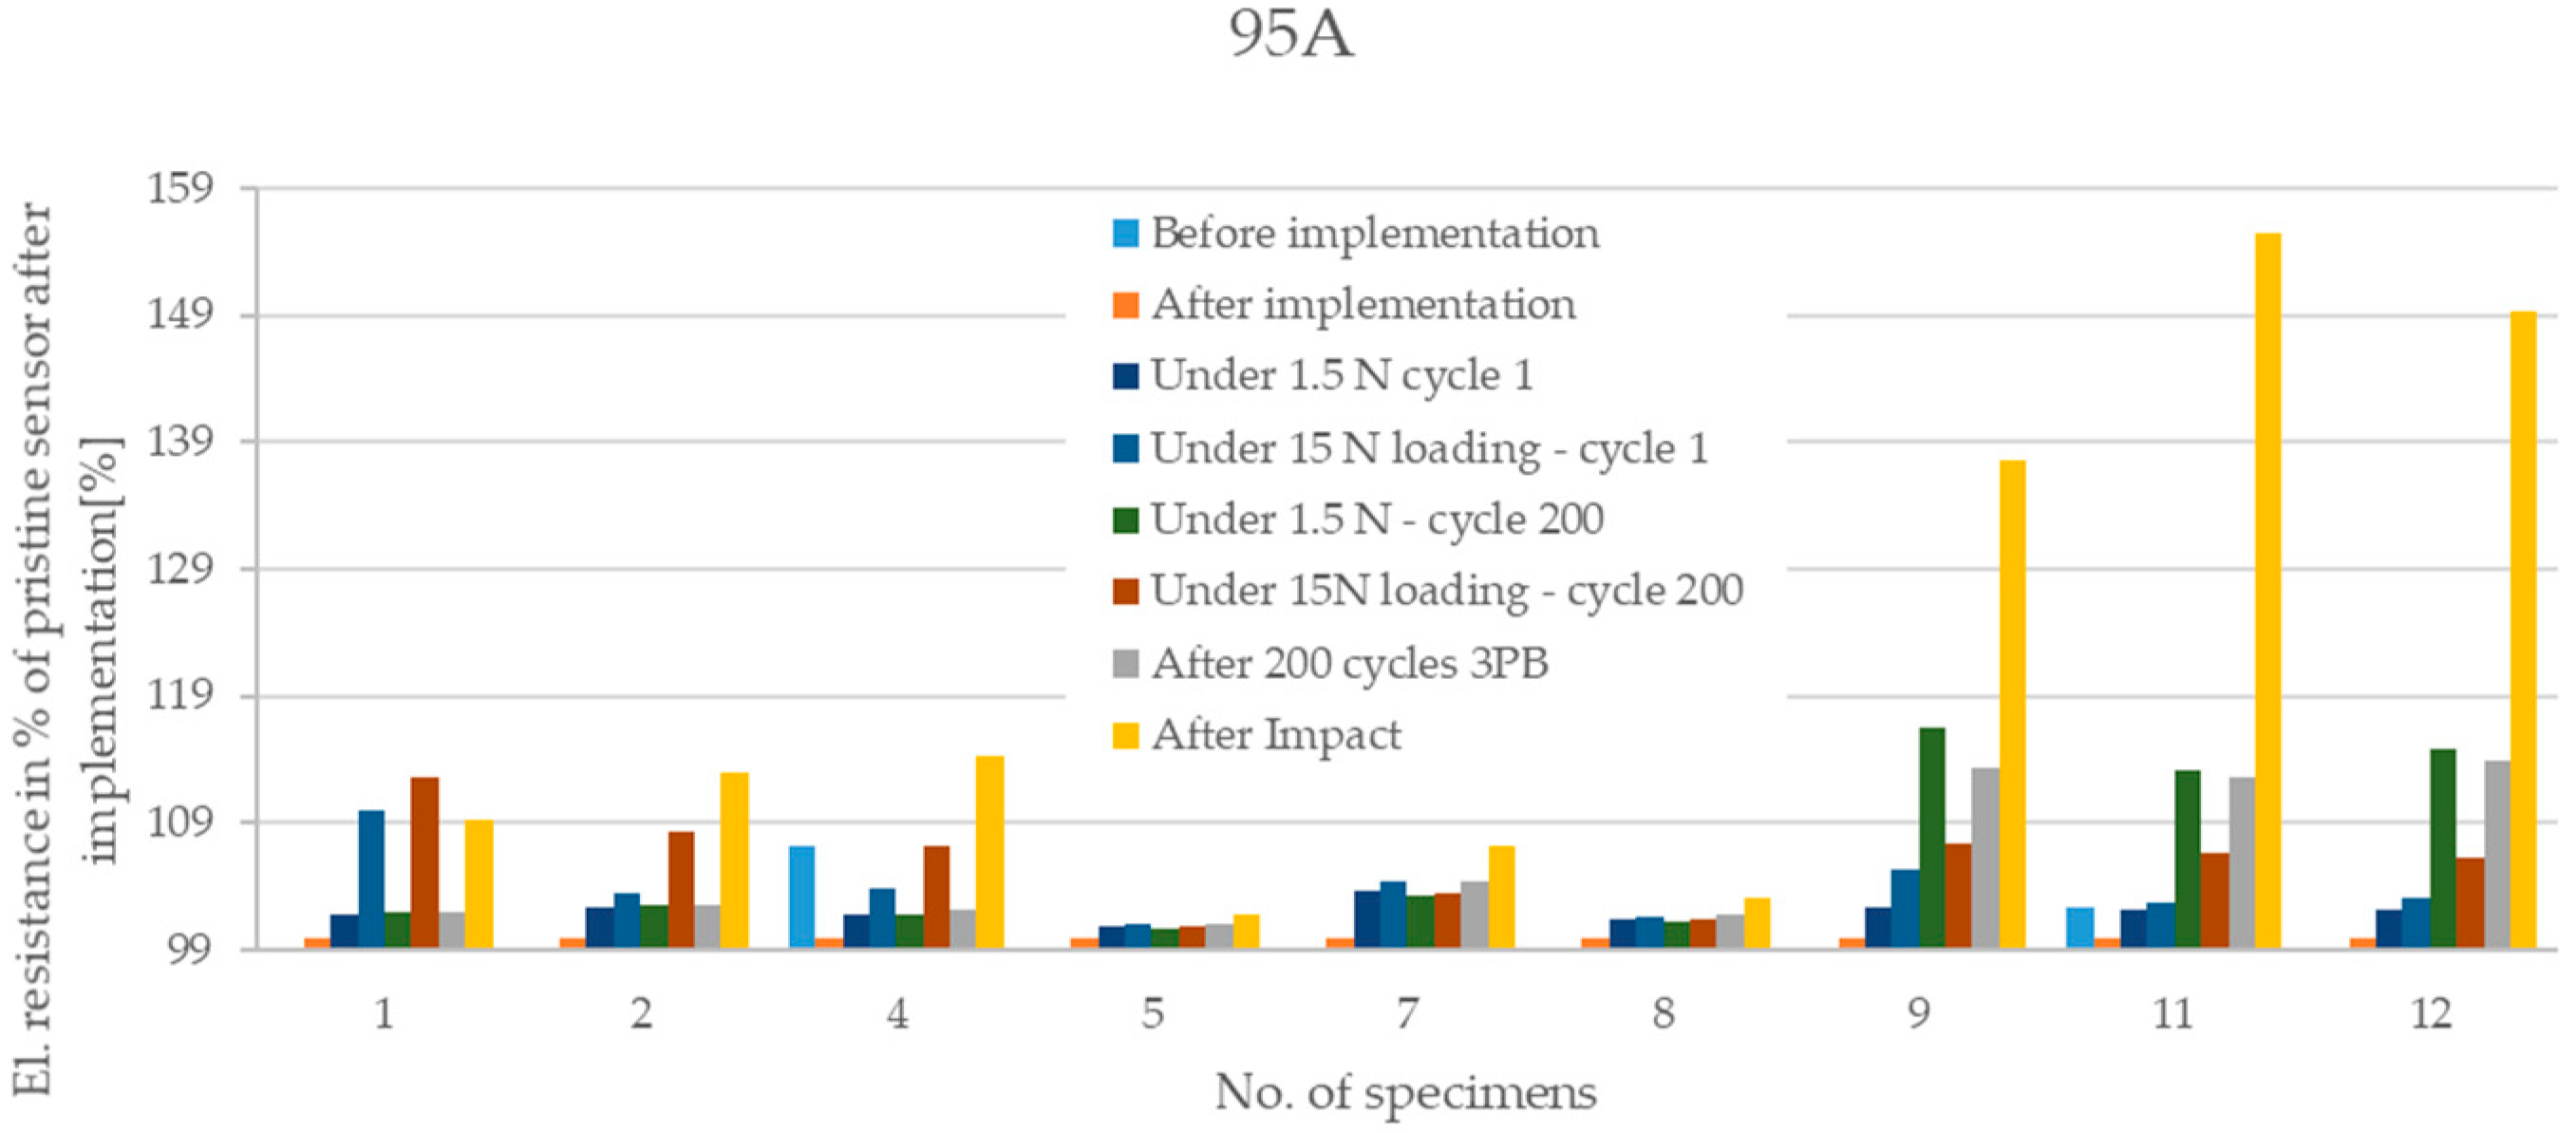
The dependency between the number of cycles and the measured resistance for the sensors can be neglected in the case of material T300 before impact. Impacted sensors made of material T300 also show quite limited dependency between the number of cycles and the measured resistance. All specimens show a change lower than 0.7% in the peak-to-peak relative values between the first cycle and the 200th cycle, with the exception of specimen T300-32, which shows a change of 7%. The influence of the number of cycles on the measured signal is much more pronounced for the specimens with integrated sensors made of pitch carbon fiber tow 95 A and 70 A. Compressive loading has a bigger impact on the change in the measured signal for both of these materials.
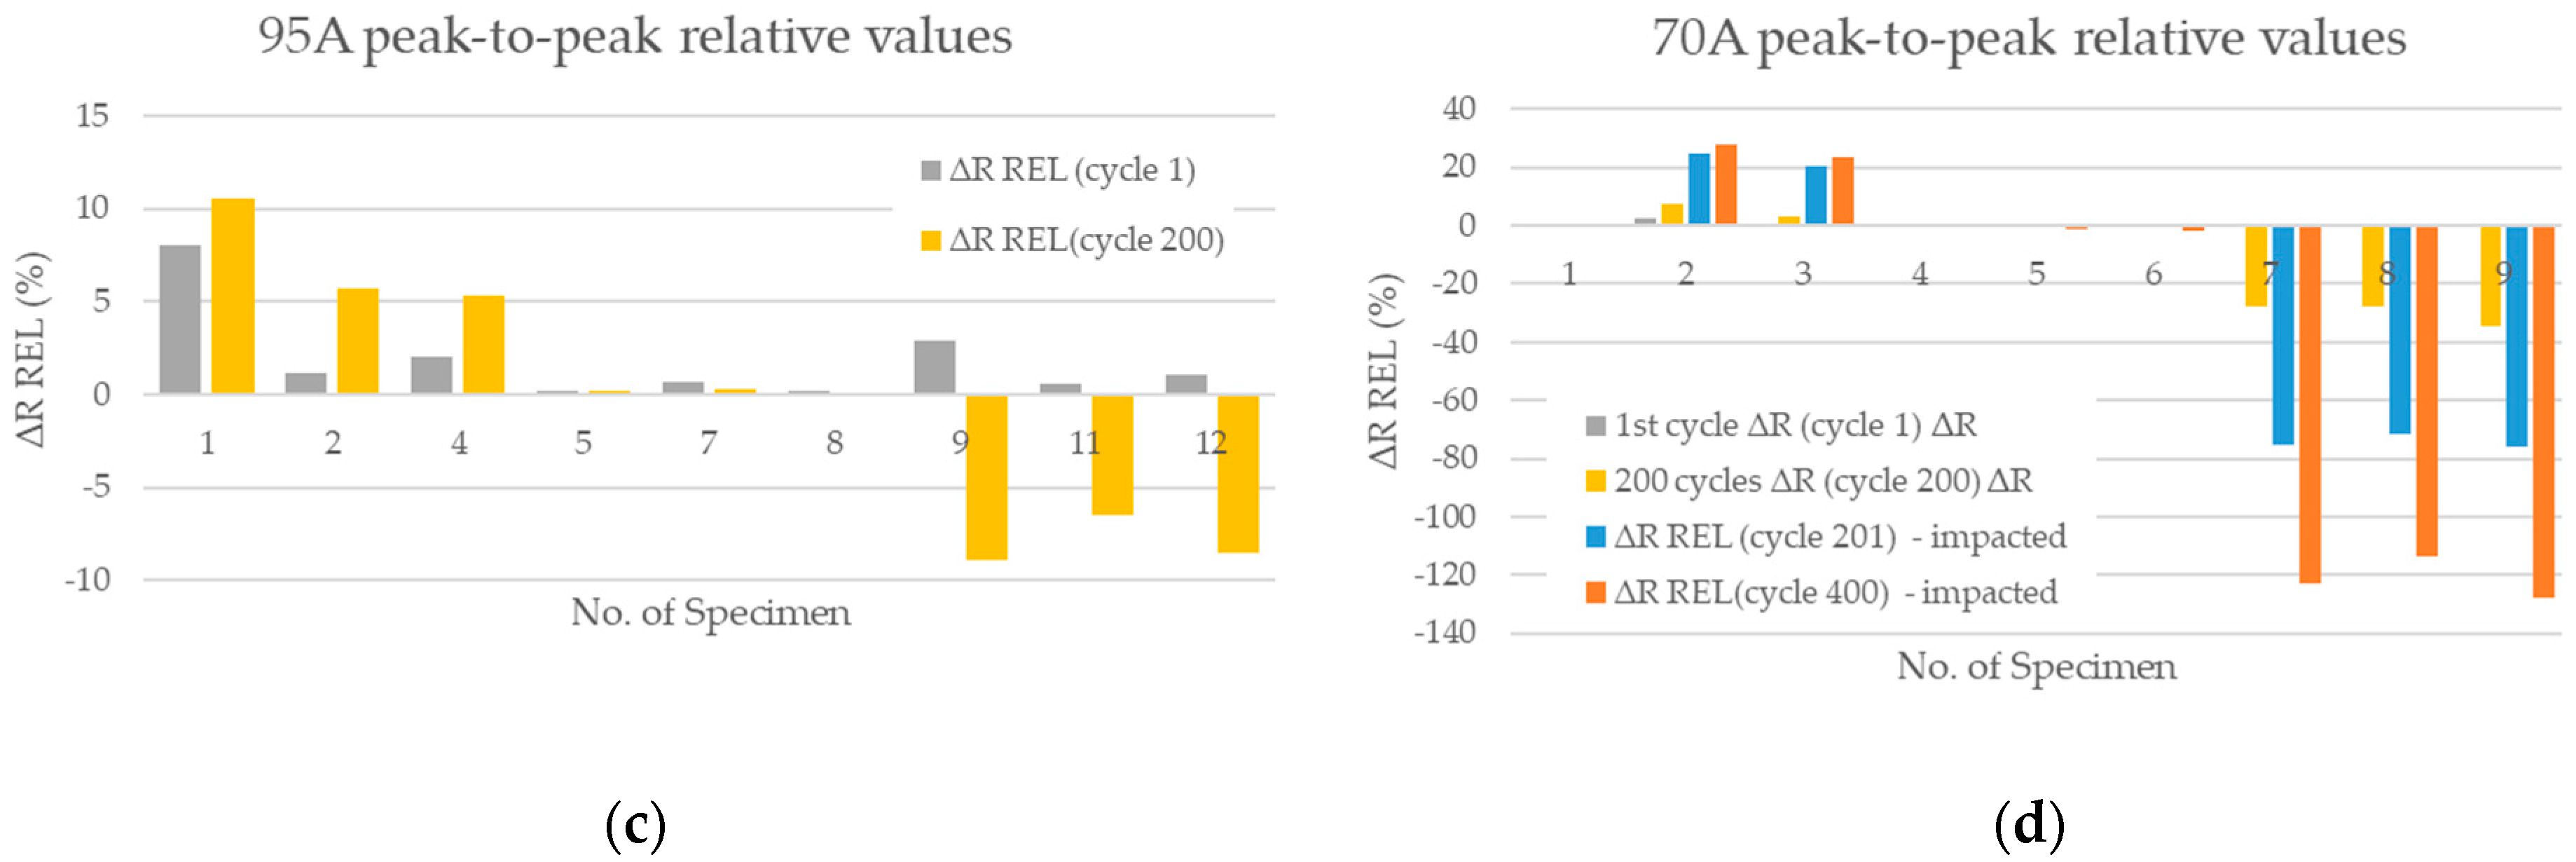
For material 70A, we also have data for cyclic loading after impact loading. Figure 7 shows that the bigger the change is in the measured electrical resistance after impact, the greater is the influence of the number of cycles after impact on the change in the measured electrical resistance. Peak-to-peak values for sensors made of the most brittle material 95 A are not given. The reason is that the specimens with sensors of this type were not subjected to a second campaign of cyclic loading, because damage in the contact area was detected for this type of CFS already after implementation, see Section 3.3.
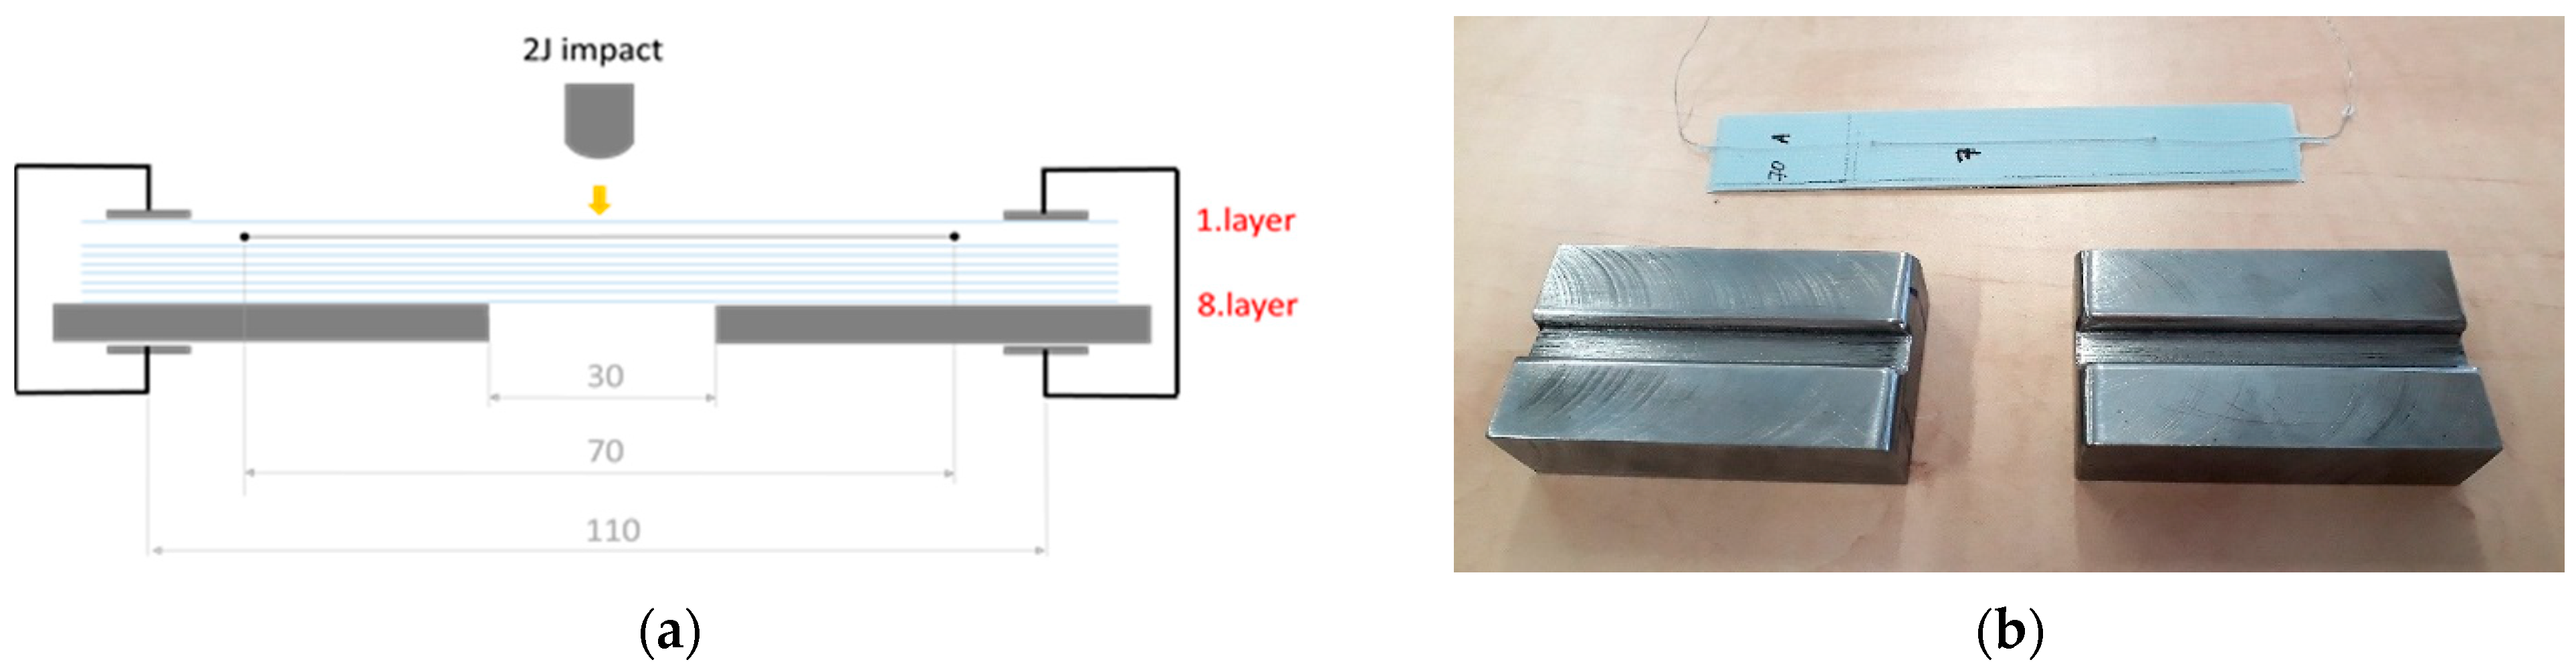
After 200 cycles of flexural 3PB loading, the specimens were subjected to impact loading according to the configuration depicted in Figure 3. According to our hypothesis and in accordance with a previous experimental investigation published in [27], sensors made of a material with lower ultimate elongation should be more sensitive to impact loading. The relative change in the measured electrical resistance of the integrated sensor after impact should be greater for sensors made of a more brittle carbon fiber tow.
This hypothesis was not confirmed for all types of specimens. For the specimens with sensors on the impacted side, the biggest change in electrical resistance was measured for sensors made of material 95 A, which is the most brittle. For the specimens with sensors on the opposite side to the impact, the biggest change in electrical resistance was measured for material 70 A. This may have been caused by the fact that the sensors made of 95A had damaged electrical contacts already after implementation.
Based on the measured data, positioning the CFS sensor on the opposite side to the impact seems to be more appropriate (specimens T300-16, T300-17, T300-18; 70A-7, 70A-8, 70A-9; 95A-9, 95A-11, 95A-12), because the change in the measured electrical resistance was the biggest (see Figure 9, Figure 10 and Figure 11).
Peak-to-peak values after impact for sensors made of the most brittle material 95 A are not given, because the specimens with sensors of this type were not subjected to the second campaign of cyclic loading.

3.3. Active Thermographic Inspection and Computer Tomography

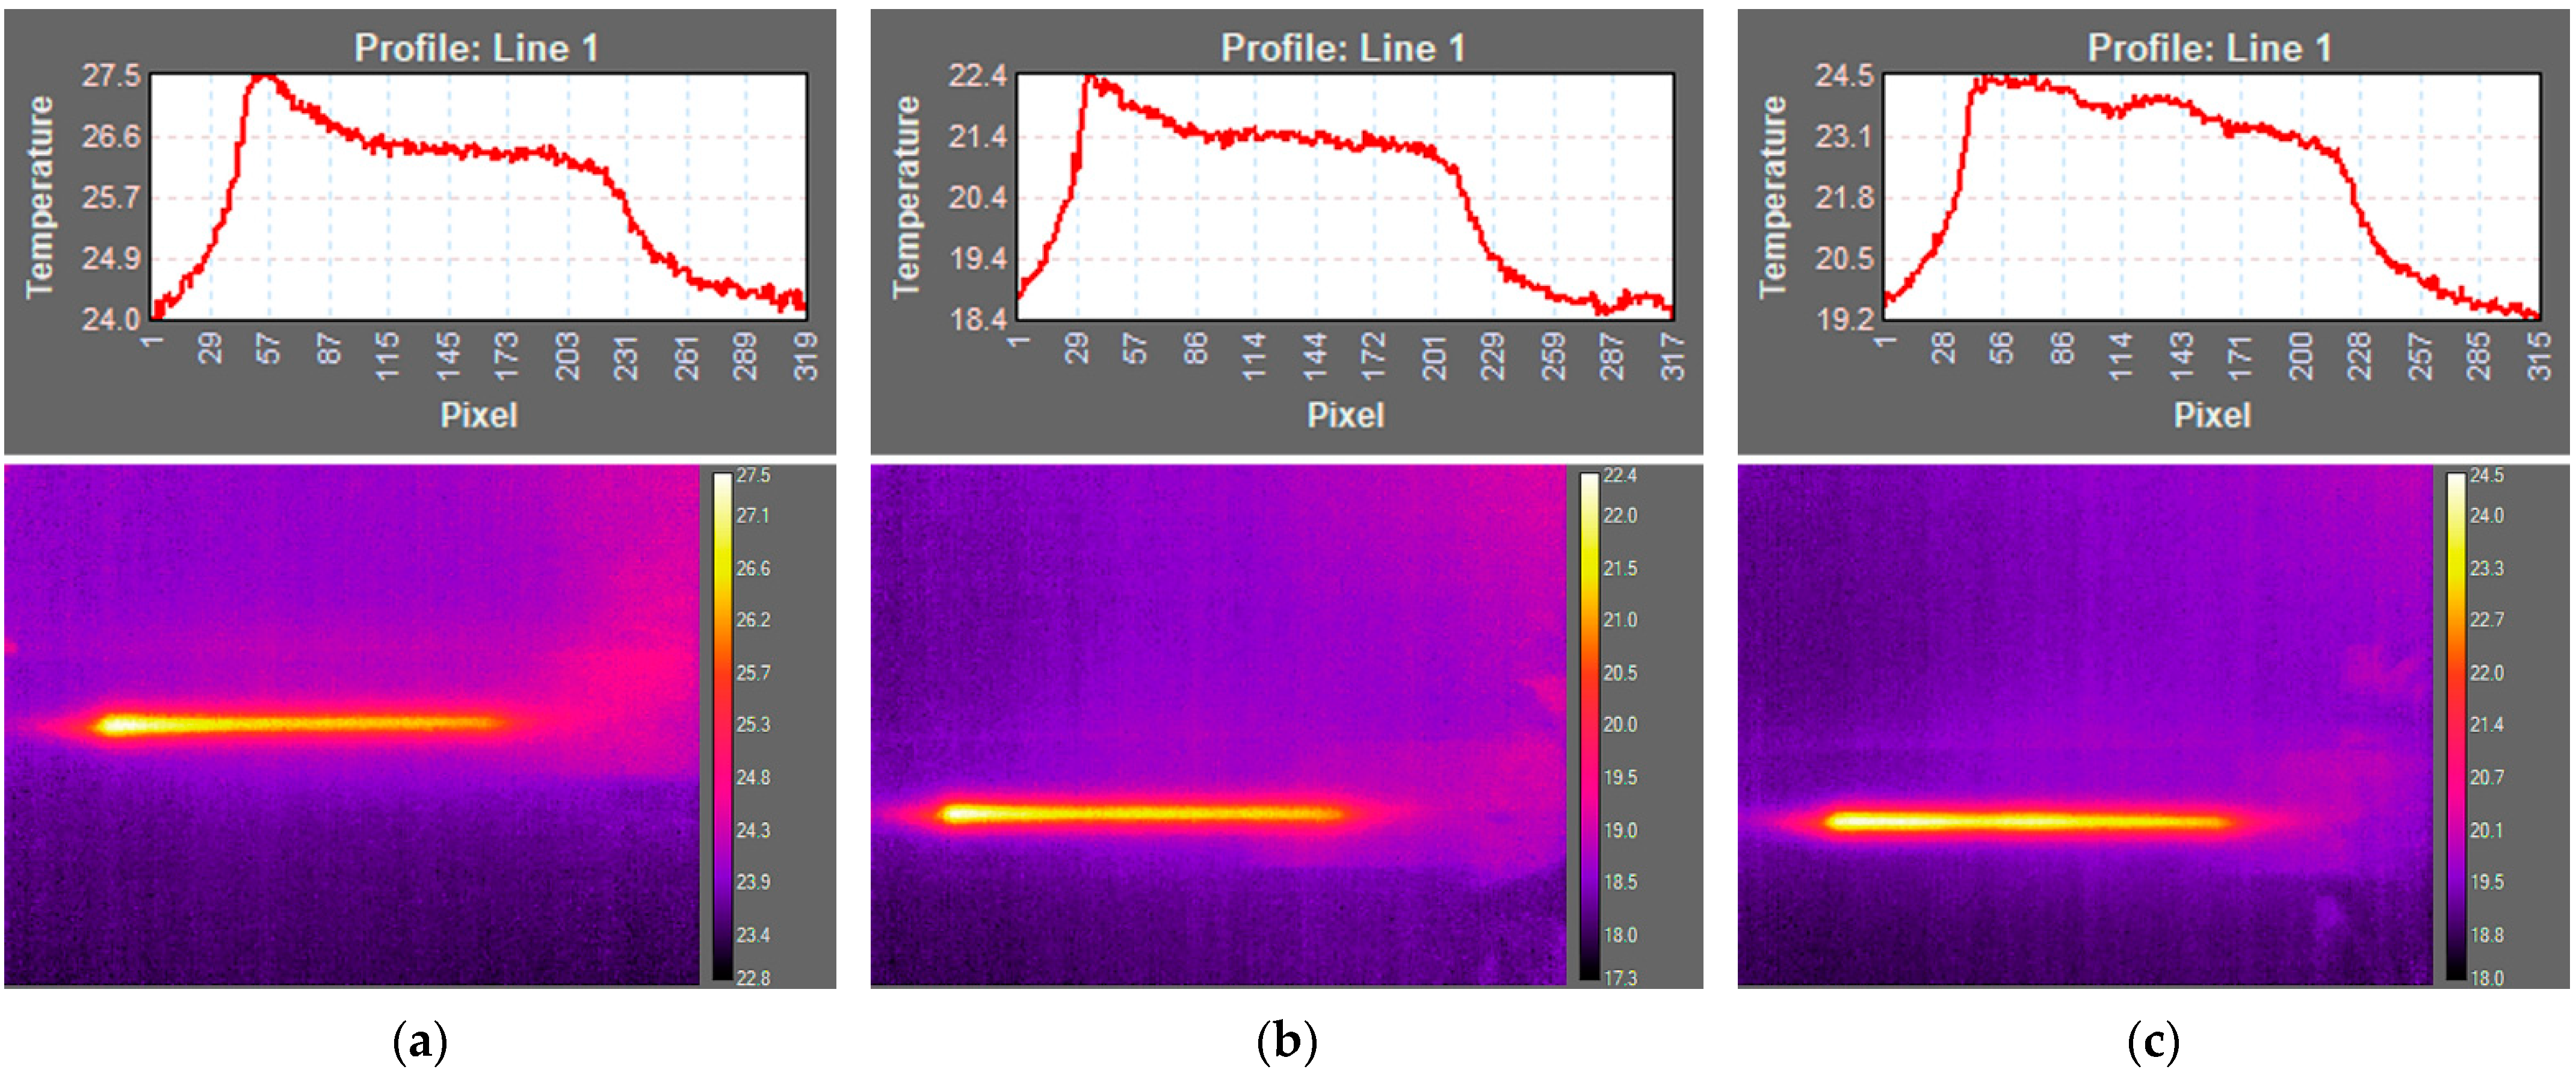
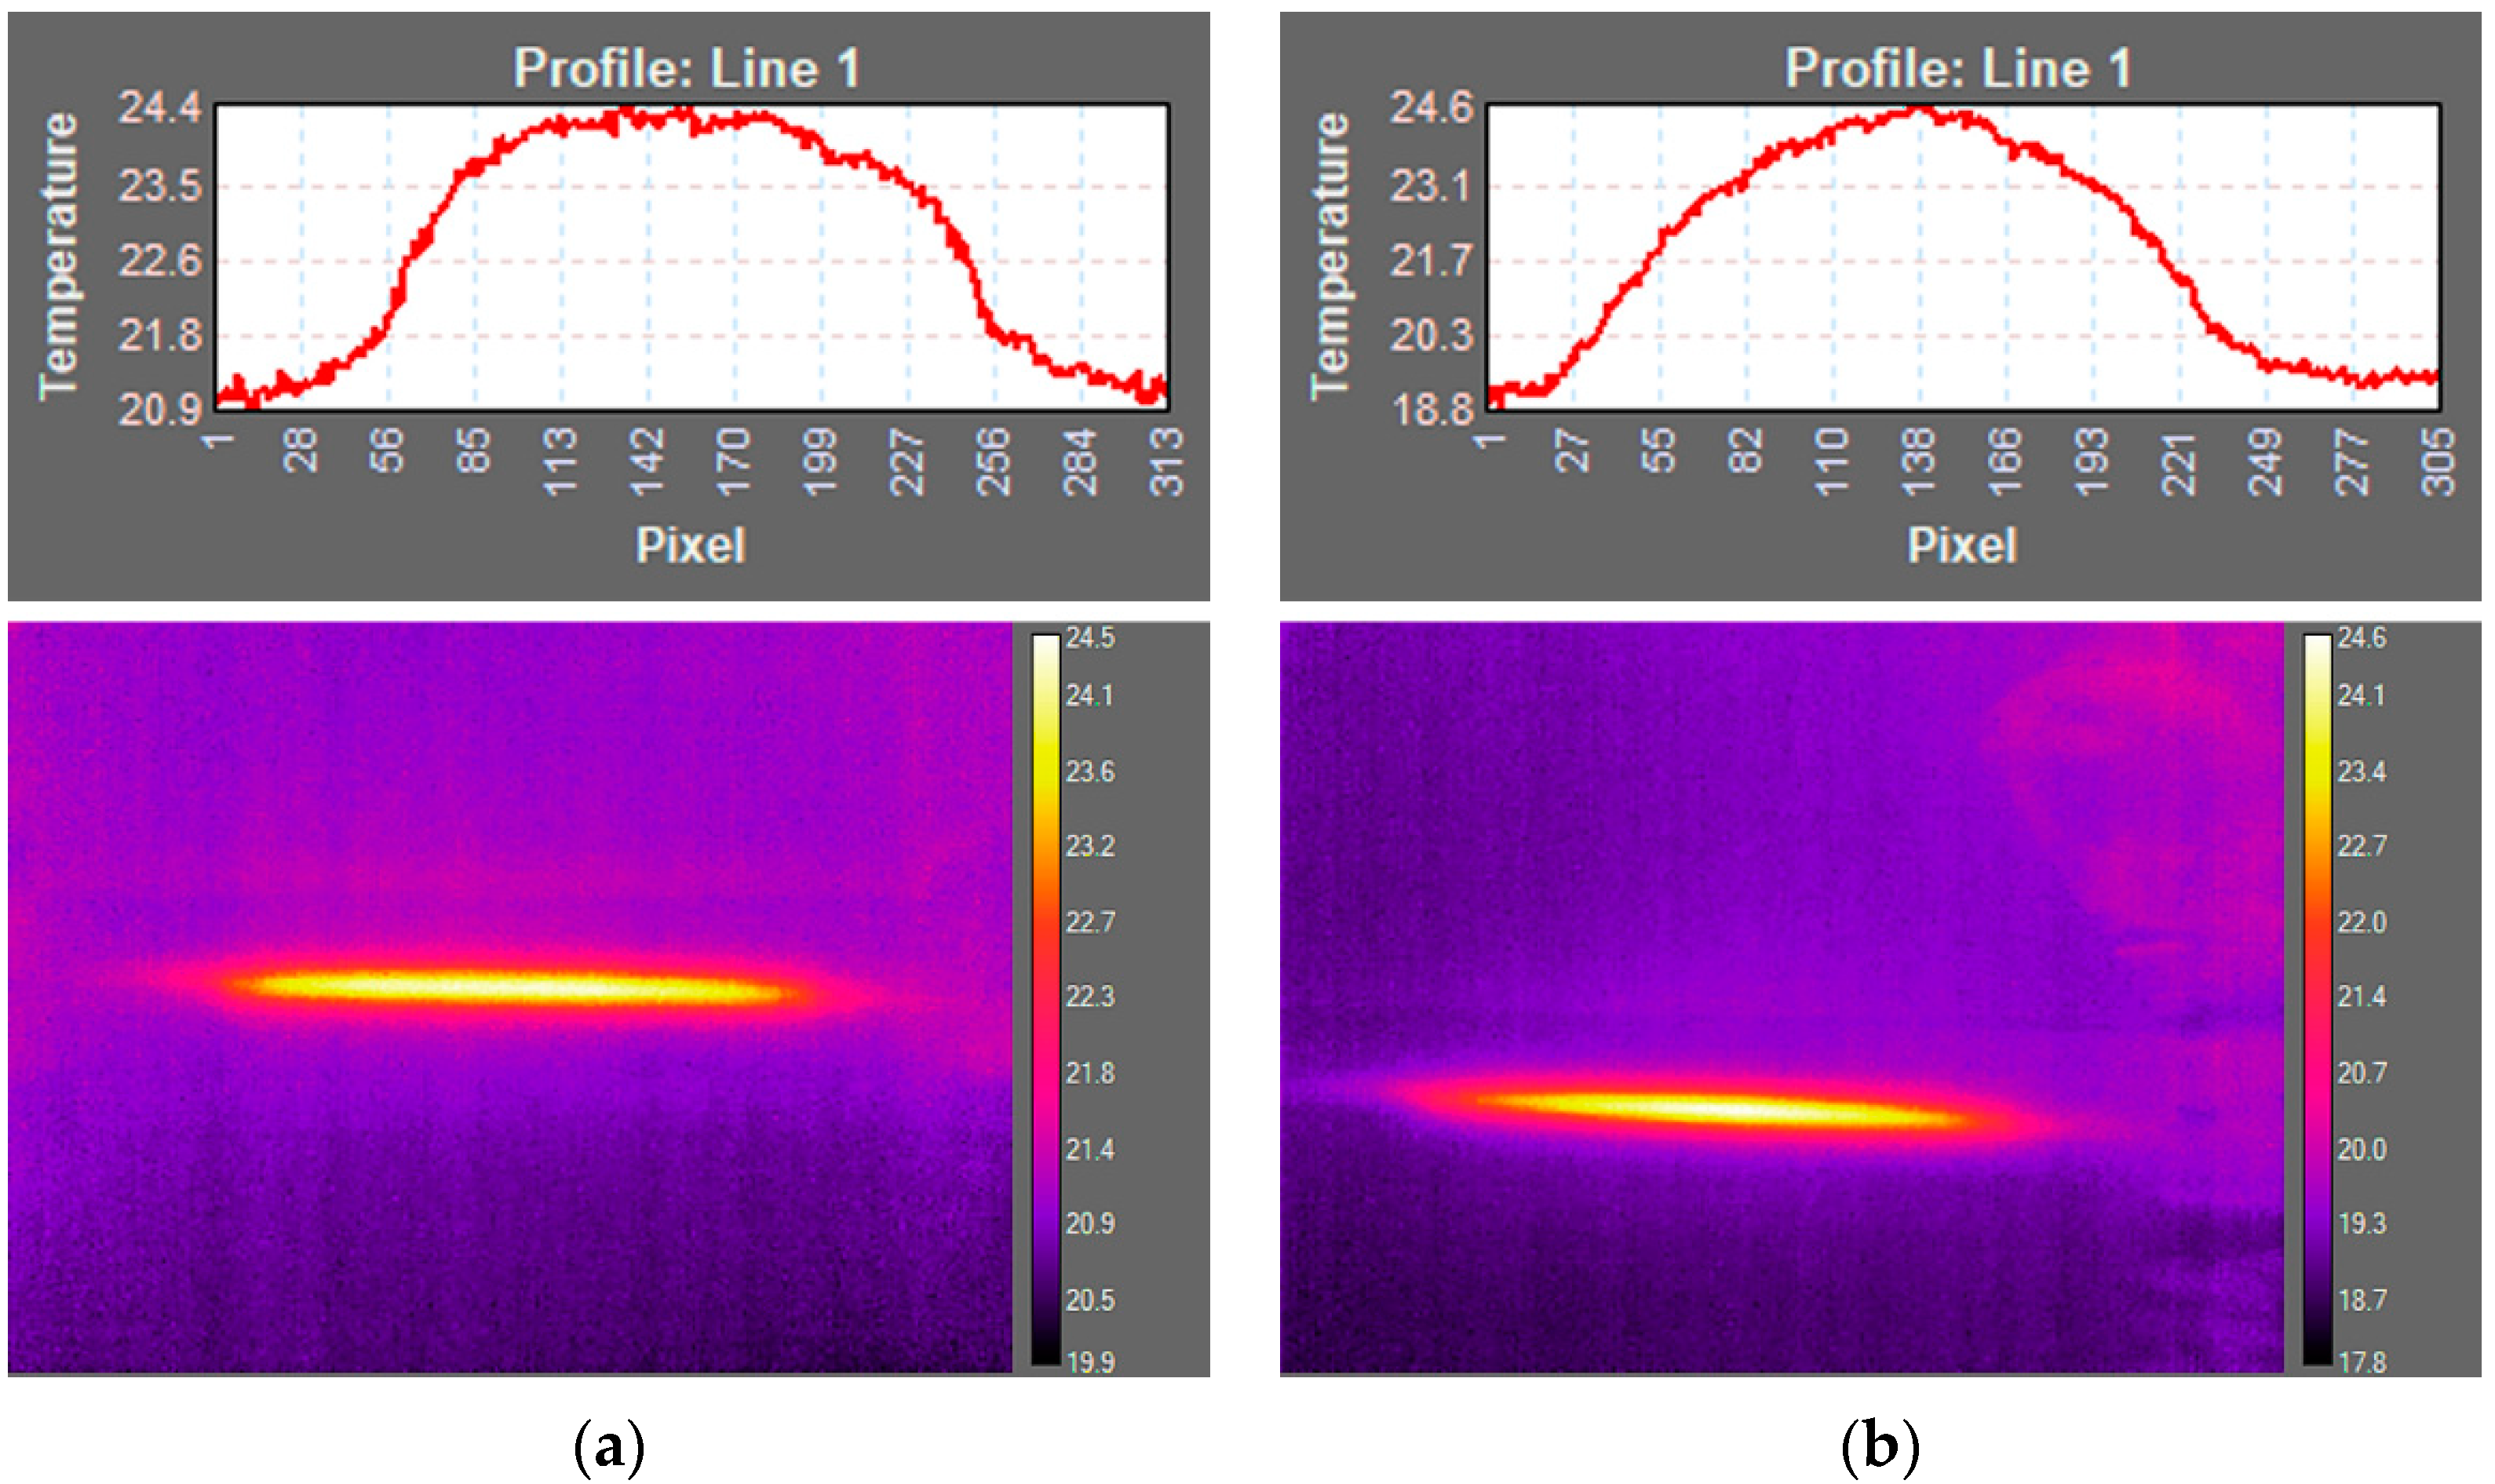
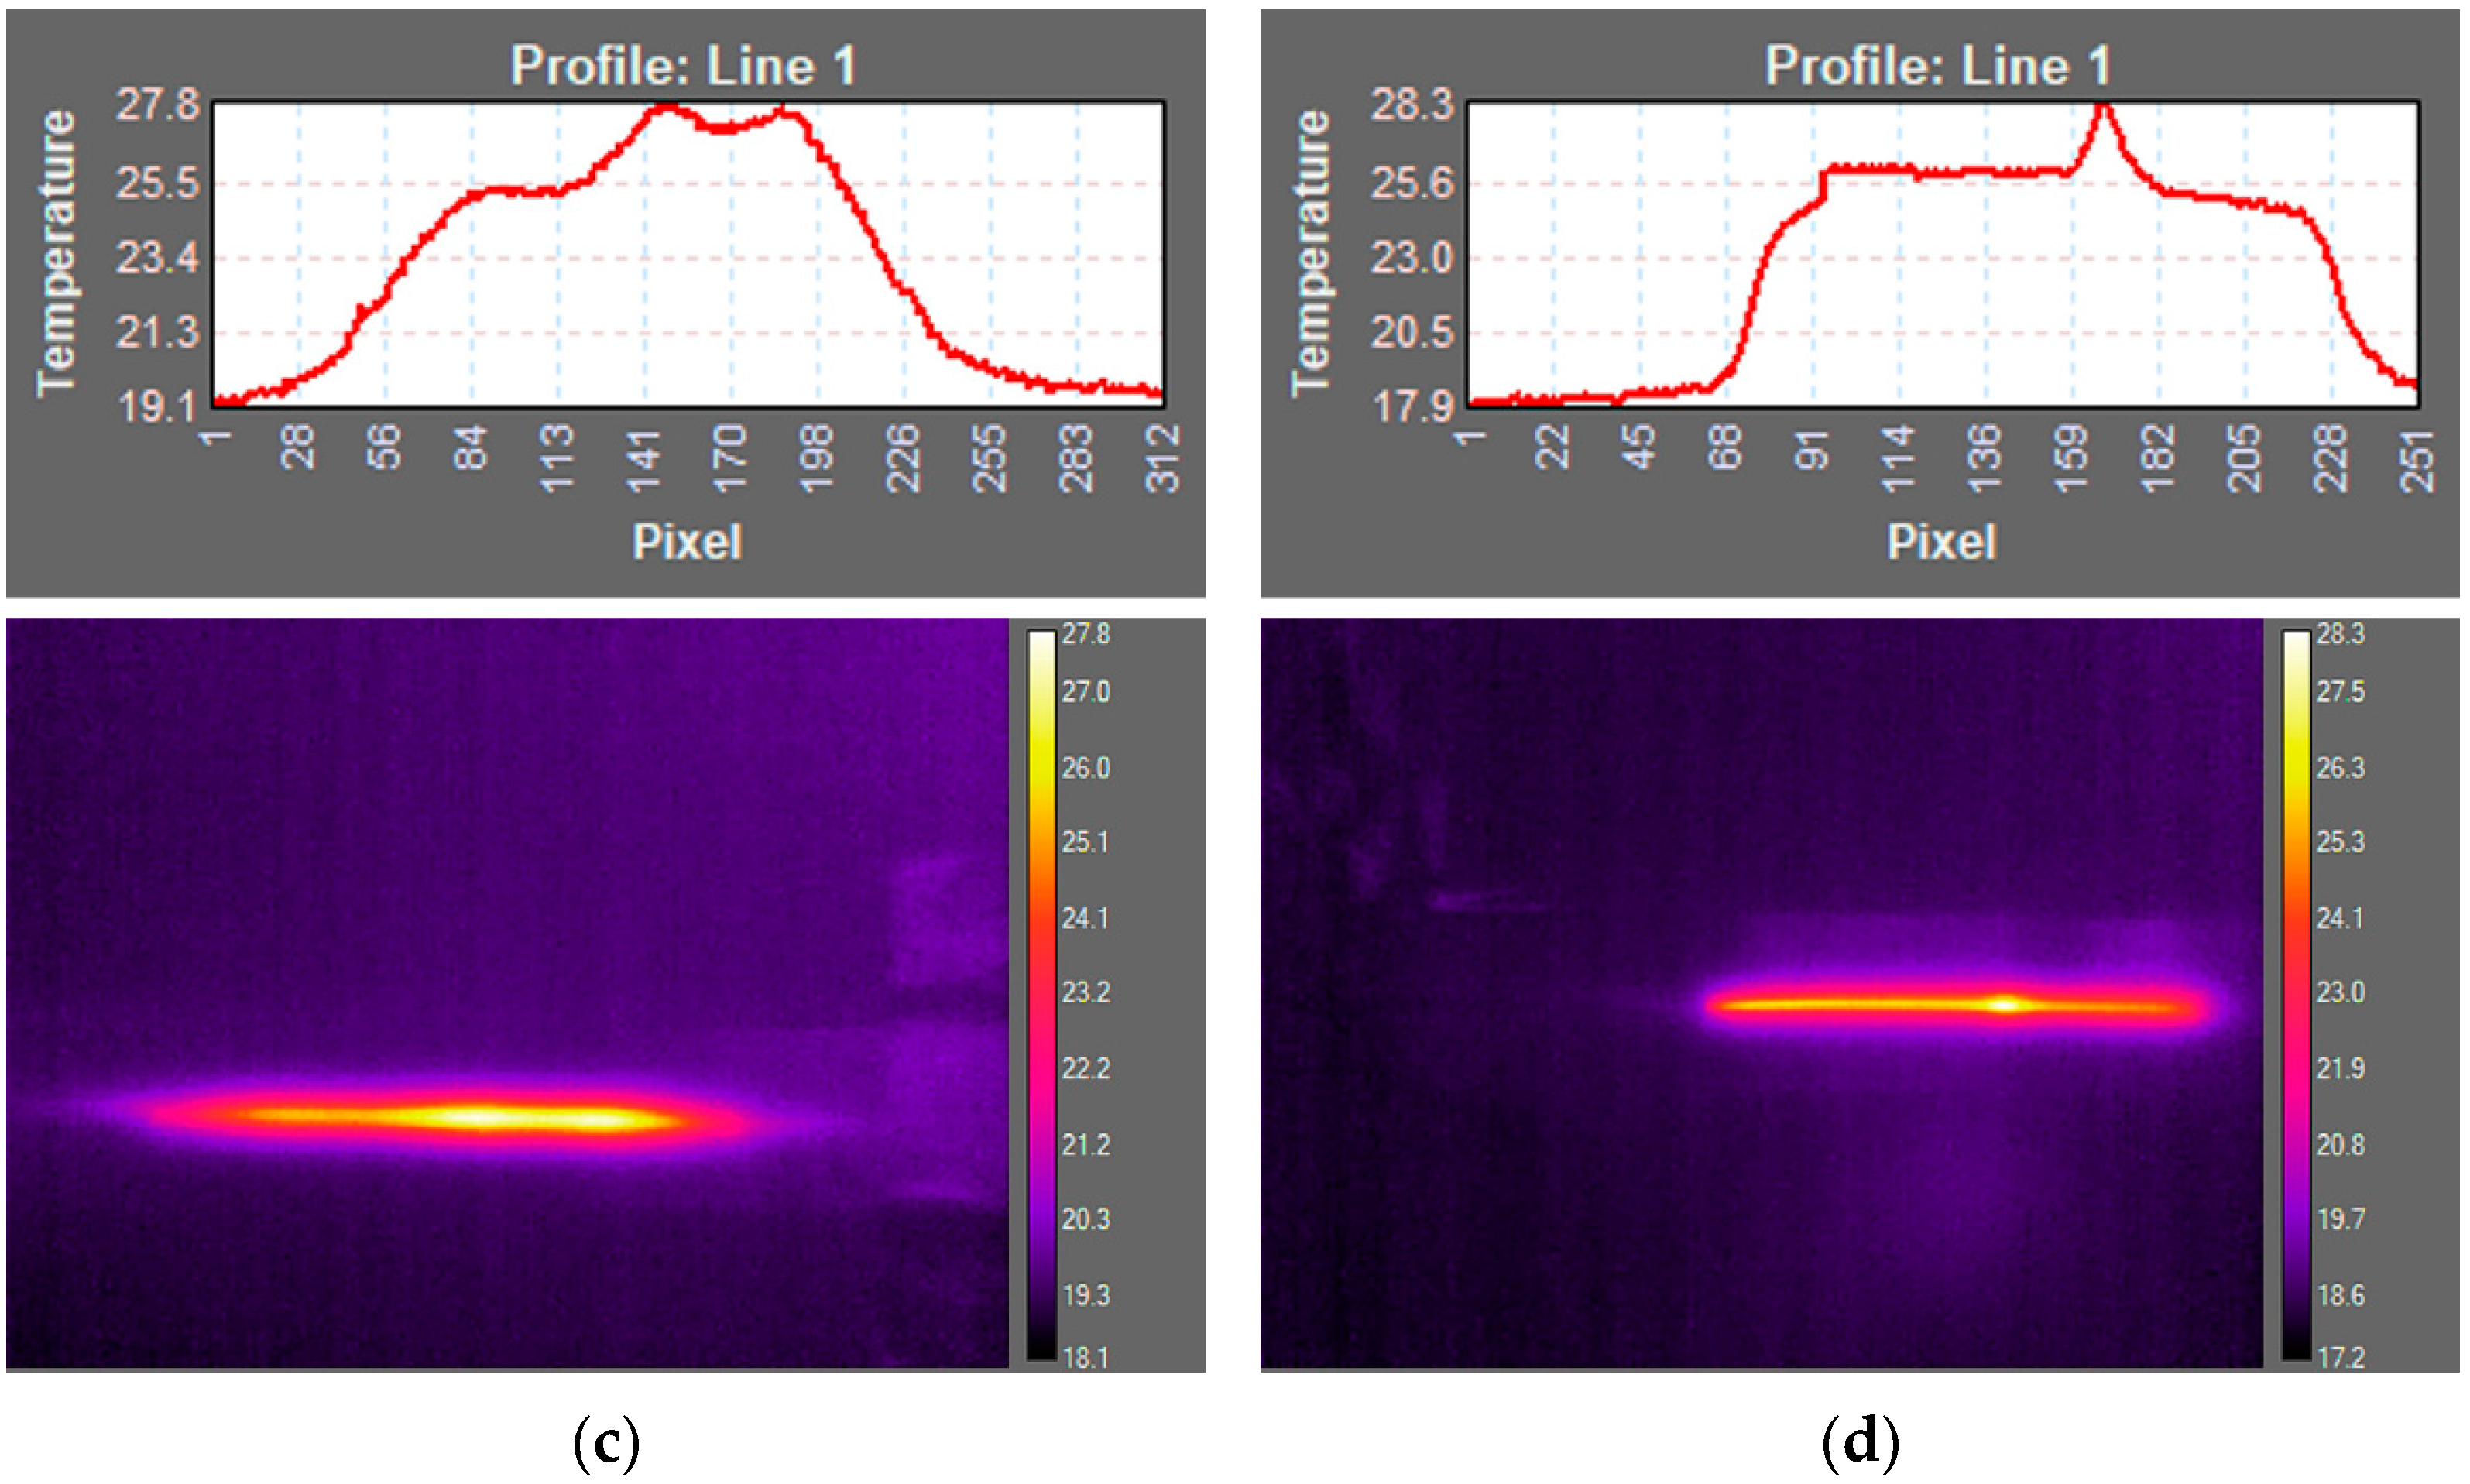
An active thermographic inspection of the specimens before loading revealed damage to the electrical contacts of the sensors made of pitch carbon fiber tow 95 A. The temperature profile along the sensor with the damaged contact area is shown in Figure 12. In Figure 13. The temperature profile of a sensor without any pre-damage is depicted. Six out of 9 specimens with implemented sensors made of material 95 A were definitely damaged during manufacturing or during implementation. Two specimens were indeterminate regarding damage to the sensor, and no data were provided for one specimen. This demonstrates the sensitivity for the structural integration of carbon fiber sensors made of brittle ex-pitch filaments.
Sensors made of pitch 70 A carbon fiber tow and sensors made of pan T300 carbon fiber tow showed no signs of damage before loading.
Specimens T300-16, T300-17, 95 A-11, 95 A-12, 70 A-8, 70 A-7 were investigated after 200 cycles of flexural loading and before impact loading. No signs of damage caused by flexural cyclic loading were observed for specimens with a T300 sensor. Damage to the electrical contacts could be detected for specimens 95 A-11, 95 A-12. The temperature profile along the sensor changed slightly after cyclic loading in the case of sensors 70 A-7 and 70 A-8.
The specimens were thermographically inspected again after impact loading. The results of this observation are given in Table 5. Based on our measurements, T300 has the greatest potential for use as a heating element for active thermography. It was possible to detect the impact if the sensor was on the impacted site, and if the sensor was on the opposite side of the specimen to the impact. Based on observations with CFSs made of material 95A, the impact can also be detected by a sensor with damaged electrical contacts. In the case of specimens with an integrated CFS made of material 70 A, damage to the electrical contacts was observed for specimens 70 A-1, 70 A-3, and 70 A-9 after cyclic loading and impact loading. Unfortunately, only two specimens for each type of CFS material were inspected thermographically after 200 cycles, and before impact loading, for material type 70 A, specimens 70 A-7 and 70-8 were checked. Therefore, based on data from active thermography, it is not possible to determine whether the damage to the electrical contacts was caused by impact loading or by cyclic loading.
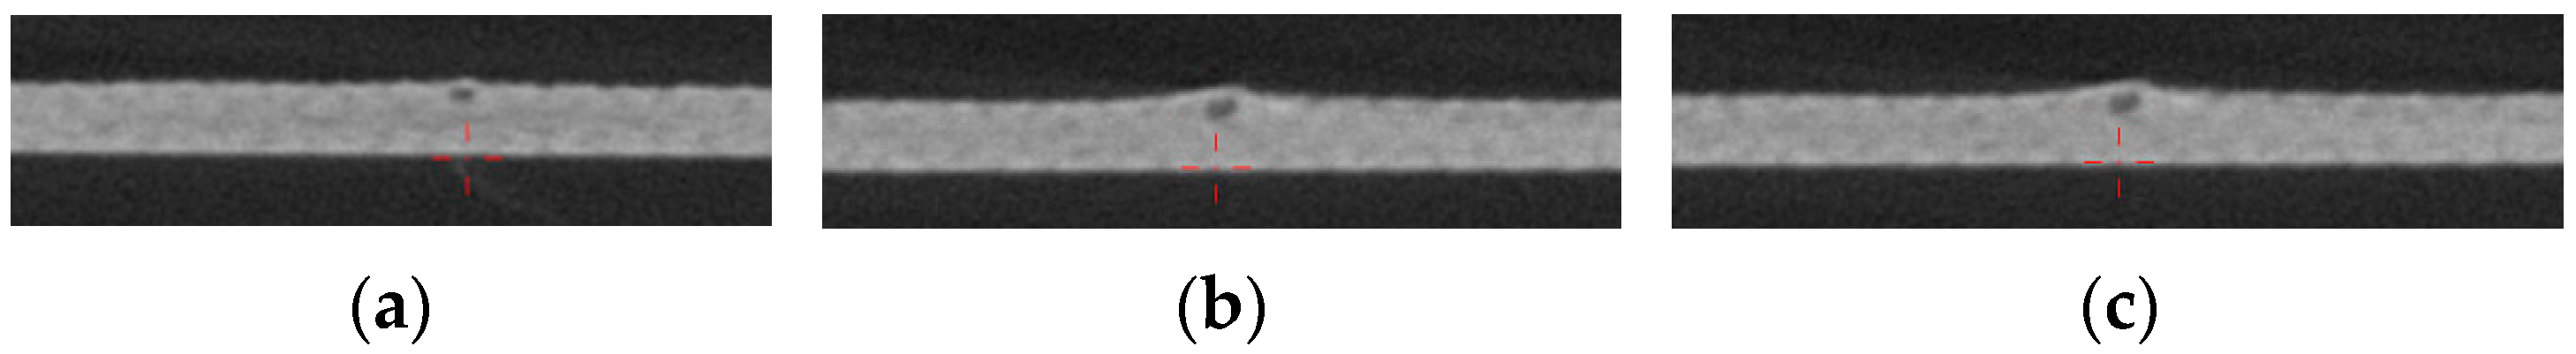
Three specimens of each type of carbon fiber tow underwent CT, see Table 1. No signs of damages were detected using CT. Different sizes of the inserted carbon fiber tow are illustrated in pictures made by CT, see Figure 14.

4. Conclusions

Impact damage detection using sensors made of different types of carbon fiber tows has been demonstrated on rectangular coupons made of a prepreg glass fabric composite. According to obtained results, it is possible to detect barely visible impact damage of glass fabric composite using integrated CFS.
Different ways of positioning the sensors in the lay-up were investigated. According to our investigation, it is better to place the CFSs on the side opposite to an impact, rather than on the impacted side. If a CFS is positioned on the side opposite to the impact, there is a bigger probability that the impact can be detected. Integrating the sensor in the middle of the lay-up is not convenient for impact damage detection.
The Pan type of fiber tow used for integrated CFS showed stable cyclic loading behavior. Sensors made of pitch carbon fiber tows were more sensitive to cyclic loading. For industrial applications with a lot of cyclic loading, a more extensive experimental campaign on the influence of cyclic loading on the measured signal need to be done.
It is not advisable to manufacture CFSs using extremely brittle pitch carbon fiber tows (Pitch 95 A), because the contact quality cannot be guaranteed, and there are difficulties when manufacturing the sensor and during handling (during integration into the structure). The difficulties came from the brittleness of the Pitch 95 A fiber itself. It is assumed that failure occurred in the contact zone between the filaments and the solder. The handling of the CFS made of 70 A and T300 material is problem-free for the manufacturing operator. Moreover, no damage after manufacturing was observed using active thermography for specimens with sensors made of 70 A and T300 material.
The influence of the mechanical loading on the change in the electrical resistance of the integrated Pan T300 CFS and Pitch 70 A CFS is small in comparison with the effect of barely visible impact damage. It has been shown that it is possible to distinguish the change in the electrical resistance of all types of CFSs resulting from mechanical loading.
The response to the temperature of the CFSs has been described, and the temperature effect can be eliminated during the measurements.
Active thermography inspection using the CFS as a heating element can be applied for inspection and also for impact damage detection in combination with CFSs.

Author Contributions

Conceptualization, N.S.; methodology, N.S. and J.M.; formal analysis, N.S. and J.M.; investigation, N.S., J.M., R.S., T.K. and J.Š.; resources, N.S. and J.M.; data curation, N.S. and J.M.; writing—original draft preparation, N.S.; writing—review and editing, R.S., T.K., M.R. and A.H.; visualization, N.S. and J.M.; supervision, M.R. and A.H.; project administration, N.S.; funding acquisition, M.R and A.H. All authors have read and agreed to the published version of the manuscript.

Funding

This research was funded by Bayerisch-Tschechische Hochschulagentur, grant number BTHA-AP-2019-16. The APC was funded by the Department of Mechanics, Biomechanics and Mechatronics, Faculty of Mechanical Engineering, Czech Technical University in Prague, Technická 4, Praha 6, Czech Republic.

Institutional Review Board Statement

Not applicable.

Informed Consent Statement

Not applicable.

Conflicts of Interest

The authors declare no conflict of interest.

References

  1. Bindt. Available online: https://www.bindt.org/What-is-NDT/Index-of-acronyms/B/BVID/ (accessed on 19 December 2021).
  2. Ratwani, M.M. Effect of Damage on Strength and Durability. Education Note No. 5, ADA871922; R-Tec: Rolling Hills Estate, CA, USA, 2010.
  3. Heida, J.H.; Platenkamp, D.J. In-service Inspection Guidelines for Composite Aerospace Atructures. In Proceedings of the 18th World Conference on Nondestructive Testing, Durba, South Africa, 16–20 April 2012. [Google Scholar]
  4. Talreja, R.; Phan, N. Assessment of damage tolerance approaches for composite aircraft with focus on barely visible impact damage. Compos. Struct. 2019, 219, 1–7. [Google Scholar] [CrossRef]
  5. Tan, K.T.; Watanabe, N.; Iwahori, Y. X-ray radiography and micro/computed tomography examination of damage characteristics in stitched composites subjected to impact loading. Composites 2011, 42 Pt B, 874–884. [Google Scholar] [CrossRef]
  6. Garnier, G. Structural Health Monitoring: NDT-Integrated Aerostructures Enter Service. Composites World. 2015. Available online: https://www.compositesworld.com/articles/structural-health-monitoring-ndt-integrated-aerostructures-enter-service (accessed on 20 December 2021).
  7. Rocha, H.; Semprimoschnig, C.; Nunes, J.P. Sensors for process and structural health monitoring of aerospace composites: A review. Eng. Struct. 2021, 237, 112231. [Google Scholar] [CrossRef]
  8. Boller, C. Fundamentals on Damage Monitring. In Smart Structures and Materials: Implication for Military Aircraft of New Generation; Agard: Neuilly-sur-Seine, France, 1996; pp. 1–15. [Google Scholar]
  9. Ahmed, O.; Wang, X.; Tran, M.-V.; Ismadi, M.Y. Advancements in fiber/reinforced polymer composite materials damage detection methods: Towards achieving energy efficient SHM systems. Composites 2021, 223 Pt B, 1–23. [Google Scholar] [CrossRef]
  10. Skrzypkowski, K.; Koryeniowski, W.; Zagórski, K.; Dominik, I.; Lalik, K. Fast, non-destructive measurement of roof/bolt loads. Stud. Geotech. Mech. 2019, 41, 93–101. [Google Scholar] [CrossRef] [Green Version]
  11. Garnier, C.; Pastor, M.-L.; Ezma, F.; Lorrain, B. The detection of aeronautical defects in situ on composite structures using Non Destructive Testing. Compos. Struct. 2011, 93, 1328–1336. [Google Scholar] [CrossRef] [Green Version]
  12. Dafydd, I.; Khodaei, Z.S. Analysis of barely visible impact damage severity with ultrasonic guided Lamb waves. Struct. Health Monit. 2020, 19, 1104–1122. [Google Scholar] [CrossRef]
  13. Baltopoulos, A.; Polydorides, N.; Pambaguian, L.; Vavouliotis, A.; Kostopoulos, V. Damage identification in carbon fiber reinforced polymer plates using electrical resistance tomography mapping. J. Compos. Mater. 2012, 47, 3285–3301. [Google Scholar] [CrossRef]
  14. Wang, S.; Chung, D.D.L.; Chung, J.H. Impact damage carbon fiber polymer-matrix composites studied by electrical resistance measurement. Composites 2005, 36 Pt A, 1707–1715. [Google Scholar] [CrossRef]
  15. Swait, T.J.; Jones, F.R.; Hayes, S.A. Damage detection and amelioration by electrical resistance for smart composites. In Proceedings of the ICCM18, Jeju, Korea, 21–26 August 2011. [Google Scholar]
  16. Thomas, A.J.; Kim, J.J.; Tallmann, T.N.; Bakis, C.E. Damage detection in self/sensing composite tubes via electrical impedance tomography. Composites 2019, 177 Pt B. [Google Scholar] [CrossRef]
  17. Viets, C.; Kaysser, S.; Schulte, K. Damage mapping of GFRP via electrical resistance measurements using nanocomposite epoxy matrix systems. Composites 2014, 65 Pt B, 80–88. [Google Scholar] [CrossRef]
  18. Tuloup, C.; Harizi, W.; Aboura, Y.; Meyer, Y.; Khellil, K.; Lachat, R. On the use of in-situ piezoelectric sensors for the manufacturing and structural health monitoring of polymer-matrix composites: A literature review. Compos. Struct. 2019, 215, 127–149. [Google Scholar] [CrossRef]
  19. Abot, J.L.; Song, Y.; Vatsavaya, M.S.; Medikonda, S.; Kier, Z.; Jayasinghe, C.; Rooy, N.; Shanov, V.N.; Schulz, M.J. Delamination detection with carbon nantube thread in self-sensing composite materials. Compos. Sci. Technol. 2010, 10, 1113–1119. [Google Scholar] [CrossRef]
  20. Scholle, P.; Sinapius, M. A review on the usage of continuous carbon fibers for piezoresistive self strain sensing fiber reinforced plastics. J. Compos. Sci. 2021, 5, 96. [Google Scholar] [CrossRef]
  21. Giurgiutiu, V. Structural Health Monitoring of Aerospace Composites; Academic Press: Cambridge, MA, USA, 2014; pp. 293–355. [Google Scholar]
  22. Goossens, S.; Berghmans, F.; Khodaei, Y.S.; Lambinet, F.; Karachalios, E.; Saenz-Castillo, D.; Geernaert, T. Practicalities of BVID detection on aerospace/grade CFRP materials with optical fibre sensors. Compos. Struct. 2021, 259. [Google Scholar] [CrossRef]
  23. Horoschenkoff, A.; Muller, T.; Kroelll, A. On the characterization of the piezoresistivity of embedded carbon fibres. In Proceedings of the ICCM17, Edinburg, UK, 27–31 July 2009. [Google Scholar]
  24. Horoschenkoff, A.; Selting, S.; Rapp, H. Einsatzpotential von Messfedern aus elektrisch kontaktierten Kohlenstofffasern mit hexagonaler Anordnung fuer Leichtbaustrukturen aus Faserverbundwekstoffen. 2007. [Google Scholar]
  25. Horoschenkoff, A.; Christner, C. Carbon Fibre Sensor: Theory and Application. In Composites and Their Applications, 1st ed.; Hu, N., Ed.; Intech Open: London, UK, 2021; Available online: http://www.intechopen.com/books/composites-and-their-applications/carbon-fibre-sensor-theory-and-application (accessed on 19 December 2021).
  26. Muller, T.; Horoschenkoff, A.; Rapp, A. Carbon fibre sensor for crack monitoring of composite materials. In Proceedings of the ICCM19, Montreal, QC, Canada, 28 July–2 August 2013. [Google Scholar]
  27. Schmidova, N.; Horoschenkoff, A.; Ruzicka, M. Investigation of the Electrical Resistivity of Damaged Carbon Fibers Sensors With Regard to SHM. In Proceedings of the ECCM18, Athens, Greece, 25–28 June 2018. [Google Scholar]
  28. Hoffman, K. Anwendung der Wheatstonesche Bruckenschaltung–Technische Information; Hottinger Baldwin Messtechnik; GmbH: Darmstadt, Germany; Available online: https://www.hbm.com/de/7163/die-wheatstonesche-brueckenschaltung-kurz-erklaert/ (accessed on 30 December 2021).
  29. Dvořák, M.; Had, J.; Růžička, M.; Pošvář, Z. Monitoring of 3D Composite Structures Using Fiber Optic Bragg Grating Sensors. Struct. Health Monit. 2011, 2, 1595–1602. [Google Scholar]
Figure 1. (a) Specimens after mechanical loading; (b) CFSs type 70A during implementation in the composite lay-up; (c) Specimens during temperature loading.
Applsci 12 01112 g001
Figure 2. Configuration of the 3-point-bending test: (a) specimen during cyclic flexural loading; (b) configuration of the composite lay-up during cyclic flexural loading.
Applsci 12 01112 g002
Figure 3. Configuration of the drop weight impact test: (a) schema of the impact test; (b) supports for the impact test.
Applsci 12 01112 g003
Figure 4. Temperature dependence of the measured electrical resistance of the investigated types of CFSs: (a) PT100 temperature sensor, (b) CFS type 95A, (c) CFS type T300, (d) CFS type 70A.
Applsci 12 01112 g004
Figure 5. A linear fit function for the measured mean values of the CFS.
Applsci 12 01112 g005
Figure 6. Evaluating the peak-to peak data.
Applsci 12 01112 g006
Figure 7. Peak-to-peak relative values of the measured signal from CFSs integrated into the specimens before and after impact loading: (a) results for specimens T300; (b) results for specimens T300–detail; (c) results for specimens 95 A; (d) results for specimens 70 A.
Applsci 12 01112 g007aApplsci 12 01112 g007b
Figure 8. Configuration of the 3PB test and the measured signal from the integrated CFSs: (a) results for specimen with CFS between the 1st and 2nd layer during 3PB (measured data of T300-30), (b) results for specimen with CFS between the 4th and 5th layer during 3PB (measured data of T300-37), (c) results for specimen with CFS between the 7th and 8th layer during 3PB (measured data of T300-16).
Applsci 12 01112 g008
Figure 9. Electrical resistance of integrated sensors as a percentage of the value of a pristine sensor after implementation-results for specimens with CFSs made of material T300.
Applsci 12 01112 g009
Figure 10. Electrical resistance of integrated sensors as a percentage of the value of a pristine sensor after implementation-results for specimens with CFSs made of material 70 A.
Applsci 12 01112 g010
Figure 11. Electrical resistance of integrated sensors as a percentage of the value of a pristine sensor after implementation-results for specimens with CFSs made of material 95 A.
Applsci 12 01112 g011
Figure 12. Active thermographic inspection: (a) 95 A-11 before loading, (b) 95 A-11 after 200 cycles of cyclic flexural loading, (c) 95 A-11 after impact.
Applsci 12 01112 g012
Figure 13. Thermographic inspection: (a) 70 A-8 before loading, (b) 70 A-8 after 200 cycles of 3PB, (c) 70 A-8 after impact, (d)–T300-30 after impact.
Applsci 12 01112 g013aApplsci 12 01112 g013b
Figure 14. Non-destructive testing using CT: (a) specimen T300-18 (zoom = 150%), (b) specimen 70A-8 (zoom = 150%), (c) specimen 95A-12 (zoom = 150%).
Applsci 12 01112 g014
Table 1. Overview of specimens for mechanical tests.
Material of CFSSpecimen NumbersPlacement of CFS between Layers
T300 1000-50A30 1, 31, 32, 331 and 2
34, 35, 36, 374 and 5
16, 17, 187 and 8
YS-95A-30S1, 2, 41 and 2
5, 7, 84 and 5
9, 11, 127 and 8
YSH-70A-30S1, 2, 31 and 2
4, 5, 64 and 5
7, 8, 97 and 8
1 The specimens with numbers written in bold underwent computer tomography after the mechanical loading and impact test.
Table 2. An overview of the carbon fiber tows examined here.
Label of the Fiber Tow T300
T300 1000-50A
95A
YS-95A-30S
70A
YSH-70A-30A
Type PANPITCHPITCH
Producer TorayNippon Graphite Fiber Corporation
Number of filaments[–]100030003000
Tensile modulus[GPa]230893714
Tensile strength[MPa]353036003600
Ultimate elongation[%]1.50.30.5
Thermal conductivity[W/mK]10.46600250
Volume resistivity[μΩm]172.25
Table 3. Overview of the specimens for temperature tests.
Material of CFSSpecimen Nos.Placement of CFS
between Layers
T300 1000-50A12, 13, 14, 151 and 2
YS-95A-30S14, 16, 171 and 2
YSH-70A-30S10, 11, 12, 131 and 2
Table 4. The calculated values of the linear fit, and also the R2 and RMSE values.
Specimen Nos.m [Ω/°C]R0 °C [Ω]R2RMSE [°C]
T300-12−9.10 × 10−327.791 − 3368 × 10−50.206
T300-13−8.93 × 10−327.761 − 5498 × 10−60.083
T300-14−9.02 × 10−327.911 − 1286 × 10−60.128
T300-15−9.04 × 10−327.901 − 1123 × 10−60.119
T300 mean−9.02 × 10−327.84
70A-10−3.12 × 10−33.490.99851.365
70A-11−3.17 × 10−33.540.99781.682
70A-12−3.19 × 10−33.530.99861.309
70A-13−3.32 × 10−33.480.99831.462
70A mean−3.20 × 10−33.51
Table 5. Results of a thermographic inspection after impact loading.
CFS between LayersT30095A70A
1–230IV 11IV1DEC
31IV2IV2CH
32IV4ND3DEC, CH
33INV
4–534ND5INV4IV
35ND7INV5INV
36INV8INV6INV
37INV
7–816IV9INV7ND
17IV11IV8IV, DEC
18IV12INV9DEC
1 data description: IV—impact visible, INV—impact not visible, ND—no data, DEC—damage of electrical contacts after impact, CH—change of temperature profile along CFS.
Publisher’s Note: MDPI stays neutral with regard to jurisdictional claims in published maps and institutional affiliations.

