
High Definition tDCS Effect on Postural Control in Healthy Individuals: Entropy Analysis of a Crossover Clinical Trial

 ,
,  , , , ,
Abstract
:1. Introduction
2. The Data
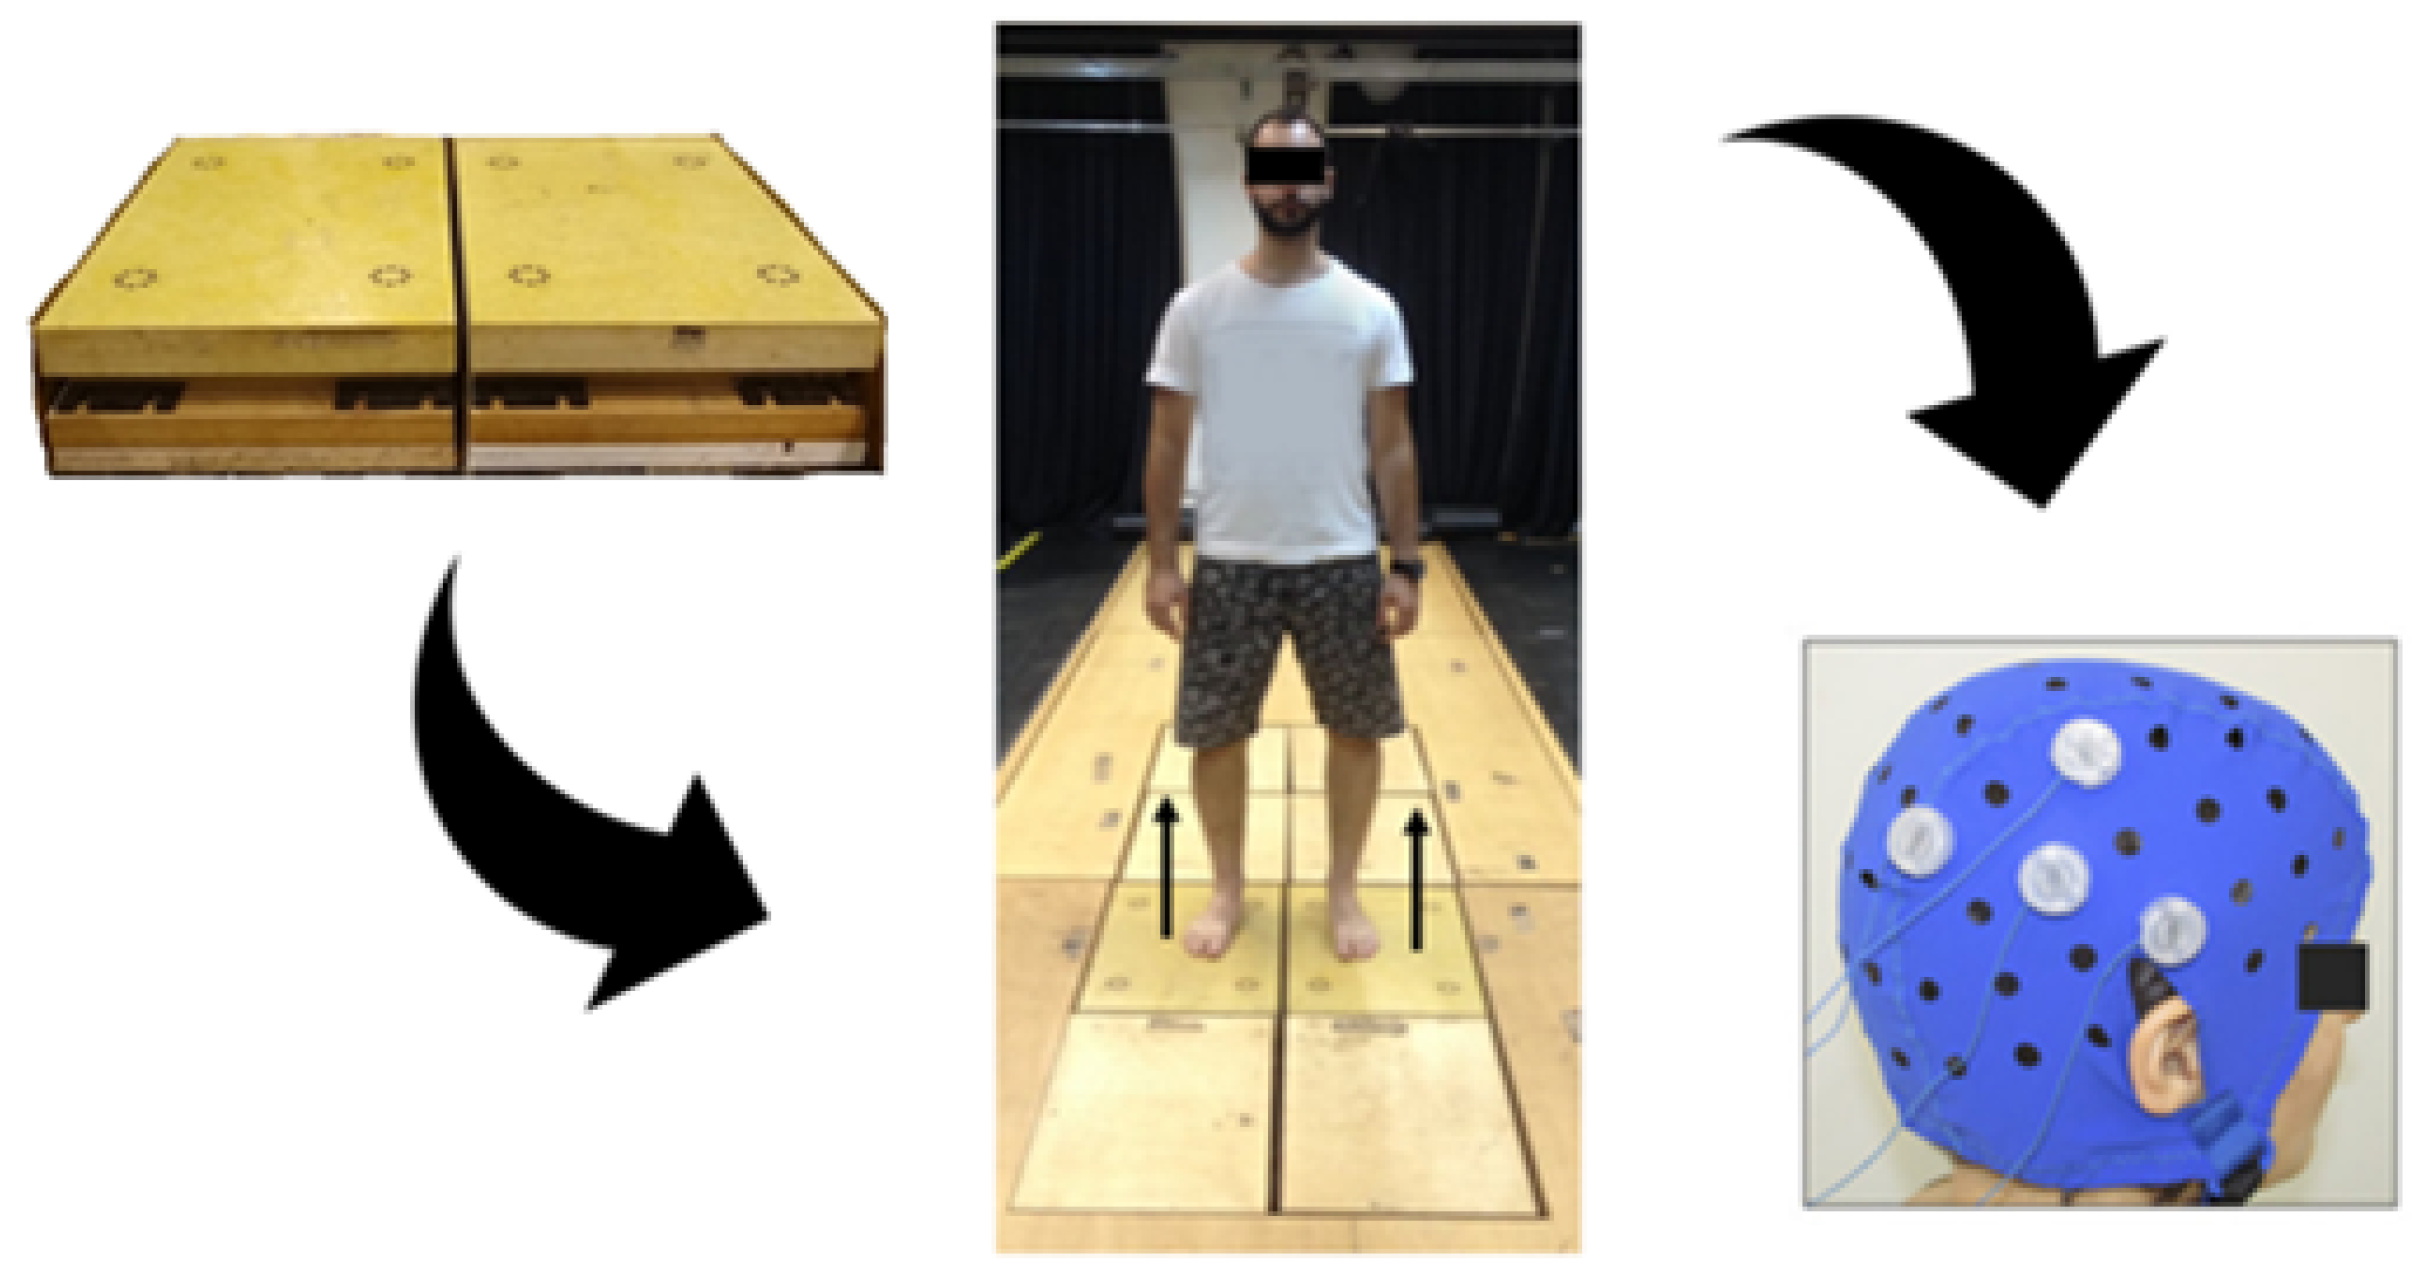
2.1. Participants
2.2. Intervention
2.3. Outcome Measure
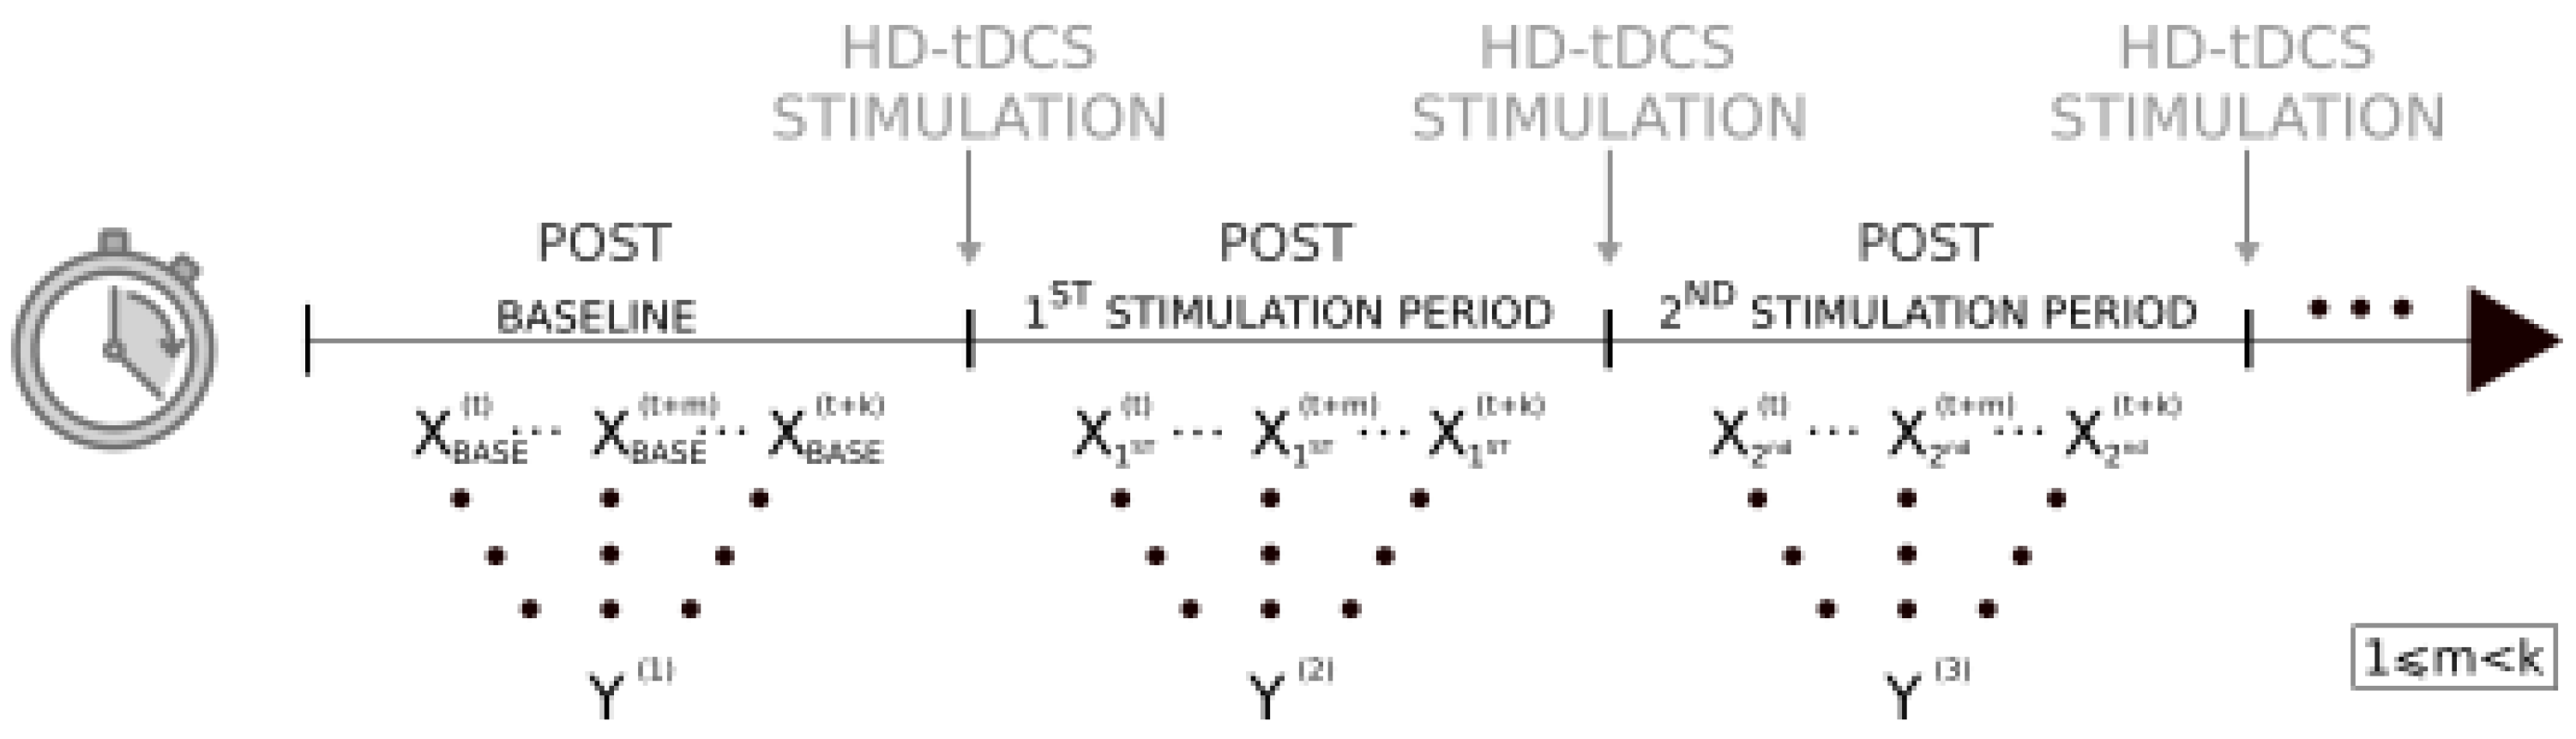
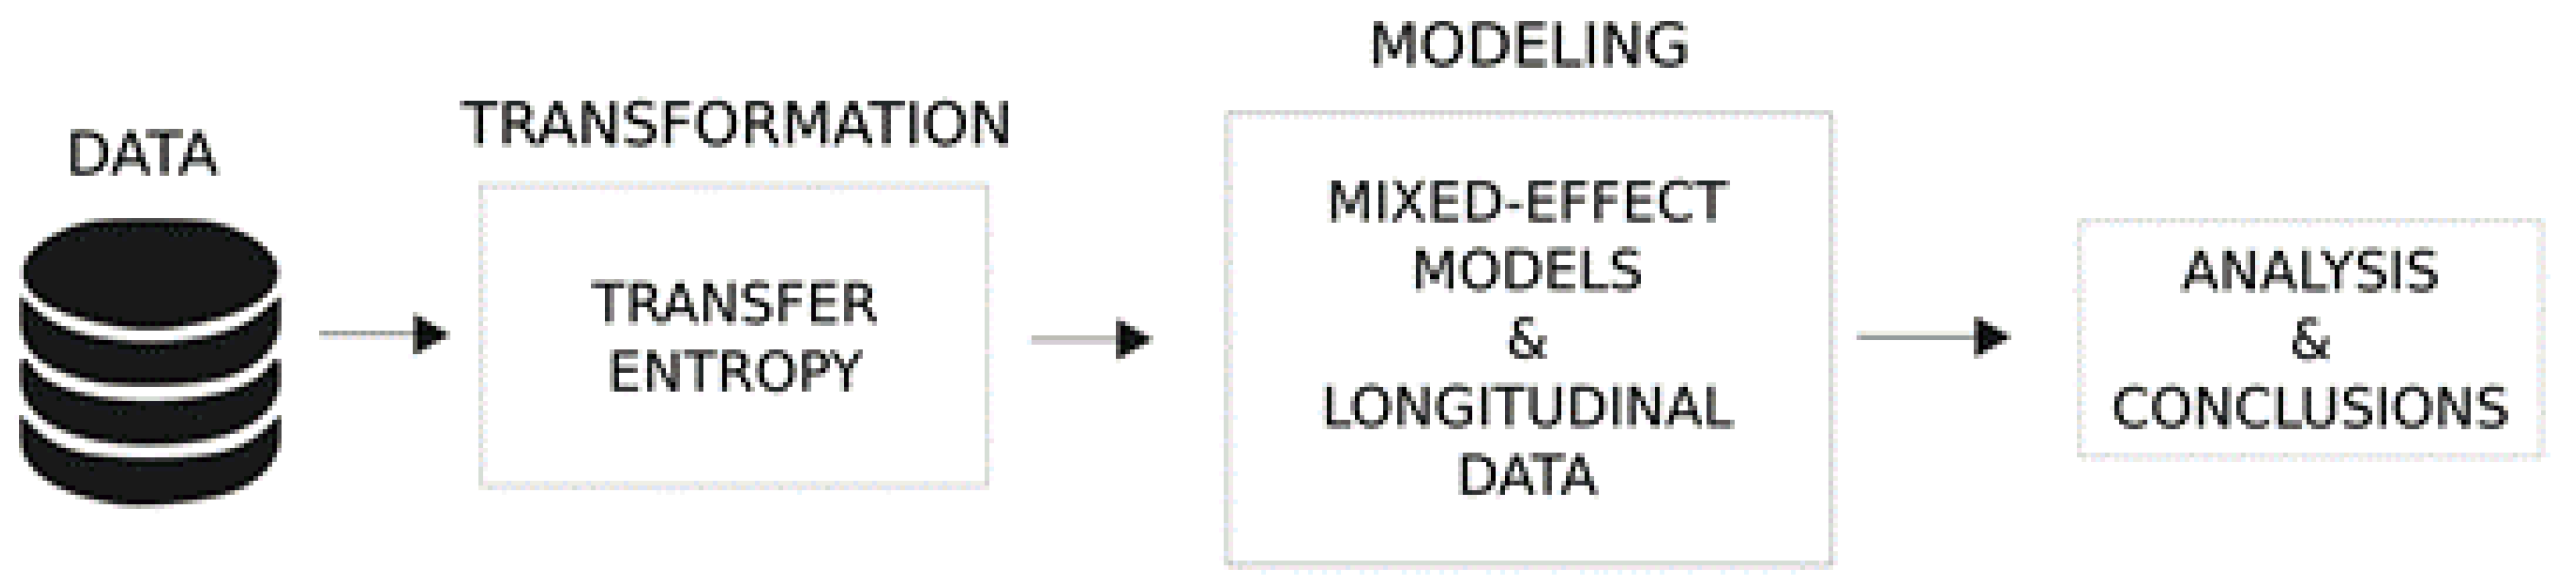
2.4. Statistical Analyses
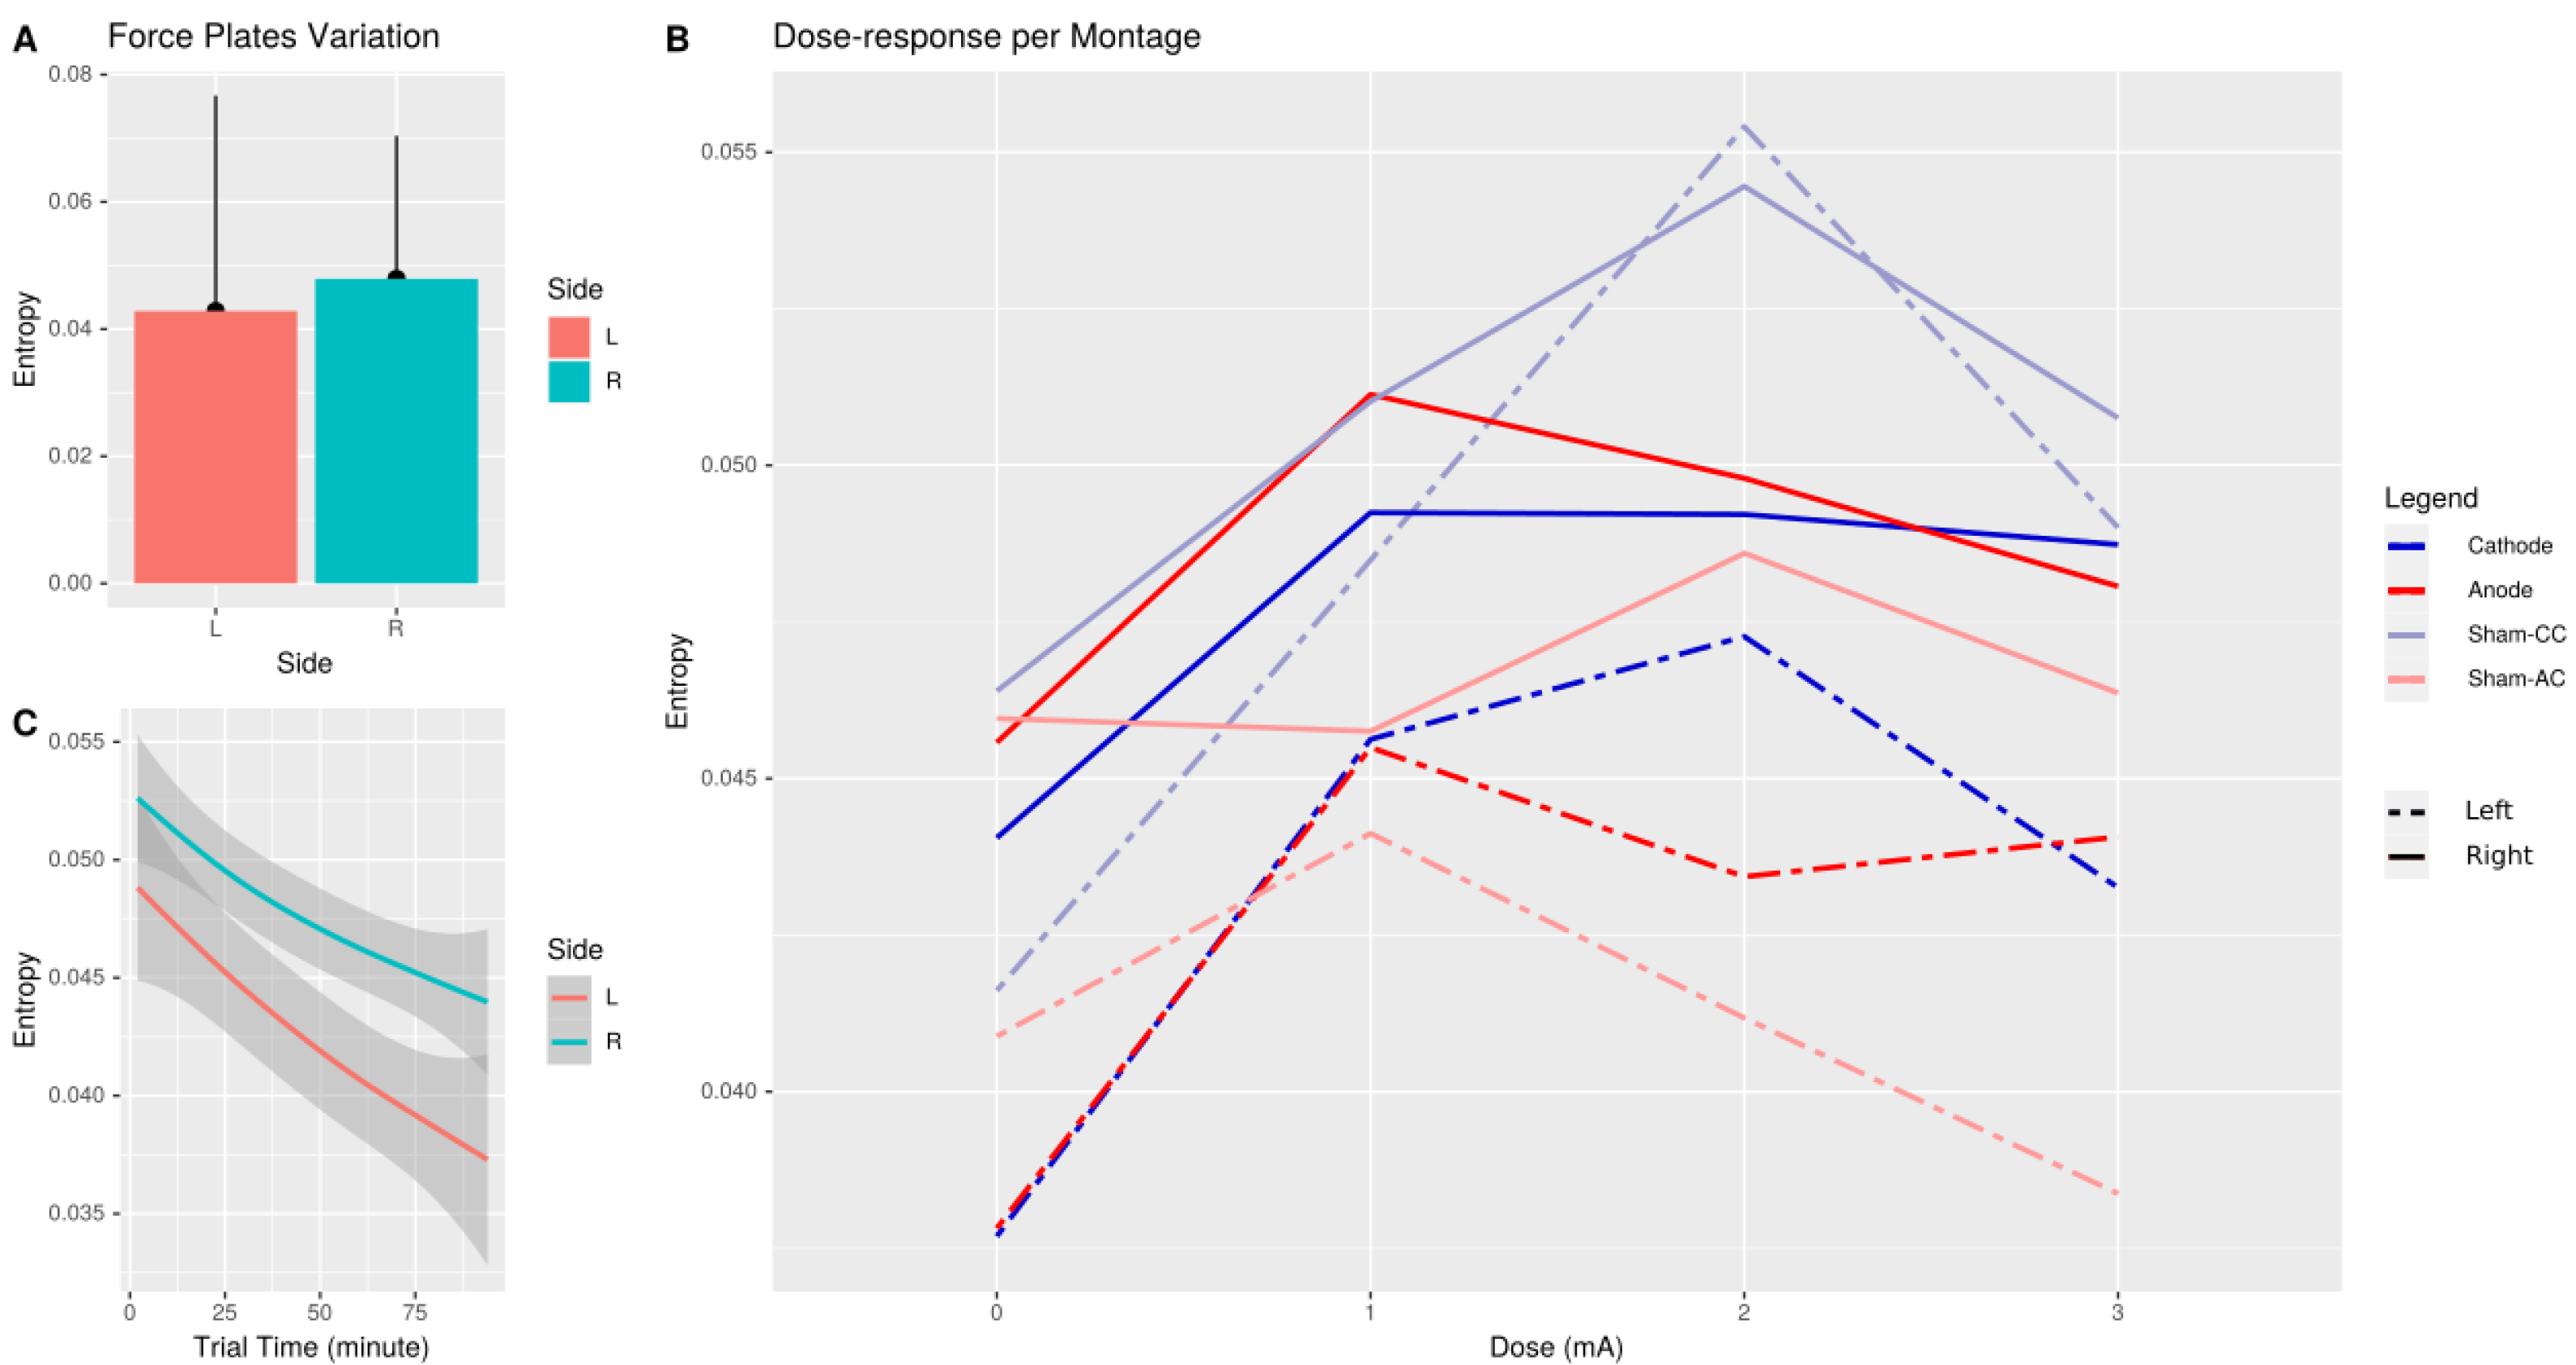
3. Results
4. Discussion
5. Conclusions
Author Contributions
Funding
Institutional Review Board Statement
Informed Consent Statement
Data Availability Statement
Conflicts of Interest
Appendix A

| Estimate | Std. Error | t Value | Pr(>|z|) | ||
|---|---|---|---|---|---|
| baseline | −2.8219 | 0.1203 | −23.46 | <2 × 10 | *** |
| Anodal (AC) | −3.1613 | 0.1068 | −29.59 | <2 × 10 | *** |
| Cathodal (CC) | −3.1495 | 0.1068 | −29.48 | <2 × 10 | *** |
| SHAM-AC | −3.1958 | 0.1107 | −28.86 | <2 × 10 | *** |
| SHAM-CC | −3.0344 | 0.1094 | −27.74 | <2 × 10 | *** |
| 1 mA vs. 0 mA | −0.1088 | 0.0649 | −1.68 | 0.0934 | . |
| 2 mA vs. 0 mA | 0.1073 | 0.0545 | 1.97 | 0.0490 | * |
| 3 mA vs. 0 mA | −0.0899 | 0.0597 | −1.51 | 0.1321 | |
| Time | −0.0034 | 0.0006 | −6.13 | 8.6 × | *** |
| Right-side vs. Left- | 0.1457 | 0.041 | 3.55 | 0.0004 | *** |
| AC vs. SHAM-CC: 1 mA | 0.1142 | 0.0809 | 1.41 | 0.1579 | |
| CC vs. SHAM-CC: 1 mA | 0.1813 | 0.0804 | 2.25 | 0.0242 | * |
| SHAM-AC vs. SHAM-CC: 1 mA | 0.02619 | 0.0968 | 0.27 | 0.7867 | |
| AC vs. SHAM-CC: 2 mA | −0.0299 | 0.0678 | −0.44 | 0.6592 | |
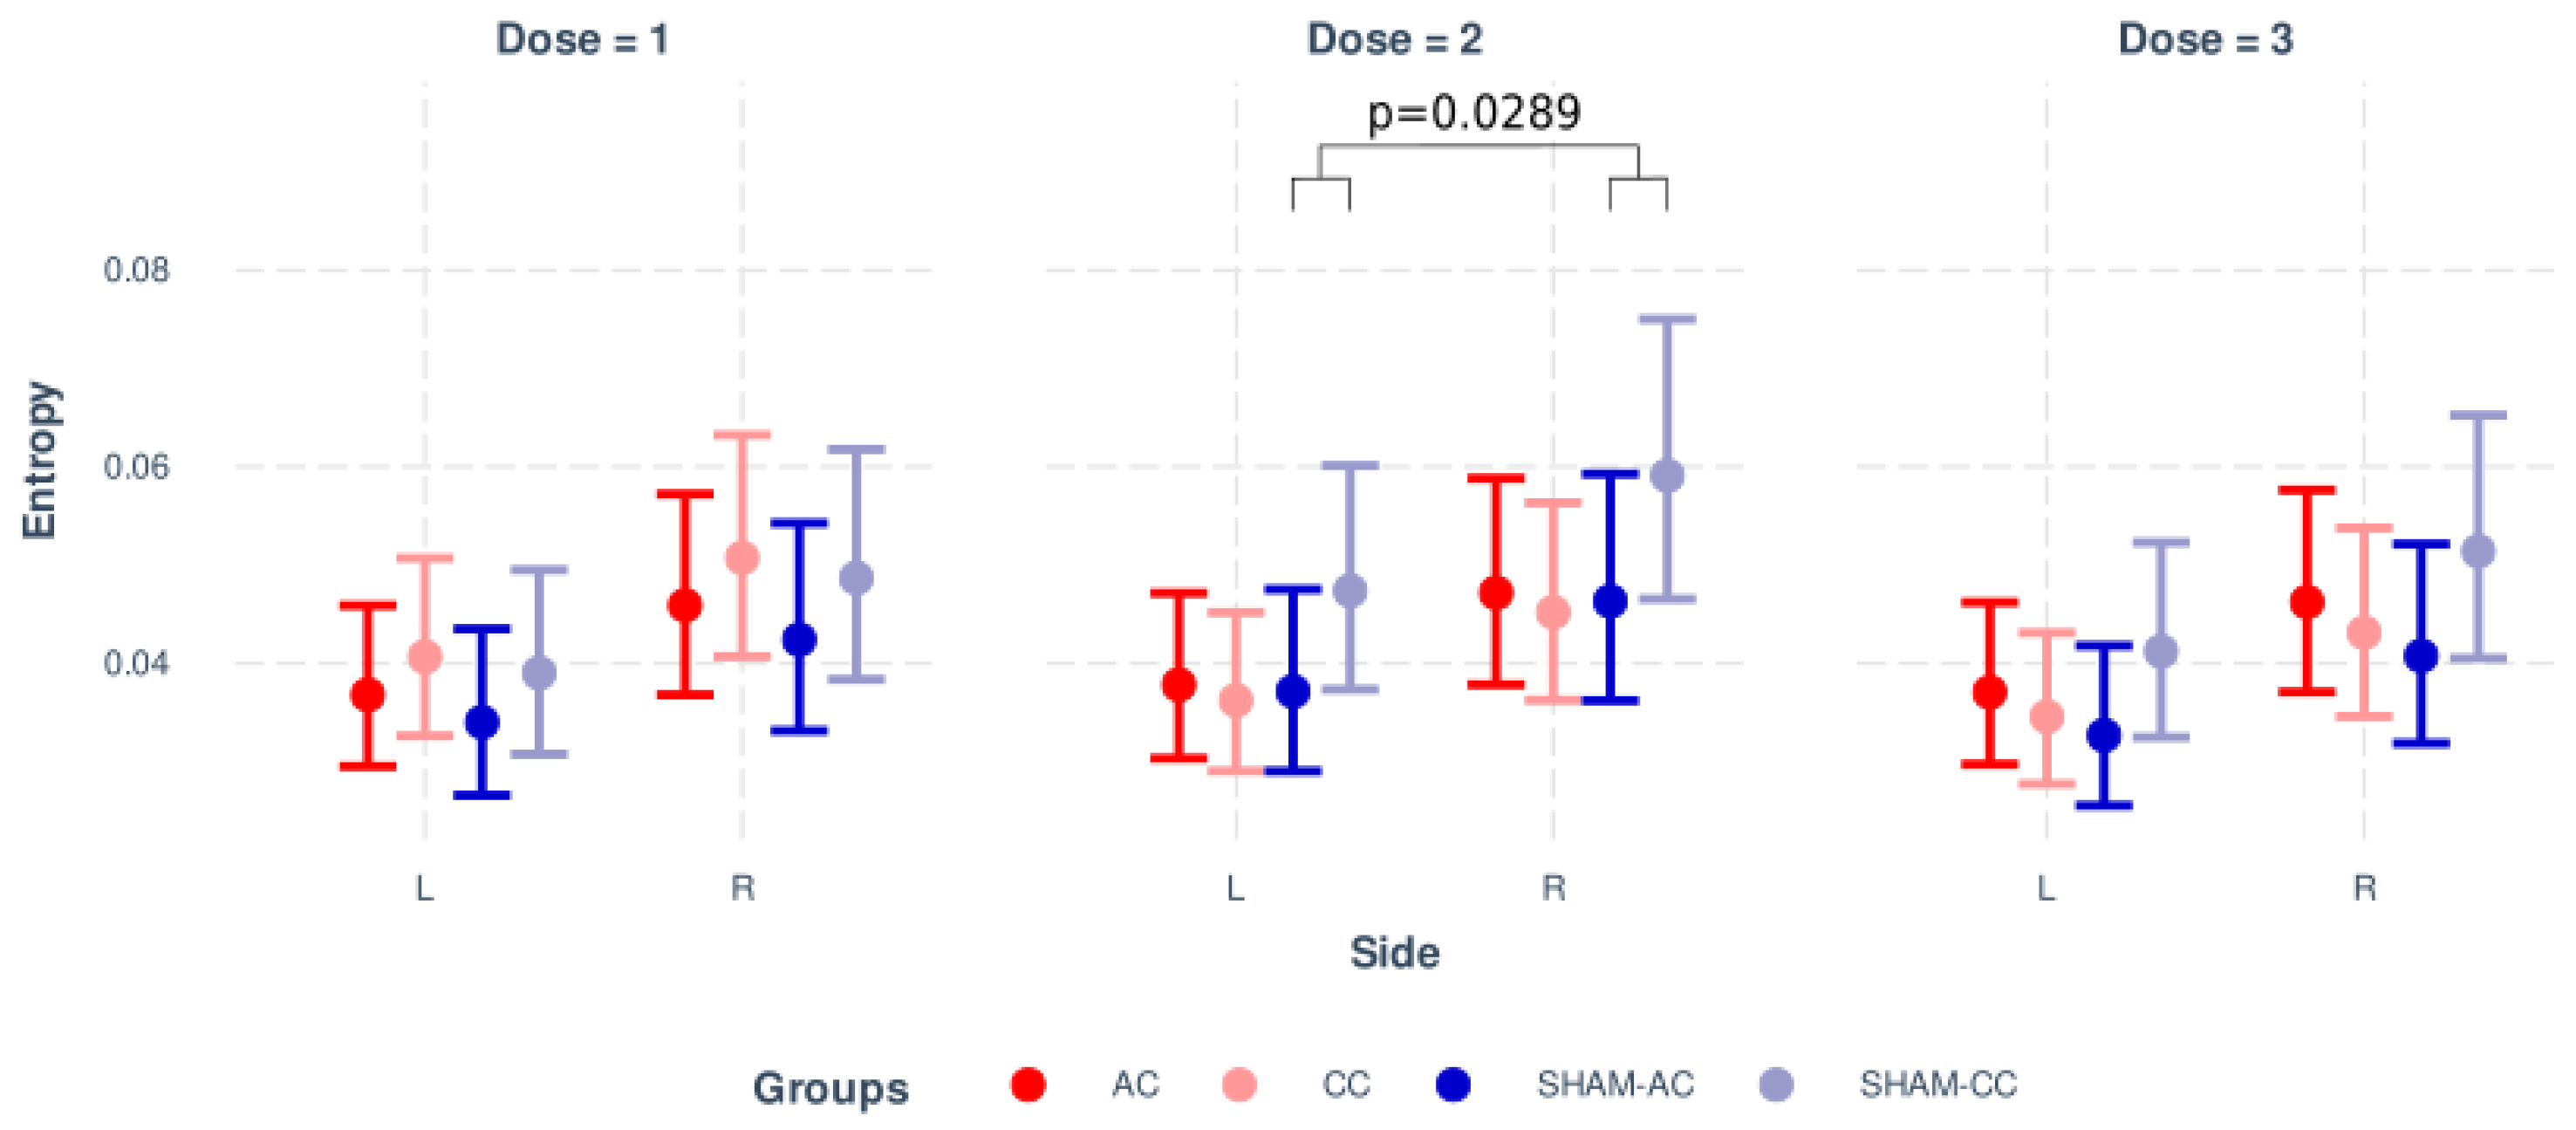
| CC vs. SHAM-CC: 2 mA | −0.1483 | 0.0679 | −2.18 | 0.0289 | * |
| SHAM-AC vs. SHAM-CC: 2 mA | −0.158 | 0.0811 | −1.95 | 0.0515 | . |
| AC vs. SHAM-CC: 3 mA | 0.0303 | 0.0743 | 0.41 | 0.6839 | |
| CC vs. SHAM-CC: 3 mA | −0.0033 | 0.0744 | −0.04 | 0.9646 | |
| SHAM-AC vs. SHAM-CC: 3 mA | 0.0584 | 0.0891 | 0.66 | 0.5124 | |
| Right-side vs. Left-: Time | 0.0017 | 0.0008 | 2.17 | 0.0299 | * |
| −−− | |||||
| Signif. codes: | ‘***’ 0.001 | ‘**’ 0.01 | ‘*’ 0.05 | ‘.’ 0.1 | ‘ ’ 1 |
Appendix B
| Estimate | Std. Error | l-95% CI | u-95% CI | Rhat | Bulk ESS | Tail ESS | |
|---|---|---|---|---|---|---|---|
| baseline | −2.463 | 3.638 | −9.658 | 4.671 | 1.001 | 3438 | 3764 |
| Anodal (AC) | −3.157 | 0.115 | −3.380 | −2.925 | 1.000 | 2128 | 3039 |
| Cathodal (CC) | −3.146 | 0.114 | −3.368 | −2.912 | 1.001 | 2138 | 2968 |
| SHAM-AC | −3.189 | 0.118 | −3.423 | −2.956 | 1.000 | 2204 | 2932 |
| SHAM-CC | −3.028 | 0.116 | −3.253 | −2.794 | 1.001 | 2081 | 3043 |
| 1 mA vs. 0 mA | 0.076 | 4.543 | −8.888 | 9.022 | 1.000 | 3560 | 3726 |
| 2 mA vs. 0 mA | 0.435 | 4.318 | −8.009 | 8.579 | 1.000 | 3394 | 3553 |
| 3 mA vs. 0 mA | −0.274 | 4.337 | −8.635 | 8.395 | 1.000 | 3142 | 3523 |
| Time | −0.003 | 0.001 | −0.005 | −0.002 | 1.000 | 4073 | 3580 |
| Right-side vs. Left- | 0.146 | 0.041 | 0.064 | 0.227 | 1.000 | 3899 | 3913 |
| AC vs. baseline: 1 mA | −0.071 | 4.543 | −9.004 | 8.854 | 1.000 | 3542 | 3663 |
| CC vs. baseline: 1 mA | −0.004 | 4.542 | −8.956 | 9.027 | 1.000 | 3562 | 3682 |
| SHAM-AC vs. baseline: 1 mA | −0.157 | 4.543 | −9.086 | 8.816 | 1.000 | 3555 | 3700 |
| SHAM-CC vs. baseline: 1 mA | −0.185 | 4.540 | −9.130 | 8.746 | 1.000 | 3545 | 3668 |
| AC vs. baseline: 2 mA | −0.358 | 4.318 | −8.493 | 8.080 | 1.000 | 3392 | 3520 |
| CC vs. baseline: 2 mA | −0.476 | 4.317 | −8.660 | 7.978 | 1.000 | 3398 | 3587 |
| SHAM-AC vs. baseline: 2 mA | −0.485 | 4.318 | −8.684 | 8.021 | 1.000 | 3392 | 3520 |
| SHAM-CC vs. baseline: 2 mA | −0.328 | 4.318 | −8.480 | 8.128 | 1.000 | 3392 | 3553 |
| AC vs. baseline: 3 mA | 0.214 | 4.337 | −8.458 | 8.524 | 1.000 | 3147 | 3537 |
| CC vs. baseline: 3 mA | 0.181 | 4.338 | −8.502 | 8.534 | 1.000 | 3143 | 3524 |
| SHAM-AC vs. baseline: 3 mA | 0.242 | 4.336 | −8.421 | 8.583 | 1.000 | 3146 | 3460 |
| SHAM-CC vs. baseline: 3 mA | 0.183 | 4.337 | −8.485 | 8.534 | 1.000 | 3146 | 3538 |
| Right-side vs. Left-: Time | 0.002 | 0.001 | 0.000 | 0.003 | 1.000 | 4098 | 3929 |
| — | |||||||
| shape parameter | 3.460 | 0.097 | 3.274 | 3.653 | 1.000 | 4261 | 4043 |
| — | |||||||
| sd(Intercept) | 0.473 | 0.084 | 0.346 | 0.673 | 1.000 | 3286 | 3929 |
References
- Campbell, B.C.; De Silva, D.A.; Macleod, M.R.; Coutts, S.B.; Schwamm, L.H.; Davis, S.M.; Donnan, G.A. Ischaemic stroke. Nat. Rev. Dis. Prim. 2019, 5, 1–22. [Google Scholar] [CrossRef] [PubMed]
- Capistrant, B.D.; Wang, Q.; Liu, S.Y.; Glymour, M.M. Stroke-associated differences in rates of activity of daily living loss emerge years before stroke onset. J. Am. Geriatr. Soc. 2013, 61, 931–938. [Google Scholar] [CrossRef] [PubMed]
- Mizuta, N.; Hasui, N.; Nakatani, T.; Takamura, Y.; Fujii, S.; Tsutsumi, M.; Taguchi, J.; Morioka, S. Walking characteristics including mild motor paralysis and slow walking speed in post-stroke patients. Sci. Rep. 2020, 10, 1–10. [Google Scholar] [CrossRef] [PubMed]
- Barra, J.; Oujamaa, L.; Chauvineau, V.; Rougier, P.; Pérennou, D. Asymmetric standing posture after stroke is related to a biased egocentric coordinate system. Neurology 2009, 72, 1582–1587. [Google Scholar] [CrossRef]
- Bonan, I.; Leman, M.; Legargasson, J.; Guichard, J.; Yelnik, A. Evolution of subjective visual vertical perturbation after stroke. Neurorehabilit. Neural Repair 2006, 20, 484–491. [Google Scholar] [CrossRef]
- Piscicelli, C.; Perennou, D. Visual verticality perception after stroke: A systematic review of methodological approaches and suggestions for standardization. Ann. Phys. Rehabil. Med. 2017, 60, 208–216. [Google Scholar] [CrossRef]
- Pérennou, D. Postural disorders and spatial neglect in stroke patients: A strong association. Restor. Neurol. Neurosci. 2006, 24, 319–334. [Google Scholar]
- Baggio, J.A.; Mazin, S.S.; Alessio-Alves, F.F.; Barros, C.G.; Carneiro, A.A.; Leite, J.P.; Pontes-Neto, O.M.; Santos-Pontelli, T.E. Verticality perceptions associate with postural control and functionality in stroke patients. PLoS ONE 2016, 11, e0150754. [Google Scholar] [CrossRef] [Green Version]
- Kheradmand, A.; Winnick, A. Perception of upright: Multisensory convergence and the role of temporo-parietal cortex. Front. Neurol. 2017, 8, 552. [Google Scholar] [CrossRef]
- Rossi, S.; Hallett, M.; Rossini, P.M.; Pascual-Leone, A.; Safety of TMS Consensus Group. Safety, ethical considerations, and application guidelines for the use of transcranial magnetic stimulation in clinical practice and research. Clin. Neurophysiol. 2009, 120, 2008–2039. [Google Scholar] [CrossRef] [Green Version]
- Santos-Pontelli, T.E.; Rimoli, B.P.; Favoretto, D.B.; Mazin, S.C.; Truong, D.Q.; Leite, J.P.; Pontes-Neto, O.M.; Babyar, S.R.; Reding, M.; Bikson, M.; et al. Polarity-dependent misperception of subjective visual vertical during and after transcranial direct current stimulation (tDCS). PLoS ONE 2016, 11, e0152331. [Google Scholar] [CrossRef] [PubMed]
- Santos, T.E.; Favoretto, D.B.; Toostani, I.G.; Nascimento, D.C.; Rimoli, B.P.; Bergonzoni, E.; Lemos, T.W.; Truong, D.Q.; Delbem, A.C.; Makkiabadi, B.; et al. Manipulation of human verticality using high-definition transcranial direct current stimulation. Front. Neurol. 2018, 9, 825. [Google Scholar] [CrossRef] [PubMed] [Green Version]
- Baier, B.; Suchan, J.; Karnath, H.O.; Dieterich, M. Neural correlates of disturbed perception of verticality. Neurology 2012, 78, 728–735. [Google Scholar] [CrossRef] [PubMed]
- Nascimento, D.C.; Depetri, G.; Stefano, L.H.; Anacleto, O.; Leite, J.P.; Edwards, D.J.; Santos, T.E.; Louzada Neto, F. Entropy analysis of high-definition transcranial electric stimulation effects on eeg dynamics. Brain Sci. 2019, 9, 208. [Google Scholar] [CrossRef] [Green Version]
- Vicente, R.; Wibral, M.; Lindner, M.; Pipa, G. Transfer entropy—A model-free measure of effective connectivity for the neurosciences. J. Comput. Neurosci. 2011, 30, 45–67. [Google Scholar] [CrossRef] [Green Version]
- Pincus, S.M. Approximate entropy as a measure of system complexity. Proc. Natl. Acad. Sci. USA 1991, 88, 2297–2301. [Google Scholar] [CrossRef] [Green Version]
- Richman, J.S.; Moorman, J.R. Physiological time-series analysis using approximate entropy and sample entropy. Am. J. Physiol.-Heart Circ. Physiol. 2000, 278, H2039–H2049. [Google Scholar] [CrossRef] [Green Version]
- Fonteneau, C.; Mondino, M.; Arns, M.; Baeken, C.; Bikson, M.; Brunoni, A.R.; Burke, M.J.; Neuvonen, T.; Padberg, F.; Pascual-Leone, A.; et al. Sham tDCS: A hidden source of variability? Reflections for further blinded, controlled trials. Brain Stimul. 2019, 12, 668–673. [Google Scholar] [CrossRef]
- Bossomaier, T.; Barnett, L.; Harré, M.; Lizier, J.T. Transfer entropy. In An Introduction to Transfer Entropy; Springer: Berlin/Heidelberg, Germany, 2016; pp. 65–95. [Google Scholar]
- Aziz, N.A. Transfer entropy as a tool for inferring causality from observational studies in epidemiology. bioRxiv 2017, 149625. [Google Scholar]
- R Core Team. R: A Language and Environment for Statistical Computing; R Foundation for Statistical Computing: Vienna, Austria, 2019. [Google Scholar]
- Mann, H.B.; Whitney, D.R. On a test of whether one of two random variables is stochastically larger than the other. Ann. Math. Stat. 1947, 18, 50–60. [Google Scholar] [CrossRef]
- Wilcoxon, F. Individual Comparisons by Ranking Methods. Biom. Bull. 1945, 1, 80–83. [Google Scholar] [CrossRef]
- Biabani, M.; Farrell, M.; Zoghi, M.; Egan, G.; Jaberzadeh, S. Crossover design in transcranial direct current stimulation studies on motor learning: Potential pitfalls and difficulties in interpretation of findings. Rev. Neurosci. 2018, 29, 463–473. [Google Scholar] [CrossRef] [PubMed]
- Leshikar, E.D.; Leach, R.C.; McCurdy, M.P.; Trumbo, M.C.; Sklenar, A.M.; Frankenstein, A.N.; Matzen, L.E. Transcranial direct current stimulation of dorsolateral prefrontal cortex during encoding improves recall but not recognition memory. Neuropsychologia 2017, 106, 390–397. [Google Scholar] [CrossRef] [PubMed]
- Long, J.A. Jtools: Analysis and Presentation of Social Scientific Data, 2020. R Package Version 2.1.0. Available online: https://cran.r-project.org/web/packages/jtools/index.html (accessed on 30 November 2021).
- Genthon, N.; Rougier, P. Influence of an asymmetrical body weight distribution on the control of undisturbed upright stance. J. Biomech. 2005, 38, 2037–2049. [Google Scholar] [CrossRef] [PubMed]
- Anker, L.C.; Weerdesteyn, V.; van Nes, I.J.; Nienhuis, B.; Straatman, H.; Geurts, A.C. The relation between postural stability and weight distribution in healthy subjects. Gait Posture 2008, 27, 471–477. [Google Scholar] [CrossRef] [PubMed]
- Kamphuis, J.F.; de Kam, D.; Geurts, A.C.; Weerdesteyn, V. Is weight-bearing asymmetry associated with postural instability after stroke? A systematic review. Stroke Res. Treat. 2013, 2013, 692137. [Google Scholar] [CrossRef] [PubMed]
- Marigold, D.S.; Eng, J.J.; Tokuno, C.D.; Donnelly, C.A. Contribution of muscle strength and integration of afferent input to postural instability in persons with stroke. Neurorehabilt. Neural Repair 2004, 18, 222–229. [Google Scholar] [CrossRef] [Green Version]
- Marigold, D.S.; Eng, J.J. The relationship of asymmetric weight-bearing with postural sway and visual reliance in stroke. Gait Posture 2006, 23, 249–255. [Google Scholar] [CrossRef] [Green Version]
- Mansfield, A.; Danells, C.J.; Inness, E.; Mochizuki, G.; McIlroy, W.E. Between-limb synchronization for control of standing balance in individuals with stroke. Clin. Biomech. 2011, 26, 312–317. [Google Scholar] [CrossRef] [Green Version]
- Skarda, C.A.; Freeman, W.J. How brains make chaos in order to make sense of the world. Behav. Brain Sci. 1987, 10, 161–173. [Google Scholar] [CrossRef] [Green Version]
- Huang, Y.; Holzel, R.; Pethig, R.; Wang, X.B. Differences in the AC electrodynamics of viable and non-viable yeast cells determined through combined dielectrophoresis and electrorotation studies. Phys. Med. Biol. 1992, 37, 1499–1517. [Google Scholar] [CrossRef] [PubMed]
- Chialvo, D.R.; Gilmour, R.F., Jr.; Jalife, J. Low dimensional chaos in cardiac tissue. Nature 1990, 343, 653–657. [Google Scholar] [CrossRef] [PubMed]
- Stein, K.M.; Walden, J.; Lippman, N.; Lerman, B.B. Ventricular response in atrial fibrillation: Random or deterministic? Am. J. Physiol.-Heart Circ. Physiol. 1999, 277, H452–H458. [Google Scholar] [CrossRef] [PubMed]
- Carroll, J.P.; Freedman, W. Nonstationary properties of postural sway. J. Biomech. 1993, 26, 409–416. [Google Scholar] [CrossRef]
- Collins, J.J.; Luca, C.J.D. Open-loop and closed-loop control of posture: A random-walk analysis of center-of-pressure trajectories. Exp. Brain Res. 1993, 95, 308–318. [Google Scholar] [CrossRef]
- Duarte, M.; Zatsiorsky, V.M. On the fractal properties of natural human standing. Neurosci. Lett. 2000, 283, 173–176. [Google Scholar] [CrossRef]
- Gagey, P.M.; Martinerie, J.; Pezard, L.; Benaim, C. L’équilibre Statique Est Contrôlé par un Système Dynamique Non-Linéaire. 1998. Available online: http://ada-posturologie.fr/L'equilibrestatique1998.pdf (accessed on 28 February 2022).
- Kerk, J.; Snyder, A.C.; Schot, P.K.; Myklebust, B.M.; Prieto, T.; Myklebust, J.; O’Hagan, K.P.; Clifford, P.S. The Effect of an Abdominal Binder on the Exercise Response of Paraplegic Wheelchair Athletes: 188. Med. Sci. Sport. Exerc. 1992, 24, S32. [Google Scholar] [CrossRef]
- Oie, K.S.; Kiemel, T.; Jeka, J.J. Human multisensory fusion of vision and touch: Detecting non-linearity with small changes in the sensory environment. Neurosci. Lett. 2001, 315, 113–116. [Google Scholar] [CrossRef]
- Fino, P.C.; Mojdehi, A.R.; Adjerid, K.; Habibi, M.; Lockhart, T.E.; Ross, S.D. Comparing Postural Stability Entropy Analyses to Differentiate Fallers and Non-fallers. Ann. Biomed. Eng. 2015, 44, 1636–1645. [Google Scholar] [CrossRef]
- Donker, S.F.; Roerdink, M.; Greven, A.J.; Beek, P.J. Regularity of center-of-pressure trajectories depends on the amount of attention invested in postural control. Exp. Brain Res. 2007, 181, 1–11. [Google Scholar] [CrossRef] [Green Version]
- Kędziorek, J.; Błażkiewicz, M. Nonlinear Measures to Evaluate Upright Postural Stability: A Systematic Review. Entropy 2020, 22, 1357. [Google Scholar] [CrossRef] [PubMed]
- Lipsitz, L.A. Dynamics of stability: The physiologic basis of functional health and frailty. J. Gerontol. A Biol. Sci. Med. Sci. 2002, 57, B115–B125. [Google Scholar] [CrossRef] [PubMed] [Green Version]
- Lipsitz, L.A.; Goldberger, A.L.; Goldberger, A.L. Loss of ‘complexity’ and aging. Potential applications of fractals and chaos theory to senescence. Jama 1992, 267, 1806–1809. [Google Scholar] [CrossRef]
- Busa, M.A.; van Emmerik, R.E.A. Multiscale entropy: A tool for understanding the complexity of postural control. J. Sport Health Sci. 2016, 5, 44–51. [Google Scholar] [CrossRef] [PubMed] [Green Version]
- Louzada, F.; Nascimento, D.C.d.; Egbon, O.A. Spatial Statistical Models: An Overview under the Bayesian Approach. Axioms 2021, 10, 307. [Google Scholar] [CrossRef]
- Paillard, T.; Noé, F. Techniques and methods for testing the postural function in healthy and pathological subjects. BioMed Res. Int. 2015, 2015, 891390. [Google Scholar] [CrossRef] [PubMed] [Green Version]
- Bürkner, P.C. brms: An R package for Bayesian multilevel models using Stan. J. Stat. Softw. 2017, 80, 1–28. [Google Scholar] [CrossRef] [Green Version]
- R Core Team. R: A Language and Environment for Statistical Computing; R Foundation for Statistical Computing: Vienna, Austria, 2021. [Google Scholar]
- Team, S.D. Stan modeling language users guide and reference manual. Version 2.12. Tech. Rep. 2016. [Google Scholar]


| Stimuli Moment | Sham-Anodal | Sham-Cathodal | |
|---|---|---|---|
| Median [Range] | Median [Range] | ||
| PRE or POST (OFF) | 0.0397 [0.02, 0.10] | 0.0438 [0.02, 0.10] | |
| Right → Left | 1 mA (ON) | 0.0314 [0.01, 0.10] | 0.0429 [0.01, 0.13] |
| 2 mA (ON) | 0.0433 [0.02, 0.12] | 0.052 [0.01, 0.10] | |
| 3 mA (ON) | 0.0373 [0.02, 0.10] | 0.0481 [0.01, 0.09] | |
| PRE or POST (OFF) | 0.0266 [0.01, 0.12] | 0.0396 [0.01, 0.12] | |
| Left → Right | 1 mA (ON) | 0.0225 [0.01, 0.13] | 0.0393 [0.00, 0.16] |
| 2 mA (ON) | 0.0205 [0.01, 0.15] | 0.0667 [0.01, 0.13] | |
| 3 mA (ON) | 0.0206 [0.01, 0.11] | 0.0469 [0.00, 0.11] |
| p-Value | ||
|---|---|---|
| Stimuli Moment | Left-Side | Right-Side |
| PRE or POST (OFF) | 0.529 | 0.505 |
| 1 mA (ON) | 0.791 | 0.375 |
| 2 mA (ON) | 0.099 | 0.214 |
| 3 mA (ON) | 0.255 | 0.408 |
Publisher’s Note: MDPI stays neutral with regard to jurisdictional claims in published maps and institutional affiliations. |
© 2022 by the authors. Licensee MDPI, Basel, Switzerland. This article is an open access article distributed under the terms and conditions of the Creative Commons Attribution (CC BY) license (https://creativecommons.org/licenses/by/4.0/).
Share and Cite
Favoretto, D.B.; Bergonzoni, E.; Nascimento, D.C.; Louzada, F.; Lemos, T.W.; Batistela, R.A.; Moraes, R.; Leite, J.P.; Rimoli, B.P.; Edwards, D.J.; et al. High Definition tDCS Effect on Postural Control in Healthy Individuals: Entropy Analysis of a Crossover Clinical Trial. Appl. Sci. 2022, 12, 2703. https://doi.org/10.3390/app12052703
Favoretto DB, Bergonzoni E, Nascimento DC, Louzada F, Lemos TW, Batistela RA, Moraes R, Leite JP, Rimoli BP, Edwards DJ, et al. High Definition tDCS Effect on Postural Control in Healthy Individuals: Entropy Analysis of a Crossover Clinical Trial. Applied Sciences. 2022; 12(5):2703. https://doi.org/10.3390/app12052703
Chicago/Turabian StyleFavoretto, Diandra B., Eduardo Bergonzoni, Diego Carvalho Nascimento, Francisco Louzada, Tenysson W. Lemos, Rosangela A. Batistela, Renato Moraes, João P. Leite, Brunna P. Rimoli, Dylan J. Edwards, and et al. 2022. "High Definition tDCS Effect on Postural Control in Healthy Individuals: Entropy Analysis of a Crossover Clinical Trial" Applied Sciences 12, no. 5: 2703. https://doi.org/10.3390/app12052703