Article

Characterizing Micro-Displacements on Active Faults in the Gobi Desert with Time-Series InSAR

1
Department of Civil and Environmental Engineering, Imperial College London, London SW7 2BX, UK
2
Department of Earth Sciences, Royal Holloway, University of London, London SW7 2BX, UK
3
Department of Earth Science and Engineering, Imperial College London, London SW7 2BX, UK
4
Geotechnical Consulting Group, 52A Cromwell Road, London SW7 5BE, UK
*
Authors to whom correspondence should be addressed.
Appl. Sci. 2022, 12(9), 4222; https://doi.org/10.3390/app12094222
Submission received: 18 February 2022 / Revised: 10 April 2022 / Accepted: 15 April 2022 / Published: 22 April 2022
(This article belongs to the Special Issue Advances in Ground Deformation Monitoring)

Abstract

:
This research investigates small-scale tectonic activity in the Jiujing region in Beishan, northwest China through the application of persistent scatterer (PS) Interferometric synthetic aperture radar (InSAR). PS InSAR is an effective monitoring tool in this unpopulated, arid, and unvegetated rural area, whose surface geology is dominated by a single large granitic intrusion, and which represents a candidate site for a geological disposal facility (GDF) for high-level radioactive waste (HLW) in China. This research demonstrates that faults F16-2, F17, F18, and F20-2 are still active, producing dip-slip motions along the fault planes. The lithological variations in weathering and erosion can be discounted as the cause for these small-scale displacement variations. The work has also identified 11 previously unknown faults, characterising them from vertical (DU) and eastward horizontal (DE) displacements along and across the faults. These newly discovered structures demonstrate how PS InSAR can be used to monitor and measure micro-scale movements on regional-scale faults, which, in many cases, were previously considered to be inactive. Thus, this also improves our understanding of local stress regimes in this area. The Jiujing region is part of a convergent fault zone dominated by NE-SW compression, leading to NE-SW crustal shortening and NW-SE elongation. Through determination of the sense of ground movement measured at irregularly distributed PS points, some faults are reverse and trending NW-SE, while others are normal and trending NE-SW, highlighting how InSAR can be used to resolve fault type and relative movements to monitor tectonic fault blocks at a regional scale.

1. Introduction

Beishan lies in northwest China and is strategically important for nuclear safety, as it is a potential site for a geological disposal facility (GDF) to permanently isolate and dispose of high-level radioactive waste (HLW) by burial in an engineered underground facility in the local granite region. The Jiujing granite region at Beishan was chosen for investigation through the application of the persistent scatterer Interferometric synthetic aperture radar technique (PSI). This area is dominated by the Gobi Desert and by several large, east-west elongated granite plutons including Jiujing, Xinchang, Jijicao, Yemaquan, Suanjingzi, and Shazaoyuan. A detailed understanding of the local structural geology is essential and is achieved by identifying, mapping, quantifying, and characterising the active faults.
The term ‘wrench fault’ refers to a high angle strike-slip fault of great linear extent, which formed in response to horizontal pure shear [1]. Such faults are characterised by the attributes of lateral-slip evidence, steep fault plane, and complex deformation zones of subsidiary faults, and they often occur in regional-scale basement rocks. The collision between the Eurasian and Indian Plates along the Himalayan Mountain belt has resulted in prominent compressional wrench faulting in the Jiujing region of northwest China [2].
Active faults are frequently detected with differential InSAR (DInSAR), if the displacement is sudden or significant, or with time-series InSAR techniques such as PSI, if displacements are small or slowly developing. The details will be explained in Section 3.2. Chronologically, the following are a series of studies investigating the tectonic faults through time-series InSAR techniques. Parcharidis [3] first detected the differences in ground subsidence over the Rio−Antirio area in Western Greece and suggested that the subsidence rates at Rio (−1.8 to −6.2 mm a−1) were much higher than those at Antirio (−2.0 mm a−1 or less). It is suggested that subsidence was mainly attributed to the presence of active faults in the centre, with Rio located in the hanging wall side of the fault zone. Then, Liu [4] monitored the crustal deformation in the L’Aquila area in central Italy based on deformation gradients and identified that most active faults were NW-SE striking and dipped to the SW. After that, Champenois [5] observed the interseismic deformation along the Longitudinal Valley Fault (LVF) in Eastern Taiwan, China and found that there was a clear velocity discontinuity along the fault, with a 3 mm a−1 velocity offset due to shallow interseismic creep. This improved the mapping of local active tectonic structures. At the same time, Cigna [6] measured a 10 mm a−1 average velocity difference between the hanging wall and footwall sides of the Central Camionera Fault and a maximum land subsidence around 7–8 mm a−1 in Morelia, Mexico. However, it was concluded that this was the result of groundwater overexploitation rather than tectonic fault activity, where the fault planes in Morelia only acted as a barrier to the horizontal migration of groundwater. Two years later in 2014, Yang [7] investigated the impacts of groundwater exploitation and fault activity on ground subsidence in Datong Basin, China, using the small baseline subset (SBAS) method, and measured a 6 mm a−1 subsidence difference between the two sides of F8 ground fissure, indicating the local ground subsidence was controlled by the Kou-Quan and Datong-Yanggao Faults and surrounding fissures. In a different study [8], the ground deformation in Taiyuan Basin was also investigated, and it was suggested that the local subsidence was also a result of fault activity. Further, Cetin [9] mapped and deduced the velocity field along the North Anatolian Fault (NAF) at Ismetpas in Turkey and found a maximum creep rate of ca 20 mm a−1 in 2014; subsequently, Mason [10] revealed there were systematic patterns of both vertical and horizontal ground displacement across London, UK, which appeared to be fault-constrained and in agreement with the predicted tectonic structures in Southern Britain. Finally, Deffontaines [11] located and quantified the activity of Hengchun Fault through the superimposition of the structural sketch map with PSI results and confirmed the Hengchun Fault as an active left lateral transpressive fault; meanwhile, in 2019, Hu [12] reported that East Beijing is subsiding with a maximum rate of 140 mm a−1 due to the overextraction of groundwater, but this subsidence is spatially controlled by the geological faults, such as Nankou-Sunhe (F4) and Shunyi-Liangxiang (F7), to some degree, showing a correlation between uneven subsidence and fault distribution. Aside from tectonic activity, the PSI method has also been widely applied to investigate human-induced surface deformation, such as the surface subsidence caused by the construction of Lee Tunnel in London [13], the urban subsidence in Yangon, Myanmar due to groundwater extraction and overlaying building loads [14], and the surface deformation in Ha Long and Cam Pha, Vietnam triggered by the underground coal mining exploitation [15].
Based on previous studies, this research focuses on the Jiujing region as a case study and aims to develop a new application approach to identify, map, and characterise the micro-displacements along active faults through the combination of vertical (DU) and horizontal (DE) deformation data reprocessed by the PS method. This paper first presents an investigation of known faults and tracing of unmapped faults in Section 4.2, then discusses the kinematics of convergent wrench fault zone deformation in northwest China in Section 4.3, and finally assesses the factors that may affect Sentinel-1 data in Section 4.4. Overall, this study develops a new approach for future geological mapping work in geologically quiescent intraplate regions.

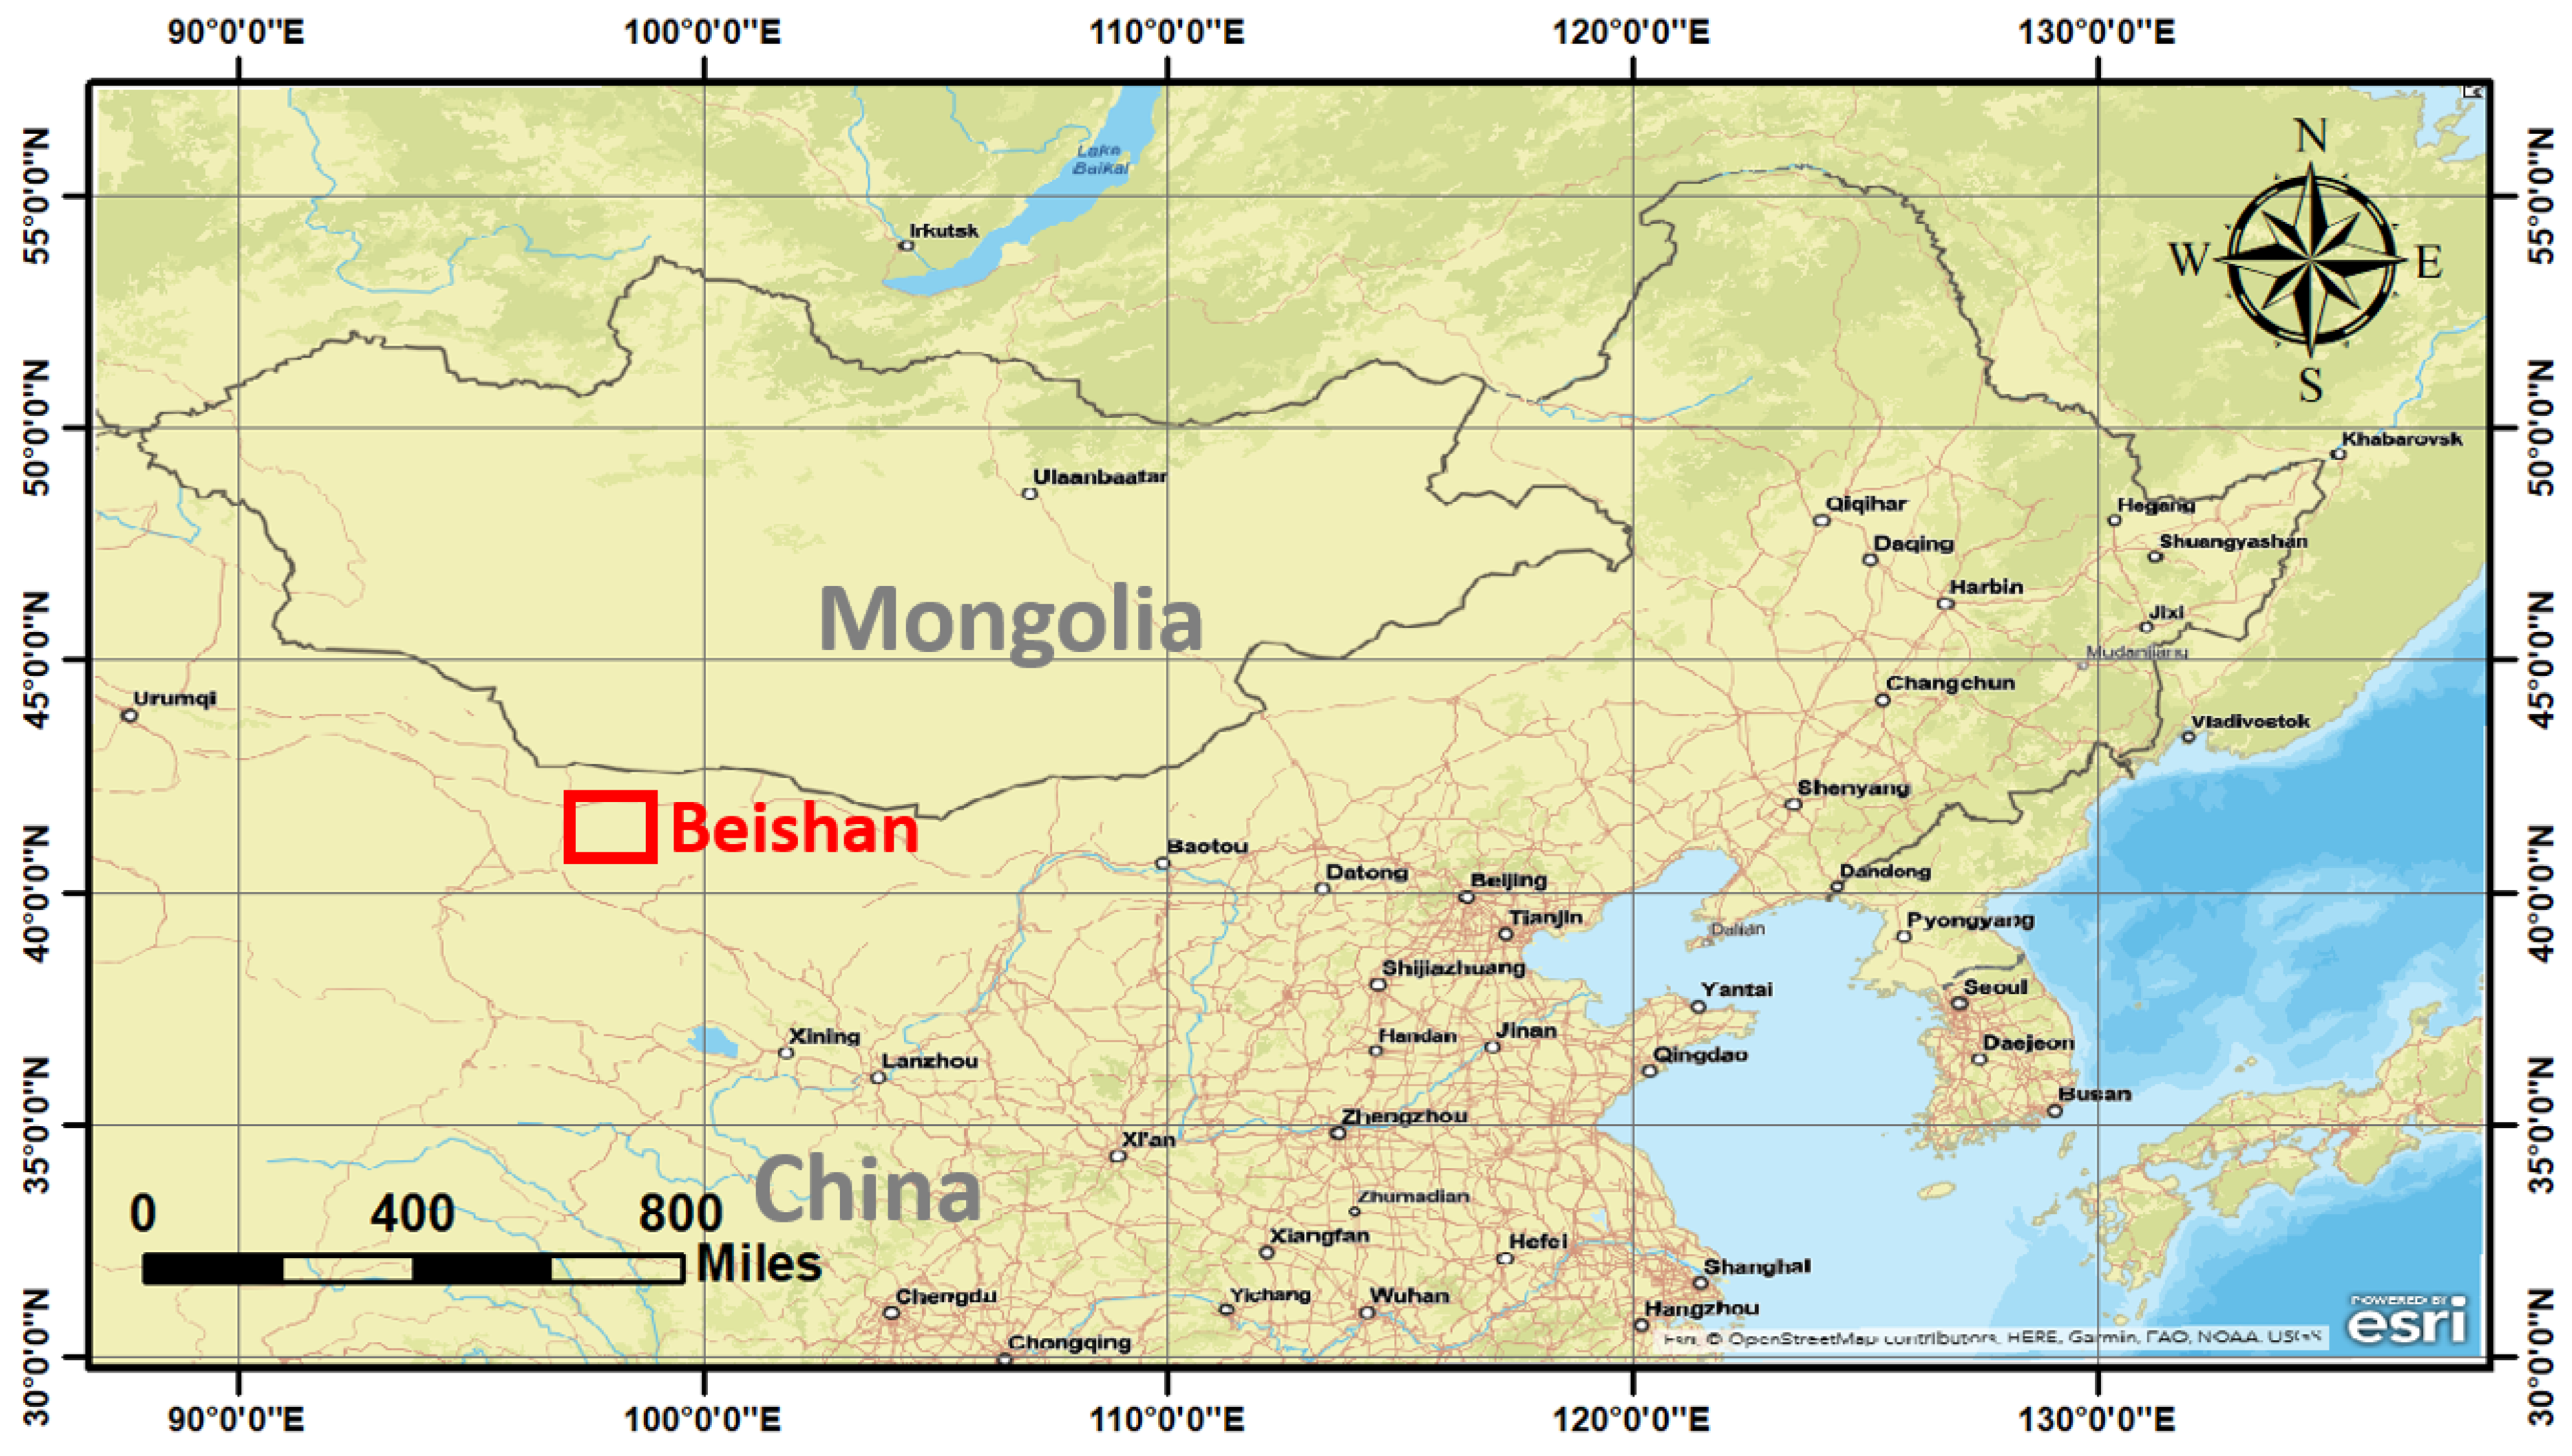
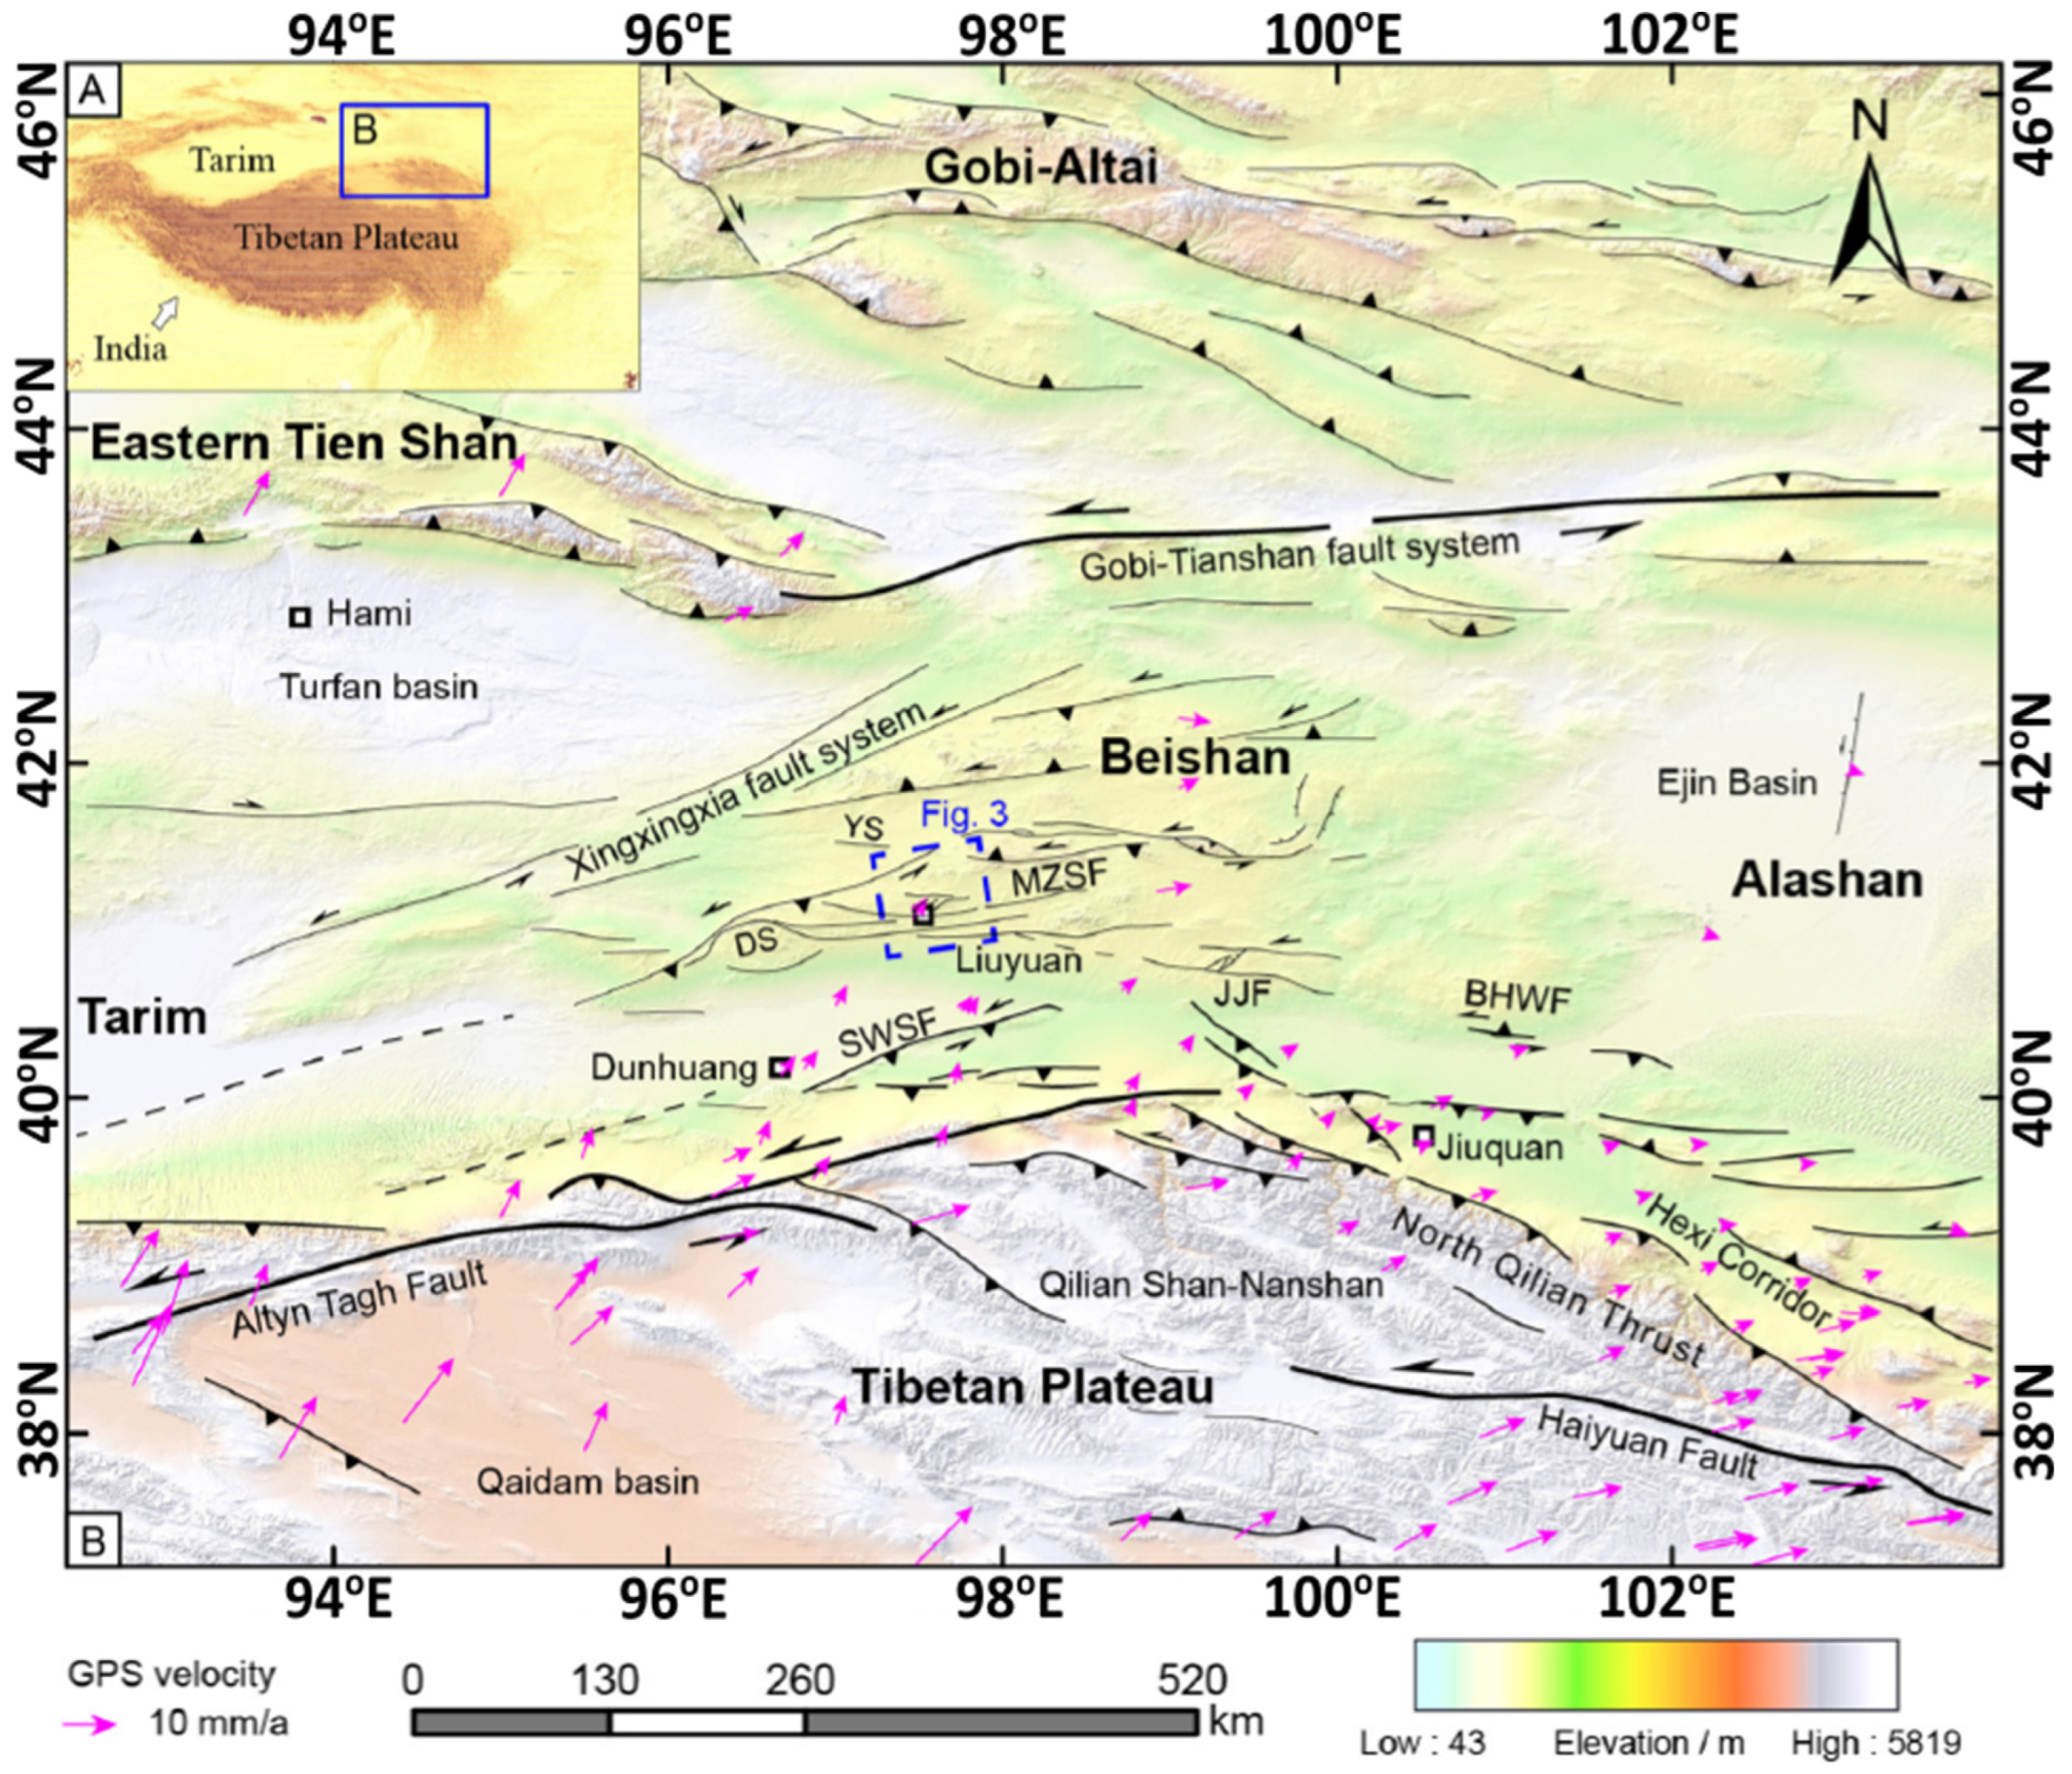
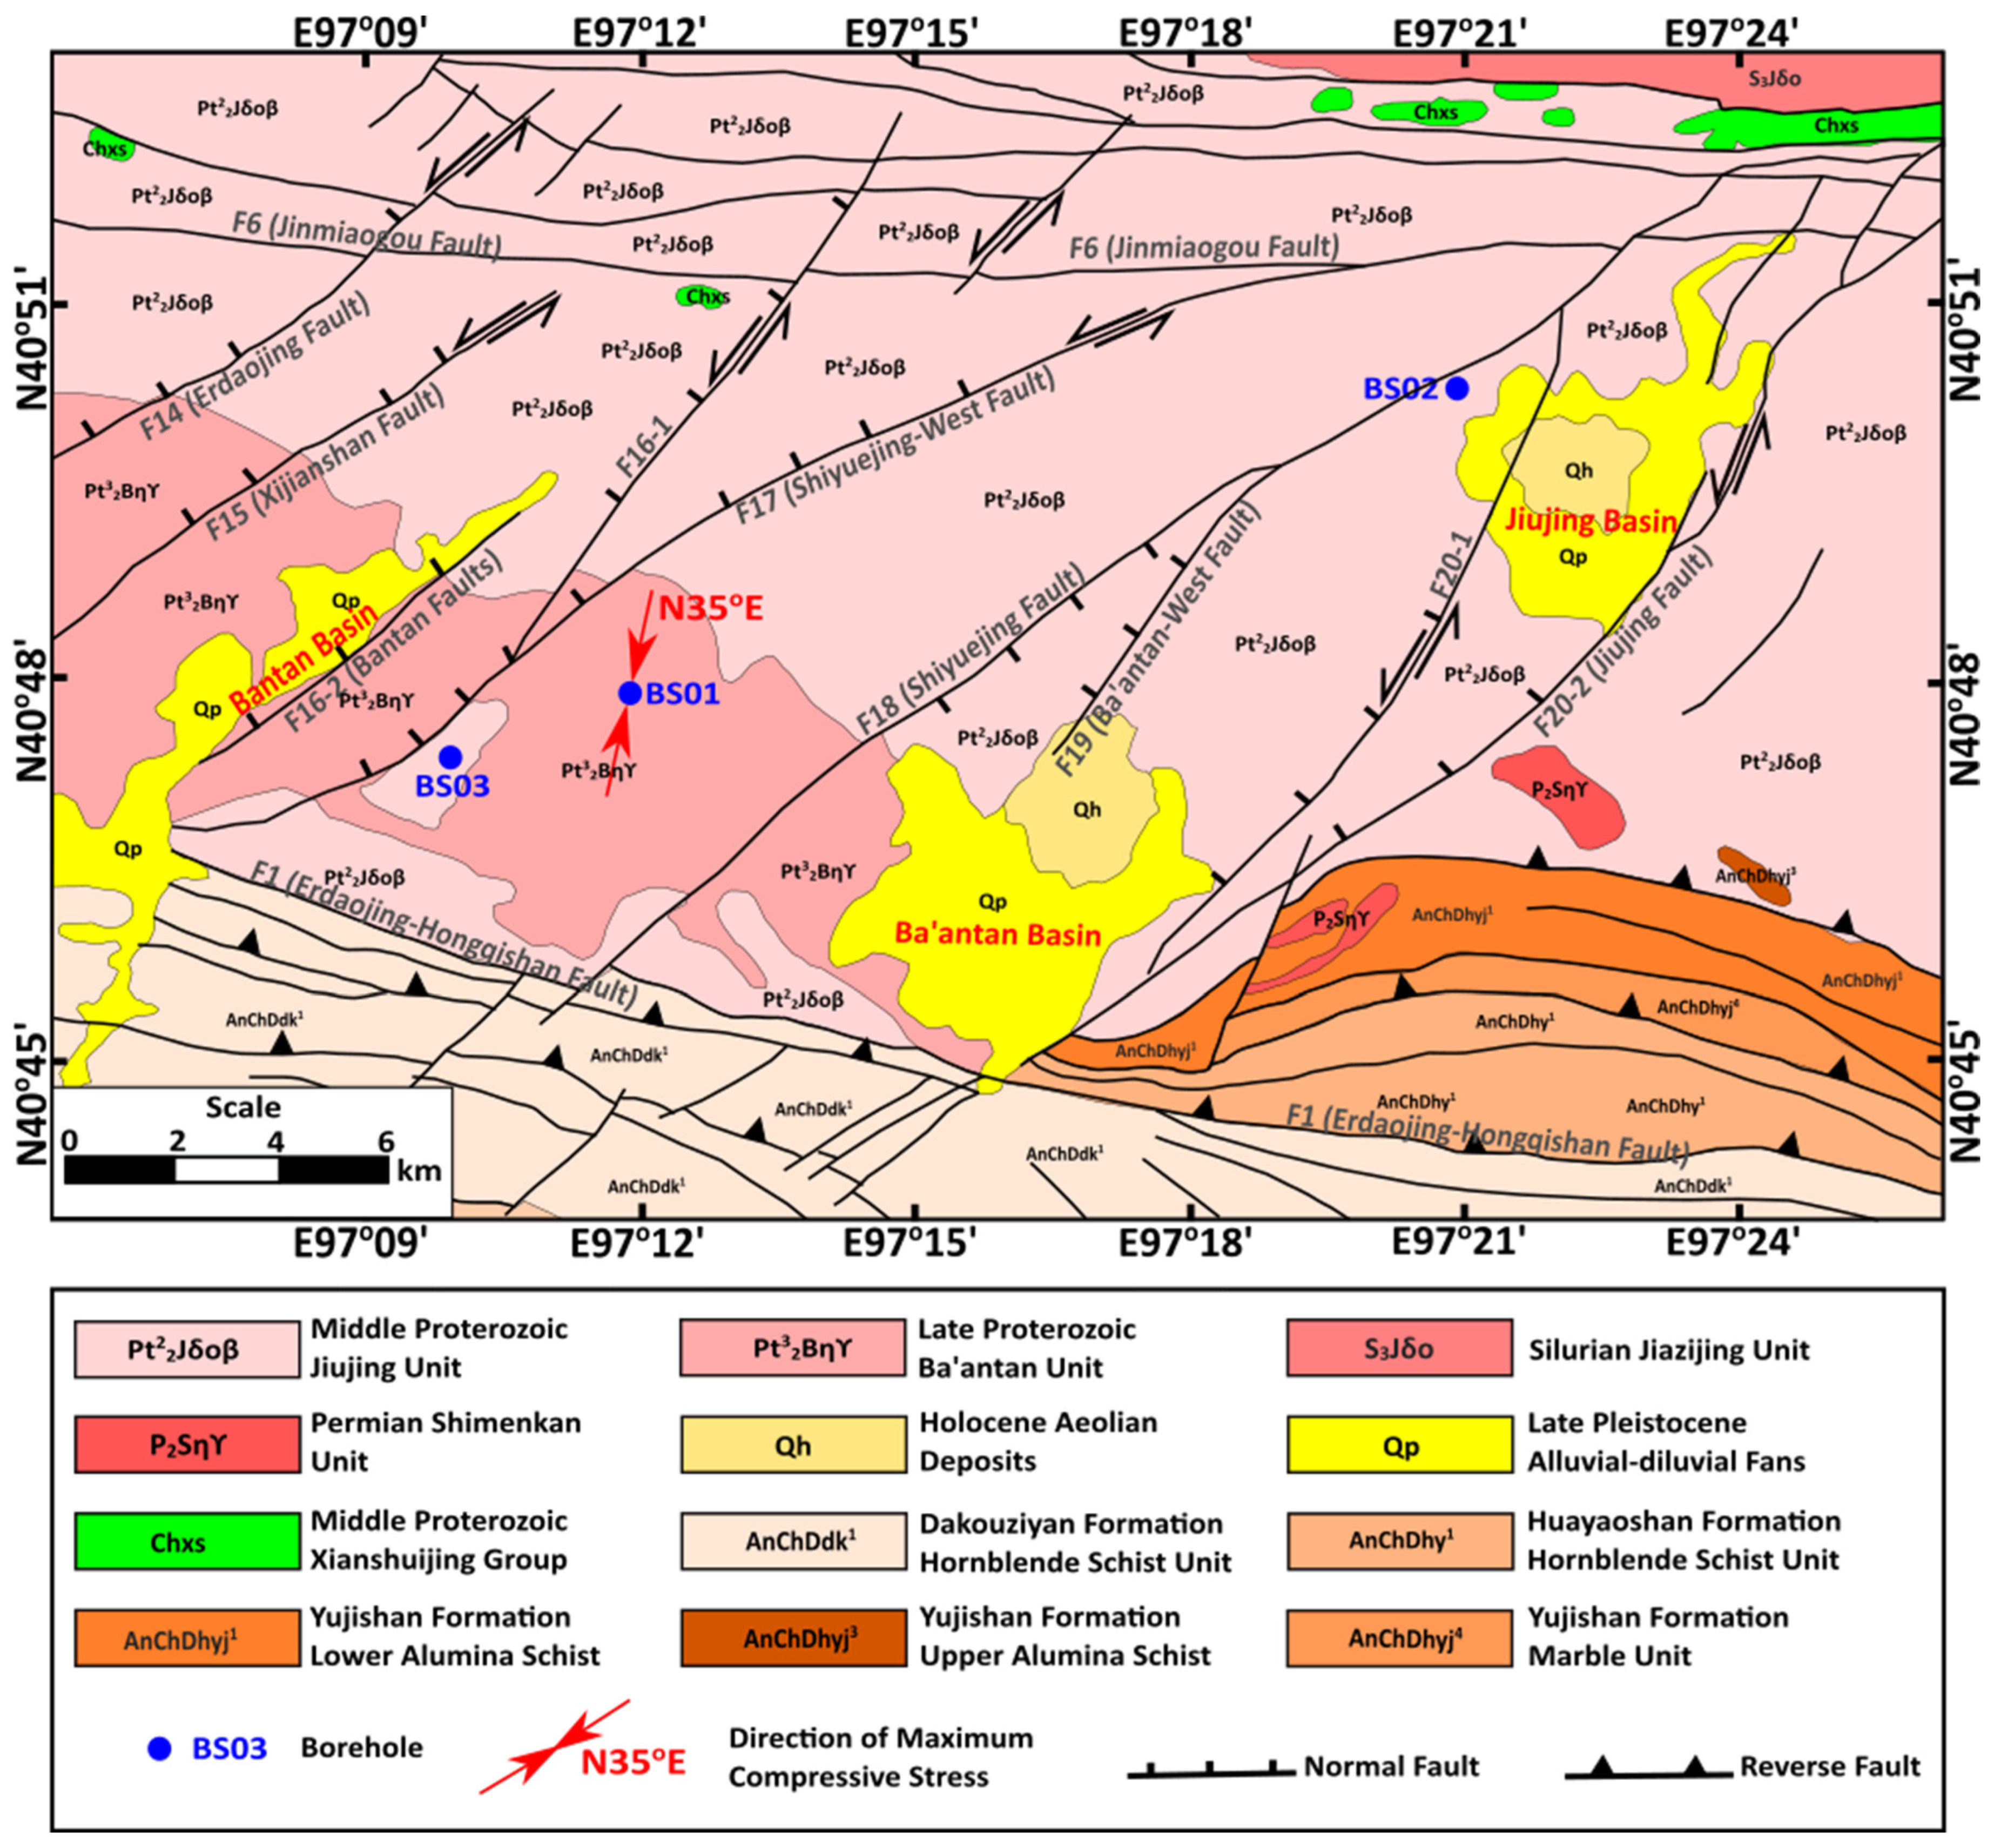
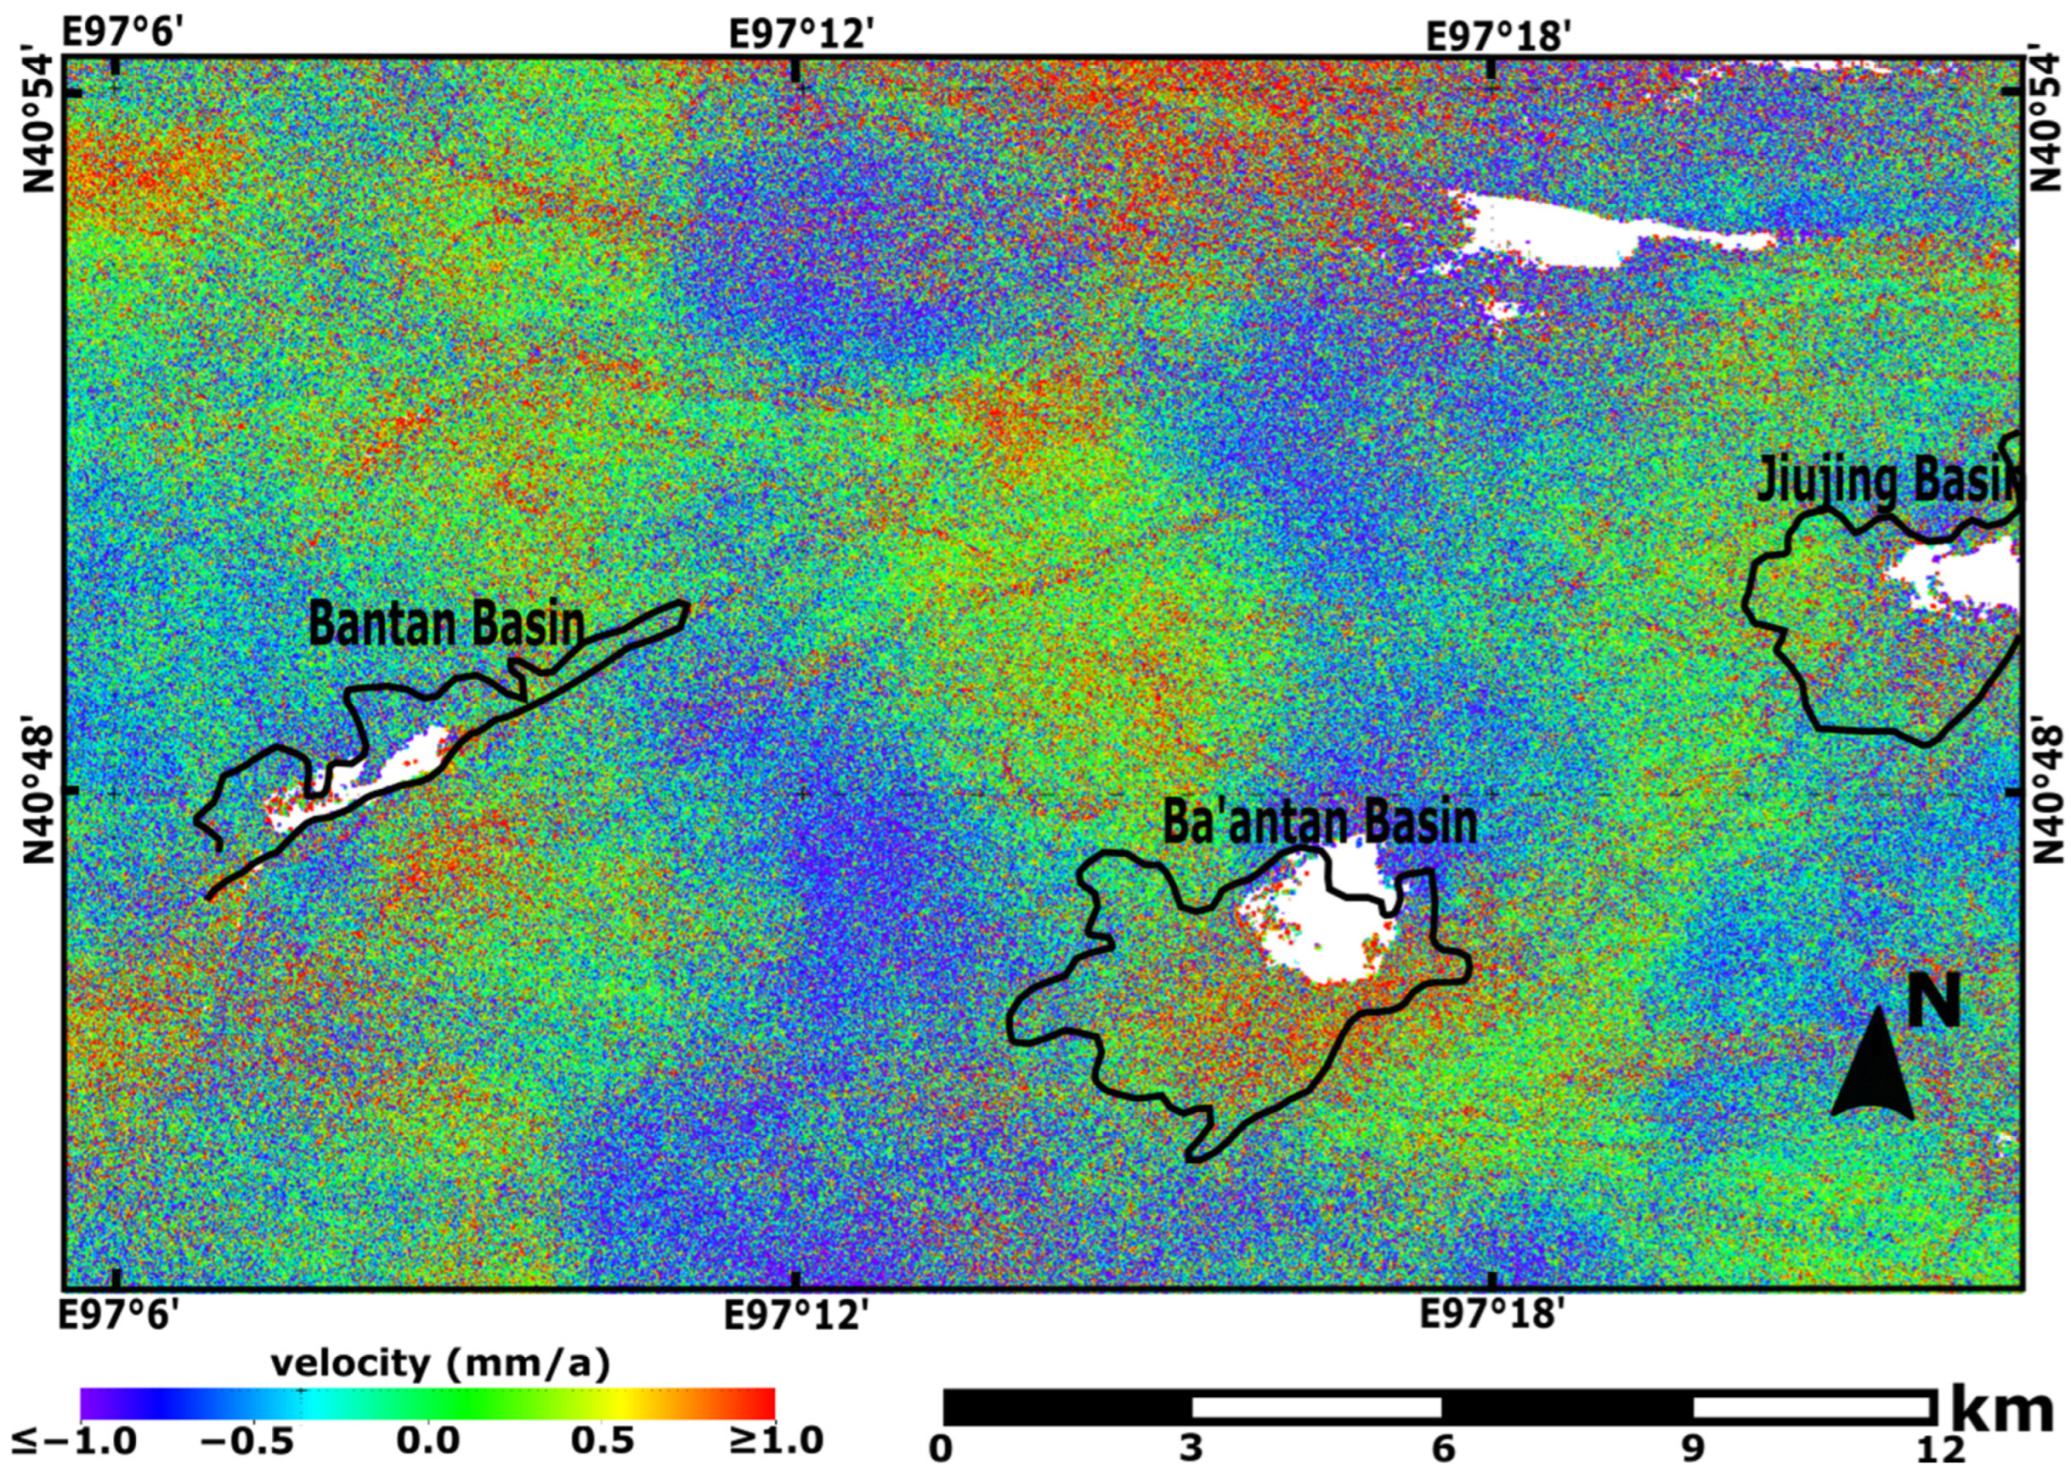
2. Study Area and Geological Setting

Beishan lies in northwest Gansu Province in China (Figure 1 and Figure 2), within 40°00′ to 42°00′N and 96°40′ to 98°40′E and covering an area of more than 12,000 km2 (Figure 3). The area has a semiarid climate, where average annual evaporation significantly exceeds precipitation (average precipitation for Gansu is 37–734 mm pa). The dry climate produces ephemeral rivers and very limited vegetation growth, with the Gobi landscape characterised by flat plains and small hills with an elevation between 1400 m and 2000 m above sea level [16,17].
Tectonically, Beishan is part of Tarim Basin, northeast of the Aerjin Fault system, and it has an annual uplift rate of 0.6–0.8 mm a−1 [18]. The Aerjin Fault system (Altyn Tagh Fault, Figure 2) is a strike-slip fault zone that has been active since the early Cenozoic era but, due to the buffer impact of the Qilian Mountains, which absorb most of the energy generated by the fault zone, Beishan has been described as “the most stable region within the active zone” [19]. This is the reason for the preselection of this region as a potential HLW repository. The regional in situ stress analyses indicate that the maximum horizontal stress is oriented NE-SW, explaining the NW-SE trend of the reverse faults in Figure 2.
Tectonic processes are the most significant factors contributing to the elevation differences within the rock sections of the area. This is mainly driven by a compressive stress field in the NE-SW direction. Based on the in-situ stress measurements at borehole BS01, the orientation of the average maximum compressive stress is N35°E, as shown in Figure 3, but it is understood to vary with depth [20,23]. The horizontal stress orientation is governed by the tectonic movements [24], with trends of maximum horizontal compression reflected in the displacement direction of the shifting granite regions.
There are two groups of faults that divide the Jiujing region into rhombus-shaped blocks, as shown in Figure 3. The first group is a set of northeast-trending (around 50°N) oblique-slip faults with clear sinistral shearing properties, which includes Erdaojing Fault (F14), Xijianshan Fault (F15), Bantan Faults (F16-1, F16-2), Shiyuejing-West Fault (F17), Shiyuejing Fault (F18), Ba’antan-West Fault (F19), and Jiujing Faults (F20-1 and F20-2), which were most active in the late Pleistocene era (126,000–12,000 years ago) [16,18,25,26]. The second group includes Erdaojing-Hongqishan Fault (F1) and Jinmiaogou Fault (F6). These two east-west-trending fault zones control the south and north boundaries of the Jiujing region, respectively, and are widely considered to be south-dipping reverse faults [16,18,21,24] (Table 1). Due to the complex structural geology along the fault zone, the characteristics of these two faults are unclear.
The Jiujing granite region can be divided into four units, which are Jiujing (middle Proterozoic), Bantan (middle Proterozoic), Jiazijing (Silurian), and Shimenkan (Permian) [29]. The Jiujing unit is composed of tonalite with an area of 220 km2 and the Bantan unit is composed of porphyritic-monzonitic granite with an area of 53 km2 [30]. Overlying the granite, there are Quaternary sediments such as talluvium and diluvium distributed on the surface of granite rocks at Bantan Basin, Ba’antan Basin, and Jiujing (Shiyuejing) Basin (shown in Figure 3), which are mainly composed of loose sandy gravel, coarse sand, and clay [31]. Due to the subsidence caused by faulting (F16, F18 and F20), Bantan Basin, Ba’antan Basin, and Jiujing Basin have lower elevations compared to surrounding blocks, which result in the discharge of shallow groundwater, surface water, and floodwater towards the centre of the basins [23,31,32], leading to the sediments being eroded and transported during the wet season.

3. Methodology

3.1. Data

To quantify recent surface displacements, 2.5 years of Sentinel-1 data were accessed via the Alaska Satellite Facility (ASF) online Vertex portal. This dataset includes 70 images from the ascending orbit acquired between 8 October 2017 and 27 February 2020, and 72 images from the descending orbit direction acquired between 11 March 2017 and 31 January 2020.

3.2. InSAR Technique

Interferometric synthetic aperture radar (InSAR) is a technique used to quantify ground surface deformation using the differences in the phase of the electromagnetic waves returning to the satellite [33,34,35]. The deformation can be measured through the comparison of two radar images, but there are several mechanisms which contribute to a change in the measured phase. Algorithmic approaches have been developed to estimate these phase contributions based on statistical analysis of the data. The typical model for these phase terms is as follows [36,37]:
Φ   = Φ   d e m + Φ   d e f + Φ   a t m + Φ   o r b + Φ   s c a t   
where Φ   is measured phase change,   Φ   d e m is topographic error, Φ   o r b is satellite orbital errors generated by inaccurate orbit determination, Φ   a t m is atmospheric phase delay caused by water vapor, Φ   s c a t is clutter and thermal noise and processing errors, and Φ   d e f is the deformation, which is a function of radar wavelength ( λ ) and radar line-of-sight (LoS) distortion (ΔR):
Φ   d e f = 4 π λ Δ R
where a change in the distance between the sensor and scatterer will produce a shift in the measured phase, corresponding to 2 π radians doubled due to the two-way travel path-per-wavelength of the signal. The deformation ( Φ   d e f ) of the targeted scatterer during the data acquisition period can be obtained after the removal of satellite orbital errors ( Φ   o r b ), topography ( Φ   d e m ), atmospheric phase delay ( Φ   a t m ), and temporal and geometrical decorrelation noise ( Φ   n o i s e ). This is achieved using a time-series InSAR analysis technique, such as persistent scatterer interferometry (PSI or PSInSAR™). The SAR data were processed in ENVI SARScape (Harris Geospatial Solutions) using the PSI technique applied to a series of Sentinel-1 SAR datasets. PSI is a stack processing method that uses multiple images taken at regular intervals to achieve millimetric-scale measurements. Compared to the traditional DInSAR stacking method, (1) PSI has a strongly reduced atmospheric error while DInSAR has no reduction on it, (2) PSI usually has a high coherence threshold (0.7>) on a single pixel while DInSAR only has a coherence threshold about 0.3, (3) PSI has Digital elevation model (DEM) accuracy around 100 m while the DEM accuracy in DInSAR is baseline dependent, and (4) PSI allows the stacking of more than 30 SAR images and DInSAR only allows 2 [36]. These make PSI much more precise than the DInSAR, which only has centimetre level precision [38].
The PSI method was developed from the work of Ferretti [36,37] and the method can be summarised in four steps:
(1)
Interferogram formation, where K interferograms are formed from K + 1 SAR images.
(2)
DEM and differential interferograms formation with orbital error removal. This is achieved based on Equation (3), where R is the reference sensor-target distance, θ is the local incidence angle with respect to reference ellipsoid, q is elevation, λ is wavelength, and B is perpendicular baseline.
  Φ   d e m    4 π λ R   B   ( x )   q ( x ) sin θ
(3)
Preliminary estimate of the LoS motion, elevation error, and atmospheric contribution, where only scatterers with high coherence are considered.
(4)
Refinement of step (3) by application of the atmospheric phase screen (APS) through residual phase spatial smoothing, which allows extra scatterers to be identified.
During these steps, targets with strong stable signals and subsequently low Φ   n o i s e are selected. The selected scatterers are expected to be only slightly affected by geometrical and temporal decorrelation and always have coherence greater than a specified threshold value [37]. Commonly, and in this research, this threshold coherence value has been set as 0.75; it is a widely accepted coherence threshold in other PSI-related studies such as Scoular [13], Jiang [39], Hu [40], and Farova [41].
The contribution of Φ   d e m can be reduced through use of a high-quality DEM and regression to find the relationship between phase value and slight variations in the satellite’s position that are indicative of DEM error; Φ   o r b and Φ   a t m can be reduced through spatiotemporal filtering [42]. Therefore, the Φ   d e f can finally be measured by minimising the additional phase change contributors on a PS-by-PS basis [36].

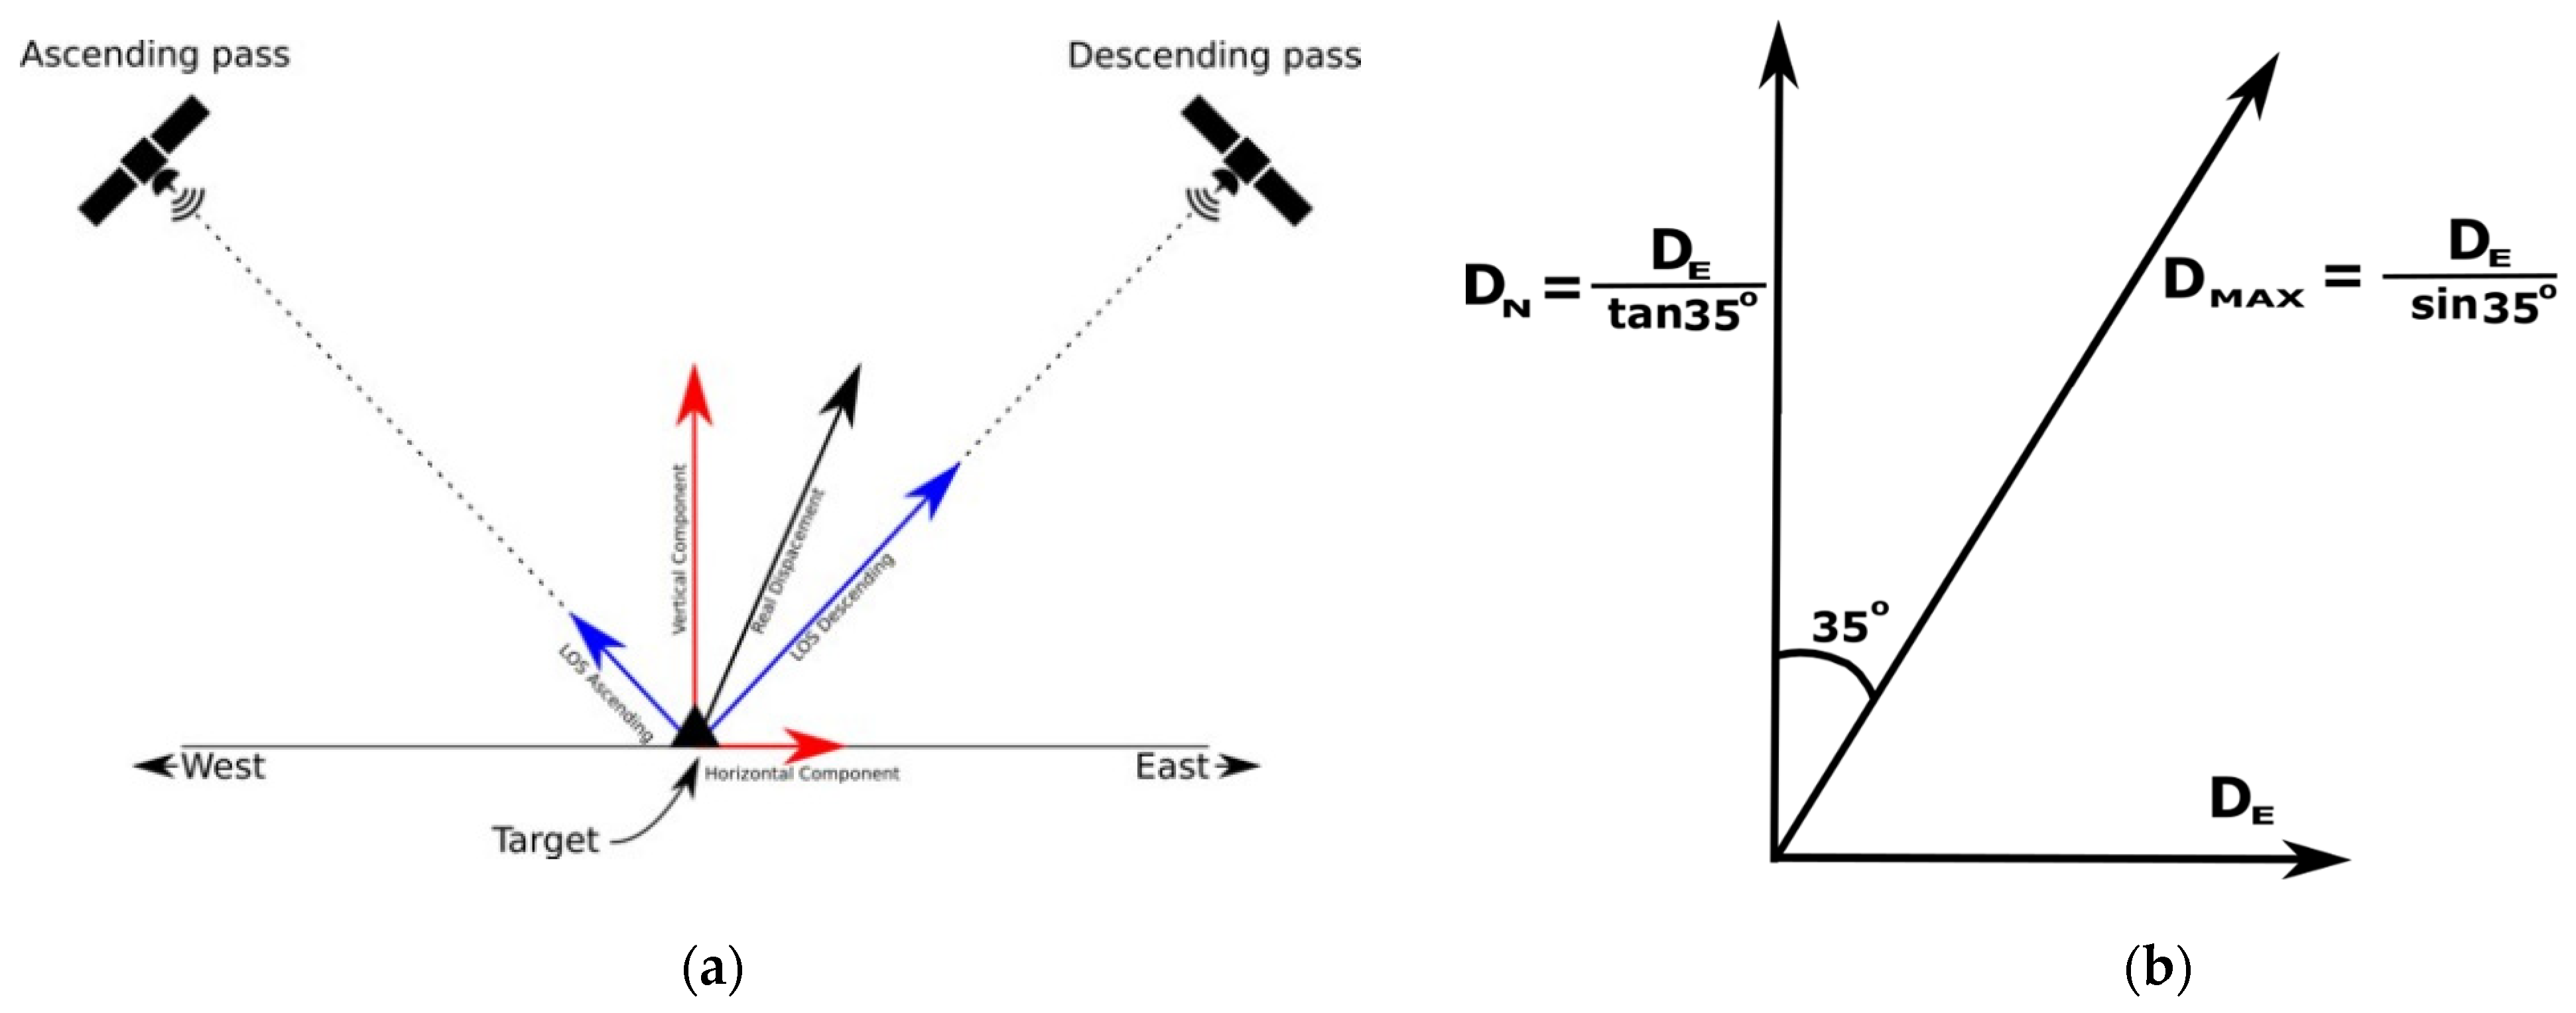
3.3. Estimation of Vertical and Eastward Displacement

The vertical, eastward, and northward displacements (DU, DE, DN) are three components that can be estimated from the measured line-of-sight (LoS) surface displacement. They can be derived from the decomposition of LoS displacements in both ascending and descending directions, as shown in Figure 4a. In theory, this can be expressed in Equation (4) [43,44]:
[   cos θ sin θ cos α   sin θ sin α   ] [ D U   D E   D N   ] =   Δ R
where α is the azimuth of the satellite-heading vector, θ is the incidence angle at the reflection point, and ΔR is ground displacement in the LoS direction between the two acquisitions.
The right-looking viewing geometry of Sentinel-1 SAR satellite imaging (and that of most near-polar-orbiting earth observation SAR sensors) makes it insensitive to north-south oriented motions. Thus, it is difficult to measure DN accurately and, out of necessity, the contribution of DN to total LoS displacement (ΔR) is considered insignificant and negligible. Meanwhile, the large errors introduced by atmospheric phase delay and orbit error residuals may further reduce the accuracy of DN estimation [43]. These make the LoS displacements strongly sensitive to DU, modestly sensitive to DE, and almost insensitive to DN [44]. Therefore, to guarantee the interpretation is achieved based on accurate data and minimise the chance of an incorrect solution, this research excludes the DN data estimated from LoS displacements.
The eastward displacement (DE) is estimated based on the combination of PS points in datasets from ascending and descending nodes. However, as these points are irregularly and differently distributed, the PS values at each dataset are therefore spatially interpolated to allow the decomposition at each gridded point. If we neglect northward displacement (DN), Equation (4) can be simplified to Equation (5), to estimate the vertical displacement (DU) and eastward displacement (DE). This can be expressed as [43,44]:
[   cos θ sin θ cos α   ] [ D U D E ] = Δ R

3.4. Estimation of Actual Displacement

The orientation of horizontal stress is governed by the tectonic movements [24]. Therefore, based on the measurement of maximum horizontal stress, the direction of rock block movement can be estimated from the E-W component and a knowledge of the stress orientation. The in-situ stress measurement at borehole BS01 suggests the Jiujing granite region is in a compressive stress field with maximum horizontal stress in the direction of N35°E [21]. This indicates the overall maximum horizontal displacement (DMAX) in the Jiujing region is along N35°E. DN and DE are two components of DMAX. DE can be calculated using the previous steps and based on this value, the estimation of DMAX towards N35°E and DN is shown in Figure 4b:
Using this trigonometric relationship, the northward displacement (DN) and the N35°E displacement (DMAX) can be expressed in Equations (6) and (7), respectively.
D N = D E tan 35   o   
D MAX = D E sin 35   o
This estimation is based on two assumptions, where the direction of horizontal deformation is in line with the stress field, and where the maximum horizontal displacement is almost homogeneous across the entire granite pluton. However, it is recognised that there is the exceptional case where the actual movements of blocks are not in NE-SW direction, and this will be discussed in Section 4.2.7.

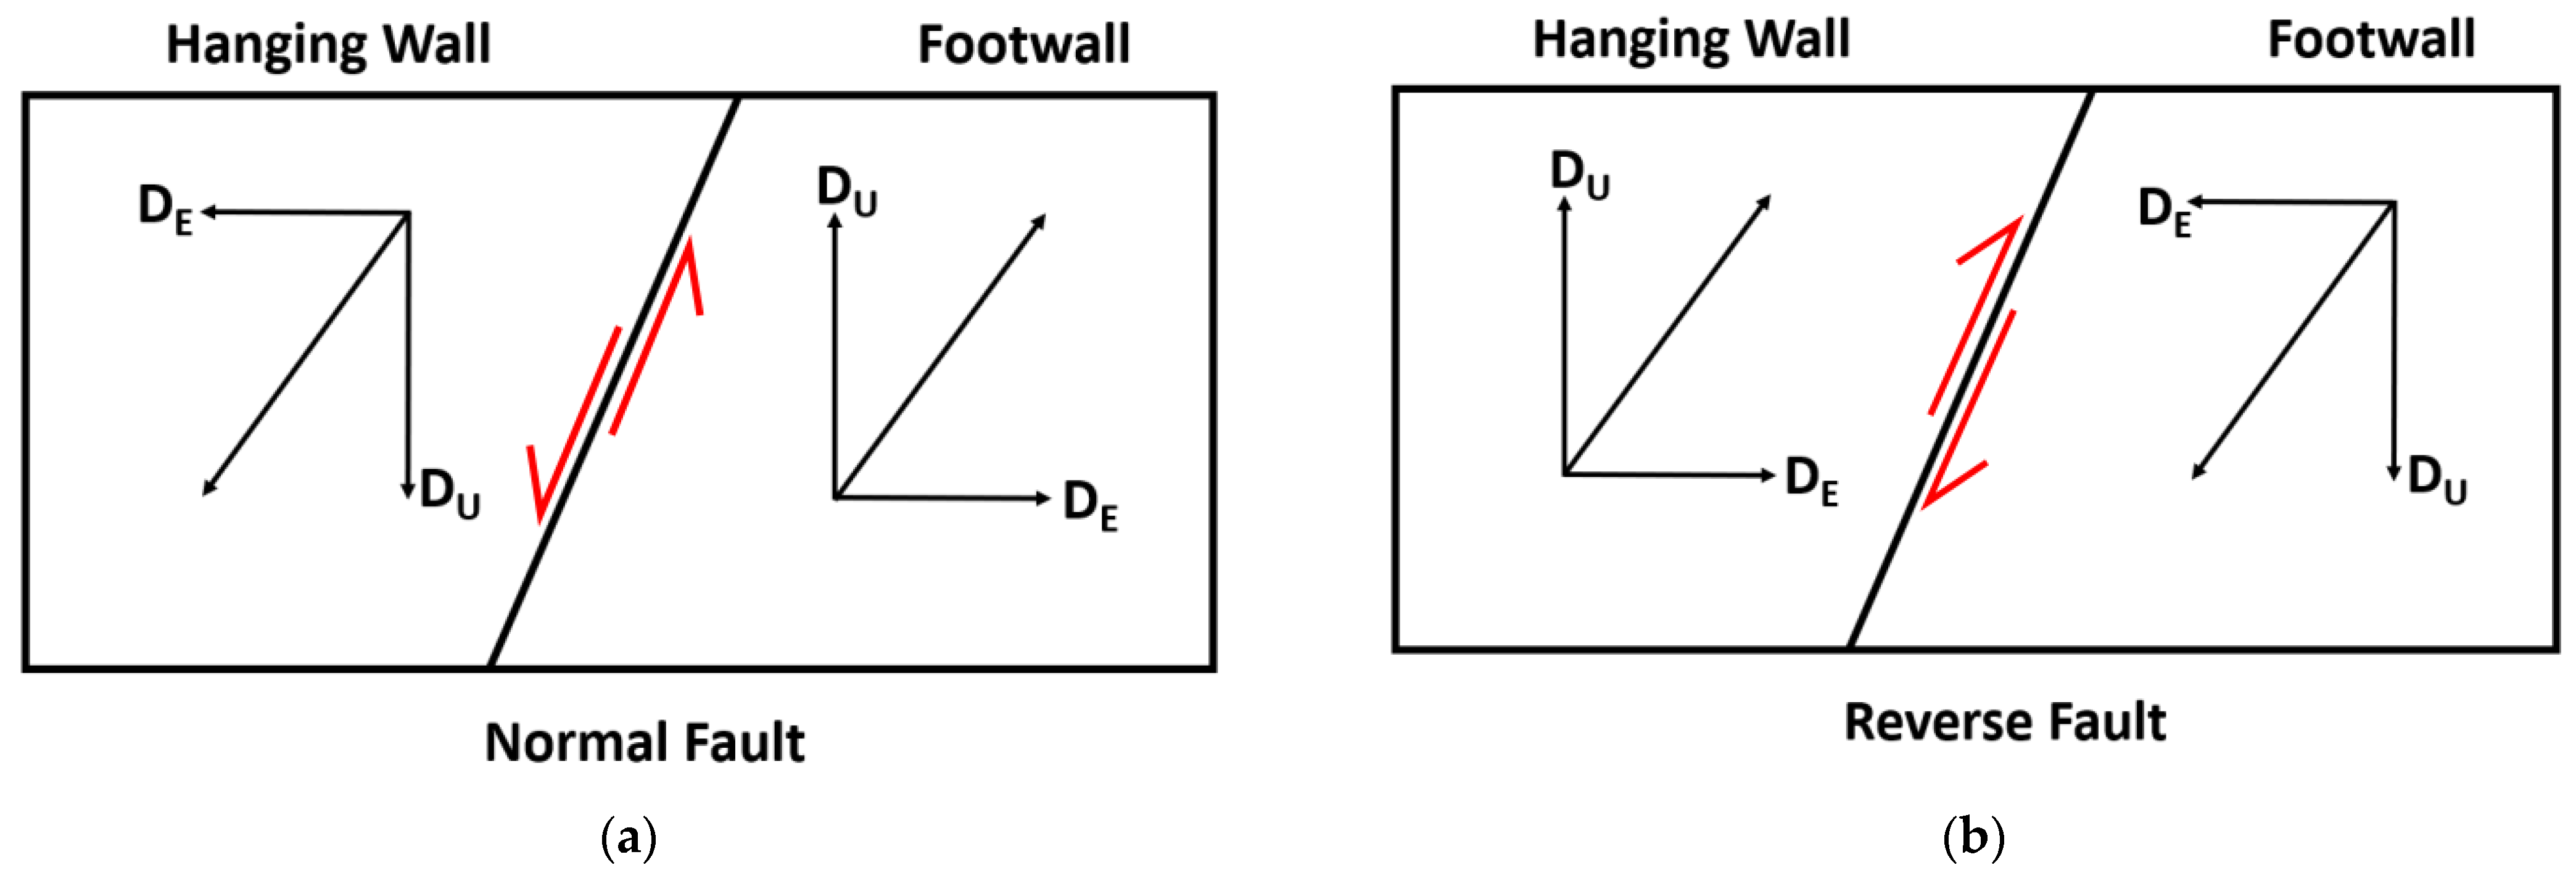
3.5. Characterisation of Active Faults Based on Micro-Displacements

The significant velocity pattern contrast between the two sides of the fault plane reflects the activation of the observed fault and, in addition, the fault properties can be characterised based on the combination of vertical (DU) and eastward (DE) deformation along the fault plane.
The normal faults triggered by extension show a divergent horizontal deformation (DE) pattern, where the hanging wall is expected to move downward relative to the footwall, as shown in Figure 5a. The reverse faults triggered by compression show crustal shortening, the horizontal deformation (DE) is expected to show a convergence pattern, where the hanging wall moves upwards relative to the footwall side, as shown in Figure 5b. Based on the horizontal and vertical displacement comparison along the two sides of the fault plane, the fault type and dip direction can be postulated.

4. Results and Discussion

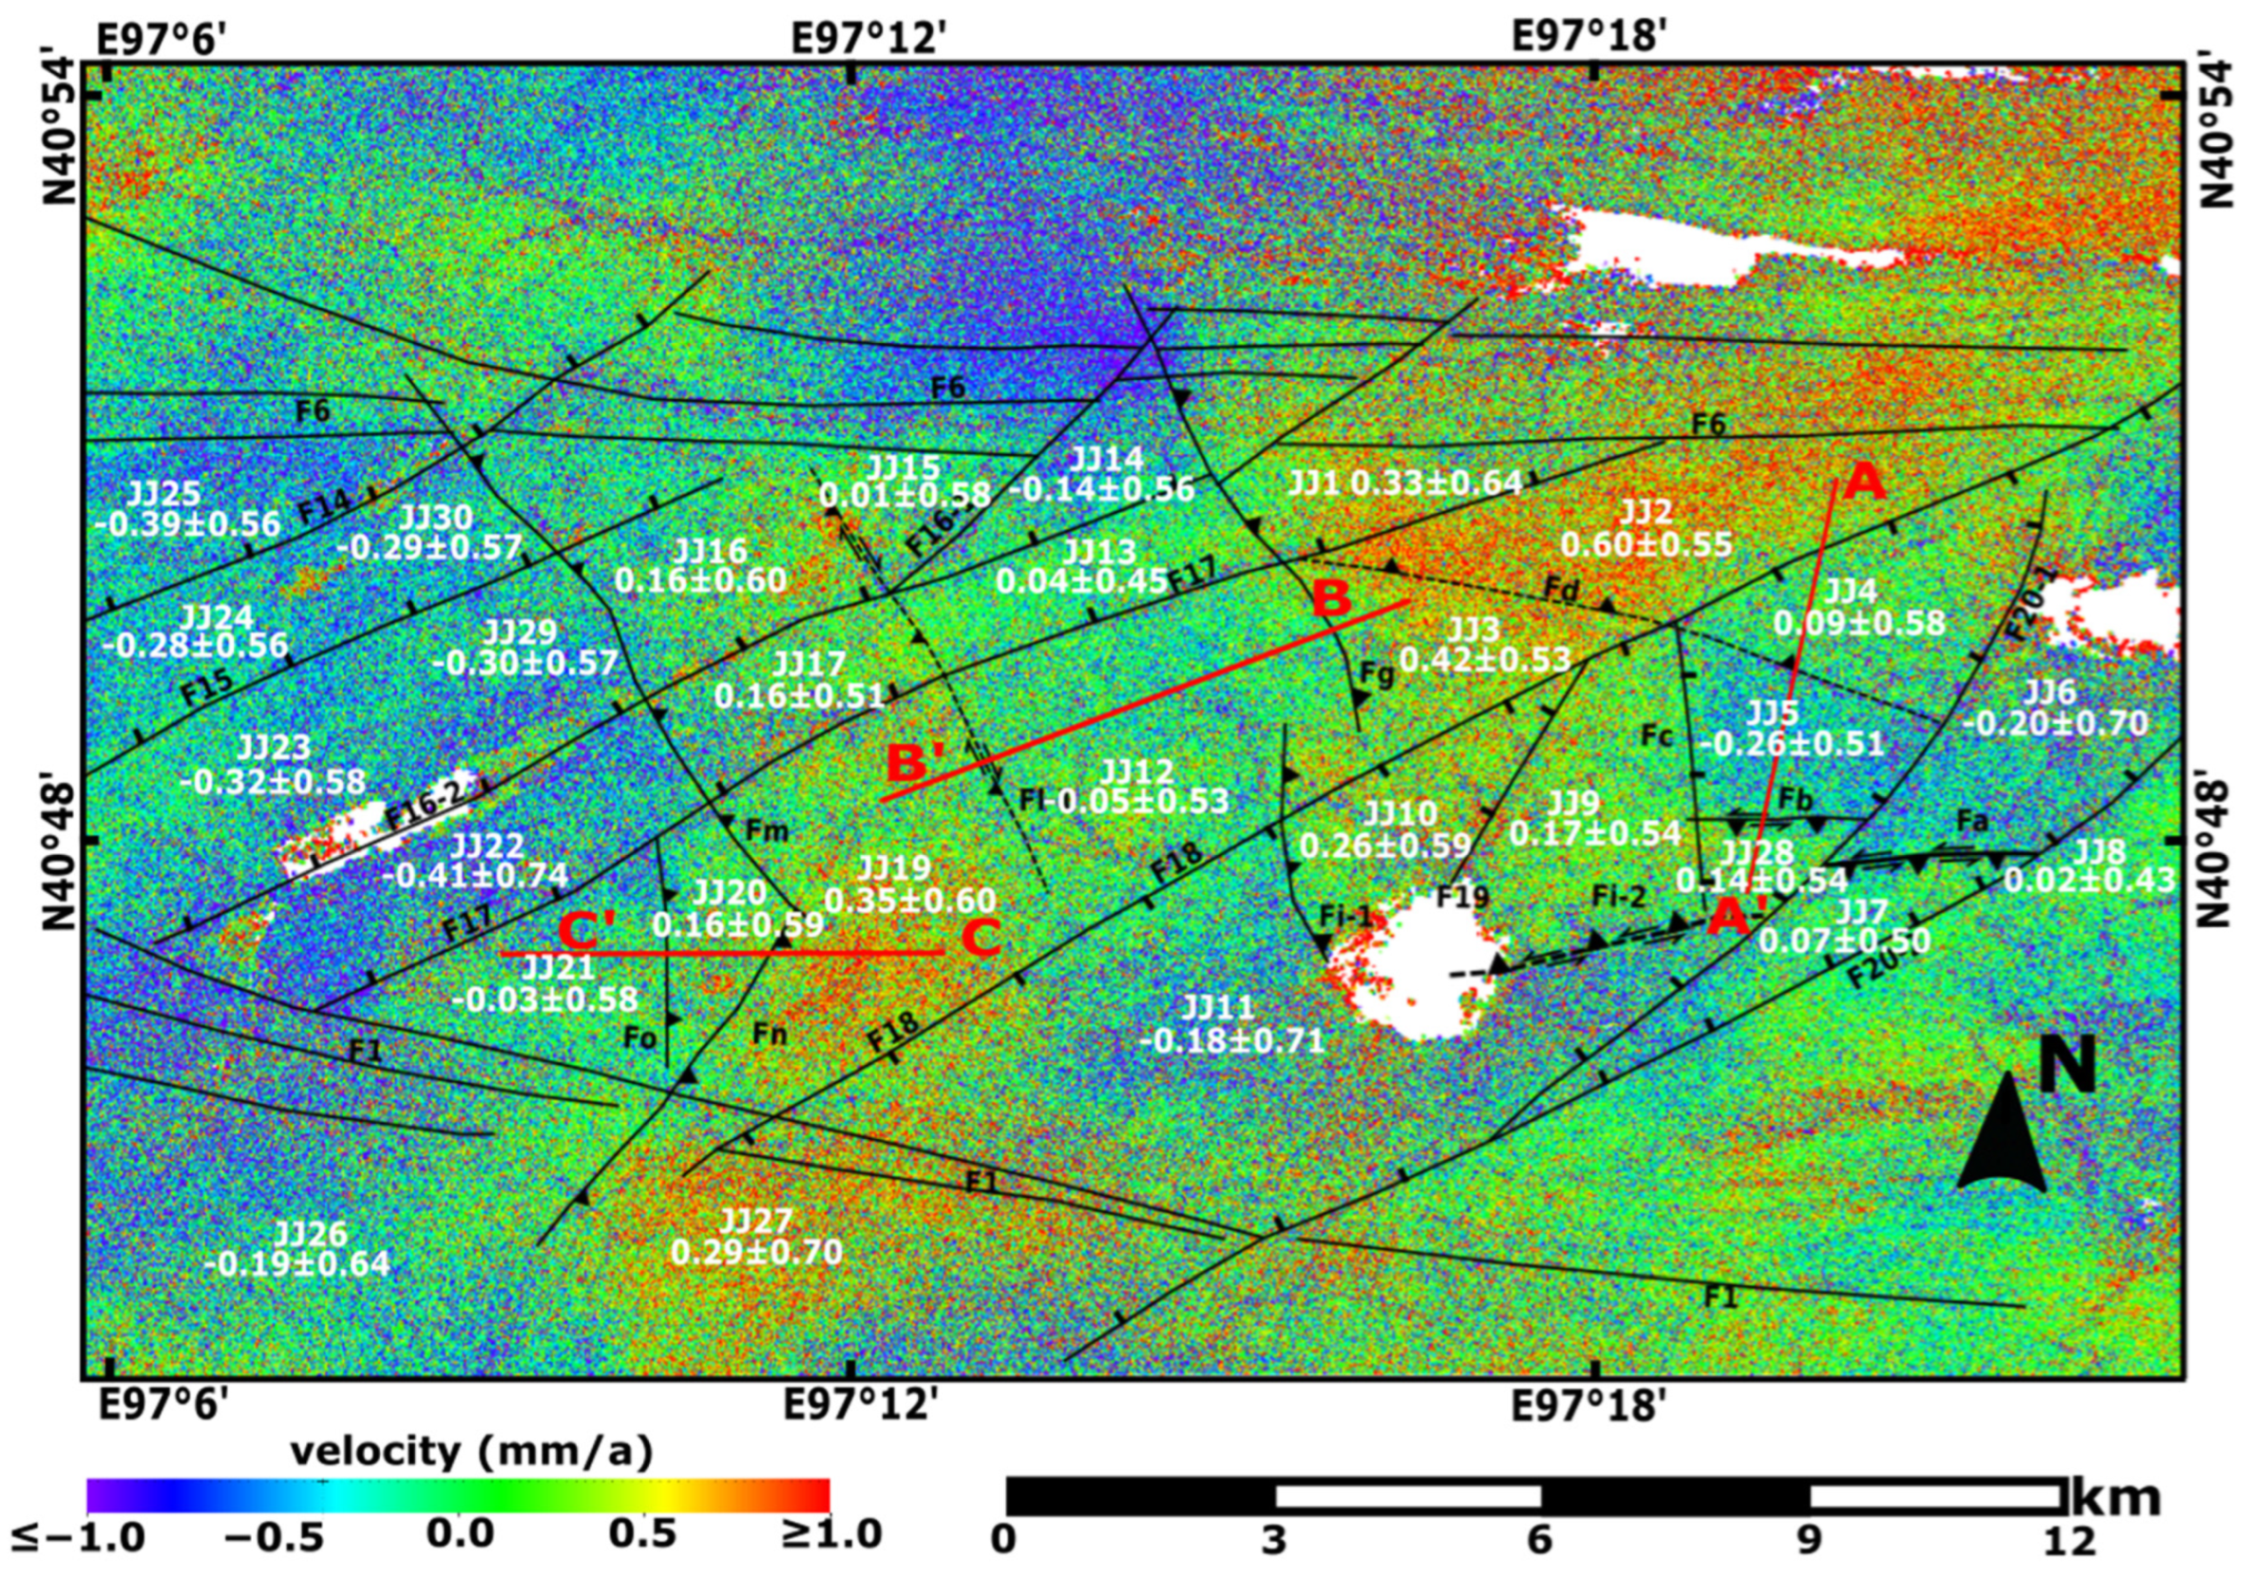
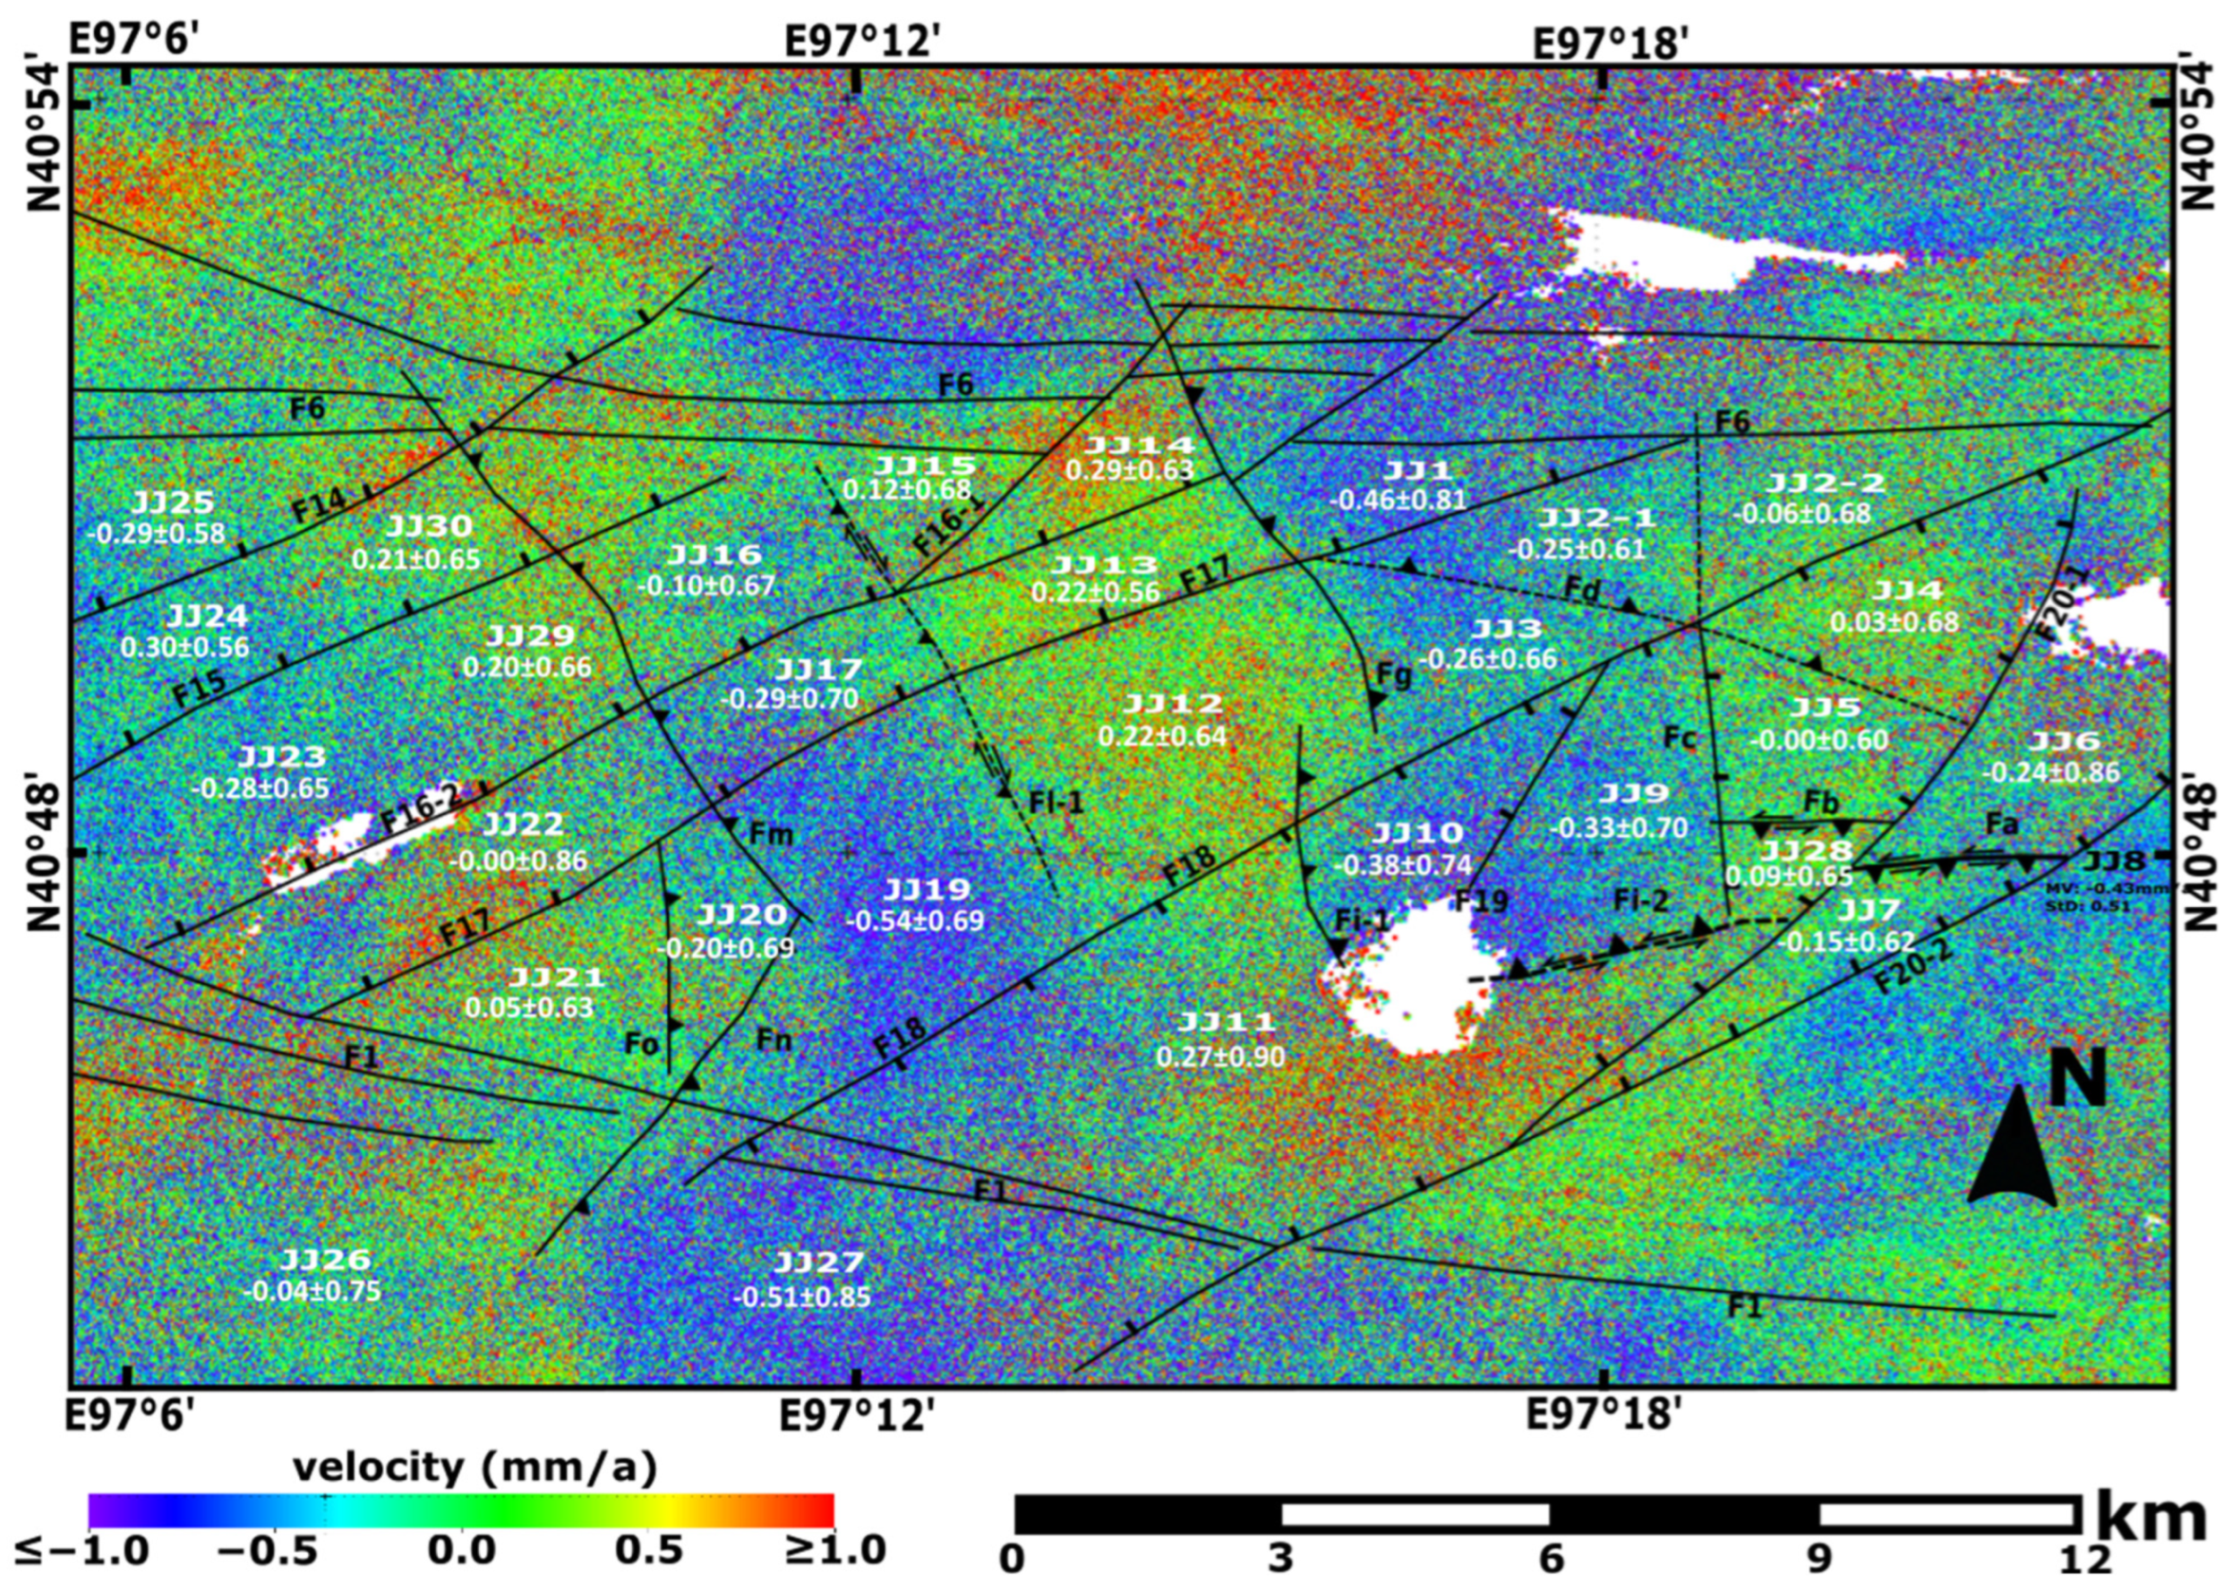
4.1. The Patterns of Surface Deformation in the Jiujing Region

Using the method outlined in Section 3, Figure 6 and Figure 7 show the patterns of vertical (DU) and eastward (DE) displacements within the study area. The Sentinel-1 data were analysed in terms of potential structural phenomena. The measured deformations were interpreted and compared against independent priori data sources. Further potential explanations for apparent movements in InSAR data are discussed for the area as a whole in Section 4.4.
According to the published literature, the faults in this region are considered to be inactive [21,23]. However, the PSI data show small but measurable movements along both known faults (such as F16-2, F17, F18, and F20-2) and on previously unmapped active faults (traced by blue lines in Figure 8 and presented in Table 2). The interpretation of unmapped faults is supported by discontinuities (which might be valleys, gullies, or cracks) on the surface of the granite, which are visible in Google Earth satellite imagery. The use of InSAR in this context may therefore provide a new method of characterising known faults and identifying previously unknown faults, thus enhancing the understanding of regional tectonic regimes and stress mechanisms.
To better describe the deformation patterns, the Jiujing region has been divided into 30 blocks, labelled from JJ1 to JJ30 (Figure 6 and Figure 7); based on the distribution of faults, their information and the vertical velocity normal distribution curves have been summarised and presented in Tables S1 and S2 and Figure S1 in Supplementary Materials. The time-series analyses conducted across several major blocks (blocks 3, 6, 7, 12, 19, and 21) presents the temporal variation of vertical displacement (shown in Figure 9a–f, and the original data is presented in Table S3 in Supplementary Materials). This is achieved through the averaging of the displacement values of 300 PS points within each block. The standard deviations of the datasets are represented by the error bars. Meanwhile, three cross-sections (AA’, BB’, and CC’, Figure 6) were generated to show the spatial distribution of vertical displacement. It should be recognised that these results are estimated from a time series of around 2.5 years of SAR data acquisitions, and they represent continuous ground movement with consistent downward or upward trends over that time; thus, they are considered to be accurate enough to reflect the surface movement against time. The decorrelation noise and atmospheric artifacts are usually random; however, the time-series analysis in Figure 9a–f showed consistent trends of uplifting or subsiding. This further demonstrates that the surface deformations are the result of ground movement rather than decorrelation noise and atmospheric effects.
The weathering and fracturing of the individual blocks within the Jiujing region are relatively spatially consistent, and Quaternary sediments are constrained to three basins (Figure 3). We therefore assume that the detected surface displacements are caused by active tectonic processes, affecting several faults, which lead to differential movements of the fault-bound blocks. It should be noted that the faults marked in Figure 6 and Figure 7 are the most conspicuous features and it is likely there are other, smaller faults internal to these blocks that may also be active.

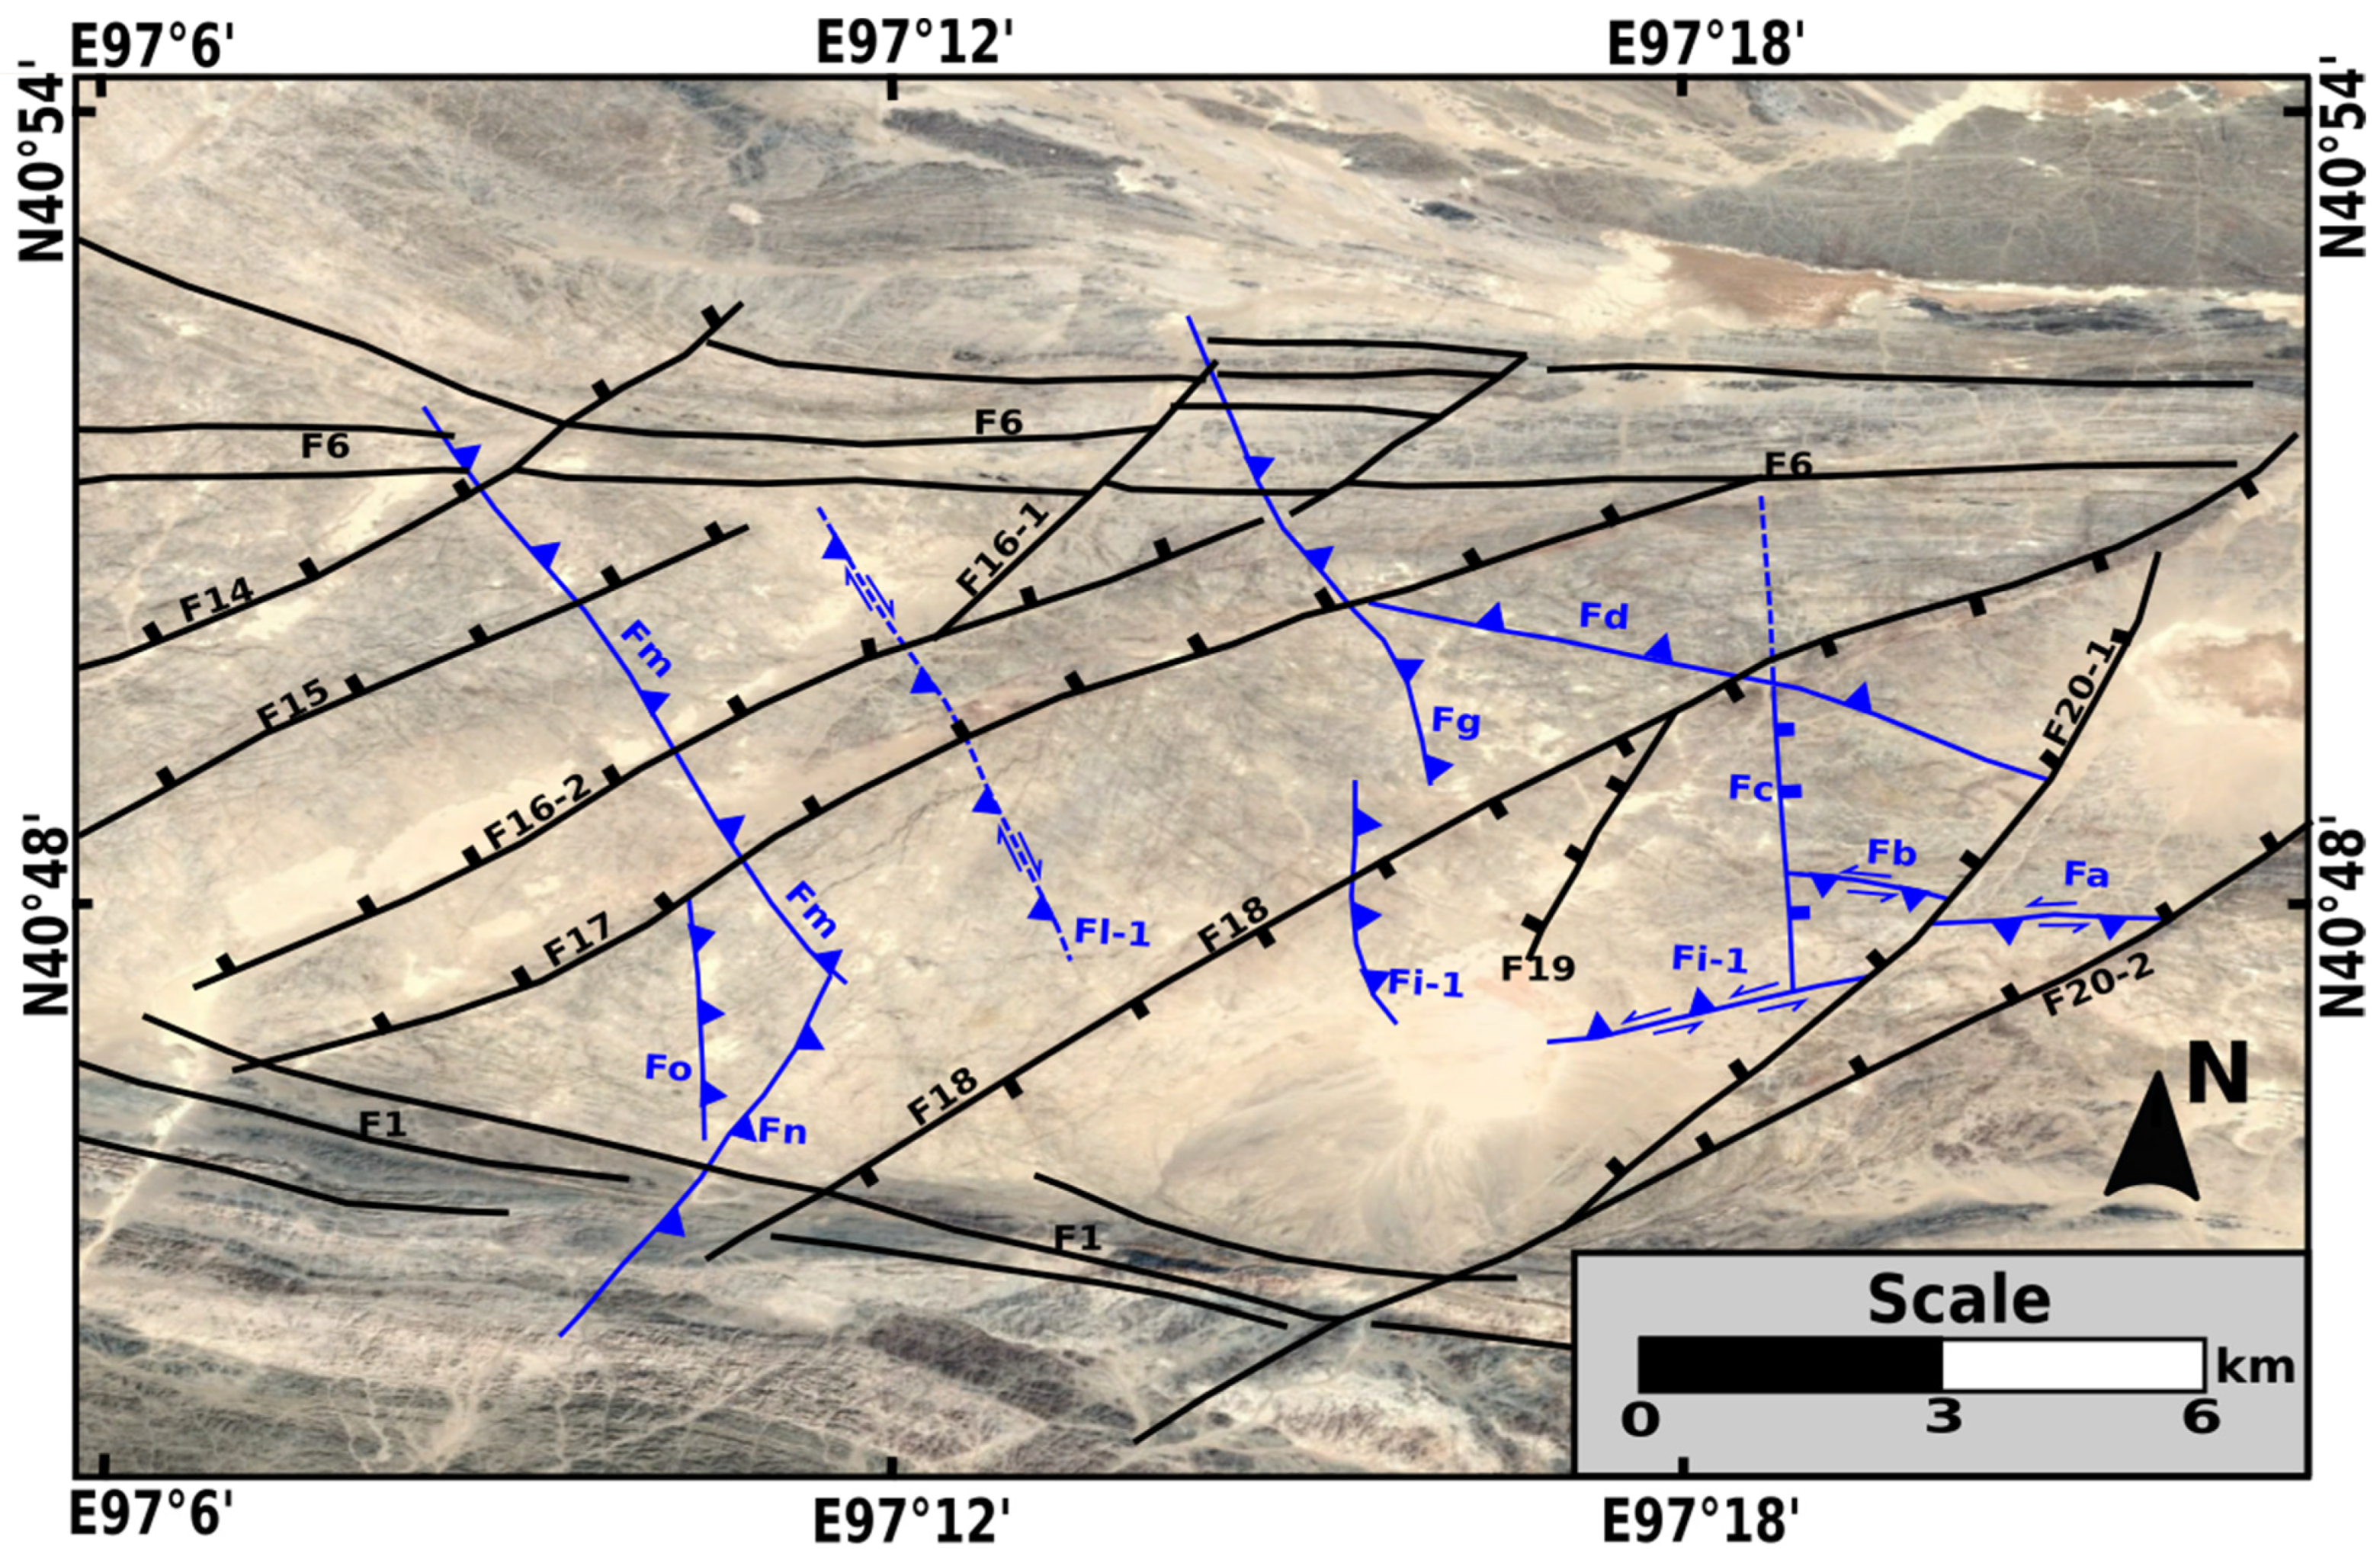
4.2. The Structural Geology of the Jiujing Region

4.2.1. F16-2, F17, F18, and F20-2 as Active Faults

The PSI results in Figure 6 and Figure 7 clearly show that the NE-SW trending normal faults F16-2, F17, F18, and F20-2 are still vertically active. The direct evidence of this comes from the patterns of DU across the fault planes, where there is a clear difference in the relative vertical motion of the blocks on either side of the fault lines.
F20-2 controls the eastern boundary of the Jiujing region. The eastern side of the fault (block JJ8) has a maximum elevation difference of 90 m, with Jiujing Basin on the western side of the fault (JJ6), caused by past tectonic activity [43]. The Sentinel-1 data in Figure 6 indicates the western side of F20-2 in JJ6 is subsiding by 0.20 mm a−1 on average whilst the eastern side of the fault (JJ8) is uplifting by an average of 0.02 mm a−1. These differences in vertical displacement rates and the relative subsidence at JJ6 confirm that F20-2 is a normal fault dipping to the northwest [43,46], where JJ6 and JJ7 form the hanging wall of that fault and are expected to move downwards relative to JJ8.
The PSI results also indicate that the average uplift rates on the southern side of F18 (JJ4, JJ5, JJ9, JJ10, and JJ11) range from −0.18 to 0.26 mm a−1, while uplift of the northern side of the fault (JJ2, JJ3, JJ12, and JJ19) ranges from 0 to 0.60 mm a−1. This shows F18 is a vertically active normal fault dipping towards the southwest. This vertical velocity difference along cross section AA’ shown in Figure 6 is presented in Figure 10.
Conversely, the southern side of F17 (JJ2, JJ3, JJ12, JJ19, JJ20, and JJ21) is uplifting faster compared to the northern side (JJ1, JJ13, JJ17, JJ18, and JJ22). The average vertical displacement rates on the southern and northern sides range from −0.03 to 0.6 mm a−1 and −0.41 to 0.33 mm a−1, respectively, indicating that F17 is a normal fault dipping towards the northwest, consistent with the literature.
In Figure 7, along fault F16-2 between JJ13 and JJ14, it is shown that the average vertical deformation patterns indicate JJ13 is subsiding (−0.04 mm a−1) at a slower rate than block JJ14 on the northern side of fault F16-2 (JJ14, −0.14 mm a−1). This confirms that F16-2 is a northwest-dipping normal fault, whereas the northern side of the fault (JJ14) is expected to subside relative to the southern side, showing that this part of fault F16-2 is vertically active.

4.2.2. Fa as a Sinistral Reverse Fault

The average vertical velocity difference between JJ6 (−0.20 mm a−1) and JJ7 (0.07 mm a−1) suggest Fa is vertically active (Figure 8). The average time-series displacements of these two blocks along Fa are presented in Figure 9a,b, where the gradients of the linear trendlines show the rates of subsidence or uplift. A positive gradient refers to an upward displacement and a negative gradient refers to a downward displacement (this also applies to Figure 9c–f).
The average horizontal velocity indicates JJ7 is relatively stable, with a westward deformation rate of only 0.15 mm a−1. Meanwhile, the northern side (JJ6) has average westward deformation rate of 0.24 mm a−1, indicating a sinistral shear sense along Fa.
Based on the method introduced in Section 3.4 to compute DMAX, it can be estimated that JJ6 is moving towards the southwest at a higher velocity (0.42 mm a−1) than JJ7 (0.26 mm a−1), which indicates a crustal shortening along Fa. The uplift of JJ7, relative to JJ6, suggests JJ7 is in the hanging wall of the reverse fault, therefore Fa is dipping towards south.

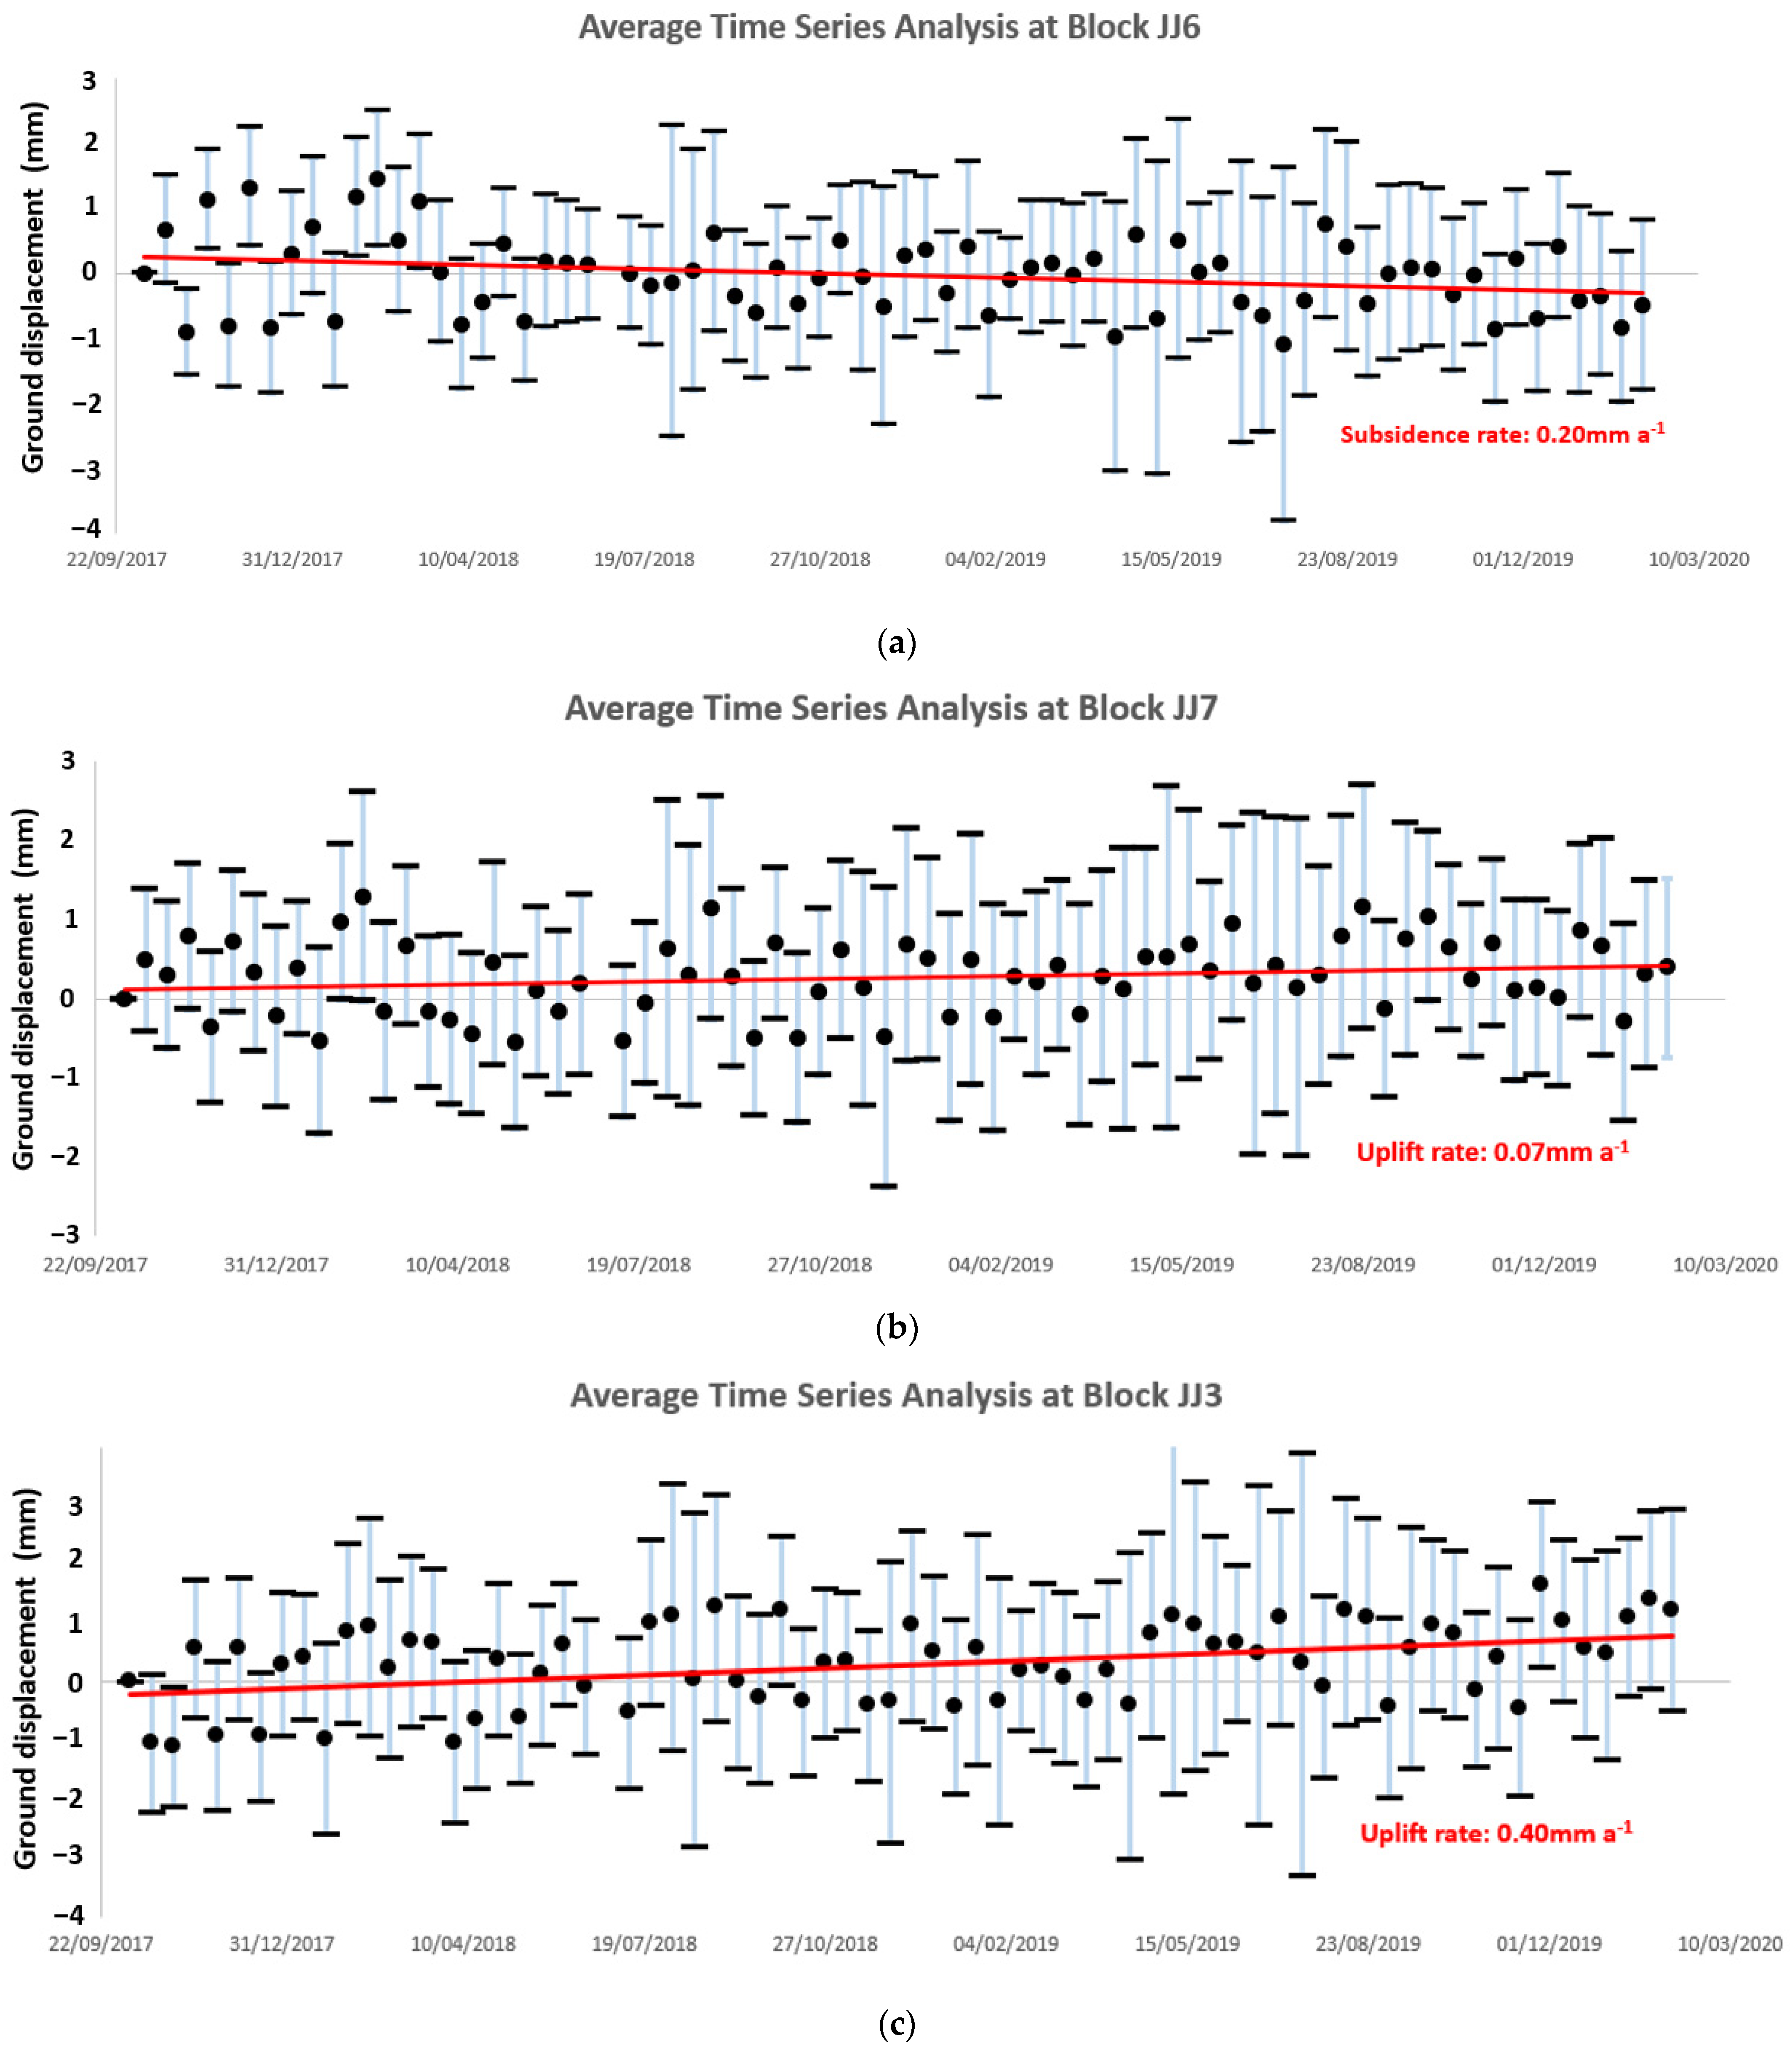
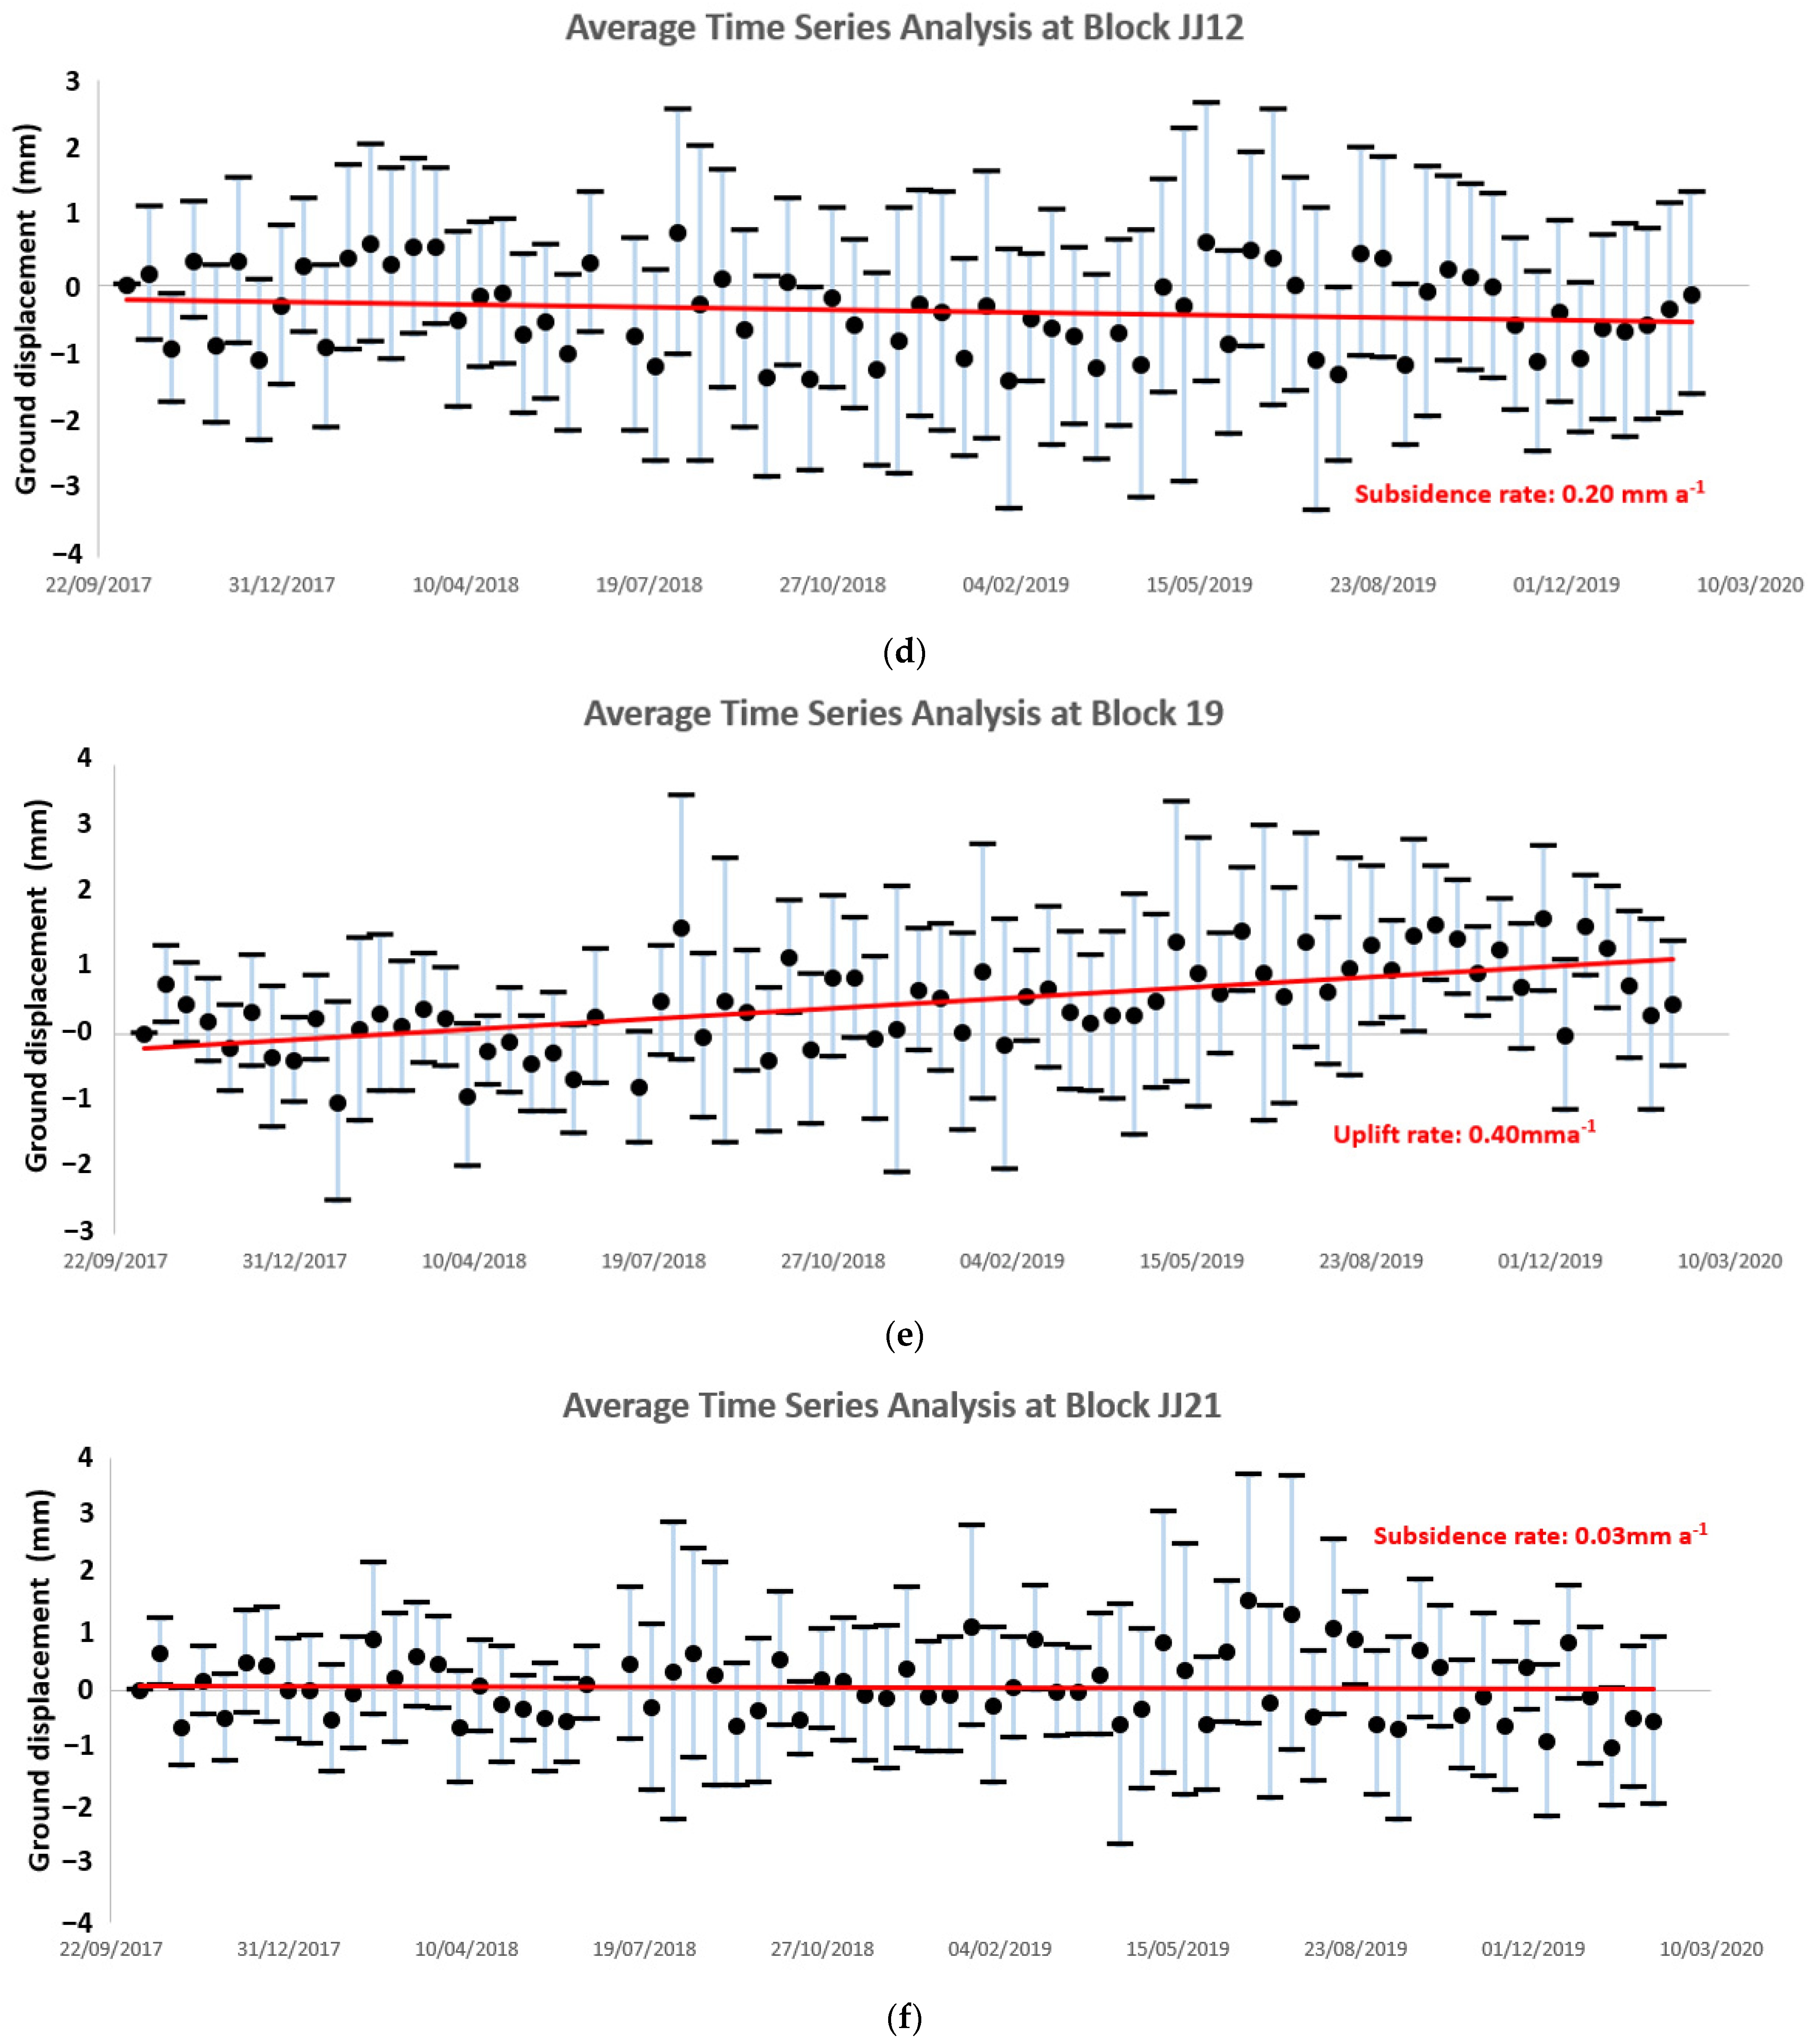
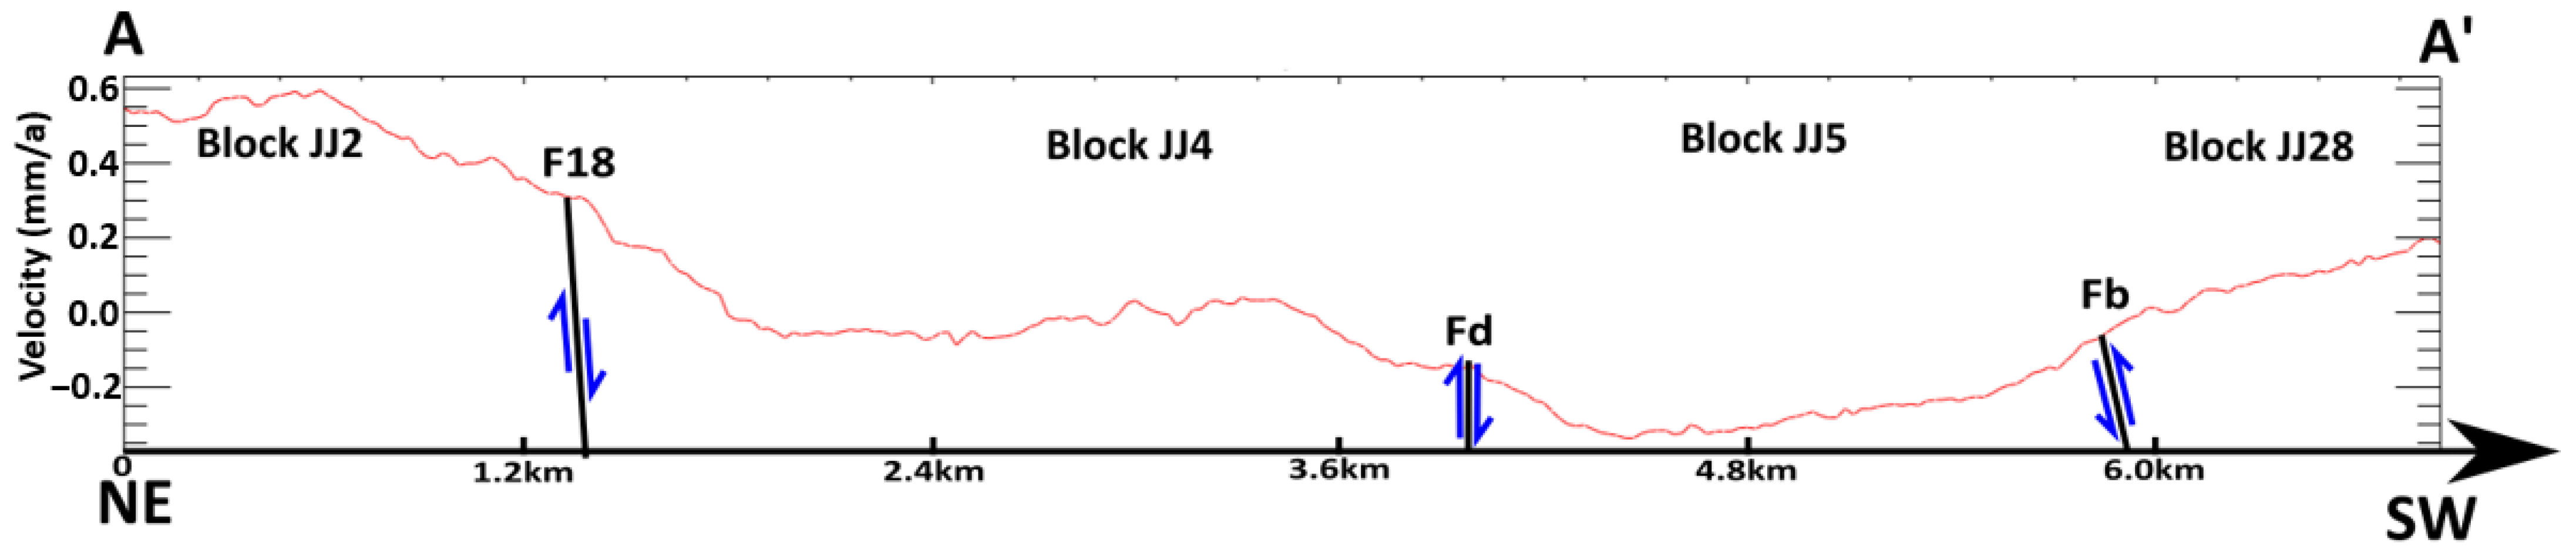
4.2.3. The Subsidence of JJ5

Block JJ5 subsided by 0.26 mm a−1 (Figure 6), likely caused by movements on Fc, Fb, and Fd. Along Fb, JJ28 (southern side) and JJ5 (northern side) are displacing eastward by 0.09 mm a−1 and 0 mm a−1, respectively (Figure 7). JJ5 is clearly stable but based on the orthogonal decomposition of maximum velocity (Section 3.4), JJ28 is displacing towards the northeast (N35°E) at 0.16 mm a−1, indicating crustal shortening along Fb in the northeast direction and that Fb is a reverse fault. The vertical deformation pattern in Figure 6 indicates JJ28 has an average uplift rate of 0.14 mm a−1, whereas JJ5 has subsided by 0.26 mm a−1. This indicates Fb is dipping towards the south and JJ28 is the hanging wall of the reverse fault.
Fc appears to be another active fault causing the subsidence of JJ5. JJ5 is horizontally stable while, as shown in Figure 7, JJ9 (the west side of Fc) is displacing towards the west by 0.33 mm a−1. This indicates crustal extension along Fc in an east-west direction. Meanwhile, Figure 6 also shows a vertical velocity contrast between the eastern and western sides of Fc, where JJ9 is uplifting by 0.17 mm a−1 on average, which is much higher than that at JJ5 (−0.26 mm a−1). This indicates that JJ9 and JJ5 represent the footwall and hanging wall of Fc, respectively, and that Fc is a normal fault dipping towards the east.
The difference in vertical displacement between JJ5 (subsidence rate 0.26 mm a−1) and JJ4 (uplifted by 0.09 mm a−1) is 0.35 mm a−1, shown in Figure 6, which indicates that Fd is vertically active. However, Fd is horizontally inactive, whereas the E-W displacements along the two sides of the fault plane are similar, according to Figure 7. Since Fd is NW-SE-oriented and because the entire Jiujing granite pluton is influenced by a NE-SW directed maximum principal compression, Fd is more likely to be compressional than extensional. According to the vertical deformation pattern in Figure 6, it can be estimated that Fd is north dipping. In this way, JJ5 is actually part of the Fd footwall.
F20-1 is a normal fault dipping towards the northwest [43] and JJ5 is a part of the F20-1 hanging wall, in theory. The PSI data in Figure 6 suggests there is a slight vertical displacement rate difference between the two sides of F20-1, where JJ5 (western side) is subsiding, on average, 0.26 mm a−1 more than JJ6 (subsiding at 0.20 mm a−1). In conclusion, JJ5 is the normal fault’s hanging wall of Fc and Fd and the reverse fault footwall of Fb. The combined effect of Fc, Fb, and Fd contributes to the overall subsidence of JJ5. Their spatial relationships are clearly illustrated in Figure 6, Figure 7 and Figure 10.

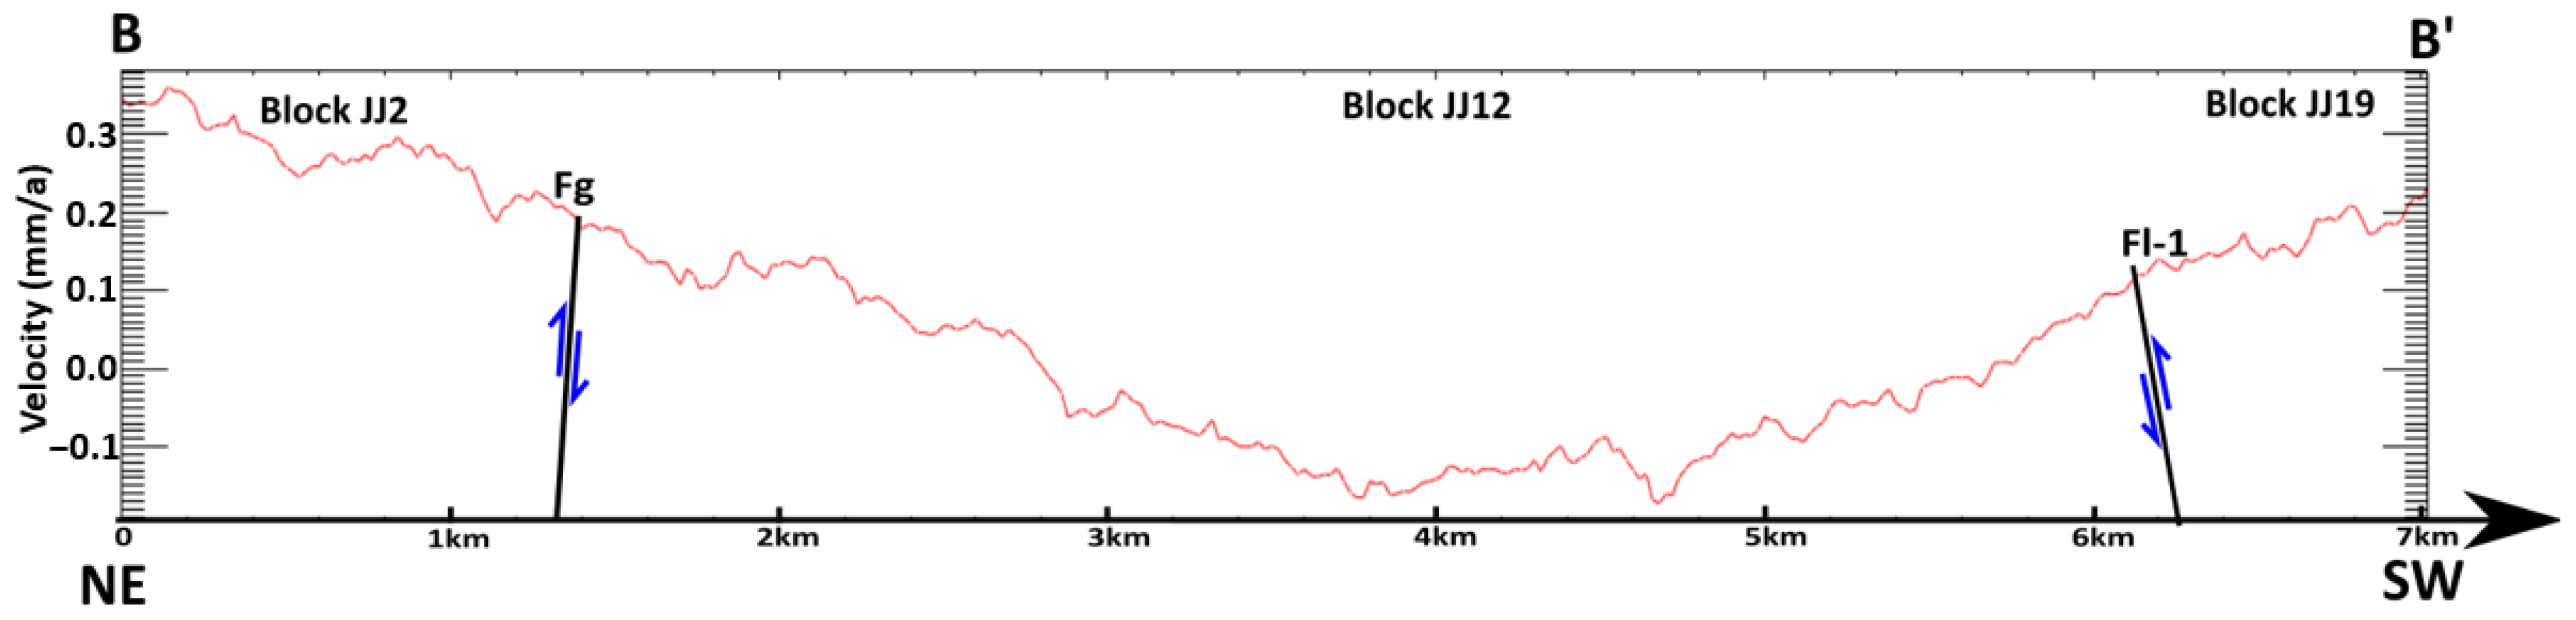
4.2.4. Fg and Fi-1 as Reverse Faults

Along fault Fg (Figure 7), the eastern side JJ1, JJ2, and JJ3 are displacing towards the west by −0.46, −0.05, and −0.26 mm a−1, respectively; meanwhile, blocks on the western side of the fault (JJ12, JJ13, and JJ14) are moving towards the east by 0.22, 0.22, and 0.29 mm a−1, respectively. This indicates a crustal convergence along Fg, showing it is a reverse fault.
Figure 6 shows that JJ1, JJ2, and JJ3 on the eastern side of Fg are uplifting by 0.33 to 0.60 mm a−1 while, on the western side, JJ13 is uplifting by only 0.04 mm a−1 and JJ12 and JJ14 are subsiding by an average of 0.05 and 0.14 mm a−1, respectively. This kind of vertical displacement difference is clearly illustrated by the cross-section BB’ in Figure 11 and by the average time-series analyses at JJ3 (Figure 9c) and JJ12 (Figure 9d), illustrating vertical deformation rate variability along Fg (Figure 9b). Generally, the blocks on the eastern side are moving upwards relative to those on the western side, indicating they are part of a reverse fault hanging wall and that Fg is dipping towards the northeast.
Similarly, to compare the average vertical (Figure 6) and horizontal (Figure 7) deformation rates at JJ11 and JJ12 on the western side and JJ10 on the eastern side, it can be speculated that Fi-1 is another east-dipping reverse fault.

4.2.5. Fi-2 as a Reverse Fault

Fi-2 is another reverse fault, where JJ9 and JJ11 lie on the northern and southern sides of Fi-2, respectively. JJ11 lies on the southern side of Fi-2; horizontally it is displacing towards the east by 0.27 mm a−1, whilst the northern side of the fault (JJ9) is displacing towards the west by 0.33 mm a−1. This indicates a sinistral shear sense on Fi-2, and since the maximum compressive stress is in a north-easterly direction (average N35°E) [16], based on the method introduced in Section 3.4, it is estimated that JJ11 displaces towards the northeast by 0.47 mm a−1 and JJ9, on the northern side of Fi-2, displaces towards the southwest by 0.58 mm a−1. This kind of crustal convergence indicates a shortening along Fi-2 and thus Fi-2 is a reverse fault. Vertically, Figure 8 shows JJ11 is subsiding by ca 0.18 mm a−1, whilst JJ9 on the northern side of the fault is uplifting by ca 0.17 mm a−1. This indicates that JJ11 and JJ9 represent the footwall and hanging wall sides of Fi-2, respectively, and that Fi-2 is dipping towards the north.

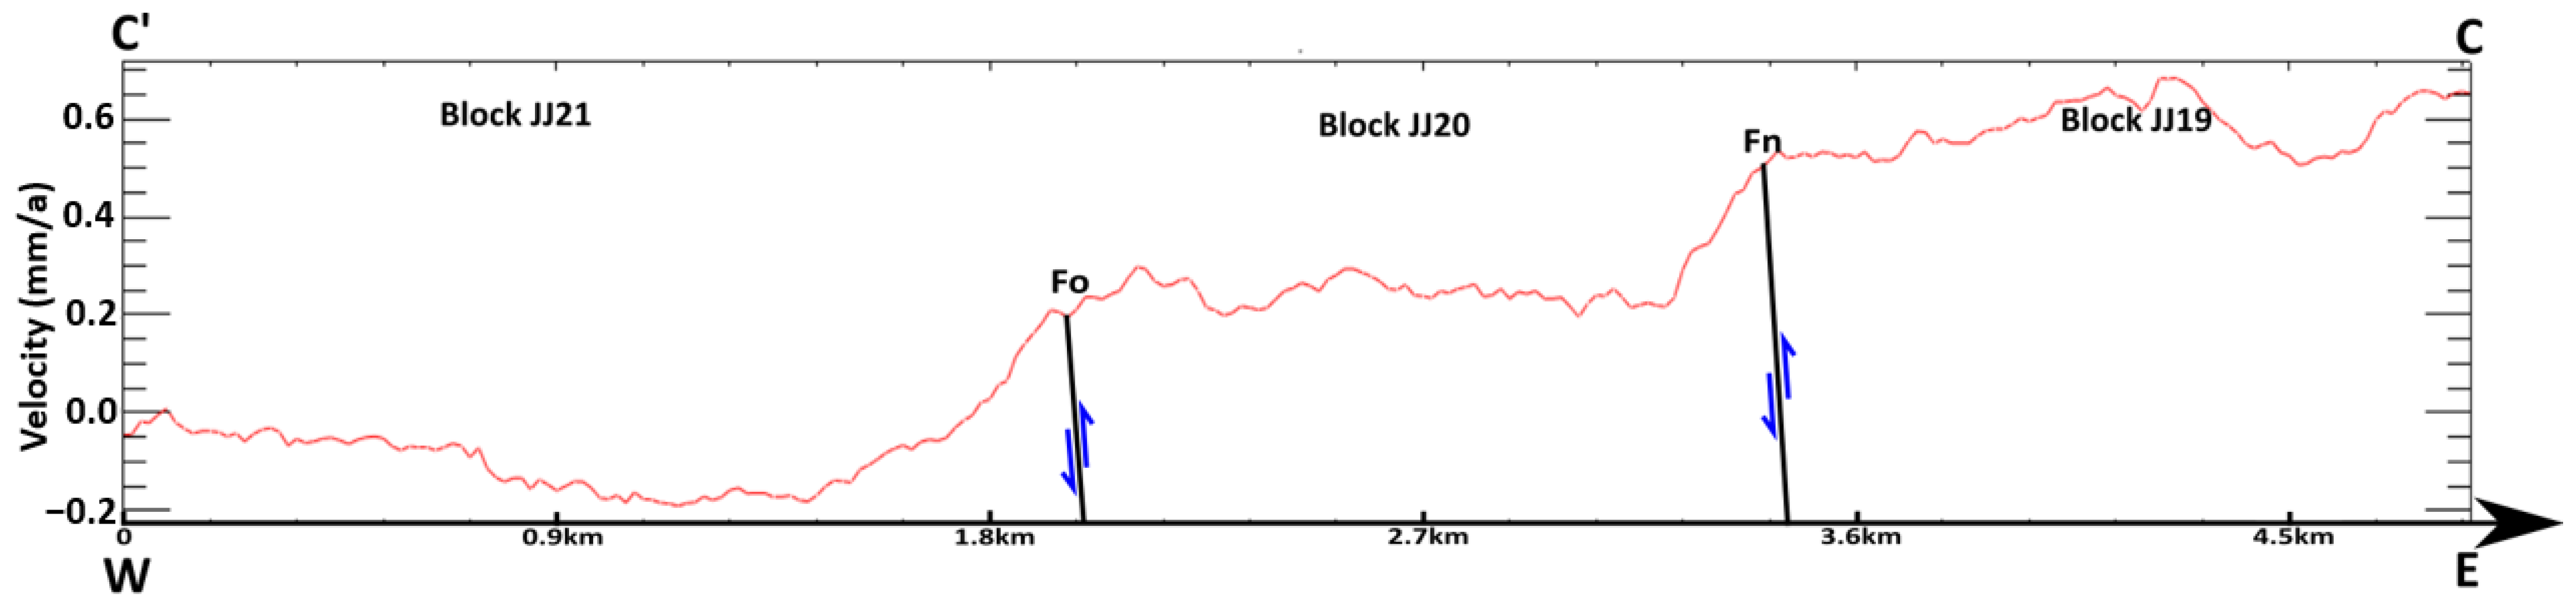
4.2.6. Fm, Fn, and Fo as Reverse Faults

Within the west side of Fm, Figure 7 shows that JJ30 and JJ29 are displacing towards the east by 0.21 and 0.20 mm a−1 and JJ22 and JJ20 are displacing towards the west by 0.01 and 0.20 mm a−1, respectively. Meanwhile, as mentioned above, JJ16, JJ17, JJ18, and JJ19 on the east side of Fm are displacing westward by 0.10 to 0.54 mm a−1. Therefore, Fm has been interpreted as a reverse fault due to the crustal convergence along it. Figure 7 also shows that both JJ20 and JJ19 are moving westward but JJ19 is moving at an average rate of 0.54 mm a−1, which is higher than that of JJ20, moving at an average rate of 0.20 mm a−1. This generates a crustal shortening along Fn and may be interpreted as a reverse fault.
Vertically, JJ16, JJ17, and JJ19 on the eastern side of Fm and Fn are uplifting by 0.16 to 0.35 mm a−1, whilst JJ30, JJ29, and JJ22 on the western side of Fm is subsiding by 0.30, 0.29, and 0.41 mm a−1, respectively. JJ20 is uplifting but the rate of uplift (0.16 mm a−1) is lower than its eastern counterpart JJ19, which is uplifting at 0.35 mm a−1. These all indicate that the western side blocks are generally moving downwards relative to the eastern side fault blocks along Fm and Fn, suggesting Fm and Fn are east-dipping reverse faults, where blocks JJ16, JJ17, and JJ19 are part of the hanging wall and JJ30, JJ29, and JJ22 are the footwall.
Fault Fo is another east-dipping reverse fault generated by the convergence of JJ20 and JJ21 shown in Figure 6 and Figure 7, where the east side (JJ20) is displacing towards the west by 0.20 mm a−1 and is uplifting by 0.16 mm a−1, and the western side of the fault (JJ21) is displacing towards the east by 0.05 mm a−1 and subsiding by 0.03 mm a−1. This kind of horizontal crustal shortening indicates Fo is a reverse fault, and the uplift of JJ20 relative to JJ21 indicates that JJ20 is part of the hanging wall and Fo is dipping towards the east.
In general, due to the impacts of Fm, Fn, and Fo, JJ21 is subsiding at 0.03 mm a−1 whilst JJ20 is uplifting at 0.16 mm a−1 and JJ19 has the greatest rate of uplift at 0.35 mm a−1. This shows that the average time-series analyses at JJ19, JJ20, and JJ21 (cross-section CC’, Figure 6) have a stepped vertical displacement pattern with a gradual uplift from west to east. These has been illustrated in Figure 9e,f and Figure 12, respectively.

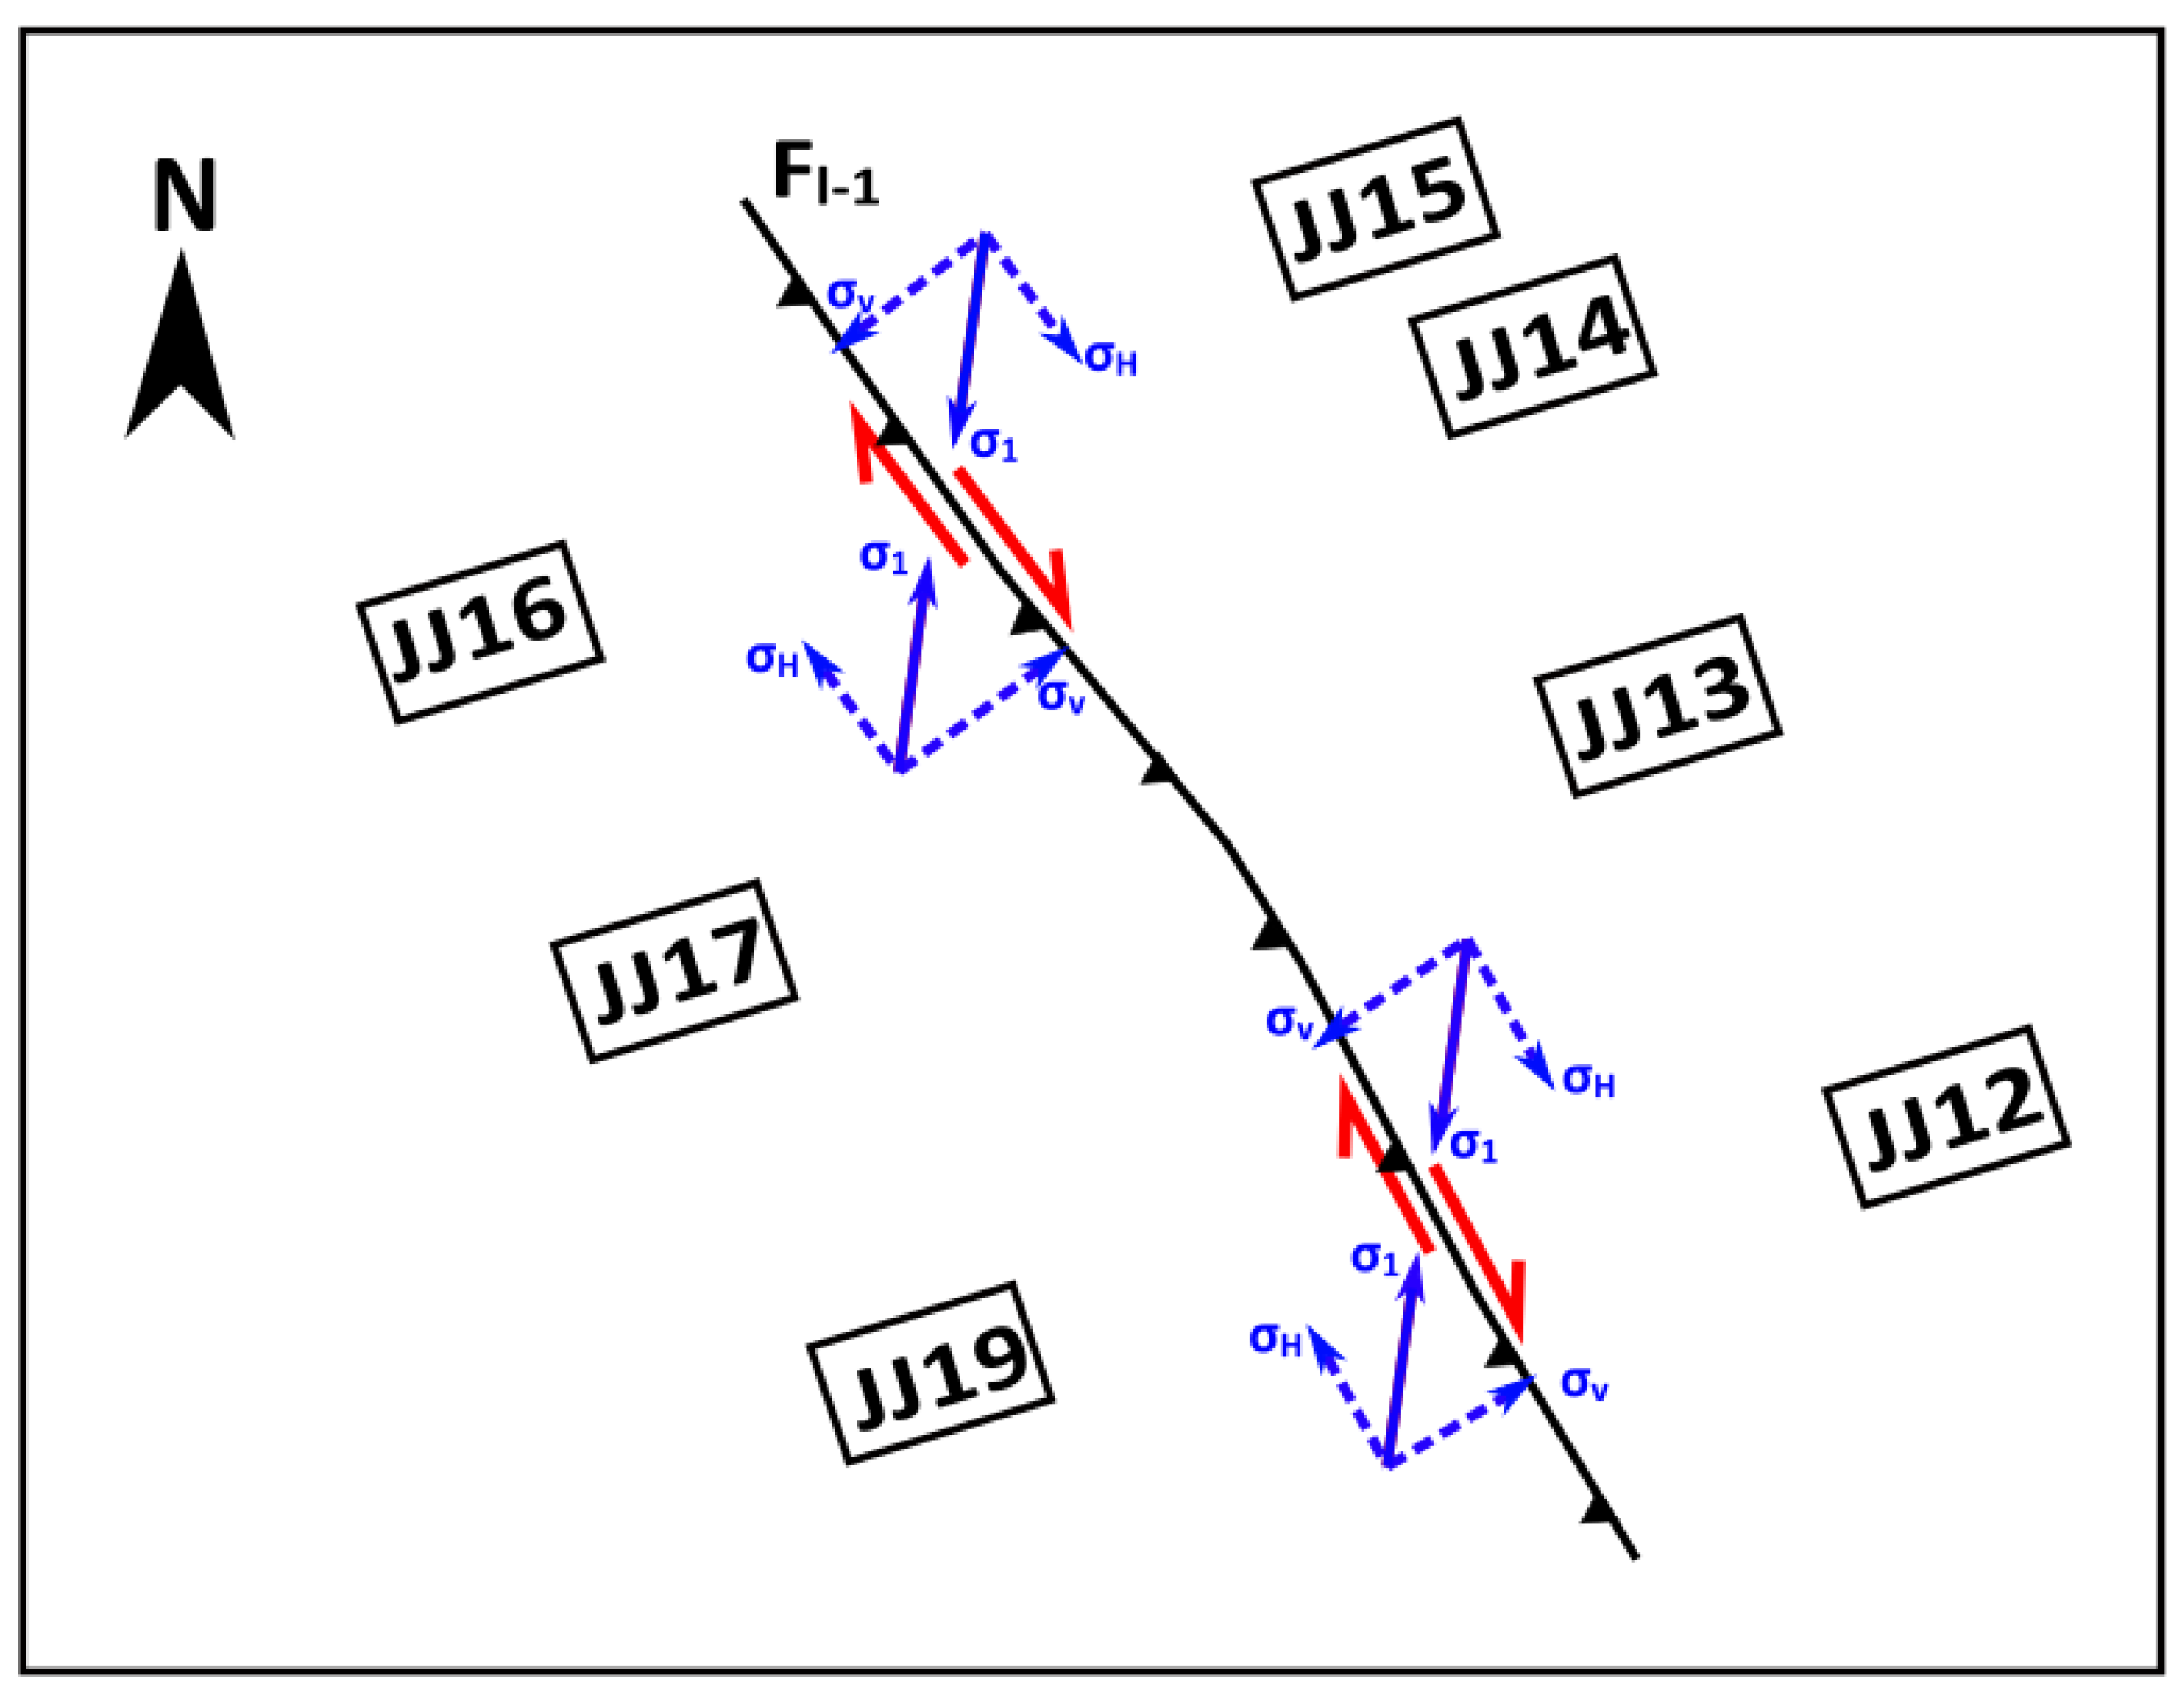
4.2.7. Fl-1 as a Dextral Reverse Fault

Horizontally, on the western side of Fi-1 and Fi-2, the PSI data in Figure 7 show that JJ16, JJ17, JJ18, and JJ19 are displacing towards the west by ca 0.10, 0.29, 0.48, and 0.54 mm a−1, respectively; meanwhile, as mentioned above, JJ12 to JJ15 on the eastern side of Fi-1 are displacing eastward by 0.12 to 0.29 mm a−1. This kind of crustal divergence indicates Fl-1 is a normal fault. This interpretation assumes that maximum horizontal displacement is homogeneous across the entire granite section. However, since the entire Jiujing granite pluton is dominantly affected by a NE-SW trended compression, the existence of extensional structures Fl-1 is kinematically and mechanically incompatible with the compressional structures, such as Fm and Fg. In this way, Fl-1 is less likely to be extensional.
A potential explanation is that Fl-1 is a dextral reverse fault, dipping to the southwest, as illustrated in Figure 13. This could be triggered by a NE maximum compression (σ1) at a very low angle between the fault planes. The horizontal component (σH) leads to right-lateral sliding along the fault plane, where the east side (JJ12, JJ13, JJ14, and JJ15) and west side (JJ16, JJ17, and JJ19) are displacing towards the southeast and northwest, respectively. This, in turn, leads to a divergent pattern along Fl-1, shown in Figure 7. Vertically, the uplifting of JJ16, JJ17, and JJ19 and the relative subsidence of JJ12 to JJ15 (shown in Figure 6) indicate that the hanging walls lie to the west and the footwalls to the east of these reverse faults, respectively, which suggests Fl-1 is west-dipping.

4.3. The Stress Fields in the Jiujing Region

The Jiujing granite region is a convergent wrench zone, where the maximum compressive stress in the NE-SW direction [21,23] leads to the sinistral displacement of the entire granite pluton (Figure 14a). The NW-SE direction is thus elongated (AA’ in Figure 14a), which generates the NE-SW trending normal faults, such as F20-2, F20-1, F18, F17, F16-2, F15, and F14. Meanwhile, the crustal shortening (BB’ in Figure 14a) in the NE-SW direction leads to the formation of reverse faults (mostly trending in NW-SE and/or E-W), such as Fa, Fb, Fg, Fi-1, Fi-2, Fm, Fn, and Fo., explaining the superposition of compressional and extensional structures within the area.
The strike direction of the fault planes determines their shearing properties. Within this research, Fm, Fn, Fo, and Fg have a high angle to wrench strike (marked by XX’ in Figure 14b), so they can be classified as high-angle faults or antithetic strike-slip faults (marked by DD’ in Figure 14b). These are expected to shear dextrally due to NE compression, leading to sinistral strain of the entire granite body. The low-angle faults (also known as synthetic strike-slip faults, marked by CC’ in Figure 14b), which are subparallel to the wrench fault strike and directly impacted by this sinistral strain, tend to rotate anticlockwise, leading to prominent sinistral shearing properties, e.g., Fa, Fb, and Fi-2.
The evolutionary processes of the deformation in the Jiujing region can be interpreted based on the analogue modelling introduced by Tchalenko [46] and Schreurs [47]. The NE transpression first led to the formation of sinistral strike-slip faults such as F20-2, F20-1, F18, F17, F16-2, F15, and F14, with a high-dipping angle. As straining rates increased, the NW-SE trending convergent strike-slip faults such as Fg and Fm developed. In theory, these NW-SE reverse faults are expected to rotate in an anticlockwise direction to become lower angled, forming low-angle reverse faults (such as Fb and Fa), which would be horizontally elongated to the major fault plane, parallel the wrench strike, and would finally dominate the surface deformation.

4.4. The Factors Affecting Sentinel-1 Data

Atmospheric effects on the SAR data were corrected during PSI processing, so the observed vertical (DU) and eastward horizontal (DE) displacements may be caused by five factors: vegetation growth, groundwater level, surface sediment movement, surface rock erosion, and tectonic movement. Beishan lies within the semiarid environment of the Gobi Desert, with very little vegetative cover; therefore, the impact of vegetation is assumed to be negligible and thus excluded.
The average annual evaporation is 3200 mm, but the annual precipitation is only 60–120 mm and is concentrated in the summer months from July to September. Groundwater is recharged by precipitation, and the peak recharging period is in April despite the maximum precipitation being in July and August. Most of the rainwater in the summer period is removed by the high evaporation in this region, so the groundwater recharging in these months is low [31,48].
Groundwater recharge is expected to swell the ground surface seasonally in relation to the variations of local precipitation and evaporation. The Valley View Fault, Nevada, southwest USA has a similarly arid climate to Beishan. A case study from Bell [49] indicated groundwater can generate a maximum of 3 mm of seasonal amplitude due to the impact of hydraulic pressure. In the case of Beishan, the highest groundwater recharging is in April, which means the peak of the seasonal amplitudes is expected to occur shortly after this period due to the highest groundwater recharging amount. However, within the average time-series analyses shown in Figure 9a–f, this kind of seasonal amplitude is not considered significant. This indicates that the groundwater, which could exert the hydraulic pressure necessary to trigger seasonal uplift, is unlikely to have an impact in Beishan, confirming that groundwater has very little impact on surface deformation here.
The Quaternary sediments that cover the surface of granite blocks may also affect the measured Sentinel-1 data by masking the tectonic movements or causing significant spatial and temporal decoherence. In the case of Jiujing, this is mainly due to the existence of pore water and the deposition of sediments. As shown in Figure 3, most of the surface sediments within the Jiujing region are distributed at Bantan Basin, Ba’antan Basin, and Jiujing (Shiyuejing) Basin. To combine the information in Figure 3 with the deformation patterns in Figure 6, Figure 7, Figure 15 and Figure 16, depictions were produced to improve the understanding of the impacts of Quaternary sediments on surface deformations, where the distributed sediments are circled by black lines (Figure 15 and Figure 16).
The Sentinel-1 data at Bantan Basin, Ba’antan Basin, and Jiujing Basin show a loss of coherence (with the deformation data missing) due to the presence of pore water in the surface sediments, as shown in Figure 15 and Figure 16. That is because the subsidence triggered by normal faults F16, F18, and F20 lowers the topographic height of Bantan Basin, Ba’antan Basin, and Jiujing Basin, causing a discharge of shallow groundwater, surface water, and flood water towards the basin centres [31,32]. This increases the saturation of the sediments. As wet sediments absorb the microwave radiation [50] and contribute a less backscattered signal to the sensor, the interferograms produced between dates with different moisture levels are less coherent than those with similar moisture content [51].
In addition to pore water presence, the accumulation of surface sediments not only decreases the surface coherence, but also impacts the vertical deformation data, with most typical cases around Ba’antan Basin in JJ11. As shown in Figure 15, the red PS points representing uplifting scatterer targets can be found in the middle and north parts of Ba’antan Basin, even though the entire Block JJ11 is subsiding due to the impact of F20-2 and Fi-2. One interpretation is that this apparent uplift is due to the accumulation of surface sediment. This argument is supported by a past investigation that found that the Holocene sediments are still accumulating in the Jiujing region in modern times, with average accumulate rates of 0.1 and 0.4 mm a−1 at Ba’antan Basin and Jiujing Basin, respectively [23], indicating that modern sediments alter the surface of the granite section. Alternatively, lower moisture levels may cause uplift by unloading, or reduced dielectric delay of the radar signal, but this still requires further investigations.
Overall, the Quaternary sediments are present only in Bantan Basin, Ba’antan Basin, and Jiujing (Shiyuejing) Basin while most of the surface at Jiujing is characterised by exposed granite, as shown in Figure 3. The surface sediments only generate localised impacts and do not significantly influence the overall deformation pattern in the Jiujing region.
The surface rock eroded by natural aeolian, and alluvial processes will lower the surface elevation and make the rock appear as if it is subsiding. Past studies of granite or granodiorite erosion rates under arid, semiarid, temperate, and alpine climates show rates on the order of 10−3 mm a−1 [52,53,54,55,56,57], three orders of magnitude smaller than the average surface deformation rates measured here. Hence, granite erosion rates under natural processes are too low to have a significant effect on observed deformation rates.
Thus, the lack of vegetation cover, minor and predictable groundwater changes, and low erosion rate of granite are considered to have no significant impact on the observed vertical and horizontal velocity patterns. The accumulation of modern sediments appears to trigger the uplift in some parts of the granite surface but the influence on vertical deformation patterns is limited to Bantan Basin, Ba’antan Basin, and Jiujing (Shiyuejing) Basin. Furthermore, the coincidence of the deformation patterns with observed discontinuities in optical data strongly indicates that the vertical and eastward displacement of the PS points presented in Tables S1–S3 are mainly the result of active tectonic fault movements. In general, the long time-series analysis reveals movements, which, although very small, are in broadly consistent directions over contiguous areas. There is noise and small-scale local variation (which in turn lead to variable standard deviations) but the regional pattern within the blocks is broadly consistent. Therefore, the results are sufficiently convincing to be considered as real fault-controlled surface displacements.

5. Conclusions

This research investigates the vertical (DU) and eastward horizontal (DE) deformation of a convergent wrench fault zone in the Jiujing region in Beishan, China, and successfully demonstrates a new approach to mapping and characterising unidentified active faults in large rural areas. This improves the understanding of overall tectonic regimes.
The maximum deformation pattern (DMAX) is consistent with the maximum in situ compressive stress field. Based on the method of orthogonal decomposition and the measured eastward (DE) deformation, DMAX and DN are estimated and used to trace active fault lines along discontinuities and characterise previously unknown faults through the relative movements of footwall and hanging wall blocks.
This research found that:
(1)
Faults, such as F16-2, F17, F18 and F20-2, which had previously been interpreted as inactive, are still displacing vertically.
(2)
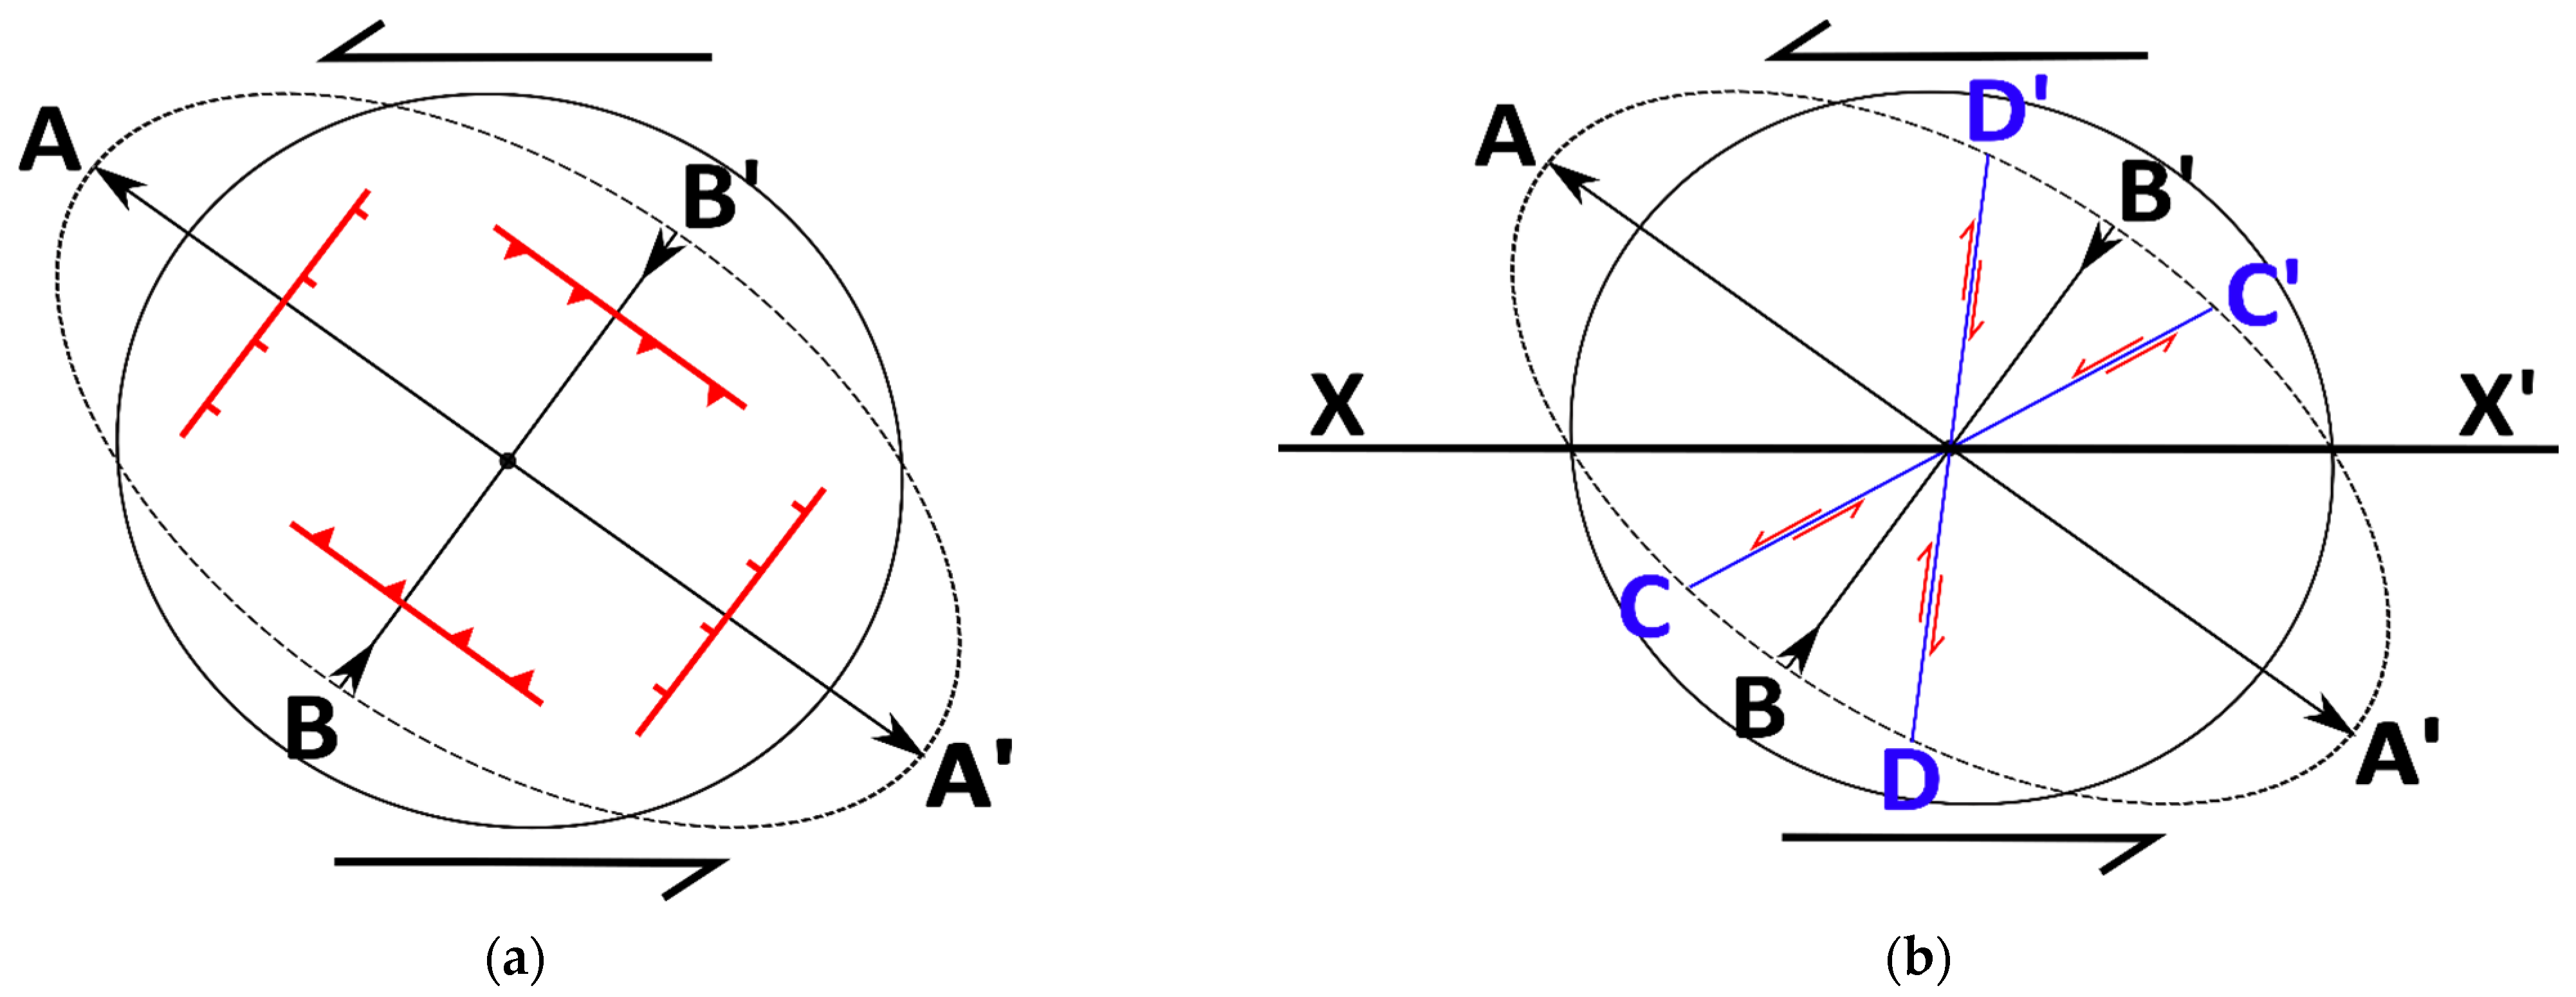
Furthermore, previously unidentified faults (Fa, Fb, Fc, Fg, Fi-1, Fi-2, Fl-1, Fl-2, Fm, Fn, and Fo) were mapped and their displacements characterised. The antithetic strike-slip faults Fm, Fn, Fo, and Fg with high angle-to-wrench strike are expected to shear dextrally due to NE compression; meanwhile, the synthetic strike-slip faults Fa, Fb, and Fi-2 that are subparallel to the wrench fault strike tend to rotate anticlockwise, showing sinistral shearing properties.
(3)
There is no significant difference in deformation between the two sides of boundary faults (F1 and F6), and these are therefore considered to be inactive.
(4)
Our results are consistent with the existing geodynamic model of a convergent wrench fault zone affected by NE compression, with crustal shortening in the NE-SW direction and NW-SE elongation, providing additional confidence that the PSI data discriminates patterns of active tectonic fault movement in this area.
(5)
Finally, vegetation, groundwater recharge, surface sediments accumulation, and granite erosion are shown to have only localised or negligible impacts on surface deformation.
These discoveries confirm PSI as a powerful and effective tool to trace the undiscovered active faults and monitor micro-scale movements on existing faults that were previously considered to be inactive. This study involves only the use of persistent point scatterers, which, in this arid region, has proven very effective. Through the future employment of distributed scatterers, the detection of micro-scale fault movements could be extended to more temperate and more populated regions where seismic hazard in intraplate regions is poorly quantified.
This research has also improved the understanding of the local stress regimes in Jiujing, which could greatly benefit the ongoing GDF siting investigation in this region of China. When these sub-millimetre-scale movements are considered over timescales of up to 100,000 years, they represent tens to hundreds of meters of displacement. Such significant and potentially hazardous displacements are important to the radioactive waste disposal agenda. Therefore, the newly identified active deformation along faults within the granite pluton should form part of the long-term safety case assessment for any future siting investigation.

Supplementary Materials

The following supporting information can be downloaded at: https://www.mdpi.com/article/10.3390/app12094222/s1, Table S1: The rates of vertical deformation (DU) at Block JJ1 to JJ30; Table S2: The rates of eastward deformation (DE) at Block JJ1 to JJ30; Table S3: The average ground displacements at Blocks JJ3, JJ6, JJ7, JJ12, JJ19 and JJ21; Figure S1: The normal distribution curve of vertical velocity at Block JJ2, JJ3, JJ4, JJ5, JJ12, JJ19, JJ20, JJ21, and JJ28.

Author Contributions

Conceptualization, Z.W.; Formal analysis, Z.W.; Investigation, Z.W.; Methodology, Z.W. and S.A.; Software, A.C. and S.A.; Supervision, J.L., R.G. and P.M.; Writing—original draft, Z.W.; Writing—review & editing, J.L., R.G., P.M., A.C., S.A. and T.M. All authors have read and agreed to the published version of the manuscript.

Funding

This research received no external funding.

Institutional Review Board Statement

The study did not require ethical approval.

Informed Consent Statement

Not applicable.

Data Availability Statement

The study did not report any data.

Conflicts of Interest

The authors declare no conflict of interest.

References

  1. Wilcox, R.E.; Harding, T.T.; Seely, D.R. Basic wrench tectonics. AAPG Bull. 1973, 57, 74–96. [Google Scholar]
  2. Bader, W.J. Wrench Fault Tectonics. North American: Geo News, January 2020; pp. 20–24. Available online: https://www.dmr.nd.gov/ndgs/documents/newsletter/2020Winter/Wrench_Fault_Tectonics.pdf (accessed on 11 November 2020).
  3. Parcharidis, I.; Foumelis, M.; Kourkouli, P.; Wegmuller, U. Persistent Scatterers InSAR to detect ground deformation over Rio-Antirio area (Western Greece) for the period 1992–2000. J. Appl. Geophys. 2009, 68, 348–355. [Google Scholar] [CrossRef]
  4. Liu, B.; Luo, Y.; Zhang, J.; Gong, L.; Jiang, W.; Ren, L. PS-InSAR time series analysis for measuring surface deformation before the L’Aquila earthquake. In Proceedings of the 2010 IEEE International Geoscience and Remote Sensing Symposium, Honolulu, HI, USA, 25–30 July 2010; IEEE: Piscataway, NJ, USA, 2010; pp. 4604–4607. [Google Scholar]
  5. Champenois, J.; Fruneau, B.; Pathier, E.; Deffontaines, B.; Lin, K.C.; Hu, J.C. Monitoring of active tectonic deformations in the Longitudinal Valley (Eastern Taiwan) using Persistent Scatterer InSAR method with ALOS PALSAR data. Earth Planet. Sci. Lett. 2012, 337, 144–155. [Google Scholar] [CrossRef]
  6. Cigna, F.; Osmanoğlu, B.; Cabral-Cano, E.; Dixon, T.H.; Ávila-Olivera, J.A.; Garduño-Monroy, V.H.; DeMets, C.; Wdowinski, S. Monitoring land subsidence and its induced geological hazard with Synthetic Aperture Radar Interferometry: A case study in Morelia, Mexico. Remote Sens. Environ. 2012, 117, 146–161. [Google Scholar] [CrossRef]
  7. Yang, C.S.; Zhang, Q.; Zhao, C.Y.; Wang, Q.L.; Ji, L.Y. Monitoring land subsidence and fault deformation using the small baseline subset InSAR technique: A case study in the Datong Basin, China. J. Geodyn. 2014, 75, 34–40. [Google Scholar] [CrossRef]
  8. Yang, C.; Zhang, Q.; Zhao, C. Ground deformation investigation over Taiyuan Basin (China) by InSAR technology. In Proceedings of the IEEE International Geoscience and Remote Sensing Symposium (IGARSS), Beijing, China, 10–15 July 2016; IEEE: Piscataway, NJ, USA, 2016; pp. 6831–6834. [Google Scholar]
  9. Cetin, E.; Cakir, Z.; Meghraoui, M.; Ergintav, S.; Akoglu, A.M. Extent and distribution of aseismic slip on the Ismetpaşa segment of the North Anatolian Fault (Turkey) from Persistent Scatterer InSAR. Geochem. Geophys. Geosyst. 2014, 15, 2883–2894. [Google Scholar] [CrossRef] [Green Version]
  10. Mason, P.J.; Ghail, R.C.; Bischoff, C.; Skipper, J.A. Detecting and monitoring small-scale discrete ground movements across London, using Persistent Scatterer InSAR (PSI). In Proceedings of the Geotechnical Engineering for Infrastructure and Development: XVI European Conference on Soil Mechanics and Geotechnical Engineering, Edinburgh, Scotland, 13–17 September 2015. [Google Scholar]
  11. Deffontaines, B.; Chang, K.J.; Champenois, J.; Lin, K.C.; Lee, C.T.; Chen, R.F.; Hu, J.C.; Magalhaes, S. Active tectonics of the onshore Hengchun Fault using UAS DSM combined with ALOS PS-InSAR time series (Southern Taiwan). Nat. Hazards Earth Syst. Sci. 2018, 18, 829–845. [Google Scholar] [CrossRef] [Green Version]
  12. Hu, L.; Dai, K.; Xing, C.; Li, Z.; Tomás, R.; Clark, B.; Shi, X.; Chen, M.; Zhang, R.; Qiu, Q.; et al. Land subsidence in Beijing and its relationship with geological faults revealed by Sentinel-1 InSAR observations. Int. J. Appl. Earth Obs. Geoinf. 2019, 82, 101886. [Google Scholar] [CrossRef]
  13. Scoular, J.; Ghail, R.; Mason, P.; Lawrence, J.; Bellhouse, M.; Holley, R.; Morgan, T. Retrospective InSAR analysis of East London during the construction of the Lee Tunnel. Remote Sens. 2020, 12, 849. [Google Scholar] [CrossRef] [Green Version]
  14. van der Horst, T.; Rutten, M.M.; van de Giesen, N.C.; Hanssen, R.F. Monitoring land subsidence in Yangon, Myanmar using Sentinel-1 persistent scatterer interferometry and assessment of driving mechanisms. Remote Sens. Environ. 2018, 217, 101–110. [Google Scholar] [CrossRef] [Green Version]
  15. Dang, V.K.; Nguyen, T.D.; Dao, N.H.; Duong, T.L.; Dinh, X.V.; Weber, C. Land subsidence induced by underground coal mining at Quang Ninh, Vietnam: Persistent scatterer interferometric synthetic aperture radar observation using Sentinel-1 data. Int. J. Remote Sens. 2021, 42, 3563–3582. [Google Scholar] [CrossRef]
  16. Wang, J. High-level radioactive waste disposal in China: Update 2010. J. Rock Mech. Geotech. Eng. 2010, 2, 1–11. [Google Scholar]
  17. Guo, Y.H.; Wang, J.; Xiao, F.; Wang, Z.M.; Liu, S.F.; Rui, S.; Zong, Z.H.; Li, Y.W.; Wang, H.L. Groundwater formation in Beishan (Gansu) preselected area of high-level radioactive waste disposal repository. Geol. J. China Univ. 2010, 16, 13–18. [Google Scholar]
  18. Xu, G.; Wang, J.; Jin, Y.; Chen, W. Study of the crustal stability of the Beishan area, Gansu province, China-the preselected area for China’s high-level radioactive waste repository. In The Progress Report of Geological Disposal of High-Level Radioactive Waste in China in the Past Ten Years; U.S. Department of Energy Office of Scientific and Technical Information: Washington, DC, USA, 2004. [Google Scholar]
  19. Guo, J.; Zhang, Z.; Wang, J.; Chen, W. The Preliminary Assessment of the Tectonic Activity in Beishan Area; Chinese Society of Mineralogy, Petrology and Geochemistry: Guiyang, China, 2007; Volume 11. [Google Scholar]
  20. Yang, H.; Cunningham, D.; Yang, X. Quaternary crustal reactivation of the southwestern Beishan, NW China: The Liuyuan sinistral transpressional duplex. Tectonophysics 2021, 803, 228758. [Google Scholar] [CrossRef]
  21. Ma, L.K. Study on the Long-Term Stability of Beishan Granitic Host Rock for High-Level Radioactive Waste Repository in the Beishan Area in Gansu Province. Ph.D. Thesis, Beijing Research Institute of Uranium Geology, Beijing, China, 2017. [Google Scholar]
  22. Guo, L.; Wu, L.; Zhang, J.; Liao, M.; Ji, Y. Identification of homogeneous region boundaries of fractured rock masses in candidate sites for Chinese HLW repository. Bull. Eng. Geol. Environ. 2020, 79, 4221–4243. [Google Scholar] [CrossRef]
  23. Wang, F.; Wang, J.; Fan, H.H.; Su, G.; Xu, J.; Wang, H.Z. Distribution of Late Quaternary active faults and its tectonic significance in the Beishan region, Gansu Province, China. Geol. Rev. 2005, 51, 250–259. [Google Scholar]
  24. Zhao, X.G.; Wang, J.; Cai, M.; Ma, L.K.; Zong, Z.H.; Wang, X.Y.; Su, R.; Chen, W.M.; Zhao, H.G.; Chen, Q.C.; et al. In-situ stress measurements and regional stress field assessment of the Beishan area. China. Eng. Geol. 2013, 163, 26–40. [Google Scholar] [CrossRef]
  25. Yun, L. An Investigation of the Tectonic Stability at Potential GDF Host Rock in Xinchang and Jijicao. Ph.D. Thesis, Beijing Research Institute of Uranium Geology, Beijing, China, 2014. [Google Scholar]
  26. Zhao, H.G.; KUNZ, H.; WANG, J. 3D geological modelling in Jiujing block, Beishan area, Gansu Province and application of rock flow to nuclides migration simulation. Chin. J. Rock Mech. Eng. 2007, 26, 3989–3994. [Google Scholar]
  27. Lu, H. Study on Geological Characteristics and 3d Geological Modelling of Xinchang Underground Laboratory Site. Ph.D. Thesis, Beijing Research Institute of Uranium Geology, Beijing, China, 2019. [Google Scholar]
  28. Wan, H. Electromagnetic Method Detection of Granite Body Distribution and Internal Structure in Xinchang Area of Beishan, Gansu. Master’s Thesis, East China Institute of Technology, Nanchang, China, 2015. [Google Scholar]
  29. Wang, J.; Chen, W.; Jin, Y.; Su, R. Geology of Jiujing section, Beishan area, Gansu province-the preselected area for China’s high-level radioactive waste repository (on the scale of 1/50,000). In The Progress Report of Geological Disposal of High-Level Radioactive Waste in China in the Past Ten Years; U.S. Department of Energy Office of Scientific and Technical Information: Washington, DC, USA, 2004. [Google Scholar]
  30. Wang, J.; Su, R.; Chen, W.M.; Guo, Y.H.; Jin, Y.X.; Wen, Z.J.; Liu, Y.M. Deep geological disposal of high-level radioactive wastes in China. Chin. J. Rock Mech. Eng. 2006, 25, 649–658. [Google Scholar]
  31. Li, J. An Investigation of the Groundwater Recharging from Atmospheric Precipitation in Arid Area: A Case Study at Xinchang-Xiangyangshan Pre-Selected Region in Beishan, China. Master’s Thesis, Beijing Research Institute of Uranium Geology, Beijing, China, 2014. [Google Scholar]
  32. Xiao, F.; Wang, J.; Guo, Y.; Wang, Z.; Su, R. Progress of hydrogeological studies in Beishan preselected area of disposal repository for high level radioactive waste in China. Uranium Geol. 2011, 27, 185–192. [Google Scholar]
  33. Massonnet, D.; Feigl, K.L. Radar interferometry and its application to changes in the Earth’s surface. Rev. Geophys. 1998, 36, 441–500. [Google Scholar] [CrossRef] [Green Version]
  34. Bürgmann, R.; Rosen, P.A.; Fielding, E.J. Synthetic aperture radar interferometry to measure Earth’s surface topography and its deformation. Annu. Rev. Earth Planet. Sci. 2000, 28, 169–209. [Google Scholar] [CrossRef]
  35. Hanssen, R.F. Radar Interferometry: Data Interpretation and Error Analysis; Springer Science & Business Media: Berlin/Heidelberg, Germany, 2001; Volume 2. [Google Scholar]
  36. Ferretti, A.; Prati, C.; Rocca, F. Nonlinear subsidence rate estimation using permanent Scatterer in differential SAR interferometry. IEEE Trans. Geosci. Remote Sens. 2000, 38, 2202–2212. [Google Scholar] [CrossRef] [Green Version]
  37. Ferretti, A.; Prati, C.; Rocca, F. Permanent scatterers in SAR interferometry. IEEE Trans. Geosci. Remote Sens. 2001, 39, 8–20. [Google Scholar] [CrossRef]
  38. MDA Corporation. Persistent Scatterer (PS) InSAR. 2020. Available online: https://mdacorporation.com/geospatial/international/products-services/insar/technology/permanent-scatterer-insar/ (accessed on 11 November 2020).
  39. Jiang, S.; Shi, F.; Hu, B.; Wang, W.; Lin, Q. Monitoring of the Ground Subsidence in Macao Using the PSI Technique. In Proceedings of the International Conference on Geo-Spatial Knowledge and Intelligence, Chiang Mai, Thailand, 8–10 December 2017; Springer: Singapore, 2017; pp. 250–261. [Google Scholar]
  40. Hu, B.; Chen, J.; Zhang, X. Monitoring the land subsidence area in a coastal urban area with InSAR and GNSS. Sensors 2019, 19, 3181. [Google Scholar] [CrossRef] [Green Version]
  41. Fárová, K.; Jelének, J.; Kopačková-Strnadová, V.; Kycl, P. Comparing DInSAR and PSI techniques employed to Sentinel-1 data to monitor highway stability: A case study of a massive Dobkovičky landslide, Czech Republic. Remote Sens. 2019, 11, 2670. [Google Scholar] [CrossRef] [Green Version]
  42. Wang, X.; Han, Z.; Zhang, L.; Zhou, J. Regional engineering geology suitability assessment for high-level radioactive waste disposal of pre-selected alxa area. J. Eng. Geol. 2018, 26, 1715–1723. [Google Scholar]
  43. Ng, A.H.M.; Ge, L.; Zhang, K.; Chang, H.C.; Li, X.; Rizos, C.; Omura, M. Deformation mapping in three dimensions for underground mining using InSAR–Southern highland coalfield in New South Wales, Australia. Int. J. Remote Sens. 2011, 32, 7227–7256. [Google Scholar] [CrossRef]
  44. Fialko, Y.; Simons, M.; Agnew, D. The complete (3-D) surface displacement field in the epicentral area of the 1999 Mw7. 1 Hector Mine earthquake, California, from space geodetic observations. Geophys. Res. Lett. 2001, 28, 3063–3066. [Google Scholar] [CrossRef] [Green Version]
  45. Sarmap, S.A. SARscape 5.5.4. 2020. Available online: https://www.sarmap.ch/tutorials/PS_Tutorial_V_0_9.pdf (accessed on 14 November 2020).
  46. Tchalenko, J.S. Similarities between shear zones of different magnitudes. Geol. Soc. Am. Bull. 1970, 81, 1625–1640. [Google Scholar] [CrossRef]
  47. Schreurs, G.; Colletta, B. Analogue modelling of faulting in zones of continental transpression and transtension. Geol. Soc. 1998, 135, 59–79. [Google Scholar] [CrossRef]
  48. Guo, Y.H.; Wang, J.; Lü, C.H. Chemical characteristics of groundwater and water-rock interaction: Modeling of the Yemaquan preselected area for China’s high-level radioactive waste repository. Earth Sci. Front. 2005, 12 (Suppl. S1), 117–123. [Google Scholar]
  49. Bell, J.W.; Amelung, F.; Ferretti, A.; Bianchi, M.; Novali, F. Permanent scatterer InSAR reveals seasonal and long-term aquifer-system response to groundwater pumping and artificial recharge. Water Resour. Res. 2008, 44. [Google Scholar] [CrossRef] [Green Version]
  50. Barrett, B.W.; Dwyer, E.; Whelan, P. Soil moisture retrieval from active spaceborne microwave observations: An evaluation of current techniques. Remote Sens. 2009, 1, 210–242. [Google Scholar] [CrossRef] [Green Version]
  51. Scott, C.P.; Lohman, R.B.; Jordan, T.E. InSAR constraints on soil moisture evolution after the March 2015 extreme precipitation event in Chile. Sci. Rep. 2017, 7, 4903. [Google Scholar] [CrossRef] [PubMed]
  52. Matmon, A.; Mushkin, A.; Enzel, Y.; Grodek, T.; ASTER Team. Erosion of a granite inselberg, Gross Spitzkoppe, Namib desert. Geomorphology 2013, 201, 52–59. [Google Scholar] [CrossRef]
  53. Small, E.E.; Anderson, R.S.; Repka, J.L.; Finkel, R. Erosion rates of alpine bedrock summit surfaces deduced from in situ 10Be and 26Al. Earth Planet. Sci. Lett. 1997, 150, 413–425. [Google Scholar] [CrossRef]
  54. Nishiizumi, K.; Kohl, C.P.; Arnold, J.R.; Dorn, R.; Klein, I.; Fink, D.; Middleton, R.; Lal, D. Role of in situ cosmogenic nuclides 10Be and 26Al in the study of diverse geomorphic processes. Earth Surf. Processes Landf. 1993, 18, 407–425. [Google Scholar] [CrossRef]
  55. Bierman, P.R. Cosmogenic Isotopes and the Evolution of Granitic Landforms. Ph.D. Thesis, University of Washington, Washington, DC, USA, 1993, unpublished. [Google Scholar]
  56. Bierman, P.; Turner, J. 10Be and 26Al evidence for exceptionally low rates of Australian bedrock erosion and the likely existence of pre-Pleistocene landscapes. Quat. Res. 1995, 44, 378–382. [Google Scholar] [CrossRef]
  57. Granger, D.E.; Kirchner, J.W.; Finkel, R. Spatially averaged long-term erosion rates measured from in situ-produced cosmogenic nuclides in alluvial sediment. J. Geol. 1996, 104, 249–257. [Google Scholar] [CrossRef]
Figure 1. Location of Beishan area in Gansu Province, northwest China (highlighted by red box).
Applsci 12 04222 g001
Figure 2. Structural geology map around Beishan [20] highlighting the locations of Beishan, Tarim Basin, Aerjin Fault System (Altyn Tagh Fault), and Qilian Mountains. The study area is indicated by the blue dashed outline, labelled Figure 3.
Applsci 12 04222 g002
Figure 3. The map of the Jiujing granite region shows the distribution of faults, Quaternary sediments, exposed formations, and the granite, where BS01, BS02, and BS03 refer to borehole number. Information is summarised from literature [21,22].
Applsci 12 04222 g003
Figure 4. The estimation of horizontal displacement components: (a) eastward (DE) through the decomposition of ascending and descending orbit direction data [45] and (b) northward (DN) and maximum displacement (DMAX) along N35°E based on the measured eastward displacement (DE).
Applsci 12 04222 g004
Figure 5. The schematic illustrations of (a) normal fault and (b) reverse fault.
Applsci 12 04222 g005
Figure 6. The pattern of vertical deformation (DU) in the Jiujing region, where the positive values (upper, red side of colour axis) refer to the uplift and negative values (blue, lower side of colour axis) refers to subsidence. Values in white text indicate movement rates with standard deviations in mm a1 and the full data are presented in Table S1 in Supplementary Materials.
Applsci 12 04222 g006
Figure 7. The pattern of horizontal deformation (DE) in the Jiujing region, where the positive values (red- and yellow-coloured) refer to eastward horizontal displacements and the negative values (blue-coloured) refers to westward displacements. Values in white text indicate movement rates with standard deviations in mm a−1 and the full data are presented in Table S2 in Supplementary Materials.
Applsci 12 04222 g007
Figure 8. The distribution of faults in the Jiujing region in a Google Earth image, where faults found in the literature are highlighted by black lines and the newly identified faults are highlighted by blue lines.
Applsci 12 04222 g008
Figure 9. (af). (a) The average time-series analysis for JJ6 along Fa. JJ6 subsided by 0.5 mm from October 2017 to February 2020, equivalent to an annual rate around 0.2 mm; (b) the average time-series analysis for JJ7 along Fa. JJ7 uplifted by 0.2 mm from October 2017 to February 2020, equivalent to an annual rate of about 0.07 mm; (c) the average time-series analysis for JJ3 along Fg. JJ3 uplifted by 1.0 mm from October 2017 to February 2020, equivalent to an annual rate of about 0.40 mm; (d) the average time-series analysis for JJ12 along Fg. JJ12 subsided by 0.5 mm from October 2017 to February 2020, equivalent to an annual rate of about 0.2 mm a−1; (e) the average time-series analysis for JJ19 along Fm, Fn, and Fo. JJ19 uplifted by 1 mm from October 2017 to February 2020, equivalent to an annual rate around 0.40 mm; (f) The average time-series analysis for JJ21 along Fm, Fn and Fo suggests JJ21 subsided slightly by 0.03 mm a−1 from October 2017 to February 2020.
Applsci 12 04222 g009aApplsci 12 04222 g009b
Figure 10. Vertical displacement along cross-section AA’ shown in Figure 6. This cross-section is formed from 300 PS displacement values sampled along the cross-section line and shows the annual relative movements within each fault block. The marked faults are interpreted from the PS displacement maps and they are illustrative, showing the sense of fault movement and general direction of faults.
Applsci 12 04222 g010
Figure 11. Vertical displacement distribution along cross-section BB’ in Figure 6. This cross-section is formed from 300 PS values sampled along the cross-section line and shows the annual relative movements within each fault block. The marked faults are interpreted from the PS and they are illustrative, showing the sense of fault movement and general direction of faults.
Applsci 12 04222 g011
Figure 12. Vertical displacement distribution along cross-section CC’ in Figure 6. This cross-section is formed from 300 PS values sampled along the cross-section line and shows the annual relative movements within each fault block. The marked faults are interpreted from the PS, and they are illustrative, showing the sense of fault movement and general direction of faults.
Applsci 12 04222 g012
Figure 13. A schematic figure illustrating the direction of maximum compression (σ1) and the two components (σV and σH) along Fl-1. This relationship leads to dextral slip along the fault plane, so that JJ12 to JJ15 are displacing towards the southeast.
Applsci 12 04222 g013
Figure 14. The schematic diagrams to illustrate: (a) the sinistral shearing of the Jiujing granite region due to the impacts of NE compression, where the long ellipse axis (AA’) marks the direction of elongation and the short axis (BB’) marks the direction of shortening and (b) the shearing properties of high-angle faults (also known as antithetic strike-slip faults, marked by axis DD’) and low-angle faults (also known as synthetic strike-slip faults, marked by axis CC’) under the NE compression. Axis XX’ refers to wrench strike. Modified after Wilcox [1].
Applsci 12 04222 g014
Figure 15. The locations of Bantan Basin, Ba’antan Basin, and Jiujing Basin within vertical deformation (DU) patterns (black outlines indicate Quaternary sediments).
Applsci 12 04222 g015
Figure 16. The locations of Bantan Basin, Ba’antan Basin, and Jiujing Basin within horizontal deformation (DE) patterns (black outlines indicate Quaternary sediments).
Applsci 12 04222 g016
Table 1. The characteristics of Jiujing region faults in the literature.
Fault No. Dipping Direction Vertical Shearing Component Lateral Shearing Component Dip Angle Reference
F1South or NorthReverseDextral or sinistral--[23,25]
F6South or NorthReverseSinistral60°–75°[27,28]
F14NorthwestNormalSinistral63°[25]
F15Northwest or SoutheastNormalSinistral≈90°[25]
F16-1NorthwestNormal----[25]
F16-2NorthwestNormalSinistral75°[25]
F17NorthwestNormalSinistral80°[25]
F18Northwest or SoutheastNormal--70°–80°[23,25]
F19NorthwestNormal--≈90°[25]
F20-1NorthwestNormalSinistral--[23,25]
F20-2NorthwestNormalSinistral--[23,25]
F20-3NorthwestNormalSinistral--[23,25]
F20-4NorthwestNormalSinistral--[23,25]
Table 2. The characteristics of newly identified active faults in Jiujing region.
Fault No. Dipping Direction Vertical Shearing Component Lateral Shearing Component
FaSouthReverseSinistral
FbSouthReverseSinistral
FcEastNormal--
FgNortheastReverseDextral
Fi-1EastReverse--
Fi-2NorthReverseSinistral
Fl-1SouthwestReverseDextral
FmEastReverse--
FnEastReverse--
FoEastReverse--
Publisher’s Note: MDPI stays neutral with regard to jurisdictional claims in published maps and institutional affiliations.

