1. Introduction
The current era is the age of advanced technology and research in various domains of information technology, computer vision, and artificial intelligence. These domains open the way to develop smart technologies and smart tools with the help of existing cameras and motion-based sensors. These smart tools enable a way to find solutions in various domains, one of which is to find and estimate human behavior that proves to be very useful for improving the lifelog of humans and advancement in the living standard of society. However, some challenges and issues still exist in this domain such as noise reduction, posture estimation, behavior mining, cost-efficient system, pedestrian behavior mining, data optimization, and the classification of various events and activities. These issues still need to be addressed with the help of previous knowledge and current technology.
Currently, motion sensors and camera-based human motion detection techniques are used in various domains and smart applications [
1,
2,
3]. While these applications are a part of smart systems such as smart homes, the internet of things [
4,
5], machine learning-based prediction systems [
6], information security and encryption [
7], smart emergency systems [
8], educational and managements system, e-learning approaches, smart transport systems, and smart medical systems, in the security domain, it may help to find the anomaly and normal behavior of human and even nonhuman objects [
9,
10,
11], while in the education system users can monitor the behavior of students. In the sports domain, we also find the behavior of the players and crowd [
12]. Similarly, in the medical domain using the EBP system, we can predict the behavior of patients, doctors, and visitors [
13], while in smart homes or internet of things-based systems we can predict the nonhuman-based objects’ behavior and as well as human behavior.
Thus, in this article, we designed a robust approach for extrinsic behavior prediction of the pedestrian in indoor and outdoor crowd scenes. Initially, indoor and outdoor crowd-based data are considered as the input for the proposed system; then human silhouette extraction, human verification, crowd analysis, and crowd clustering are the next phase of the system. After the extraction of a human silhouette, the next step is to extract the features to predict more accurate human behavior. That is, three main features are extracted from all the datasets such as deep flow, force flow matrix, and interaction force. To minimize the repetition of features data and reduce the use of computational resources, we use the graph mining approach and to find extrinsic behavior prediction of pedestrians; the maximum entropy Markov model [
14,
15,
16] is used, which is one of the advanced models to predict more accurate over complex datasets. Three main publicly available datasets are used, namely avenue_dataset, crowd-activity_UMN_dataset, and A Day on Campus (ADOC). Our contributions are as follows:
We proposed a robust human silhouette extraction approach and human verification method in crowded outdoor and indoor environments.
We constructed a graph mining optimization approach and maximum entropy Markov model, which presented relevant information along with classifying pedestrian behaviors for complicated crowd indoor and outdoor data.
Furthermore, three major benchmark datasets were thoroughly evaluated, providing a remarkable performance in comparison with other state-of-the-art approaches.
The rest of this paper is structured as follows. We evaluate the associated methods of pedestrian behavior mining in
Section 2.
Section 3 contains the proposed EPB methodology and features extraction approach along with graph mining and the maximum entropy Markov model.
Section 4 describes the tentative design and the outcomes of the evaluation with present recognized statistical state-of-the-art approaches. Finally,
Section 5 concludes the paper and suggests some future trends.
2. Related Work
Over the decades, a variety of ways to solve the crowd activity recognition challenge have been offered. In particular, tracking features in extremely dense and complex crowds is impossible, as per Kratz and Nishino [
17] and Marques et al. [
18], and optical flow estimation can become undependable. By identifying fixed-length spatio-temporal dimensions and generating spatio-temporal variations of gray levels that are characterized using a 3D Gaussian Mixture Framework, Kratz and Nishino. [
17] avoid optical flow-based motion description (GMM) [
19,
20,
21,
22]. The researchers used Hidden Markov Model [
23,
24,
25] to design behavior patterns and identify additional observations as abnormal if they do not fit the trained model. While working against crowds, Wang and Xu. [
26] resist using an optical flow-based representation and used statistical data calculated from Fourier-converted spatio-temporal segments collected from a spatio-temporal region. Although the usefulness of optical flow when working with crowds is sometimes a matter of theoretical debate, several approaches use optical flow measurements with excellent results. Ryan et al. [
27] used a three-dimensional Obtained Co-occurrence Matrix (GLCM) architecture to record optical flow vectors, indicating the movements of a particular region through moving homogeneity. The researchers use a Gaussian Mixture Model to create a normalcy prediction. The authors claimed that their strategy is efficient at distinguishing between regular and aberrant situations while preserving a processing capability of around 9 fps, which is essentially real-time. Wang et al. [
28] used two different techniques, one-class Support Vector Machines (SVM) [
29] understanding and Kernel integrates, to calculate the multilateral Histogram of Optical Flow Orientation (HOFO) [
30,
31,
32] on a per-frame premise and framework-appropriate behavior. When combined with their predictor, the obtained ideas of both techniques have been effective at simulating the appropriate behavior; only one-class SVM performed somewhat better. Chen et al. [
33] created the concept of crowd velocity and claimed that quick variations in velocity can be employed to distinguish a crowd demonstrating appropriate behavior from one that is now experiencing panic. The issue of anomalous behavioral science, according to Biswas et al. [
34], has been detected in limited or infrequent actions. Each frame has been presented as a vector representation, and matrix reduction has been used to divide the protein complexes into two groups.
Despite previous EBP research studies, there are still some challenges in dynamic motion and crowd analysis. Therefore, we proposed a novel approach for EBP in this research paper that is an innovation compared to previous research studies. For this, we took three major benchmark datasets as input to the system. Initially, pre-processing, background subtraction, and human detection were performed. The next step was to extract the features from the extraction of human shape and body information. Furthermore, we applied the heuristic approach to minimize the data and repetition problem via the graph mining approach. Finally, the maximum entropy Markov model was applied for the classification and recognition of pedestrian behaviors for complicated crowd indoor and outdoor data. After an evaluation of the system, our model is shown to provide a remarkable performance in comparison with other state-of-the-art approaches.
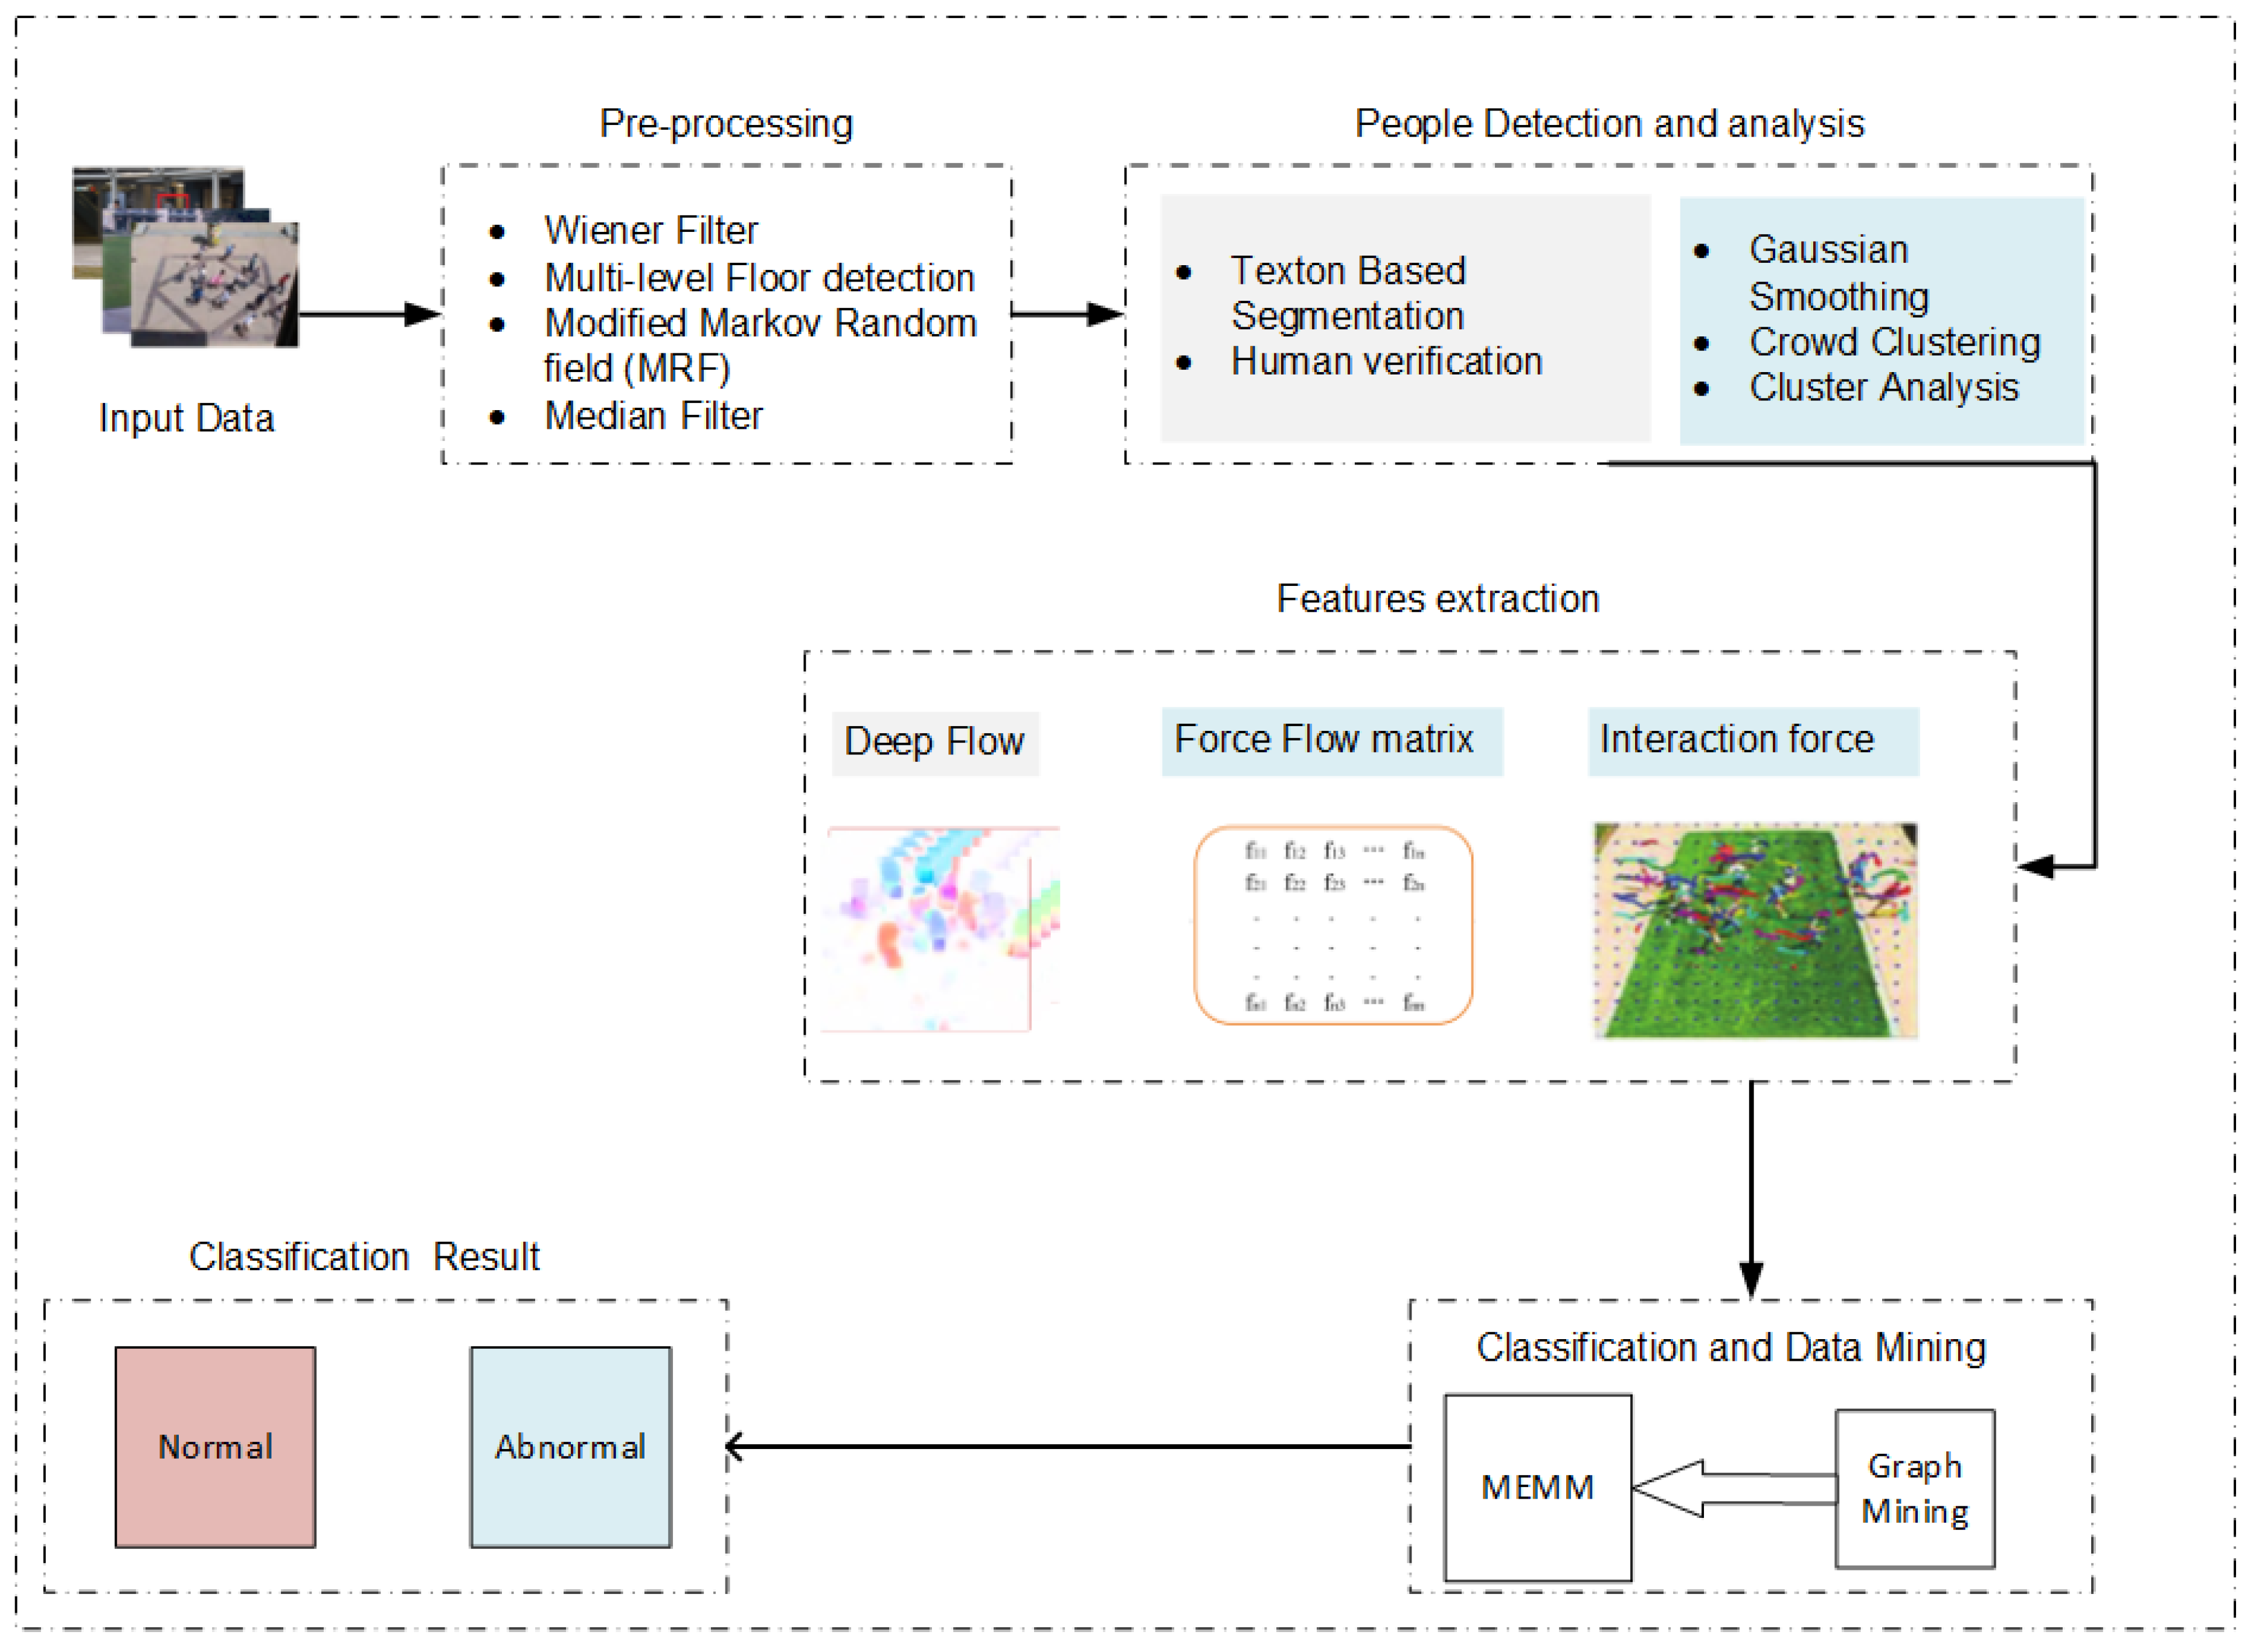
3. System Model of Proposed EBP
Primarily, the designed extrinsic behavior prediction (EBP) system is based upon red green and blue (RGB) images, a sequence of frames, and video dataset. Some steps are required, such as dealing with motion blur noise, frame sizing, and the conversion of frames from images. The next step is defined as people detection and analysis, which is contained human silhouette, human detection, human verification, crowd clustering, and analysis. After that, the feature extraction phase contains interaction force, force flow matrix, and deep flow features. Finally, the last step is to minimize the data through the graph mining data optimization approach, and the maximum entropy Markov model is applied over the output optimal feature vector for extrinsic behavior prediction. The graphical representation of our comprehensive method is presented in
Figure 1.
3.1. Data Acquisition and filtering
For classification of the crowd-based scenes, in most cases, videos and sequences of image-based data are acquired as an input of the system. Such types of data are much more sensitive towards motion blur noise. Noise in images or videos data may cause an increase in the production cost of a smart system and make it difficult to find accurate results [
35]. To deal with this initially, the Wiener filter [
36] was adopted, which is more sensitive to finding and restoring the images against motion blur noise. Equation (1) represents the mathematical relationship of the Wiener filter.
where
are the actual data, and
are the large area and
the filter values. To find more accurate results, we used a modified Markov random field (MRF) [
37], which is based on the Bayesian concept; Markov random field theory gives the possibility of providing a structured methodology to visual analysis. The frequent patterns of visuals are modeled using Markov random fields (MRFs). This provides a variety of analytical methods and methodologies for addressing so-called inadequacy issues, in which the observed data does not provide a correct method. To enhance the human silhouette results, a multi-level floor detection process is adopted in which floor detection is performed to remove the unnecessary information from the frame. Finally, a median filter [
38] is applied to optimize the silhouette and to show more precise results. Equation (2) shows the mathematical formula of the median filter.
where
i and
j narrate to categorization frame n having uncertain district cantered adjacent pixels
in an image.
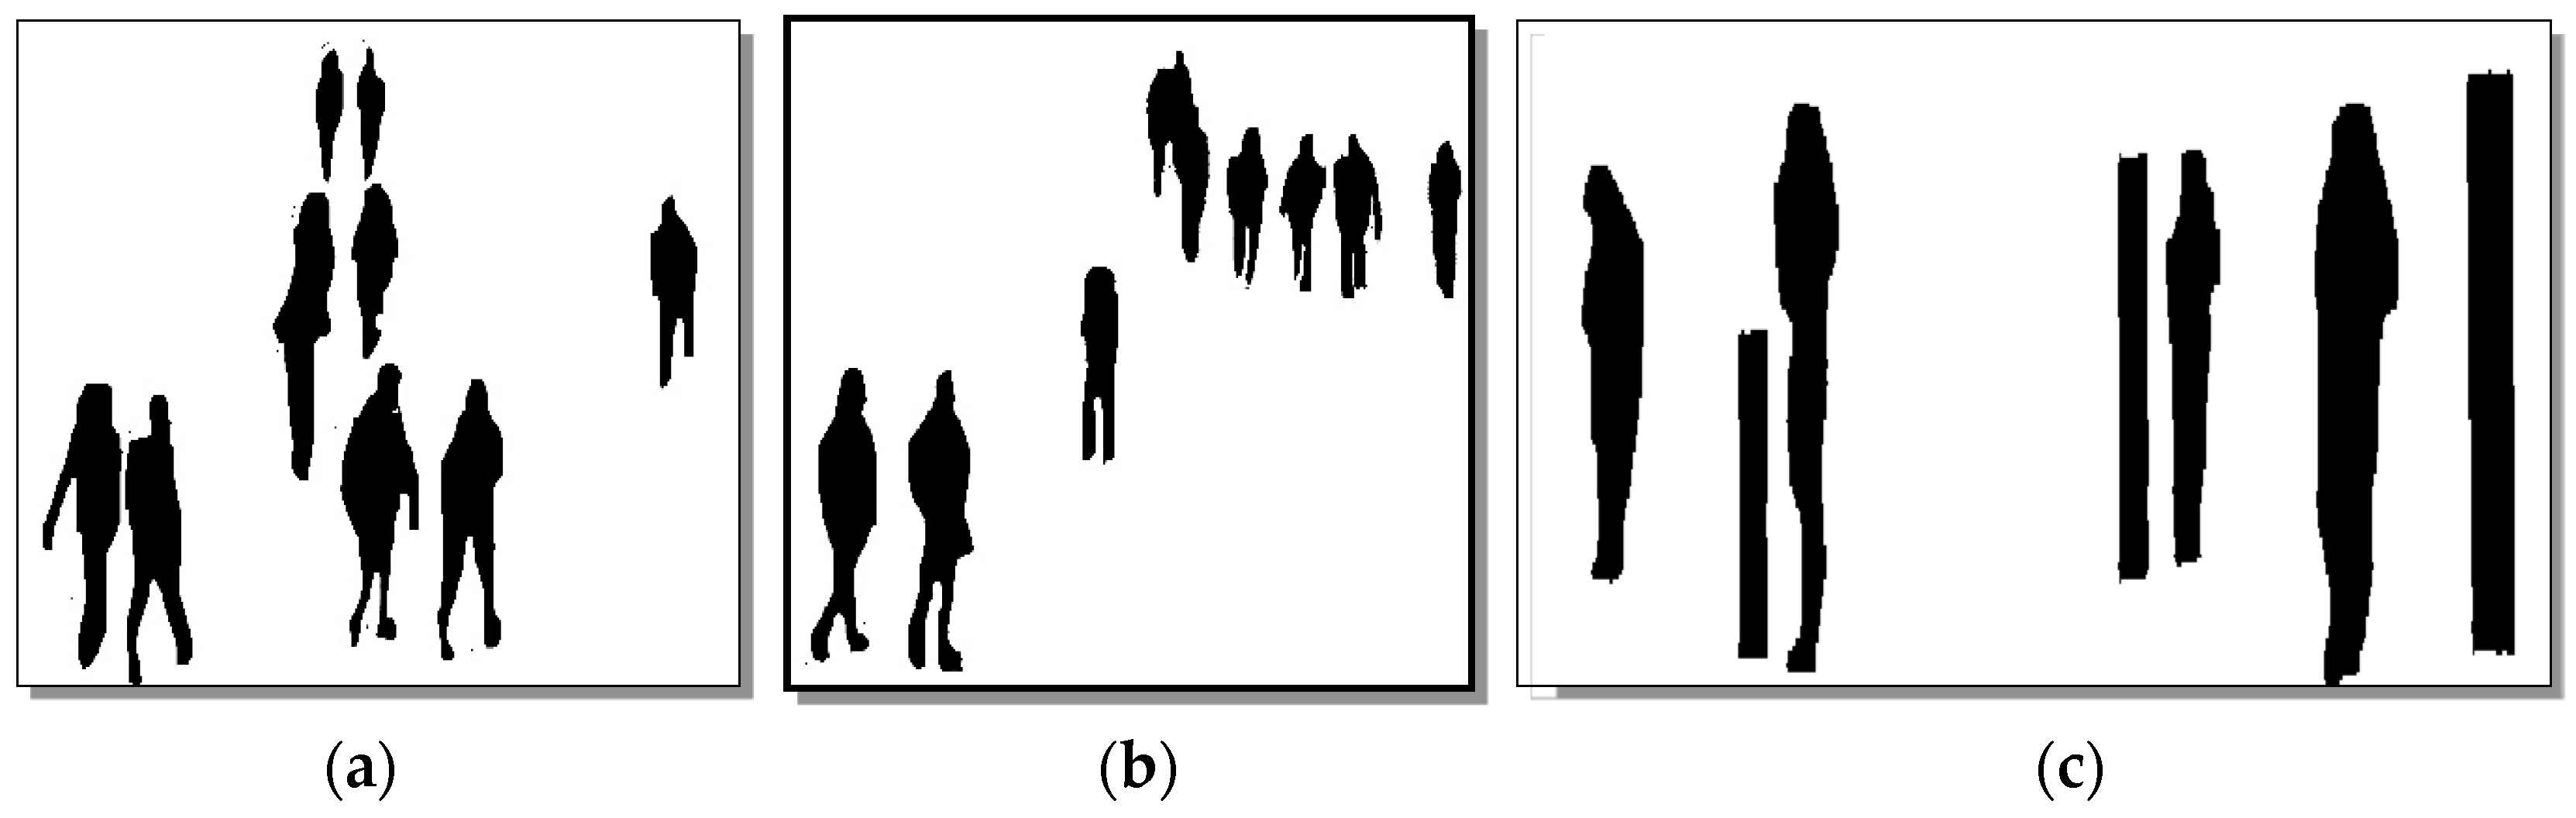
Figure 2 shows the results of preprocessing.
3.2. People Detection and Analysis
The next step is to find humans in given frames and analyze the given results; for this, texton-based human segmentation is applied; for the verification of human and non-human objects, Gaussian smoothing is applied; and finally, crowd clustering and analysis is performed.
3.2.1. Texton-Based Segmentation
Texton is a textural description derived from grouping filtration system that returns into a small number of technology demonstrator reaction matrices [
39]. Filtering responses could be estimated by employing Leung–Malik (LM) [
40] filter banks with inter variations and multi-orientation to convolve filter banks on visuals. It is made up of Gaussian filters’ first and intermediate gradients, as well as the Laplacian of Gaussian (LoG) [
41] separates. Text-based segmentation is represented as
where
is the
i-th value of data, and
is the weights subordinate to each dimension of the given cluster.
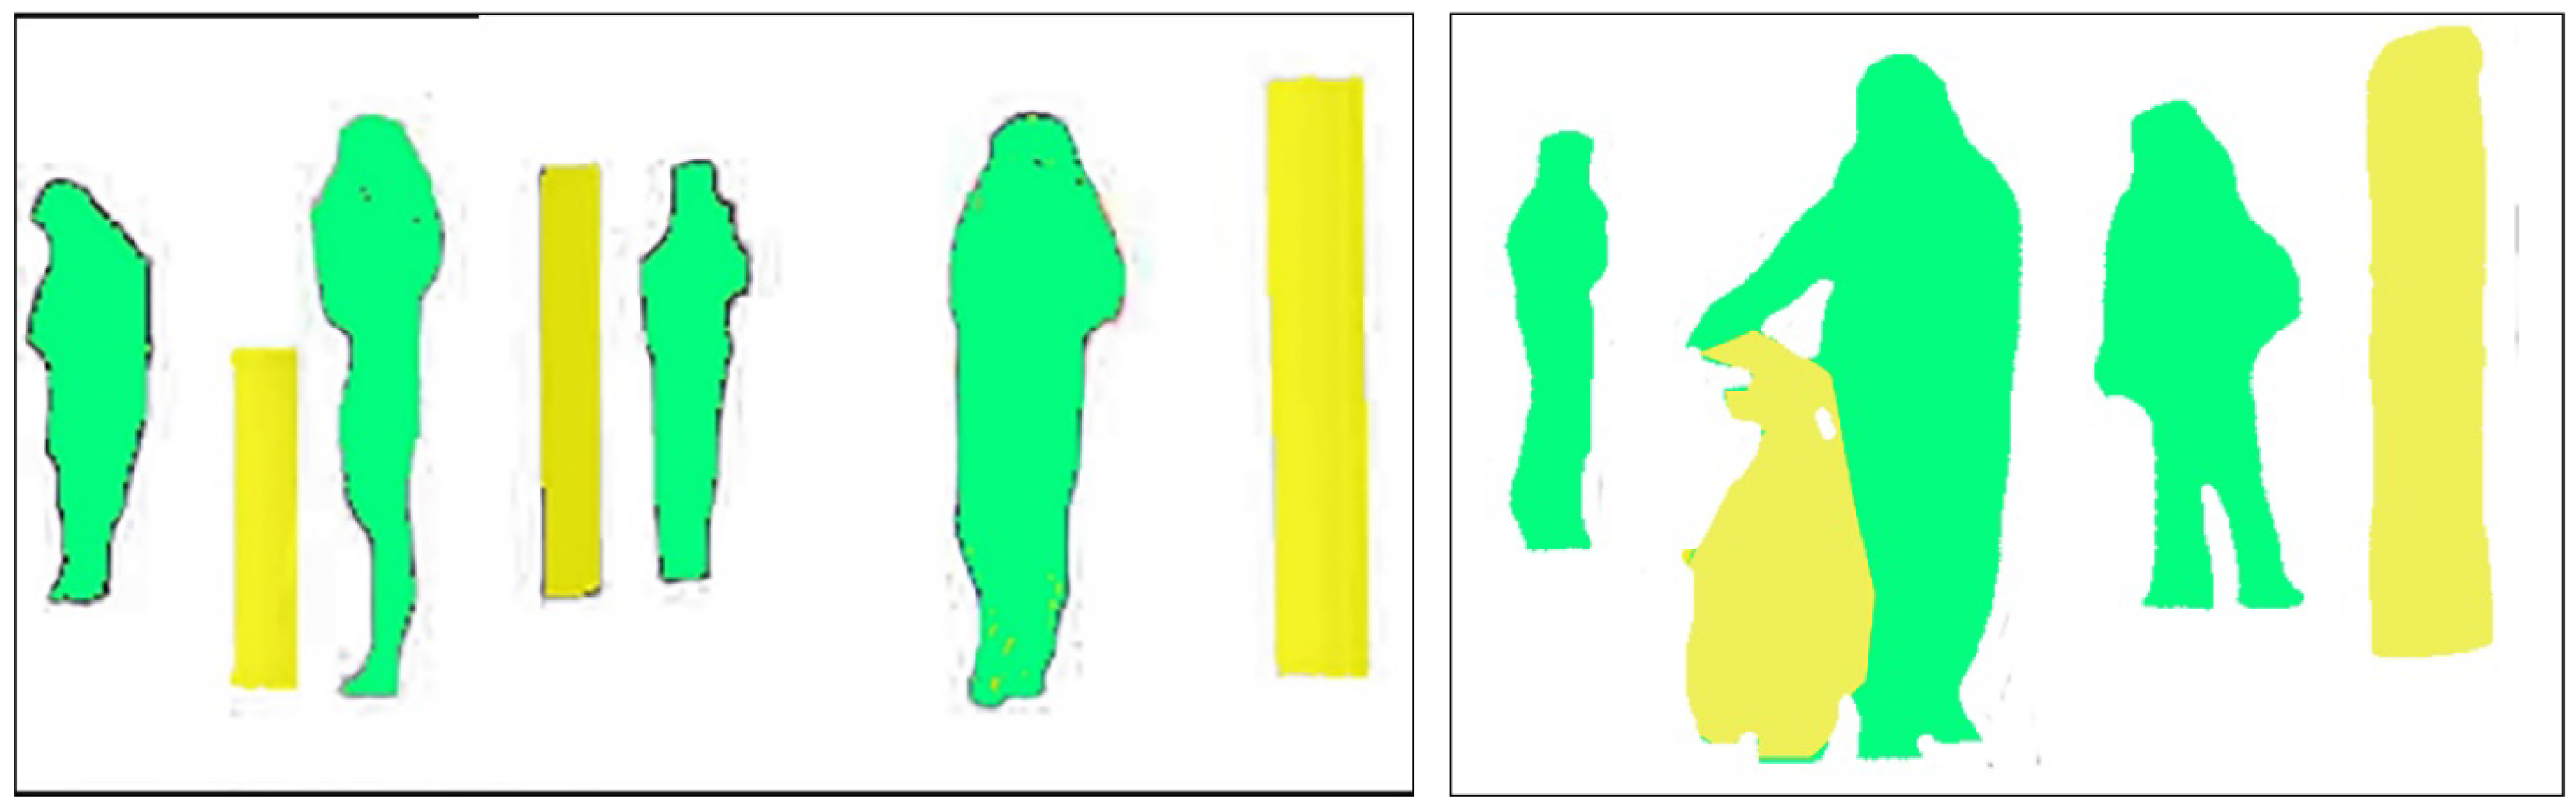
Figure 3 shows the example results of text-based segmentation.
3.2.2. Human Verification
Human verification is one of the key steps in crowd behavior prediction problems; using the size and shape information of the human body, it is possible to verify a human in given data. In size-based techniques, there is a specific range that is selected for the human body, such as
pixels where
and
are values that can be increased or decreased by 5 pixels. There are some limitations of the size-based human verification approach, such as if non-human objects have the same size, this algorithm might detect this object as human [
42]. To deal with this issue, shape-based approaches are used to verify the human, such as using the human head and human foot shape to indicate the human. Due to the similar shape of the human body to other objects, sometimes non-human objects are considered human, or sometimes humans are considered non-human objects. We used an optimized approach by merging both the approaches and obtaining final human verification results.
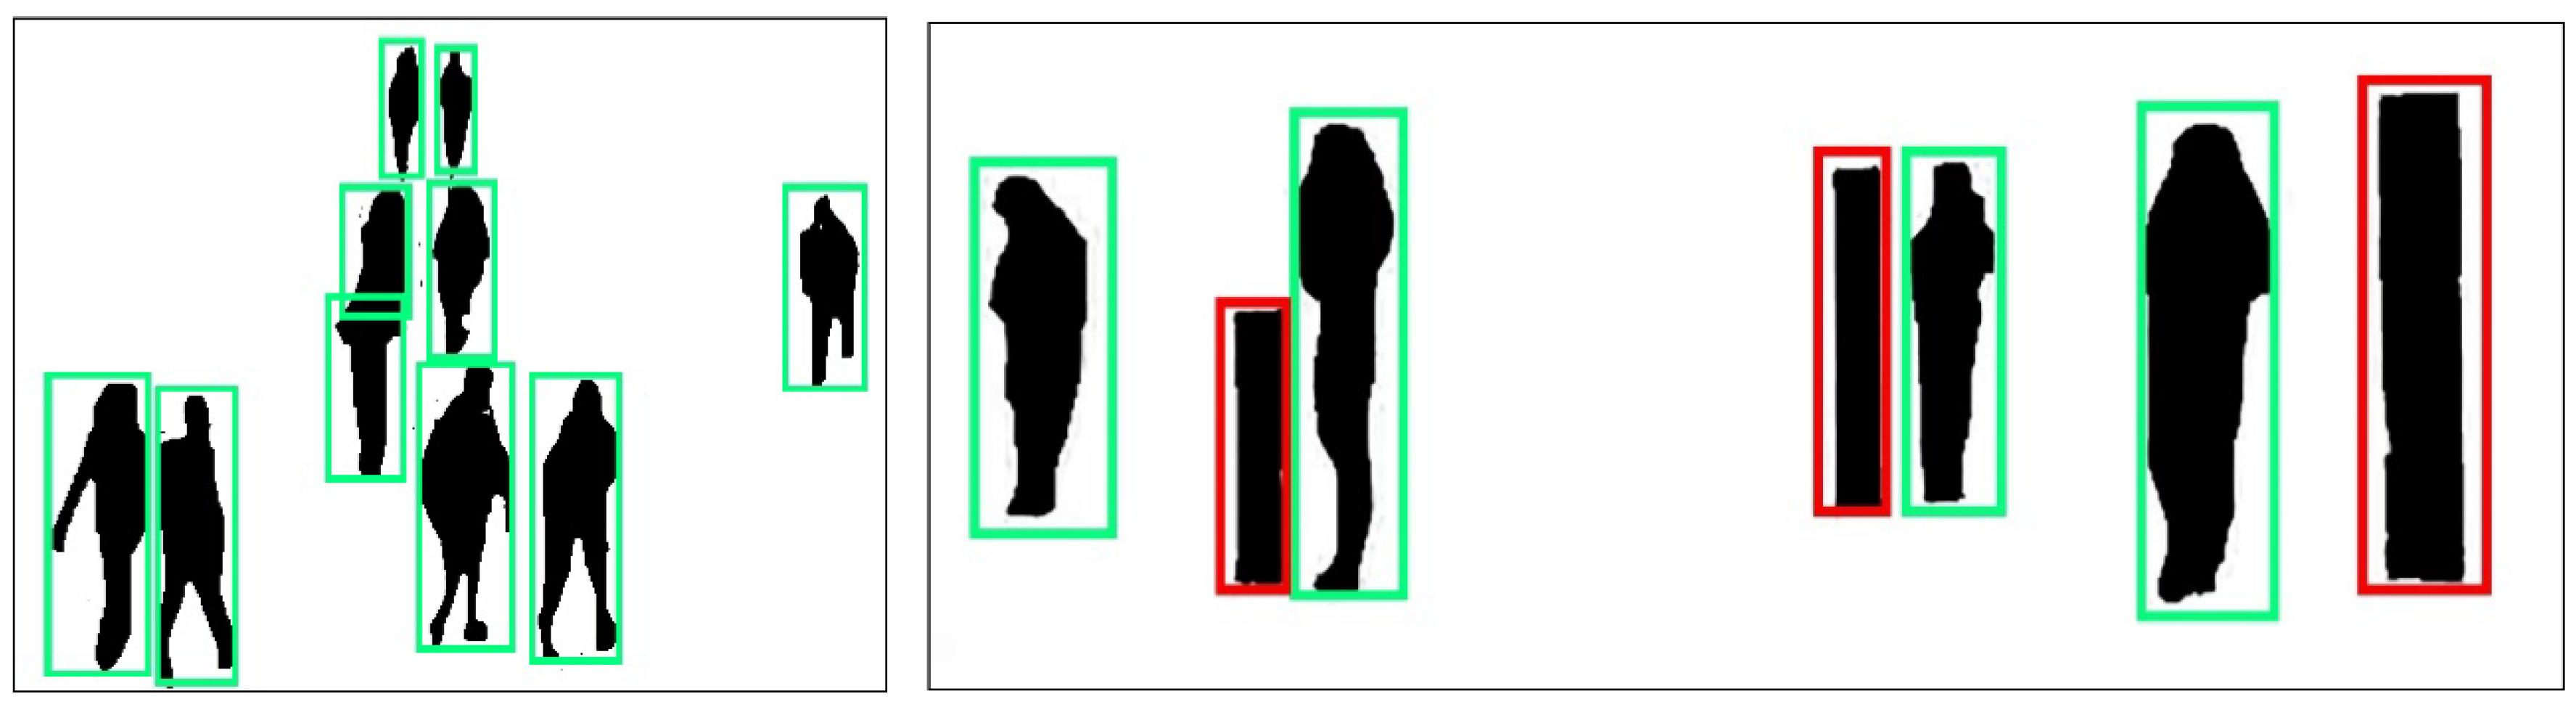
Figure 4 shows detailed results of human verification.
3.2.3. Gaussian Smoothing
After human verification in crowd-based data, the next step is crowd clustering and analysis to find human behavior. Initially, Gaussian smoothing [
43] is applied to human verification. The impact of Gaussian smoothing is identical to that of the average filter in that it blurs a picture. The standard deviation of the Gaussian defines the extent of reduction. The Gaussian produces a ‘composite index’ of every pixel’s surroundings, with the estimation graded further towards the core pixel’s intensity.
Figure 5 shows the results of Gaussian smoothing over the human-verified frame.
3.2.4. Crowd Clustering and Analysis
The next phase is to combine the Gaussian cluster [
44] for further processing, such as crowd clustering and analysis. The variance
of the Gaussian is normalized to approximate the swarm-suspended particles for every human subject whenever humans are in near vicinity to one another in the Gaussian region. The Gaussian clusters are defined as
where
is the given human-verified frame,
are the smoothing values, and
is defined as the Gaussian area, while
Figure 6 represents the results of crowd clustering.
3.3. Feature Extraction Methods
The features extraction method is helpful to classify the human behavior for extrinsic behavior prediction in crowd-based data and gives more considerable results. In this paper, we find the three optimal features, such as interaction force, force flow matrix, and deep flow-based features. Algorithm 1 represents the detailed model of the features extraction approach.
| Algorithm 1: Features computation |
Input: Frame_data
Output: Feature vectors
[]
GetDatal()
Data_size ← GetData_size()
Procedure EBP(Video, Images)
[]
Denoise_Data Pre_processing(Win,Median)
SampledData(DenoiseData)
While exit invalid state do
ExtractlFeatures(sample data)
]
Return MultifeaturesVector |
3.3.1. Interaction Force Features
Interaction force flow features are based upon the force, which interacts with humans, and find the force value and direction with human movements with the calculations of force, which are the starting and ending information of human movements, and track information on human movement. The mathematical description of interaction force flow features is
where
is defined as the interaction force flow features;
denotes the given data and
the starting point, while
indicates the ending point of the human node.
Figure 7 shows the results of interaction force features over a crowded scene.
3.3.2. Force Flow Matrix
To discover a similar pattern and flow of force with human movement, we adopted the force flow matrix. The force flow matrix enables human force flow and movement information via the multi-object tracking of human data. Inappropriate instances are finally acknowledged using the continuous spatial-temporal examination of the crowd’s values. Finally, extracted features are mapped onto a vector. It is defined as
where
is the force flow matrix, and
denotes the data.
Figure 8 shows the graphical visualization of the force flow matrix features of EBP the system.
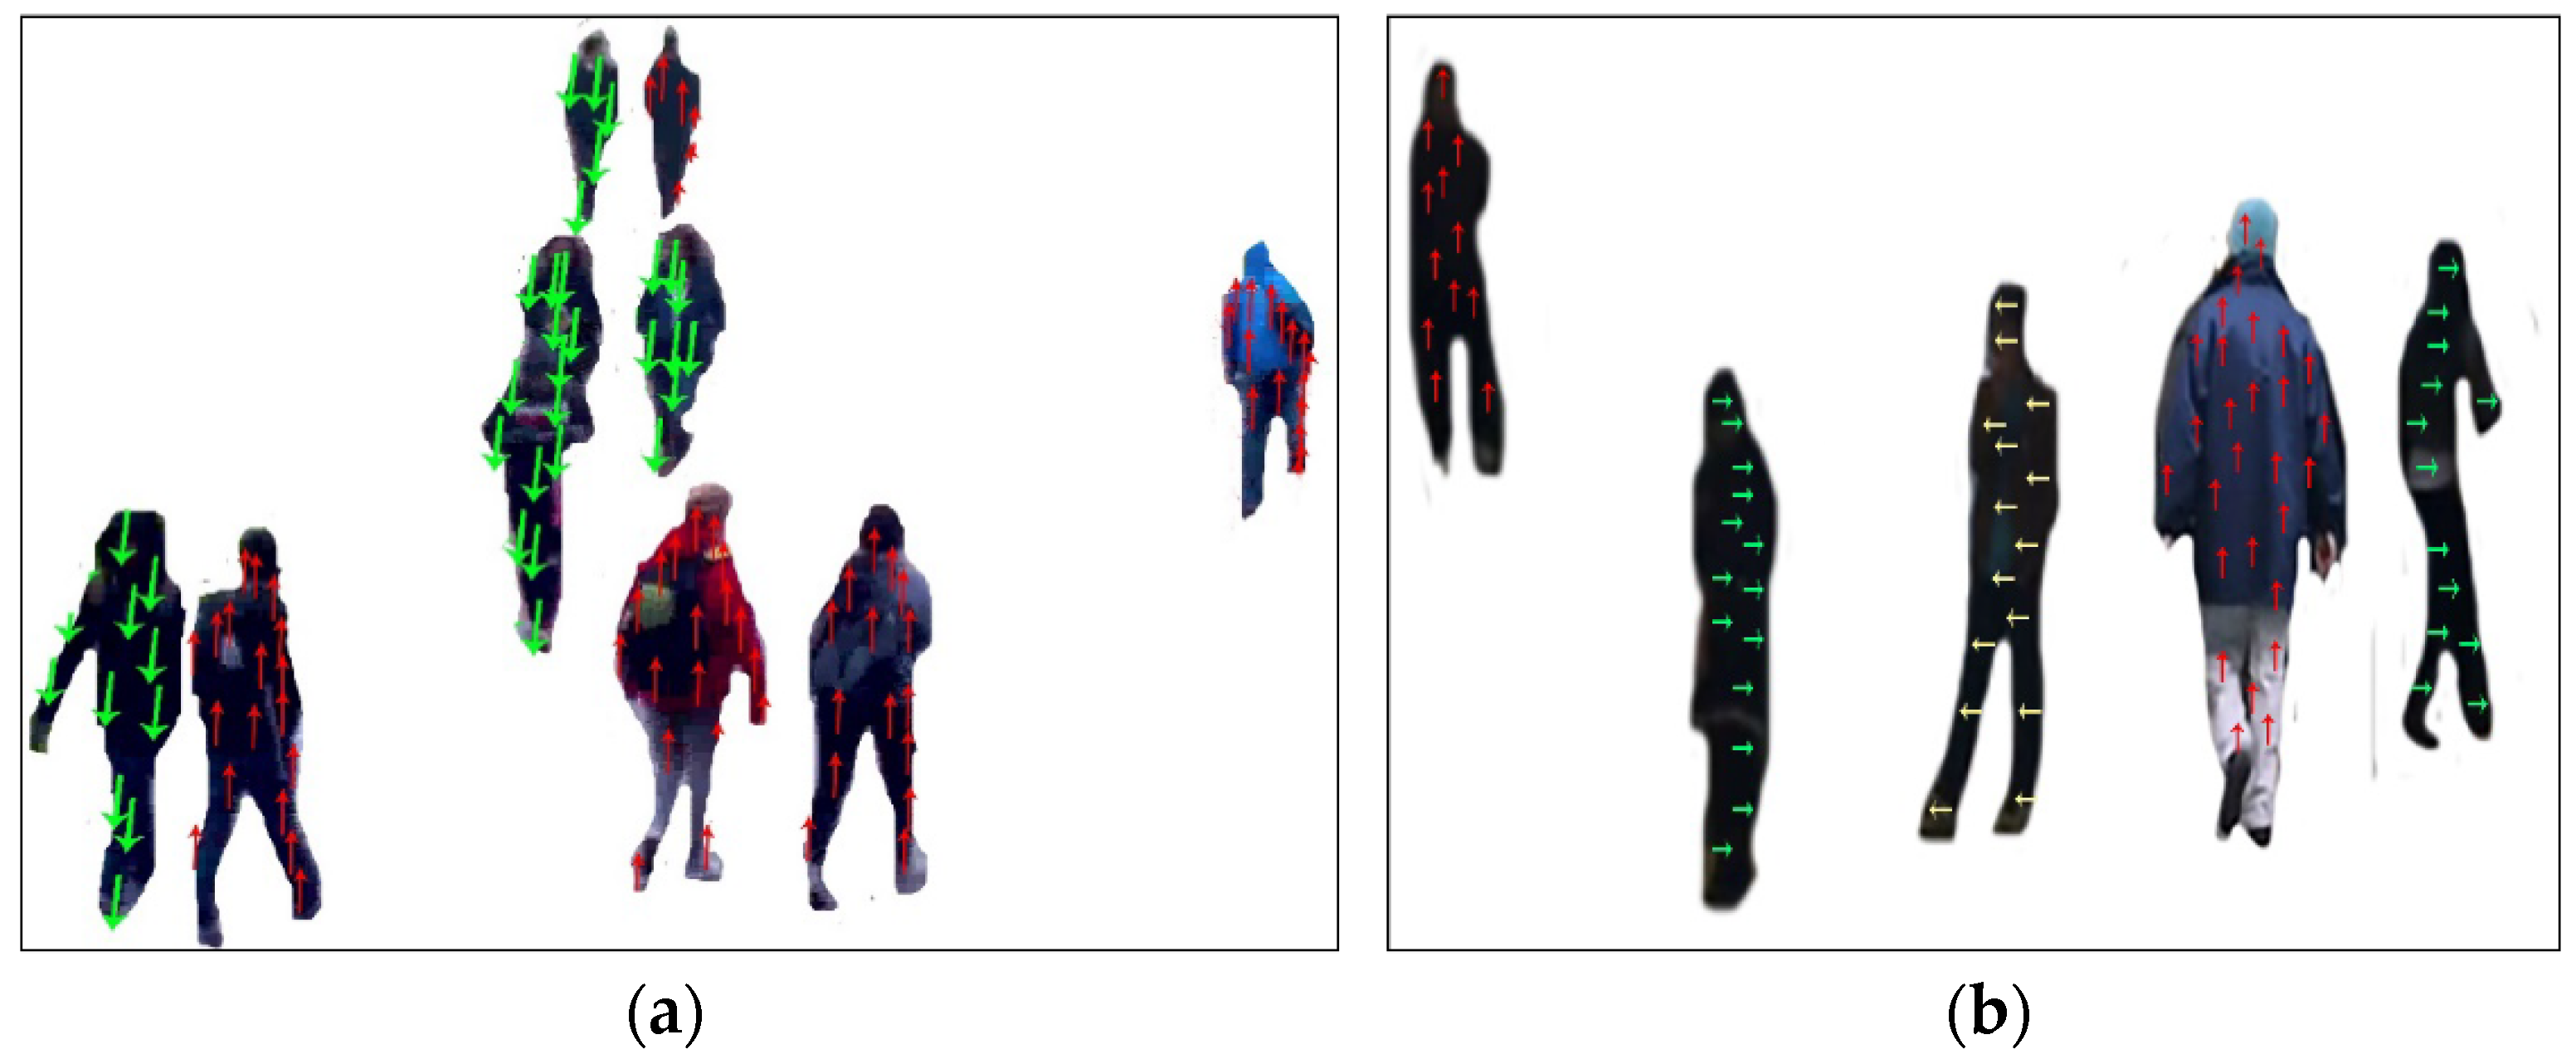
3.3.3. Deep Flow Features
Under this subheading, the deep flow feature-based based approach has been utilized. Human movement statistics and the direction of flow in uninterrupted visuals and human multimedia statistics have been used to create deep flow dynamics. In this case, the extracting features approach calculates the human’s circulation through their beginning position to their final destination and gives a certain color to the required destination. For the same orientation of deep flow, the color pattern will be the same. Following that, we put all of the retrieved elements into the matrix and performed some more analysis. Equation (7) describes the mathematical description of deep flow as follows:
where
symbolizes the trajectory of deep flow,
the initial argument of human, and
illustrations the finish spot of the human sign.
Figure 9 shows a graphical representation of deep flow features over a crowd-based environment.
4. Extrinsic Behavior Prediction
We utilize a correlation approach in which iterative methods act as a pre-classifier to enhance overall accuracy based on cross-features systems. For the extrinsic behavior prediction model, the maximum entropy Markov model has been used as a classifier, and graph mining has been used as a data optimizer and mining approach.
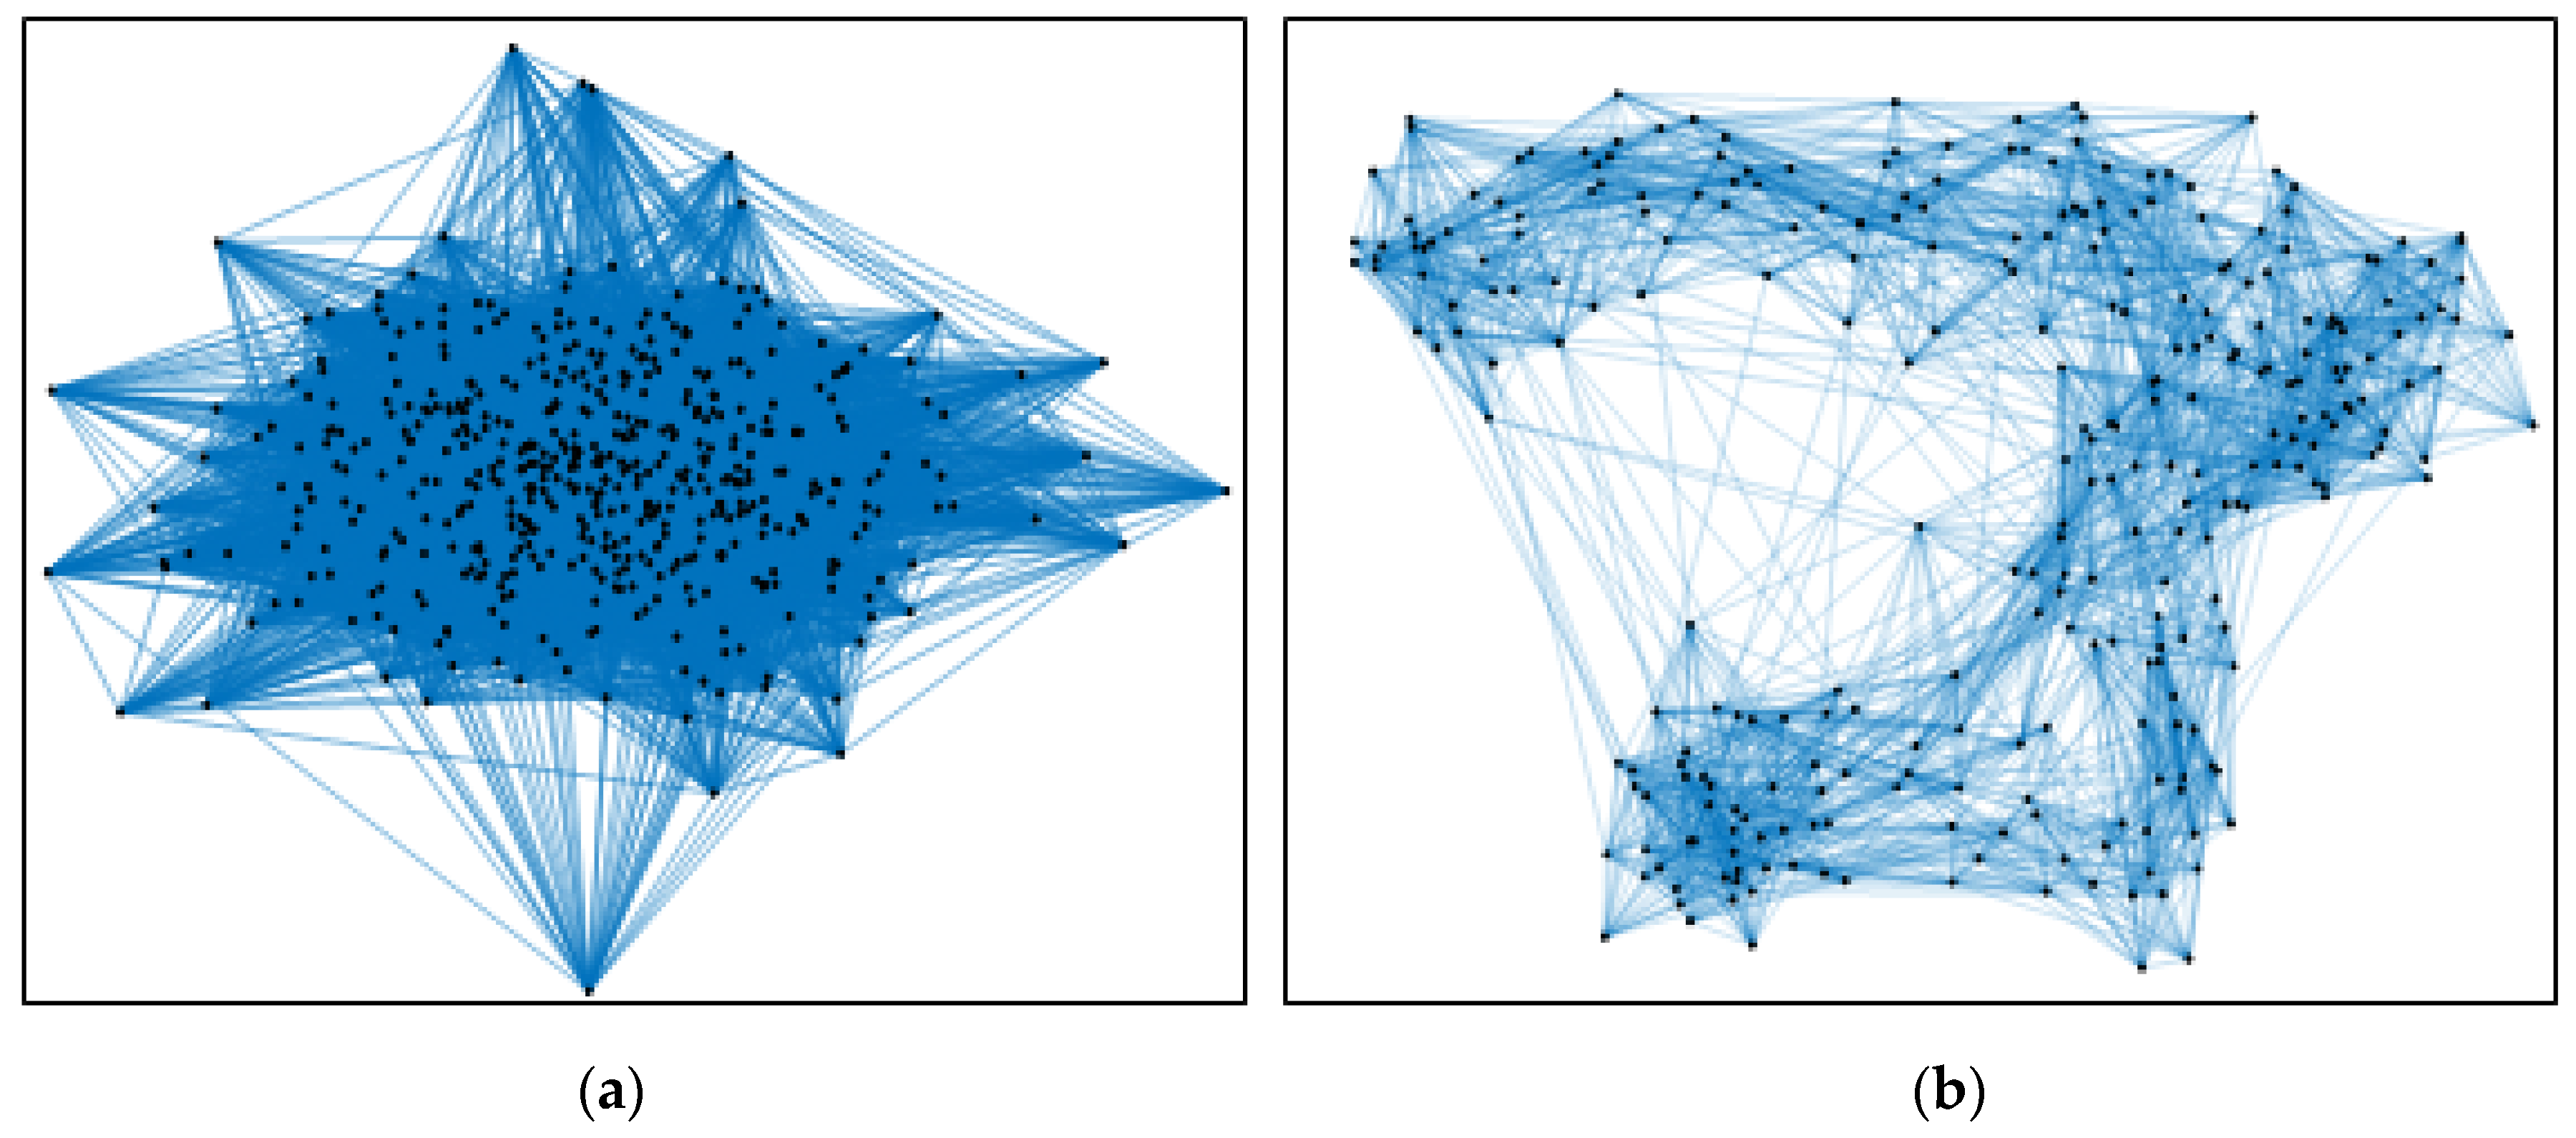
4.1. Graph Mining
Once features are extracted from all of the visual frames in the datasets, the next step is to minimize the input, which minimizes operational expenses and improves precision. Due to feature data that is also subjected to statistical structures and indices, researchers may obtain a high prediction performance of extraction by using the graph mining approach [
45]. Graph mining is a collection of tools and methodology for data analysis, predicting data structure, and creating an ordered and factual graph for template matching. Algorithm 2 describes the complete working overview of graph mining, while
Figure 10 shows the mining results of the feature vectors.
| Algorithm 2: Data mining via Graph mining approach |
Input: Complete Features (Cf)
Output: Minined_data
[]
for i = 1: k do
Read_Data: U→(Cf)
Tree_Craeting: TC_tree(U→0)
Read_Data: to find min R(min) and max R(Max)
Find_next_node: R(Cf→ next_node)
Find Mutual_node: apprise_the_list
Mine_the_date: min(Tree,apprise)
Restrictive_TC_tree:Produce_the_tree(mining)
end
return Optimized Data {OD} |
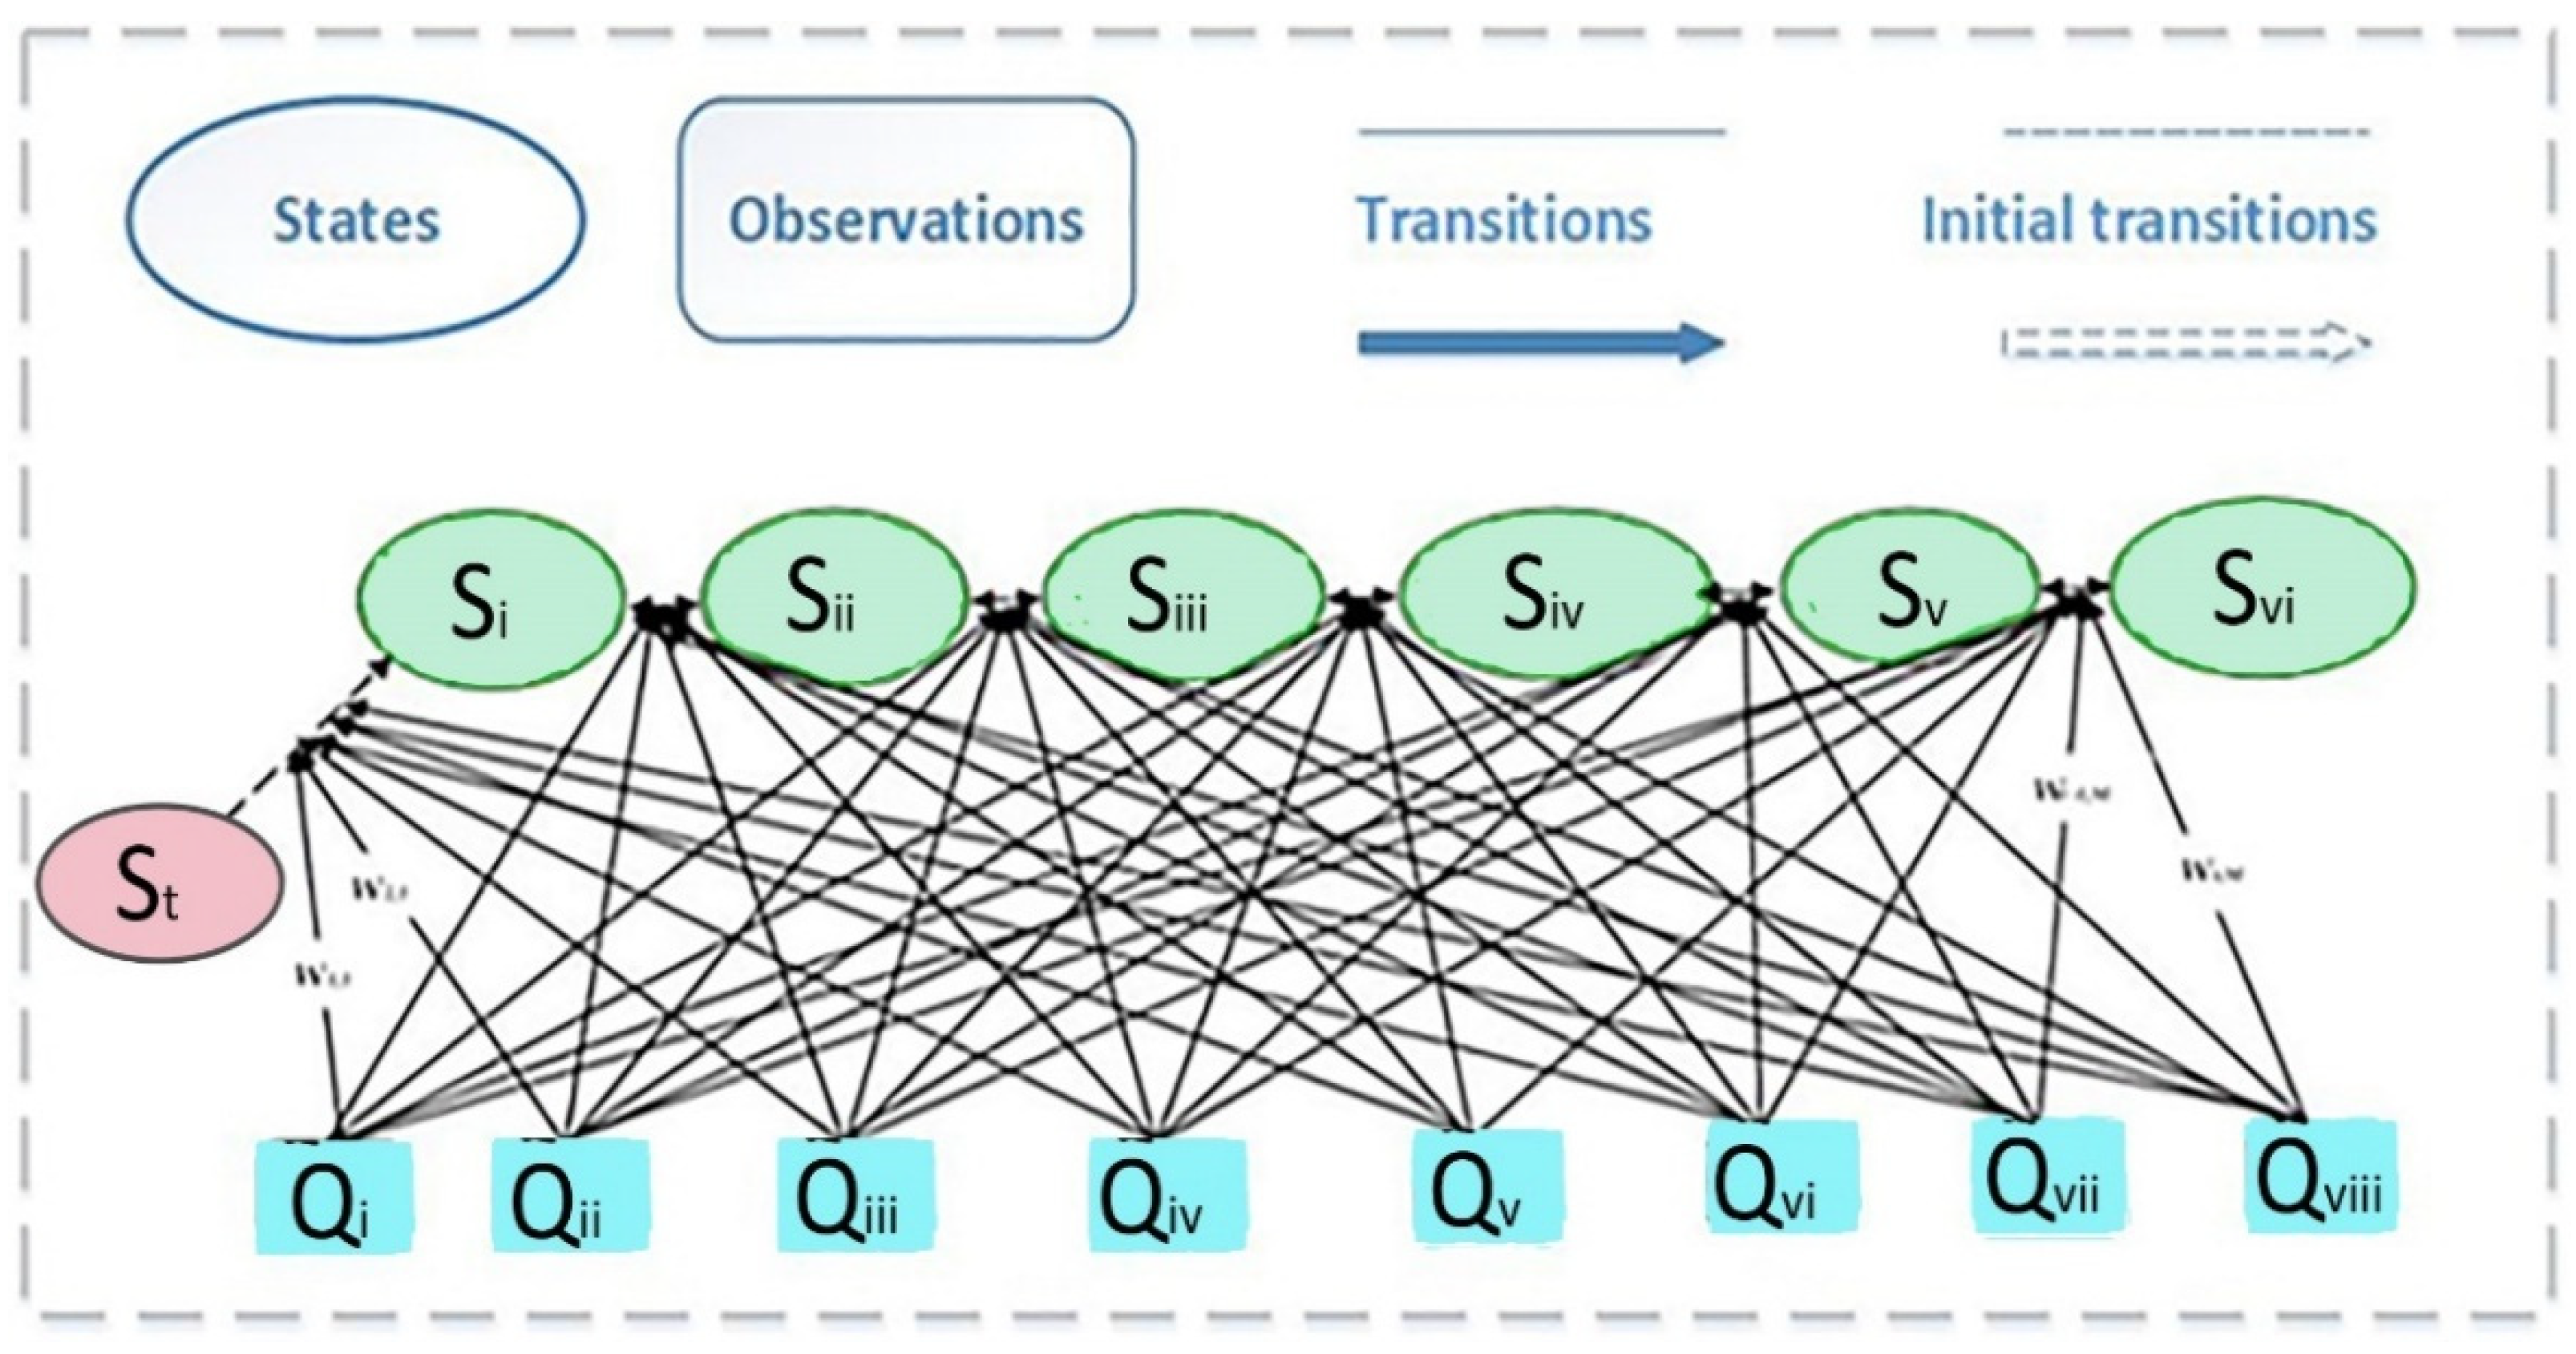
4.2. Maximum Entropy Markov Model
For the classification and detection of human behavior, we applied the maximum entropy Markov model over three benchmark datasets. The goal of using this approach is to get around the notion of the traditional hidden Markov model (HMM) [
14] architecture, which replaces monitoring and transformation processes with a single function,
As a result, the current measurement is dependent on the current condition.
Maximum Entropy Markov Model (MEMM), on the other hand, can view the data as being connected with transition phases rather than depending on its current states. At first, all experiences have been linked to transfers rather than states. It is formulated as
where
is the likelihood of the initial state occurring at a specific moment in time q to the reflection classification. Therefore it calculates the data’s probabilistic model, which is based on specific limitations obtained from the learning algorithm [
46]. Each limitation denotes certain instructional properties of the data that estimate the outcomes of all specific elements in the learning distribution. It can also address the multivariate regression approach that relies upon probabilistic models by emitting symbols from the learning algorithm, which selects the optimal set of monitoring characteristics. This classification method generalizes to identify factors that correspond to the reliant variable’s decomposition as follows:
where
is the state arrangement, and
is the structure of clarifications, i.e.,
. To exhaust the possibilities of the uncertain possibility
a set of clarifications is marked with tags, i.e.,
as
where
are the spell imprints that include changeover utility
where
is the quantity that must be taught and is linked to a trait
selection of best functions also called the legitimate characteristic capabilities, and
is the normalization factor that ensures the average of the matrix.
Figure 11 shows a detailed overview of the Maximum Entropy Markov Model architecture.
5. Experimental Results and Analysis
5.1. Experimental Setting
The leave-one-out cross-validation approach has been adopted to evaluate the performance of the proposed EBP method over three publicly available benchmark datasets named avenue dataset, crowd-activity UMN dataset, and ADOC. These datasets cover human crowd-based indoor/outdoor and normal/abnormal scenes.
The avenue dataset [
47] comprises 16 preparation and 21 challenging video clips. The videos were taken in the Chinese University of Hong Kong (CUHK) site avenue with 30652 frames overall. The exercise videos capture usual circumstances. Challenging videos comprise normal and abnormal actions. Three abnormal examples are strange, wrong, and abnormal objects, and the dataset comprehends a few contests such as minor camera vibration, outliers and normal outlines.
The second dataset in our designed EBP framework is the activity of the crowd The University of Minnesota UMN dataset [
48] is a machine mapping of populated areas. Normal crowd behavior is observed until a predefined singular moment, where at the point the behavior shifts to an evacuated scenario, in which each individual hurries out of the camera frame to resemble terror. The collection is made up of 11 video clips that start normal and then move to deviant behavior. The anxiety issue is shot in three different locations, one indoors and two exteriors. All clip had been recorded at a frame rate of 30 frames per second with a resolution of 640 × 480 pixels using a static camera.
We also verified with a third standard dataset entitled ADOC [
49], a 24-hour event that includes 25 different event types and spans 721 occurrences. This is the biggest dataset accessible for intrusion detection with localized bounding box descriptions. The information has been gathered through a security camera that was installed on a huge university campus. It looks out over a corridor that connects many structures and catches the activities of students, educators, and employees on a hectic day. Video is captured at a frequency of 1080p at a frame rate of three frames per second by the camera. The footage has been encoded with the H.264 protocol, a lossy image compression technology that is widely used in the monitoring sector. We generated a dataset using footage that was collected over 24 h. The video depicts a variety of lighting settings as well as congested situations with debris in the backdrop. The data were annotated with a variety of events increasing in occurrence from low to high. Where the bicyclist had a 238 frequency, the individual on the lawn had a 132 frequency, the golf cart on the sidewalk had a 105 frequency, the person on the phone had a 58 frequency, and the individual on a skateboard had a 48 frequency.
5.2. Hardware Platform
MATLAB (R2018a) was utilized for all software-based simulations and computation, while Intel (R) Core(TM) i5-4210U CPU @ 1.70 GHz with 64-bit Windows 10 was used as the physical device. The device enclosed an 8 GB RAM and a 2.40 GHz CPU. The leave one subject out (LOSO) cross-validation method was applied to evaluate the established method’s accuracy. The new conclusions over the crowd-based dataset and tentative outcomes are discussed in the results segment.
5.3. Experimental Result and Evaluation
In this subdivision, trials were conducted twice to assess the performance of the designed EBP model over three standard datasets.
Table 1 shows the actual human count and human detection mean accuracy by the change of the given frame data [
50]. This table has five columns in which the first one indicates the sequences of given frames, the second for the actual track, the third for successful detection, the fourth for failure rate, and finally the fifth for the accuracy of the avenue dataset with 91.60% mean accuracy.
Table 2 shows the actual human count and human detection mean accuracy by the change of the given frame data. This table has five columns, in which first one indicates the sequences of given frames, the second for the actual track, the third for successful detection, the fourth for the failure rate, and finally the fifth for the accuracy of the UMN dataset with 90.92% mean accuracy.
Table 3 shows the actual human count and human detection mean accuracy by the change of the given frame data. This table has five columns in which first one indicates the sequences of the given frames, the second for the actual track, the third for successful detection, the fourth for the failure rate, and finally the fifth for the accuracy of the ADOC dataset with 92.84% mean accuracy.
The next step is to find normal and abnormal events of the proposed EBP method with the help of the maximum entropy Markov model algorithm;
Table 4 shows the confusion matrix [
51,
52,
53] of the avenue dataset with 87.00% of mean accuracy and 13.00% error rate.
Table 5 shows the confusion matrix of the UMN dataset with a mean accuracy rate of 89.50% and an error rate of 10.50%.
Table 6 shows the confusion matrix of the ADOC data set with a mean accuracy rate of 90.50 and 9.50% error.
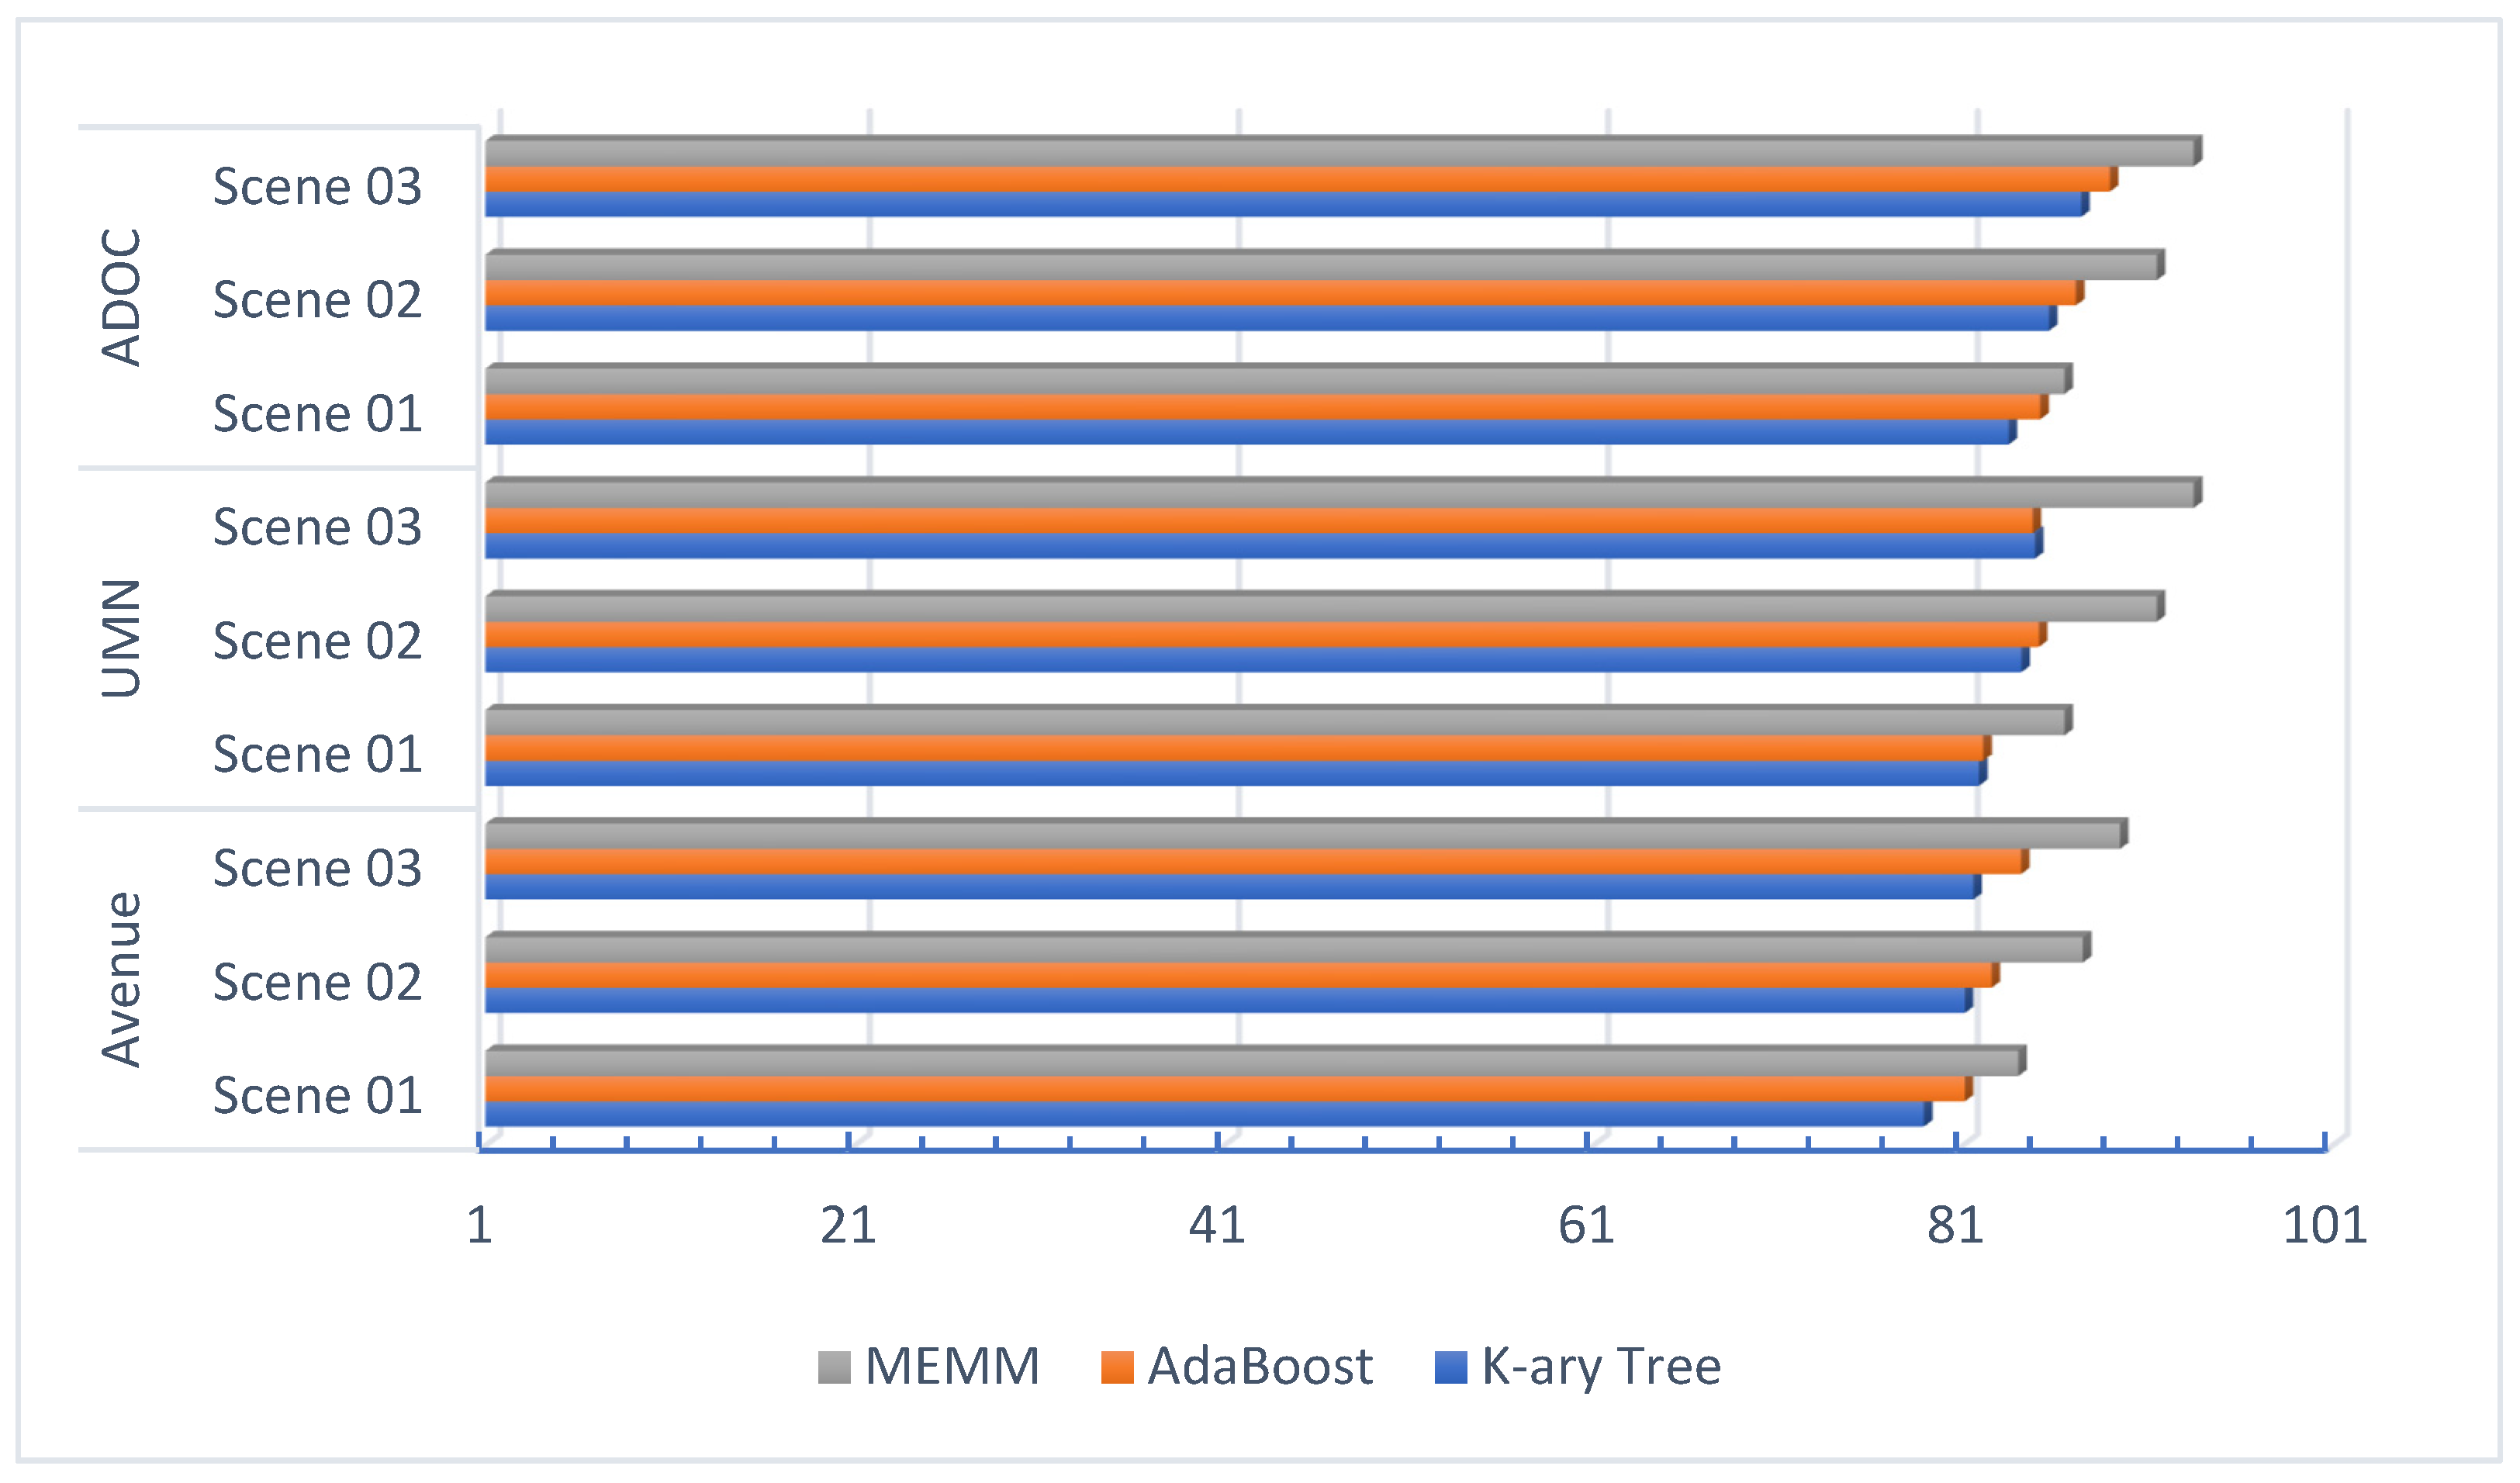
After obtaining the results of means accuracy for the EPB system, the next phase is to compare with a state-of-the-art classification algorithm.
Figure 12 shows the detailed results of the comparison.
In study [
54], they designed an approach for a fine-grained abnormal behavior understanding in the crowd with the help of low-level motion descriptors, dense trajectory, and histogram of oriented tracks. In [
55], Lloyd et al. developed a legitimate descriptor that encodes differences in crowd appearance utilizing periodic estimates of grey level co-occurrence tensor information to explain crowd behavior. As compared with other types of crowd behavior, they add an inter-frame consistency indicator and show the perception of aggressive behavior in a less consistent manner. Leyva et al. [
56] designed a model to check abnormal activities; the model utilizes an intelligent system that examines the compressed feature set using Gaussian Mixture Models, Markov Chains, and Bag-of-Words. To improve recognition rate, their system additionally incorporates the coordinated approach of the classifiers in the local spatial region. In [
57], Vu et al. used multilayer models including both luminance and movement information to propose a model for efficient abnormal identification. The architecture was made up of three primary parts: (1) denoising auto encoders for transfer learning, (2) conditional generative adversarial networks for level-wise representative production, and (3) consolidation of abnormal areas found at every representing standard. Gong et al. [
58] proposed to integrate a unit into the decoder and create a better encoder dubbed MemAE (memory-augmented auto encoder). MemAE collects the encoder’s encoding and then utilizes it as a request to identify the most appropriate storage objects for restoration considering an argument. In [
59] Tang et al. suggest a solution that incorporates the benefits of both approaches while balancing their drawbacks. An edge framework was set up to forecast and reassemble upcoming frames sequentially. The next frame estimation increases the size of the restoration mistakes, making it easier to spot unusual occurrences, while restoration enhances the future expected blocks with normal events. Chong et al. [
60] provide a dynamical structure for detecting anomalies in cluttered scenes in video content. The framework was made up of two primary elements: one for representing spatial data and the other for understanding the time dynamics of those qualities. For understanding and simulating the relationship of normal objects, Pourreza et al. [
61] present Ano-Graph, a unique yet fast technique. A Spatial-Temporal Graph (STG) is created throughout this manner by taking each cluster as an entity’s attribute collected from a real-time off-the-shelf detection algorithm, and connections are created to interact. Following that, the STG is subjected to an identity learning system that captures events in a subspace.
Table 7 shows the comparison of proposed method accuracy with state-of-the-art methods over the Avenue, UMN, and ADOC datasets.
6. Discussion
The development of the proposed system is to attain extrinsic behavior prediction of pedestrians via maximum entropy Markov model and graph-based features mining. This research study is based upon preprocessing, human verification, crowd analysis, features extraction, data optimization, and behavior prediction steps; while preprocessing was performed to reduce the computational cost, some of the data contained human and non-human objects simultaneously. To deal with this issue, human verification and crowd analysis were performed. For the classification and prediction of various classes or things, features extraction is one of the important steps. We proposed three robust features such as deep flow, force interaction matrix, and force flow features. Moreover, for data optimization and mining the features data, a graph mining approach was used. Finally, for extrinsic behavior prediction and classification, the maximum entropy Markov model was used.
Meanwhile, due to the complex dataset and distance from the camera, there is one limitation of this research study, which is the obstruction issue. This issue creates problems in human detection and verification as well as the features extraction. This becomes the main reason for the lower mean accuracy rate of human detection and extrinsic behavior prediction.
Figure 13 illustrates the challenging images of crowd scenes.
7. Conclusions and Future Works
This paper proposes a step forward in the approach to predict human behavior in a crowded indoor or outdoor environment and classification of normal and abnormal behavior. Initially, crowd-based data was taken as the input of the system, using some preprocessing tools and techniques. We then reduced the noise and size of the frames and identified the human and nonhuman objects. After that, feature extraction was performed, and the three features were extracted. To minimize the data and to save the computational cost as well as to increase the accuracy of the system, the graph-mining approach was adopted. Finally, in order to predict the behavior of pedestrians, the maximum entropy Markov model was applied. The comparison results show an improvement over the three benchmarked datasets avenue, UMN, and ADOC in mean accuracy and classification rates.
We will incorporate additional extracting features algorithms from other areas in the future to identify far more complicated behaviors in various contexts, such as emergency service, education, surveillance, and transport system. In addition, we have planned to apply this to remote sensing data and real-time environments.
Author Contributions
Conceptualization, I.A. and Y.Y.G.; methodology, I.A., H.A. and A.J.; software, I.A. and M.G.; validation, I.A., Y.Y.G., S.A.A. and J.P.; formal analysis, M.G., S.A.A. and J.P.; resources, Y.Y.G., M.G., H.A. and J.P.; writing—review and editing, I.A., M.G., S.A.A. and J.P.; funding acquisition, Y.Y.G., S.A.A., H.A. and J.P. All authors have read and agreed to the published version of the manuscript.
Funding
This research was supported by the MSIT (Ministry of Science and ICT), Korea, under the ITRC (Information Technology Research Center) support program (IITP-2023-2018-0-01426) supervised by the IITP (Institute for Information & Communications Technology Planning & Evaluation). Additionally, it was supported by the Emirates Center for Mobility Research (ECMR) Grant #12R012. In addition, it was supported by Princess Nourah bint Abdulrahman University Researchers Supporting Project number (PNURSP2022R54), Princess Nourah bint Abdulrahman University, Riyadh, Saudi Arabia.
Conflicts of Interest
The authors declare no conflict of interest.
References
- Wang, Y.; Mori, G. Multiple tree models for occlusion and spatial constraints in human pose estimation. In Proceedings of the Lecture Notes in Computer Science (Including Subseries Lecture Notes in Artificial Intelligence and Lecture Notes in Bioinformatics); Springer: Cham, Switzerland, 2008. [Google Scholar]
- Ullah, A.; Muhammad, K.; Haq, I.U.; Baik, S.W. Action recognition using optimized deep autoencoder and CNN for surveillance data streams of non-stationary environments. Future Gener. Comput. Syst. 2019, 96, 386–397. [Google Scholar] [CrossRef]
- Abid Hasan, S.M.; Ko, K. Depth edge detection by image-based smoothing and morphological operations. J. Comput. Des. Eng. 2016, 3, 191–197. [Google Scholar] [CrossRef] [Green Version]
- Shao, J.; Kang, K.; Change Loy, C.; Wang, X. Deeply learned attributes for crowded scene understanding. In Proceedings of the 2015 IEEE Conference on Computer Vision and Pattern Recognition, Boston, MA, USA, 7–12 June 2015; pp. 4657–4666. [Google Scholar]
- Ali, S.; Shah, M. Human action recognition in videos using kinematic features and multiple instance learning. IEEE Trans. Pattern Anal. Mach. Intell. 2010, 32, 288–303. [Google Scholar] [CrossRef]
- Khalid, N.; Gochoo, M.; Jalal, A.; Kim, K. Modeling Two-Person Segmentation and Locomotion for Stereoscopic Action Identification: A Sustainable Video Surveillance System. Sustainability 2021, 13, 970. [Google Scholar] [CrossRef]
- ur Rehman, M.A.; Raza, H.; Akhter, I. Security Enhancement Of Hill Cipher By Using Non-Square Matrix Approach. In Proceedings of the 4th International Conference on Knowledge and Innovation in Engineering, Science and Technology, Berlin, Germany, 21–23 December 2018; Acavent: Haarlem, The Netherlands, 2018. [Google Scholar]
- Rafique, A.A.; Jalal, A.; Kim, K. Automated Sustainable Multi-Object Segmentation and Recognition via Modified Sampling Consensus and Kernel Sliding Perceptron. Symmetry 2020, 12, 1928. [Google Scholar] [CrossRef]
- Zhu, Y.; Zhou, K.; Wang, M.; Zhao, Y.; Zhao, Z. A comprehensive solution for detecting events in complex surveillance videos. Multimed. Tools Appl. 2019, 78, 817–838. [Google Scholar] [CrossRef]
- Wang, Y.; Du, B.; Shen, Y.; Wu, K.; Zhao, G.; Sun, J.; Wen, H. EV-gait: Event-based robust gait recognition using dynamic vision sensors. In Proceedings of the 2019 IEEE Computer Society Conference on Computer Vision and Pattern Recognition, Long Beach, CA, USA, 15–20 June 2019. [Google Scholar]
- Perera, A.G.; Law, Y.W.; Ogunwa, T.T.; Chahl, J. A Multiviewpoint Outdoor Dataset for Human Action Recognition. IEEE Trans. Hum.-Mach. Syst. 2020, 50, 405–413. [Google Scholar] [CrossRef]
- Akhter, I. Automated Posture Analysis of Gait Event Detection via a Hierarchical Optimization Algorithm and Pseudo 2D Stick-Model. Master’s Thesis, Air University, Islamabad, Pakistan, 2020. [Google Scholar]
- Jalal, A.; Quaid, M.A.K.; Hasan, A.S. Wearable sensor-based human behavior understanding and recognition in daily life for smart environments. In Proceedings of the 2018 International Conference on Frontiers of Information Technology (FIT), Islamabad, Pakistan, 17–19 December 2018; pp. 105–110. [Google Scholar]
- McCallum, A.; Freitag, D.; Pereira, F.C.N. Maximum entropy Markov models for information extraction and segmentation. In Proceedings of the 17th International Conference on Machine Learning, Stanford, CA, USA, 29 June–2 July 2000; Morgan Kaufmann Publishers Inc.: San Francisco, CA, USA, 2000; Volume 17, pp. 591–598. [Google Scholar]
- Ratnaparkhi, A. A maximum entropy model for part-of-speech tagging. In Proceedings of the 1996 Conference on Empirical Methods in Natural Language Processing, Philadelphia, PA, USA, 17–18 May 1996; Volume 1, pp. 133–142. [Google Scholar]
- Sun, G.-L.; Guan, Y.; Wang, X.-L.; Zhao, J. A maximum entropy markov model for chunking. In Proceedings of the 2005 International Conference on Machine Learning and Cybernetics, Guangzhou, China, 18–21 August 2005; Volume 6, pp. 3761–3765. [Google Scholar]
- Kratz, L.; Nishino, K. Tracking pedestrians using local spatio-temporal motion patterns in extremely crowded scenes. IEEE Trans. Pattern Anal. Mach. Intell. 2011, 34, 987–1002. [Google Scholar] [CrossRef]
- Marques, J.S.; Jorge, P.M.; Abrantes, A.J.; Lemos, J.M. Tracking groups of pedestrians in video sequences. In Proceedings of the 2003 Conference on Computer Vision and Pattern Recognition Workshop, Madison, WI, USA, 16–22 June 2003; Volume 9, p. 101. [Google Scholar]
- Abdi, H.; Williams, L.J. Principal component analysis. Wiley Interdiscip. Rev. Comput. Stat. 2010, 2, 433–459. [Google Scholar] [CrossRef]
- Camacho, D.M.; Collins, K.M.; Powers, R.K.; Costello, J.C.; Collins, J.J. Next-generation machine learning for biological networks. Cell 2018, 173, 1581–1592. [Google Scholar] [CrossRef] [Green Version]
- Thudumu, S.; Branch, P.; Jin, J.; Singh, J.J. A comprehensive survey of anomaly detection techniques for high dimensional big data. J. Big Data 2020, 7, 42. [Google Scholar] [CrossRef]
- Yang, W.; Zhao, Y.; Wang, D.; Wu, H.; Lin, A.; He, L. Using principal components analysis and IDW interpolation to determine spatial and temporal changes of surface water quality of Xin’anjiang river in Huangshan, China. Int. J. Environ. Res. Public Health 2020, 17, 2942. [Google Scholar] [CrossRef]
- Eddy, S.R. What is a hidden Markov model? Nat. Biotechnol. 2004, 22, 1315–1316. [Google Scholar] [CrossRef] [Green Version]
- Miller, D.R.H.; Leek, T.; Schwartz, R.M. A hidden Markov model information retrieval system. In Proceedings of the 22nd Annual International ACM SIGIR Conference on Research and Development in Information Retrieval, Berkeley, CA, USA, 15–19 August 1999; pp. 214–221. [Google Scholar]
- Felsenstein, J.; Churchill, G.A. A Hidden Markov Model approach to variation among sites in rate of evolution. Mol. Biol. Evol. 1996, 13, 93–104. [Google Scholar] [CrossRef] [Green Version]
- Wang, J.; Xu, Z. Spatio-temporal texture modelling for real-time crowd anomaly detection. Comput. Vis. Image Underst. 2016, 144, 177–187. [Google Scholar] [CrossRef]
- Ryan, D.; Denman, S.; Fookes, C.; Sridharan, S. Textures of optical flow for real-time anomaly detection in crowds. In Proceedings of the 2011 8th IEEE International Conference on Advanced Video and Signal based Surveillance (AVSS), Klagenfurt, Austria, 30 August–2 September 2011; pp. 230–235. [Google Scholar]
- Wang, T.; Snoussi, H. Detection of abnormal events via optical flow feature analysis. Sensors 2015, 15, 7156–7171. [Google Scholar] [CrossRef] [Green Version]
- Suthaharan, S. Support vector machine. In Machine Learning Models and Algorithms for big Data Classification; Springer: Cham, Switzerland, 2016; pp. 207–235. [Google Scholar]
- Wang, T.; Snoussi, H. Histograms of optical flow orientation for visual abnormal events detection. In Proceedings of the 2012 IEEE Ninth International Conference on Advanced Video and Signal-based Surveillance, Beijing, China, 18–21 August 2012; pp. 13–18. [Google Scholar]
- Mousavi, H.; Mohammadi, S.; Perina, A.; Chellali, R.; Murino, V. Analyzing tracklets for the detection of abnormal crowd behavior. In Proceedings of the 2015 IEEE Winter Conference on Applications of Computer Vision, Waikoloa, HI, USA, 5–9 January 2015; pp. 148–155. [Google Scholar]
- Mousavi, H.; Galoogahi, H.K.; Perina, A.; Murino, V. Detecting abnormal behavioral patterns in crowd scenarios. In Toward Robotic Socially Believable Behaving Systems-Volume II.; Springer: Cham, Switzerland, 2016; pp. 185–205. [Google Scholar]
- Chen, C.; Shao, Y.; Bi, X. Detection of anomalous crowd behavior based on the acceleration feature. IEEE Sens. J. 2015, 15, 7252–7261. [Google Scholar] [CrossRef]
- Biswas, S.; Gupta, V. Abnormality detection in crowd videos by tracking sparse components. Mach. Vis. Appl. 2017, 28, 35–48. [Google Scholar] [CrossRef]
- Jalal, A.; Akhtar, I.; Kim, K. Human Posture Estimation and Sustainable Events Classification via Pseudo-2D Stick Model and K-ary Tree Hashing. Sustainability 2020, 12, 9814. [Google Scholar] [CrossRef]
- Chen, J.; Benesty, J.; Huang, Y.; Doclo, S. New insights into the noise reduction Wiener filter. IEEE Trans. Audio. Speech. Lang. Processing 2006, 14, 1218–1234. [Google Scholar] [CrossRef] [Green Version]
- Cross, G.R.; Jain, A.K. Markov random field texture models. IEEE Trans. Pattern Anal. Mach. Intell. 1983, PAMI-5, 25–39. [Google Scholar] [CrossRef]
- Gupta, G. Algorithm for image processing using improved median filter and comparison of mean, median and improved median filter. Int. J. Soft Comput. Eng. 2011, 1, 304–311. [Google Scholar]
- Adjeroh, D.A.; Kandaswamy, U.; Odom, J.V. Texton-based segmentation of retinal vessels. JOSA A 2007, 24, 1384–1393. [Google Scholar] [CrossRef]
- Lin, G.; Zou, X. Citrus segmentation for automatic harvester combined with adaboost classifier and Leung-Malik filter bank. IFAC-PapersOnLine 2018, 51, 379–383. [Google Scholar] [CrossRef]
- Gunn, S.R. On the discrete representation of the Laplacian of Gaussian. Pattern Recognit. 1999, 32, 1463–1472. [Google Scholar] [CrossRef]
- Akhter, I.; Jalal, A.; Kim, K. Pose Estimation and Detection for Event Recognition using Sense-Aware Features and Adaboost Classifier. In Proceedings of the 2021 International Bhurban Conference on Applied Sciences and Technologies (IBCAST), Islamabad, Pakistan, 12–16 January 2021. [Google Scholar]
- Garg, B.; Sharma, G.K. A quality-aware Energy-scalable Gaussian Smoothing Filter for image processing applications. Microprocess. Microsyst. 2016, 45, 1–9. [Google Scholar] [CrossRef]
- Van Loock, P.; Weedbrook, C.; Gu, M. Building Gaussian cluster states by linear optics. Phys. Rev. A 2007, 76, 32321. [Google Scholar] [CrossRef] [Green Version]
- Chakrabarti, D.; Faloutsos, C. Graph mining: Laws, generators, and algorithms. ACM Comput. Surv. 2006, 38, 2-es. [Google Scholar] [CrossRef]
- Gaglio, S.; Re, G.L.; Morana, M. Human activity recognition process using 3-D posture data. IEEE Trans. Hum.-Mach. Syst. 2014, 45, 586–597. [Google Scholar] [CrossRef]
- Lu, C.; Shi, J.; Jia, J. Abnormal event detection at 150 fps in matlab. In Proceedings of the 2013 IEEE International Conference on Computer Vision, Sydney, NSW, Australia, 1–8 December 2013; pp. 2720–2727. [Google Scholar]
- Mehran, R.; Oyama, A.; Shah, M. Abnormal crowd behavior detection using social force model. In Proceedings of the 2009 IEEE Conference on Computer Vision and Pattern Recognition, Miami Beach, FL, USA, 22–24 June 2009; pp. 935–942. [Google Scholar]
- Pranav, M.; Zhenggang, L.; Shah, K.S. A day on campus-an anomaly detection dataset for events in a single camera. In Proceedings of the 2020 Asian Conference on Computer Vision, Kyoto, Japan, 30 November–4 December 2020. [Google Scholar]
- Akhter, I.; Jalal, A.; Kim, K. Adaptive Pose Estimation for Gait Event Detection Using Context-Aware Model and Hierarchical Optimization. J. Electr. Eng. Technol. 2021, 16, 2721–2729. [Google Scholar] [CrossRef]
- Patro, V.M.; Patra, M.R. Augmenting weighted average with confusion matrix to enhance classification accuracy. Trans. Mach. Learn. Artif. Intell. 2014, 2, 77–91. [Google Scholar]
- Ghadi, Y.; Akhter, I.; Alarfaj, M.; Jalal, A.; Kim, K. Syntactic model-based human body 3D reconstruction and event classification via association based features mining and deep learning. PeerJ Comput. Sci. 2021, 7, e764. [Google Scholar] [CrossRef] [PubMed]
- Gochoo, M.; Akhter, I.; Jalal, A.; Kim, K. Stochastic Remote Sensing Event Classification over Adaptive Posture Estimation via Multifused Data and Deep Belief Network. Remote Sens. 2021, 13, 912. [Google Scholar] [CrossRef]
- Rabiee, H.; Haddadnia, J.; Mousavi, H.; Kalantarzadeh, M.; Nabi, M.; Murino, V. Novel dataset for fine-grained abnormal behavior understanding in crowd. In Proceedings of the 2016 13th IEEE International Conference on Advanced Video and Signal Based Surveillance (AVSS), Colorado Springs, CO, USA, 23–26 August 2016; pp. 95–101. [Google Scholar]
- Lloyd, K.; Rosin, P.L.; Marshall, D.; Moore, S.C. Detecting violent and abnormal crowd activity using temporal analysis of grey level co-occurrence matrix (GLCM)-based texture measures. Mach. Vis. Appl. 2017, 28, 361–371. [Google Scholar] [CrossRef] [Green Version]
- Leyva, R.; Sanchez, V.; Li, C.-T. Video anomaly detection with compact feature sets for online performance. IEEE Trans. Image Process. 2017, 26, 3463–3478. [Google Scholar] [CrossRef] [Green Version]
- Vu, H.; Nguyen, T.D.; Le, T.; Luo, W.; Phung, D. Robust anomaly detection in videos using multilevel representations. In Proceedings of the 2019 AAAI Conference on Artificial Intelligence, Honolulu, HI, USA, 27 January–1 February 2019; Volume 33, pp. 5216–5223. [Google Scholar]
- Gong, D.; Liu, L.; Le, V.; Saha, B.; Mansour, M.R.; Venkatesh, S.; Hengel, A. van den Memorizing normality to detect anomaly: Memory-augmented deep autoencoder for unsupervised anomaly detection. In Proceedings of the 2019 IEEE/CVF International Conference on Computer Vision, Seoul, Korea, 27 October–2 November 2019; pp. 1705–1714. [Google Scholar]
- Tang, Y.; Zhao, L.; Zhang, S.; Gong, C.; Li, G.; Yang, J. Integrating prediction and reconstruction for anomaly detection. Pattern Recognit. Lett. 2020, 129, 123–130. [Google Scholar] [CrossRef]
- Chong, Y.S.; Tay, Y.H. Abnormal event detection in videos using spatiotemporal autoencoder. In Proceedings of the 2017 International Symposium on Neural Networks, Hokkaido, Japan, 21–26 June 2017; pp. 189–196. [Google Scholar]
- Pourreza, M.; Salehi, M.; Sabokrou, M. Ano-graph: Learning normal scene contextual graphs to detect video anomalies. arXiv 2021, arXiv:2103.10502. [Google Scholar]
Figure 1.
Flow diagram of proposed human normal and abnormal activity detection model.
Figure 1.
Flow diagram of proposed human normal and abnormal activity detection model.
Figure 2.
Optimized results of pre-processing step with human and non-human objects (a) ((b) human extraction from crowd scene) and (c) human and non-human object extraction in the crowd scene.
Figure 2.
Optimized results of pre-processing step with human and non-human objects (a) ((b) human extraction from crowd scene) and (c) human and non-human object extraction in the crowd scene.
Figure 3.
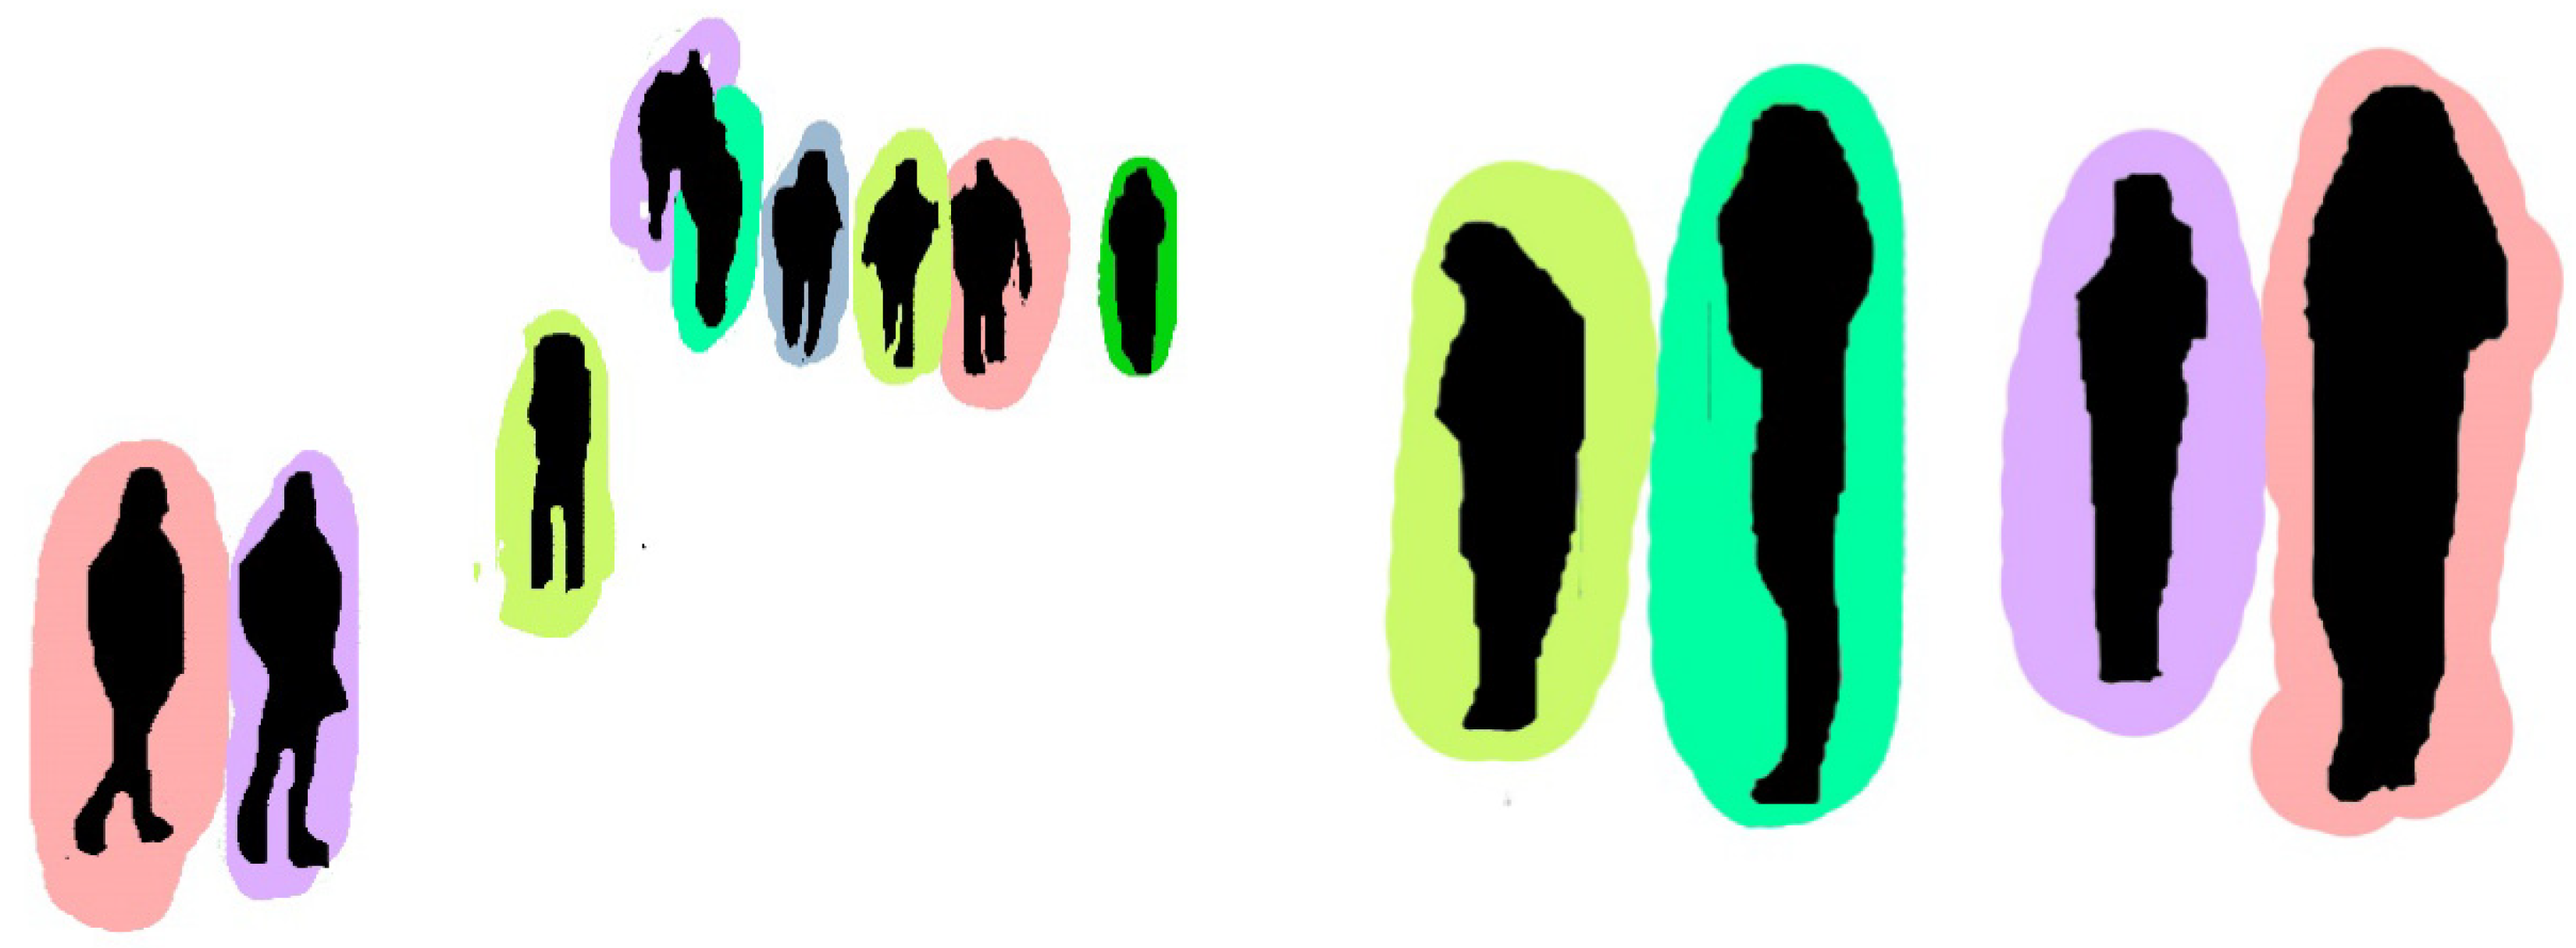
Optimized results of pre-processing step with human and non-human objects. The yellow color indicates non-human objects, whereas the green color indicates human silhouette.
Figure 3.
Optimized results of pre-processing step with human and non-human objects. The yellow color indicates non-human objects, whereas the green color indicates human silhouette.
Figure 4.
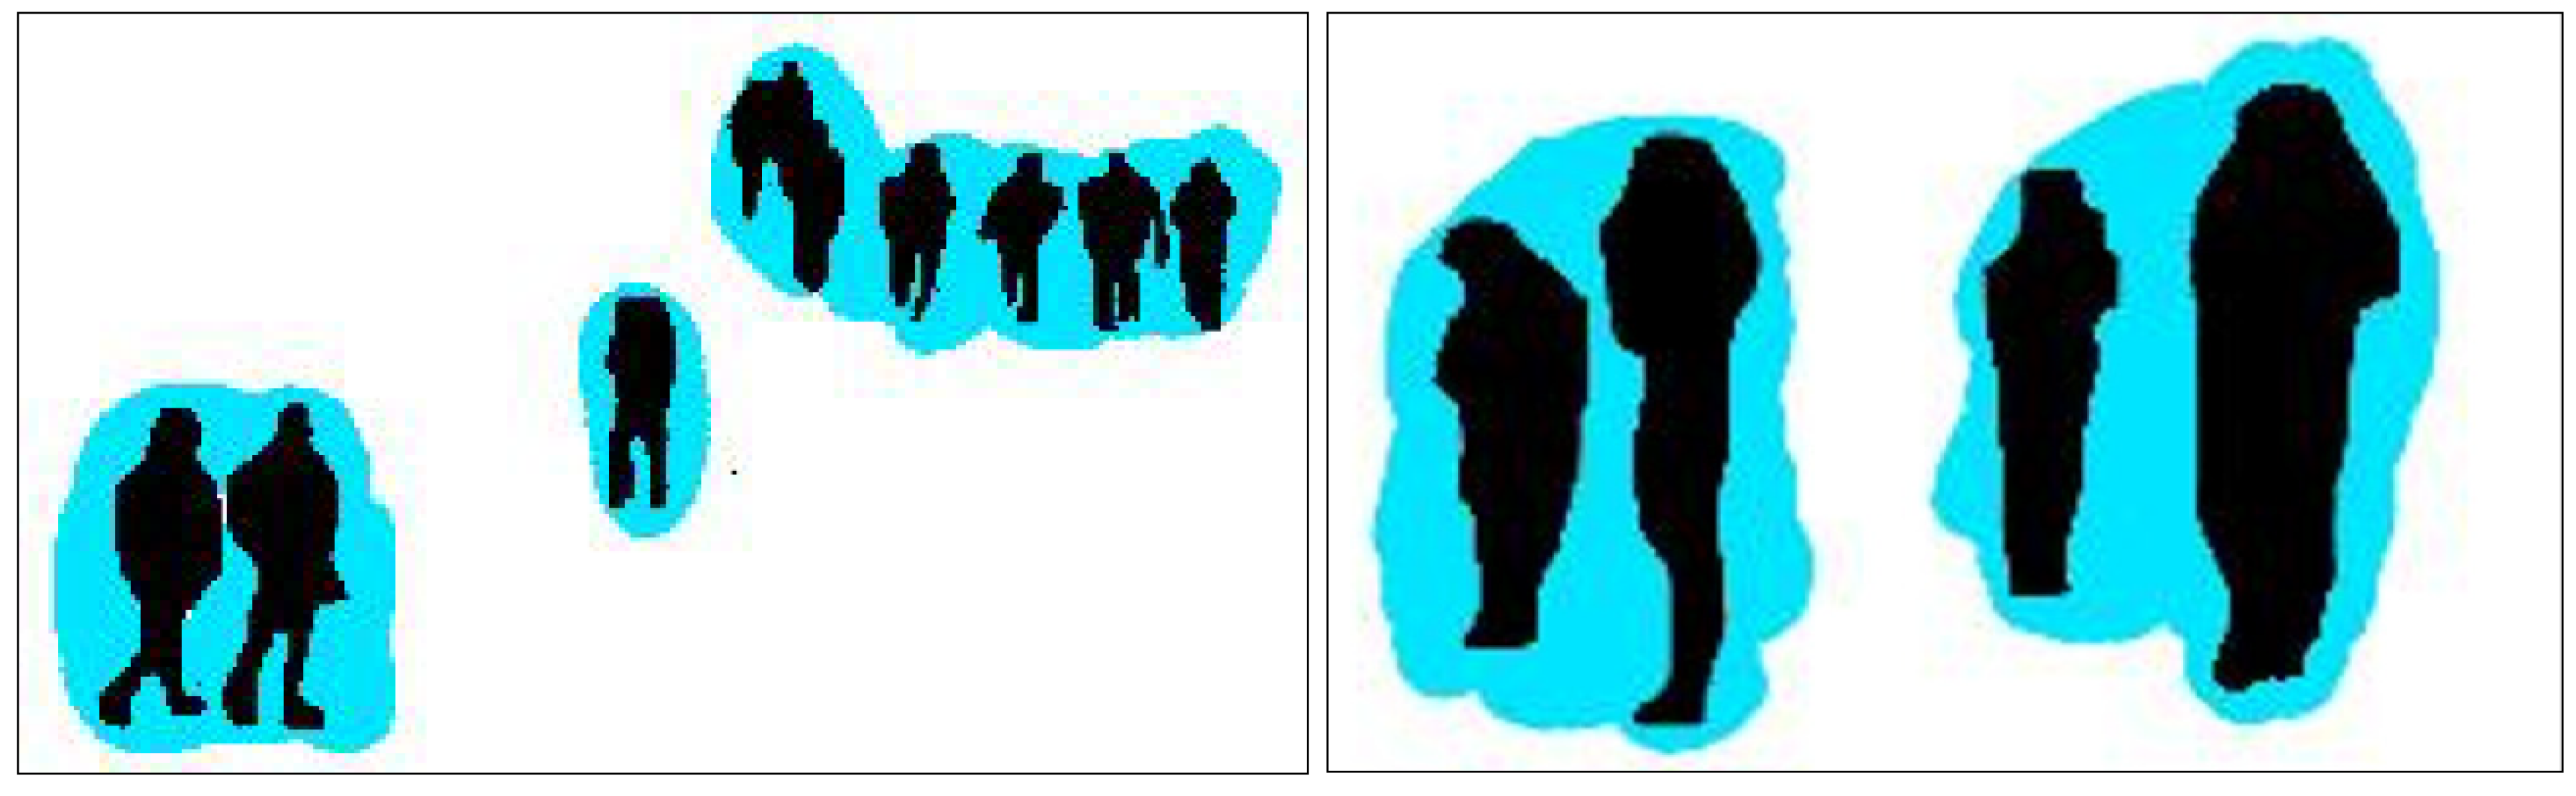
Human verification results over video-based datasets. The red bounding box indicates non-human objects, whereas the green bounding box indicates a human silhouette.
Figure 4.
Human verification results over video-based datasets. The red bounding box indicates non-human objects, whereas the green bounding box indicates a human silhouette.
Figure 5.
Gaussian smoothing results over given human-verified data.
Figure 5.
Gaussian smoothing results over given human-verified data.
Figure 6.
Results of Gaussian clustering over-extracted human silhouettes.
Figure 6.
Results of Gaussian clustering over-extracted human silhouettes.
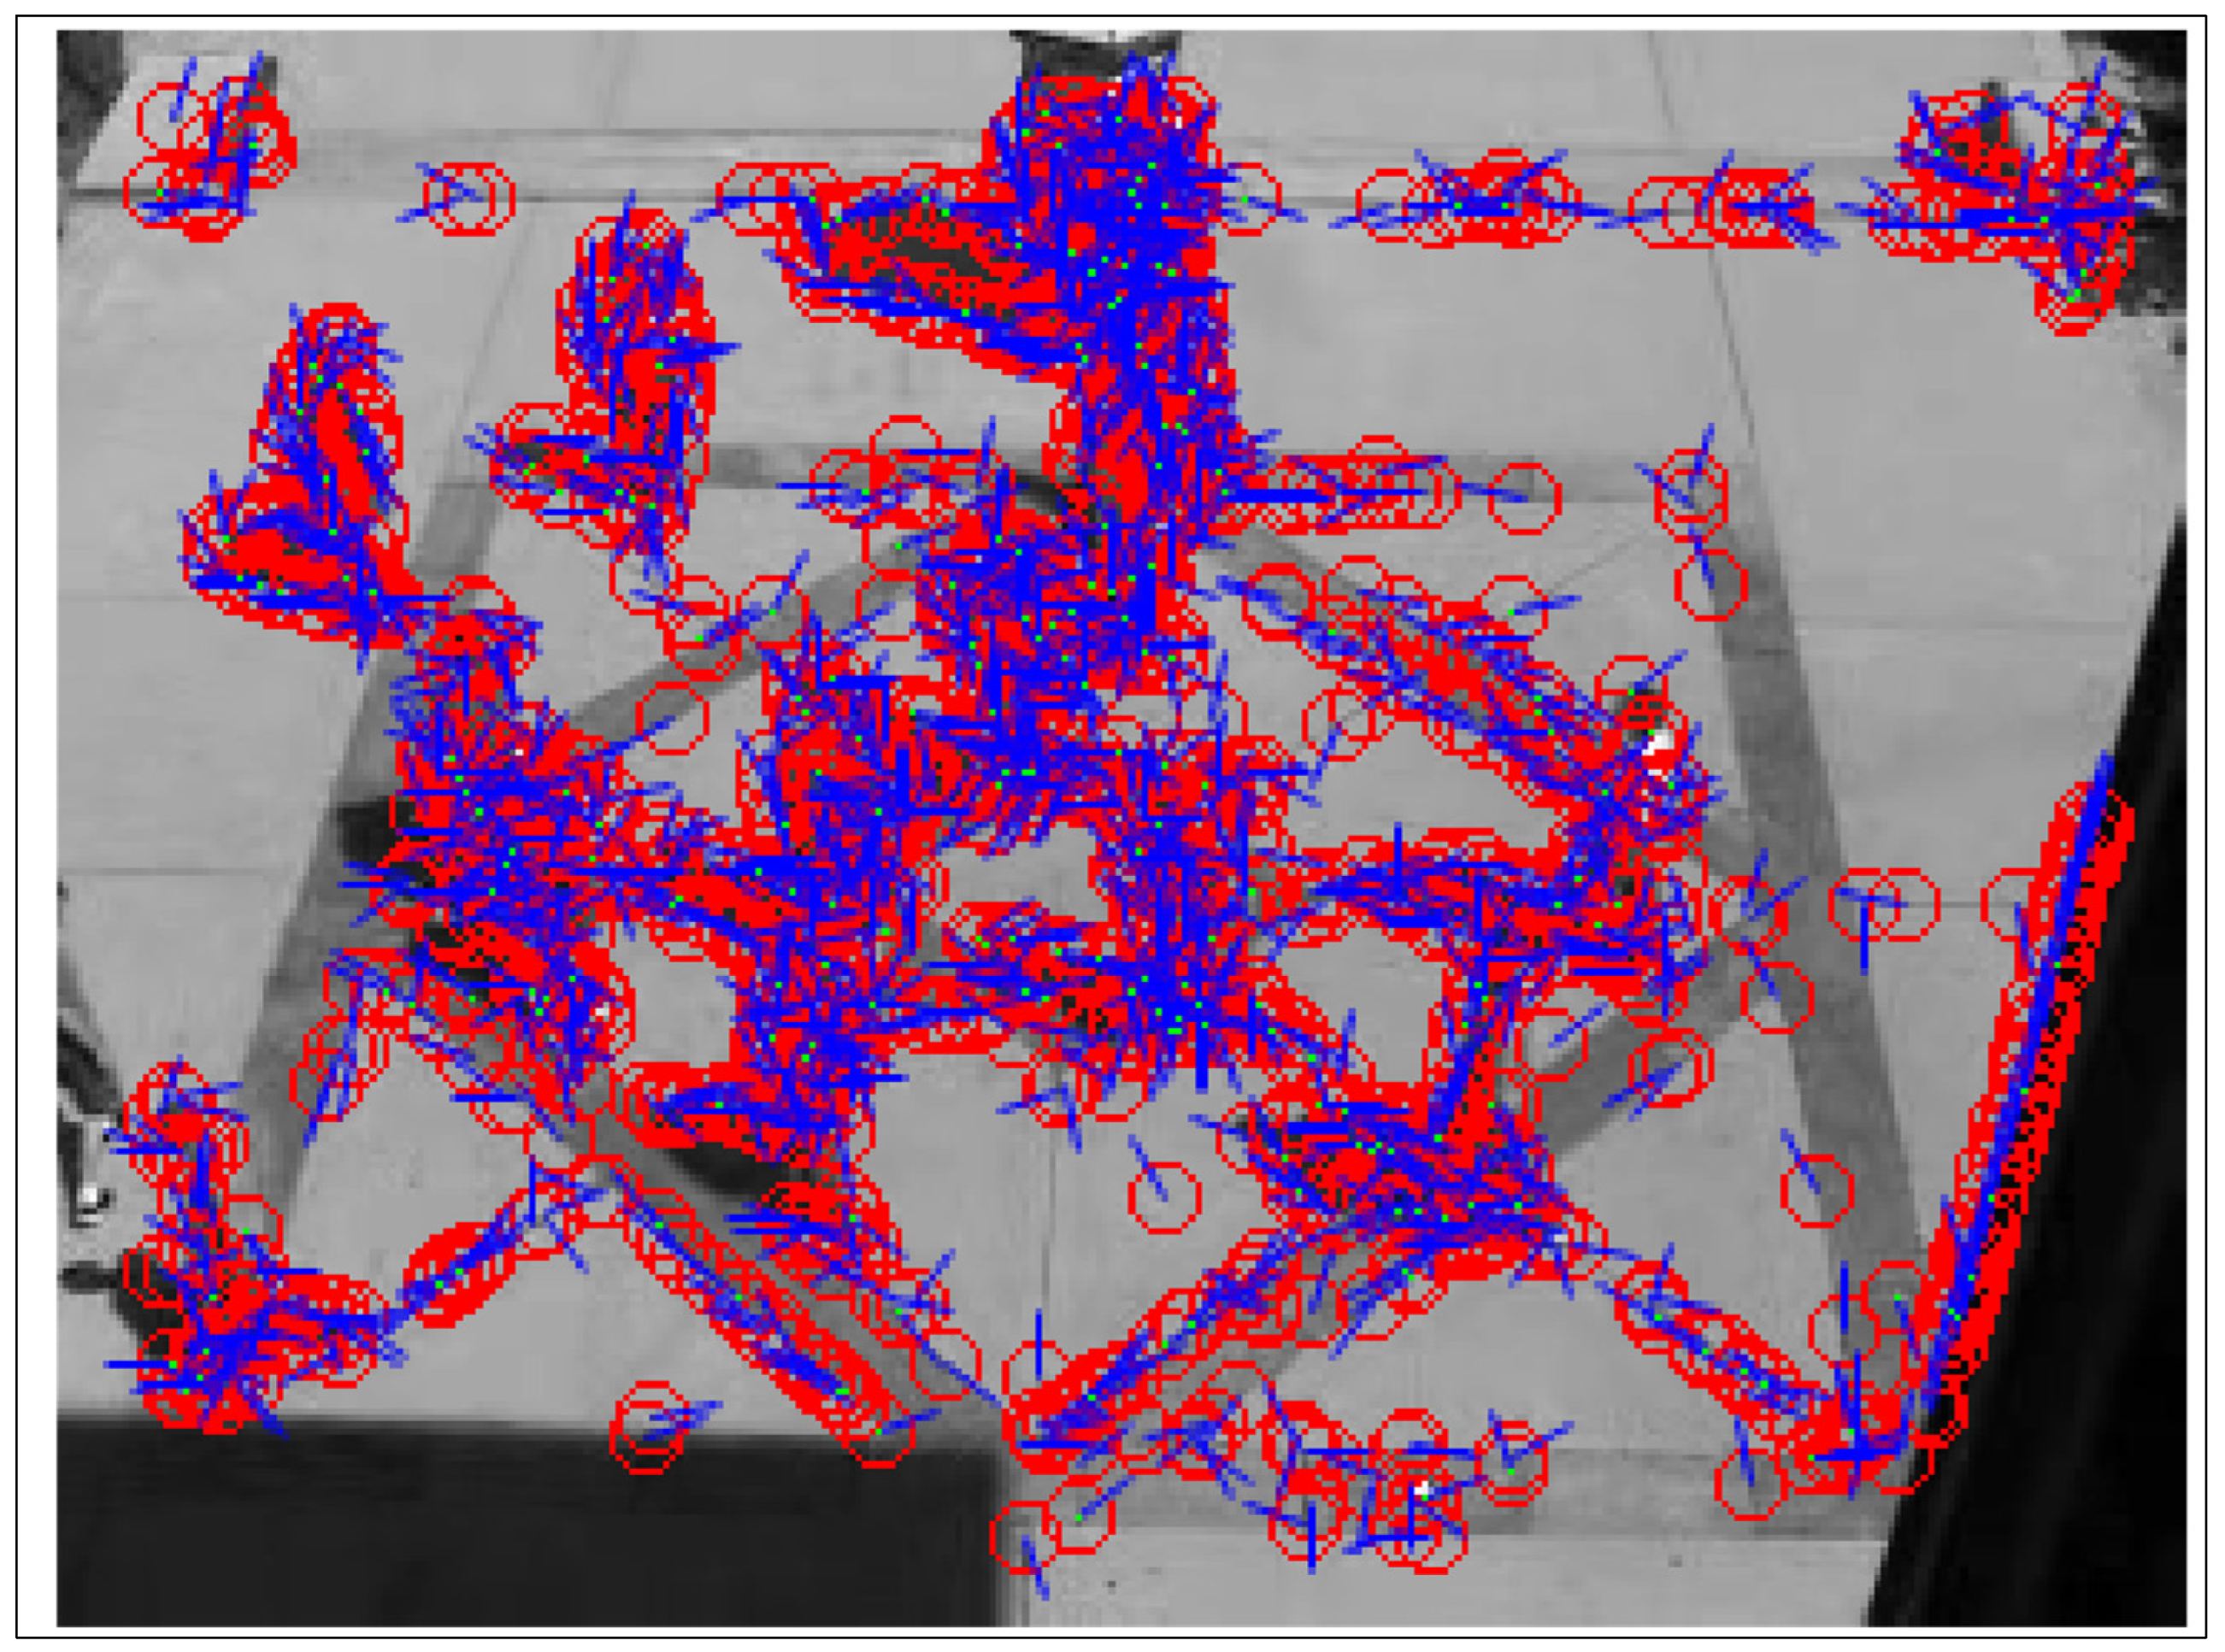
Figure 7.
The results of interaction force features over a crowded scene.
Figure 7.
The results of interaction force features over a crowded scene.
Figure 8.
The graphical visualization of force flow matrix features of the EBP system.
Figure 8.
The graphical visualization of force flow matrix features of the EBP system.
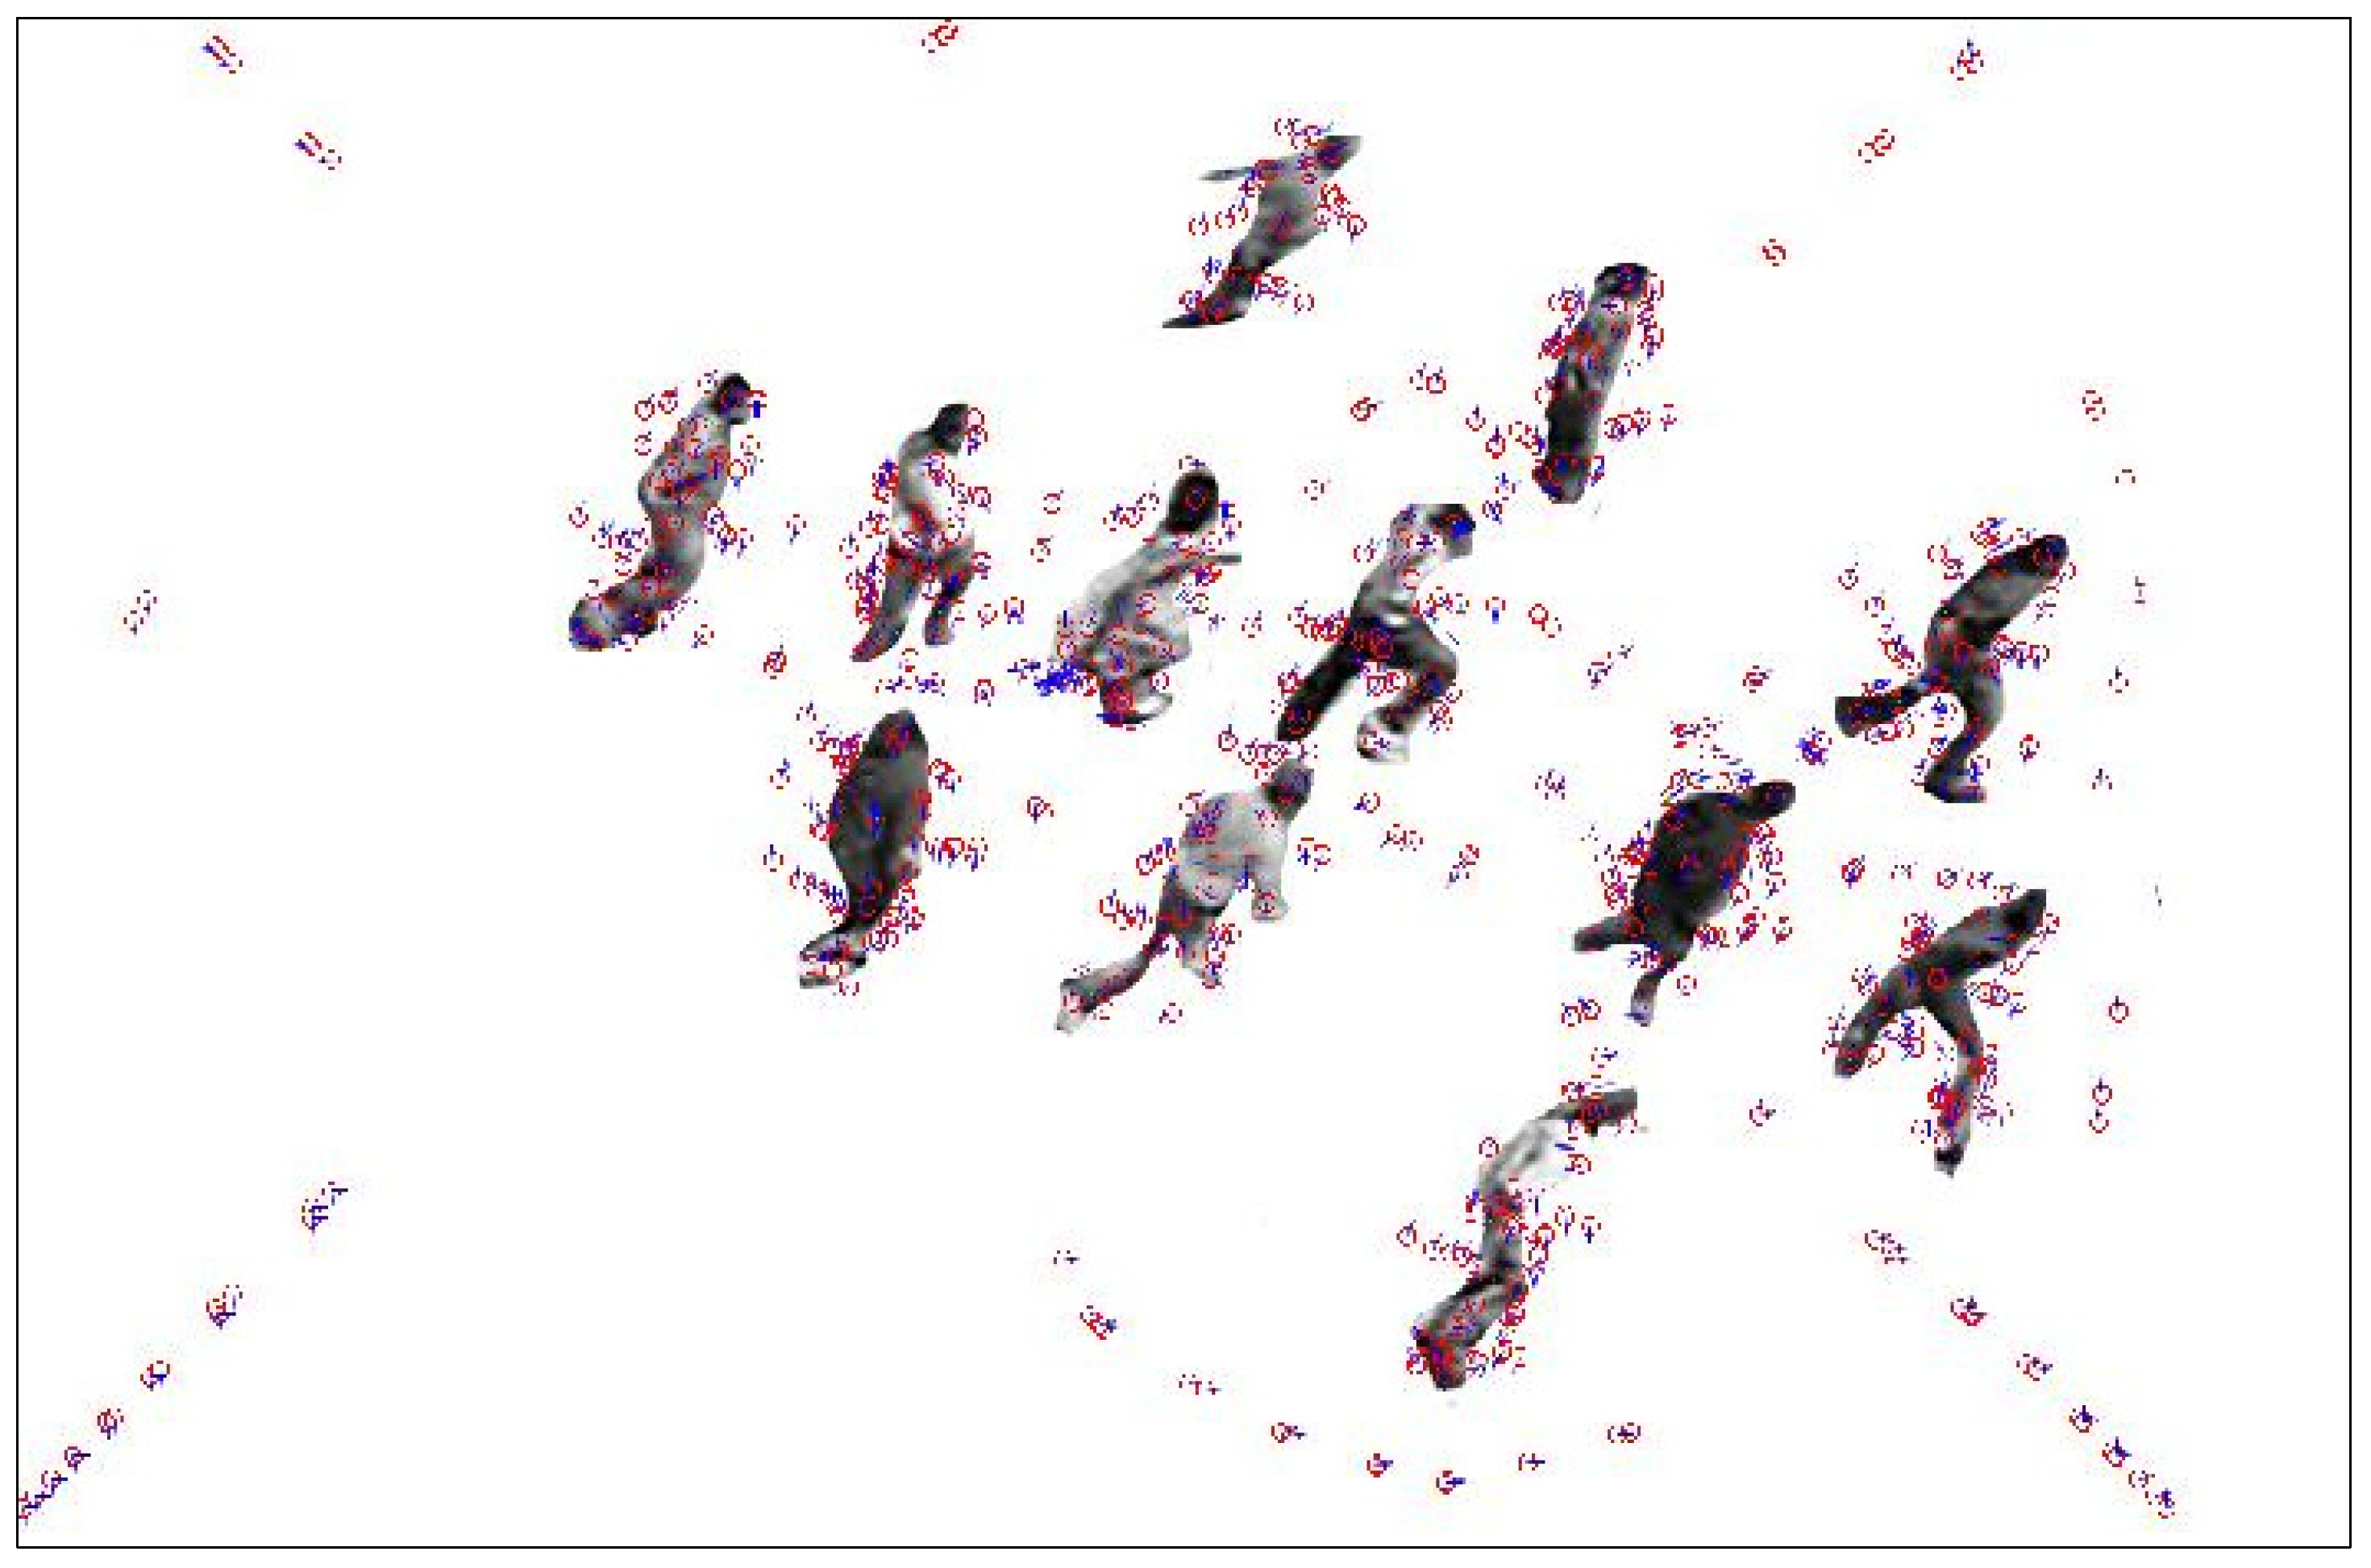
Figure 9.
Deep flow features result over a crowd scene. (a) Shows the results from the ADOC dataset and (b) shows the results from the dataset.
Figure 9.
Deep flow features result over a crowd scene. (a) Shows the results from the ADOC dataset and (b) shows the results from the dataset.
Figure 10.
Optimized features mining results using graph mining framework of extracted features vector. (a) Features vector in graph representation and (b) after graph mining, the features vector representation.
Figure 10.
Optimized features mining results using graph mining framework of extracted features vector. (a) Features vector in graph representation and (b) after graph mining, the features vector representation.
Figure 11.
The design diagram of the Maximum Entropy Markov Model algorithm.
Figure 11.
The design diagram of the Maximum Entropy Markov Model algorithm.
Figure 12.
Comparison of MEMM with Adaboost and K-ary Tree hashing algorithms.
Figure 12.
Comparison of MEMM with Adaboost and K-ary Tree hashing algorithms.
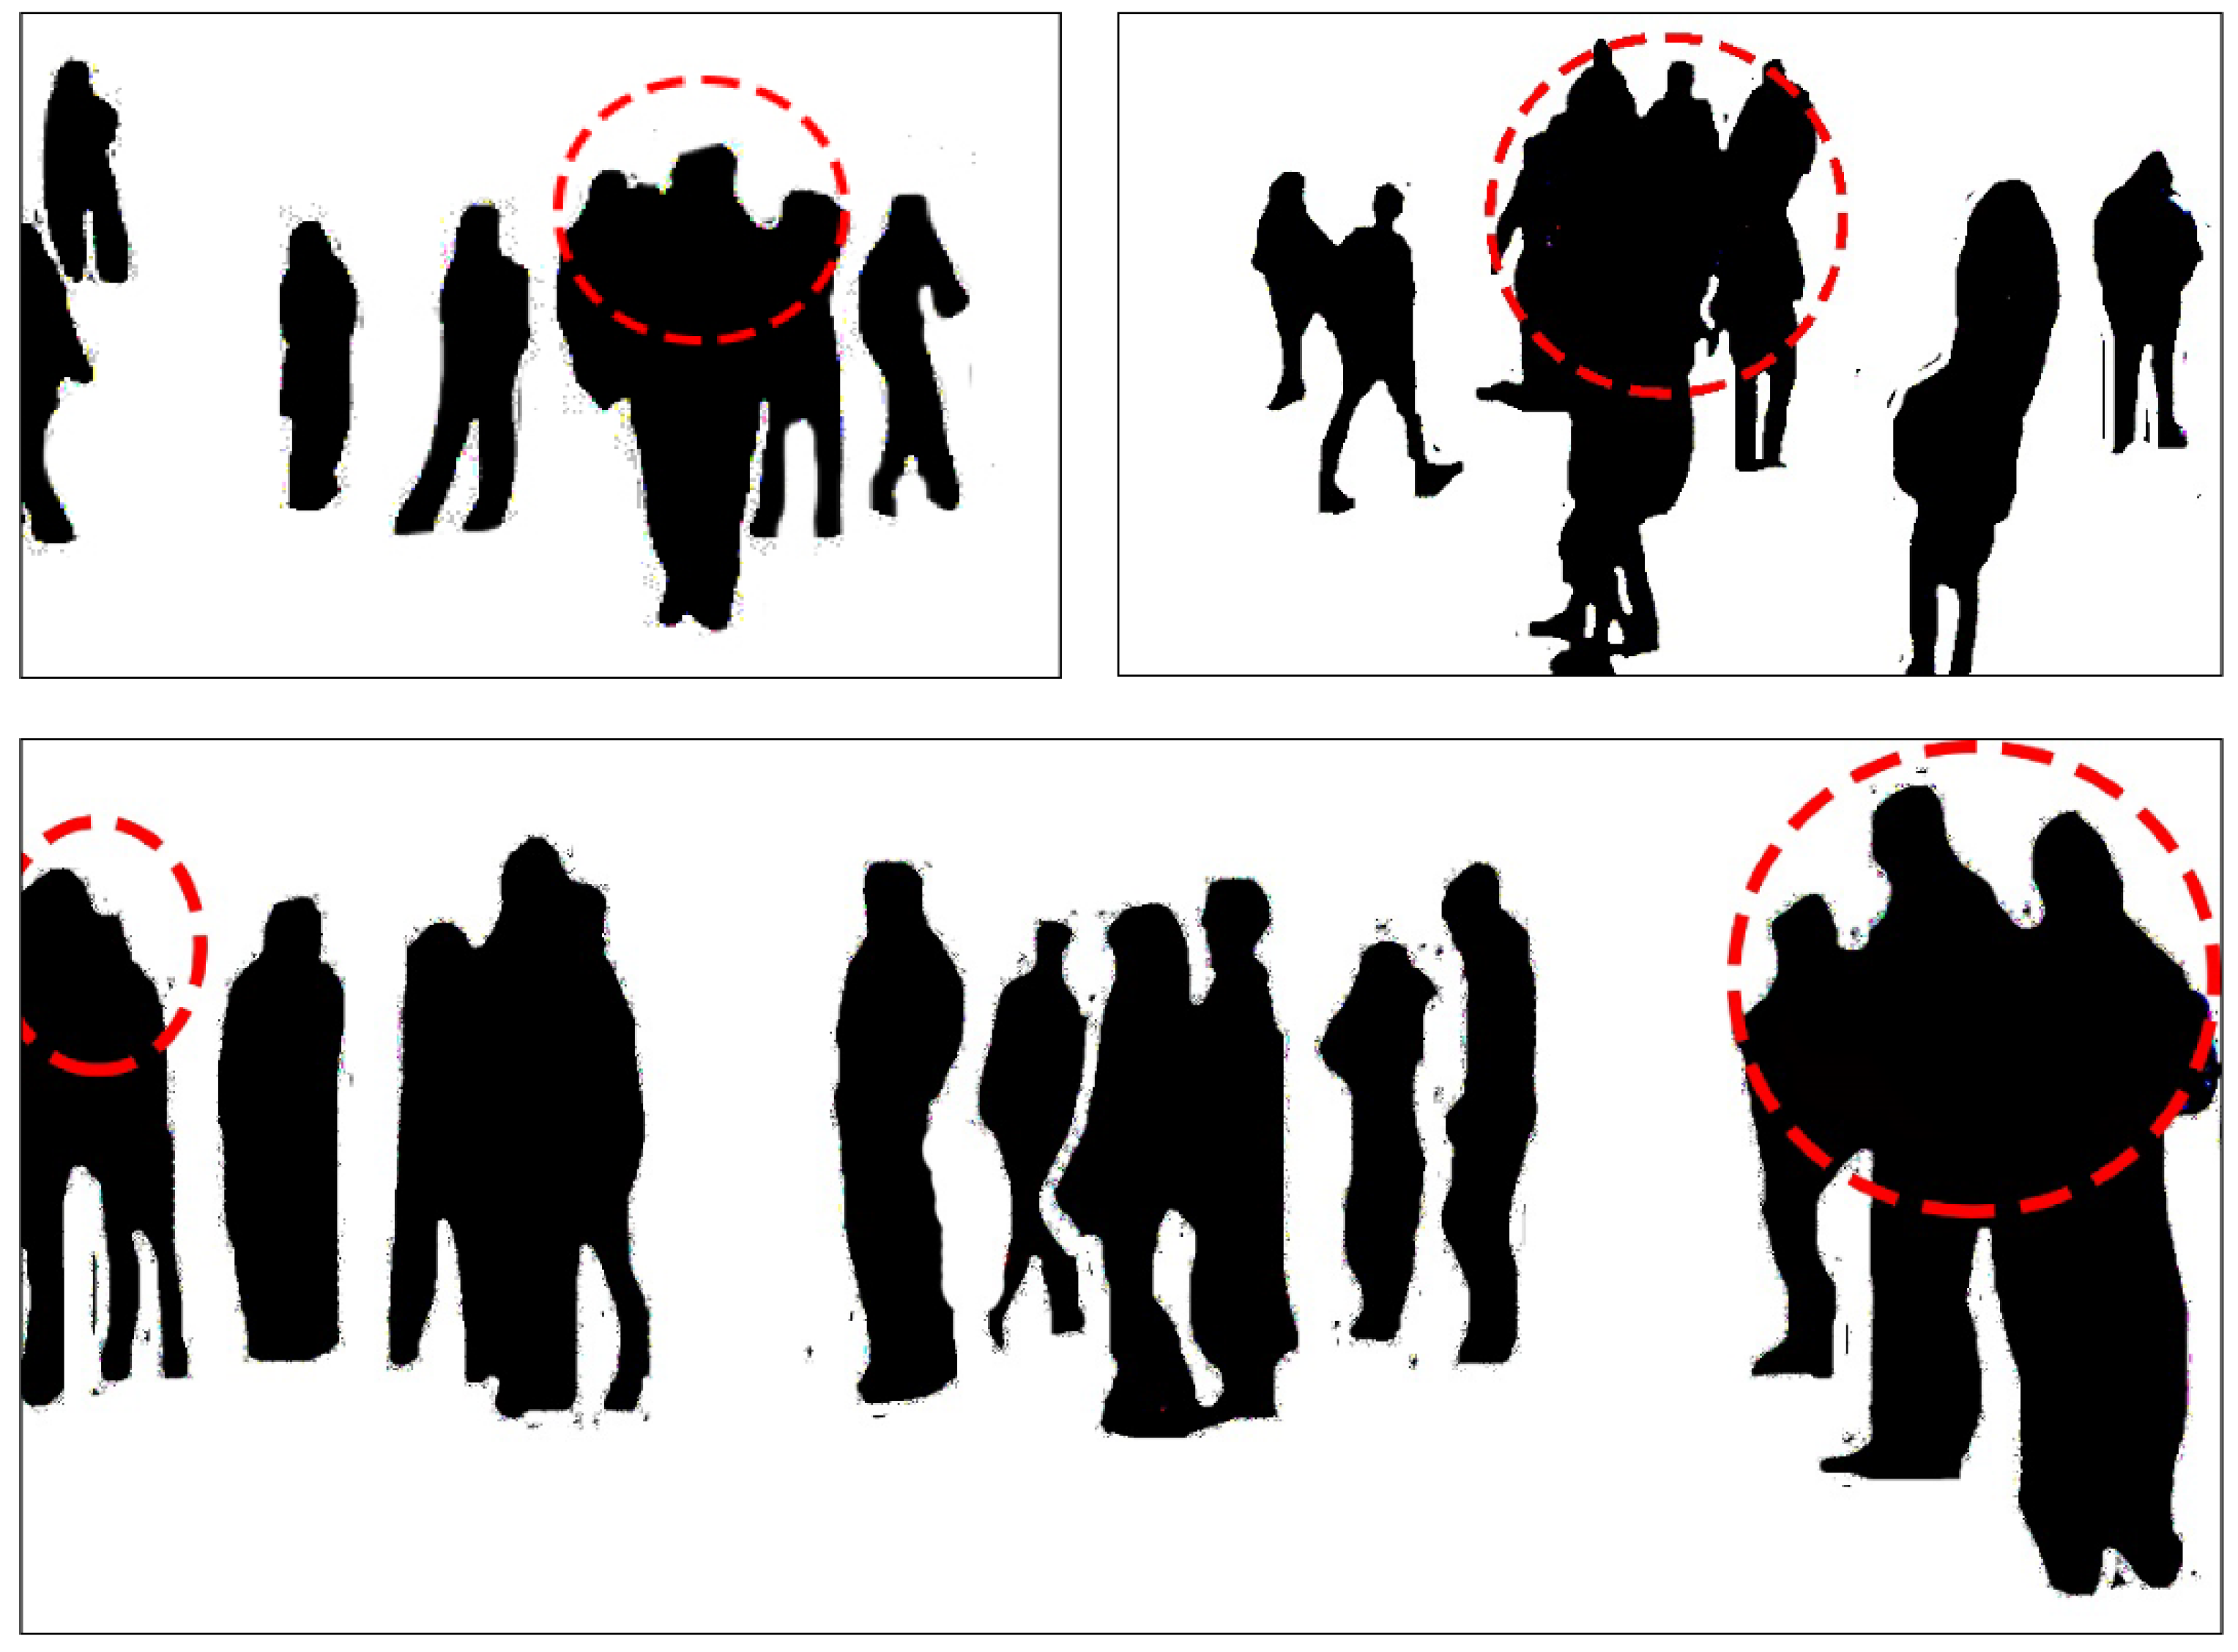
Figure 13.
The detailed results of some challenging images of obstruction issues.
Figure 13.
The detailed results of some challenging images of obstruction issues.
Table 1.
Actual human detection and recognition accuracy over avenue dataset.
Table 1.
Actual human detection and recognition accuracy over avenue dataset.
Sequence No
(Frames = 45) | Actual Track | Successful | Failure | Accuracy |
|---|
| 6 | 5 | 5 | 0 | 100.0 |
| 12 | 5 | 5 | 0 | 100.0 |
| 18 | 5 | 5 | 0 | 100.0 |
| 24 | 7 | 6 | 1 | 85.71 |
| 30 | 9 | 7 | 2 | 77.77 |
| 36 | 9 | 8 | 1 | 88.88 |
| 42 | 9 | 8 | 1 | 88.88 |
| Mean accuracy = 91.60% |
Table 2.
Actual human detection and recognition accuracy over UMN dataset.
Table 2.
Actual human detection and recognition accuracy over UMN dataset.
Sequence No
(Frames = 45) | Actual Track | Successful | Failure | Accuracy |
|---|
| 6 | 11 | 11 | 0 | 100.0 |
| 12 | 11 | 10 | 1 | 91.66 |
| 18 | 12 | 11 | 1 | 91.66 |
| 24 | 12 | 11 | 1 | 91.66 |
| 30 | 13 | 12 | 1 | 92.30 |
| 36 | 13 | 11 | 2 | 84.61 |
| 42 | 13 | 11 | 2 | 84.61 |
| Mean accuracy = 90.92% |
Table 3.
Actual human detection and recognition accuracy over ADOC dataset.
Table 3.
Actual human detection and recognition accuracy over ADOC dataset.
Sequence No
(Frames=45) | Actual Track | Successful | Failure | Accuracy |
|---|
| 6 | 12 | 12 | 0 | 100.0 |
| 12 | 12 | 11 | 1 | 91.66 |
| 18 | 13 | 12 | 1 | 92.30 |
| 24 | 13 | 12 | 1 | 92.30 |
| 30 | 14 | 13 | 1 | 92.85 |
| 36 | 15 | 14 | 1 | 93.33 |
| 42 | 16 | 14 | 2 | 87.50 |
| Mean accuracy = 92.84% |
Table 4.
Confusion matrix of proposed EPB method over avenue dataset.
Table 4.
Confusion matrix of proposed EPB method over avenue dataset.
| Scene No | Anomaly Detection | Error Rate |
|---|
| Scene 01 | 84.00 | 16.00 |
| Scene 02 | 87.50 | 12.50 |
| Scene 03 | 89.50 | 10.50 |
| Mean accuracy | 87.00% | 13.00% |
Table 5.
Confusion matrix of proposed EPB method over UMN dataset.
Table 5.
Confusion matrix of proposed EPB method over UMN dataset.
| Scene No | Anomaly Detection | Error Rate |
|---|
| Scene 01 | 87.50 | 12.50 |
| Scene 02 | 89.50 | 10.50 |
| Scene 03 | 91.50 | 08.50 |
| Mean accuracy | 89.50% | 10.50% |
Table 6.
Confusion matrix of proposed EPB method over A Day on Campus (ADOC) data set.
Table 6.
Confusion matrix of proposed EPB method over A Day on Campus (ADOC) data set.
| Scene No | Anomaly Detection | Error Rate |
|---|
| Scene 01 | 86.50 | 13.50 |
| Scene 02 | 91.50 | 8.50 |
| Scene 03 | 93.50 | 6.50 |
| Mean accuracy | 90.50% | 9.50% |
Table 7.
Comparison of proposed method accuracy with state-of-the-art methods over Avenue, UMN, and ADOC datasets.
Table 7.
Comparison of proposed method accuracy with state-of-the-art methods over Avenue, UMN, and ADOC datasets.
| Methods | Avenue | UMN | ADOC |
|---|
| Fine-grained [54]
| - | 85.00 | - |
| GLCM Texture Based [55]
| - | 88.00 | - |
| Levya et al. [56]
| - | 88.30 | - |
| Vu et al. [57]
| 71.50 | - | - |
| Gong et al. [58]
| 83.30 | - | - |
| Tang et al. [59]
| 85.10 | - | - |
| Chong et al. [60]
| - | - | 84.60 |
| Pourreza et al. [61]
| - | - | 87.05 |
| Our proposed method | 87.00% | 89.50% | 90.50% |
| Publisher’s Note: MDPI stays neutral with regard to jurisdictional claims in published maps and institutional affiliations. |
© 2022 by the authors. Licensee MDPI, Basel, Switzerland. This article is an open access article distributed under the terms and conditions of the Creative Commons Attribution (CC BY) license (https://creativecommons.org/licenses/by/4.0/).


 ,
, 


