
RCC Structural Deformation and Damage Quantification Using Unmanned Aerial Vehicle Image Correlation Technique

 , , ,
, , ,  ,
,
Abstract
:1. Introduction
2. Literature Review
- (a)
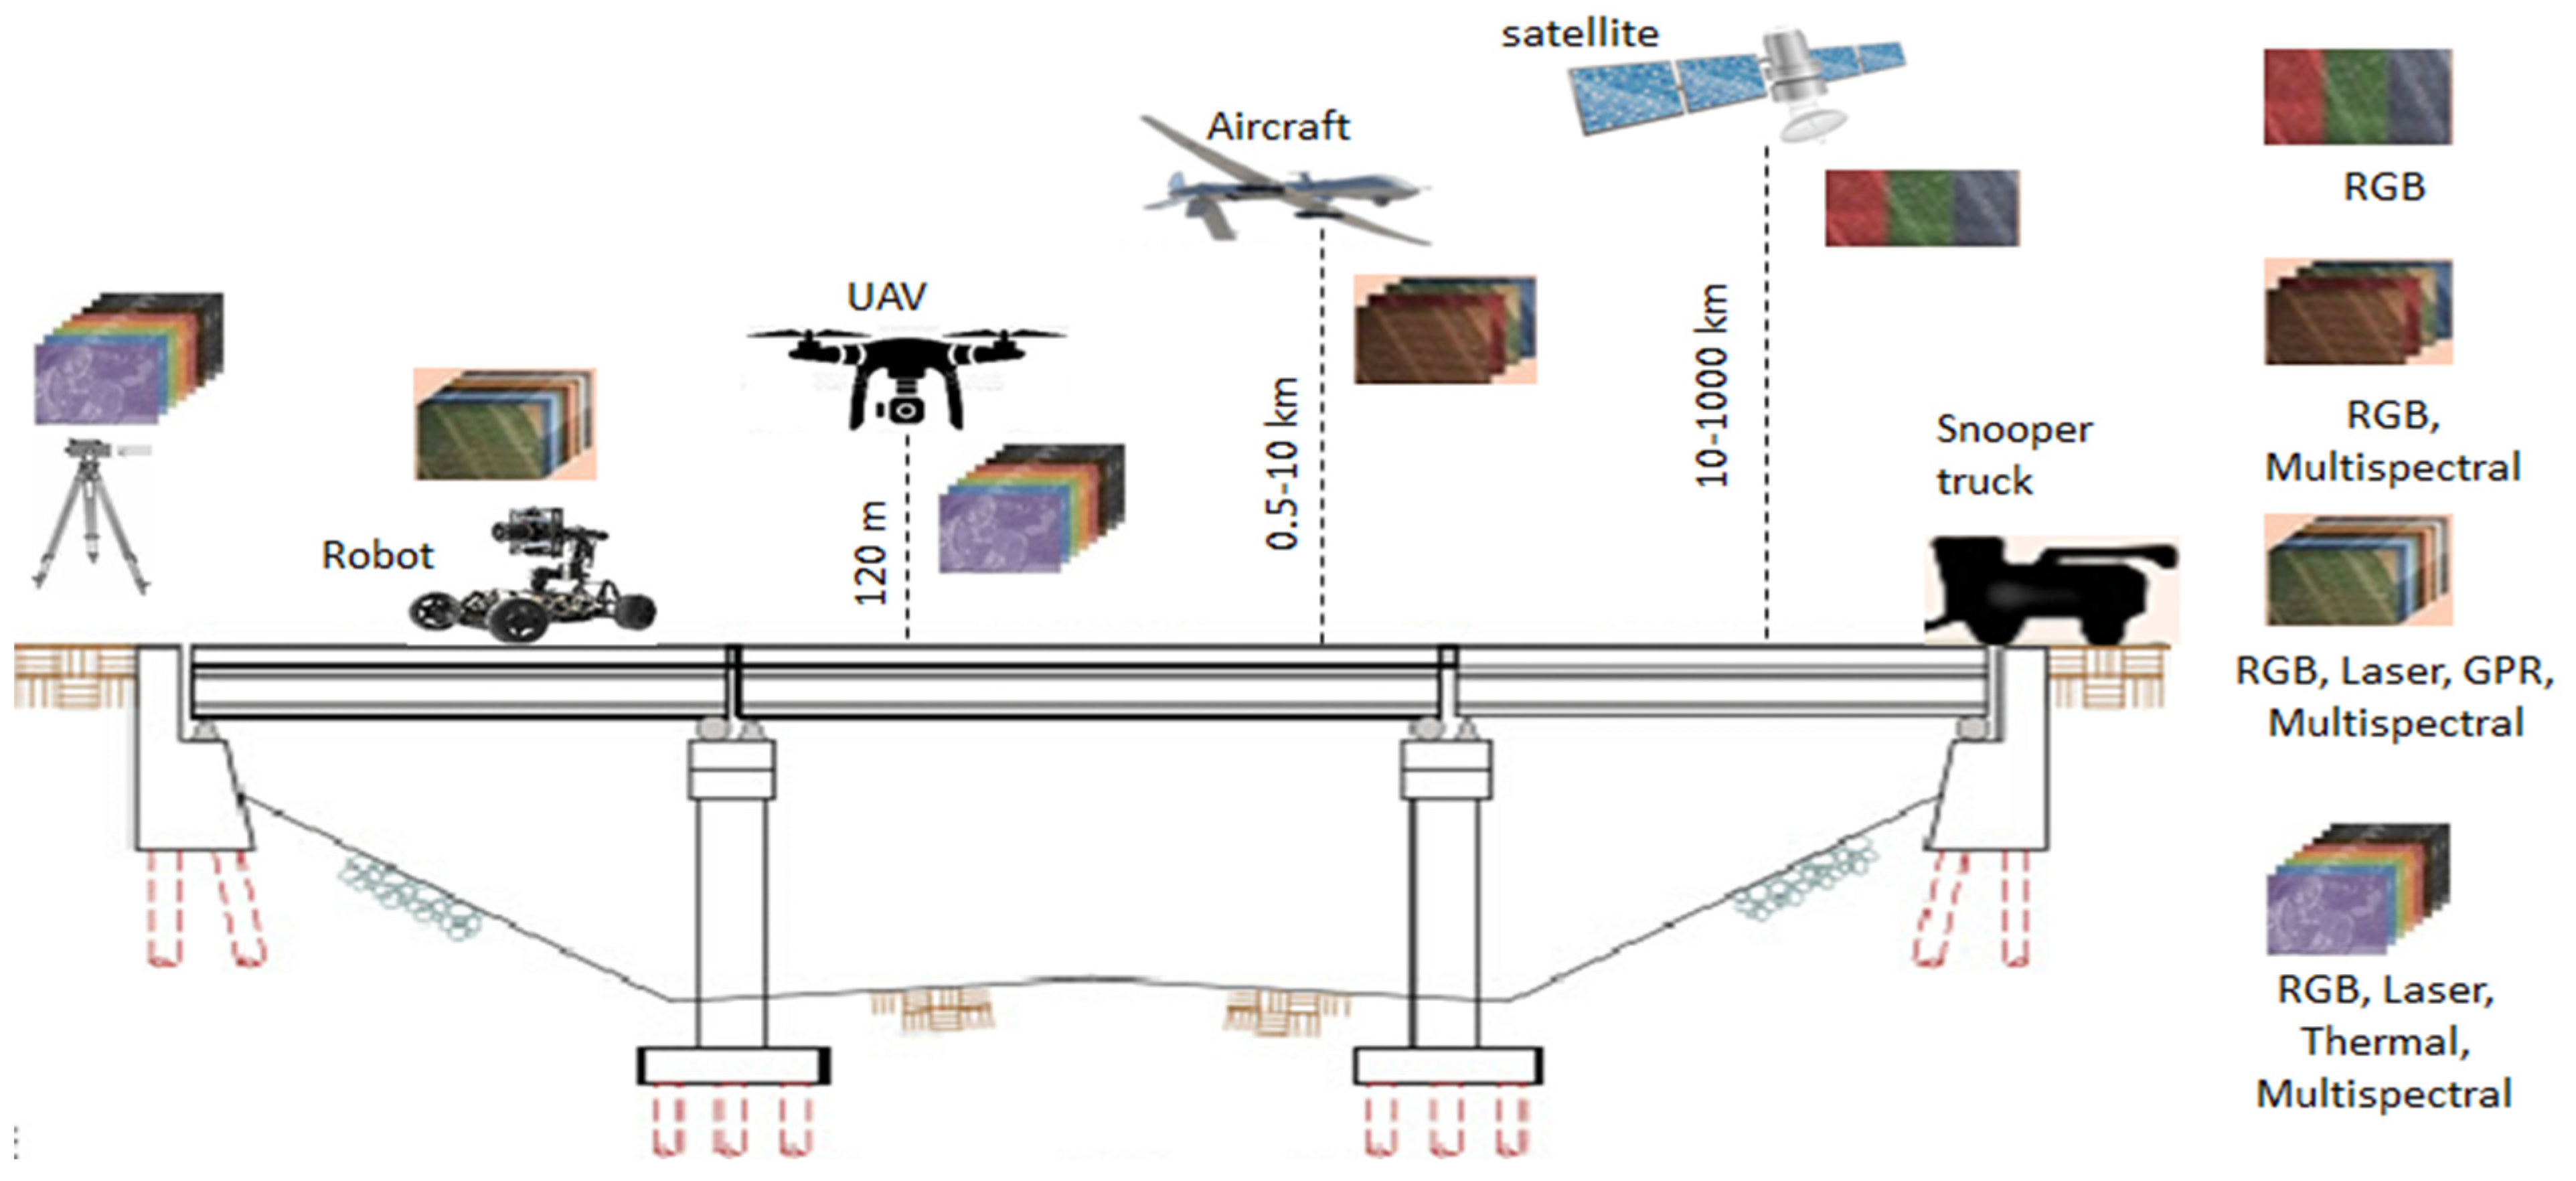
- Terrestrial Cameras: terrestrial cameras are mounted on a tripod and they have the capability to continuously acquire the data for longer periods. Different sensors, such as visible range (RGB), laser, thermal and multispectral can be mounted on the same data acquisition platform. Terrestrial cameras and laser scanners to produce 3D models through point clouds can be operated even in varied climatic conditions.
- (b)
- Robot: Robotics can be operated directly on top of the bridge deck to produce high-resolution data sets using sensors, such as RGB, laser, ground penetrating radar (GPR) and multispectral. GPR has a unique capability in exploring the internal core condition of the RCC bridge deck to inspect the further serviceability of the structure.
- (c)
- Unmanned Aerial Vehicle (UAV): UAV/drone operational altitude is low and restricted to height of 400 ft (120 m) as per the guidelines issued by the Director General of Civil Aviation (DGCA), so it can be operated very near to the target object. UAV can acquire high resolution digital, multispectral and thermal imaging datasets along with laser point cloud data to inspect the bridge.
- (a)
- Unmanned/Manned aircraft: Aircraft flying range is above 1 km to 10 km and flies at supersonic speeds. The data acquired at specified speed and altitude generates coarse resolution images of the structure that can actually be used for preparing a rough estimate of a damaged structure during natural calamity. Only high-resolution visible range RGB and Multispectral imaging data acquired through aircraft is considered for damage assessment of a bridge.
- (b)
- Satellite: Satellites are operated at higher altitudes of 10–1000 km, and the revisit time on a particular location is more than 5 days, which may not be available at desired dates. Data sets obtained are of coarser resolution and may contain cloud cover that makes the bridge monitoring a hard task [27].
Objective
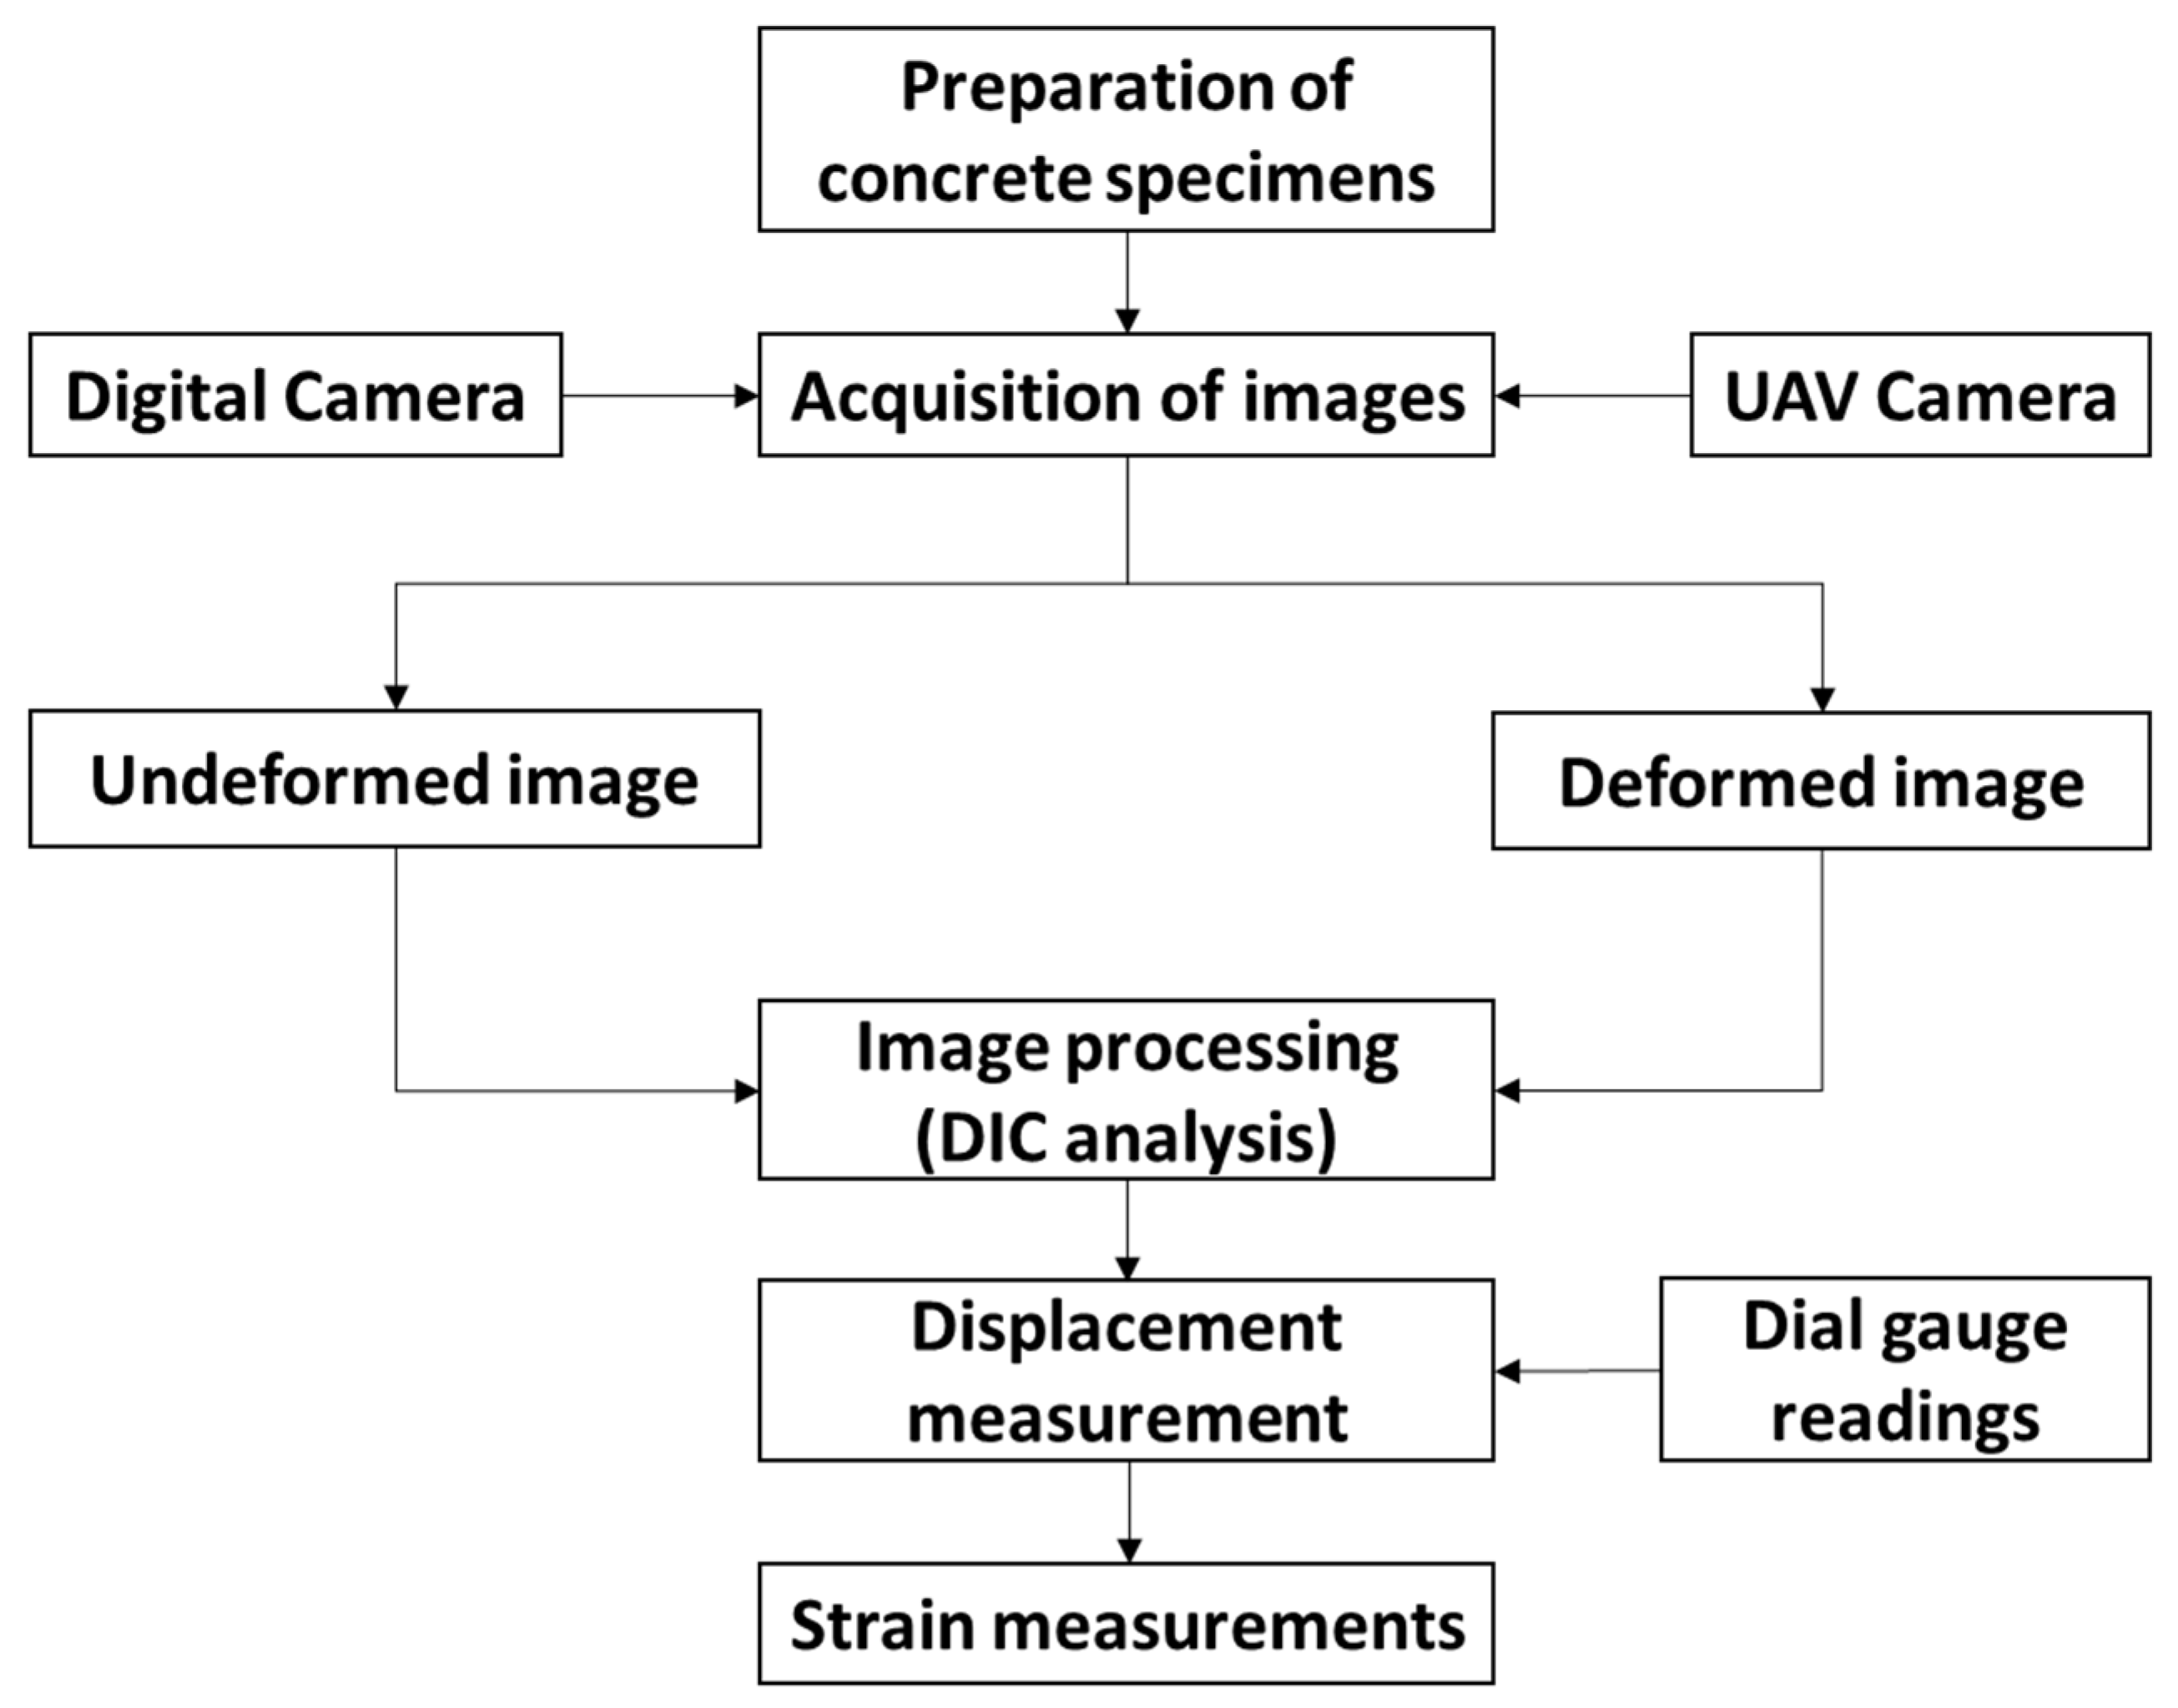
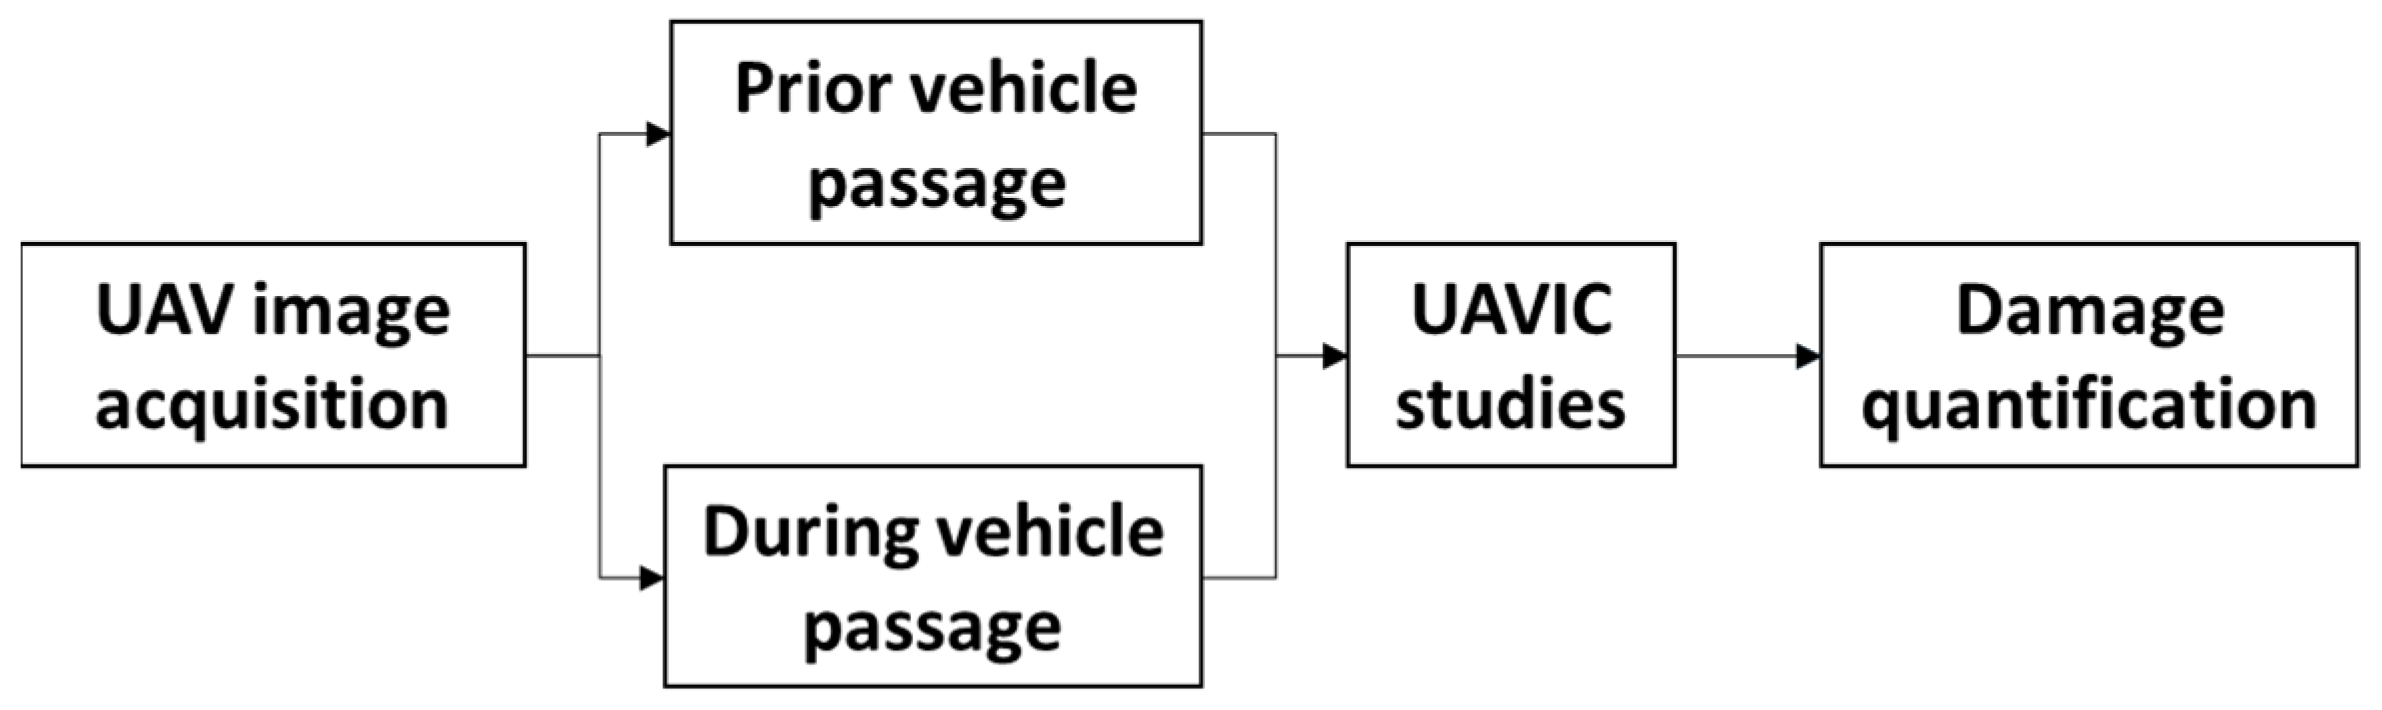
3. Methodology
3.1. UAVIC Studies in Laboratory Conditions
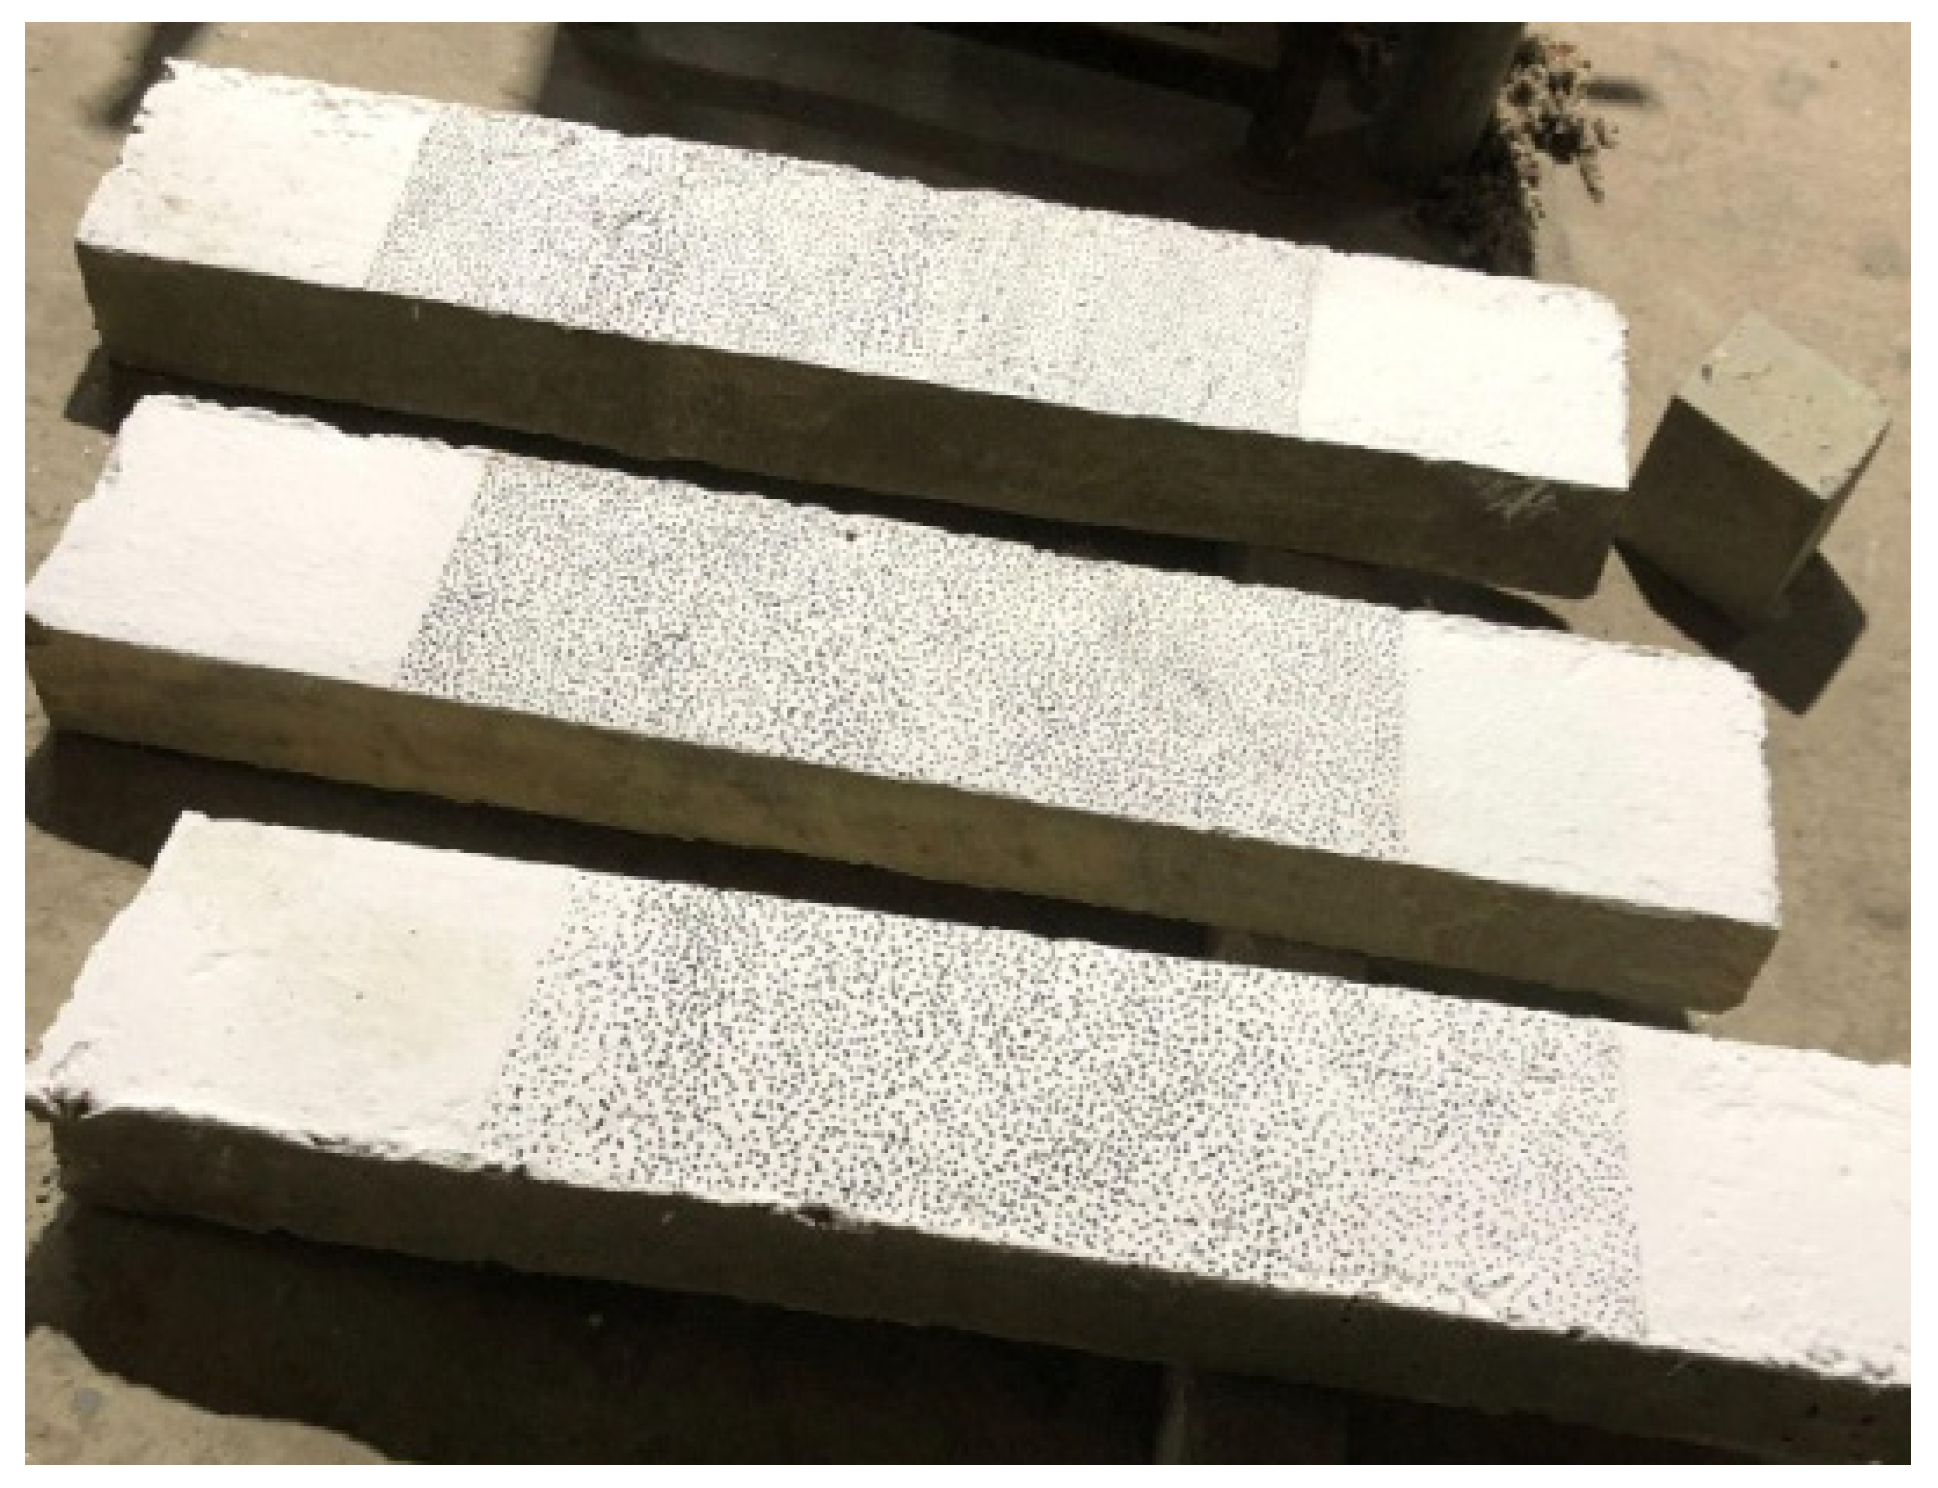
3.1.1. Specimen Preparation
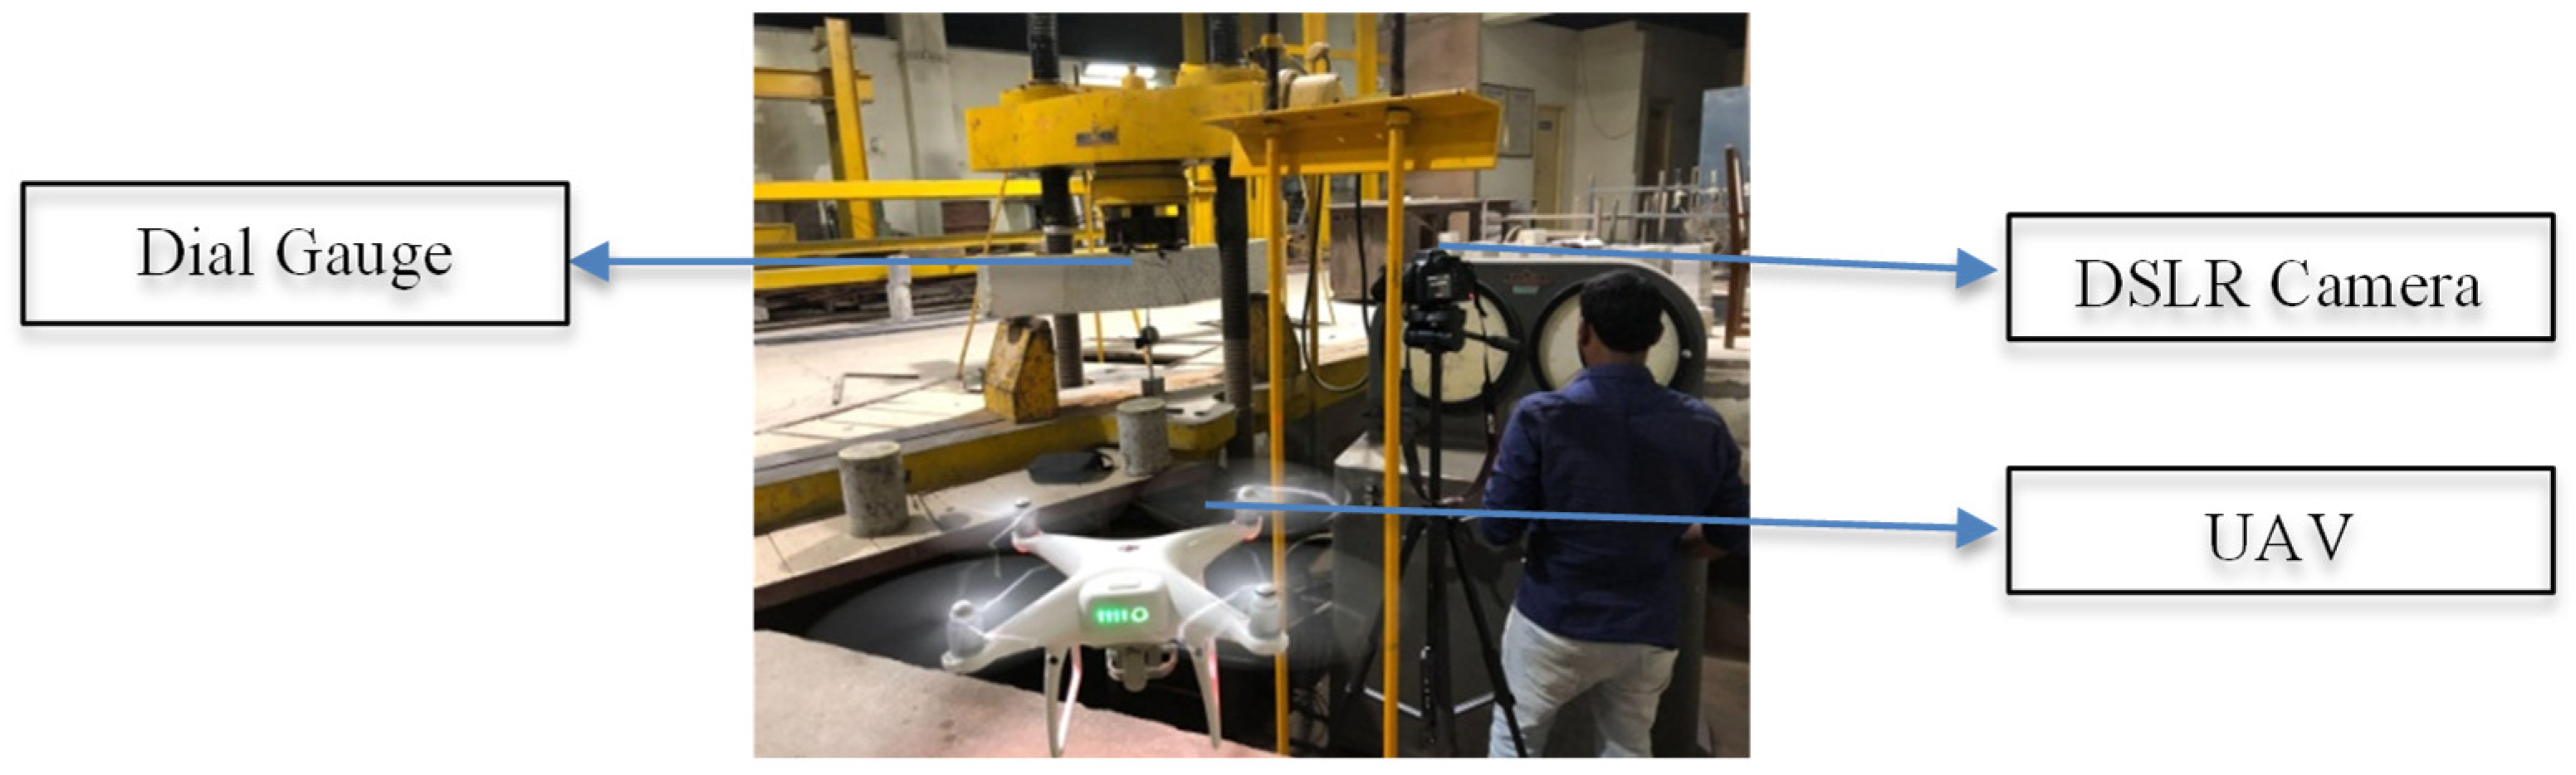
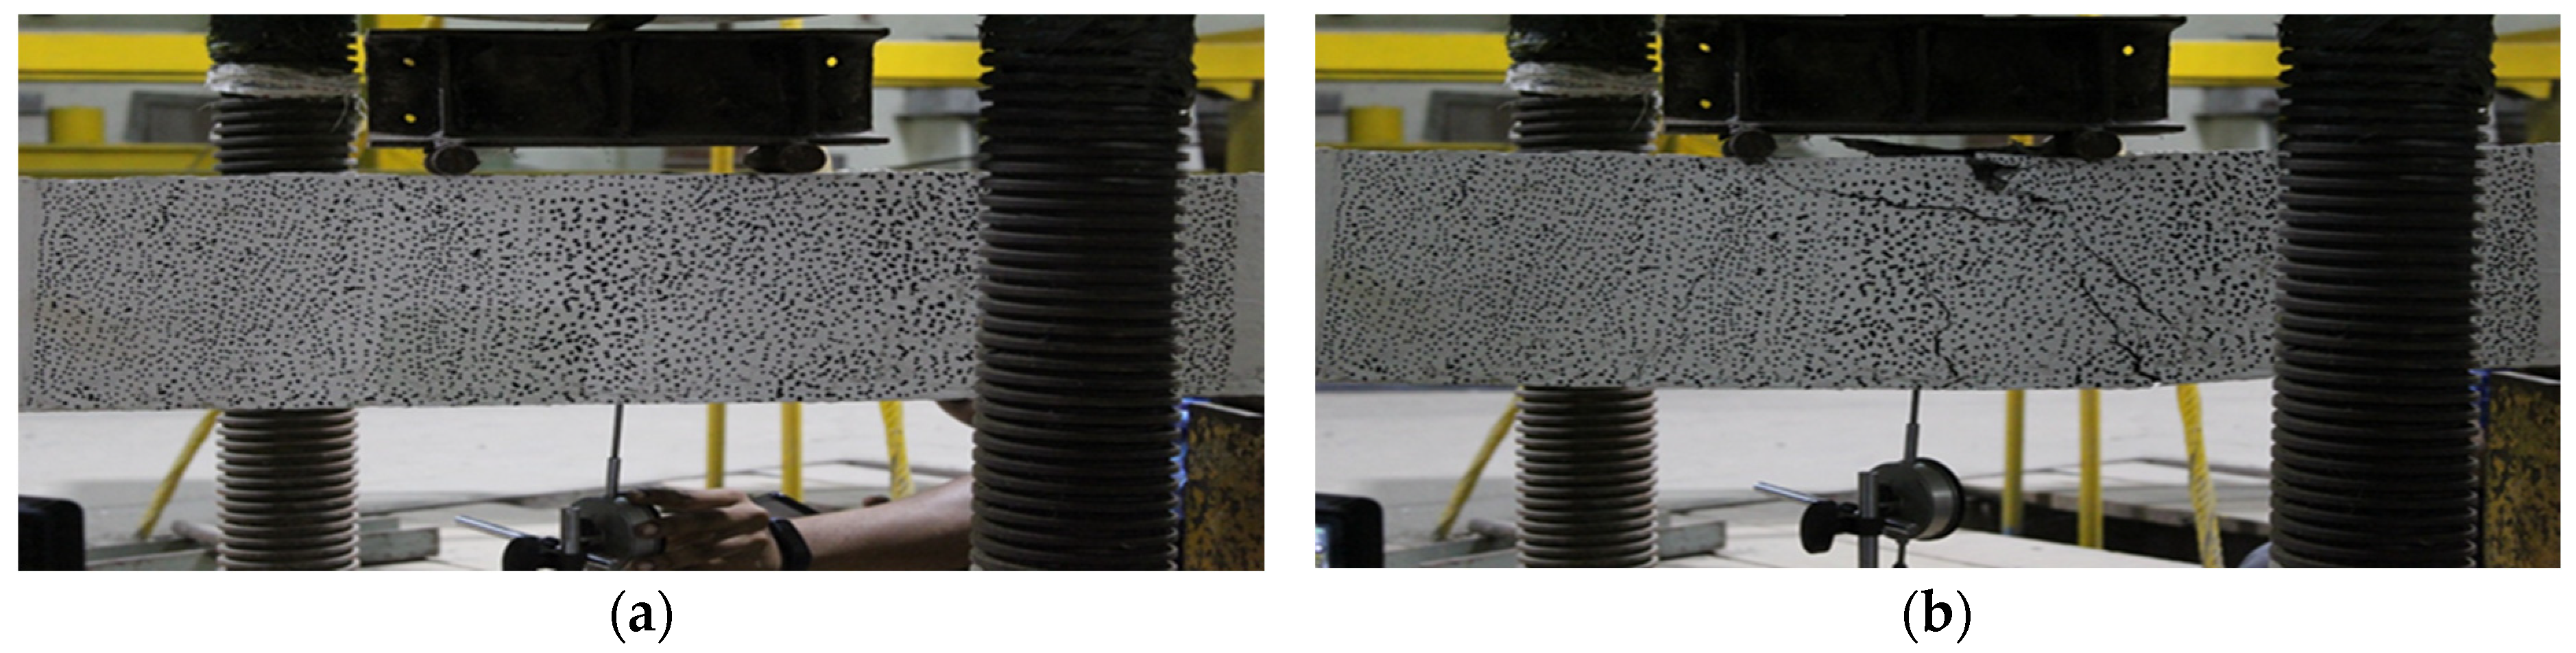
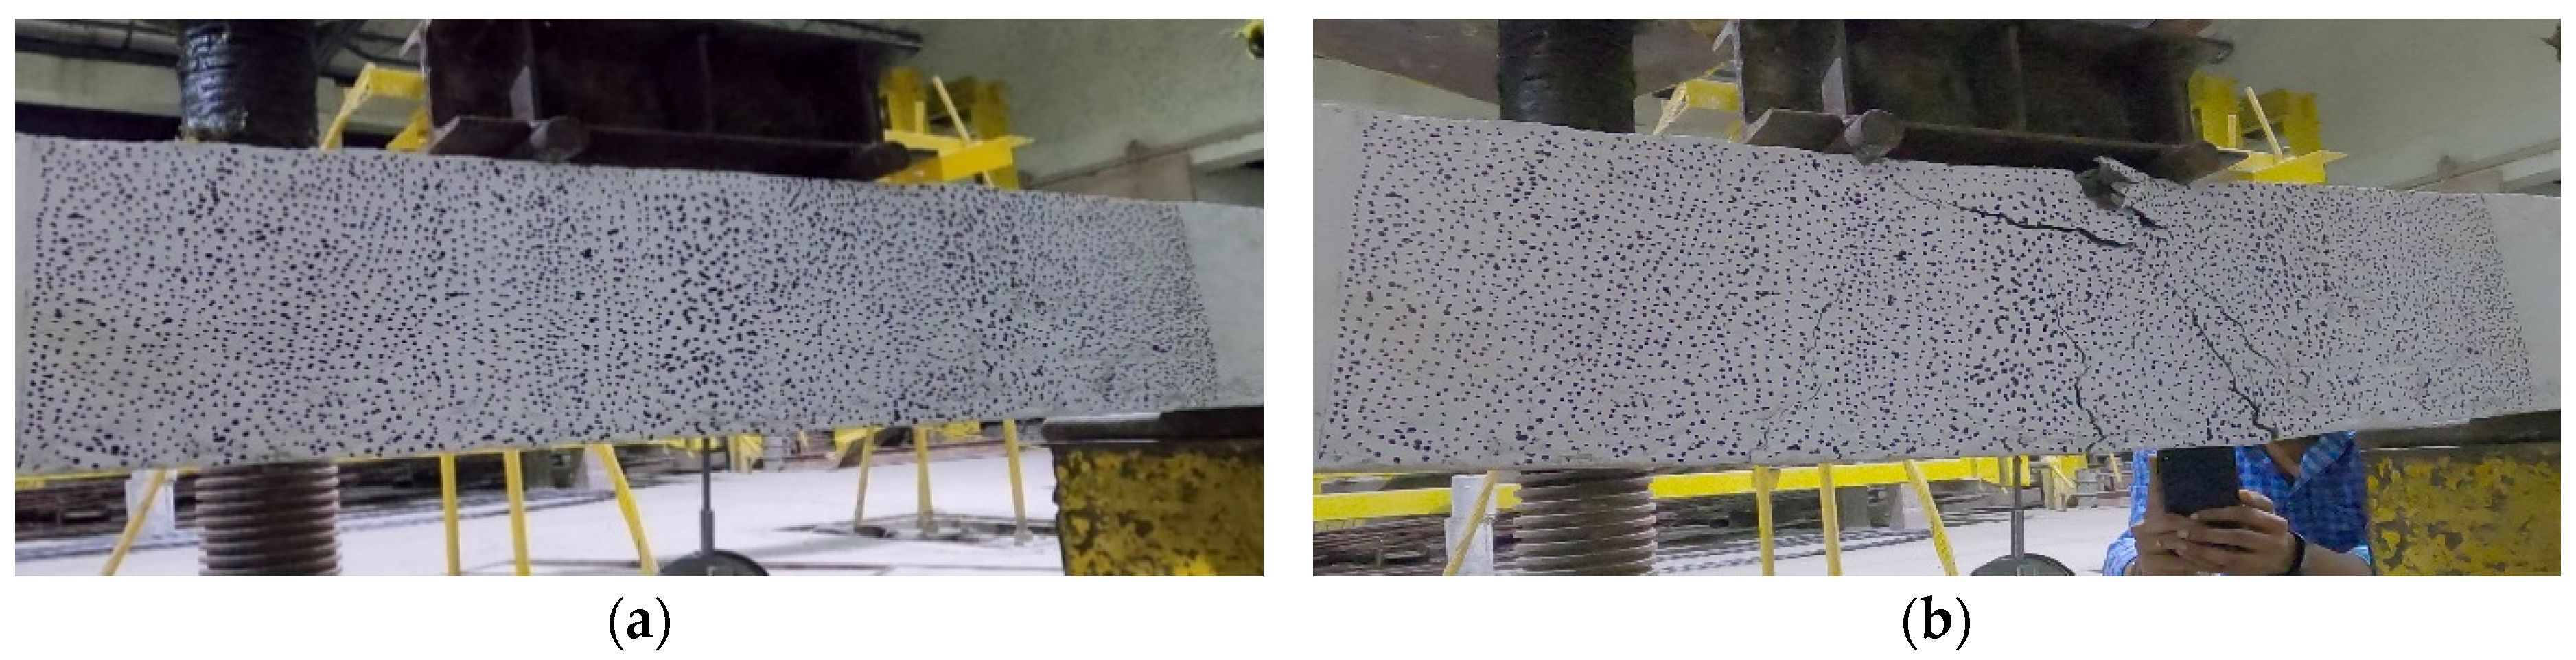
3.1.2. Loading Test
3.1.3. Image Acquisition
3.1.4. Image Correlation Using Ncorr via MATLAB
3.1.5. Setting Images
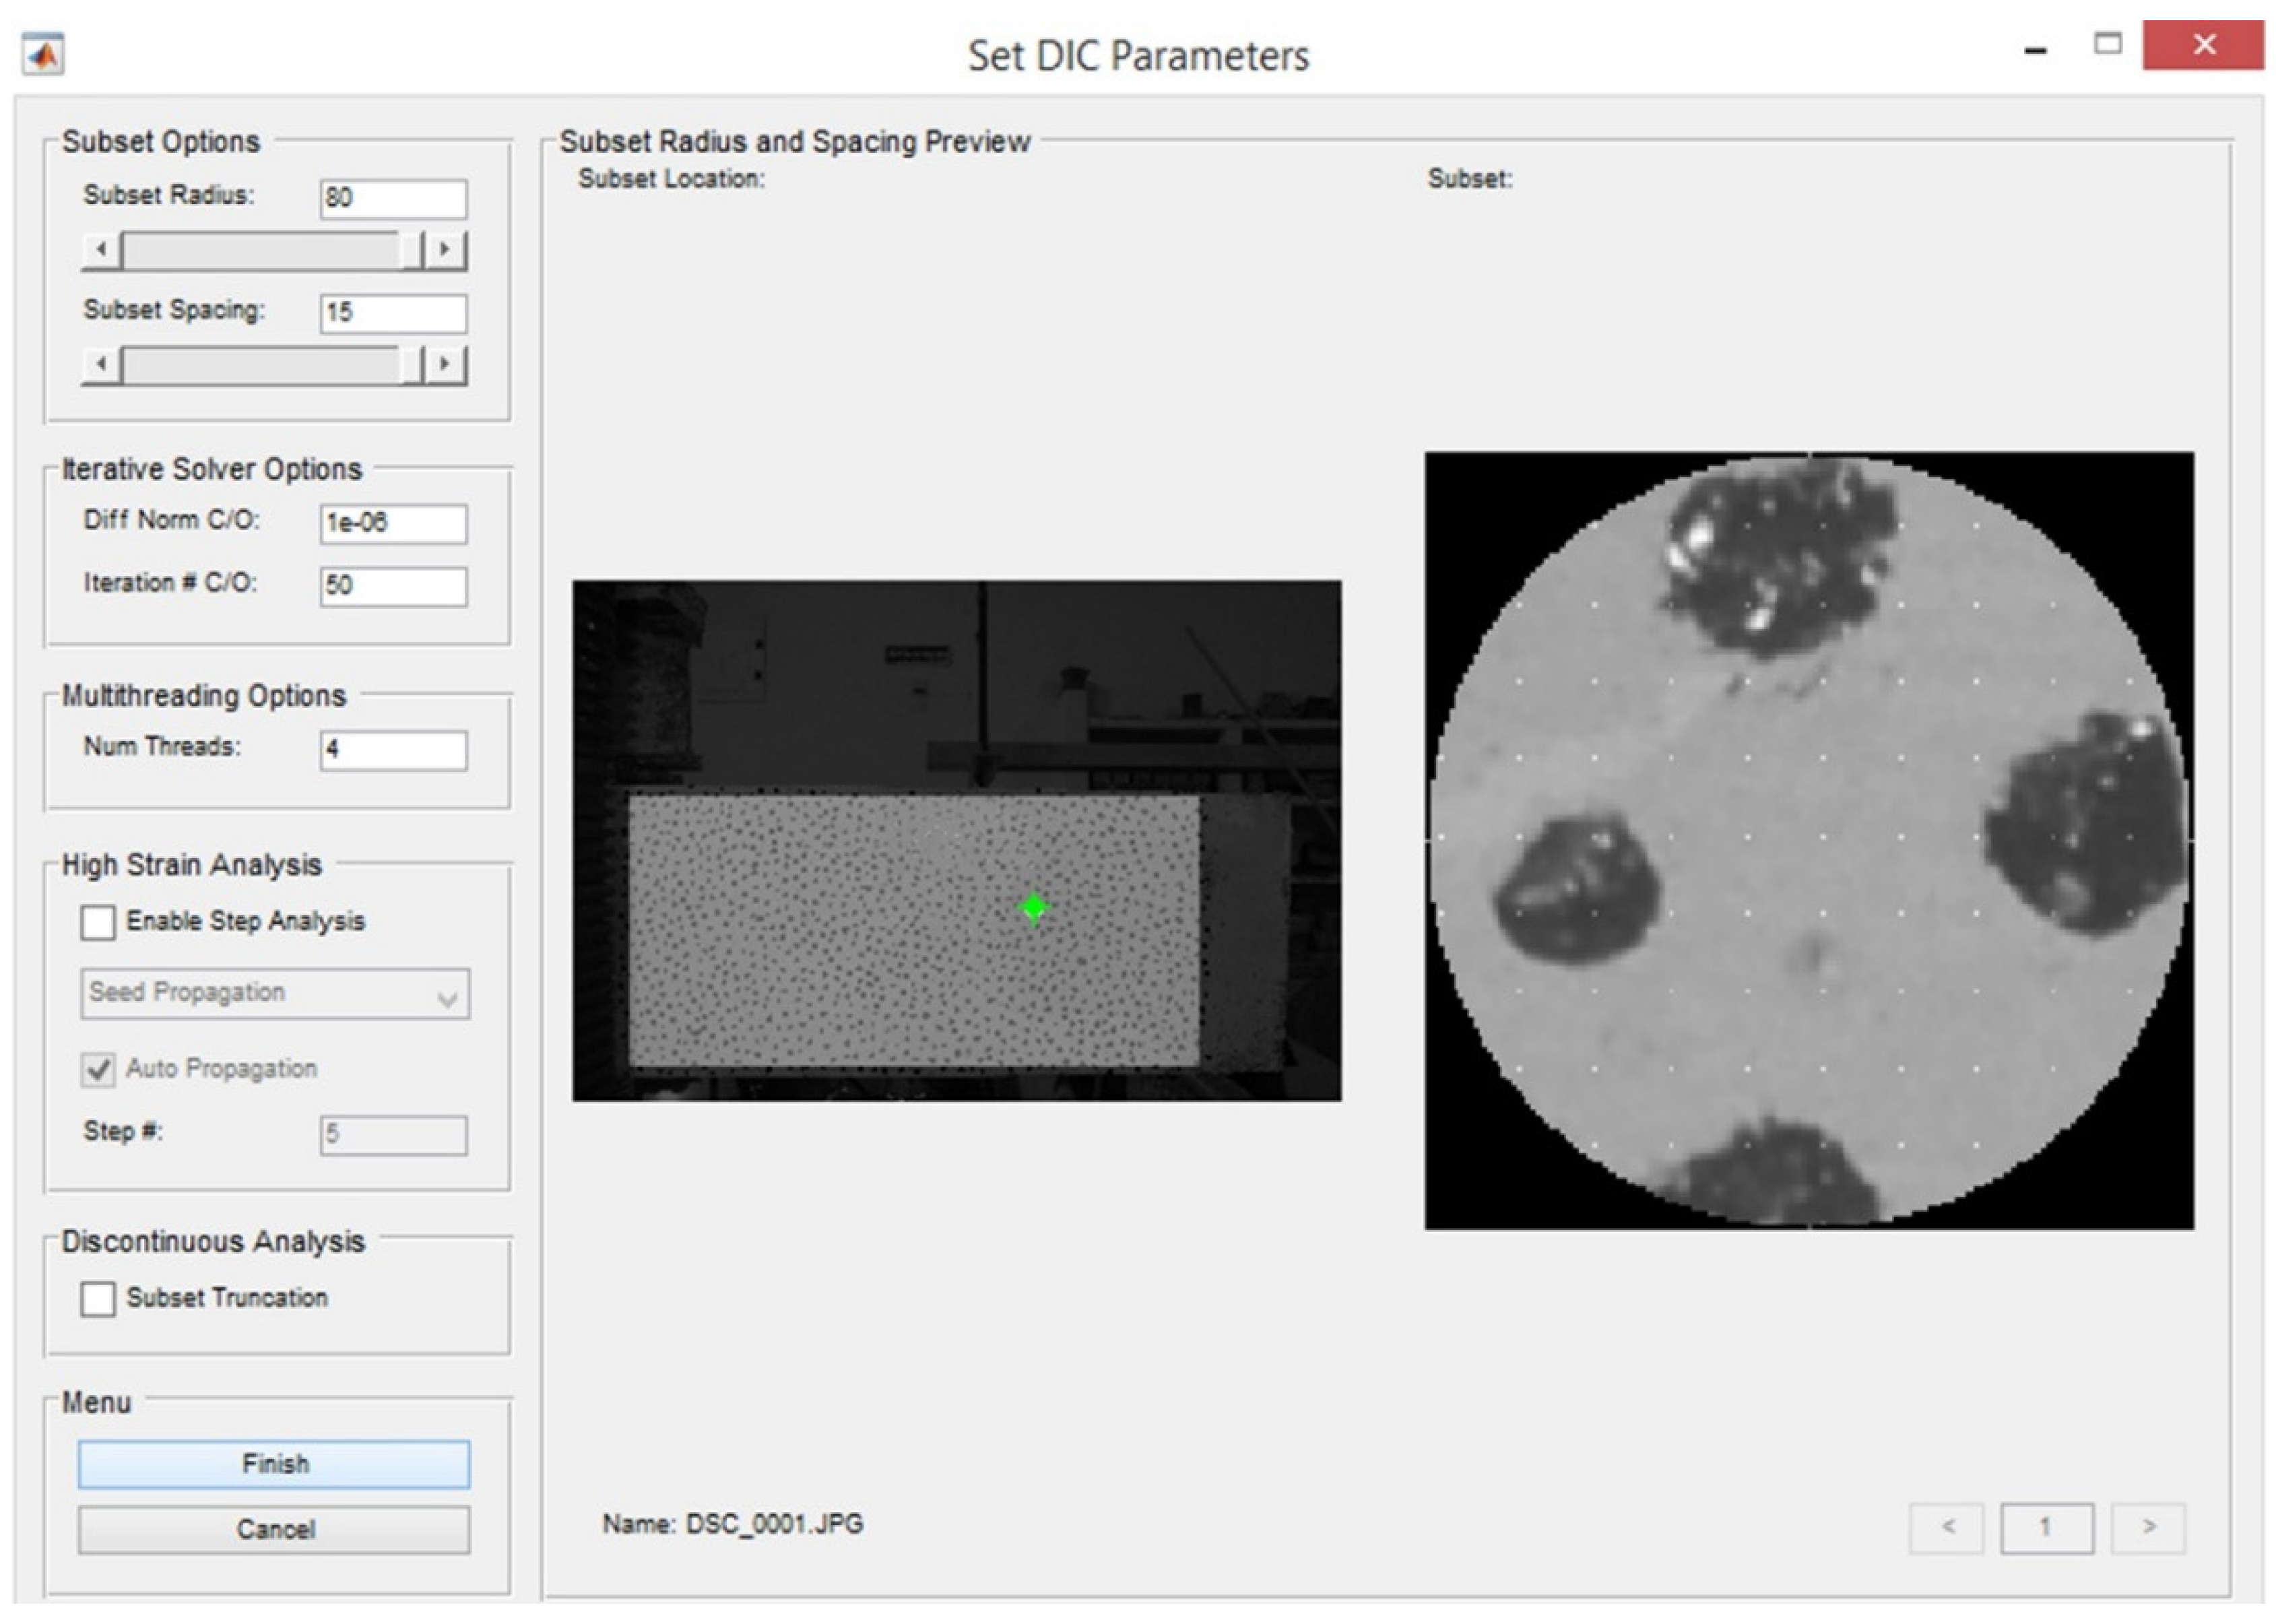
3.1.6. Setting of DIC Parameters
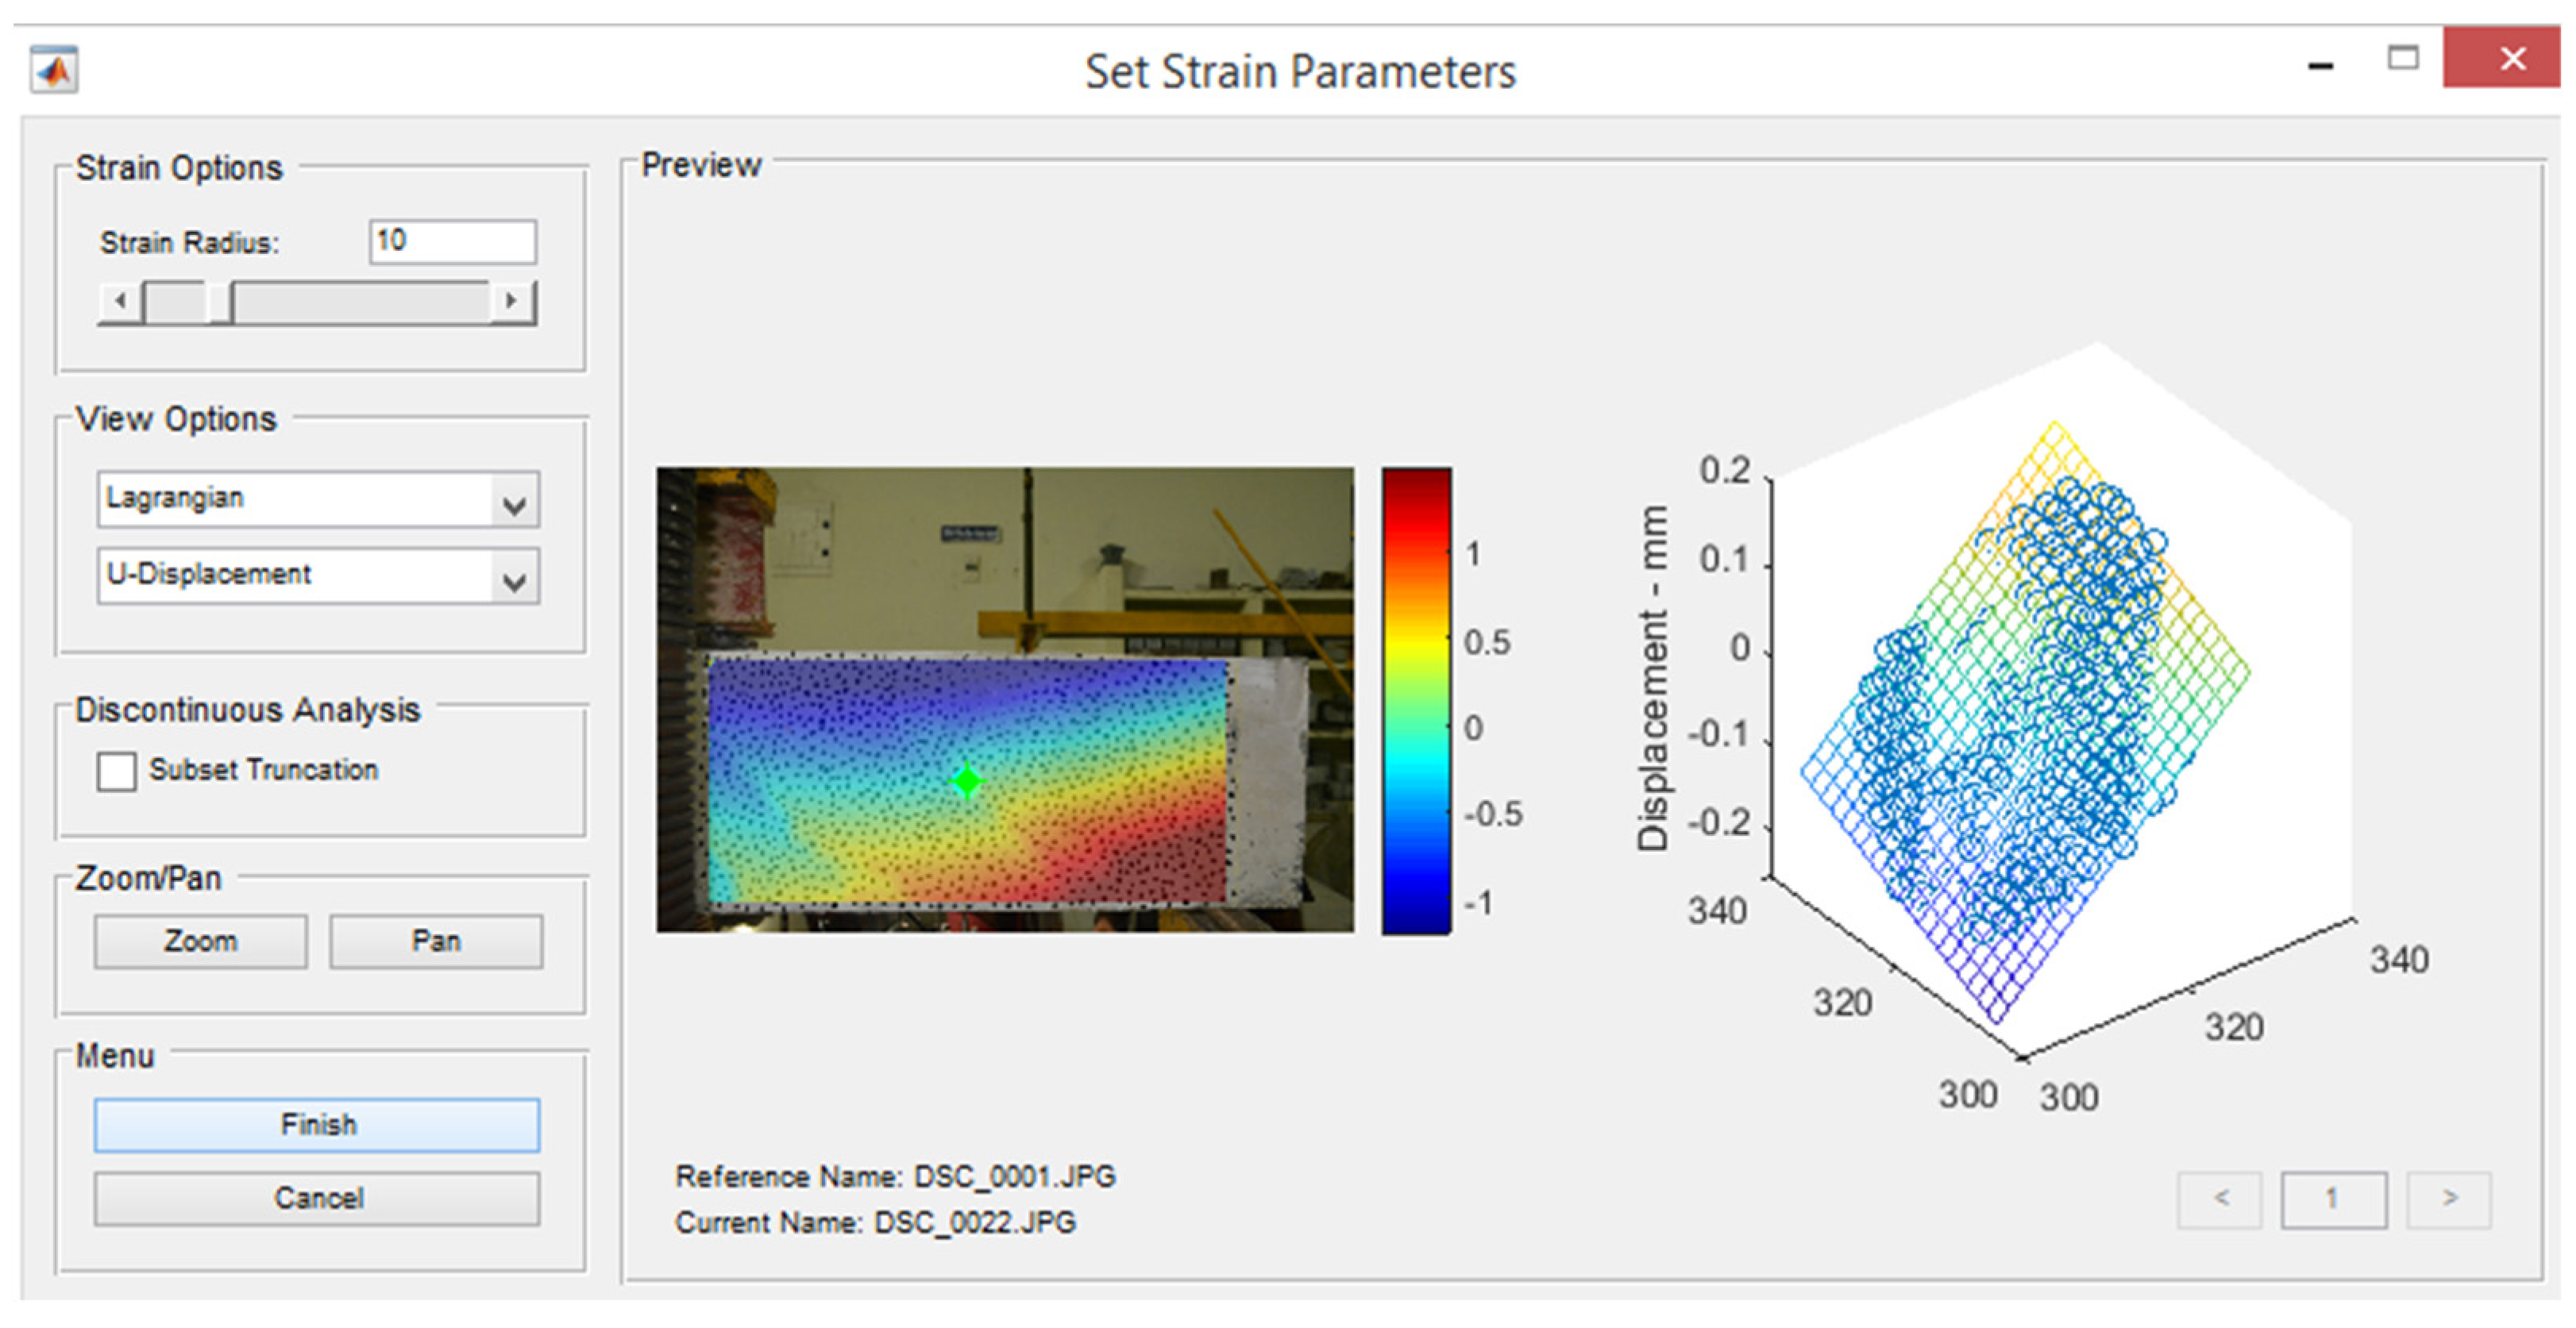
3.1.7. DIC Analysis
3.1.8. Crack Identification and Feature Extraction
3.2. UAVIC Evaluation Studies on Bridge
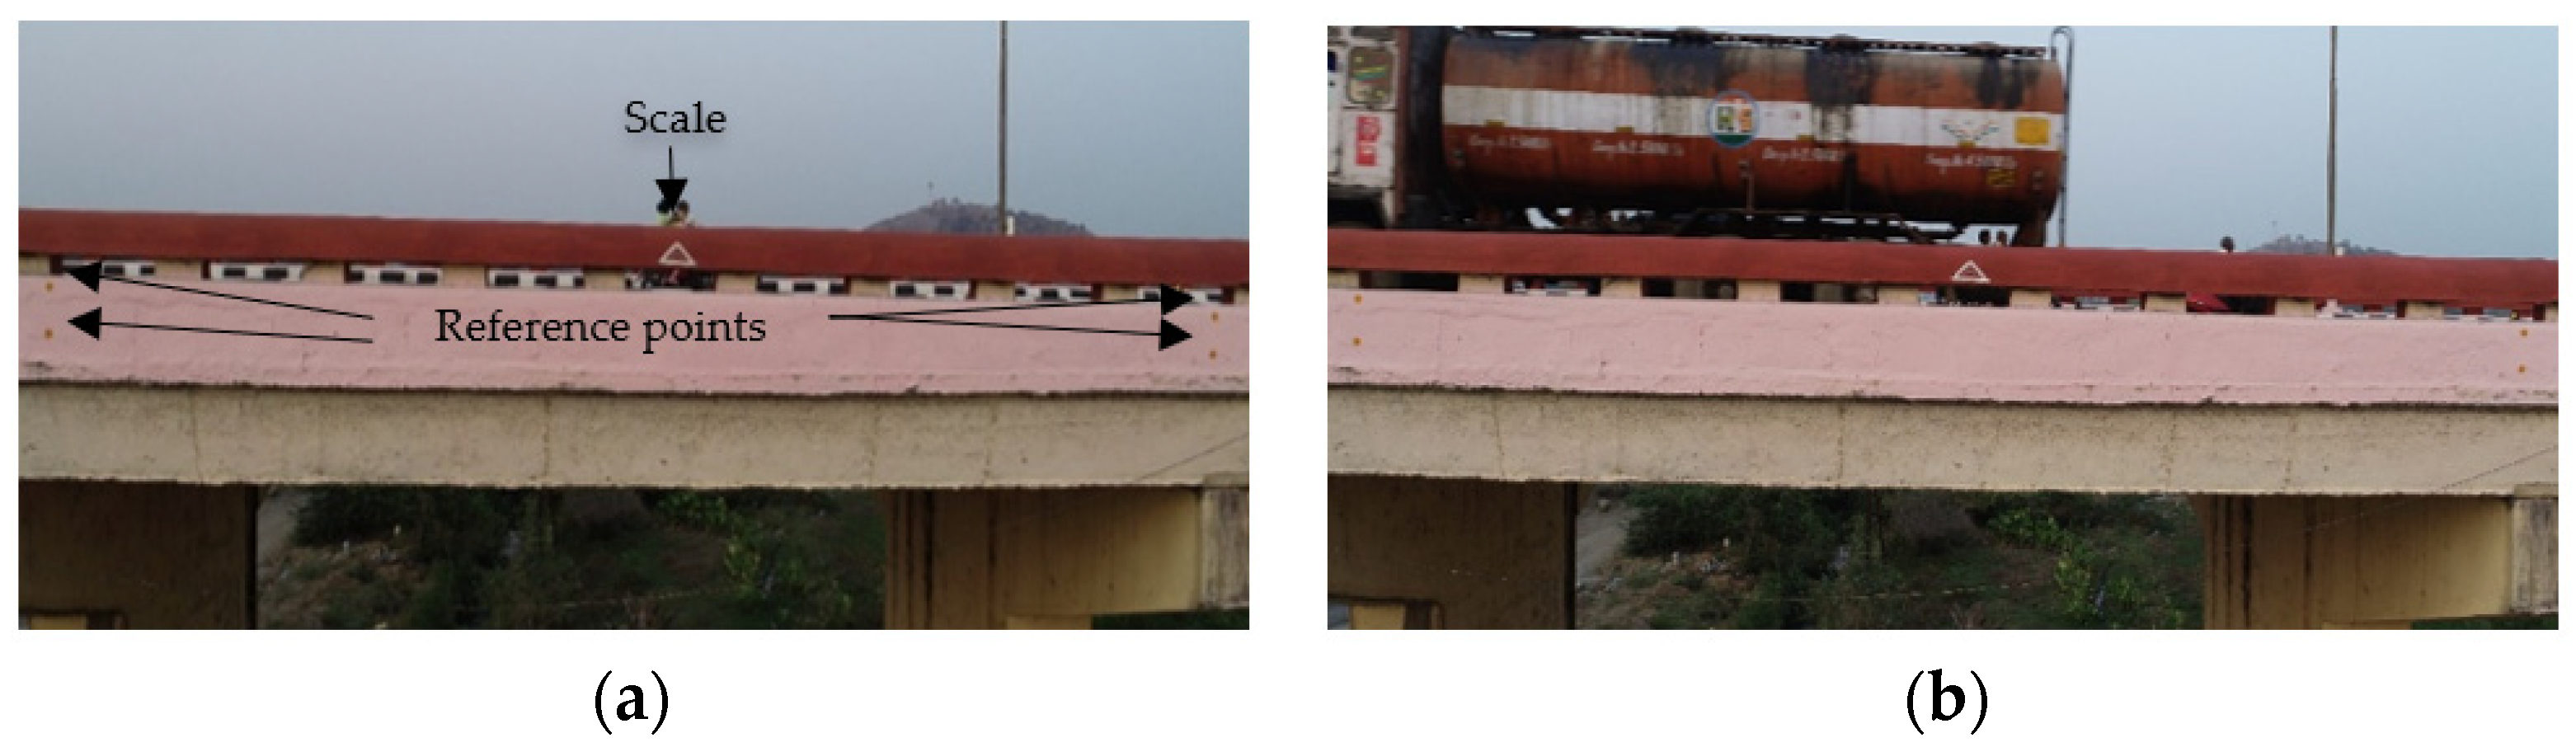
3.2.1. Bridge Image Acquisition
3.2.2. UAVIC Studies
3.2.3. Damage Quantification
4. Results and Discussions
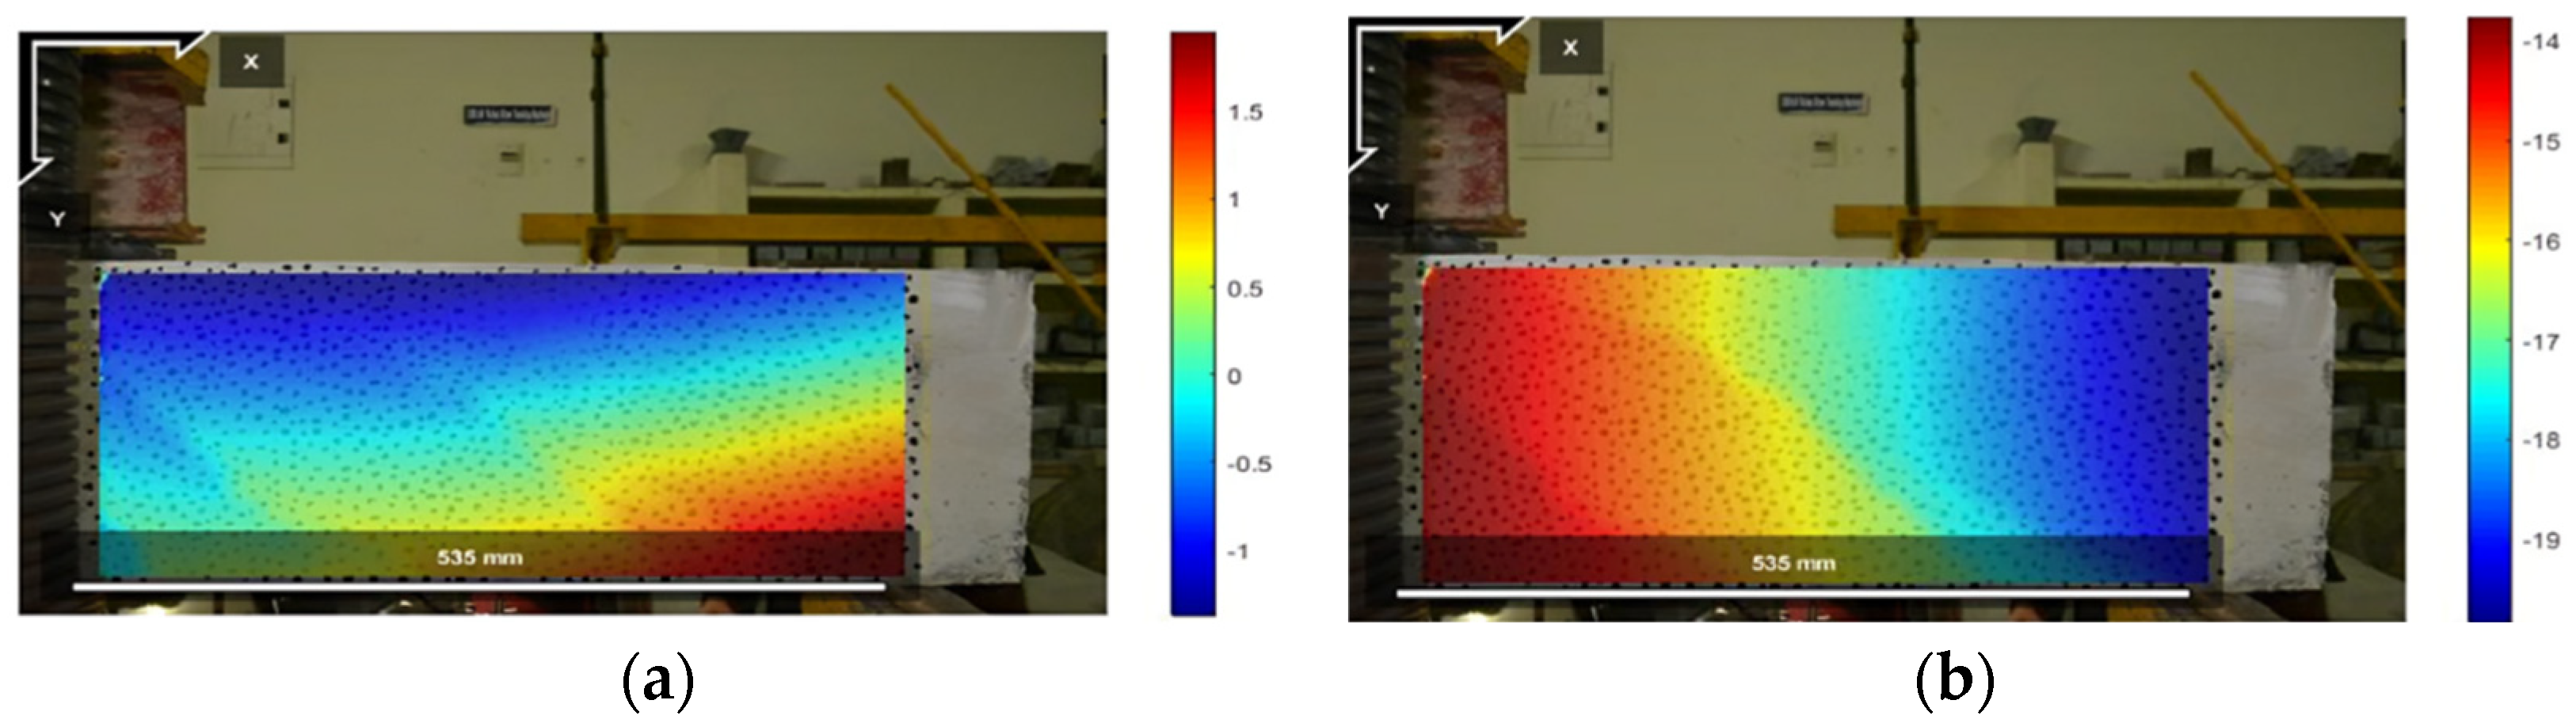
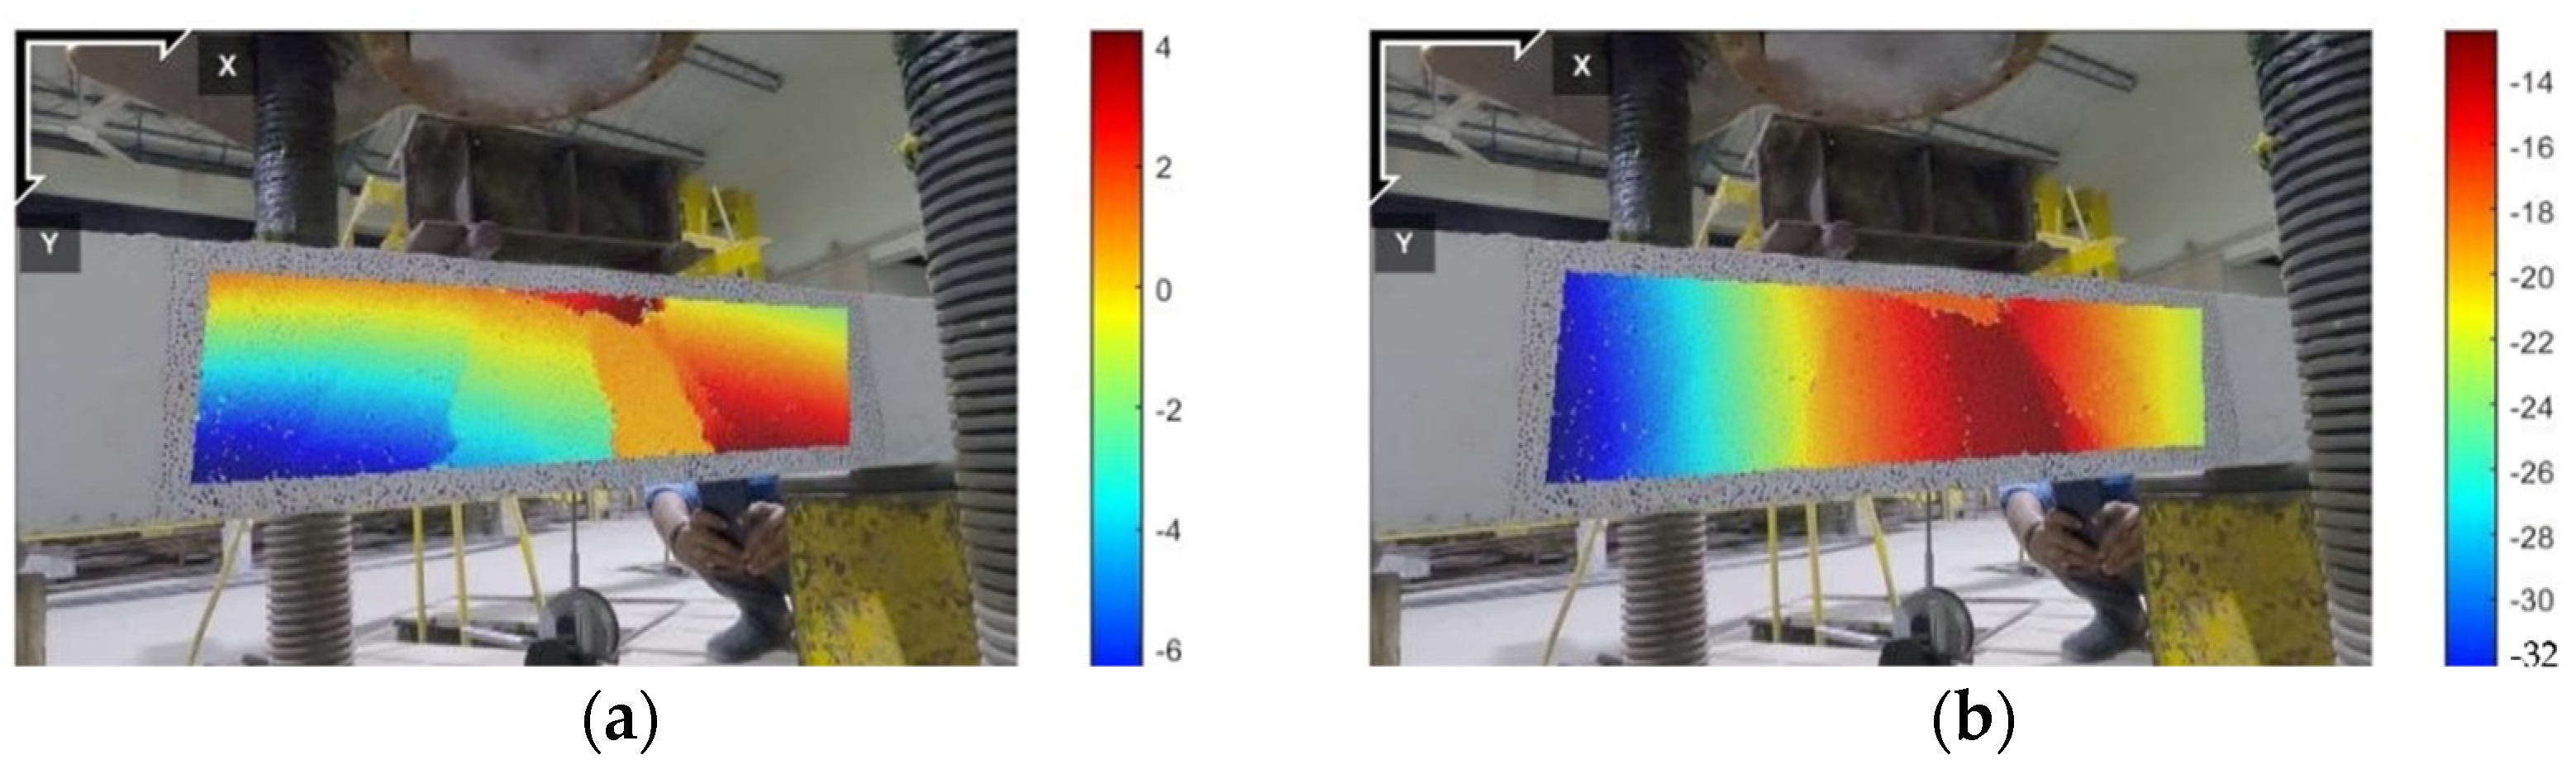
4.1. Displacements Investigations
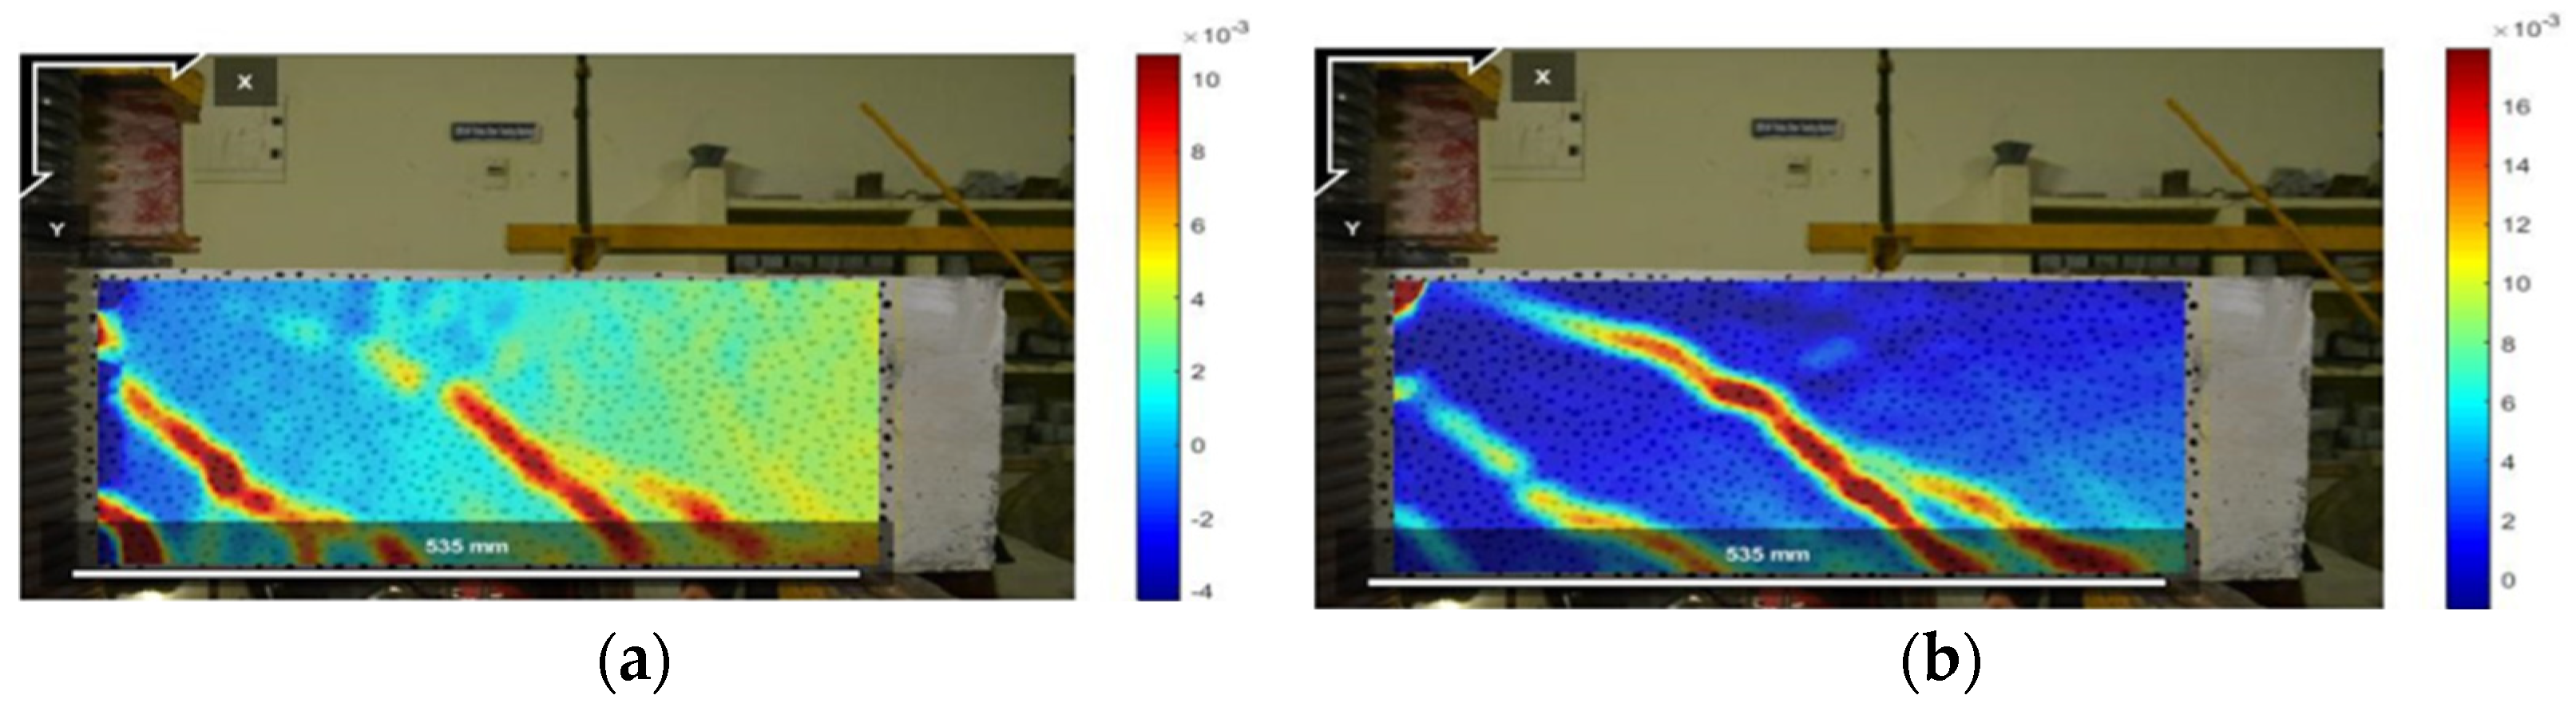
4.2. Strain Investigations
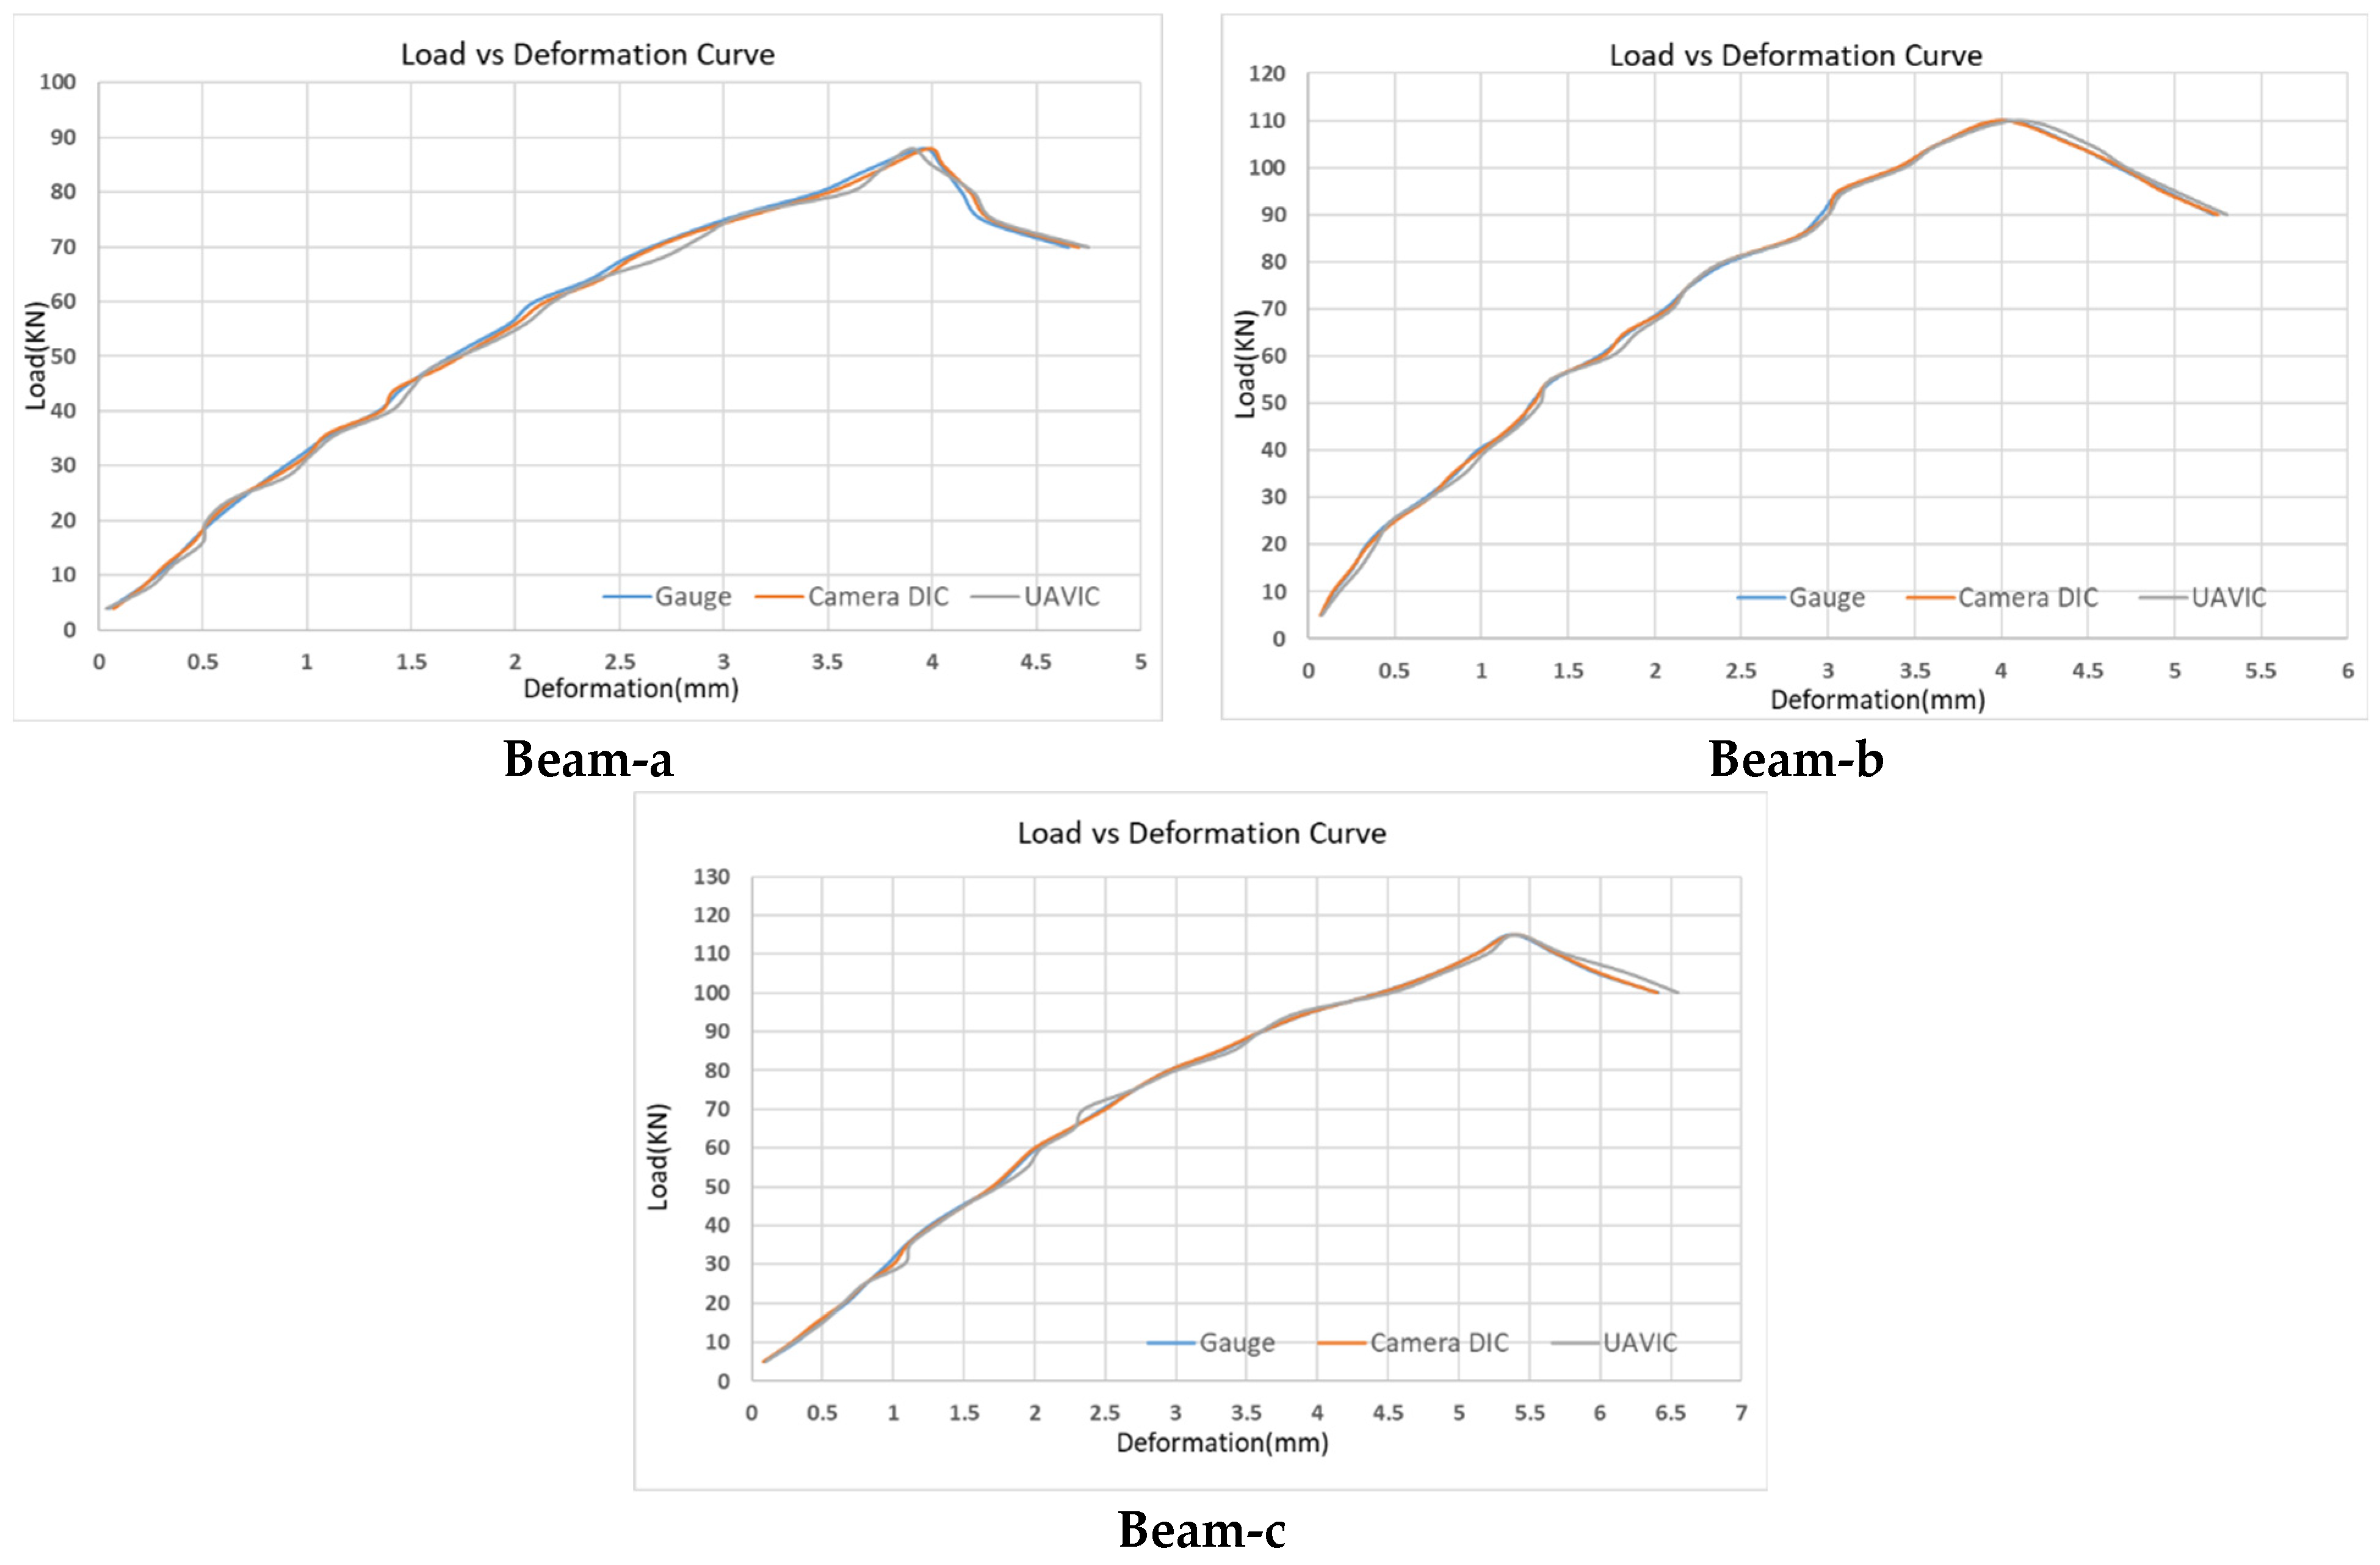
4.3. Load-Displacement Plots
4.4. Crack Detection and Parametric Analysis on the Beam
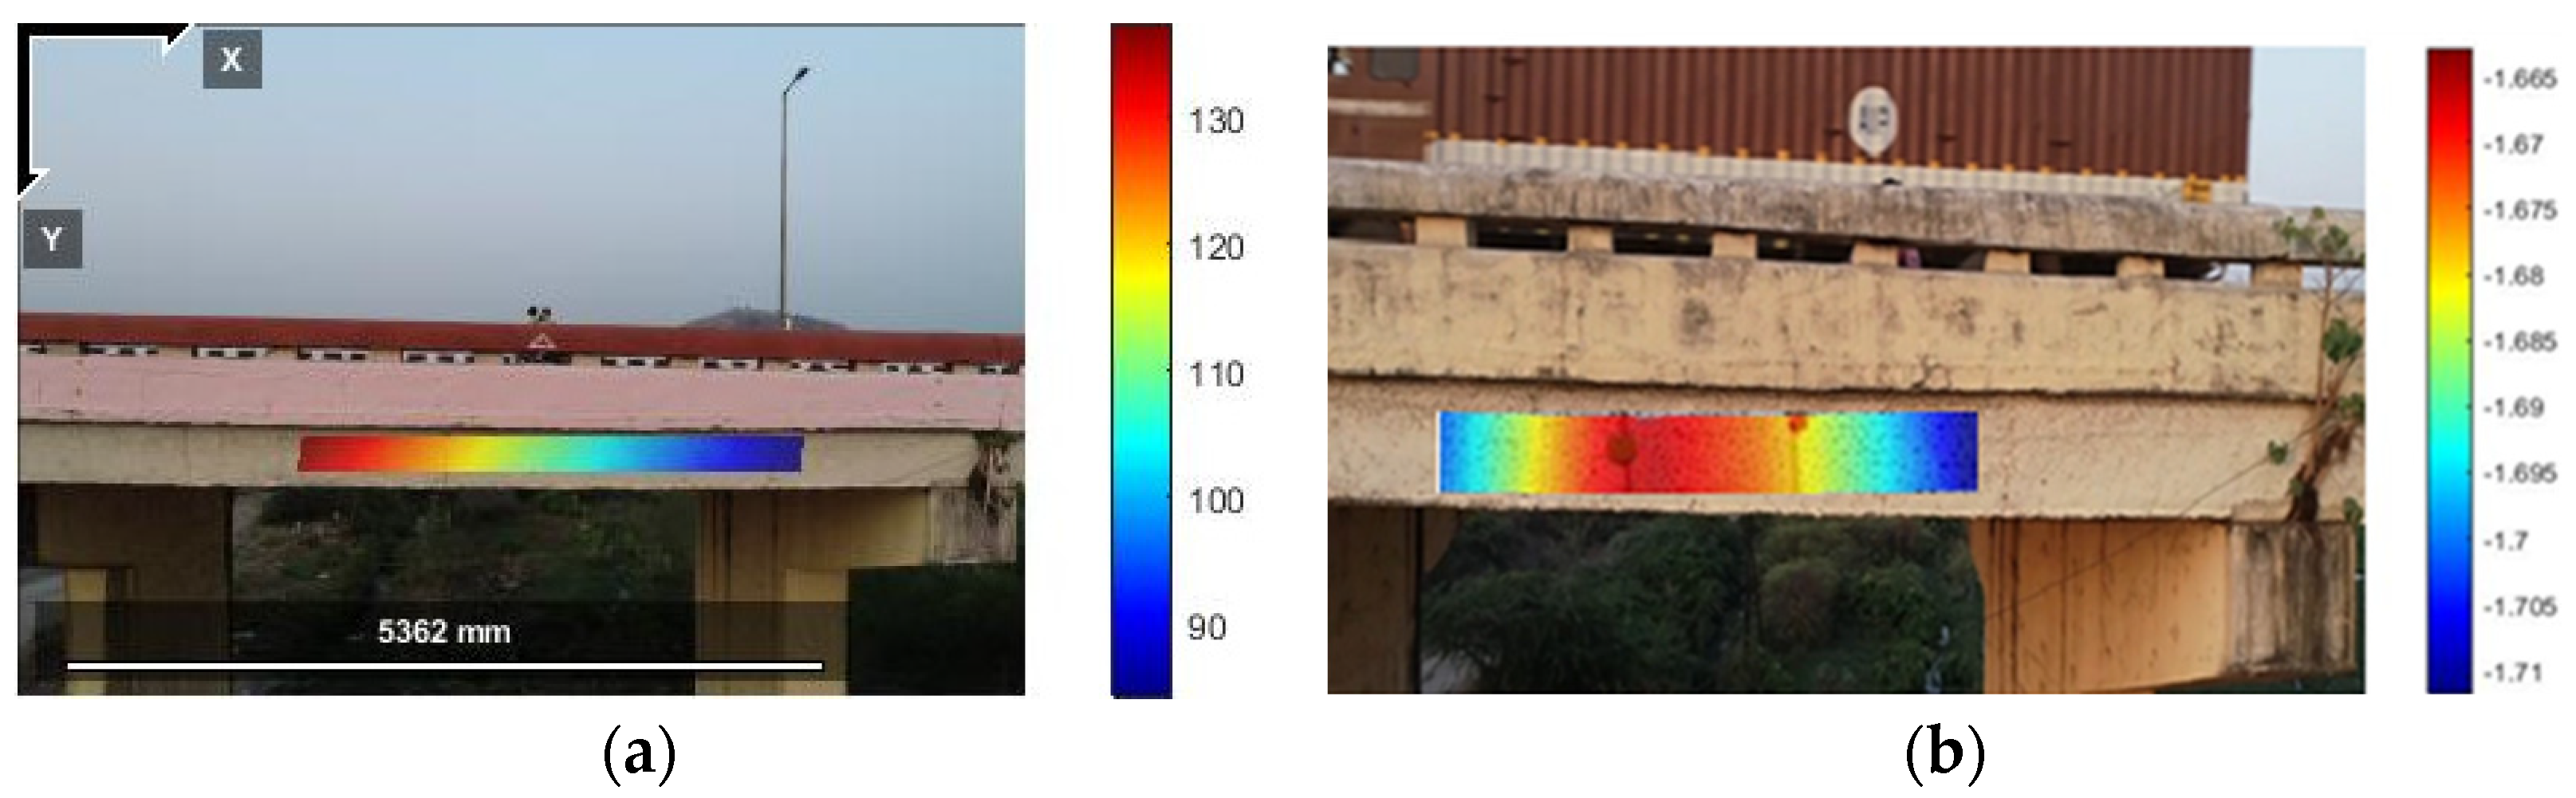
4.5. UAVIC Investigation on Bridge
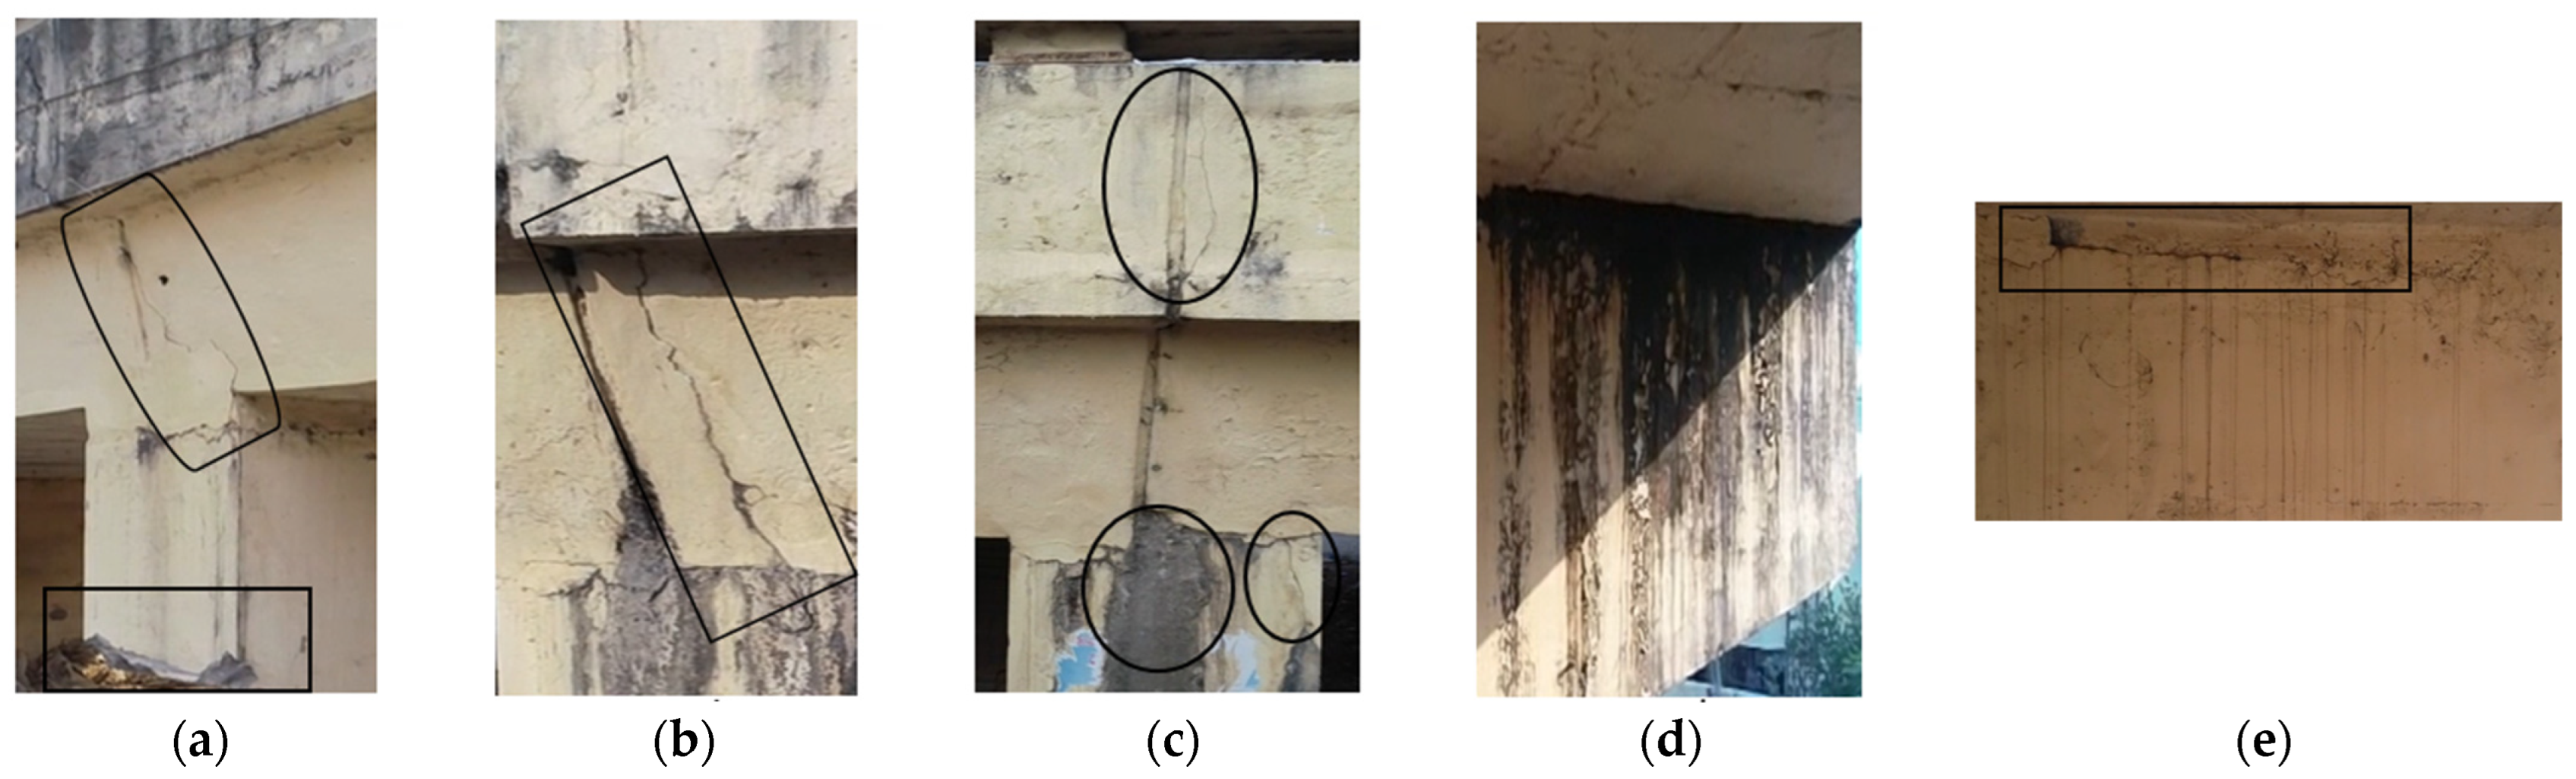
4.6. Crack Detection and Parametric Analysis on the ROB
5. Conclusions
Author Contributions
Funding
Institutional Review Board Statement
Informed Consent Statement
Data Availability Statement
Acknowledgments
Conflicts of Interest
References
- Murray, C. Dynamic Monitoring of Rail and Bridge Displacements Using Digital Image Correlation. Master’s Thesis, Queen’s University, Kingston, ON, Canada, 2013; p. 106. [Google Scholar]
- Jalinoos, F.; Agrawal, A.K.; Brooks, C.; Amjadian, M.; Banach, D.; Boren, E.J.; Dobson, R.; Ahlborn, T. Post-Hazard Engineering Assessment of Highway Structures Using Remote Sensing Technologies (No. FHWA-HIF-20-004); Federal Highway Administration Office of Infrastructure Research and Development: New York, NY, USA, 2019.
- Xie, Z.L.; Zhou, H.F.; Chen, Z.A. An investigation into fracture behavior of geopolymer concrete with digital image correlation technique. Constr. Build. Mater. 2017, 155, 371–380. [Google Scholar] [CrossRef]
- Duque, L.; Seo, J.; Wacker, J. Bridge Deterioration Quantification Protocol Using UAV. J. Bridge Eng. 2018, 23, 04018080. [Google Scholar] [CrossRef]
- Wang, Y.; Cuiti, A.M. Full-field measurements of heterogeneousdeformation patterns on polymeric foams using digitalimage correlation. Int. J. Solids Struct. 2002, 39, 3777–3796. [Google Scholar] [CrossRef]
- Fayyad, T.M.; Lees, J.M. Application of Digital Image Correlation to Reinforced Concrete Fracture. Procedia Mater. Sci. 2014, 3, 1585–1590. [Google Scholar] [CrossRef] [Green Version]
- Bhowmik, S.; Dubey, S.; Ray, S. Investigation on fracture process of concrete. Frat. Integrita Strutt. 2019, 13, 419–428. [Google Scholar] [CrossRef]
- Buttlar, W.G.; Hill, B.C.; Kim, Y.R.; Kutay, M.E.; Millien, A.; Montepara, A.; Paulino, G.H.; Petit, C.; Pop, I.O.; Romeo, E.; et al. Digital image correlation techniques to investigate strain fields and cracking phenomena in asphalt materials. Mater. Struct./Mater. Constr. 2014, 47, 1373–1390. [Google Scholar] [CrossRef]
- Nonis, C.; Niezrecki, C.; Yu, T.-Y.; Ahmed, S.; Su, C.-F.; Schmidt, T. Structural health monitoring of bridges using digital image correlation. Proc. SPIE 2013, 8695, 869507. [Google Scholar] [CrossRef]
- Sudarsanan, N.; Arul, A.; Rajagopal, K.; Veeraragavan, K. Digital Image Correlation Technique for Measurement of Surface Strains in Reinforced Asphalt Concrete Beams under Fatigue Loading. J. Mater. Civil Eng. 2019, 31, 04019135. [Google Scholar] [CrossRef]
- Saldaña, H.A.; Márquez Aguilar, P.A.; Molina, O.A. Concrete Stress-Strain Characterization by Digital Image Correlation. J. Appl. Mech.Eng. 2015, 4, 6. [Google Scholar] [CrossRef] [Green Version]
- Huang, Y.; He, X.; Wang, Q.; Xiao, J. Deformation field and crack analyses of concrete using digital image correlation method. Front. Struct. Civil Eng. 2019, 13, 1183–1199. [Google Scholar] [CrossRef]
- Feng, D.; Feng, M.Q.; Ozer, E.; Fukuda, Y. A vision-based sensor for noncontact structural displacement measurement. Sensors 2015, 15, 16557–16575. [Google Scholar] [CrossRef] [PubMed]
- Barazzetti, L.; Scaioni, M. Development and implementation of image-based algorithms for measurement of deformations in material testing. Sensors 2010, 10, 7469–7495. [Google Scholar] [CrossRef] [PubMed] [Green Version]
- Su, Y.; Zhang, Q.; Xu, X.; Gao, Z. Quality assessment of speckle patterns for DIC by consideration of both systematic errors and random errors. Opt. Lasers Eng. 2016, 86, 132–142. [Google Scholar] [CrossRef]
- Dutton, M.; Take, W.A.; Hoult, N.A. Curvature Monitoring of Beams Using Digital Image Correlation. J. Bridge Eng. 2014, 19, 05013001. [Google Scholar] [CrossRef] [Green Version]
- Santos, A.H.A.; Pitangueira, R.L.S.; Ribeiro, G.O.; Carrasco, E.V.M. Concrete modulus of elasticity assessment using digital image correlation. Rev. IBRACON Estrut. Mater. 2016, 9, 587–594. [Google Scholar] [CrossRef] [Green Version]
- Blaber, J.; Adair, B.; Antoniou, A. Ncorr: Open-Source 2D Digital Image Correlation Matlab Software. Exp. Mech. 2015, 55, 1105–1122. [Google Scholar] [CrossRef]
- Suryanto, B.; Tambusay, A.; Suprobo, P. Crack Mapping on Shear-critical Reinforced Concrete Beams using an Open Source Digital Image Correlation Software. Civil Eng. Dimens. 2017, 19, 93–98. [Google Scholar] [CrossRef] [Green Version]
- Jalinoos, F.; Amjadian, M.; Agrawal, A.K.; Brooks, C.; Banach, D. Experimental Evaluation of Unmanned Aerial System for Measuring Bridge Movement. J. Bridg. Eng. 2020, 25, 04019132. [Google Scholar] [CrossRef]
- Reagan, D.; Sabato, A.; Niezrecki, C. Feasibility of Using Digital Image Correlation for Unmanned Aerial Vehicle Structural Health Monitoring of Bridges. Struct. Heal. Monit. 2018, 17, 1056–1072. [Google Scholar] [CrossRef]
- Cusson, D.; Ghuman, P.; McCardle, A. Satellite sensing technology to monitor bridges and other civil infrastructures. In Proceedings of the SHMII-5 2011–5th International Conference on Structural Health Monitoring of Intelligent Infrastructure, Cancun, Mexico, 11–15 December 2011. [Google Scholar]
- Valença, J.; Gonçalves, L.M.S.; Júlio, E. Damage assessment on concrete surfaces using multi-spectral image analysis. Constr. Build. Mater. 2013, 40, 971–981. [Google Scholar] [CrossRef]
- Shaban, A. Determination of Concrete Properties Using Hyperspectral Imaging Technology: A Review. Sci. J. Civil Eng. Archit. 2013, 2013, sjcea-102. [Google Scholar] [CrossRef]
- Schnebele, E.; Tanyu, B.F.; Cervone, G.; Waters, A.N. Review of remote sensing methodologies for pavement management and assessment. Eur. Transp. Res. Rev. 2015, 7, 7. [Google Scholar] [CrossRef] [Green Version]
- ASTM D 4788-03; Standard Test Method for Detecting Delaminations in Bridge Decks Using Infrared. American Society for Testing and Materials. ASTM: Pennsylvania, PA, USA, 1997; pp. 4–5.
- Burgess, D.; Ortega, K.; Stumpf, G.; Garfield, G.; Karstens, C.; Meyer, T.; Smith, B.; Speheger, D.; Ladue, J.; Smith, R.; et al. 20 May 2013 Moore, Oklahoma, tornado: Damage survey and analysis. Weather Forecast. 2014, 29, 1229–1237. [Google Scholar] [CrossRef]
- Yaofeng, S.; Pang, J.H.L. Study of optimal subset size in digital image correlation of speckle pattern images. Opt. Lasers Eng. 2007, 45, 967–974. [Google Scholar] [CrossRef]
- Mejía, C.A.; Lantsoght, E.O.L. Strain and deflection analysis in plain concrete beams and reinforced concrete beams by applying digital image correlation. In Proceedings of the Insights and Innovations in Structural Engineering, Mechanics and Computation—6th International Conference on Structural Engineering, Mechanics and Computation, SEMC 2016, Cape Town, South Africa, 5–7 September 2016; pp. 1312–1317. [Google Scholar] [CrossRef] [Green Version]
- Sadegh Barkhordari, M.; Jahed Armaghani, D.; Asteris, P.G. Structural Damage Identification Using Ensemble Deep Convolutional Neural Network Models. Comput. Model. Eng. Sci. 2022, 1–21. [Google Scholar] [CrossRef]
- Hopper, T.; Manafpour, A.; Radlińska, A.; Warn, G.; Rajabipour, F.; Morian, D.; Jahangirnejad, S. Bridge Deck Cracking: Effects on In-Service Performance, Prevention, and Remediation; Bureau of Planning and Research: Pennslyvania, PA, USA, 2015; p. 267.
- Kavitha, S.; Raghuraman, G. Review and Analysis of Crack Detection and Classification Techniques Based on Crack Types. Int. J. Appl. Eng. Res. 2021, 13, 6056. [Google Scholar] [CrossRef]
- Lai, J.; Cai, J.; Chen, Q.J.; He, A.; Wei, M.Y. Influence of Crack Width on Chloride Penetration in Concrete Subjected to Alternating Wetting-Drying Cycles. Materials 2020, 13, 3801. [Google Scholar] [CrossRef]
- Cheng, S.; He, H.; Lan, B. Calculation Theory and Damage Analysis on Crack Width of RC Seismic-Damaged Columns. Structures 2021, 34, 3329–3344. [Google Scholar] [CrossRef]
- Woods, J.E.; Yang, Y.-S.; Chen, P.-C.; Lau, D.T.; Erochko, J. Automated Crack Detection and Damage Index Calculation for RC Structures Using Image Analysis and Fractal Dimension. J. Struct. Eng. 2021, 147, 04021019. [Google Scholar] [CrossRef]
- Zhou, S.; Ju, J.W. A Chemo-Micromechanical Damage Model of Concrete under Sulfate Attack. Int. J. Damage Mech. 2021, 30, 1213–1237. [Google Scholar] [CrossRef]
- Chromková, I.; Čechmánek, R. Effect of Agents of Organic Origin on Concrete Degradation. IOP Conf. Ser. Mater. Sci. Eng. 2018, 379, 012040. [Google Scholar] [CrossRef]
- Patnaik, A.; Baah, P.; Ricciardi, P.; Khalifa, W. Reduction of Crack Widths in Reinforced Concrete Bridge Decks with Fiber Addition; ACI Special Publication SP # 319; American Concrete Institute: Farmington Hills, MI, USA, 2017; pp. 1–20. [Google Scholar]
- Tan, G.; Zhu, Z.; Wang, W.; Wu, C.; Ou, J.; Cui, G.; Zhang, D. Flexural Ductility and Crack-Controlling Capacity of Polypropylene Fiber Reinforced ECC Thin Sheet with Waste Superfine River Sand Based on Acoustic Emission Analysis. Constr. Build. Mater. 2021, 277, 122321. [Google Scholar] [CrossRef]
- Ayop, S.; Tun, U.; Onn, H.; Ismail, M. Condition Assessment of Marine Structures Using Functional Condition Index Approach. Malaysian J. Civ. Eng. 2006, 18, 129–138. [Google Scholar]


| Beam | Length in mm | Width in mm |
|---|---|---|
| A | 153 | 0.937 |
| B | 214 | 1.282 |
| C | 178 | 1.147 |
| Vehicle Passage | 1 | 2 | 3 | 4 | 5 | 6 | 7 |
|---|---|---|---|---|---|---|---|
| Deformation (mm) | 2.82 | 1.47 | 3.22 | 3.18 | 1.30 | 2.63 | 0.89 |
| Bridge Component | Crack Width in mm | Crack Length in mm |
|---|---|---|
| (A) Crack in the joint and damage of beam | 1.82 | 583 |
| (B) Crack in the deck of the bridge | 2.42 | 467 |
| (C) Damage and crack in the pier | 0.96 | 328 |
| (E) Crack in the beam and slab joint | 3.28 | 524 |
Publisher’s Note: MDPI stays neutral with regard to jurisdictional claims in published maps and institutional affiliations. |
© 2022 by the authors. Licensee MDPI, Basel, Switzerland. This article is an open access article distributed under the terms and conditions of the Creative Commons Attribution (CC BY) license (https://creativecommons.org/licenses/by/4.0/).
Share and Cite
Kumarapu, K.; Mesapam, S.; Keesara, V.R.; Shukla, A.K.; Manapragada, N.V.S.K.; Javed, B. RCC Structural Deformation and Damage Quantification Using Unmanned Aerial Vehicle Image Correlation Technique. Appl. Sci. 2022, 12, 6574. https://doi.org/10.3390/app12136574
Kumarapu K, Mesapam S, Keesara VR, Shukla AK, Manapragada NVSK, Javed B. RCC Structural Deformation and Damage Quantification Using Unmanned Aerial Vehicle Image Correlation Technique. Applied Sciences. 2022; 12(13):6574. https://doi.org/10.3390/app12136574
Chicago/Turabian StyleKumarapu, Kumar, Shashi Mesapam, Venkat Reddy Keesara, Anoop Kumar Shukla, Naga Venkata Sai Kumar Manapragada, and Babar Javed. 2022. "RCC Structural Deformation and Damage Quantification Using Unmanned Aerial Vehicle Image Correlation Technique" Applied Sciences 12, no. 13: 6574. https://doi.org/10.3390/app12136574