Article

Implementation Aspects of Smart Grids Cyber-Security Cross-Layered Framework for Critical Infrastructure Operation

1
Department of Electrical & Computer Engineering, University of Florida, Gainesville, FL 32611, USA
2
Distributed Systems Group, Pacific Northwest National Laboratory, Richland, WA 99354, USA
*
Author to whom correspondence should be addressed.
Appl. Sci. 2022, 12(14), 6868; https://doi.org/10.3390/app12146868
Submission received: 3 June 2022 / Revised: 23 June 2022 / Accepted: 5 July 2022 / Published: 7 July 2022
(This article belongs to the Special Issue Electrification of Smart Cities)

Abstract

:
Communication networks in power systems are a major part of the smart grid paradigm. It enables and facilitates the automation of power grid operation as well as self-healing in contingencies. Such dependencies on communication networks, though, create a roam for cyber-threats. An adversary can launch an attack on the communication network, which in turn reflects on power grid operation. Attacks could be in the form of false data injection into system measurements, flooding the communication channels with unnecessary data, or intercepting messages. Using machine learning-based processing on data gathered from communication networks and the power grid is a promising solution for detecting cyber threats. In this paper, a co-simulation of cyber-security for cross-layer strategy is presented. The advantage of such a framework is the augmentation of valuable data that enhances the detection as well as identification of anomalies in the operation of the power grid. The framework is implemented on the IEEE 118-bus system. The system is constructed in Mininet to simulate a communication network and obtain data for analysis. A distributed three controller software-defined networking (SDN) framework is proposed that utilizes the Open Network Operating System (ONOS) cluster. According to the findings of our suggested architecture, it outperforms a single SDN controller framework by a factor of more than ten times the throughput. This provides for a higher flow of data throughout the network while decreasing congestion caused by a single controller’s processing restrictions. Furthermore, our CECD-AS approach outperforms state-of-the-art physics and machine learning-based techniques in terms of attack classification. The performance of the framework is investigated under various types of communication attacks.

1. Introduction

Over the last decade, there has been a growing and significant demand for cyber-related smart grid (SG) security. Physical operation process dependability is the focus of current research on cyber-related power grid vulnerabilities, whereas the cyber-physical security of SGs is still evolving. The traditional power system is often safeguarded by isolated and uncoordinated equipment that offers ad-hoc solutions to each protection challenge. As these tools do not work together; they are vulnerable to dispersed attacks. The creation of cross-layer awareness of the smart grid system is a potential new technique in this field. The current study into the cyber-security of power grid operation is centered on a method known as State Estimation (SE). The fundamental purpose of SE is to offer a real-time grid monitoring technique by estimating system states utilizing measurements and static data on system topology [1]. False Data Injection Attack (FDI), which changes the measures utilized by SE, is the most prevalent cyber-attack in the literature. Multiple actors exploiting diverse security weaknesses in the physical and cyber domains of the cyber-physical system is a more realistic scenario for cyber-attacks. Denial-of-Service (DoS), Distributed Denial-of-Service (DDoS), and Man-in-the-Middle (MITM), False Data Injection (FDI) attacks might all be launched. These types of attacks impact data from several layers of the grid’s physical structure. As a result, an integrated approach for identifying numerous attacks launched from different tiers inside the SG will improve grid security.
Machine Learning (ML) technology is presently being utilized to aid in the detection process or to acquire reliable findings through statistical data analysis. At various phases of the SE process, the work of the data-driven anomaly detection framework and the cross-layer viewpoint has progressed and been examined [2,3,4,5,6]. An integrated solution of a cyber-physical security framework based on a cross-layer approach that focuses on the detection of various cyber assaults is described in this study. The implementation is based on a real-world scenario. The power grid is modeled in Simulink and data from the grid is gathered every 4 s and delivered to the cloud for analysis. SimComponents [7] is used to simulate communication grid data, which is created and transferred to the cloud. In the analysis layer, SE and ML models are used to identify data threats. The SE exclusively uses measured data from the power grid, but the ML combines data from both the power and communication grids.
In addition, we propose an Open Network Operating System (ONOS) [8] three-controller distributed Software Defined Networking (SDN) architecture for the communication layer, which we tested and compared to the performance of one of the first SDN controllers, POX [9], which comes as standard with the Mininet emulation tool. SDN is a network architecture technology that allows networks to be intelligently and centrally managed, or programmed, using software applications. As its public release in 2009, software-defined networking (SDN) research has seen tremendous advancements and breakthroughs. SDN provides improved utilization, resource efficiency, network service flexibility, and lower maintenance costs as compared to conventional networks [10].
To the best of our knowledge, our suggested SDN framework is the first of its kind proposed in the literature. ONOS is the most widely used open-source SDN controller for next-generation SDN and Network function virtualization (NFV) applications. ONOS allows for network configuration as well as real-time control, removing the requirement for routing and switching control protocols to be executed inside the network fabric. By leveraging an SDN network topology, we can move the routing intelligence of the network to the ONOS controller to allow for better management, response, and visibility against cyber attacks against our network.
In a previous work [11], the authors have demonstrated that a distributed SDN framework may effectively and efficiently govern and assist in the protection of a smart grid. The authors were able to protect the smart grid from a denial of service attack by combining distributed SDN controller placement, intrusion detection systems (IDS), and state estimation. However, the framework uses a global SDN controller and a global security controller as the network and security masters, respectively, which introduce single points of failure. Furthermore, defense results against false data injection or man-in-the-middle (MiTM) attacks are not discussed. In another previous work [12,13], researchers suggest a distributed SDN framework to address scalability and reliability in smart grid systems. The authors of this study assume controller communication by using the BGP protocol to link two OpenDaylight controllers, allowing the controllers to share the workload of the network. This study, however, does not address smart grid security or protect against cyberattacks. Furthermore, the authors do not discuss or consider controller failure resistance in their framework.
In another previous work [4], The authors created the Ensemble CorrDetwith Adaptive Statistics (ECD-AS) technique to analyze measurement data and packet contents. ECD-AS is another data-driven approach for detecting FDI attacks that takes into account the changing status of the SG. This method’s drawback is that it solely employs measurement data, limiting its capacity to identify cyberattacks focused on the SG’s communication network layer. However, the work in this research will make use of the analysis layer, which may also take into account data from the communication network that powers the SG, notably packet inter-arrival intervals, transmission delay (TD), and packet count (PC). Consideration of this form of data would broaden the model of an FDI cyberattack as well as uncover models of other types of cyberattacks that would be undetected by present methodologies in the literature. Previous work [3,14] demonstrated that ML may be utilized in the cyber domain to enhance bad data analysis by acting on the same data as the SE. This hybrid data-driven physics-model-based framework makes use of both temporal data through ML and the system’s known topology through SE. However, this approach, like the other current research investigations, solely covers FDI attacks and relies on routine measurements of power systems. As a result, it overlooks the SG’s cross-layer interdependence.
The remainder of the paper is organized as follows. Background information on the major components of the framework is presented in Section 2. Section 3 contains data flow information about the framework, and the implementation necessary to make it work. In Section 4, we present a case study. Lastly, in Section 5, we conclude the paper. The contribution of this work towards the state-of-the-art is two folds:
  • To the best of our knowledge, the first proposed three controllers distributed SDN architecture for the Smart Grid’s communication layer.
  • Identification of cyber attacks against the power grid using a cross-layered framework.

2. Theoretical Background

In the following, the theoretical background of SE, ML, cyber-attack models, and communication networks performance metrics are presented. The equations utilized in this study are derived from our previous work [6].

2.1. State Estimation

In modern Energy Management Systems (EMS), the SE process is most important for situational awareness of power system operation and is used in many EMS applications, including the detection of bad data. The common approach to SE is using the classical Weighted Least Squares (WLS) method described in [15]. In this approach, the power grid is modeled as a set of non-linear equations based on the physics of the system:
z = h ( x ) + e
where z R 1 × d is the measurement vector, x R 1 × N is the vector of state variables, h : R 1 × N R 1 × d is a continuously non-linear differentiable function, and  e R 1 × d is the measurement error vector. Each measurement error, e i , is assumed to have zero mean, standard deviation σ i and Gaussian probability distribution. d is the number of measurements and N is the number of states.
In the classical WLS approach, the best estimate of the state vector in (1) is found by minimizing the cost function J ( x ) :
J ( x ) = z h ( x ) R 1 2 = [ z h ( x ) ] T R 1 [ z h ( x ) ]
where R is the covariance matrix of the measurements. In [16], it is shown that the error can be decomposed into detectable and undetectable parts where the undetectable part is recovered through the Innovation Index. Hence, the composed measurement error C M E is then used for Bad Data analysis, one of the main applications of SE [17], as
J C M E ( x ^ ) = i = 1 d C M E i σ i 2 > χ d , p 2
where σ i the measurement’s standard deviation, p is the probability (typically p = 0.95 ) and d the degrees of freedom.

2.2. Machine Learning

ECD-AS is an adaptive data-driven anomaly detection framework presented in [4]. ECD-AS learns and adapts from the real-time SG data to distinguish any anomalous behavior from the normal behavior of the system. The ECD-AS detector learns a series of statistics ( μ m , Σ m and τ m ), one for each bus m and then updates them with new incoming data samples to adapt them. ECD-AS uses mean ( μ m ) and covariance matrix ( Σ m ) of each bus established using normal samples data to calculate squared Mahalanobis distance ( δ m E C D A S ) and uses it as a decision score for the bus m and detects any anomalies by comparing it to the adaptive threshold of bus m ( τ m ). The squared Mahalanobis distance is calculated as
δ m E C D A S ( z m ) = ( z m μ m ) T Σ m 1 ( z m μ m )
where z m is the measurement vector of bus m, μ m is the mean and Σ m 1 is the inverse covariance matrix of normal samples related to m t h bus. The mean, μ m , and inverse covariance matrix, Σ m 1 , for each bus are updated using the Woodbury Matrix Identity equations provided in [18]. The adaptive threshold ( τ m ) of bus m is updated with a sliding window of size β over recent normal samples using the equation
τ m = μ t h r , m , β + η σ t h r , m , β
where μ t h r , m , β and σ t h r , m , β are the mean and standard deviation of the squared Mahalanobis distance values of normal samples in β most recent samples of selected measurements associated with m t h bus, and  η is a hyper-parameter that decides how many standard deviations the threshold should be from the mean.

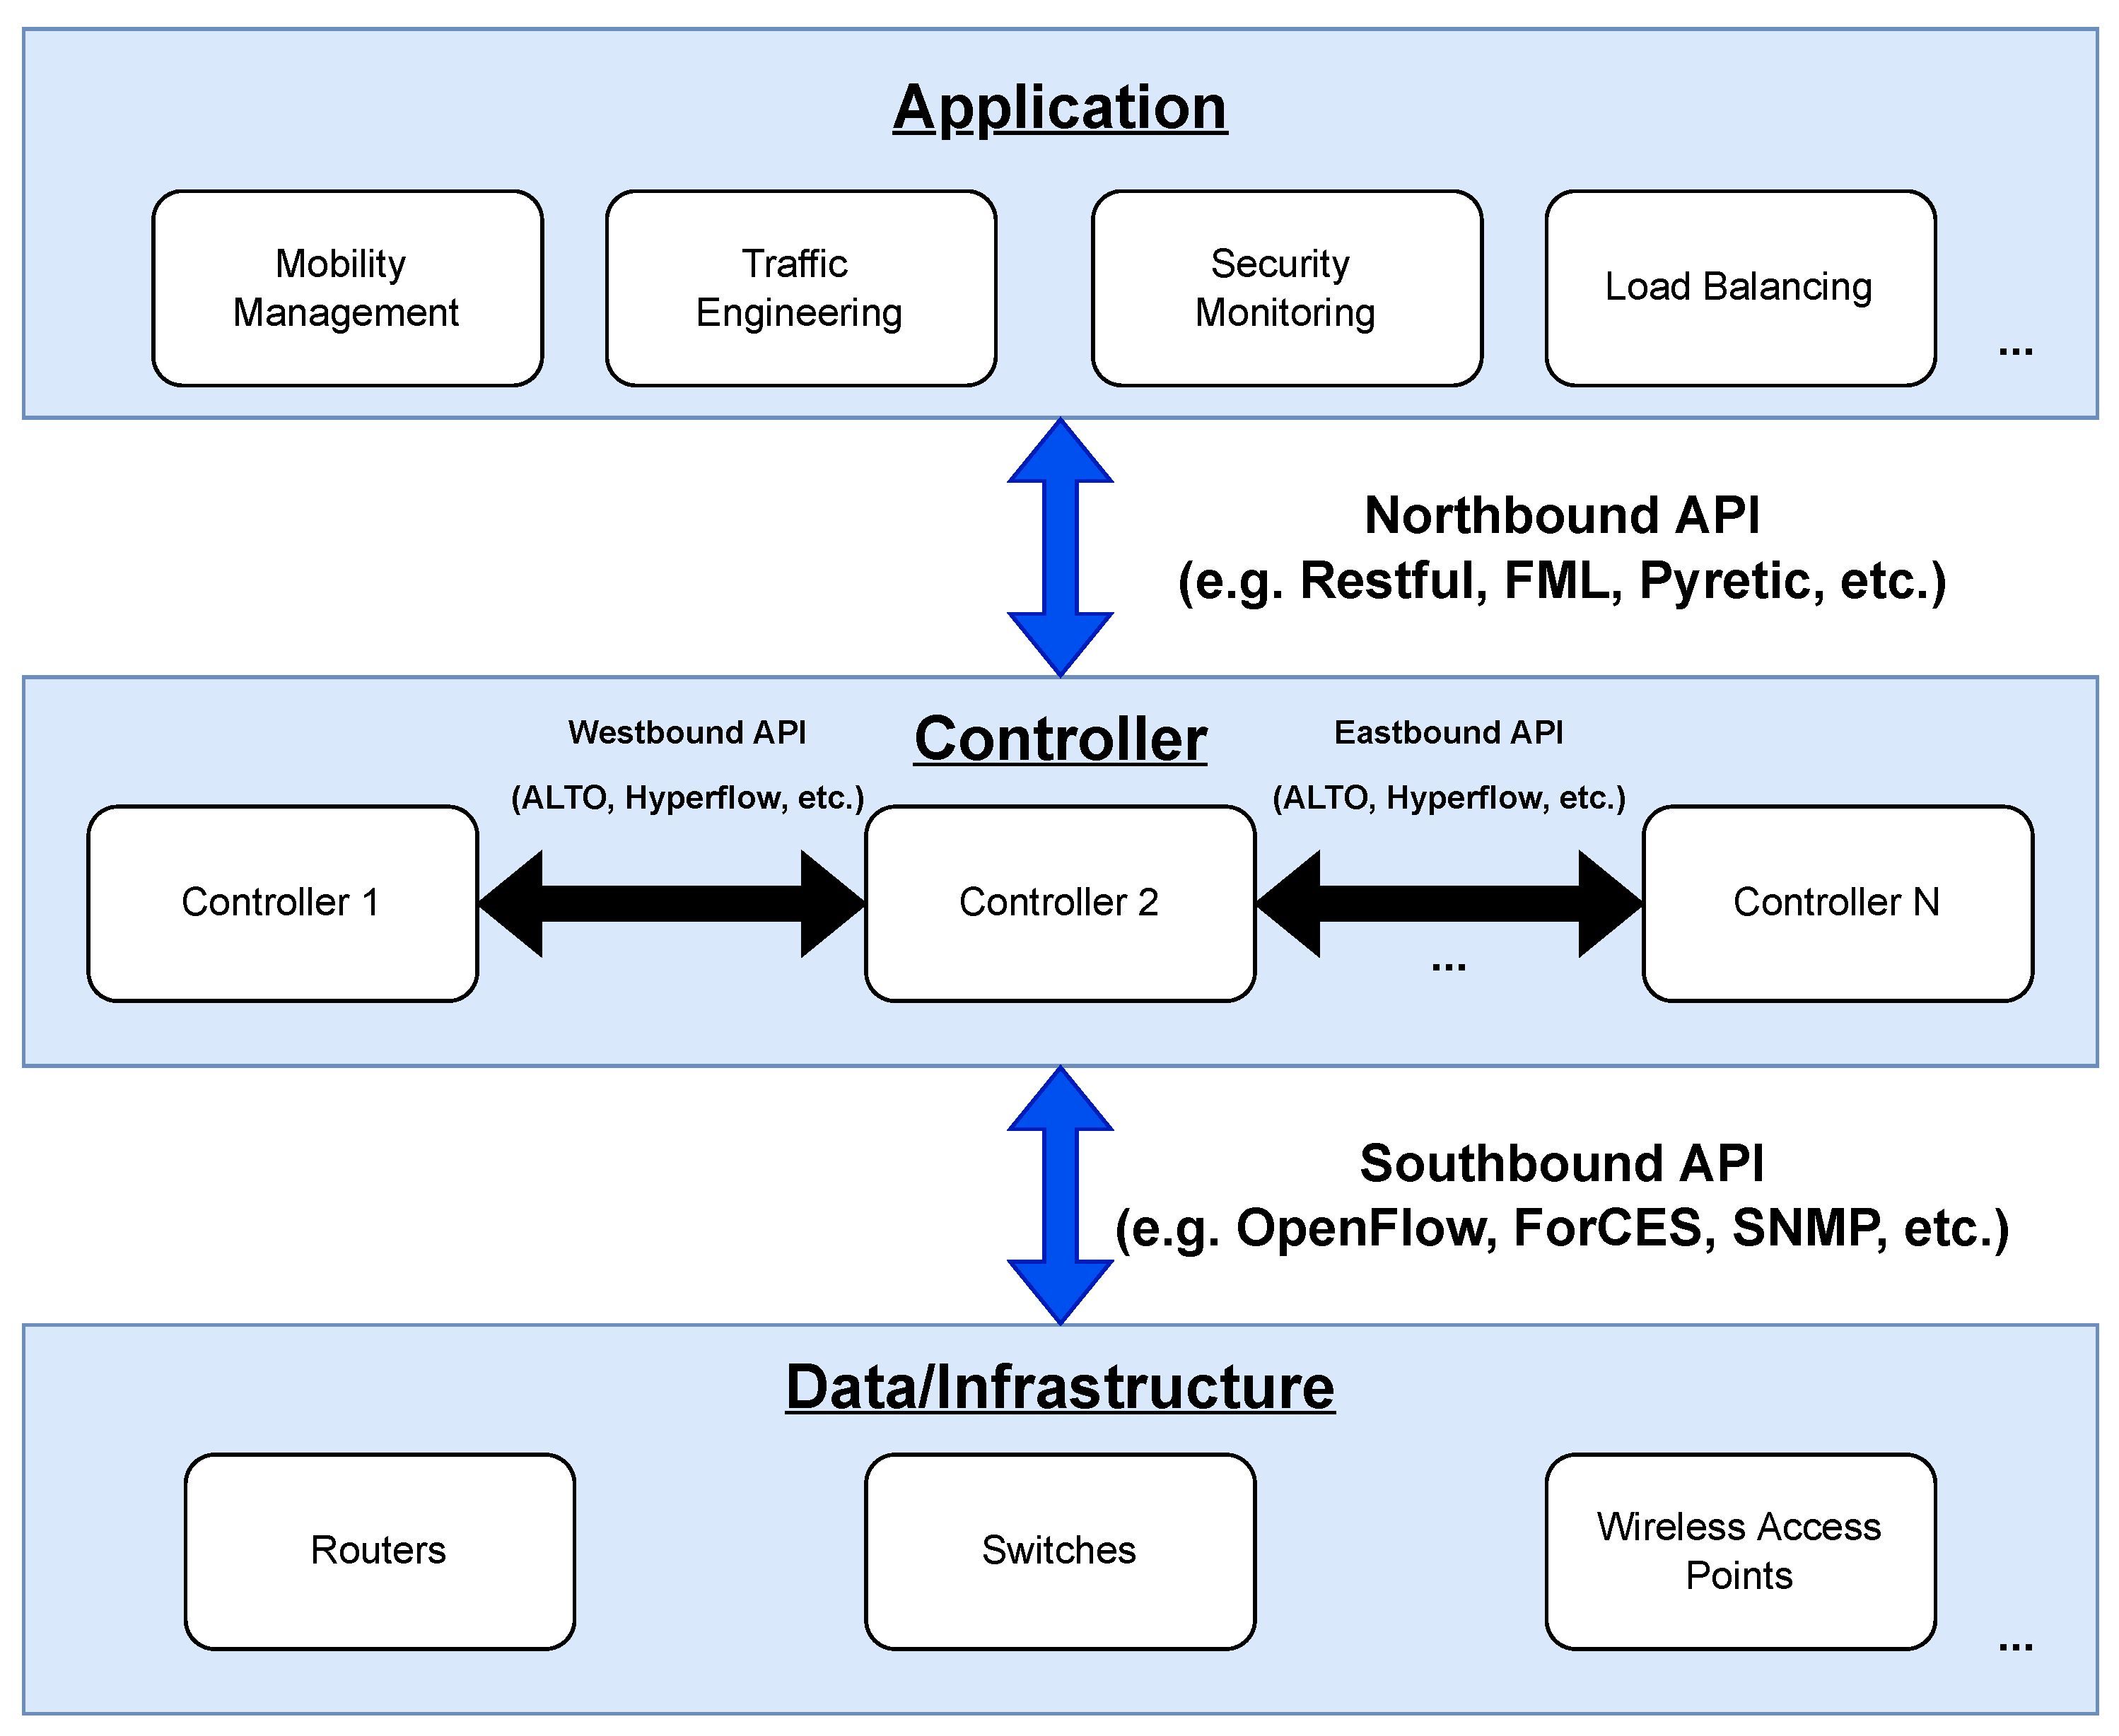
2.3. Software-Defined Networking

The concept and practice of SDN is enticing to those in the field of networking due to its visibility and ease of network device programmability. In recent years, SDN has taken shape. At Stanford University, the name SDN was coined to describe the concepts and techniques of Openflow [19]. SDN is divided into three planes:
  • Application Plane: It covers network management, policy implementation, and security services SDN applications.
  • Control Plane: This is a logically centralized control framework that runs the network operating system, operates the network operating system, and provides hardware abstractions to SDN applications. A flow in SDN is described as a set of instructions followed by a sequence of packets between the source and destination. Controllers install the flows into the flow tables of the forwarding devices.
  • Data Plane: A set of forwarding components used to move traffic flows in response to control plane instructions.
Figure 1 represents an overview example of a modern functional SDN architecture. Routers, switches, and access points comprise the infrastructure layer, as indicated in the diagram. The data plane is formed by this layer, which represents the physical network equipment in the network. Information is passed across planes of the SDN architecture through application programming interfaces (APIs). Southbound APIs like OpenFlow, ForCES, PCEP, NetConf, or IRS are used by the controller to communicate with the data plane. If there are multiple controllers, they interact via Westbound and Eastbound APIs like AlTO or Hyperflow. The application plane is the uppermost layer. The network operator can use functional applications for activities like energy efficiency, access control, mobility management, and security management at this layer. Northbound APIs such as FML, Procera, Frenetic, or RESTful are used by the application layer to communicate with the control layer. The network operator can use these APIs to relay the necessary modifications to the control layer, allowing the controller to make the appropriate adjustments in the infrastructure layer.
To emulate the SDN framework, we use Mininet. Mininet [20] is an open-source networking software used to quickly prototype and emulate networks consisting of hosts, links, and switches on a single system. Mininet uses process-based virtualization and network namespaces to establish virtual networks, both of which are present in modern Linux kernels [21]. As hosts in Mininet are simulated as bash processes running in a network namespace, any code that would usually execute on a Linux server (e.g., web server or client software) operates as it normally would. Each Mininet “Host” have their own private network interface and will only be able to see the processes it is running. Software-based switches, such as Open vSwitch or the OpenFlow reference switch, are used in Mininet. Links are virtual ethernet pairs that reside in the Linux kernel and connect our simulated switches and hosts.
Without a controller to manage the network, no SDN network would be complete. The POX [22] controller is the default controller in Mininet and is an OpenFlow controller written in Python that is useful for quick prototyping. It was built from NOX [23], the first OpenFlow controller with only C++ language support. As the POX controller does not support multiple, distributed controllers, East/Westbound API communication, as shown in Figure 1, is not possible. It is, nonetheless, the go-to controller for quickly testing SDN frameworks in Mininet due to its simplicity of setup. Because of this, we use it as our standard of comparison for our proposed framework.
There are a variety of different controllers used in SDN literature research, such as Floodlight [24], OpenDaylight (ODL) [25], RYU [26], and Open Network Operating System (ONOS) [8]. Each has its own set of features and functions, as determined by the developers. As of its relative ease of use, multiple software applications, and network visibility in the form of a graphical user interface (GUI), we employ ONOS to construct a controller cluster to manage our SDN network to achieve our distributed three controller architecture. A detailed overview of our implementation of ONOS can be found in Section 4.

2.4. Network Performance Statistics

The cross-layered analysis framework is based on the IEEE 118-bus system, which uses TCP/IP protocols to imitate the Modbus RTU. This model, which resembles the Poisson traffic model [27], sends packets in groups of four every four seconds. Each bus represents the M/M/c queue [28], i.e., cc 1, in which packet arrival is Poisson and queue service time is exponential. The traffic intensity or utilization is represented by the following equation:
P u t i l = λ μ
The packets’ arrival rate is denoted by λ , while the packets’ service time is represented by μ . The time difference ( Δ t ) between packet arrivals is known as the inter-arrival time ( I A T ). With parameter λ , it has an exponential distribution. For t ≥ 0, the probability density function is defined as follows:
f ( t ) = λ e λ t .
The average I A T is defined as
I A T = 1 λ
The service time follows an exponential distribution with parameter μ . The probability density function is as follows:
g ( s ) = μ e μ s , 0
where 1 μ is the average service time of the system. Utilizing Little’s theorem, the total waiting time is defined as transmission delays ( T D ), and represented as the following:
W = T D = 1 μ λ
The normal distribution of network packet arrivals (i.e., non-attacked packets) into each system was decided by the probability of witnessing a number of packet arrivals in a period from [0, T]. This equation is used to model the traffic volume of the bus:
P ( n a r r i v a l s i n i n t e r v a l T ) = ( λ T ) n e λ T n !
whereas T is the I A T , and the n represents the number of packets. The packet count (PC) is modeled as the following:
P C = λ T

2.5. Communication Layer

The SCADA network (Supervisory Control and Data Acquisition) is vulnerable to cyber-attacks. This section will detail how we implemented simulations for the DoS, MITM, and FDI attack scenarios.

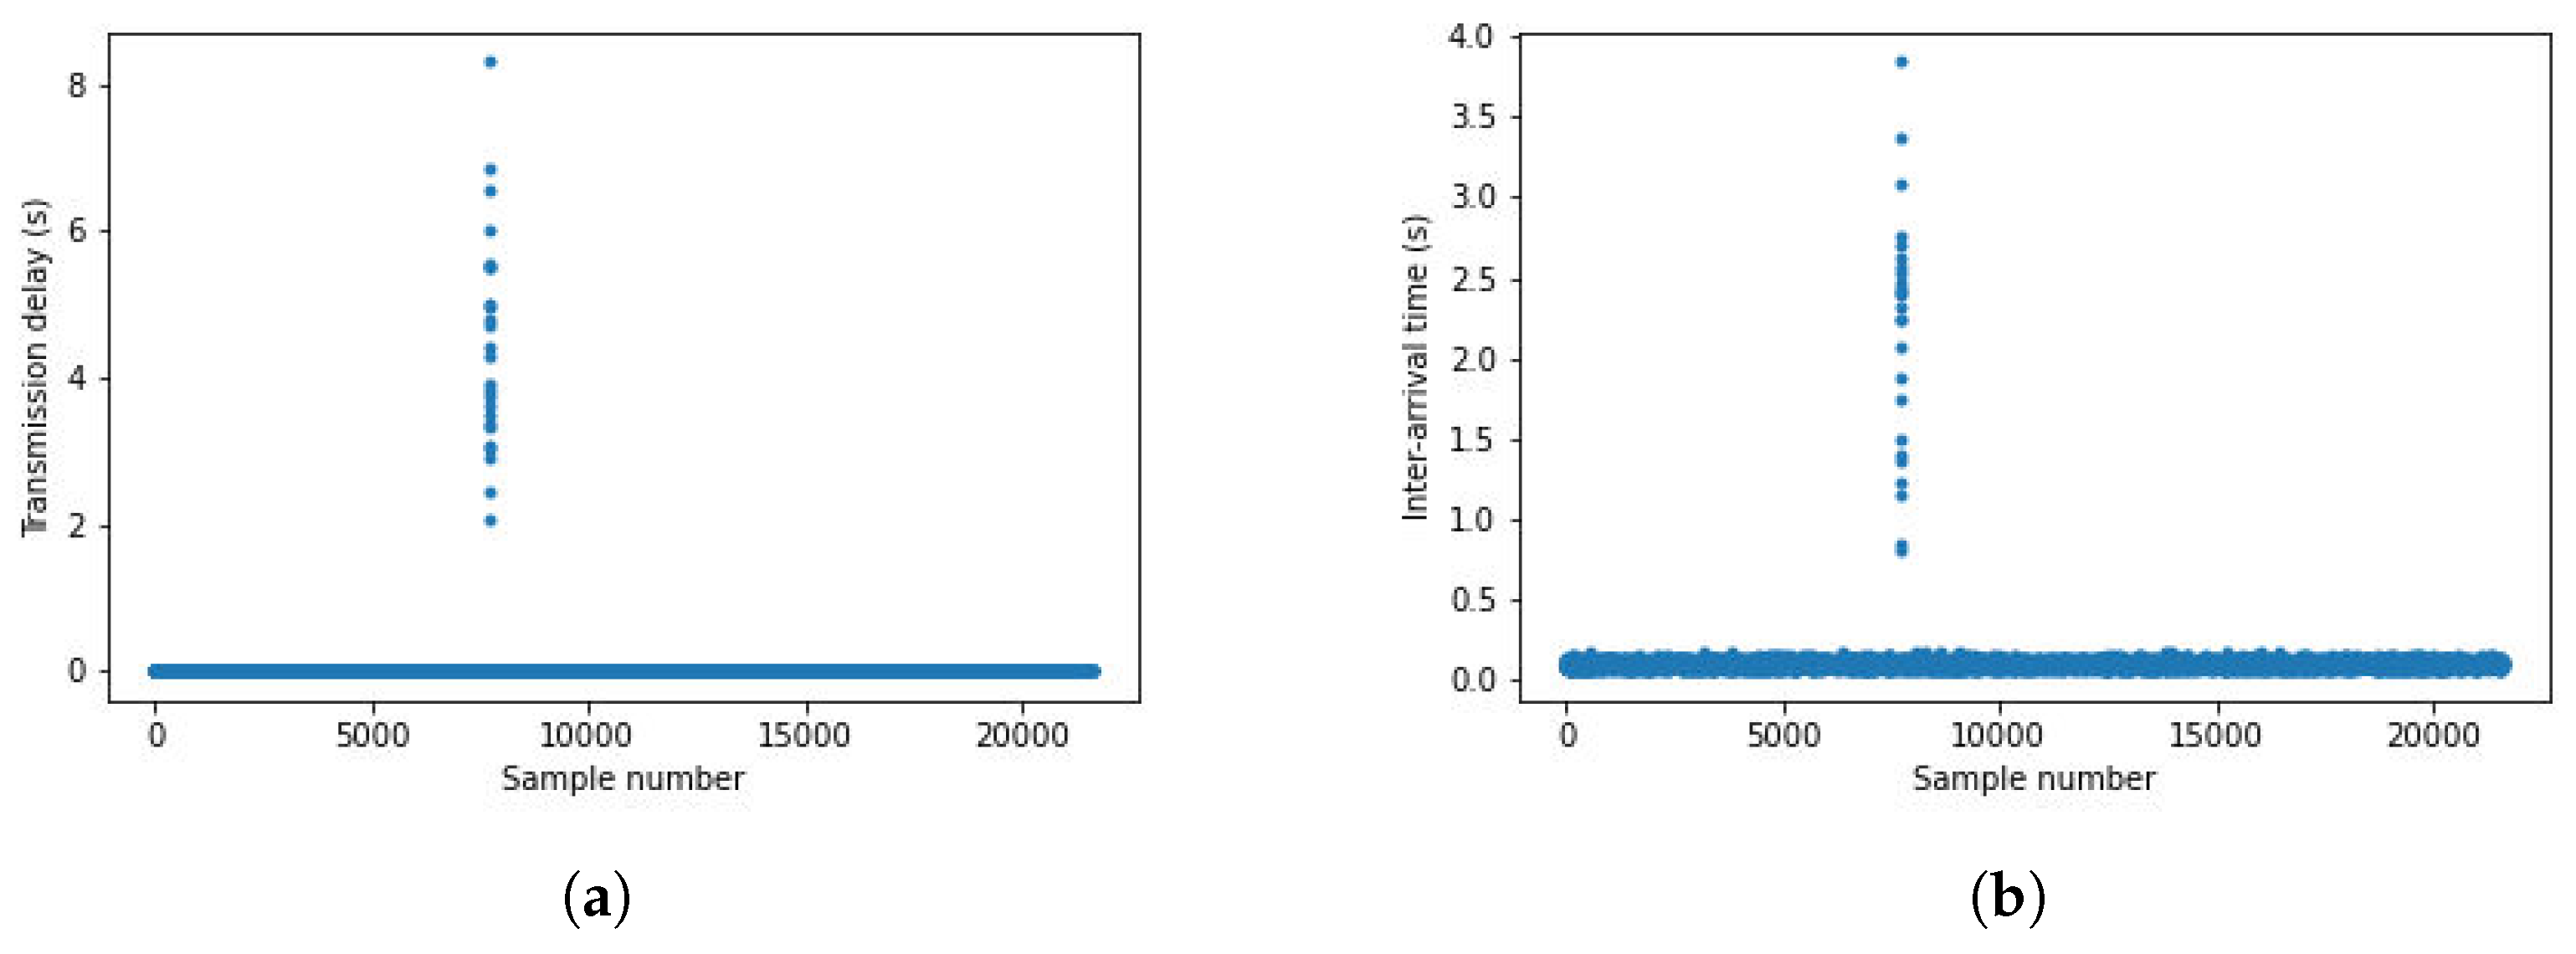
2.5.1. Denial of Service Attack Simulation

A denial-of-service (DoS) attack is a type of cyber-attack in which the perpetrator tries to prevent intended users from accessing a node or network by temporarily or permanently disrupting the services of a host connected to the network. A DoS attack is regularly carried out in an attempt to overwhelm systems and prevent some or all real requests from being handled by flooding the targeted computer or resource with unnecessary requests or packets (e.g., TCP, UDP, SYN, etc.). Communication between nodes is disrupted during a DoS attack because a huge number of service requests are delivered to the target node, depleting all of the node’s resources. A spike in network traffic to the victim (i.e., arrival rate) is created as a result of such an attack. As a result, large queues are formed, resulting in higher wait times and transmission delays [29]. Therefore, we record interarrival times (IAT) and transmission delays (TD) in our DoS attack datasets.
To simulate the effects of a DoS attack on our network traffic SimPy and component toolkit SimComponents [7] are used at the communication layer to simulate network traffic in the smart grid layer. SimPy is a discrete-event simulation framework based on Python. Active components such as packets, packet generators, packet sinks, switch ports, and port monitors may all be simulated using it. To define and replicate these components and their functionality, the SimComponents toolkit is employed. To achieve synchronization between the communication layer, smart grid layer, and machine learning model, we append the start time and index to the sample measurements. We generate data for one day’s worth of measurements and create datasets to reflect DoS attack scenarios. DoS Algorithm 1 illustrates our pseudo-code and shows the overview of our attack data generation. Figure 2 shows a histogram of malicious traffic sink interarrival times for DoS attacks. When the victim node is attacked, an influx of packets is sent to it, causing the frequency of packets received to increase.
Algorithm 1 Denial of Service Attack
1:
for One day worth of measurements do
2:
    Create arrays for the I A T & T D values
3:
    Append Index & Current Time
4:
    if An attack sample is detected then
5:
        Set error equal to 1
6:
        Create Attack Bus List
7:
        Extend Attack Bus List with attack bus number
8:
    else
9:
        Set error equal to 0
10:
    end if
11:
    for Each smart grid measurement do:
12:
        if error = 0 then
13:
           Simulate normal traffic
14:
           Append I A T & T D values to arrays
15:
        else
16:
           if a from bus is in the attack bus list then
17:
               Simulate malicious DoS traffic
18:
               Append I A T & T D values to arrays
19:
           else
20:
               Simulate normal traffic
21:
               Append I A T & T D values to arrays
22:
           end if
23:
        end if
24:
        Update IAT CSV File
25:
        Update TD CSV File
26:
    end for
27:
end for

2.5.2. False Data Injection (FDI) Attack Simulation

False Data Injection Attacks in the communication layer occur when the adversary accesses the network layer and either manipulates the data within a packet or transmits wrong data packets. This subsequently affects the behavior of the packets in the network layer. Thus, FDI attacks have the capability to increase the inter-arrival time and transmission delay at the network level. Using these performance metrics, FDI attacks in the IEEE 118-bus system are emulated in the communication network based on the M/M/c queue, where c 1 . The SimComponents and SimPy libraries are used to emulate packet generation, transmission, and FDI attacks in the communication layer. The implementation of this cyber-attack is summarized in Algorithm 2. This scenario is demonstrated by generating the inter-arrival times and transmission delay of normal and malicious packet samples using the SimPy environment. The start time is appended to the sample measurements for synchronization between the network layer and the power system layer. The packet generator function is utilized to send normal or malicious packets with a fixed inter-arrival time distribution and packet size distribution for the sample buses. In addition, the switch port is simulated with exponential packet inter-arrival times and exponentially distributed packet sizes by setting the port rate and queue limits. The port rate of false data injections is set to be lower than the normal traffic, while the queue limit of false data injections is set to be higher than the normal traffic.
Algorithm 2 False Data Injection Attack
1:
Initialize transmission delay ( T D ) array, inter-arrival time ( I A T ) array, switch function variables; port_rate_normal, queue_limit_normal, port_rate_malicious, queue_limit-malicious
2:
for all samples do
3:
    Append I n d e x & C u r r e n t T i m e to I A T array, T D array
4:
    if  A n a t t a c k s a m p l e i s d e t e c t e d  then
5:
        Create Attack Bus List packets sink
6:
        Setup switch port using p o r t _ r a t e _ m a l i c i o u s ,
7:
q u e u e _ l i m i t _ m a l i c i o u s
8:
        Simulate malicious traffic
9:
        Append I A T & T D values to arrays
10:
    else
11:
        
12:
        Create the packets generator and packets sink
13:
        Setup switch port using p o r t _ r a t e _ n o r m a l ,
14:
q u e u e _ l i m i t _ n o r m a l
15:
        Simulate normal traffic
16:
        Append I A T & T D values to arrays
17:
    end if
18:
    Create IAT CSV File
19:
    Create TD CSV File
20:
end for
The implementation of FDI attacks in Algorithm 2 is done based on the presence of normal and attacked buses in the generated bus list for the IEEE 118-bus system. Considering the bus list, if a normal bus is detected, the switch port parameters for the port rate and queue limit are set to values of 10,000 and 100,000, respectively. The packet generator is used to generate the normal packets with exponential inter-arrival times and exponentially distributed packet sizes. Similarly, if a malicious bus is detected, the switch port parameters for the port rate and queue limit are assigned values of 30 and 10,000,000, respectively. Moreover, the packet generator generates malicious packets with exponential inter-arrival times and exponentially distributed packet sizes. The packet sink records the inter-arrival times and transmission delays and appends the values of each time measurement to a CSV file, which is utilized by the ML model in real-time. The experiment is conducted for 21,600 packet samples.
Figure 3a,b represent the statistics of the transmission delay and inter-arrival time of 21,600 samples taken for 691 measurements, respectively. The generated values for the packet transmission delay and inter-arrival time are exponentially distributed.
Figure 4a,b are the plots for the transmission delay and inter-arrival time of 21,600 samples taken for the 690th normal traffic measurement. The values for the transmission delay and inter-arrival time fall within close ranges of each other for normal traffic measurement in the figures. Figure 5a,b illustrate the transmission delay and inter-arrival time of 21,600 samples for the 690th malicious traffic measurement. An instance of an FDI attack is demonstrated with a higher transmission delay at a maximum value of 8.30 in the 7712th sample, indicating malicious traffic. An occurrence of malicious traffic is represented in the 7718th sample, which shows an increased inter-arrival time with a maximum value of 3.83.

2.5.3. Man-in-the-Middle Attack Simulation

MITM attack is a type of attack during which malicious third parties position themselves between the communication of two other parties, or between a user and an application. The attack can be passive where the adversary eavesdrops and extract sensitive information. In this instance, communication confidentiality is compromised, and the adversary can remain undetected if a special network penetration test or analysis is not performed on a regular basis. The attack can also be active where the attackers hijack the router to which the victims are connected, or advertise false information using Address Resolution Protocol(ARP) messages. In doing so, they can gain access to the information being shared, and manipulate the data [30].
Our simulation considers only the active type of MITM attack because our code detects the difference in the number of packets transmitted and received between the victims. During an active MITM attack, the adversary flood the network with ARP messages to mislead the victims into thinking he is one of them. By doing so, there is a substantial increase in the number of packets transmitted that can be easily detected during the analysis of network statistics data. Moreover, active MITM attacks can also be detected with the analysis of network latency. Since the adversary is a pass-through between the two trusting parties, a delay is observed when the forwarding happens. We will only develop the concept of an increase in packet count in the following lines because this is the method used by our machine learning model to predict the behavior of the 118 bus system.
Algorithm 3 demonstrates how the principal purpose of a MITM cyber attack may be recognized and data collected. As we aforementioned, the traffic volume is affected by MITM attacks. This is why the method of detection is implemented by generating and testing packet counts. In this simulation, we alter the network traffic of randomly selected bus samples and as indicated in the algorithm and in the simulation result of Figure 6, we get alerts with the bus number and sample number for every bus that has an error.
Algorithm 3 Man-in-the-Middle Attack Detection
1:
Create benchmark arrays from arPoisson.txt
2:
Create array of sample data from matlab file
3:
for the length of the victim list do
4:
    if An attacked sample is detected then
5:
        Set error equal to 1
6:
        Extend Attacked Bus List with attack Bus number
7:
        Alert of error with error number and bus number
8:
    else
9:
        Set error equal to 0
10:
    end if
11:
    for the length of victim list do:
12:
        if error = 0 then
13:
           Append packet count values to array from firsth
14:
        else
15:
           if a from bus is in the attack bus list at this index then
16:
               Append packet count values to array from secondh
17:
           else
18:
               
19:
           end if
20:
        end if
21:
        Create packet count CSV File
22:
    end for
23:
end for
In conclusion, MITM attacks typically have a low impact or no impact at all on network performance but they are the first steps to achieve to jeopardize a cyber security system. During MITM attacks and depending on the type of MITM attack, a flux of packets could increase the network traffic. These kinds of attacks are amongst the most dangerous ones because they are very hard to detect and can easily open doors to other types of attacks like DoS or FDI.

2.6. Power Grid: FDI and Parameter Attacks
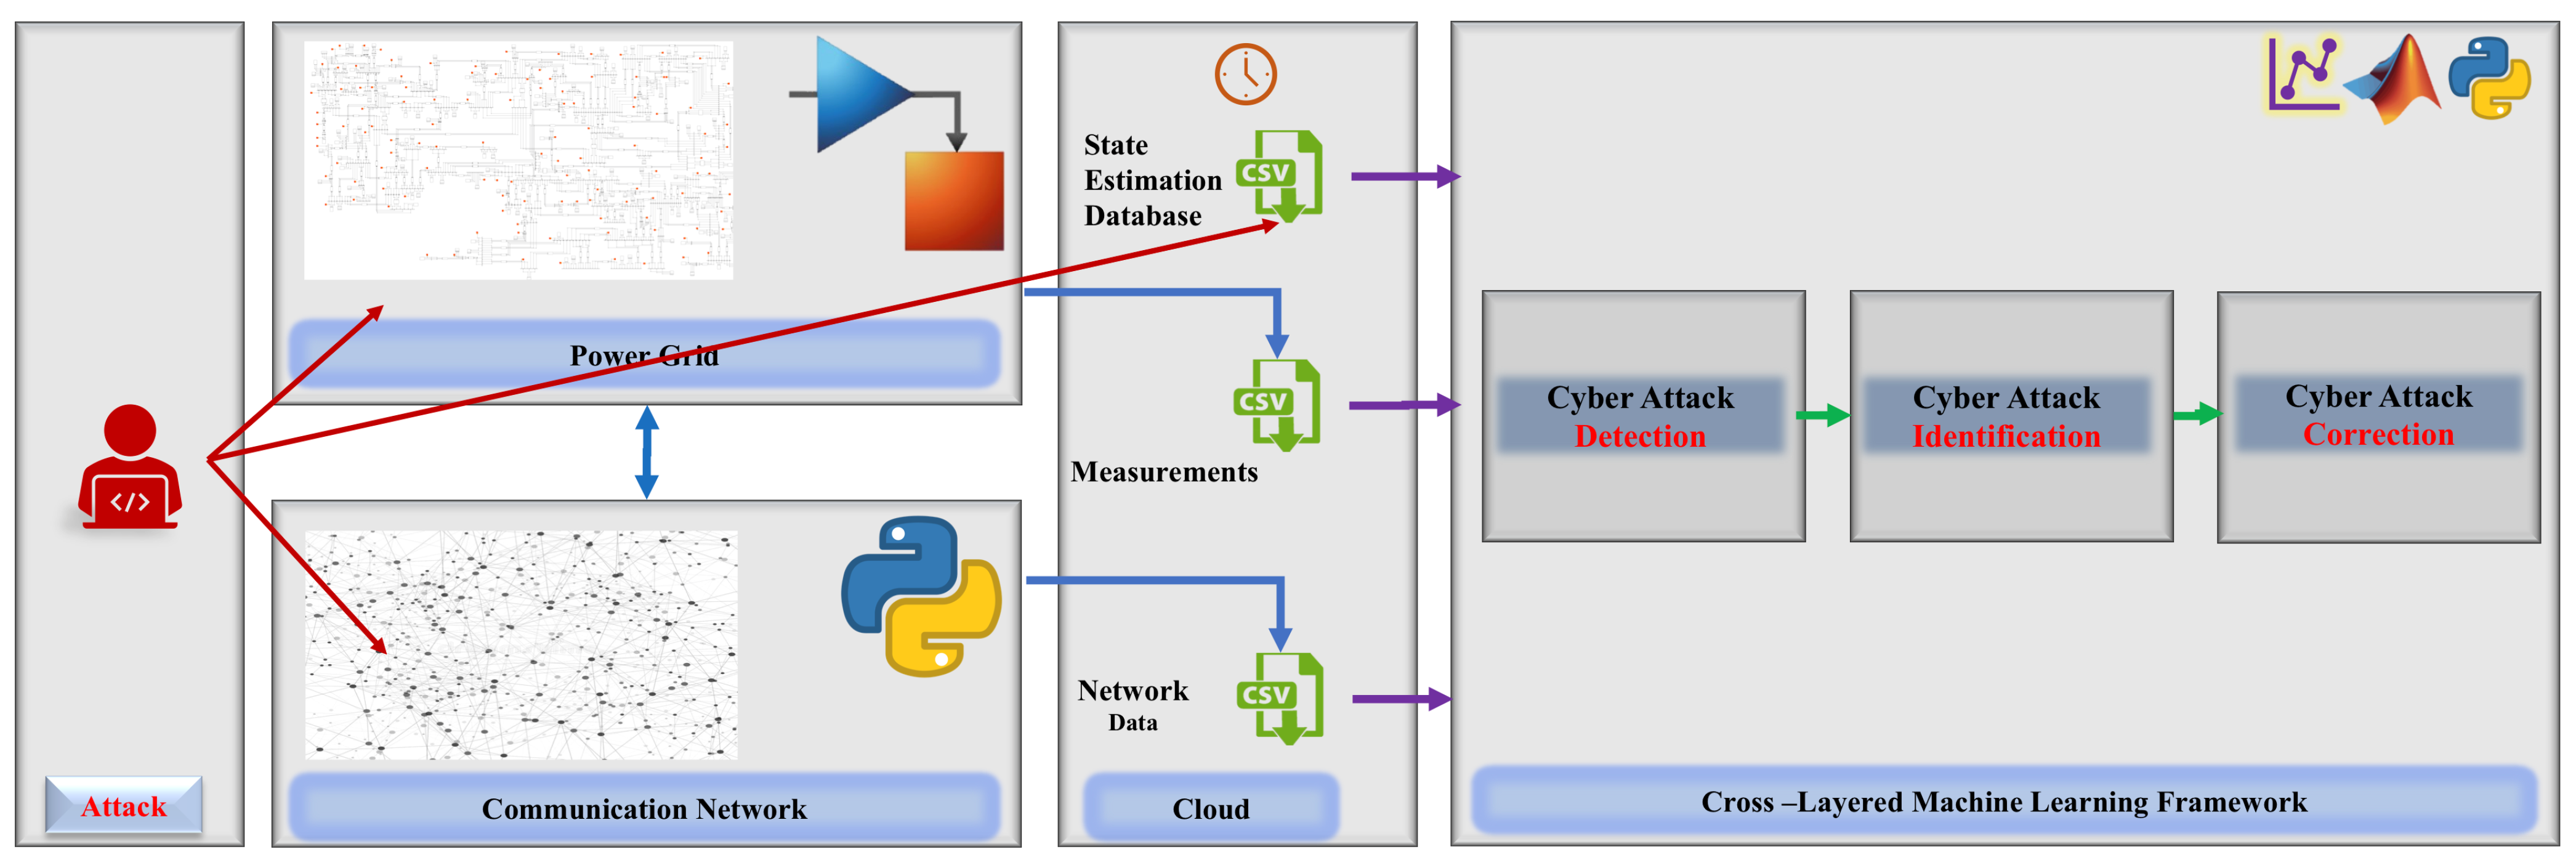
The power grid can be modeled through nodes and edges. Measurements collected from the grid are power flows into those edges (lines) and injections into the nodes. SE reads off those measurements and uses a model that is based on the connectivity of the nodes and the electrical characteristics of the lines (system database). Hence, SE is a monitoring tool to observe the healthiness of the power grid over time. Therefore, the attacks pertaining to the power grid could affect the collected measurements or the database used by SE. FDI attacks can be on measurements or databases [31]. Attack types result in different residual characteristics and patterns [17]. These will be used here for the correction. This work [32] was used towards parameter cyber-attack correction, while [33] is used for measurement FDI attack correction.

3. Framework

The cross-layered cyber security framework takes into account the cyber-physical domain of the concept of the smart grid. The physical domain is composed of a power grid and communication network while in the cyber domain, the collected and communicated data are analyzed. The top view of the cross-layer framework is illustrated in Figure 7. As shown in Figure 7 and reading the figure from left to right, the attacker is designed as an outside entity where the desired scenario. Data collected from the power grid and communication network are stored in files to be analyzed by the cyber-domain. The collected data then passes through three stages: detection, identification, and correction. In the detection stage, the data collected from the power grid as well as the communication network are combined and analyzed by Machine Learning techniques as shown in Figure 8. It is worth mentioning that the data stored in the “CSV” file are after the attack took place and their effects happened. For instance, for an FDI attack on measurement, the corresponding measurement in the “CSV” file named “Measurements” are altered based on the attack scenario constructed. The output of the detection stage is a flag that corresponds to the attack scenario initiated. In the identification stage, each flag will be passed to a corresponding routine for identifying the location of the attack within the network of interest. For instance, in an attack in the system database used by State Estimation (SE), the k-nearest neighbor (kNN) routine will be activated to identify which line (Edge/Arc) in the power network is being altered/attacked by the attack scenario.

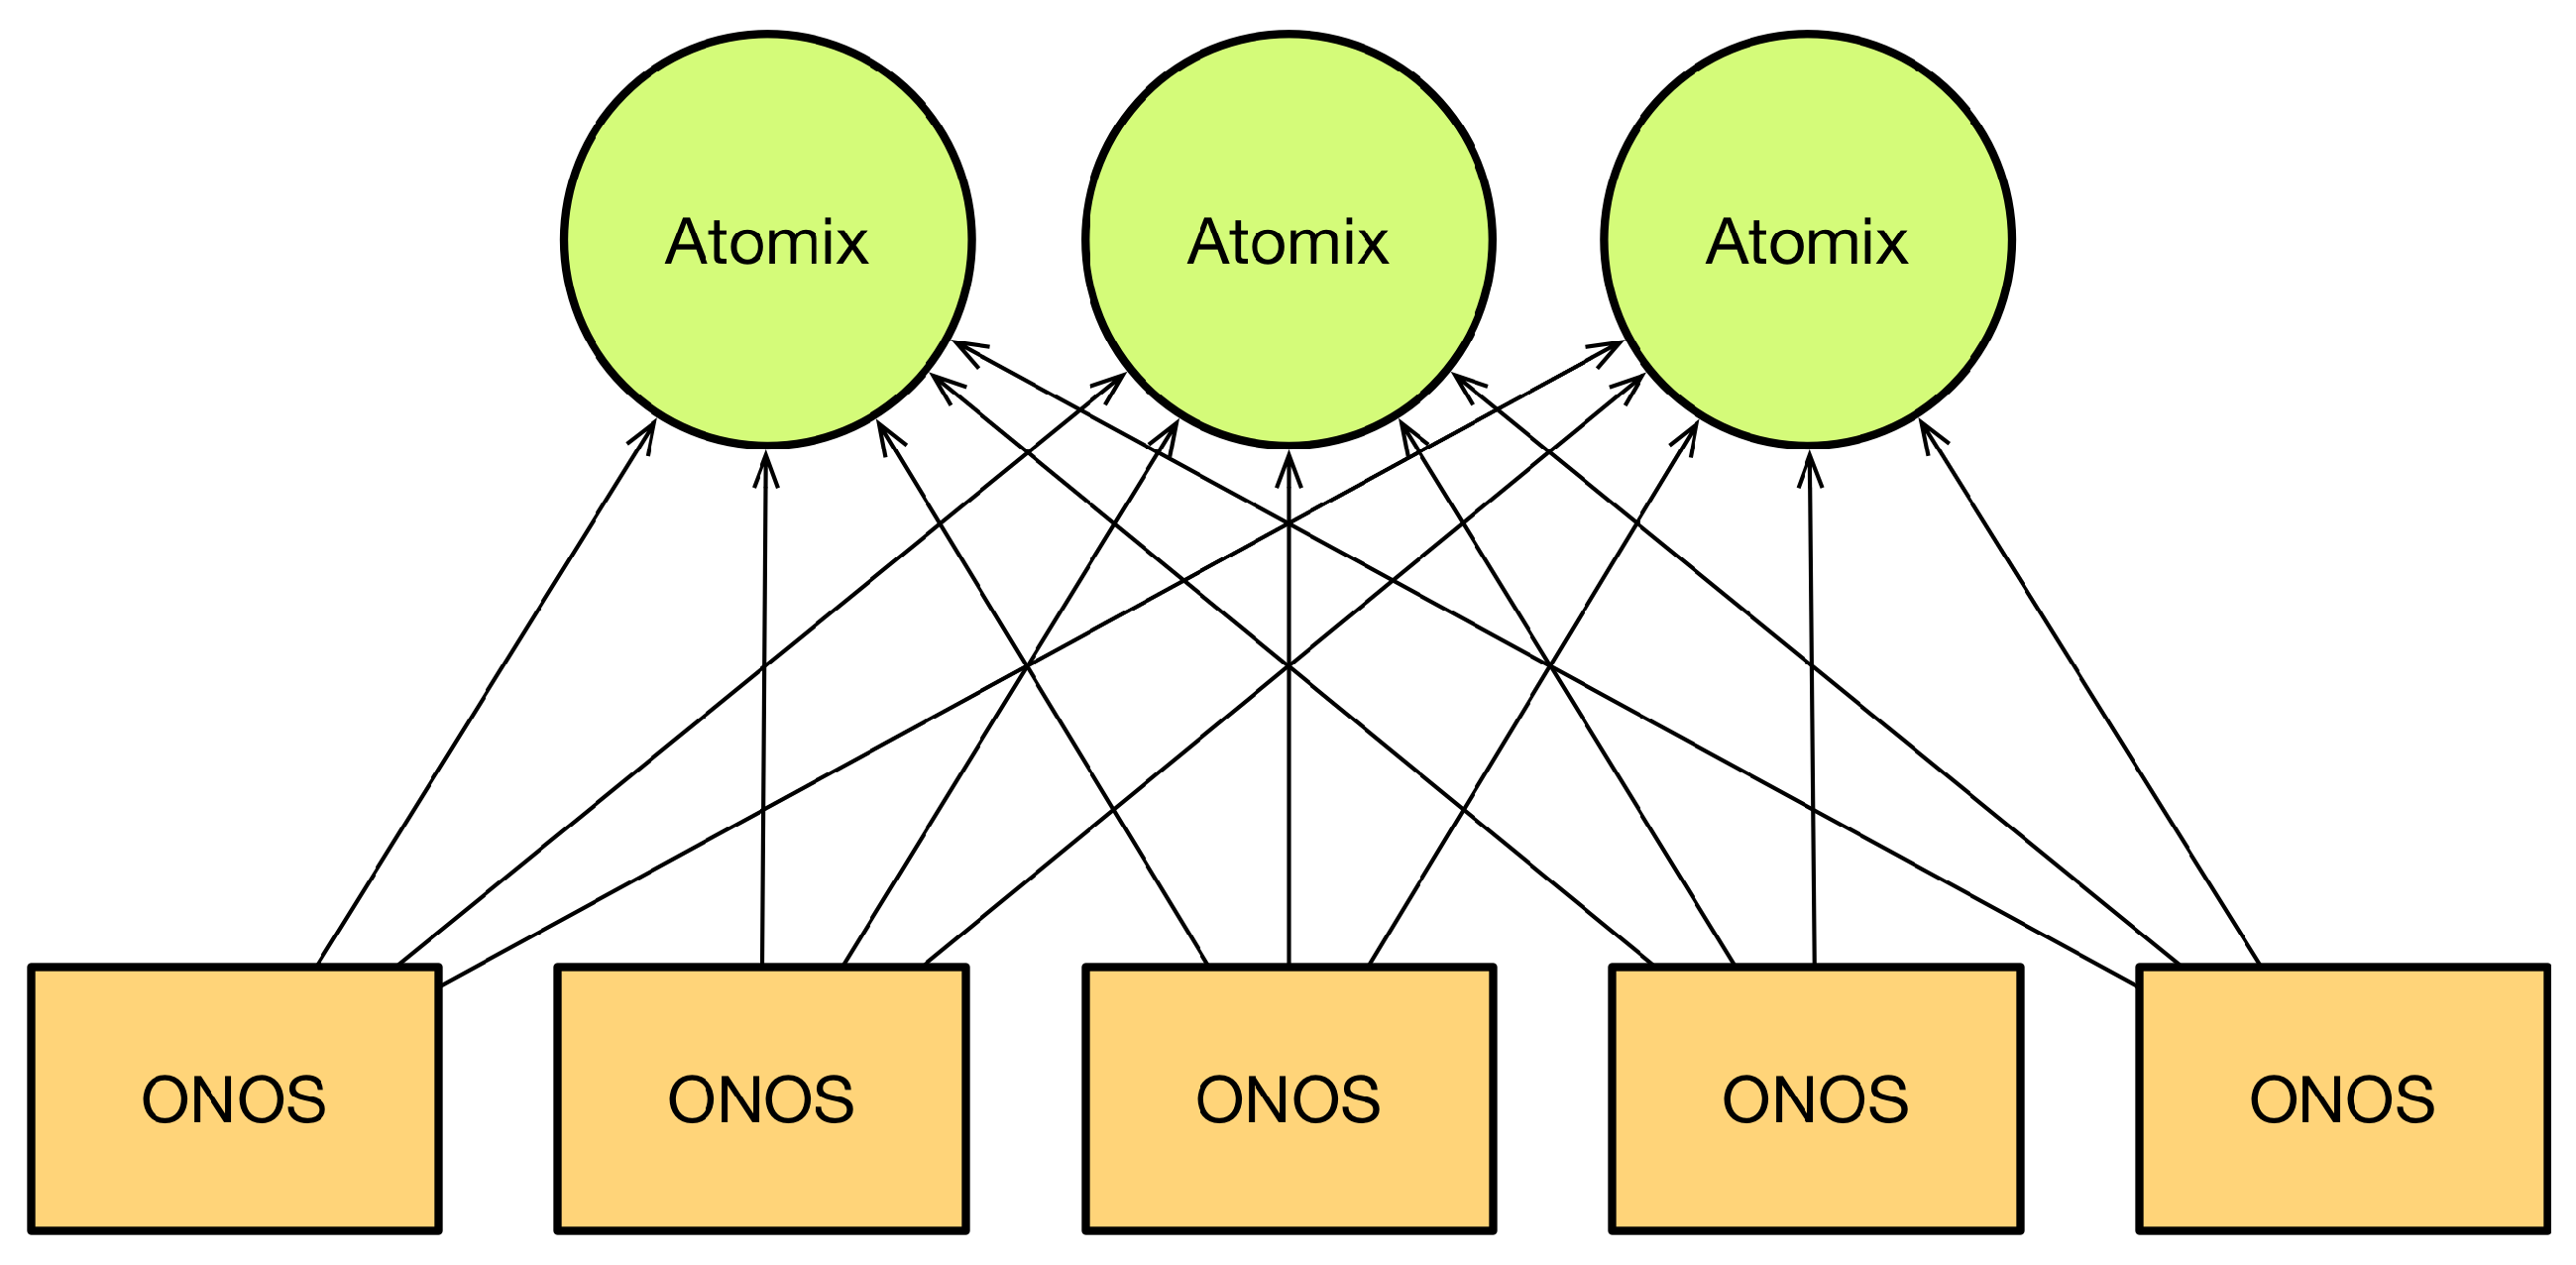
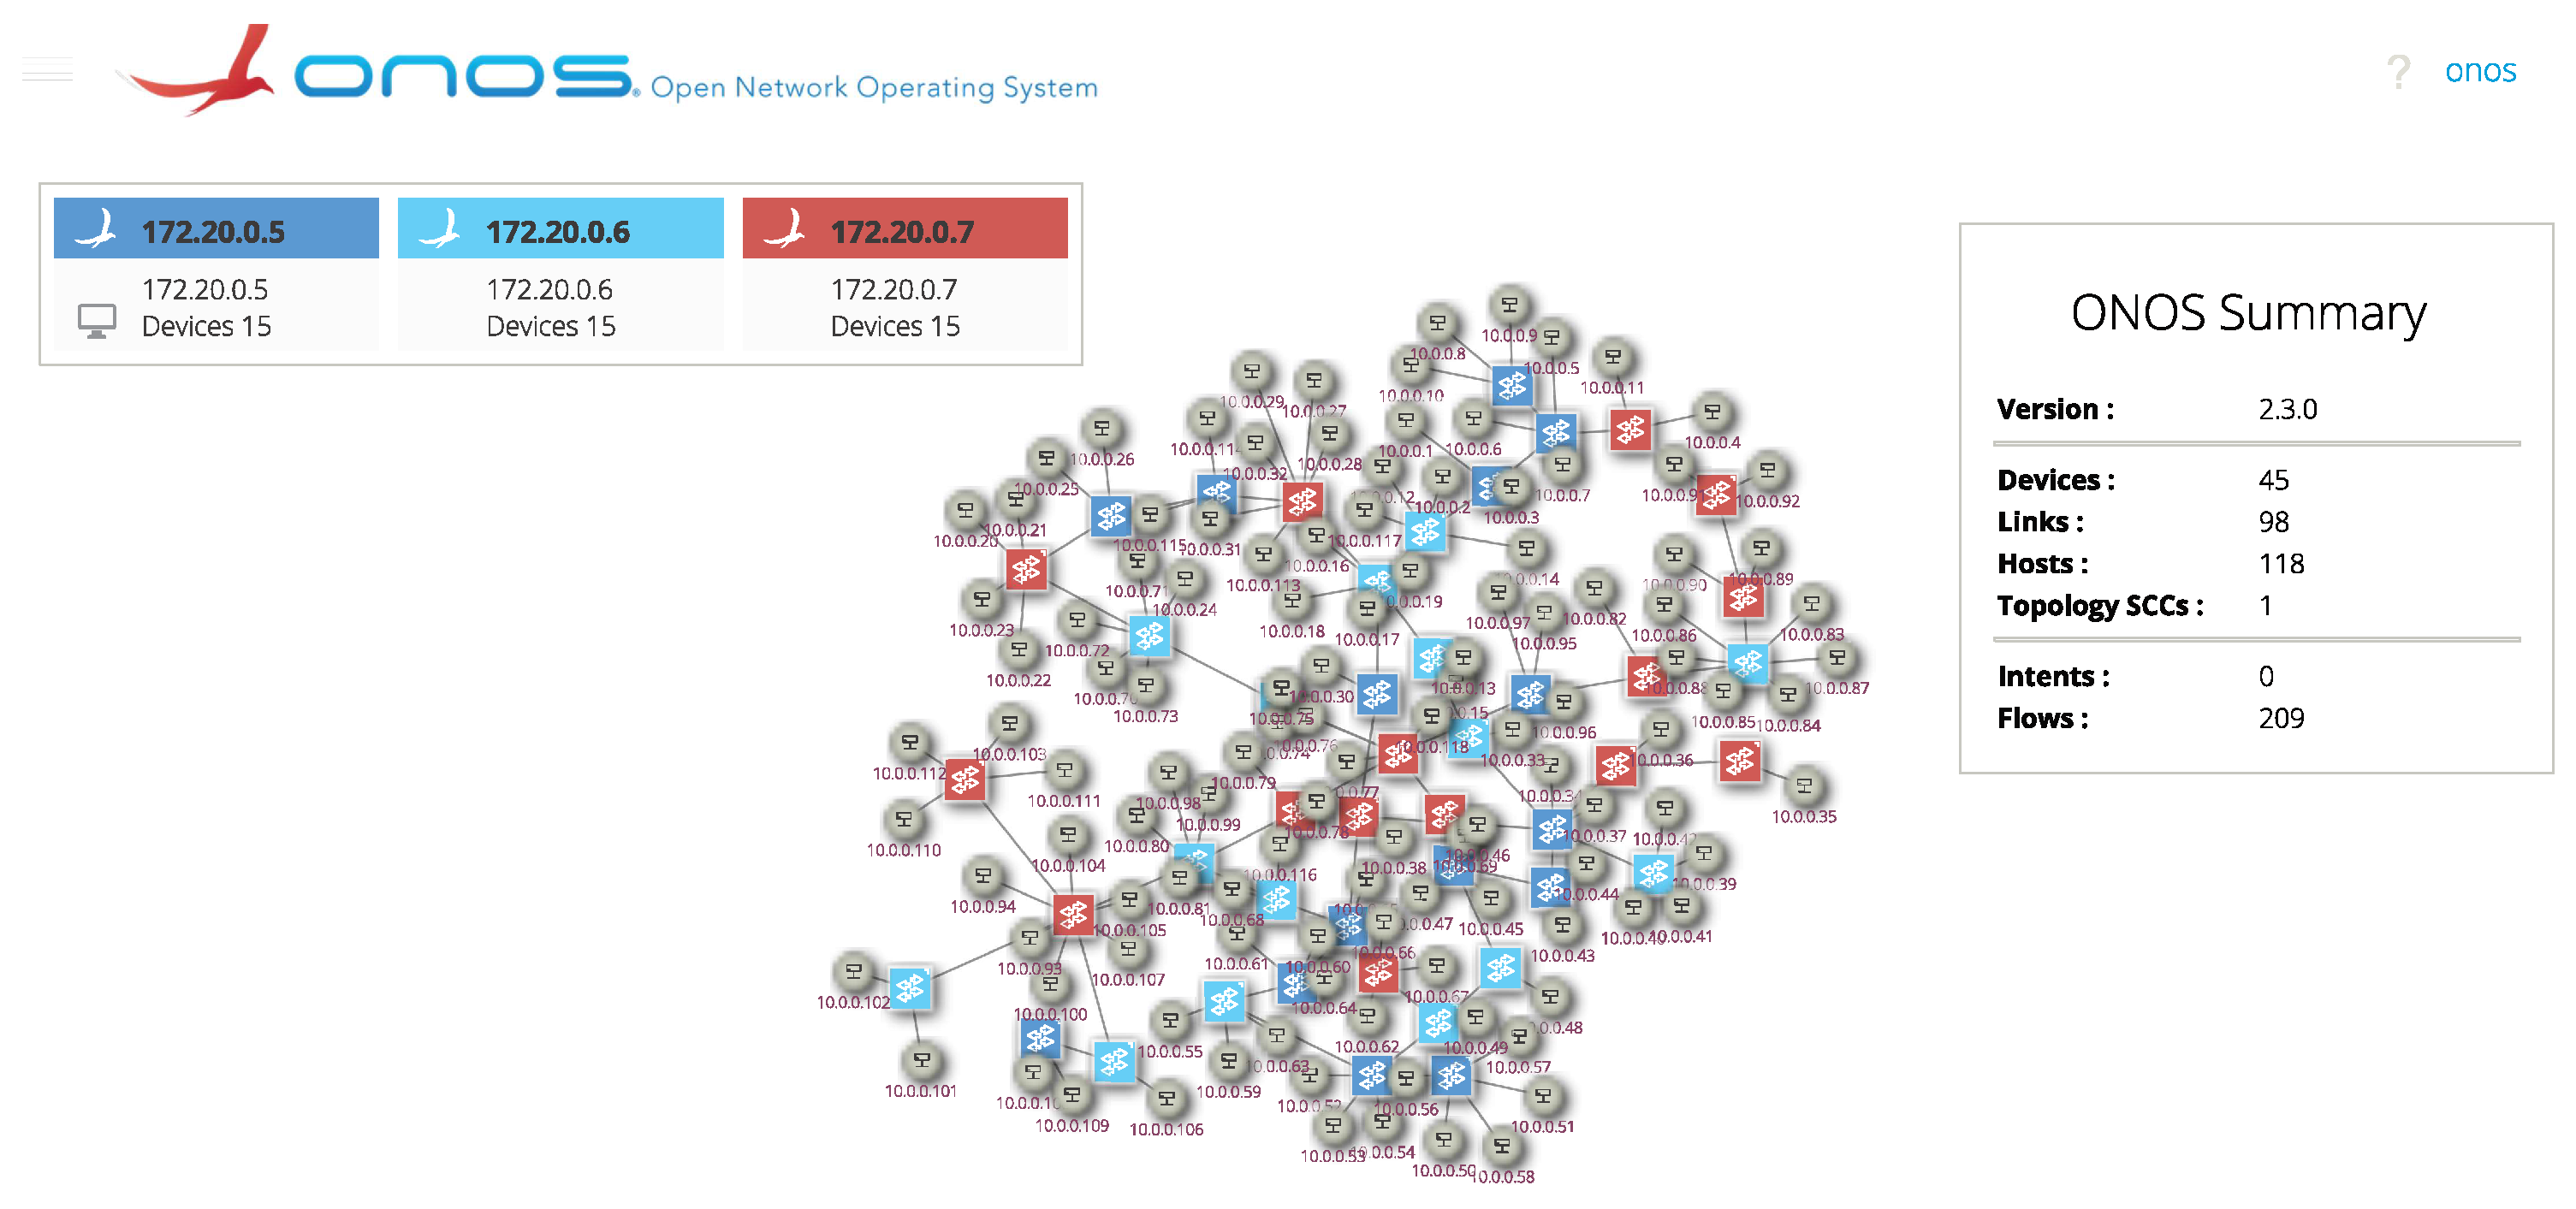
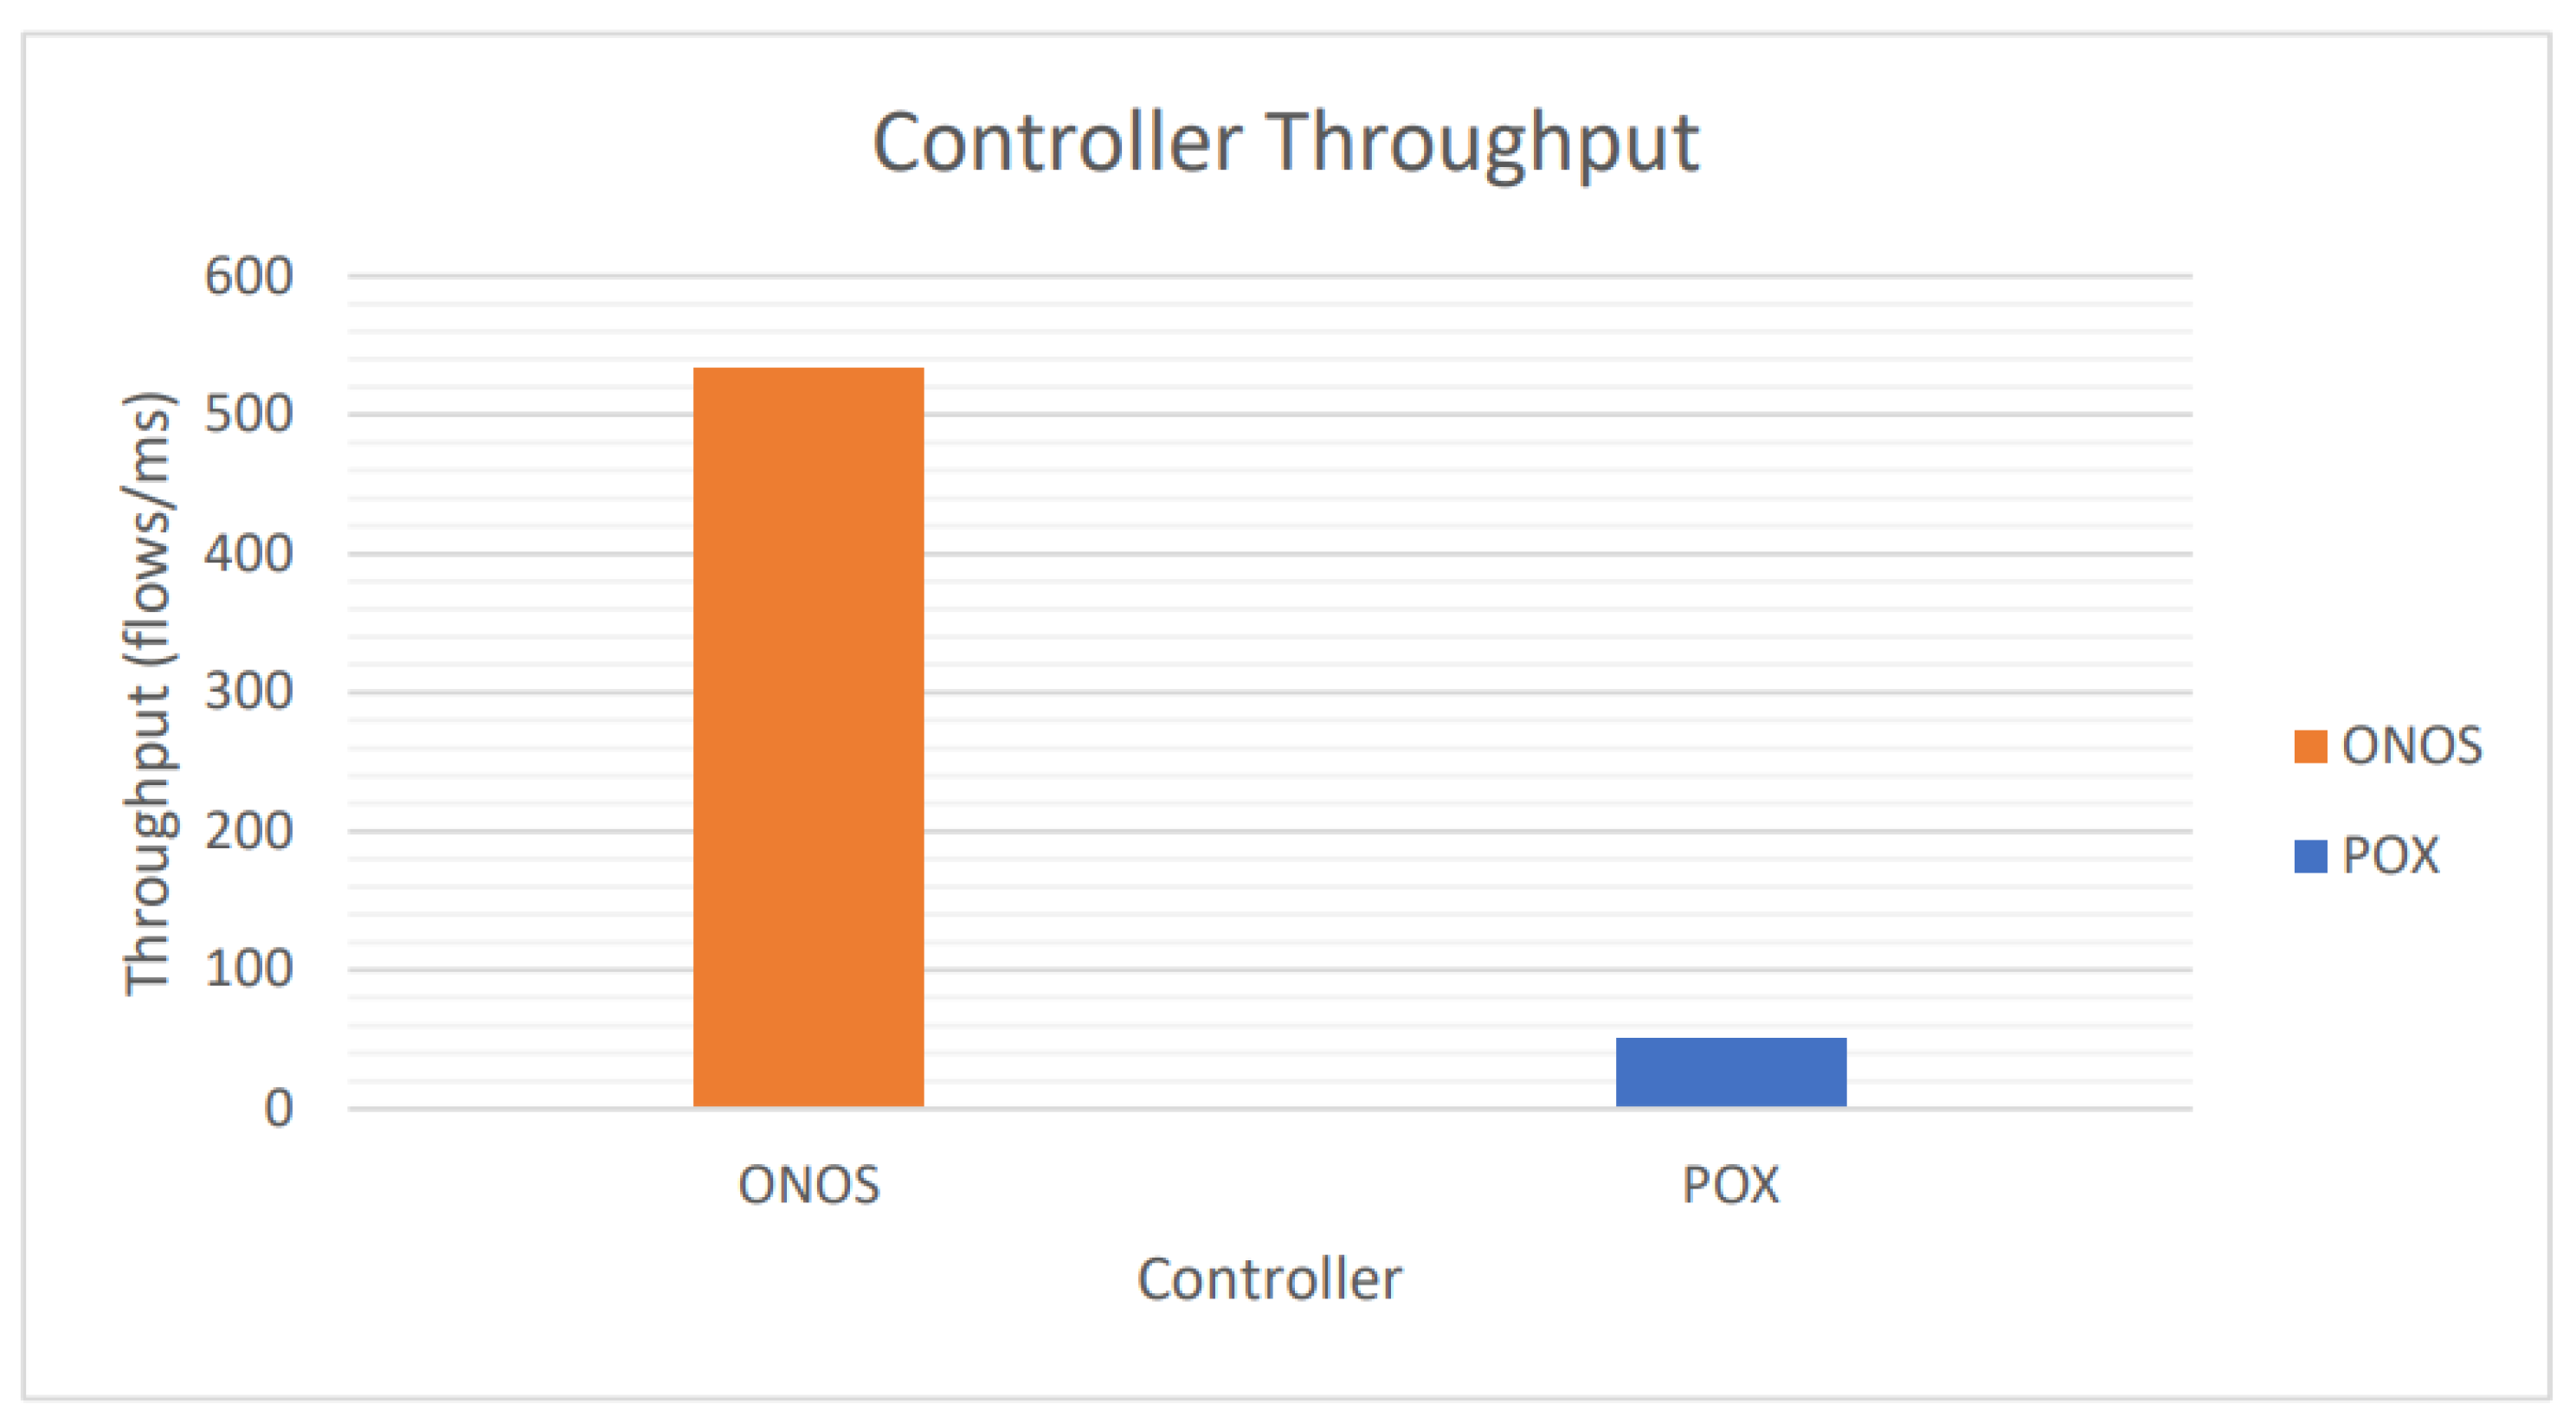
3.1. Implementation of SDN

We use a distributed, three-controller SDN structure to serve as the communication layer for the smart grid. To avoid a single point of failure, we use three controllers, each of which has the same authority level in the network. This means that each controller has equal control over the network. There isn’t a single point of failure in the network since there aren’t any single controllers. We utilize ONOS as our SDN framework’s control layer, which is primarily open source. It provides for network and configuration control in real-time.
ONOS also allows for quick redistribution of controller load, allowing each controller to function optimally for the network. We can monitor and regulate the flow of packets in our smart grid infrastructure from the ONOS cluster GUI. Furthermore, ONOS eliminates controller single points of failure by dynamically shifting the workload from a down controller to the remaining controllers if necessary. This is done by Atomix [34], a reactive java framework for building scalable fault-tolerant distributed systems. The Atomix cluster is responsible for ONOS cluster administration, service discovery, and data storage, as depicted in Figure 9. ONOS controllers may be quickly discovered and removed if down, thanks to the Atomix framework. First, we utilized Docker containers to build the Atomix and ONOS clusters in a local virtual machine (VM) installation on a local personal device, using ONOS version 2.3, Openflow version 1.3, and Atomix version 3.1.5. Then, using a python script with Mininet 2.3 APIs, we built 118 hosts and 45 Open vSwitches with OpenFlow 1.3, as illustrated in Figure 10. Open vSwitch [35] is an open-source distributed virtual multilayer switch solution and one of the most popular implementations of OpenFlow. This is our proposed SDN framework, which is modeled around the IEEE 118 bus system.

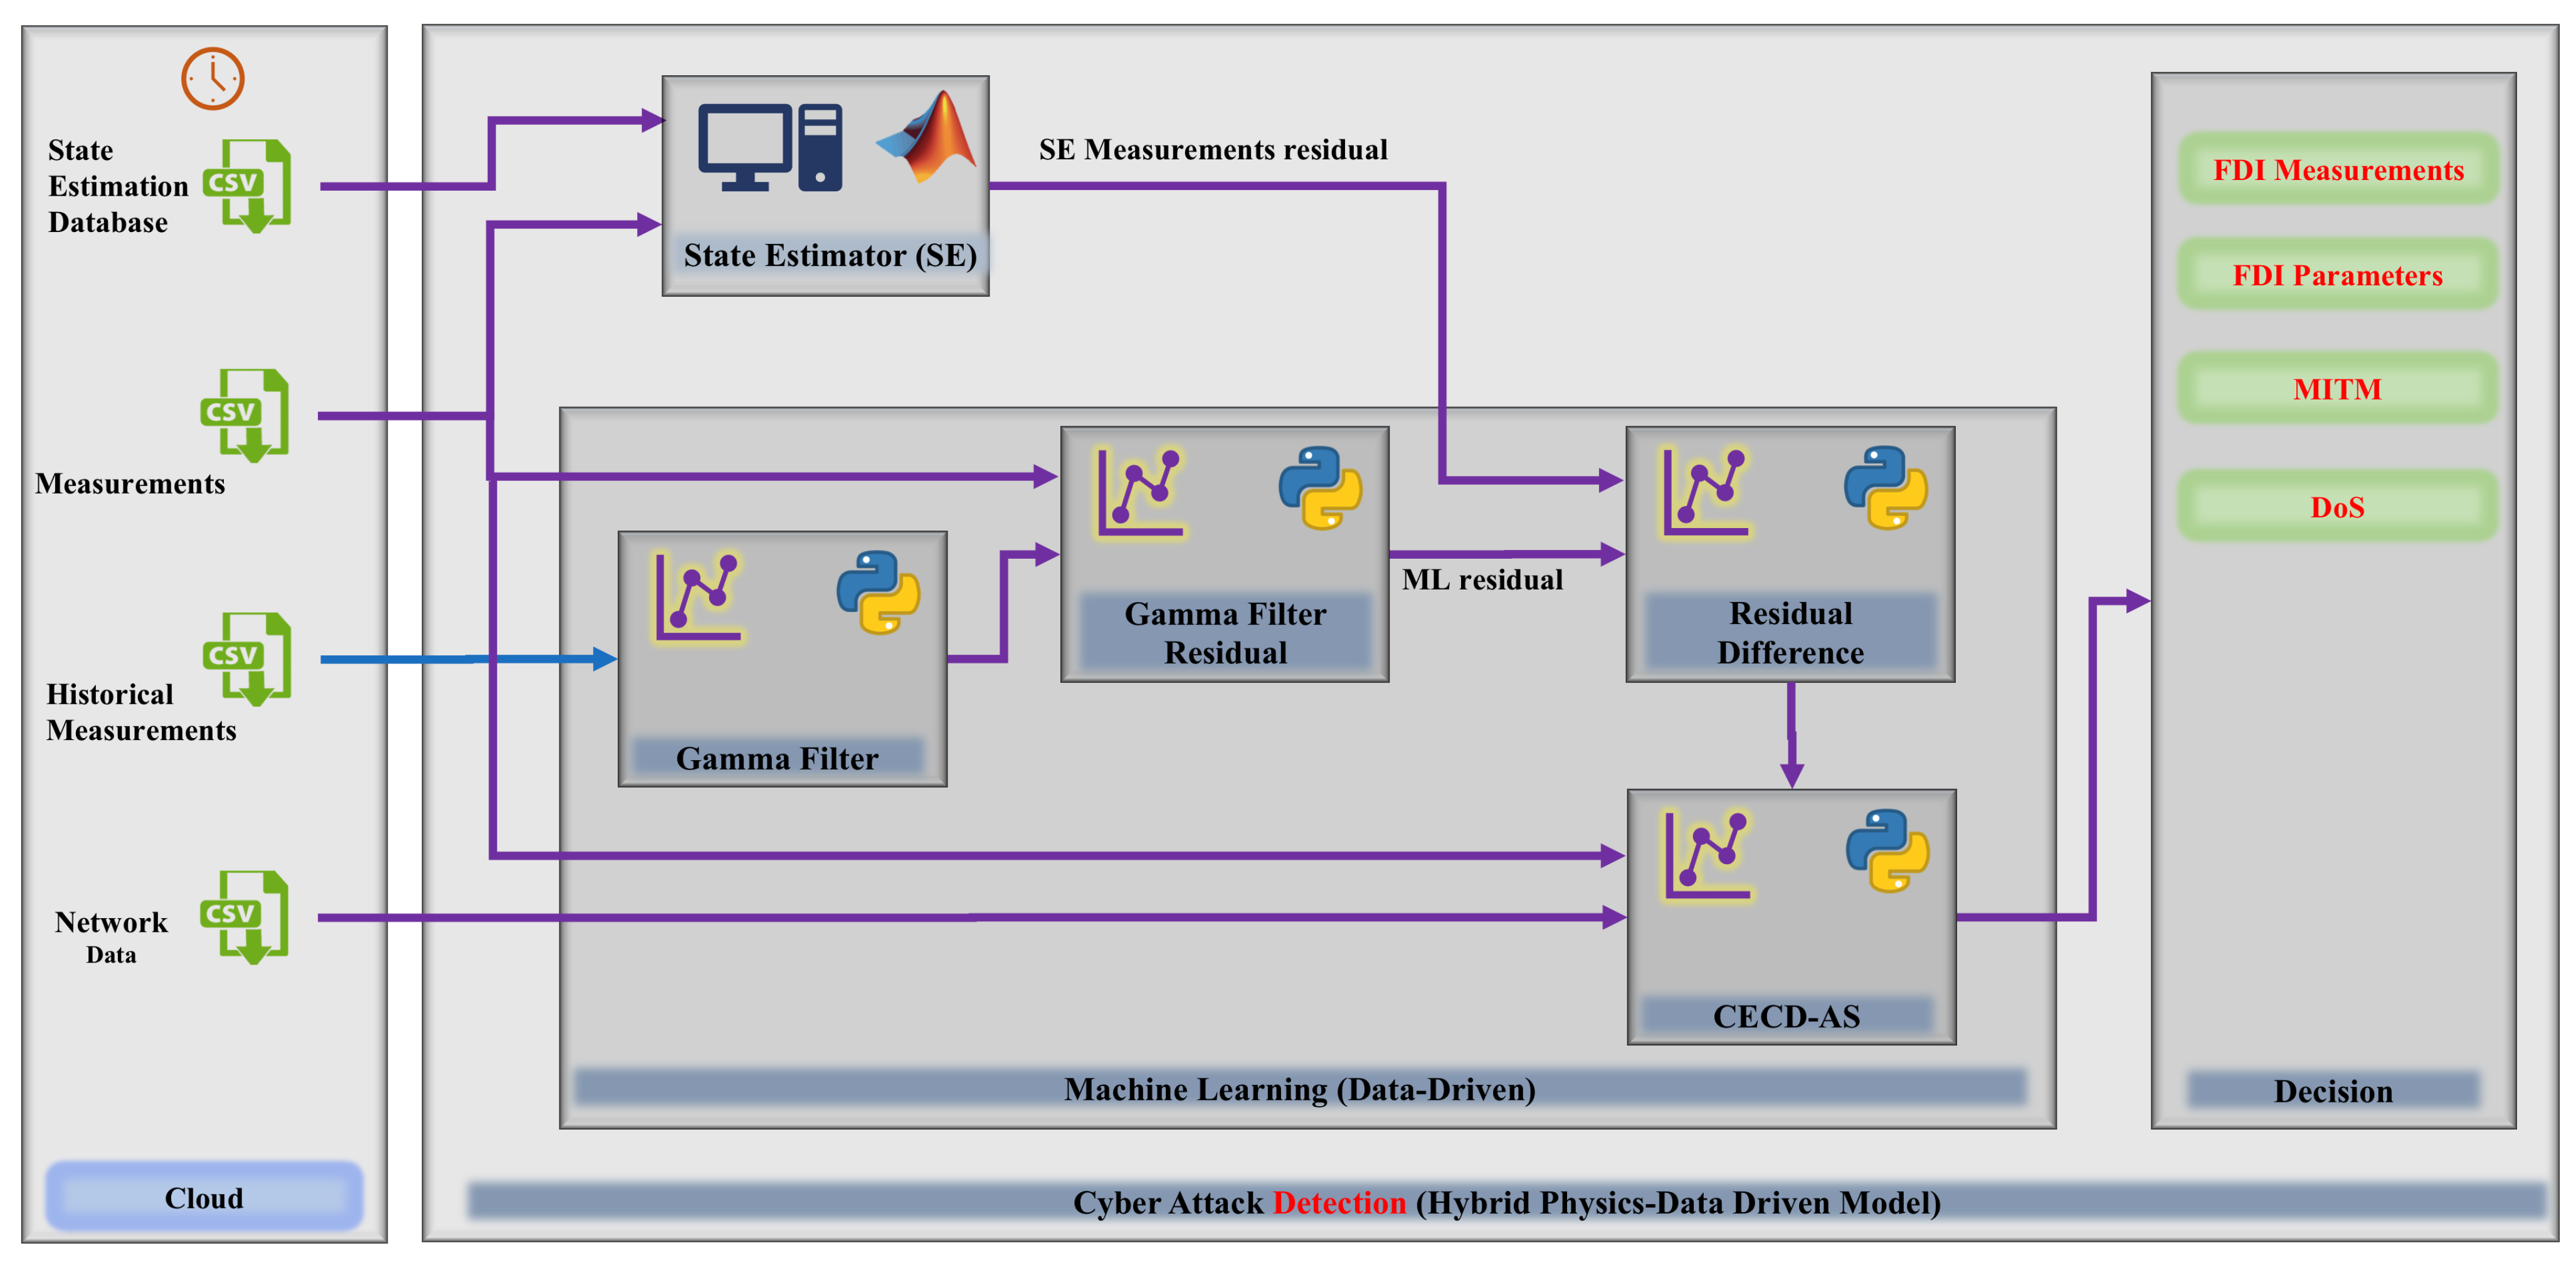
3.2. Details on the Apps: Cybersecurity Framework
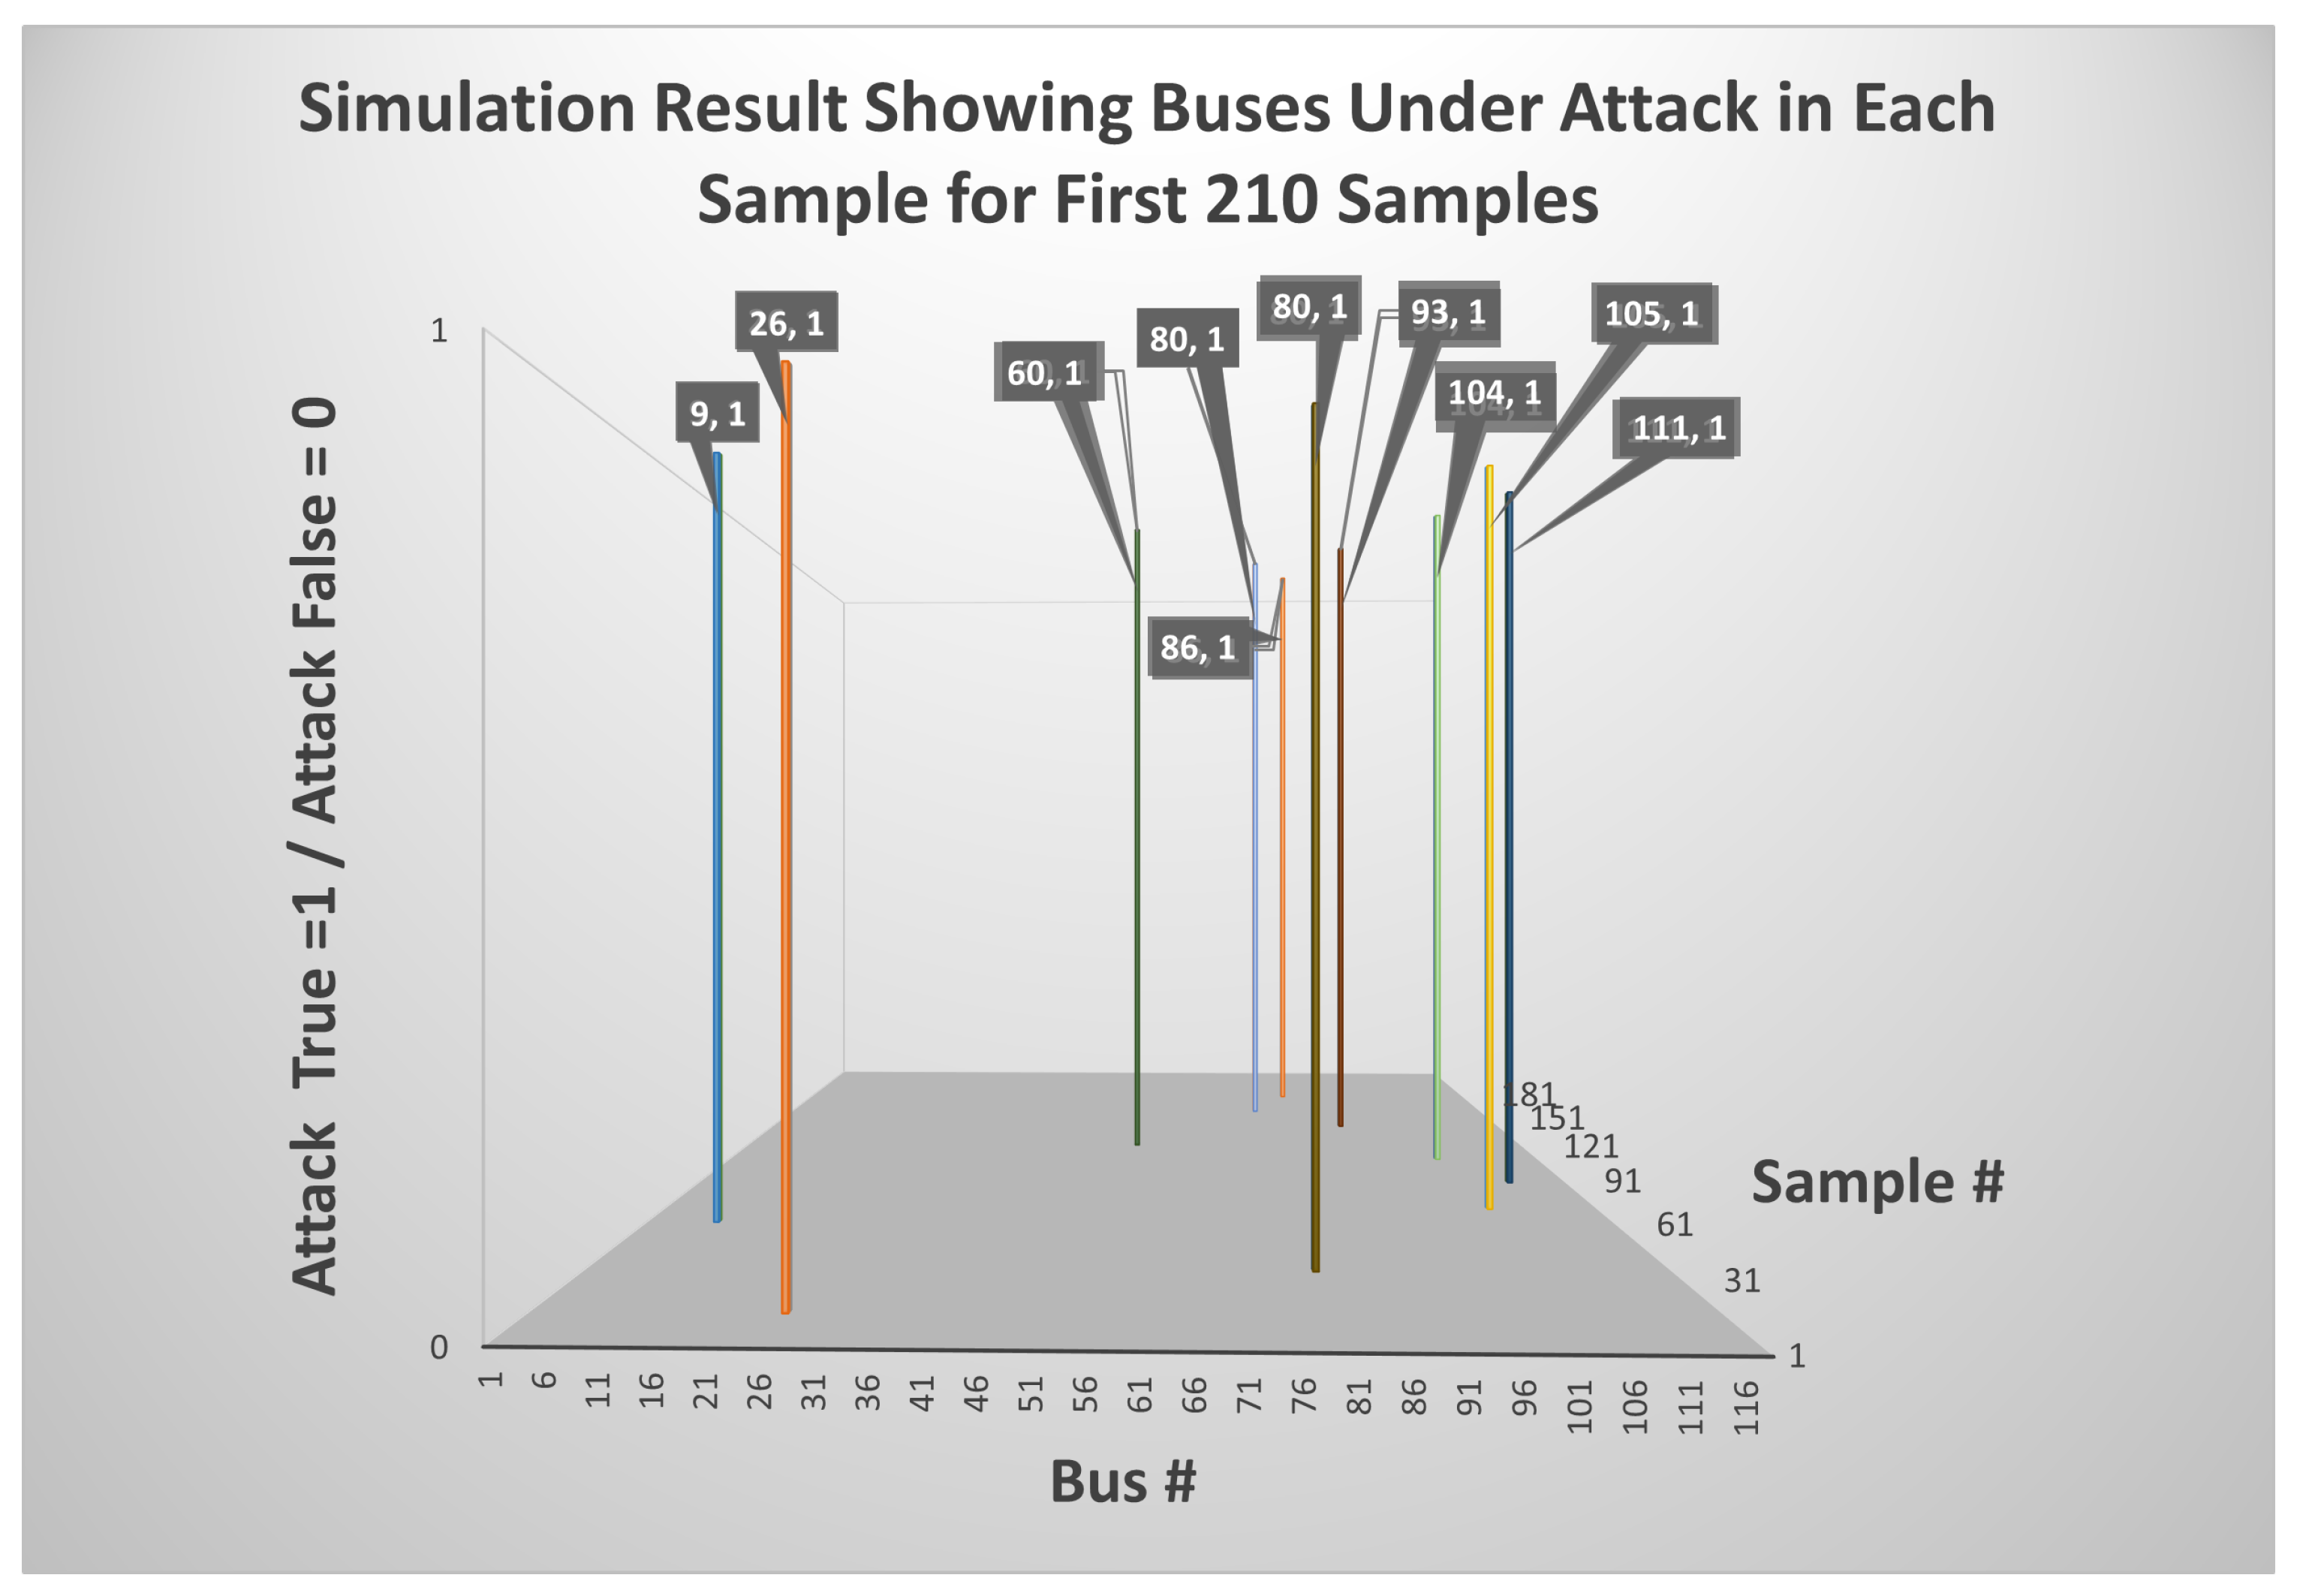
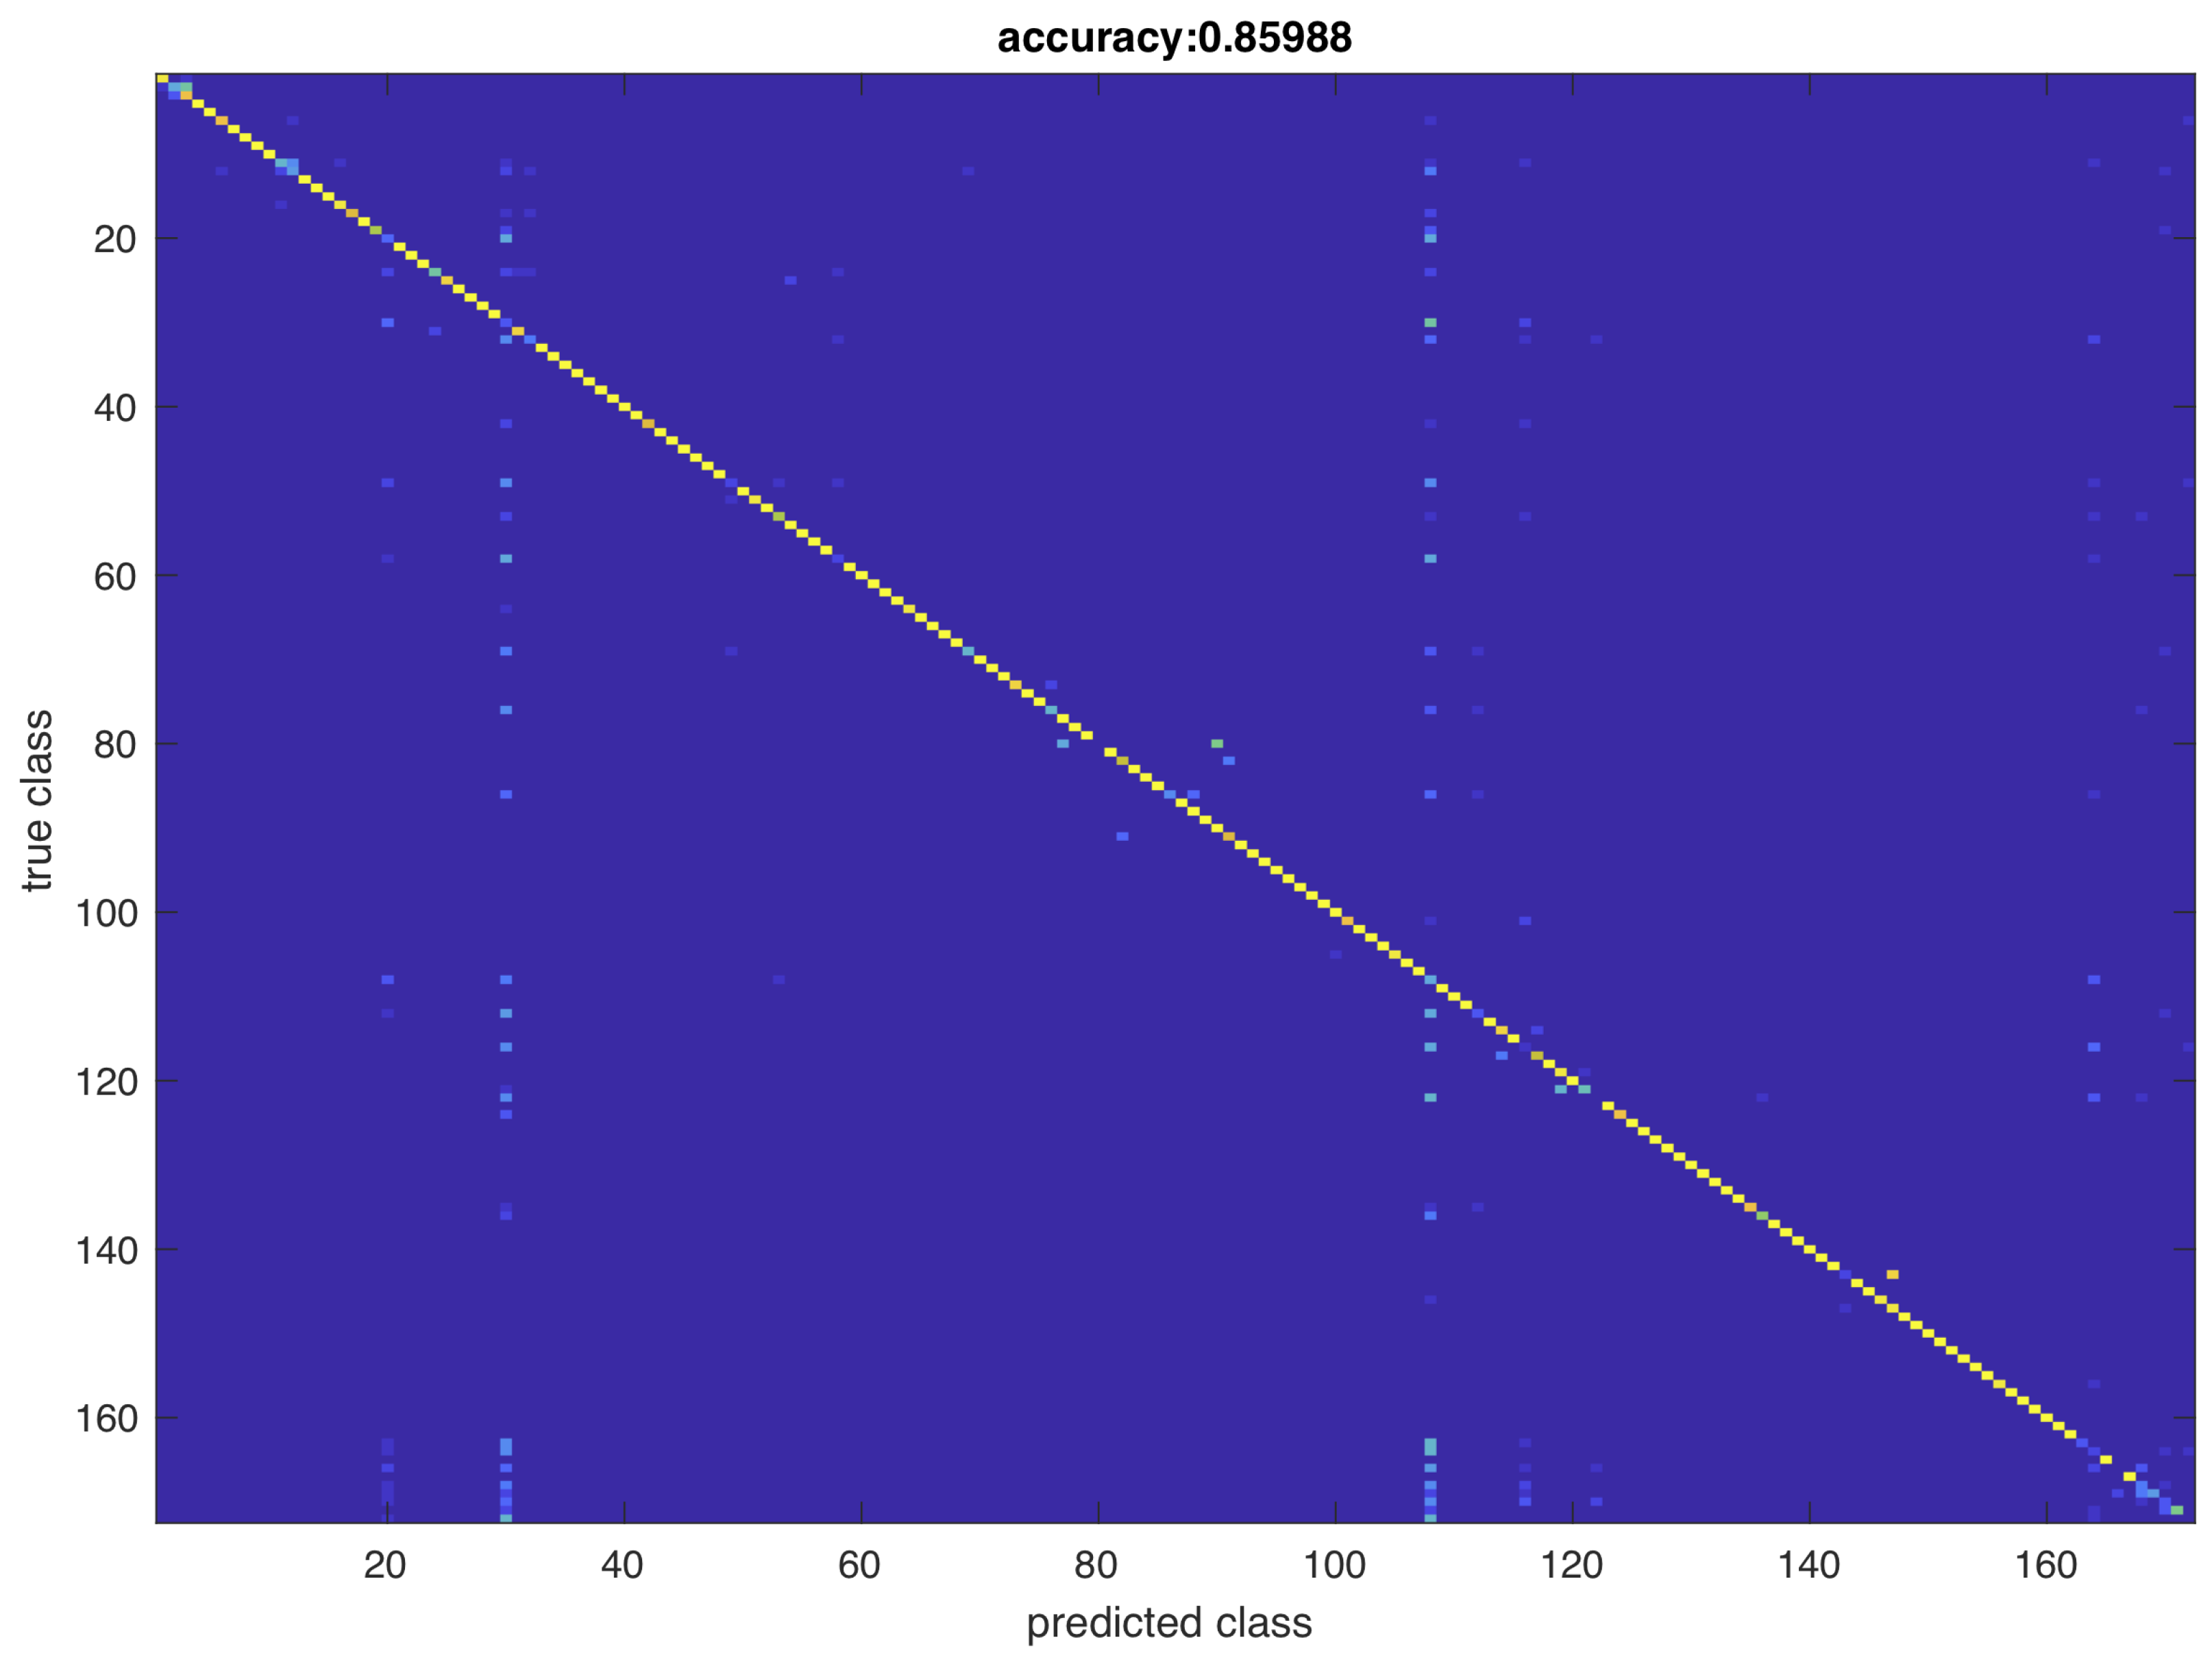
The KNN (k Nearest Neighbors) algorithm is known as a non-parametric supervised learning classifier. This algorithm is typically used as a classification algorithm in Machine Learning. The favor of choosing this technique typically is the ease of interpretation as well as the low computation time. The main idea of the KNN algorithm is that most similar samples are clustered and grouped into the same class. Classification of a new sample in KNN starts by finding k nearest neighbors of the new sample in the training dataset, and then the new sample is classified to the major class in the k nearest neighbors.
The Cross-Layer Ensemble CorrDet with Adaptive Statistics (CECD-AS) algorithm proposed iteAllen2022Starke is utilized as the cyber threat detection technique in this paper and is used in conjunction with polling and synchronization steps to make it work for a real-time system. The CECD-AS algorithm combines data from measurement collection devices in SG and communication networks in real-time to detect any anomalous behavior caused due to cyber attacks such as FDI, DoS, or MITM. The power grid and communication layers generate measurement and network performance values every 4 s respectively and save them in corresponding CSV files. The data acquisition component in the ML layer is equipped with a polling module that polls for data every 2 s and checks if the CSV files are updated with any new data. If the CSV files are updated, then the data acquisition component collects newly added data samples along with index numbers and time stamps. The index numbers and timestamp values of data samples incoming from the communication layer and power grid layer are matched to synchronize and combine data as needed for the CECD-AS algorithm. The CECD-AS algorithm creates and updates statistical models for different regions of the SG using Woodbury Matrix Identities, anomaly scores using Mahalanobis distance measures, and updates adaptive thresholds for different regions based on the equations provided [4,6].

4. Case Study

We built a 691 × 10,000 matrix in the form of a CSV file to create our dataset. Each row represents a moment in time for the respective measurements, while each column indicates a measurement point in the grid. A sample of measurements for the full grid is considered one row of data. Mininet takes around 4 s to create one data point, or 45 min for a given network sample, or row of data. This creates a temporal constraint because our ML model requires 10,000 rows of data. We use SimComponent, as previously stated, to reduce the time spent obtaining network data. In comparison, SimComponent generates the data required for one data sample in roughly 0.80 s, which is substantially quicker than Mininet, allowing the completion of the necessary dataset to acquire the results for the CECD-AS method, as shown in Table 1.
CBench [36], a tool for benchmarking Openflow controllers, is used to test the SDN architecture. We can calculate the maximum throughput, or how much data was sent from a source at any particular moment, using CBench. CBench emulates the N amount of OpenFlow switches set by the researchers and connects it to the controller. Then, it emulates traffic and calculates and records the throughput. In the cluster, we test each ONOS controller individually to establish the maximum throughput for 45 open vswitches (15 switches for each controller). We ran this test again for the single POX controller for all 45 open vswitches at once and documented the results. Figure 11 shows the results of our controller benchmarking test. The ONOS cluster had an average throughput of 533.121 flows/ms, whereas the POX controller had a flow rate of 50.267 flows/ms, which is more than a tenfold improvement. Our tests revealed that a distributed controller design not only removes a single point of failure but also improves network and resource management throughput. By spreading the network workload, the ONOS cluster can endure the rigors of the smart grid better than a single controller.
For parameter attack in the lines of power grid used by State Estimator, each line is attacked to form classes for classification. In the system under study, we have 117 lines, which are transformed into 117 classes in the KNN algorithm. For identifying which line of the power grid is being attacked, the KNN algorithm is implemented. The dataset is split into training and testing. For the training dataset, each line is attacked with false data injection into its parameter. The classification accuracy of the presented KNN algorithm is illustrated in Figure 12.
To validate the cyber threat detection framework, IEEE 118 bus system is selected as the power grid under study. The power grid is simulated such that every 4 s a set of measurements is sent to the cloud where data is stored and analyzed by SE and ML. Hence, the data in the cloud is updated every 4 s. The data from the smart grid layer and communication are combined in the cloud and then analyzed to detect cyber threats. The detection results of MITM, FDI, DoS, and simultaneous FDI-DoS attacks through the use of the real-time CECD-AS algorithm are presented in Table 1 in terms of accuracy, precision, recall, and F1-score values. In the paper [6] where CECD-AS is presented, its cyber threat detection performance is shown to outperform the state-of-the-art physics-based and machine learning-based techniques. The results in this paper are based on the data and experiments discussed [6]. Table 1 shows that the real-time CECD-AS algorithm performs extremely well for a variety of cyber threats discussed in this paper. The enhancement in the detection is due to the integration (combined) data from communication and power grid that added values to the ECD-AS algorithm. Hence, data from the two layers, i.e., power grid and communication grid, complement each other.

5. Conclusions and Future Work

The design of a Cross-Layerered framework for safeguarding the power grid’s operation from physical component or communication network threats is described in this paper. To address power grid communication, we recommended adopting a distributed three-controller SDN architecture. We can manage our network with increased visibility, control, and responsiveness because of SDN. Moreover, using ONOS clusters eliminates the single point of failure that might occur when using a single controller. We benchmarked our proposed SDN framework against the conventional POX controller to demonstrate the network’s increased performance and load management. SimComponents is used to quickly build and simulate DoS, Man-in-the-Middle (MiTM), and False Data Injection attacks (FDI) attacks. The state estimation is affected by FDI and DoS attacks, and all attacks have an impact on the communication network. To detect the corresponding attack, the state estimator and machine learning examine the consequences of all attacks. Simulink is used to represent the power grid, allowing for real-time simulation. SimComponent, a Python library, is used to simulate a communication network. To detect attacked samples, data from each layer is synced and evaluated using a real-time cross-layered machine learning technique. According to the results of our suggested architecture, a three-controller distributed arrangement outperforms a single controller by a factor of more than ten times the throughput. This allows for a greater flow of data throughout the network while reducing congestion caused by the processing constraints of a single controller. Moreover, our CECD-AS approach outperforms state-of-the-art physics and machine learning-based algorithms in attack classification.
In future work, we would like to extend this framework to include more types of cyber attacks, additional controllers, and P4 [37] and Stratum [38]-enabled switches. There are other cyber attacks we would like to defend against, such as ransomware, botnet, and host impersonation attacks. Furthermore, we would like to build upon our failure-resistant framework by adding additional standby controllers for each of the current controllers to increase protection against our model from unforeseen outages that may be experienced in the field. In addition, we would like to include P4 and Stratum-enabled switches/routers to allow for complete “white box” control of the forwarding devices. This would allow for the control of packet parsing at the forwarding device level to increase QoS in the network. The framework was developed in a real-time simulated environment, making it an ideal starting point for future research on data integrity cyber threats in smart grids.

Author Contributions

Conceptualization, D.A. and N.A.; methodology, D.A. and N.A.; software, D.A., N.A., R.M. and S.B.; validation, D.A., N.A., R.M. and S.B.; formal analysis, D.A., N.A., R.M. and S.B.; investigation, D.A., N.A., R.M. and S.B.; resources, A.B. and J.M.; data curation, A.B., K.N. and J.M.; writing—original draft preparation, D.A., N.A., R.M. and S.B.; writing—review and editing, A.B. and J.M.; visualization, A.B. and J.M.; supervision, A.B. and J.M.; project administration, A.B. and J.M.; funding acquisition, A.B. and J.M. All authors have read and agreed to the published version of the manuscript.

Funding

This work was supported by NSF grant ECCS-1809739.

Institutional Review Board Statement

Not applicable.

Informed Consent Statement

Not applicable.

Conflicts of Interest

The authors declare no conflict of interest.

References

  1. Bretas, A.; Bretas, N.; London, J.; Carvalho, B. Cyber-Physical Power Systems State Estimation; Elsevier: Amsterdam, The Netherlands, 2021; Volume 1. [Google Scholar]
  2. Trevizan, R.D.; Ruben, C.; Nagaraj, K.; Ibukun, L.L.; Starke, A.C.; Bretas, A.S.; McNair, J.; Zare, A. Data-driven Physics-based Solution for False Data Injection Diagnosis in Smart Grids. In Proceedings of the 2019 IEEE Power Energy Society General Meeting (PESGM), Atlanta, GA, USA, 4–8 August 2019; pp. 1–5. [Google Scholar] [CrossRef]
  3. Ruben, C.; Dhulipala, S.; Nagaraj, K.; Zou, S.; Starke, A.; Bretas, A.; Zare, A.; McNair, J. Hybrid data-driven physics model-based framework for enhanced cyber-physical smart grid security. IET Smart Grid 2020, 3, 445–453. [Google Scholar] [CrossRef]
  4. Nagaraj, K.; Zou, S.; Ruben, C.; Dhulipala, S.; Starke, A.; Bretas, A.; Zare, A.; McNair, J. Ensemble CorrDet with adaptive statistics for bad data detection. IET Smart Grid 2020, 3, 572–580. [Google Scholar] [CrossRef]
  5. Nagaraj, K.; Aljohani, N.; Zou, S.; Ruben, C.; Bretas, A.; Zare, A.; McNair, J. State Estimator and Machine Learning Analysis of Residual Differences to Detect and Identify FDI and Parameter Errors in Smart Grids. In Proceedings of the 2020 52nd North American Power Symposium (NAPS), Tempe, AZ, USA, 11–13 April 2021; pp. 1–6. [Google Scholar]
  6. Starke, A.; Nagaraj, K.; Ruben, C.; Aljohani, N.; Zou, S.; Bretas, A.; McNair, J.; Zare, A. Cross-layered distributed data-driven framework for enhanced smart grid cyber-physical security. IET Smart Grid 2022. [Google Scholar] [CrossRef]
  7. Van Rossum, G.; Drake, F. Python 3 Reference Manual; CreateSpace: Scotts Valley, CA, USA, 2009. [Google Scholar]
  8. Berde, P.; Gerola, M.; Hart, J.; Higuchi, Y.; Kobayashi, M.; Koide, T.; Lantz, B.; O’Connor, B.; Radoslavov, P.; Snow, W.; et al. ONOS: Towards an open, distributed SDN OS. In Proceedings of the Third Workshop on Hot Topics in Software Defined Networking, Chicago, IL, USA, 22 August 2014; pp. 1–6. [Google Scholar]
  9. Kaur, S.; Singh, J.; Ghumman, N.S. Network programmability using POX controller. In Proceedings of the ICCCS International Conference on Communication, Computing & Systems, Chennai, India, 20–21 February 2014; Volume 138, p. 70. [Google Scholar]
  10. Sun, S.; Fu, X.; Luo, B.; Du, X. Detecting and mitigating ARP attacks in SDN-based cloud environment. In Proceedings of the IEEE INFOCOM 2020-IEEE Conference on Computer Communications Workshops (INFOCOM WKSHPS), Toronto, ON, Canada, 6–9 July 2020; pp. 659–664. [Google Scholar]
  11. Ghosh, U.; Chatterjee, P.; Shetty, S. A security framework for SDN-enabled smart power grids. In Proceedings of the 2017 IEEE 37th International Conference on Distributed Computing Systems Workshops (ICDCSW), Atlanta, GA, USA, 5–8 June 2017; pp. 113–118. [Google Scholar]
  12. Qureshi, K.N.; Hussain, R.; Jeon, G. A distributed software defined networking model to improve the scalability and quality of services for flexible green energy internet for smart grid systems. Comput. Electr. Eng. 2020, 84, 106634. [Google Scholar] [CrossRef]
  13. Hussain, R.; Bashir, M.U. Model to Improve Scalability and Quality of Services in Software Define Networking. In Proceedings of the 2019 2nd International Conference on Communication, Computing and Digital systems (C-CODE), Islamabad, Pakistan, 6–7 March 2019; pp. 28–33. [Google Scholar]
  14. Bretas, A.; Rossoni, A.; Trevizan, R.; Bretas, N. Distribution networks nontechnical power loss estimation: A hybrid data-driven physics model-based framework. Electr. Power Syst. Res. 2020, 186, 10639. [Google Scholar] [CrossRef]
  15. Bretas, A.S.; Bretas, N.G.; Carvalho, B.E. Further contributions to smart grids cyber-physical security as a malicious data attack: Proof and properties of the parameter error spreading out to the measurements and a relaxed correction model. Int. J. Electr. Power Energy Syst. 2019, 104, 43–51. [Google Scholar] [CrossRef]
  16. Bretas, N.G.; Bretas, A.S. The extension of the Gauss approach for the solution of an overdetermined set of algebraic non linear equations. IEEE Trans. Circuits Syst. II Express Briefs 2018, 65, 1269–1273. [Google Scholar] [CrossRef]
  17. Bretas, N.G.; Bretas, A.S.; Martins, A.C.P. Convergence Property of the Measurement Gross Error Correction in Power System State Estimation, Using Geometrical Background. IEEE Trans. Power Syst. 2013, 28, 3729–3736. [Google Scholar] [CrossRef]
  18. Alvey, B.; Zare, A.; Cook, M.; Ho, D.K.C. Adaptive coherence estimator (ACE) for explosive hazard detection using wideband electromagnetic induction (WEMI). Proc. SPIE 2016, 9823, 58–64. [Google Scholar] [CrossRef] [Green Version]
  19. Kreutz, D.; Ramos, F.M.; Verissimo, P.E.; Rothenberg, C.E.; Azodolmolky, S.; Uhlig, S. Software-defined networking: A comprehensive survey. Proc. IEEE 2014, 103, 14–76. [Google Scholar] [CrossRef] [Green Version]
  20. Kaur, K.; Singh, J.; Ghumman, N.S. Mininet as software defined networking testing platform. In Proceedings of the International Conference on Communication, Computing & Systems (ICCCS), Chennai, India, 20–21 February 2014; pp. 139–142. [Google Scholar]
  21. Mininet/Mininet: Emulator for Rapid Prototyping of Software Defined Networks. Available online: https://github.com/mininet/mininet (accessed on 1 June 2022).
  22. POX Controller Manual Current Documentation. Available online: https://noxrepo.github.io/pox-doc/html/ (accessed on 1 June 2022).
  23. Gude, N.; Koponen, T.; Pettit, J.; Pfaff, B.; Casado, M.; McKeown, N.; Shenker, S. NOX: Towards an operating system for networks. ACM SIGCOMM Comput. Commun. Rev. 2008, 38, 105–110. [Google Scholar] [CrossRef]
  24. Floodlight. Floodlight Sdn Openflow Controller. Available online: https://github.com/floodlight/floodlight (accessed on 1 June 2022).
  25. OpenDaylight: A Linux Foundation Collaborative Project. 2022. Available online: https://www.opendaylight.org/ (accessed on 1 June 2022).
  26. Faucetsdn. Ryu Component-Based Software Defined Networking Framework. Available online: https://ryu-sdn.org/ (accessed on 1 June 2022).
  27. Jain, R.; Routhier, S. Packet trains–Measurements and a new model for computer network traffic. IEEE J. Sel. Areas Commun. 1986, 4, 986–995. [Google Scholar] [CrossRef] [Green Version]
  28. Haviv, M. Queues—A Course in Queueing Theory; The Hebrew University of Jerusalem: Jerusalem, Israel, 2009; 219p. [Google Scholar]
  29. Gao, J.; Chai, S.; Zhang, B.; Xia, Y. Research about DoS attack against ICPS. Sensors 2019, 19, 1542. [Google Scholar] [CrossRef] [PubMed] [Green Version]
  30. Dowling, B.; Hale, B. Secure Messaging Authentication against Active Man-in-the-Middle Attacks. In Proceedings of the 2021 IEEE European Symposium on Security and Privacy (EuroS P), Vienna, Austria, 6–10 September 2021; pp. 54–70. [Google Scholar] [CrossRef]
  31. Aljohani, N.; Bretas, A. A Bi-Level Model for Detecting and Correcting Parameter Cyber-Attacks in Power System State Estimation. Appl. Sci. 2021, 11, 6540. [Google Scholar] [CrossRef]
  32. Zou, T.; Aljohani, N.; Nagaraj, K.; Zou, S.; Ruben, C.; Bretas, A.; Zare, A.; McNair, J. A Network Parameter Database False Data Injection Correction Physics-Based Model: A Machine Learning Synthetic Measurement-Based Approach. Appl. Sci. 2021, 11, 8074. [Google Scholar] [CrossRef]
  33. Bretas, A.S.; Bretas, N.G.; Carvalho, B.; Baeyens, E.; Khargonekar, P.P. Smart grids cyber-physical security as a malicious data attack: An innovation approach. Electr. Power Syst. Res. 2017, 149, 210–219. [Google Scholar] [CrossRef]
  34. Cluster Configuration in Owl (1.14). Available online: https://wiki.onosproject.org/pages/viewpage.action?pageId=28836788#:~:text=The%20Owl%20release%20(1.14)%20features,of%20a%20separate%20Atomix%20cluster (accessed on 1 June 2022).
  35. Openvswitch. Openvswitch/OVS: Open Vswitch. Available online: https://www.openvswitch.org/ (accessed on 1 June 2022).
  36. CBench: An Dedicated OpenFlow Controller Implementation for “Cbench” OpenFlow Controller Benchmark Suite. Available online: https://github.com/trema/cbench (accessed on 1 June 2022).
  37. Programming Protocol-Independent Packet Processors (P4). 2022. Available online: https://opennetworking.org/p4/ (accessed on 1 June 2022).
  38. Stratum—Enabling the Era of Next-Generation SDN. 2022. Available online: https://opennetworking.org/stratum/ (accessed on 1 June 2022).
Figure 1. SDN Architecture.
Applsci 12 06868 g001
Figure 2. Histogram for sink interarrival times.
Applsci 12 06868 g002
Figure 3. 21,600 samples taken for 691 measurements. (a) Statistics measurements for transmission delay. (b) Statistics measurements for Inter-arrival time.
Applsci 12 06868 g003
Figure 4. The 690th measurement for 21,600 samples with normal traffic. (a) Transmission delay for normal traffic. (b) Inter-arrival time for normal traffic.
Applsci 12 06868 g004
Figure 5. The 690th measurement for 21,600 samples with malicious traffic. (a) Transmission delay for malicious traffic. (b) Inter-arrival time for malicious traffic.
Applsci 12 06868 g005
Figure 6. Simulation result showing buses under attack in each sample.
Applsci 12 06868 g006
Figure 7. Proposed framework for cross-layer integration.
Applsci 12 06868 g007
Figure 8. Detection framework.
Applsci 12 06868 g008
Figure 9. Atomix framework [34].
Applsci 12 06868 g009
Figure 10. Proposed distributed three controller.
Applsci 12 06868 g010
Figure 11. Throughput benchmark of controllers.
Applsci 12 06868 g011
Figure 12. Prediction accuracy of KNN for attacks in power grid line parameter.
Applsci 12 06868 g012
Table 1. Performance results for FDI, DoS, and MITM attacks (FDI: False Data Injection attacks, DoS: Denial of Service attacks, MITM: Man In The Middle attacks).
Attack TypeAccuracyPrecisionRecallF1-Score
μ cv ± σ cv μ cv ± σ cv μ cv ± σ cv μ cv ± σ cv
MITM92.48 ± 00.2091.65 ± 00.2986.41 ± 00.2888.91 ± 00.24
FDI99.95 ± 00.0199.46 ± 00.3499.87 ± 00.1399.61 ± 00.17
DoS99.88 ± 00.0799.75 ± 00.0999.80 ± 00.1699.78 ± 00.08
FDI-DoS99.63 ± 00.0898.42 ± 00.2699.95 ± 00.0499.20 ± 00.15
Publisher’s Note: MDPI stays neutral with regard to jurisdictional claims in published maps and institutional affiliations.

