
Deep and Hybrid Learning Technique for Early Detection of Tuberculosis Based on X-ray Images Using Feature Fusion


1
College of Computer and Information Sciences, Prince Sultan University, Riyadh 11586, Saudi Arabia
2
Department of Computer Science & Information Technology, Dr. Babasaheb Ambedkar Marathwada University, Aurangabad 431004, India
*
Author to whom correspondence should be addressed.
Appl. Sci. 2022, 12(14), 7092; https://doi.org/10.3390/app12147092
Submission received: 28 June 2022
/
Revised: 6 July 2022
/
Accepted: 12 July 2022
/
Published: 14 July 2022
(This article belongs to the Special Issue Applications of Radiomics and Deep Learning in Medical Image Analysis)
Abstract
:Tuberculosis (TB) is a fatal disease in developing countries, with the infection spreading through direct contact or the air. Despite its seriousness, the early detection of tuberculosis by means of reliable techniques can save the patients’ lives. A chest X-ray is a recommended screening technique for locating pulmonary abnormalities. However, analyzing the X-ray images to detect abnormalities requires highly experienced radiologists. Therefore, artificial intelligence techniques come into play to help radiologists to perform an accurate diagnosis at the early stages of TB disease. Hence, this study focuses on applying two AI techniques, CNN and ANN. Furthermore, this study proposes two different approaches with two systems each to diagnose tuberculosis from two datasets. The first approach hybridizes two CNN models, which are Res-Net-50 and GoogLeNet techniques. Prior to the classification stage, the approach applies the principal component analysis (PCA) algorithm to reduce the features’ dimensionality, aiming to extract the deep features. Then, the SVM algorithm is used for classifying features with high accuracy. This hybrid approach achieved superior results in diagnosing tuberculosis based on X-ray images from both datasets. In contrast, the second approach applies artificial neural networks (ANN) based on the fused features extracted by ResNet-50 and GoogleNet models and combines them with the features extracted by the gray level co-occurrence matrix (GLCM), discrete wavelet transform (DWT) and local binary pattern (LBP) algorithms. ANN achieved superior results for the two tuberculosis datasets. When using the first dataset, the ANN, with ResNet-50, GLCM, DWT and LBP features, achieved an accuracy of 99.2%, a sensitivity of 99.23%, a specificity of 99.41%, and an AUC of 99.78%. Meanwhile, with the second dataset, ANN, with the features of ResNet-50, GLCM, DWT and LBP, reached an accuracy of 99.8%, a sensitivity of 99.54%, a specificity of 99.68%, and an AUC of 99.82%. Thus, the proposed methods help doctors and radiologists to diagnose tuberculosis early and increase chances of survival.
1. Introduction
Tuberculosis is one of the most contagious and widespread diseases which leads to death, according to the reports by the World Health Organization (WHO). According to a WHO report, in 2019, nearly 11 million people were infected, and 1.5 million died worldwide; more than 9% of infected people have HIV. The incidence of tuberculosis in Yemen went up by 2.08% from 48.0 cases per 100,000 people in 2019 to 49.0 cases per 100,000 people in 2020 [1]. In Saudi Arabia, the estimated incidence of active TB (all forms) is 46 per 100,000 and the incidence of smear-positive TB is 21 cases per 100,000, which gives an annual risk of infection of 0.35% [2]. According to a WHO report, tuberculosis is the second most common infectious disease after COVID-19, and the tenth highest cause of death [3]. Persons with weak immunity, such as people with HIV, diabetes, tobacco users, or malnutrition, are at higher risk.
Tuberculosis is spread by a bacteria called Mycobacterium tuberculosis, which is transmitted from person to person through the air by many methods, such as coughing, spitting, water, and sneezing. Tuberculosis attacks the lungs, which is called pulmonary TB; and attacks other organs such as the spine and bones, which is called extrapulmonary TB. The infected person may have one or more of the following clinical symptoms: fever, weight loss, cough, and night sweats. Such symptoms might be life-threatening if not diagnosed early. Thus, the accurate and early diagnosis of tuberculosis is crucial to prevent its development and control its spread. The accurate diagnosis of tuberculosis requires an accurate and reliable interpretation of the test results. Therefore, WHO recommended using X-rays to detect pulmonary malformations due to their availability, high sensitivity and low cost. As tuberculosis often affects the lungs, and lesions appear, X-ray images show abnormal shades of the white or gray color [4]. Diagnosis based on X-ray images requires extensive experience, is time-consuming, and is prone to human error. Despite the lack of skilled radiologists and limited medical resources, this recommendation was made [5,6]. As a result, through the development of digital imaging systems, computer vision technologies, and artificial intelligence-assisted diagnosis of diseases, such challenges have been addressed. These technologies have been evaluated for biomedical image diagnosis. In the medical field, artificial intelligence techniques are widely used to assist radiologists and physicians in improving their diagnosis decision for different disease types. AI techniques have been applied with many algorithms to increase the accuracy of diagnosis. The main idea of AI techniques is to learn from the input data in order to predict future unseen cases. One of the most widely used AI techniques is machine learning, which relies on extracting the influential features from the medical images to produce efficient and accurate predictions. In addition, deep learning techniques have been applied in many fields, including biomedical imagery [7]. Neural network techniques consist of multiple hidden layers, and each layer has units connected to each other to transmit information. Meanwhile, deep learning techniques consist of many layers with millions of neurons connected by millions of connections [8]. Deep learning techniques are distinguished by their superior ability to diagnose huge datasets and extract deep features with high accuracy. Although many AI-based approaches have been proposed for the diagnosis of tuberculosis, reaching the required accuracy is still the goal of researchers. Hence, this paper aims at proposing an accurate and high-level approach to the diagnosis of tuberculosis based on two datasets by hybridizing different AI techniques. Our ultimate goal is to achieve accurate diagnostic results by extracting features from deep learning models and combining them with features of colour, shape and texture extracted by traditional algorithms.
The main contributions in this work are as follows:
- Improving the images of the two X-ray image datasets and increasing the contrast of the region of interest (ROI).
- Diagnosing TB based on two datasets using a hybrid technique, namely deep feature extraction using deep learning models and classifying them using the SVM algorithm.
- Selecting the most important features through reducing the dimensions of the high features using the PCA algorithm.
- Diagnosing tuberculosis based on the two datasets using fused features extracted by deep learning models and merging them with features extracted by GLCM, DWT and LBP algorithms.
- Developing effective systems to assist physicians and radiologists in making proper diagnoses.
The rest of this paper is organized as follows: a discussion of several relevant previous studies is presented in Section 2. The development of the methodologies and materials used for analyzing and interpreting the X-ray images from the two datasets is presented in Section 3. A summary the experimental results of the proposed approaches is presented in Section 4. A discussion and comparison of the performance of the proposed approaches based on the two tuberculosis datasets are presented in Section 5. The conclusions of this work are presented in Section 6.
2. Related Work
The diagnosis of tuberculosis is one of the hot topics in the literature. Researchers have proposed several approaches with the aim of developing systems with satisfactory diagnosis accuracy. However, researchers and other interested parties continue to strive to reach an appropriate accuracy that may enhance diagnosis decisions. As we mentioned before, what distinguishes our study from other is extracting features from deep learning models and combining them with features of texture, shape and geometry extracted by GLCM, DWT and LBP algorithms and classifying them using hybrid techniques for the accurate and effective diagnosis of tuberculosis. In this part, we will discuss several studies related to the diagnosis of tuberculosis using deep learning.
For instance, Seelwan et al. [9] presented a DCNN model for diagnosing chest X-rays and testing it on another dataset. They concluded that the deep learning models developed based on a training dataset do not have the same performance when applied to another dataset. The advantage of this technology is that it is developed, but the disadvantage is that it is appropriate for one dataset and it cannot be applied to another dataset. Rubinder et al. [10] developed three machine learning algorithms to predict tuberculosis based on a dataset from several hospitals in Punjab, India. The decision tree achieved the best performance for diagnosing tuberculosis, with an accuracy of 95%. This approach’s advantage is that it uses more than one algorithm for classification, but the disadvantage of all of the techniques is that they involve machine learning only. Ram et al. [11] proposed a ResNet model for diagnosing tuberculosis based on chest X-ray images using the features extracted by the Haar and LBP methods. The dataset was augmented by a pipeline based on intuitive features. Zhiheng et al. [12] proposed an SVM algorithm to distinguish pulmonary tuberculosis from lung disease. The algorithm classifies images based on their discriminatory features. The algorithm’s performance indicates that bronchiectasis is useful in discovering two important characteristics; the algorithm achieved an accuracy of 85% and a sensitivity of 88%. This technique’s advantage is that it extracts representative features, but the disadvantage is that it does not achieve satisfactory accuracy. Olfa et al. [13] developed improved SVM algorithms to classify chest X-rays based on texture features extracted by the WT method. A genetic algorithm was applied to select representative features. The selected features were fed to the SVM algorithm for their classification. The advantage of this method is that it applies an algorithm to select the features, but its disadvantage is that the selected features are not tested on more than one classifier. Mustapha et al. [14] developed an EfficientNets model to diagnose tuberculosis based on two detection datasets. Five types of EfficientNets were implemented; efficientNet-b4 achieved the best performance, with an accuracy of 92.33%. The advantage of this approach is the application of several EfficientNets to diagnose tuberculosis, but its disadvantage is that did not reach high accuracy. Chirath et al. [15] presented the deep convolutional networh based on the generative adversarial network, which consists of three different structures to optimize, generate, segment, and classify chest X-ray images. Data augmentation and parameter tuning based on a genetic algorithm have been applied to improve diagnostic results; this method achieved an accuracy of 97.1%. Khin et al. [16] proposed a hybrid algorithm for extracting features from X-ray images of tuberculosis patients. Then, this method segmented lung regions using DeepLabv3 and performed feature extraction using six handcrafted feature extraction methods and nine deep feature extraction models. Particle swarm optimization was applied to select the dominant features from each model. The features were separately fed into the SVM algorithm for their classification, which achieved an accuracy of 92.5%. The advantage of this technique is the application of methods for dividing the estuary regions of the lung and extracting advantages by several algorithms, but the technique’s disadvantage is that is does not reach the required accuracy. Muhammad et al. [17] presented a new system for diagnosing tuberculosis based on two datasets using a combination of deep features extracted using CNN models and handcrafted features extracted using the Gabor filter. The method achieved good results in the diagnosis of tuberculosis. Pasa et al. [18] proposed an improved and simple CNN to solve the problem of overfitting and costly computer resource requirements. CAMs and salinity maps were tested to visualize X-ray images of tuberculosis and analyzed them from the radiological perspective. The disadvantage is that these authors did not develop a model, and instead used a pre-trained CNN model. Seok et al. [19] proposed a CNN model for tuberculosis detection based on the comparison of a CNN’s performance based on images (I-CNN) with that of a CNN using demographic variables (D-CNN). Both models were trained on 1000 images of chest patients. Features were extracted using six CNN models with demographic variables such as age, height, weight and gender. The advantage of this approach is that they use demographic variables along with the features extracted by deep learning models. KHAIRUL et al. [20] presented a method for improving the X-ray images of tuberculosis by depicting local, general, and important features. Three algorithms were applied to enhance the X-ray images and fed images to the EfficientNet and ResNet models, which reached an accuracy of 84.8% and 89.92%, respectively. The model’s advantages include that the images are improved to show general and local features, but the model did not achieve satisfactory accuracy in diagnosing tuberculosis. Muhammad et al. [21] presented three CNN models to diagnose tuberculosis based on a dataset of tuberculosis patients by extracting deep features. XGBoost was applied to classify the images, and the DenseNet201-XGBoost model achieved the best results compared to the other two models. Linh et al. [22] designed a framework based on three CNN models as classification engines—modified hybrid networks, EfficientNet and vision transformer—for classifying X-ray images of tuberculosis. The systems framework achieved the best accuracy of 97.72%. Chithra et al. [23] proposed an effective method for diagnosing tuberculosis using the FC-SVNN model. Colors were converted from RGB to LUV space, the lesion area was segmented by adaptive thresholding, and the most important features were extracted. The PCA algorithm was applied to reduce the dimensions of the dataset. The method achieved good results with a rate of 93.5%. The advantages of this method include the diversity of techniques used for color conversion, segmentation, extraction and selection features, but it did not reach the required accuracy for diagnosing tuberculosis.
3. Methods and Materials
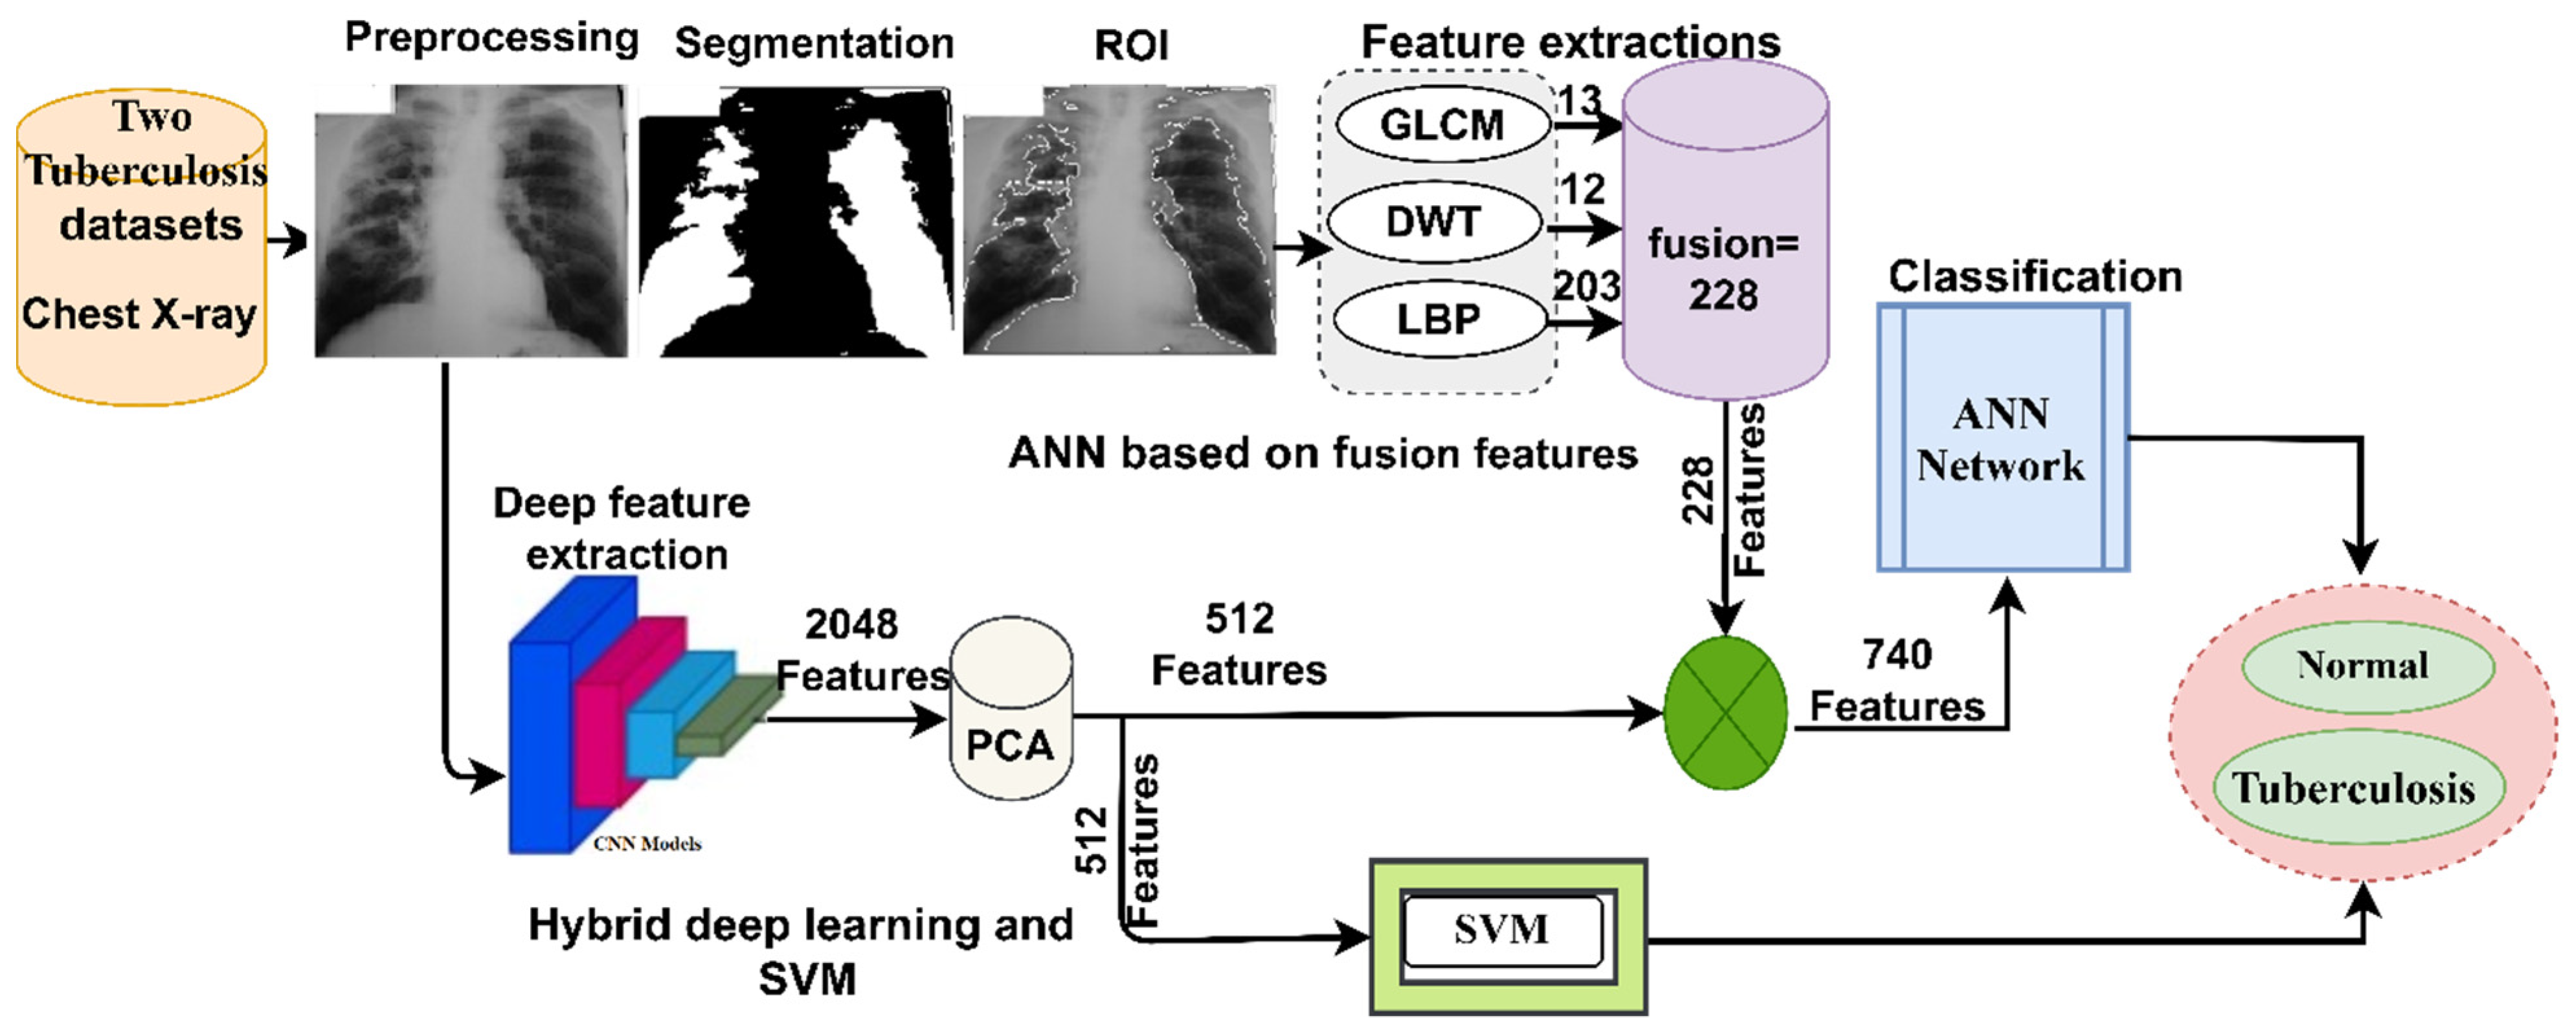
This section presents the methodology and materials used to diagnose the infected cases from two X-ray image datasets for the early detection of tuberculosis, as shown in Figure 1. The two X-ray datasets were optimized to increase contrast and remove noise. The current study proposed two approaches. The first approach proposed a hybrid technique for extracting deep features through two deep learning models and classifying them by means of the SVM algorithm. On the other hand, in the second approach, the features are extracted using two deep learning models and combined with the features of GLCM, DWT and LBP algorithms, and then stored in feature vectors to be fed into an ANN classifier for high-accuracy diagnosis. It is worth noting that the features of deep learning models were extracted with high dimensionality, and so the PCA algorithm was applied to reduce the high dimensionality. Therefore, this figure represents all the methodologies applied in this study to classify X-ray images for the early detection of tuberculosis.
3.1. Datasets
In this study, the proposed systems were evaluated based on two datasets: the first (Shenzhen) dataset and the second dataset (TB Chest Radiography Database).
3.1.1. The First Dataset Description
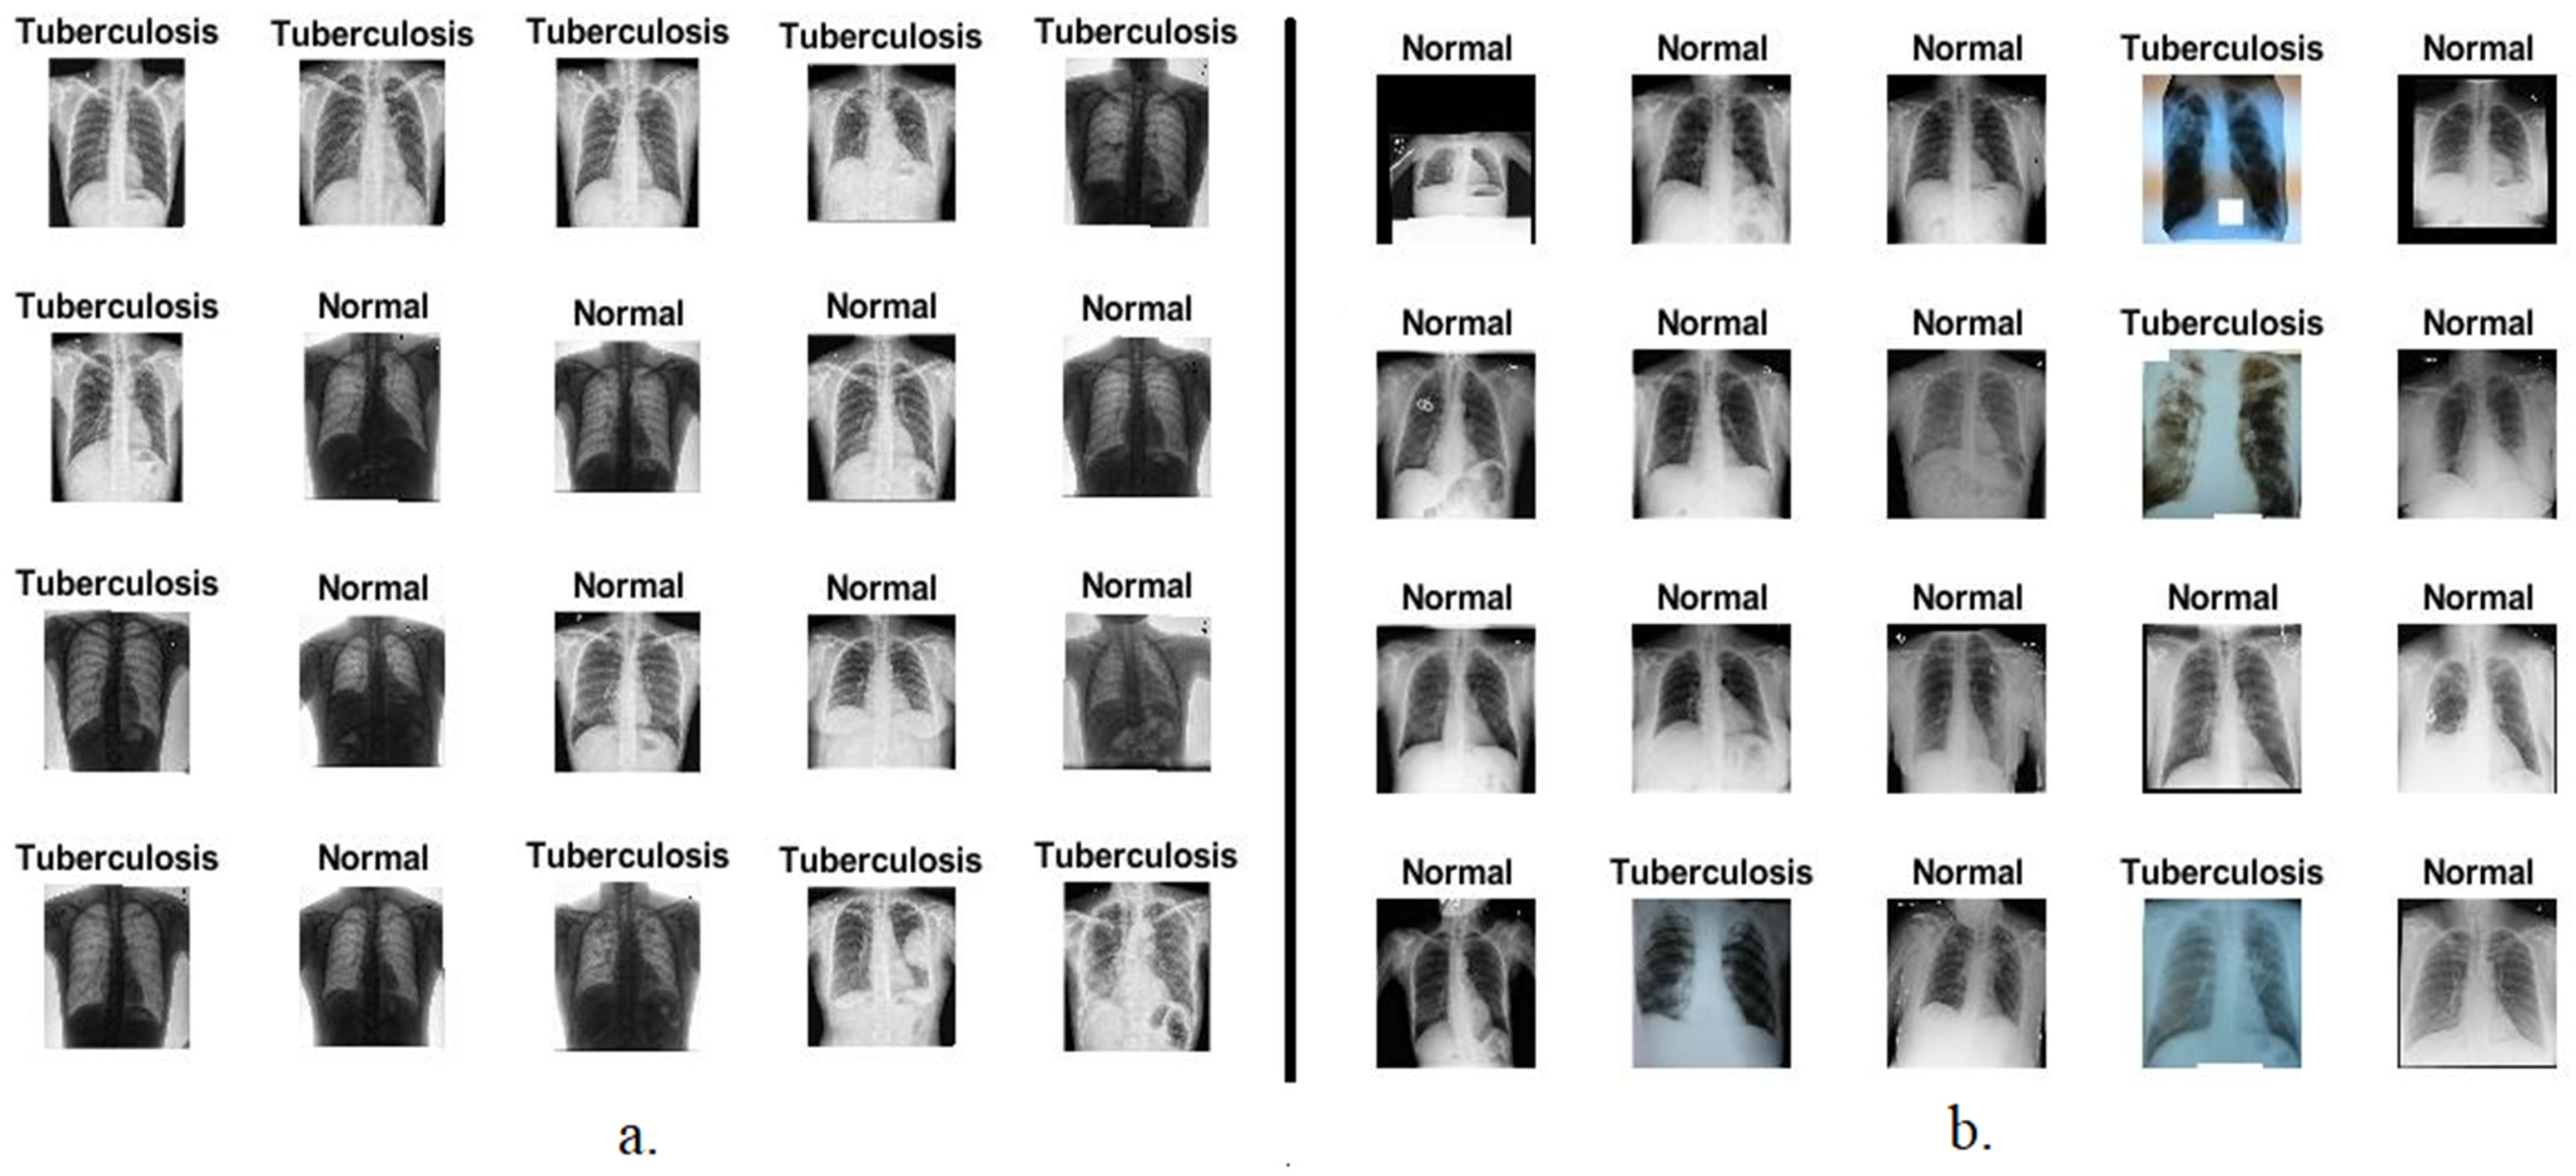
This section describes the first Shenzhen dataset, which was created by the US National Library of Medicine in collaboration with Guangdong Medical College China and Shenzhen No.3 People’s Hospital. Chest X-rays were acquired from outpatient clinics in September 2012 with a Philips DR Digital Diagnose system. The dataset consists of 662 chest X-rays in PNG format. The size of each chest X-ray varies a little, and the average image size is 3000 × 3000 pixels. The dataset was divided into two classes: 326 normal X-rays and 336 tuberculosis X-rays [24]. The dataset also contains 138 X-ray images obtained from the tuberculosis control program in Montgomery County, Maryland, USA. Abnormal X-rays contain distorted areas that appear as blurry spots. Figure 2a depicts a set of samples from the Shenzhen dataset.
3.1.2. The Second Dataset Description
In this section, the second dataset consisting of X-ray data for tuberculosis created by researchers from Qatar University, Doha and Dhaka University Bangladesh in collaboration with a group of physicians at the Hamad Medical Corporation is described. The dataset was collected from many sources as follows: the National Library of Medicine (NLM) of the United States, the National Institute of Allergy and Infectious Diseases, the Republic of Belarus and the NIAID website. The dataset consists of 4200 chest X-rays in PNG format, with a resolution of 512 × 512 pixels for each X-ray. The dataset was divided into two classes, 3500 normal X-rays and 700 tuberculosis X-rays [25]. Figure 2b depicts a set of samples from the second dataset of TB X-rays.
3.2. Chest X-rays Enhancement
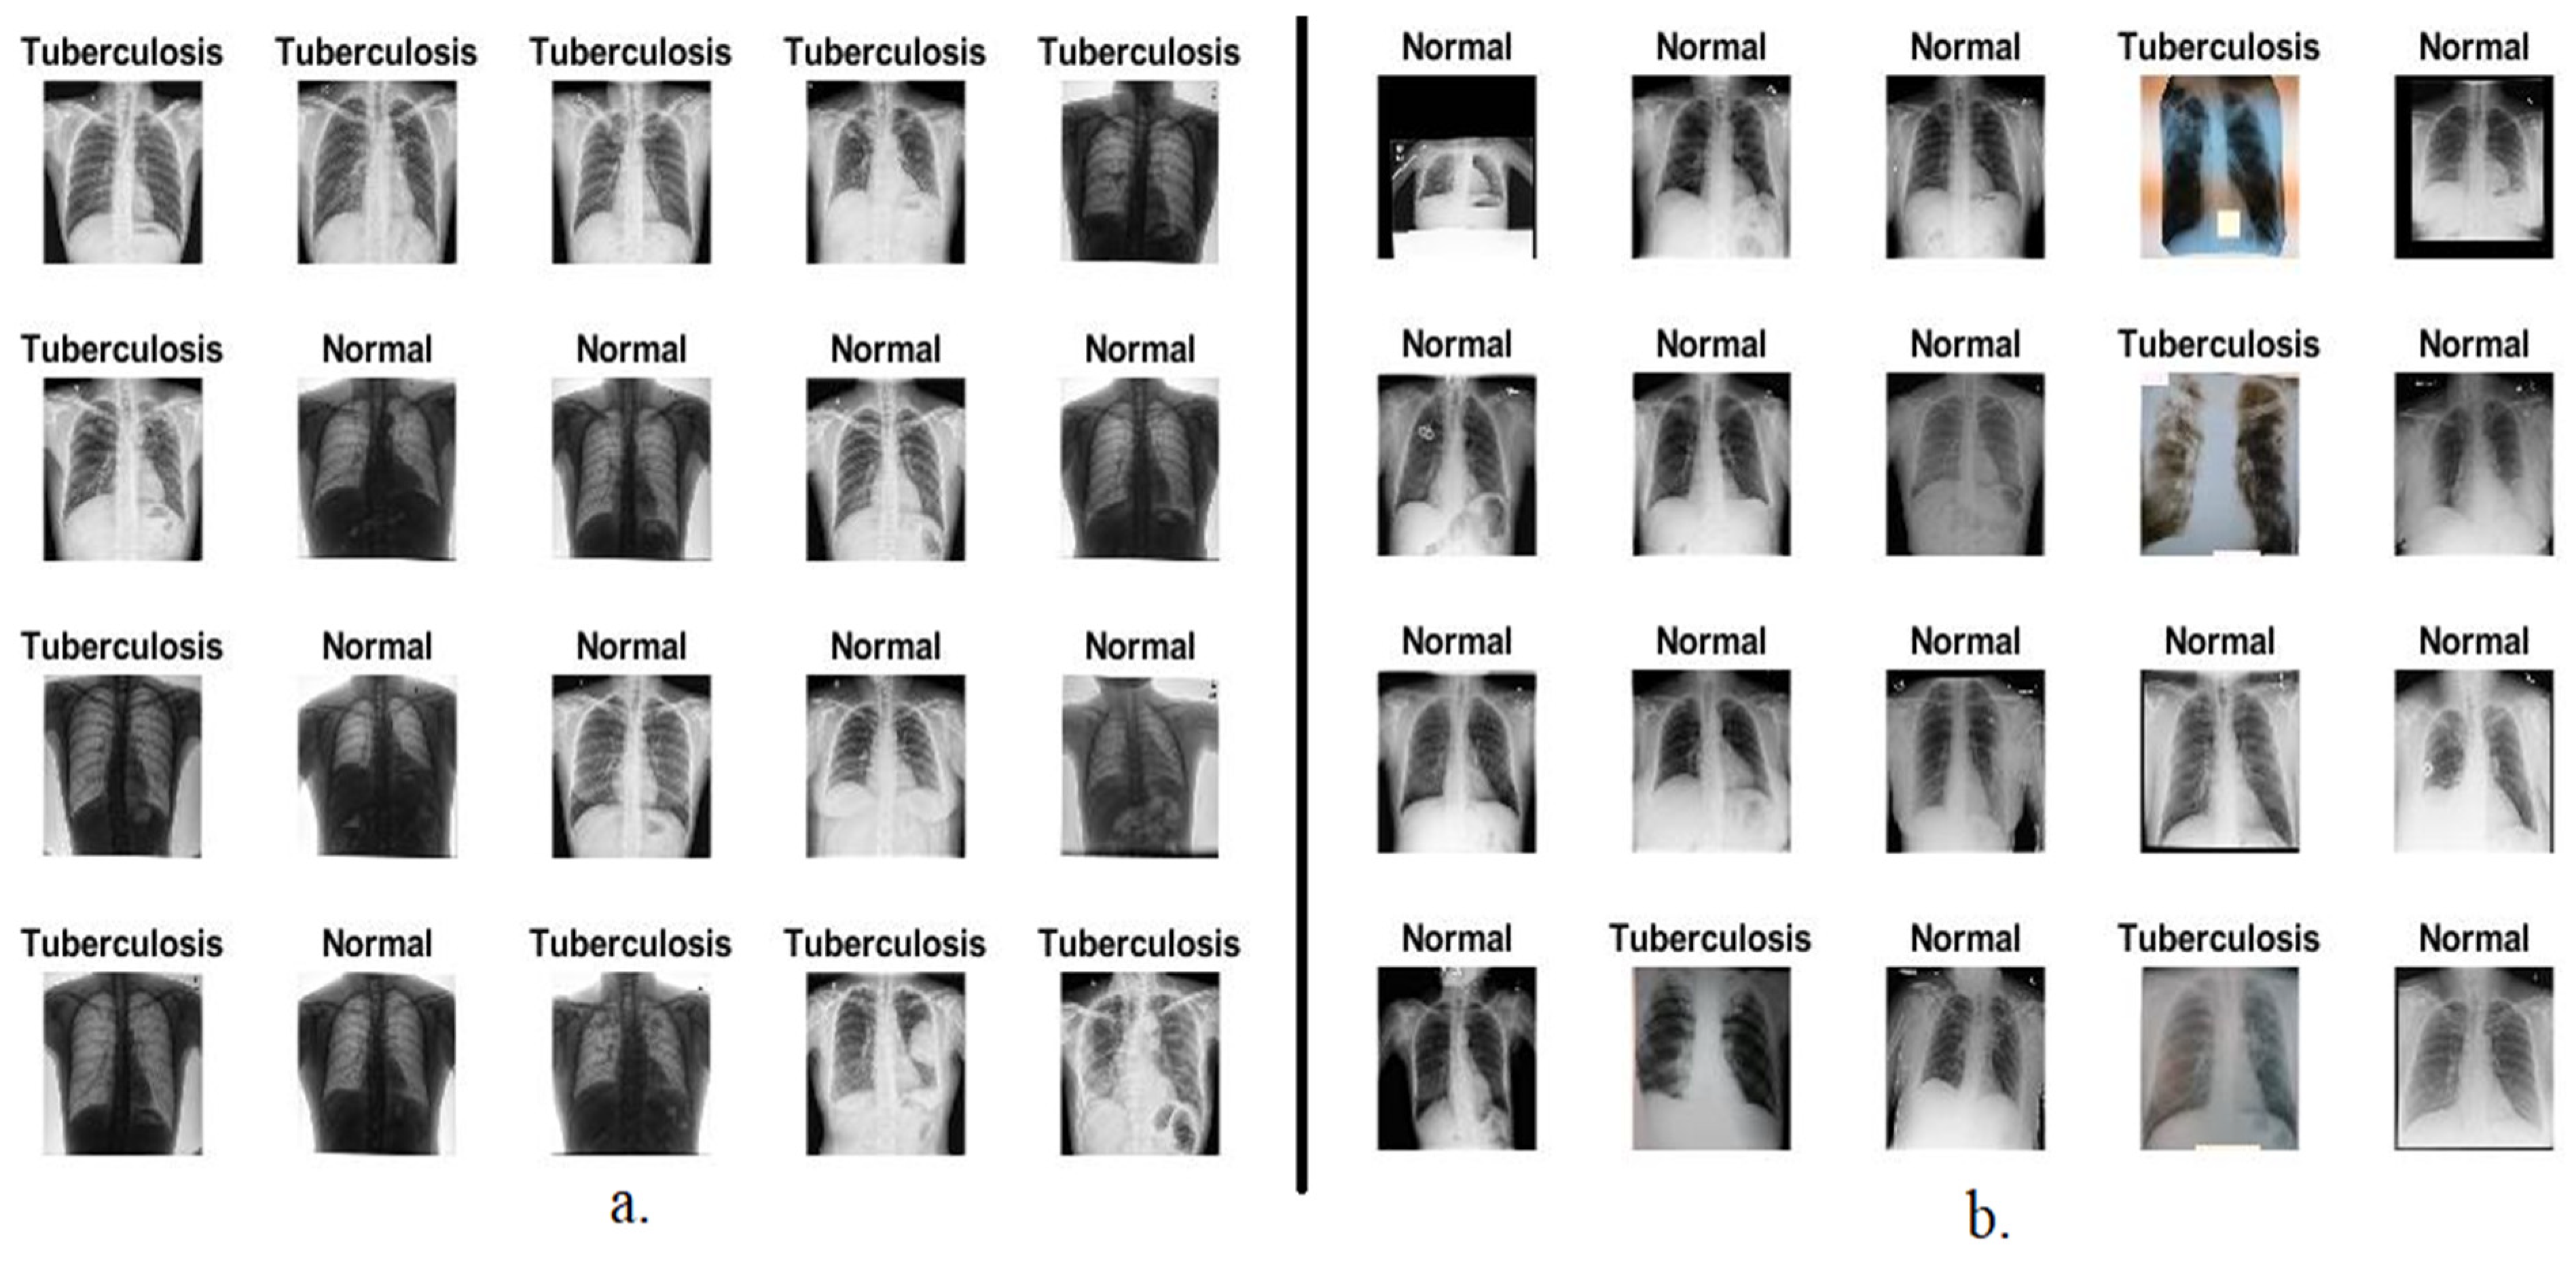
Preprocessing is essential in biomedical imaging tasks. For instance, X-ray images contain artifacts and low contrast due to many reasons, such as acquiring X-ray images from various devices, patient movement while undergoing X-ray imaging, reflections caused by lighting, and differences in image size [26]. Such deficiencies in X-ray images must be addressed before proceeding further. Thus, data preprocessing was applied in this study by adjusting color scaling and the average grayscale for all chest X-rays. Then, a contrast limited adaptive histogram equalization (CLAHE) method was used to improve the contrast of chest X-rays [27]. The CLAHE works on a fair distribution of light values on chest X-rays and effectively improves the visibility of edges and local contrast. Each central pixel is transformed by the derivative of the transformation function based on adjacent pixels. The number of adjacent pixels is adjusted based on the image’s contrast. The image is enhanced, and the contrast is increased when the central (target) pixel is smaller than the neighboring pixel; the contrast of the image is reduced when the central pixel is larger than the adjacent pixels. Thus, the resulting pixels are proportional to the neighboring pixels, and so, improved images are obtained. Figure 3 depicts a set of enhanced images for the two datasets. It is worth noting that the images in Figure 2 are same images in Figure 3 after the optimization process.
3.3. Combination of Deep Learning and SVM
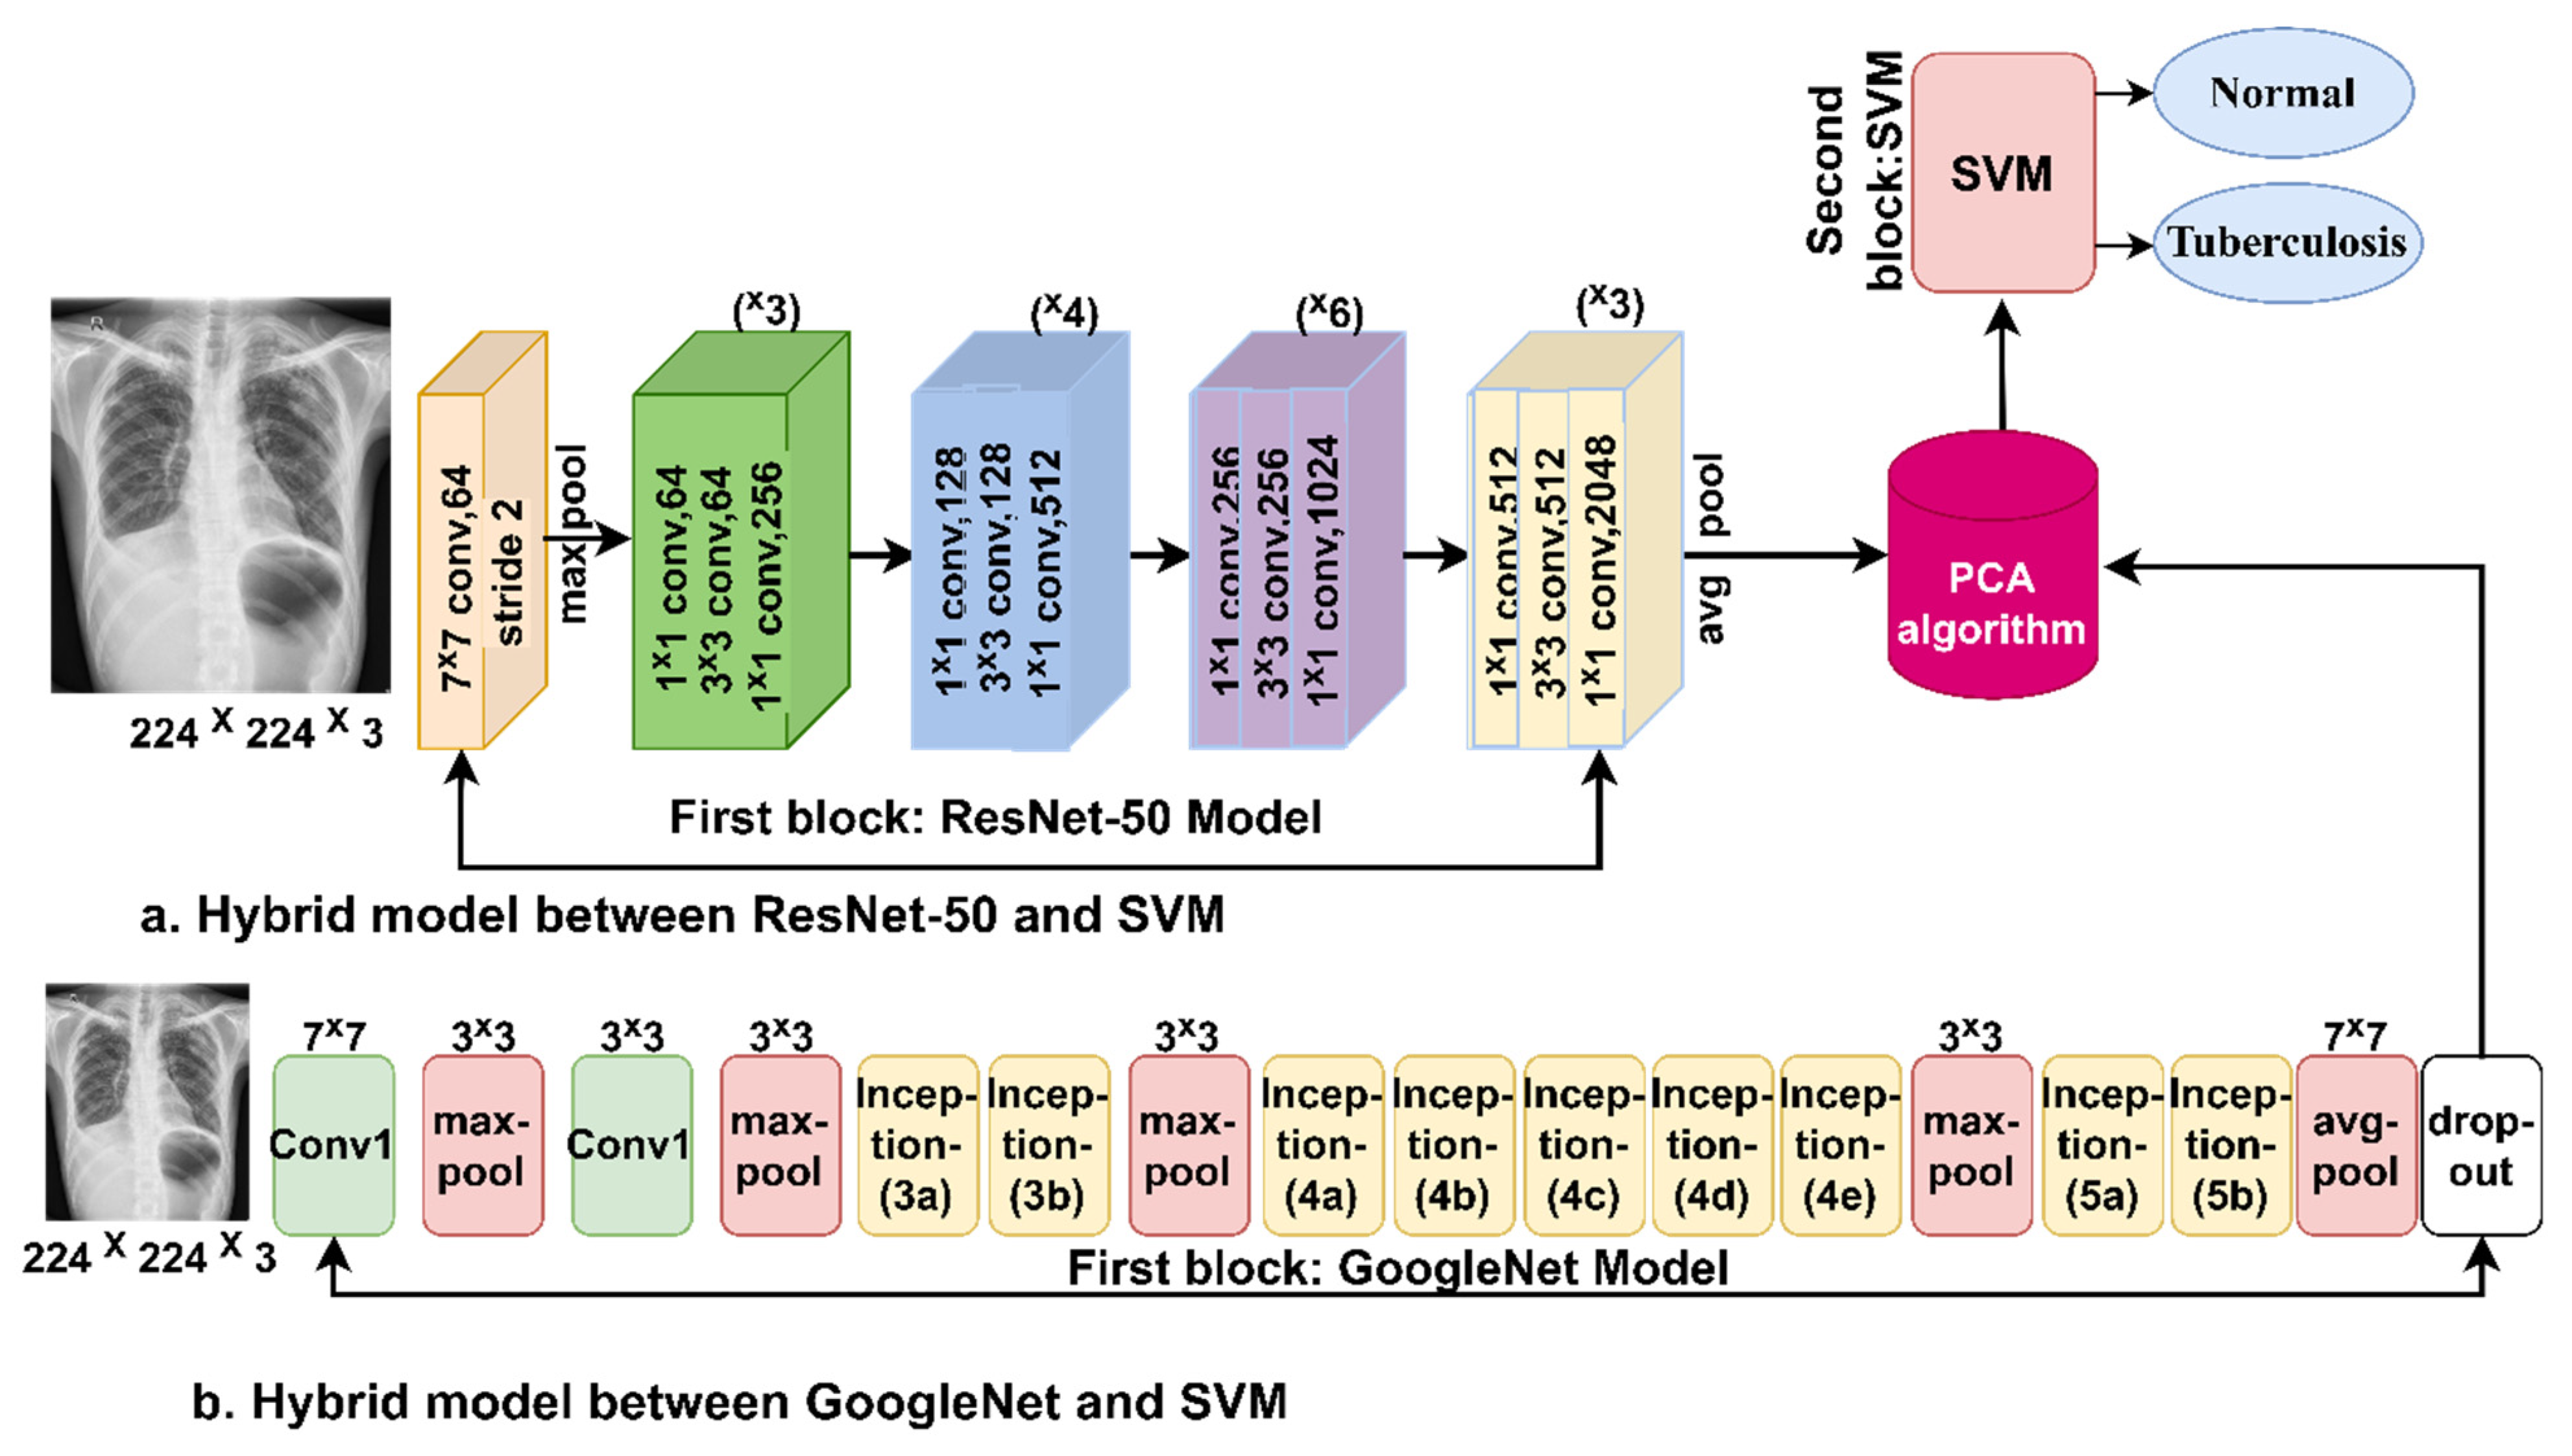
Applying the pre-trained CNN models requires a computer with a high specification and intensive computation capability, as it takes a long time to train the model using the X-ray images from the dataset. Therefore, the hybrid method will address these challenges. Thus, that it can be applied using a computer of medium cost and specifications, and it is fast at training model using the dataset and reaches high accuracy. This section describes how the hybrid method combines CNN models with the SVM algorithm [28]. Enhanced chest X-rays are fed into CNN models that extract the deep features of the X-ray images. Due to the high dimensionality of the deep features, the PCA algorithm is implemented to reduce the dimensions of the deep features and store them in feature vectors. The last layers of the CNN models are removed and replaced with the SVM algorithm. Low-dimensionality deep features are sent to the SVM for classification quickly and efficiently.
3.3.1. Deep Features Extraction
The most important feature of deep learning models is that they have many layers for deep feature extraction. Deep learning techniques extract deep features during the training phase and check their performance when diagnosing new images (deep features) during the testing phase. As deep learning models have many layers for feature extraction, each layer has a specific task for deep feature extraction; for example, the first convolutional layer extracts geometric features, the second layer is for edge detection, the third layer is for color features extraction, the fourth layer is for texture features, and so on [29].
Deep learning models differ in the number of layers they contain. The most important layers in deep learning models that extract feature maps are convolutional layers, followed by auxiliary layers for the further processing of deep features and pooling layers to reduce dimensionality. In the following section, we will discuss each layer in detail.
Convolutional layers: Convolutional layers are the backbone of deep learning models; the name “convolutional layers” derives from convolutional neural networks. Deep learning models are distinguished from one model to another according to the number of convolutional layers. Three main parameters control the efficiency of the convolutional layers’ work: filter size, zero pad, and P-Step. The filter size f(t) controls the number of pixels that will be wrapped around the original image x(t) as in Equation (1) [30]. Zero padding is provided around the edges of the image to preserve the original image in its natural size. P-Step specifies how much the filter will jump over the image at a time. For example, if P-Step = 2, the filter will jump over the image by two steps during the warping process [31].
where y(t) represents the output, f(t) represents the filter and x(t) refers to the input.
Pooling Layer: One of the most important layers in deep learning models that facilitate computational operations. Convolutional layers produce millions of parameters, which is challenging due to high computational costs. Therefore, pooling layers solve this challenge by reducing the dimensionality of high-dimensionality deep features. Deep learning models provide two techniques for dimensionality reduction, the max pooling technique and the average pooling technique [32]. The max pooling technique selects the groups of pixels according to the size of the max pooling filter [33]. It checks the value of each pixel in the selected group and replaces the selected pixels with the max value as in Equation (2). The average pooling technique selects the groups of pixels according to the size of the filter. It works by calculating the average of the selected pixels and replacing all the selected pixels with their average, as shown in Equation (3).
where m and n represent the sizes of the feature matrix, f refers to the filter pixels, p represents the step, and k refers to the feature matrix size.
Auxiliary layers: Deep learning models have auxiliary layers such as the rectified linear units (ReLU) layer, which follows the convolutional layers. The main task of the ReLU layer is to pass the values of the positive features and convert the values of the negative features to zero. The dropout layer prevents overfitting; in this work, this layer was set to 50%, which means that the layer passes 50% of the features each time.
3.3.2. Support Vector Machine
In the hybrid method, the classification layers are removed from deep learning models and replaced by the SVM algorithm. The deep features are extracted by deep learning models; the features are stored in feature vectors and sent to the classification stage by the SVM algorithm [36].
The SVM algorithm is a supervised algorithm that solves many tasks, including classification tasks. SVM distributes the dataset in n dimensions, where n represents the deep features, and each value of the deep features represents a specific coordinate [37]. The algorithm separates the dataset classes by a hyperplane. The algorithm generates many hyperplanes, and each hyperplane has a margin between different classes. Thus, the algorithm chooses the one hyperplane that has the maximum margin between classes. Support vectors define the best hyperplane, and which data points are above or near the hyperplane. There are two types of SVM algorithm, linear and non-linear [38]. The linear type was applied in this study because the dataset is linearly separable. The algorithm created a single hyperplane to separate the dataset into two classes, namely normal and tuberculosis.
Figure 4 describes the methodology of the hybrid method for classifying chest X-rays. It can be seen from the figure that deep learning models are fed with optimized images. Deep learning models for extracting deep features. Because of the high dimensionality of the features, the dimensions were reduced by applying the PCA algorithm and storing them in the feature vectors [39]. The last part of the technique involves classifying feature vectors by the SVM algorithm.
3.4. The ANN Classifier Based on Fusion of Features
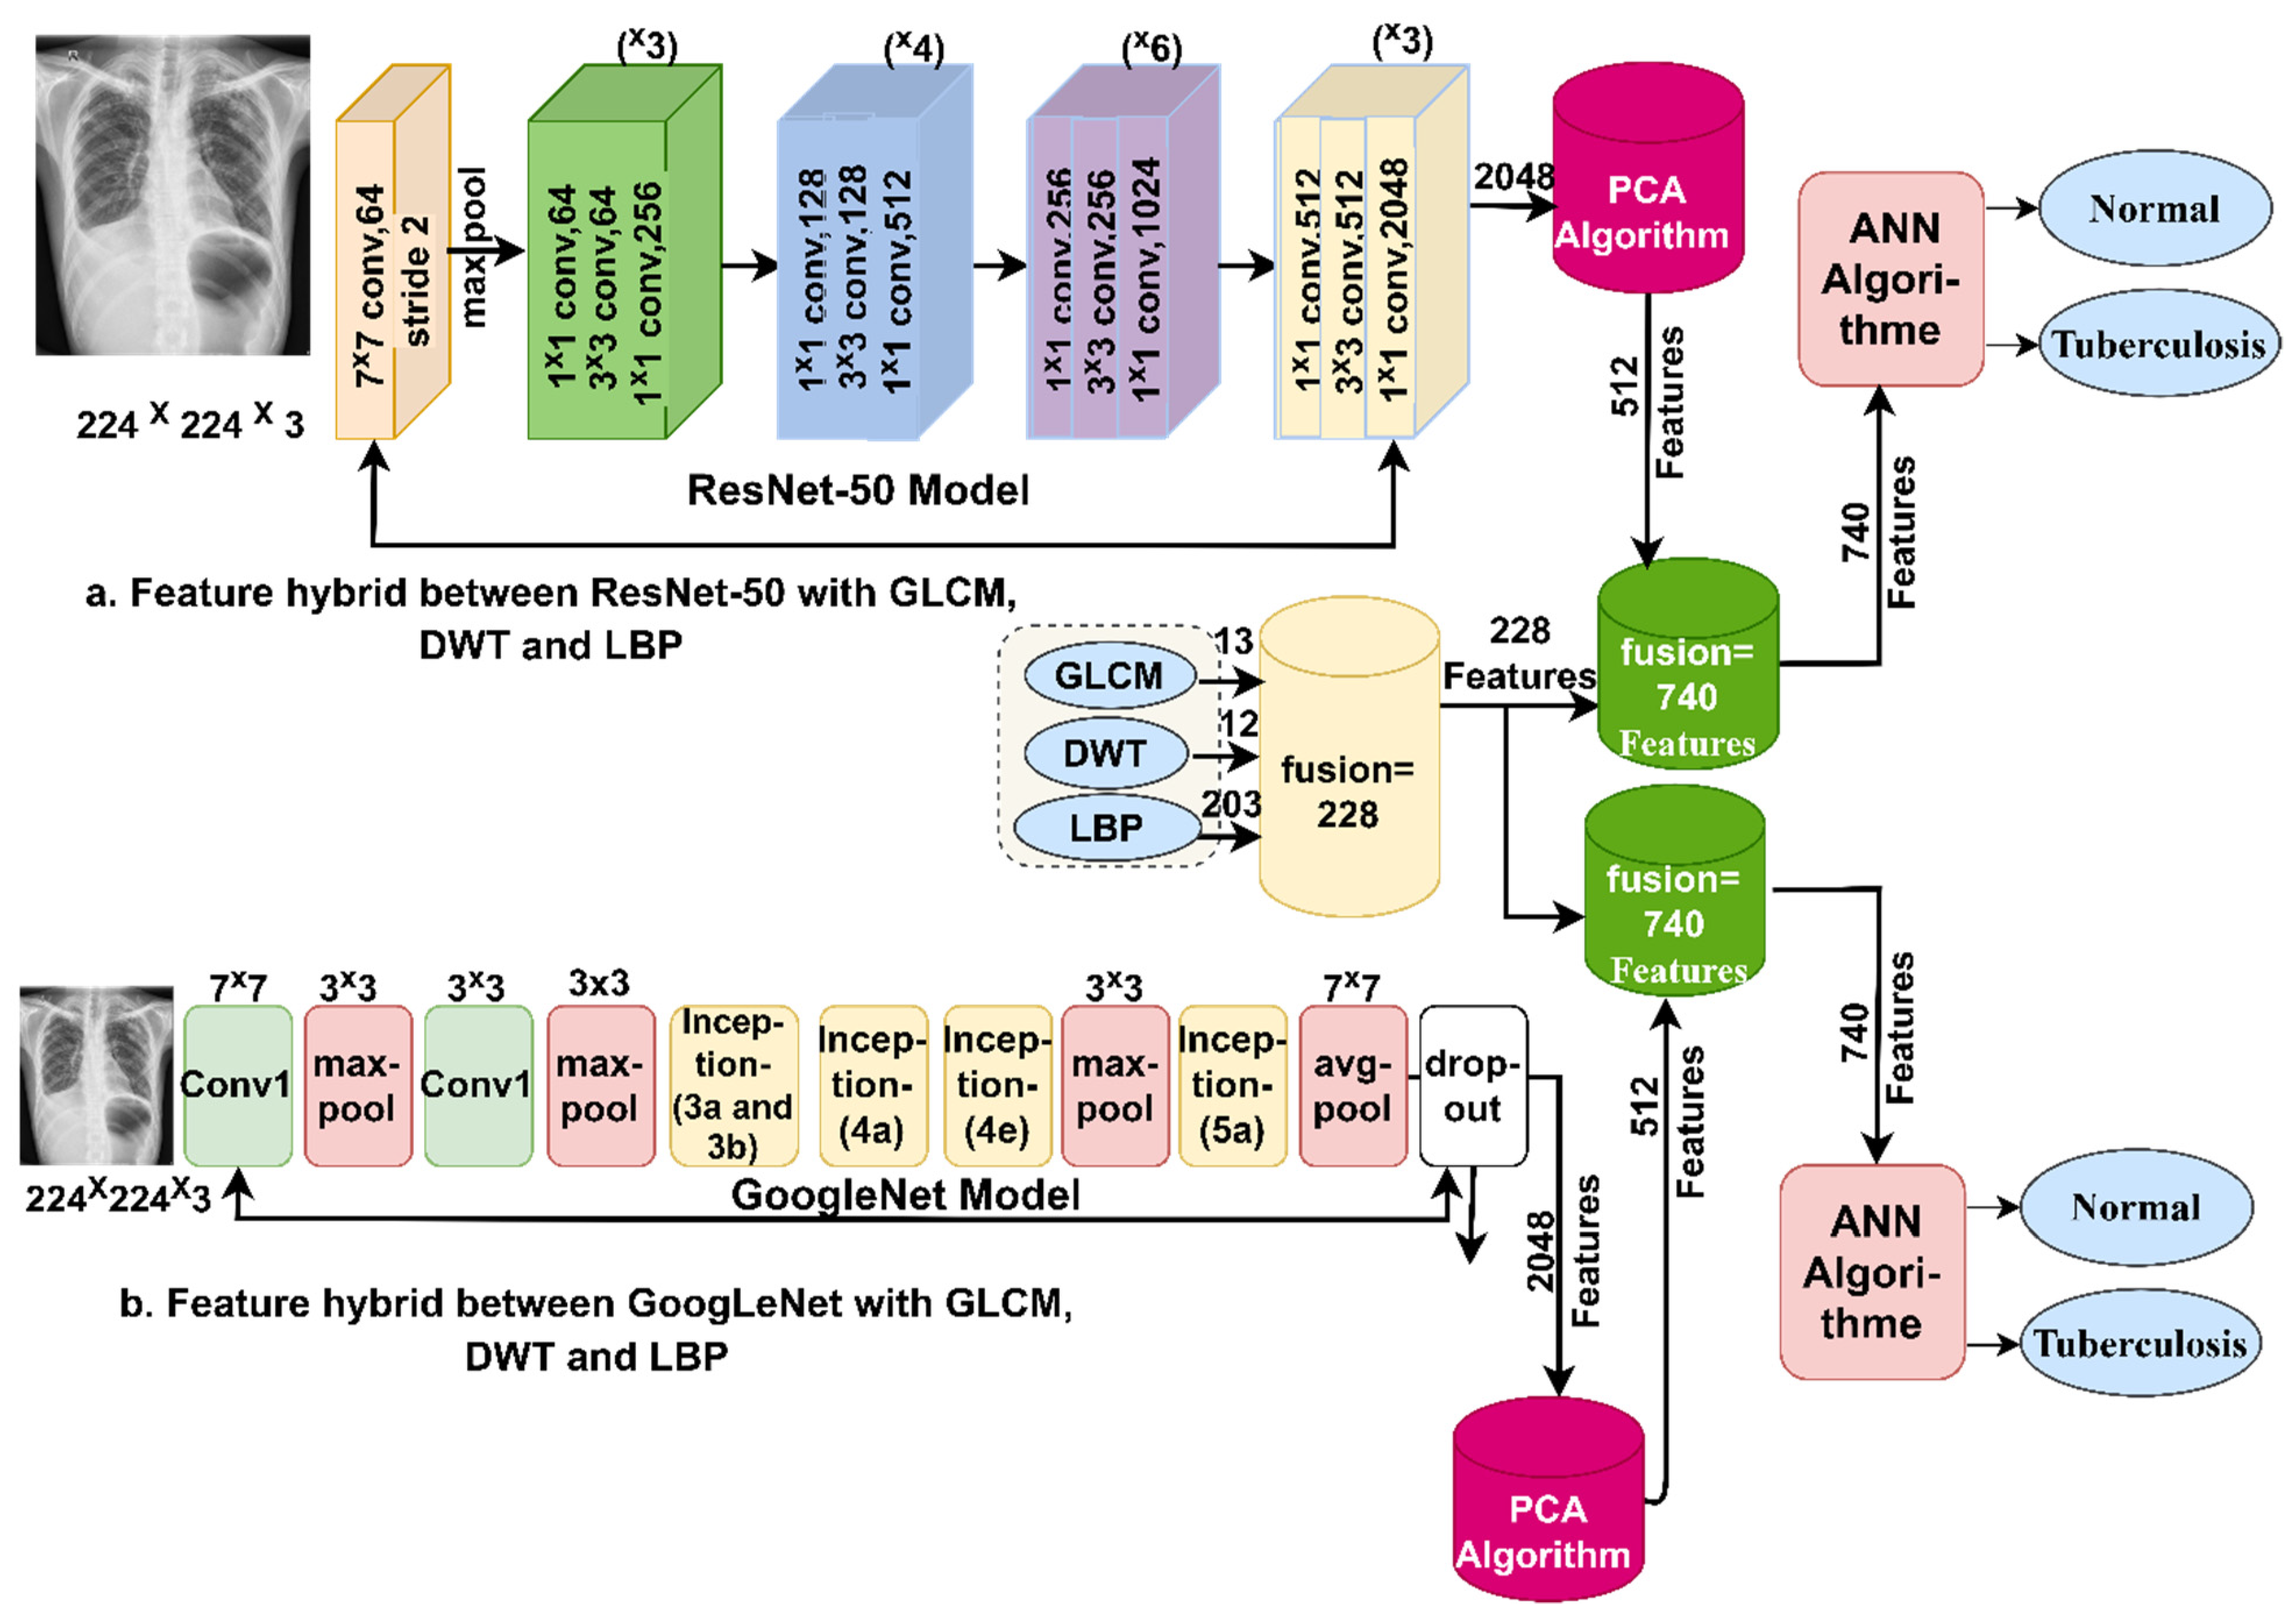
This section presents a novel method for diagnosing tuberculosis using X-ray images by integrating features extracted from deep learning models (ResNet-50 and GoogLeNet) with algorithms (GLCM, DWT, and LBP) and classifying them using an ANN classifier [40]. The steps to implement the proposed method are as follows: first, we feed the enhanced X-ray images into the ResNet-50 and GoogLeNet models. These models extract deep features through convolutional, pooling, and auxiliary layers. ResNet-50 and GoogLeNet produce 2048 deep features and store them in feature vectors with a size of 662 × 2048 for the first dataset and 4200 × 2048 for the second dataset. Second, the PCA algorithm is used to reduce the dimensions of the two datasets while retaining the most important basic features. After PCA is applied, the dataset feature size becomes 662 × 512 for the first dataset and 4200 × 512 for the second dataset. Third, the extraction of texture and shape features by GLCM, DWT, and LBP algorithms is performed.
The GLCM algorithm represents the region of interest in a matrix of gray levels to extract texture features from the gray levels. The algorithm distinguishes the smooth from the coarse regions, because the smooth regions have almost the same pixel values, while the coarse regions have significantly different pixel values. The algorithm produces 13 statistical measures by collecting spatial information [41]. Each measure represents a feature. Thus, spatial information determines the relationship between a pixel and its neighbors according to distance d and angle θ [42].
The DWT algorithm analyzes the input X-ray images as signals using low- and high-pass filters. In this work, a single-level discrete 2-D wavelet transform (dwt2) function was used to analyze the X-ray images of tuberculosis and classify them into approximation and detail coefficients [43].
This function was used because it produces approximation and detail coefficients from which statistical measures such as mean, standard deviation, and variance are extracted from each component. Therefore, these statistical measures are of importance in representing the important features of the images [44]. Low filters produce approximate parameters that extract three statistical features: standard deviation, variance, and mean, while high filters produce three detailed parameters (diagonal, vertical and horizontal), from each of which nine statistical features such as standard deviation, variance and mean are extracted [45]. Thus, the algorithm produces 12 features.
The LBP algorithm extracts the texture characteristics of binary surfaces by analyzing the contrast between local texture pixels. The algorithm is set to 6 × 6 pixels; each chest X-ray is represented in a matrix, and then each pixel in the X-ray is replaced by 35 adjacent pixels according to Equation (4) [46]. The process continues until each pixel in the X-ray is replaced by neighboring pixels. The algorithm compares the gray levels of each central pixel (gc) and the gray levels of neighboring pixels (gp) [47].
where means the grey value of neighboring pixels, P refers to the number of neighboring pixels, R is the radius for neighboring pixels, means the grey value of the goal pixel.
Thereafter, we combine the deep features extracted by ResNet-50 with features extracted by GLCM, DWT, and LBP; similarly, deep features extracted by GoogLeNet are combined with features extracted by GLCM, DWT, and LBP. Thus, after merging, the size of the feature vectors becomes 662 × 740 for the first dataset and 4200 × 740 for the second dataset.
Finally, the feature vectors of the two datasets are fed into the ANN classifier. The input layer receives 740 features as input units. The hidden layers are set to 15 hidden layers. The output layer produces two neurons, with each neuron representing one class of the dataset.
Figure 5 shows the basic structure of the proposed system for diagnosing tuberculosis based on two datasets using an ANN classifier based on integrating the features of deep learning with the features of the GLCM, DWT, and LBP methods.
4. Experimental Results of the Proposed Systems
4.1. Split the Two Datasets
To achieve the aim of this study, the proposed systems in this study were evaluated through chest X-ray images from two datasets. The first dataset (Shenzhen) contains 662 chest X-rays divided into two classes: 326 normal X-rays and 336 tuberculosis X-rays. The second dataset contains 4200 chest X-rays divided into two classes: 3500 normal X-rays and 700 tuberculosis X-rays. The two datasets were divided into 80% for training and validation and 20% for the testing of the proposed systems. Table 1 summarizes the number of X-ray images for the two datasets during all phases.
4.2. Proposed Systems Evaluation Metrics
The proposed systems in this study were evaluated based on two datasets for tuberculosis using the same evaluation scales for all systems. All the proposed systems generated the confusion matrix, which is the gold standard for evaluating the performance of the systems. The confusion matrix contains all of the appropriate dataset samples, denoted as TP and TN, and inappropriately sample, denoted as FP and FN. The performance of the systems was evaluated by means of accuracy, sensitivity, precision, specificity, and AUC, as in Equations (5)–(9). Therefore, the standard equations used to measure the performance of the systems obtain their data through the confusion matrix [48].
where TP refers to X-ray images perfectly categorized as tuberculosis, TN refers to X-ray images perfectly categorized as normal, FP refers to normal X-ray images categorized as tuberculosis, and FN refers to tuberculosis X-ray images categorized as normal.
4.3. Augmentation and Balance of Data
The lack of medical images is one of the limitations of CNN models. This limitation was addressed by a data augmentation technique. Additionally, the unbalanced dataset is one of the challenges, because the accuracy tends towards the majority class [49]. Therefore, this challenge was overcome by applying data augmentation for the minority classes more than for the majority classes [50]. It is noted that the first dataset is almost balanced, and so the limitation of data shortage is addressed by increasing the images by an equal amount for both classes. For the second dataset, it is noted that the dataset needs to be balanced, and we increased the number of X-ray images for the minority classes. The data were artificially augmented from the same dataset by many operations, such as shifting, flipping, rotating in several directions, and others. Table 2 shows the number of artificially increased X-ray images. For the first dataset, the number of images was increased by nine times for each image for both classes. For the second dataset, the number of images was increased by four times for tuberculosis, while the number of images in the normal class was not increased, and the image number remained the same. Thus, the lack of images and the imbalance of the dataset were overcome.
4.4. Results of the Hybrid Systems Approach
This section summarizes the results of hybrid systems consisting of two parts: ResNet-50 and GoogLeNet models for feature extraction. The second part is the SVM algorithm for classifying the features extracted from the first part. The hybrid systems are called ResNet-50 + SVM and GoogLeNet + SVM. What distinguishes this method is its speed in diagnosing the dataset, its implementation on a medium-cost computer, and its high accuracy in diagnosis. The two hybrid systems were evaluated based on the two tuberculosis datasets.
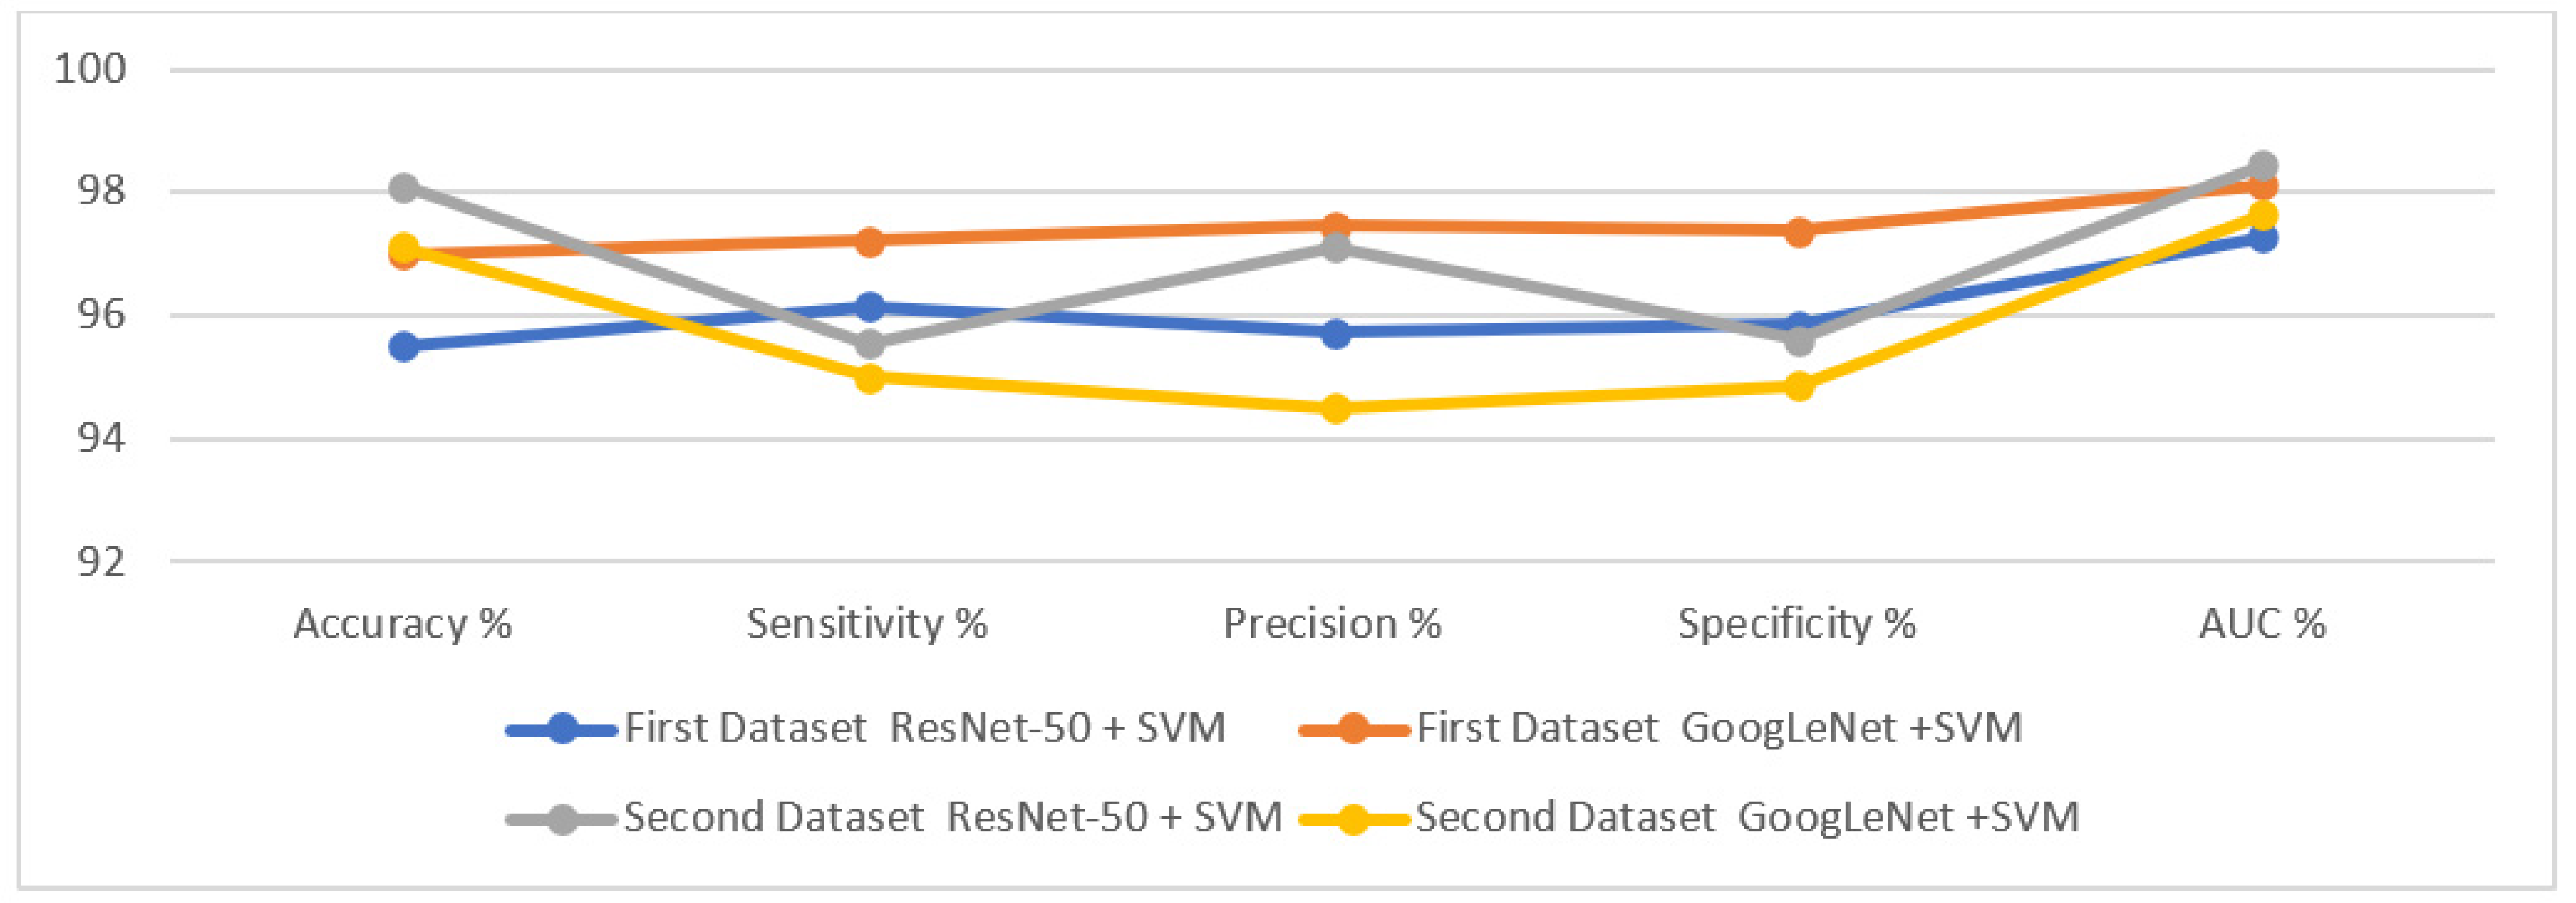
Table 3 summarizes the performance results of the hybrid approaches for diagnosing the two tuberculosis datasets. It is noted that GoogLeNet + SVM achieved better results than ResNet-50 + SVM for the first dataset, while ResNet-50 + SVM performed better than GoogLeNet + SVM for the second dataset. The systems performance results are as follows: first, for the first dataset, ResNet-50 + SVM reached an accuracy of 95.5%, a sensitivity of 96.14%, a precision of 95.72%, a specificity of 95.84%, and an AUC of 97.28%. In comparison, GoogLeNet + SVM achieved an accuracy of 97%, a sensitivity of 97.21%, a precision of 97.45%, a specificity of 97.38%, and AUC of 98.13%. Second, for the second dataset, ResNet-50 + SVM reached an accuracy of 98.1%, a sensitivity of 95.52%, a precision of 97.11%, a specificity of 95.61%, and an AUC of 98.43%. In comparison, GoogLeNet + SVM achieved an accuracy of 97.1%, a sensitivity of 95%, a precision of 94.5%, a specificity of 94.85%, and an AUC of 97.63%.
Figure 6 displays the results of performing the hybrid approaches to classify the two X-ray datasets for the early detection of tuberculosis.
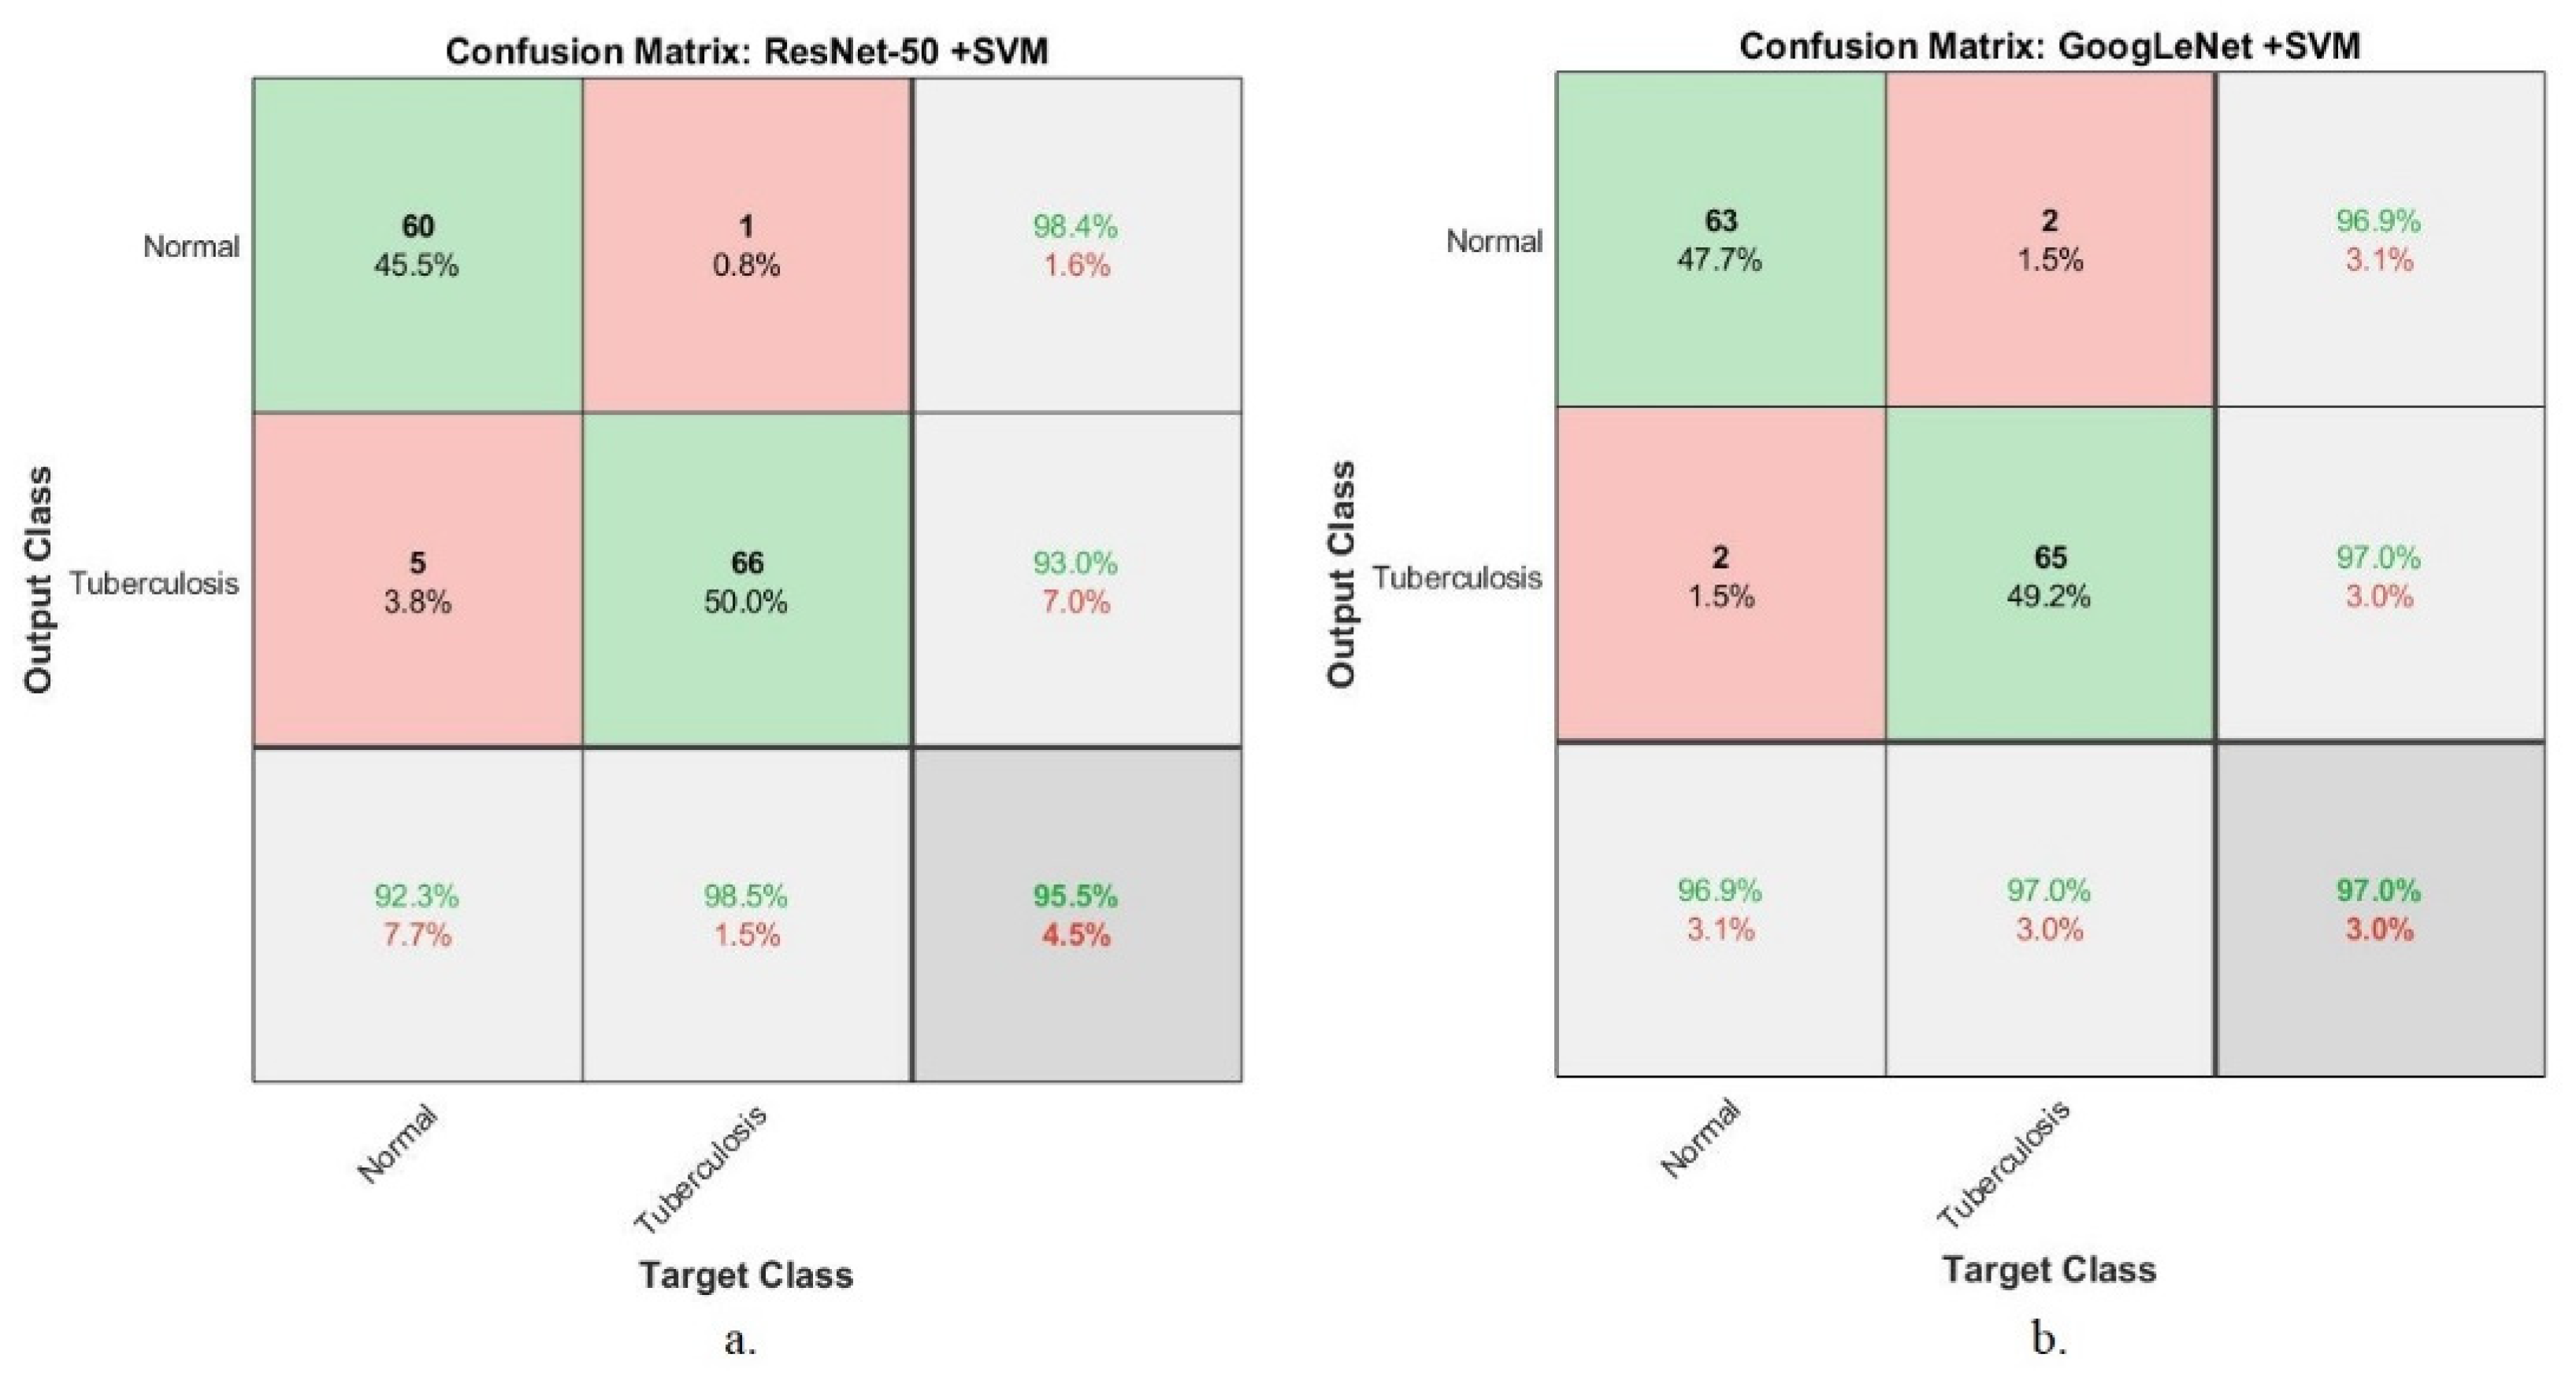
Figure 7 presents the confusion matrix generated using the hybrid approaches (ResNet-50 + SVM and GoogLeNet + SVM) based on the first dataset for tuberculosis diagnosis. The ResNet-50 + SVM system reached an accuracy of 92.3% and 98.5% when classifying normal and tuberculosis classes, respectively. In contrast, GoogLeNet + SVM system achieved an accuracy of 96.9% and 97% when classifying normal and tuberculosis classes, respectively.
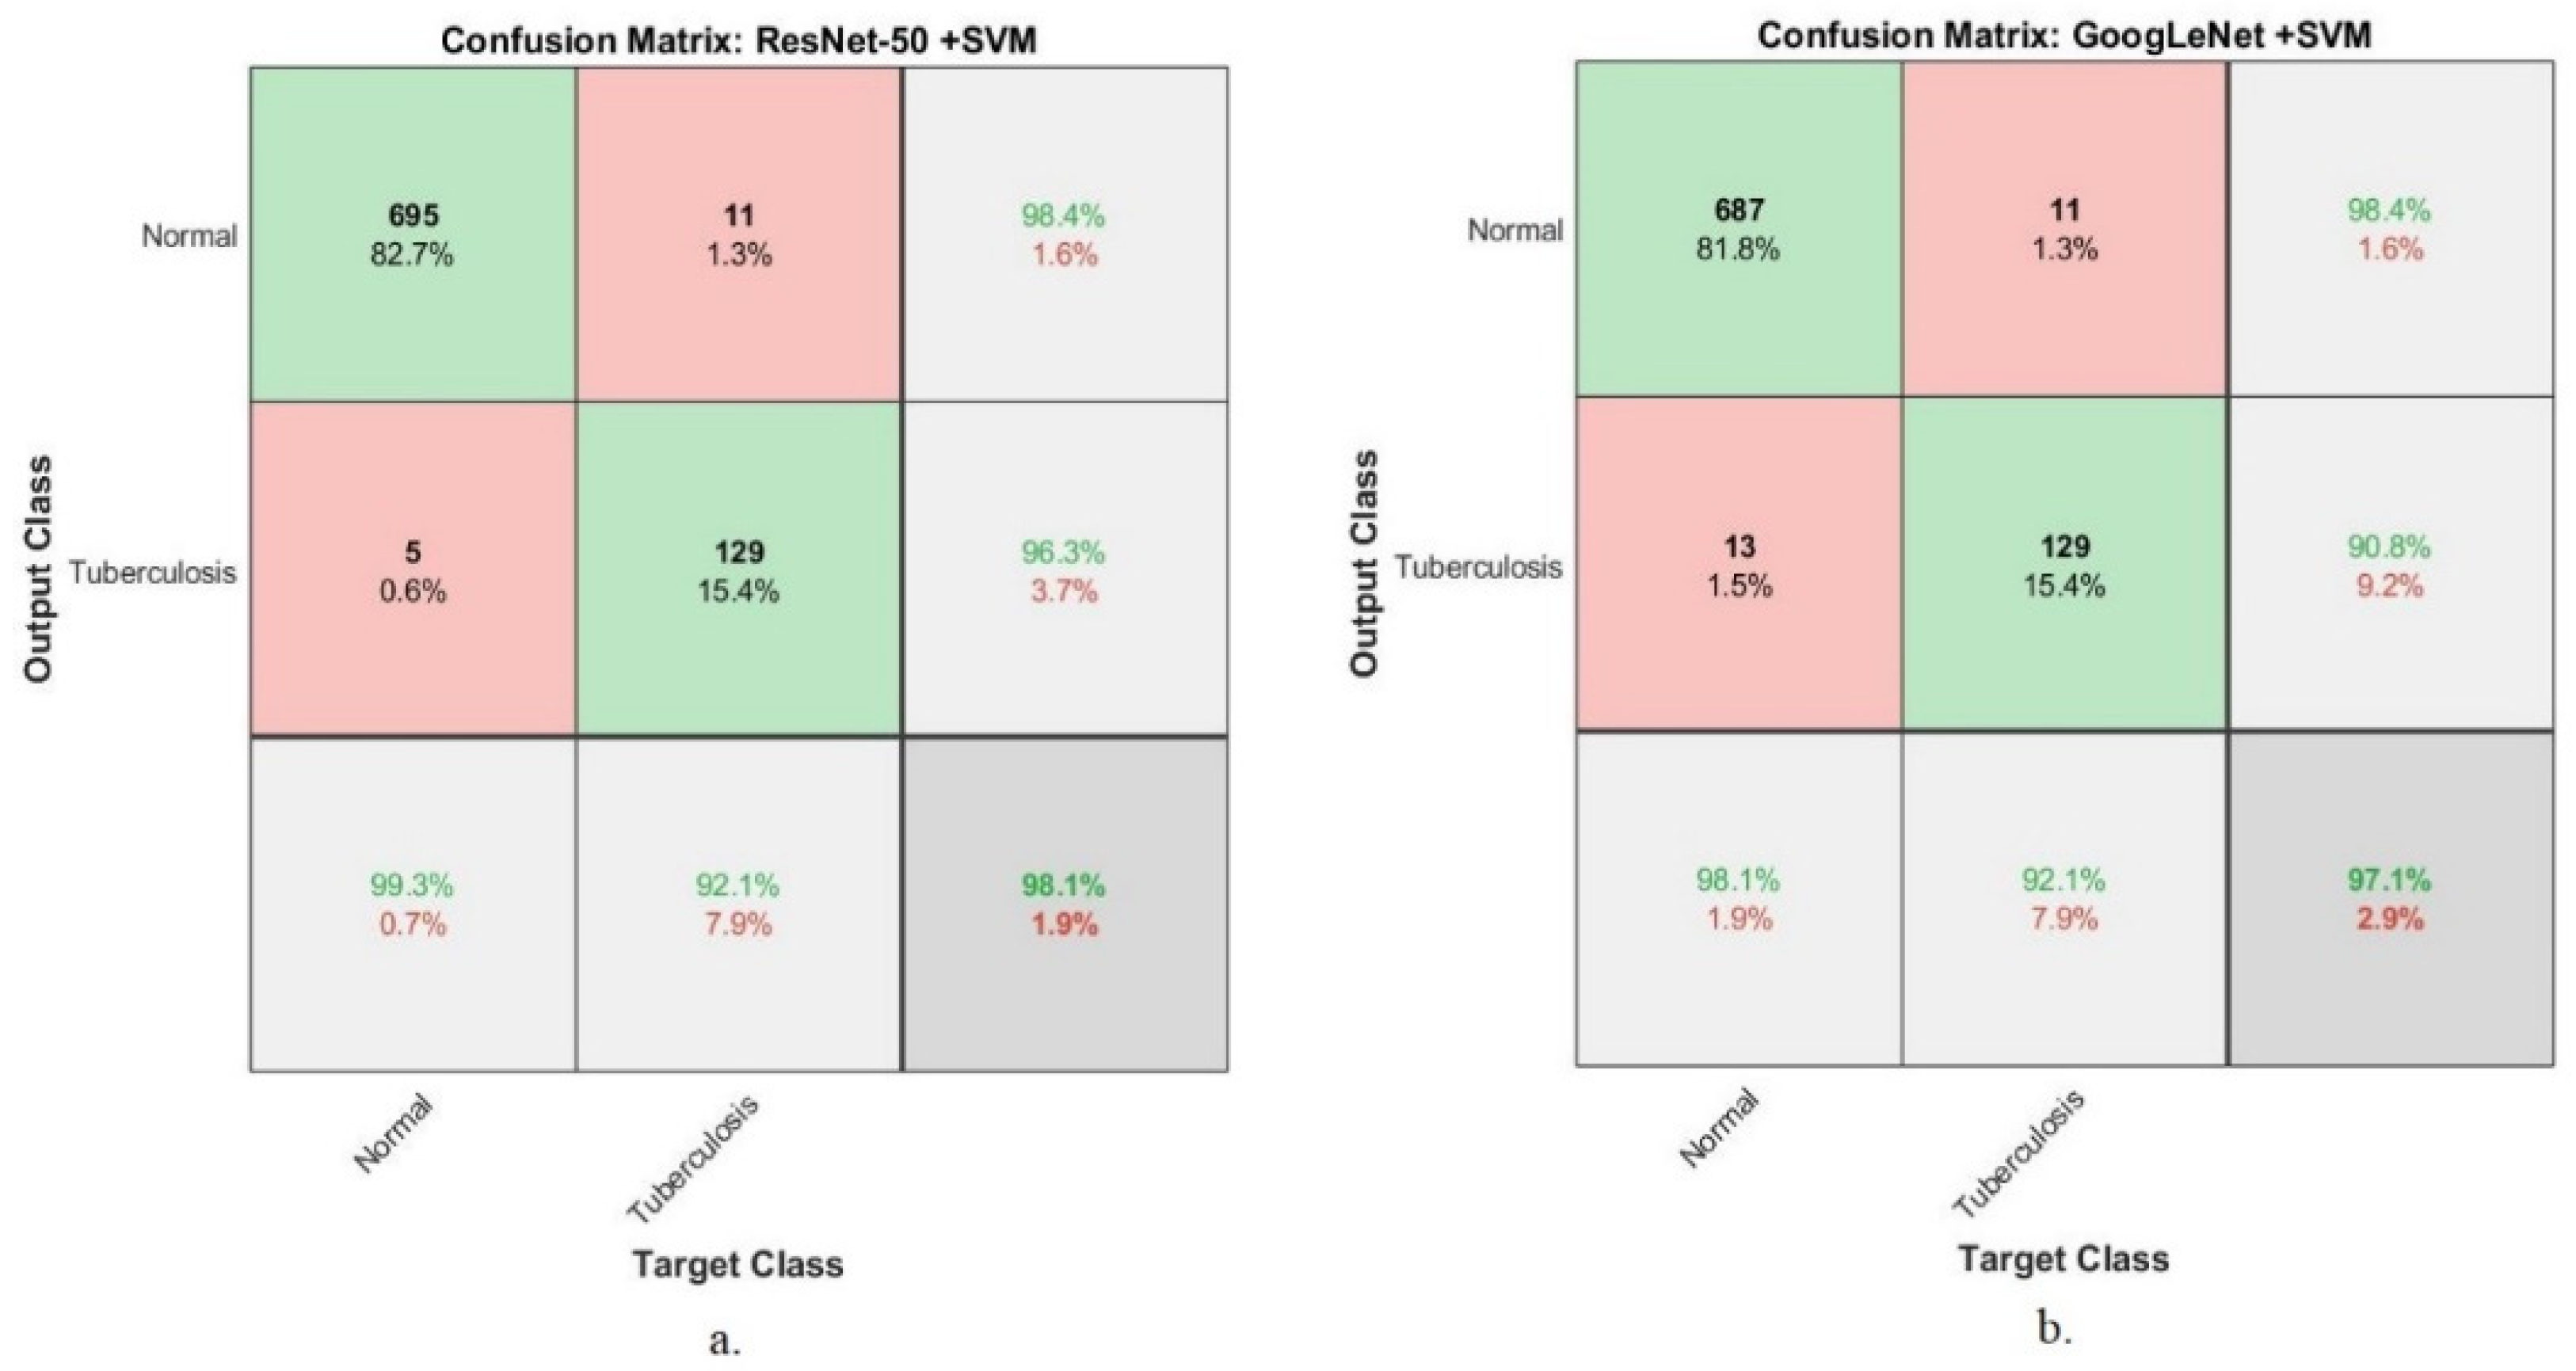
Figure 8 presents the performance of the hybrid approaches (ResNet-50 + SVM and GoogLeNet + SVM) based on the second dataset for tuberculosis diagnosis. The ResNet-50 + SVM system reached an accuracy of 99.3% and 92.1% when classifying normal and tuberculosis classes. In contrast, GoogLeNet + SVM system reached an accuracy of 98.1% and 92.1% when classifying normal and tuberculosis classes.
4.5. Results of ANN Classifier Based on Fusion of Features
This section summarizes the results of the performance of the ANN classifier based on the two X-ray datasets for early diagnosis of tuberculosis based on a set of hybrid features extracted by several techniques. This technique aims to extract the features using CNN models (ResNet-50 and GoogLeNet) and combine them with the shape and texture features extracted by the GLCM, DWT and LBP algorithms, then feed them into an ANN classifier. It is worth noting that both the ResNet-50 and GoogLeNet models produced 2048 deep features; the high dimensionality was reduced by the PCA algorithm, which reduced the dimensions of the deep features to 512 features and stored them in feature vectors. The features extracted by the GLCM, DWT and LBP algorithms were combined to produce 228 features and stored in feature vectors. Finally, the features of CNN models were combined with the features of the GLCM, DWT and LBP algorithms, which produced 740 representative features. Thus, the size of the first dataset was 662 × 740, while the size of the second dataset was 4200 × 740, and these were fed into an ANN classifier to classify them with high precision. This section summarizes a set of tools for evaluating the performance of the ANN classifier based on the two tuberculosis datasets.
4.5.1. Validation Checks and Gradient
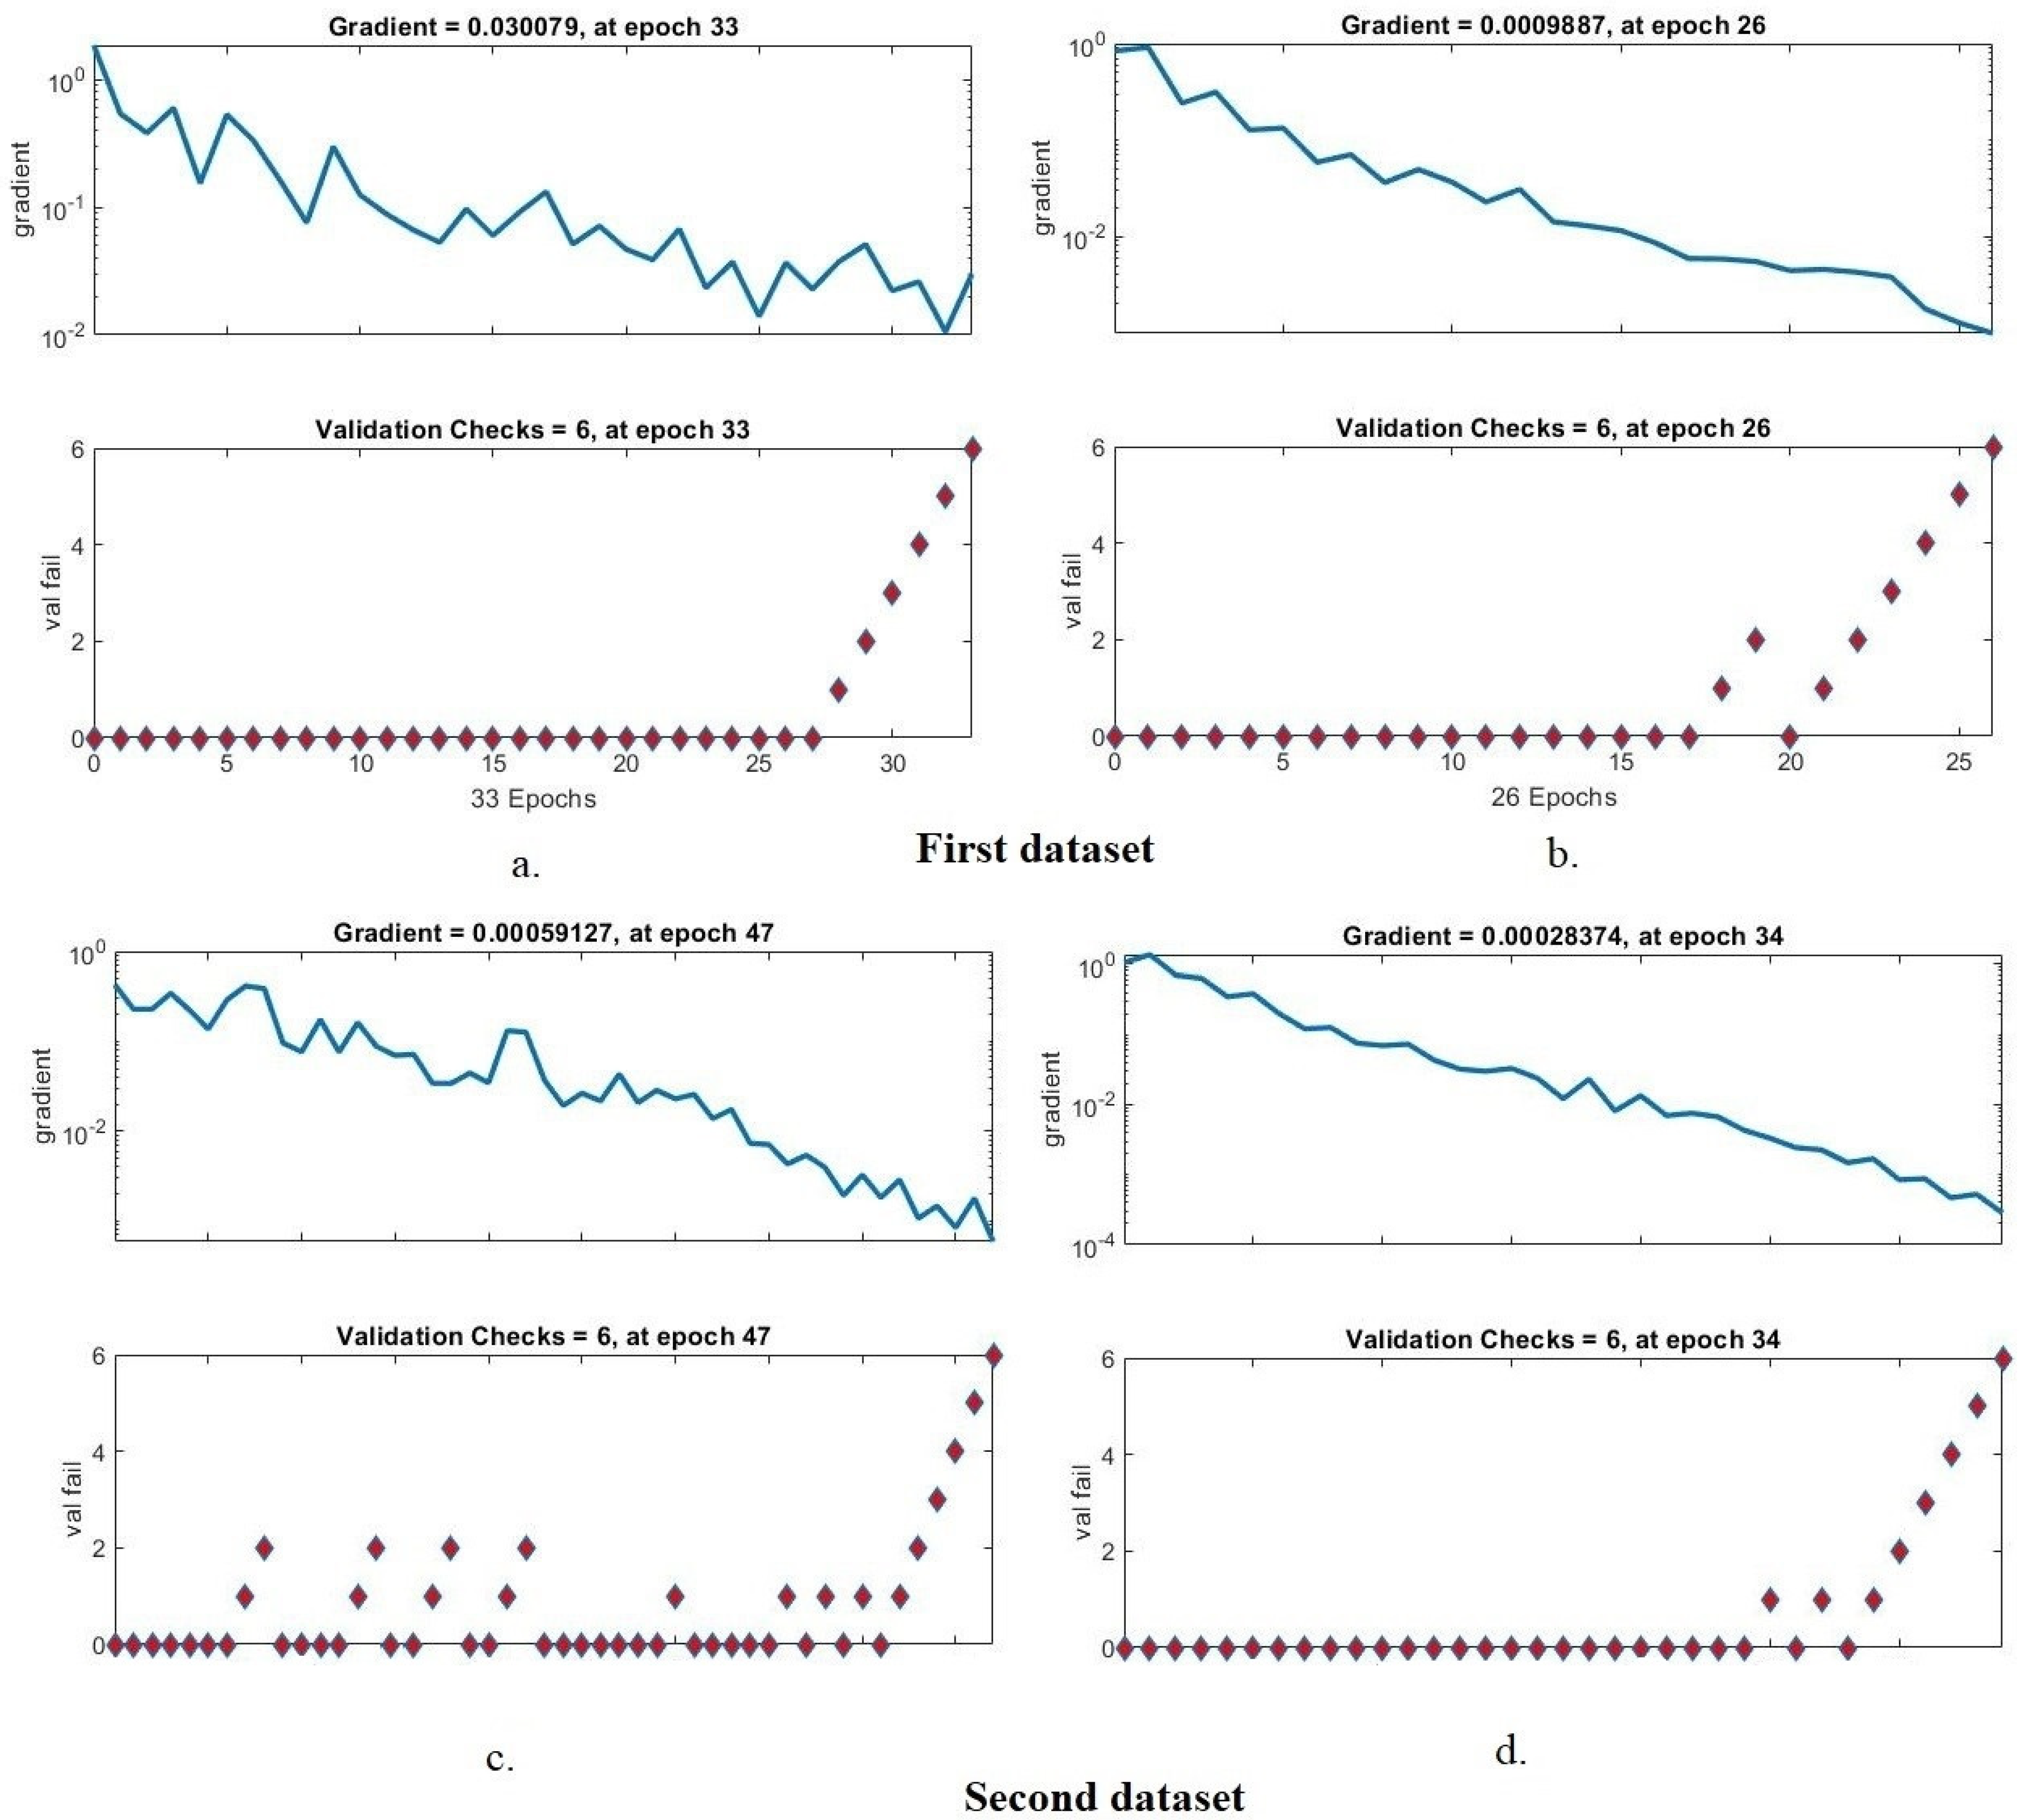
The validation check and gradient are tools for assessing the performance of the ANN based on the two tuberculosis X-ray datasets. Validation and gradient values are recorded in each epoch, and the least error is calculated to obtain the best network performance. Figure 9 describes the validation check and gradient generated by the ANN for diagnosing the two tuberculosis datasets. For the first dataset, it is noted that the ANN network with ResNet-50, GLCM, DWT and LBP features reached the best network performance at a gradient of 0.030079 at epoch 33 and a validation check with a value of 6 at epoch 33. Meanwhile, the network with GoogLeNet, GLCM, DWT and LBP features reached the best network performance at a gradient of 0.0009887 at epoch 26 and a validation check with a value of 6 at epoch 26. For the second dataset, we note that an ANN network with features of ResNet-50, GLCM, DWT and LBP achieved the best network performance at a gradient of 0.00059127 at epoch 47 and validation check with a value of 6 at epoch 47, while with GoogLeNet, GLCM, DWT and LBP features, the ANN network achieved the best performance at a gradient of 0.00028374 at epoch 34 and a validation check with a value of 6 at epoch 34.
4.5.2. Best Validation Performance
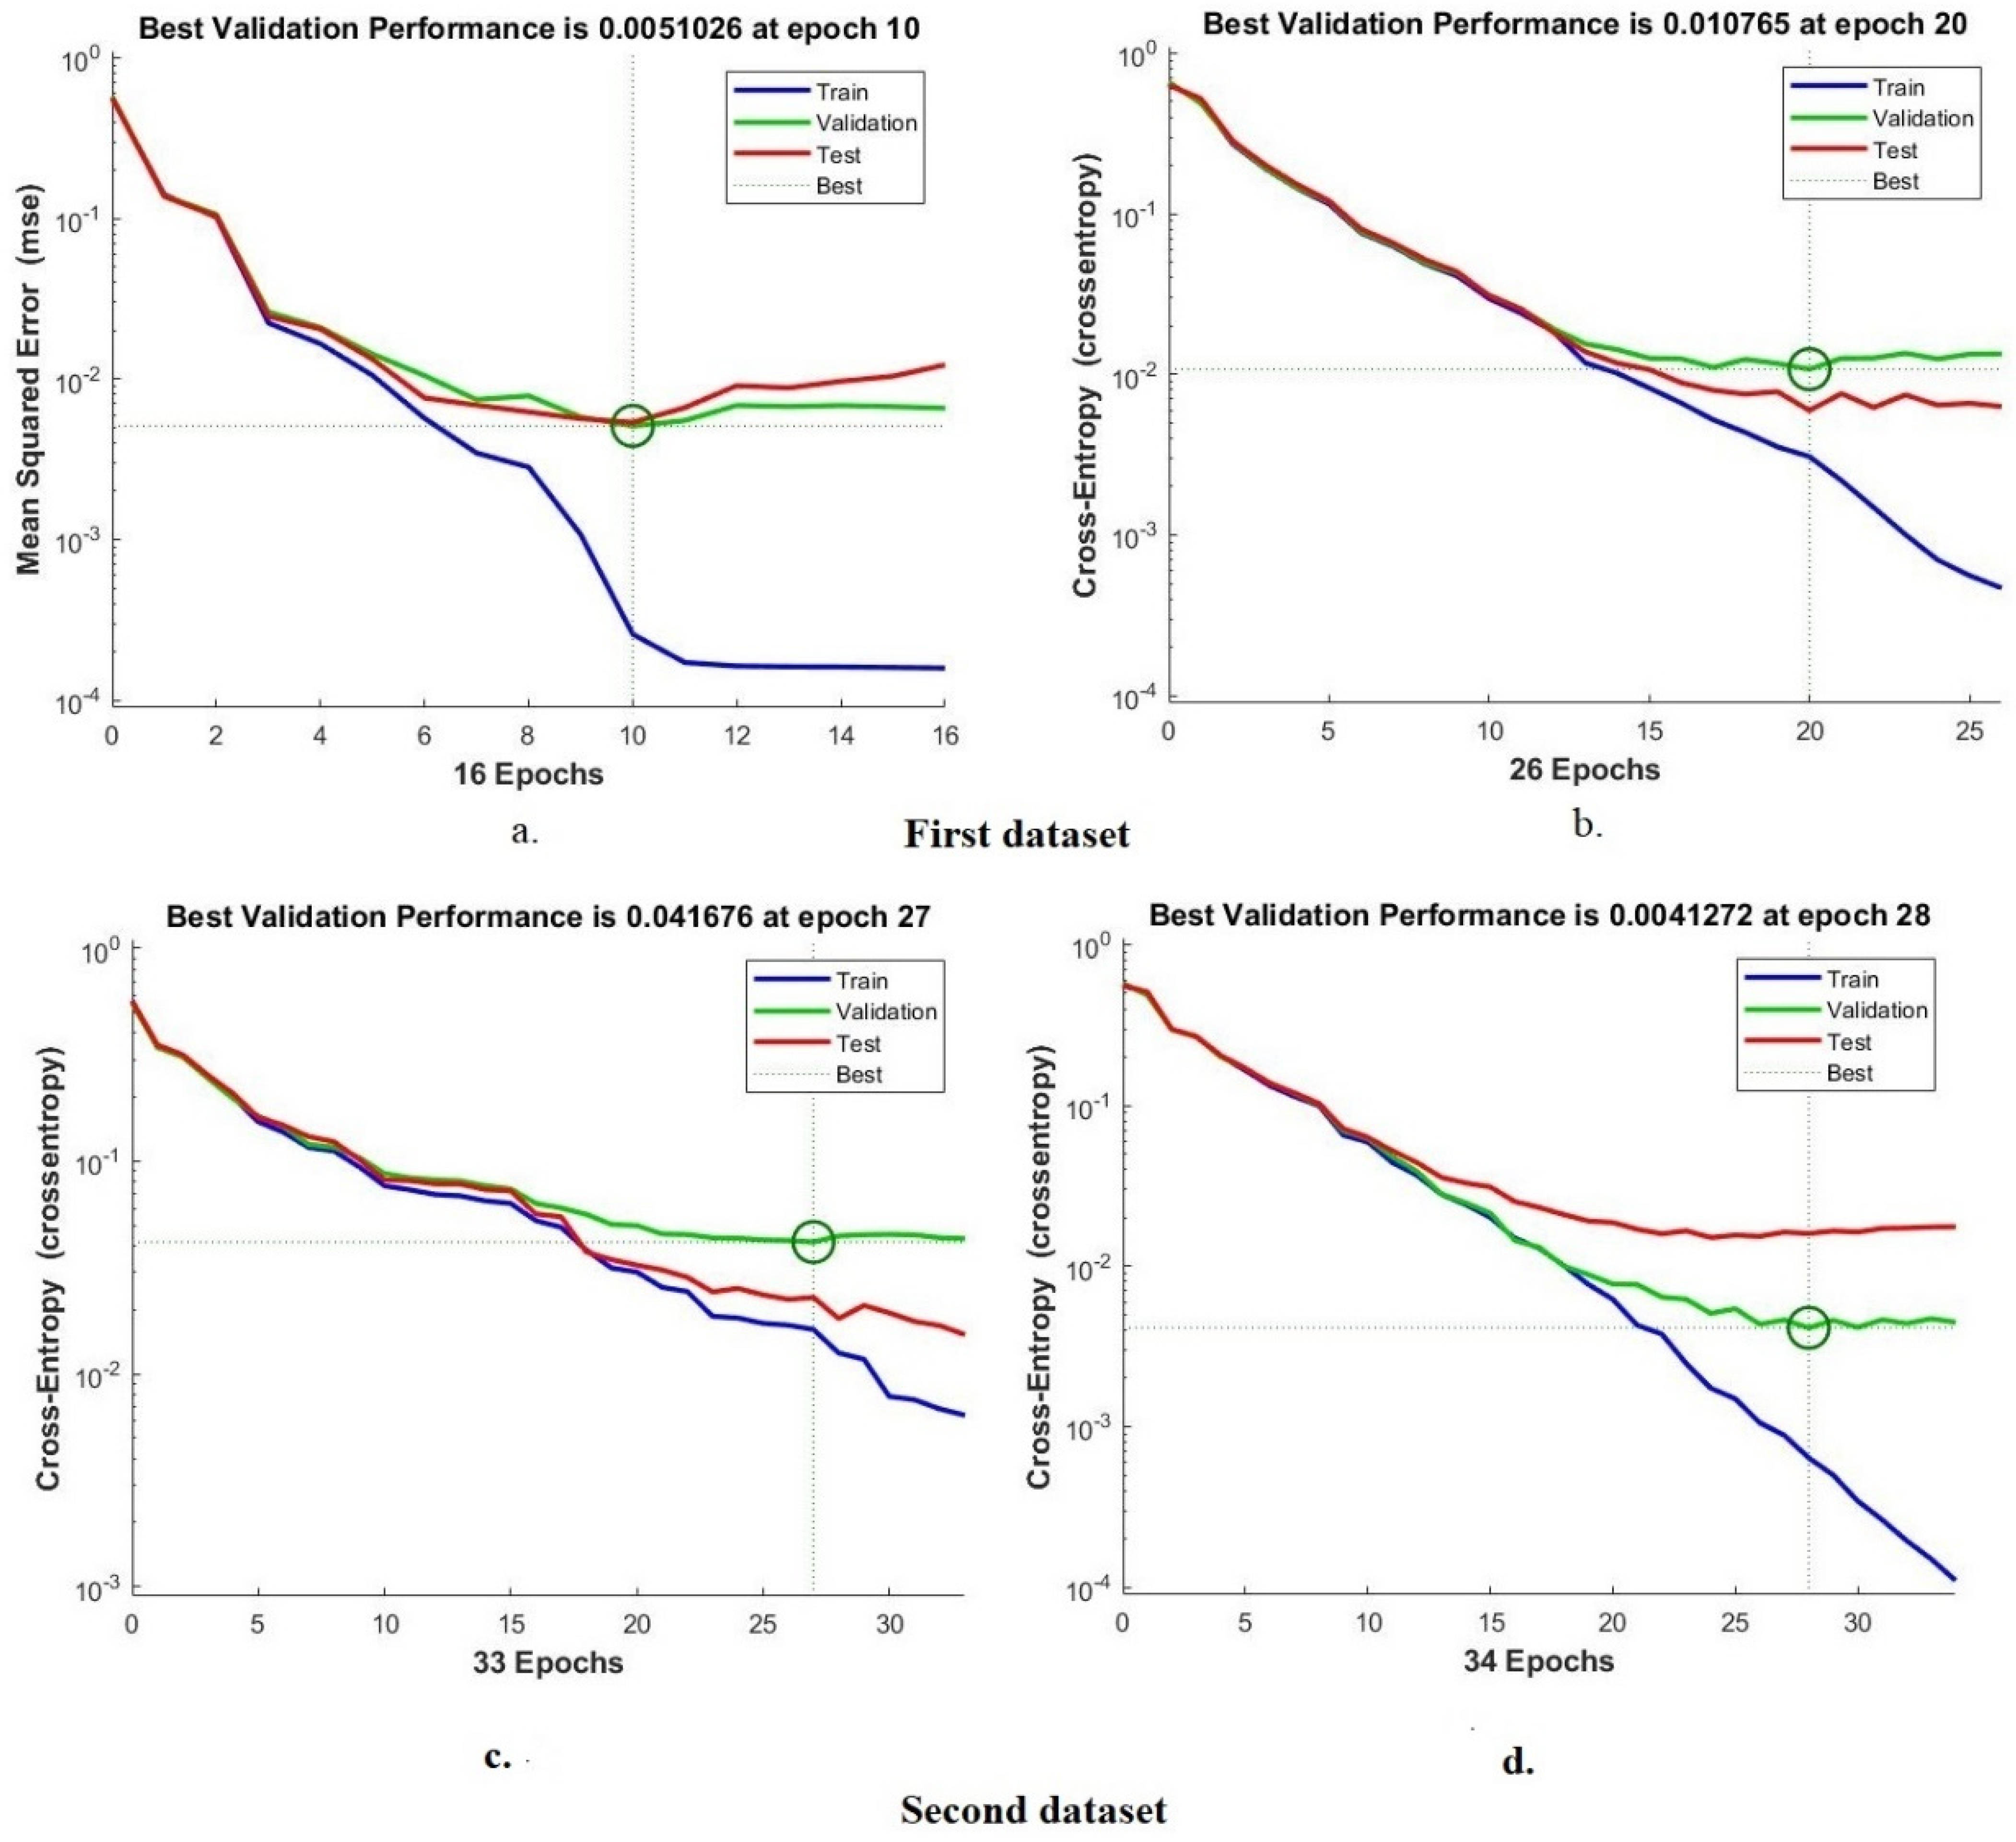
The cross-entropy, or mean square error, is one of the most important tools for evaluating the ANN classifier on the two X-ray datasets for tuberculosis. Mean square error values between actual and expected values are recorded in all epochs during all phases of splitting of the dataset. The grid generates the mean squared error in different colors, where each color represents a phase; a green color represents the evaluation of the network during validation, a blue color represents its performance during the training of the dataset, and a red color represents its performance during the testing of new samples, while the best performance of the network is represented by the dashed lines between the x and y axes. Figure 10 shows the cross-entropy produced using an ANN classifier for diagnosing the two tuberculosis datasets. For the first dataset, it is noticed that the ANN network with the features of ResNet-50, GLCM, DWT and LBP reached the best performance when the minimum error was 0.0051026 at epoch 10, while with the features of GoogLeNet, GLCM, DWT and LBP, it reached the best performance for the network when the minimum error was 0.010765 at epoch 20. For the second dataset, note that ANN with ResNet-50, GLCM, DWT and LBP features obtained the best performance when the minimum error was 0.041676 at epoch 27, whereas with GoogLeNet, GLCM, DWT and LBP features, it achieved the best network performance when the minimum error was 0.0041272 at epoch 28.
4.5.3. Error Histogram
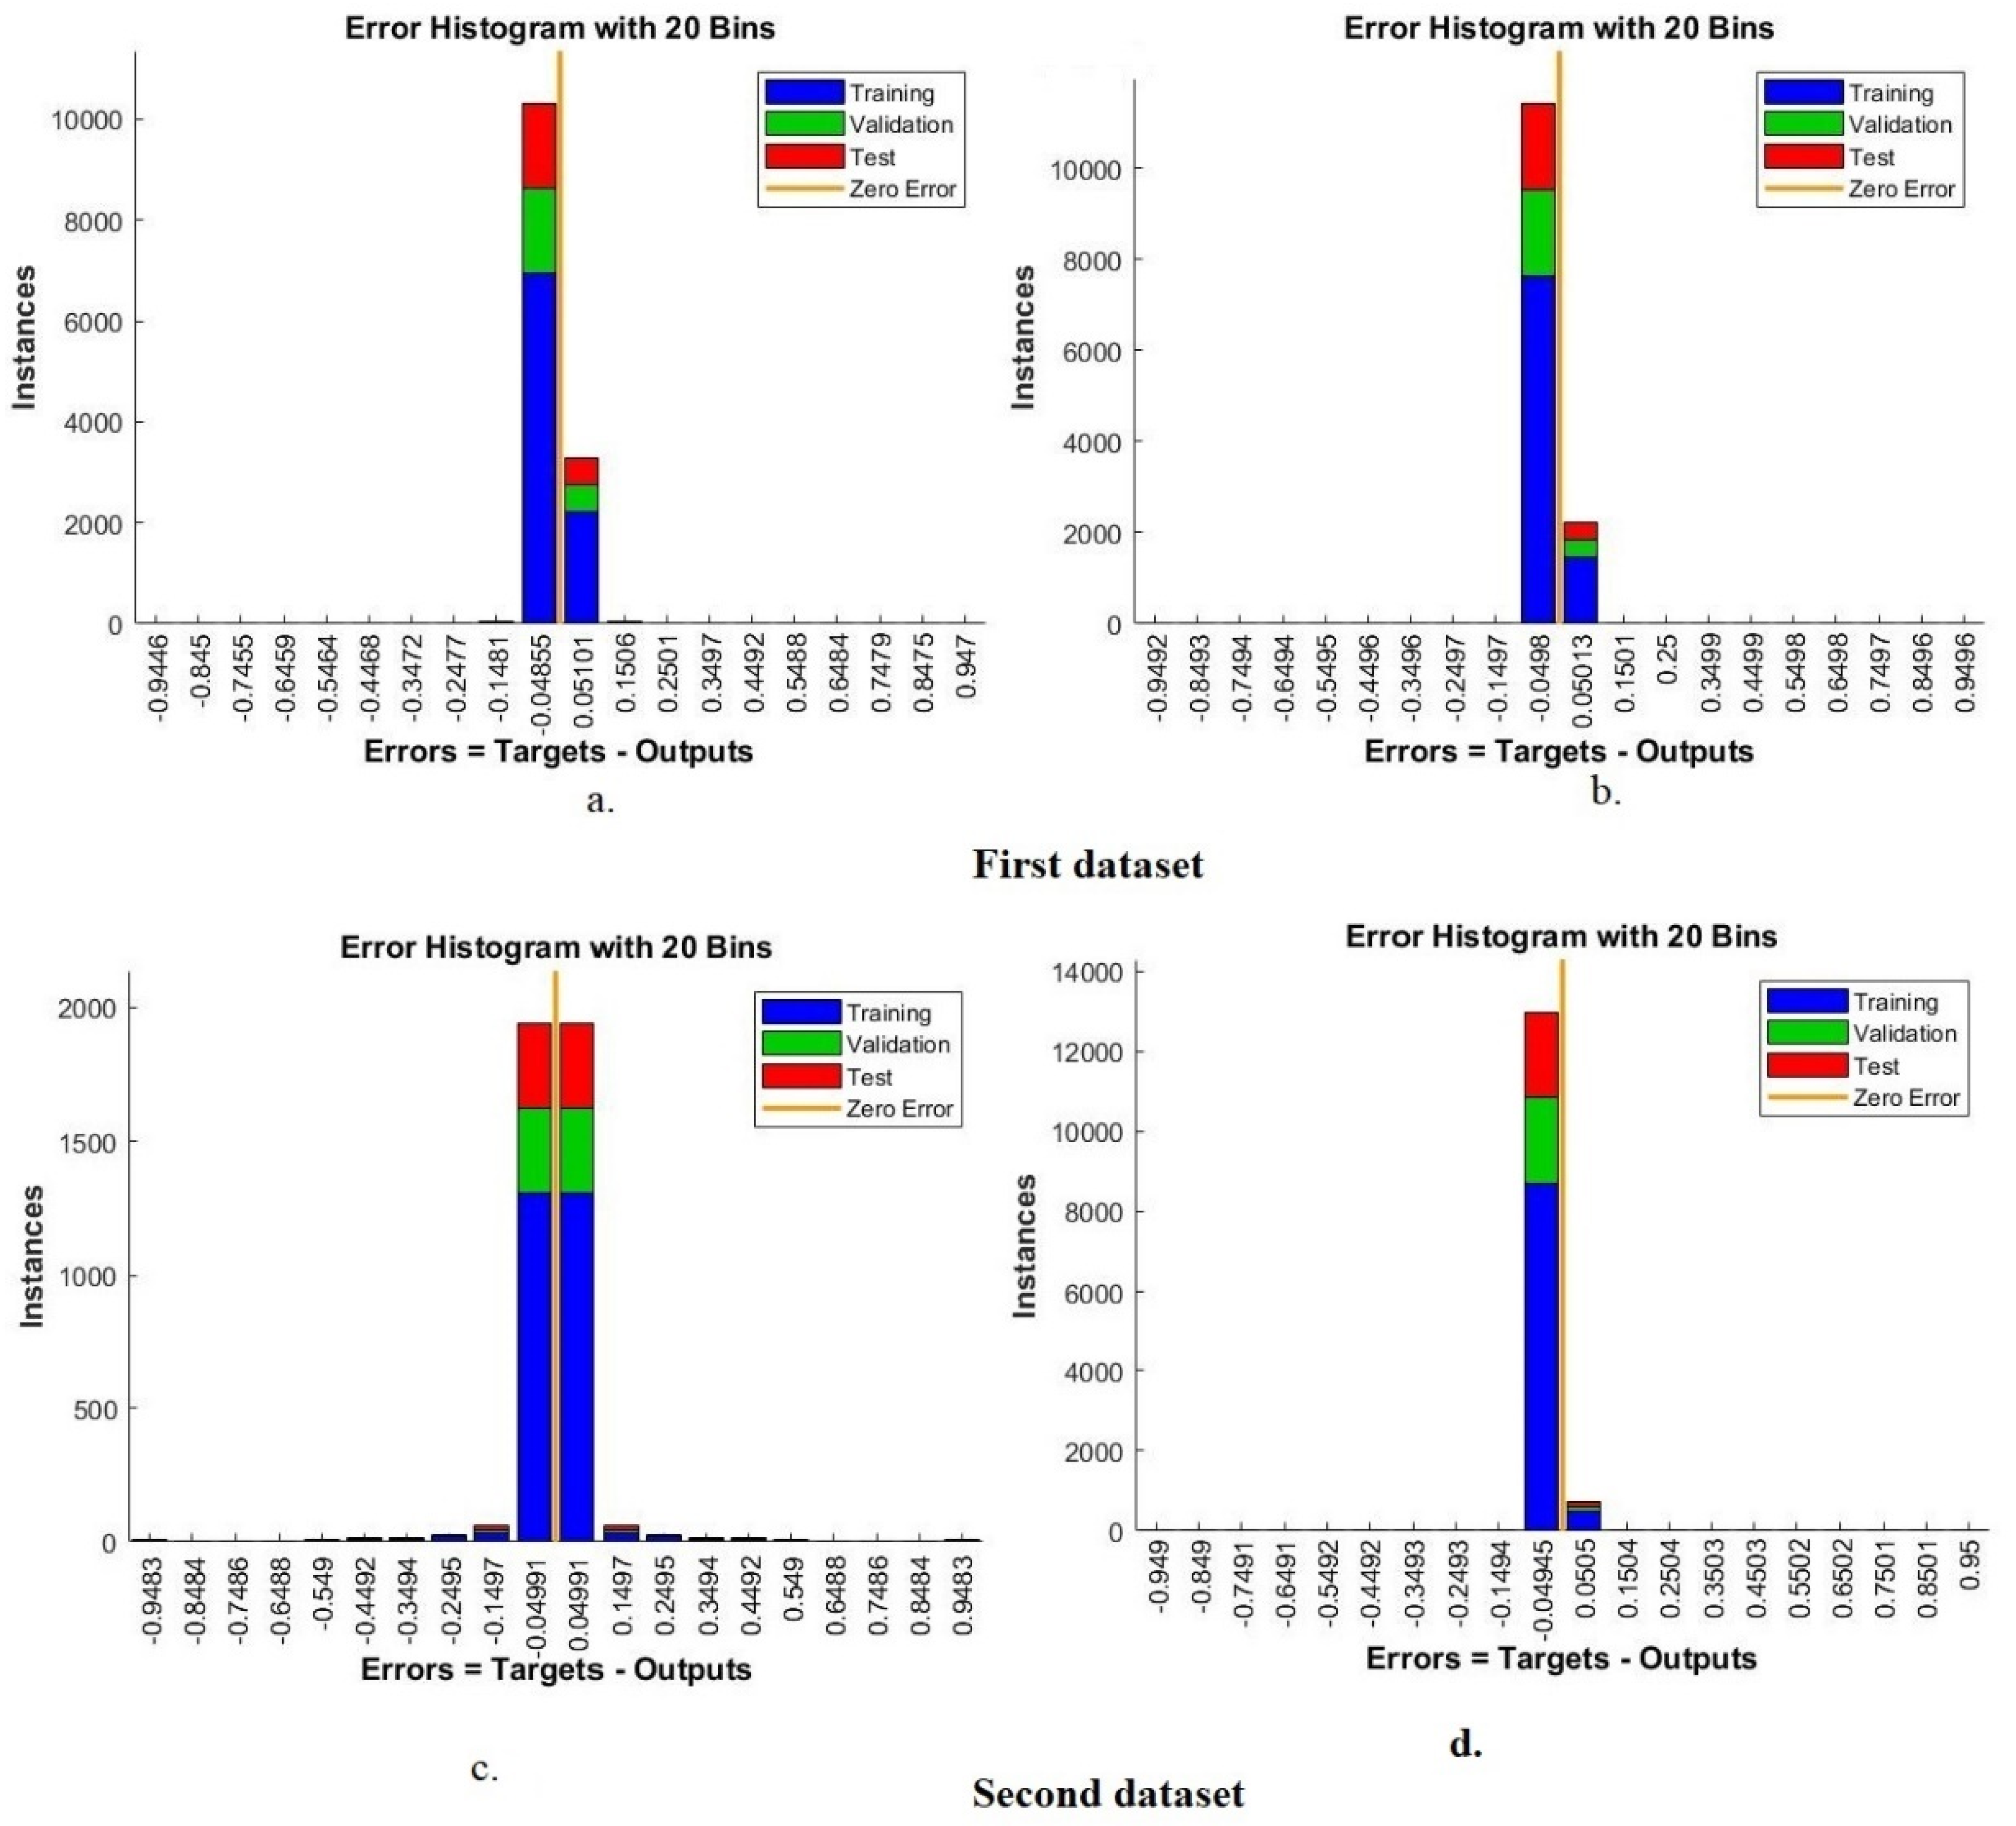
An error histogram is one of the tools used for evaluating the ANN on the two X-ray datasets for tuberculosis. Error values between the target and output values are recorded in all epochs during all stages of dataset splitting. The bin histogram is generated using an ANN classifier in different colors. Each color represents a phase; green represents the classifier’s evaluation during validation, a blue color represents its performance during the training of the dataset, a red color represents its performance during testing new samples, and the best performance of the network is depicted in orange. Figure 11 shows the error histogram generated by an ANN classifier for classifying the two tuberculosis datasets. For the first dataset, it is noted that the ANN network with the features of ResNet-50, GLCM, DWT and LBP reached the best performance with 20 bins between the values of −0.9446 and 0.947, while with the features of GoogLeNet, GLCM, DWT and LBP, it achieved the best performance for the network with 20 bins between the values of −0.9492 and 0.9496. For the second dataset, note that ANN with ResNet-50, GLCM, DWT and LBP features achieved the best performance with 20 bins between −0.9483 and 0.9483, while with GoogLeNet, GLCM, DWT and LBP features, it reached the best performance with 20 bins with values between −0.949 and 0.95.
4.5.4. Confusion Matrix
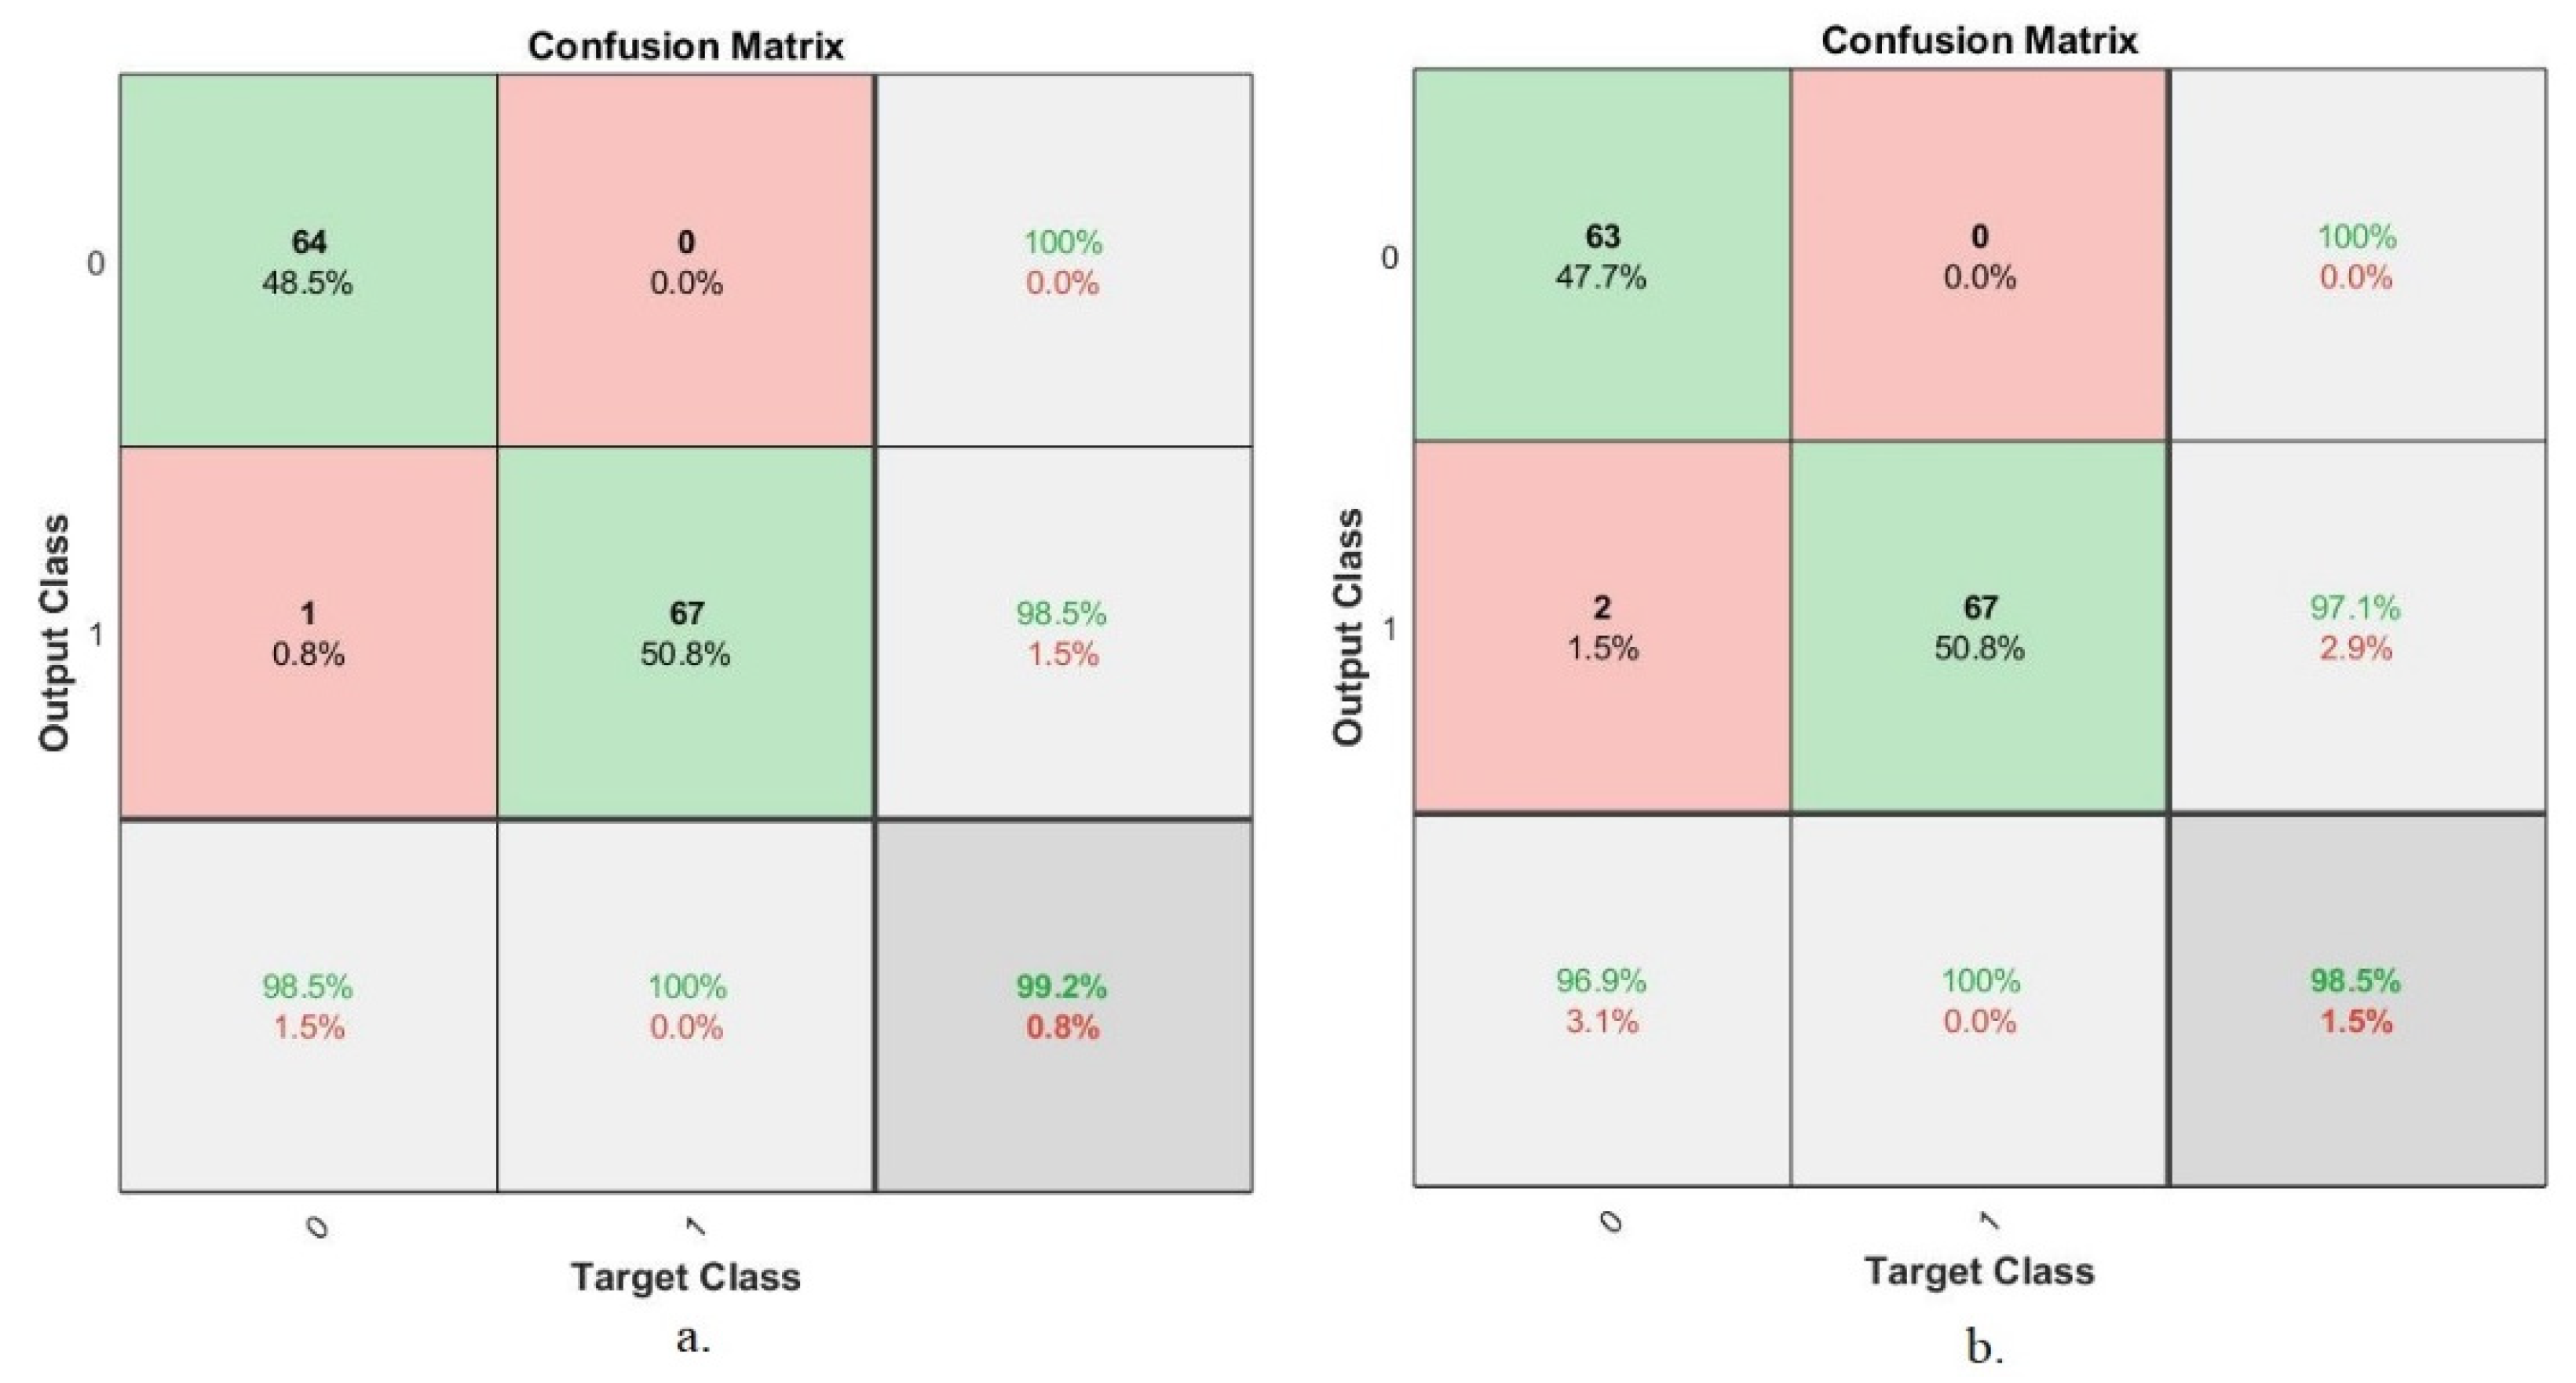
The confusion matrix is the most important tool for summarizing the results of deep and machine learning systems. This section presents a confusion matrix of an ANN based on hybrid features for the early diagnosis tuberculosis based on the two tuberculosis datasets. The confusion matrix contains all of the appropriately and inappropriately diagnosed X-rays. A well-diagnosed X-ray falls on the primary diagonal of the confusion matrix, while a misdiagnosed X-ray falls on the rest of the confusion matrix. Class 1 represents normal X-rays, and class 2 represents tuberculosis X-rays. Figure 12 displays the confusion matrix generated by the ANN to classify the first dataset’s tuberculosis X-rays. The ANN network, when fed with the hybrid features extracted by ResNet-50, GLCM, DWT and LBP, achieved an overall accuracy of 99.2%, while the ANN network fed with the hybrid features extracted by GoogLeNet, GLCM, DWT and LBP reached an overall accuracy of 98.5%.
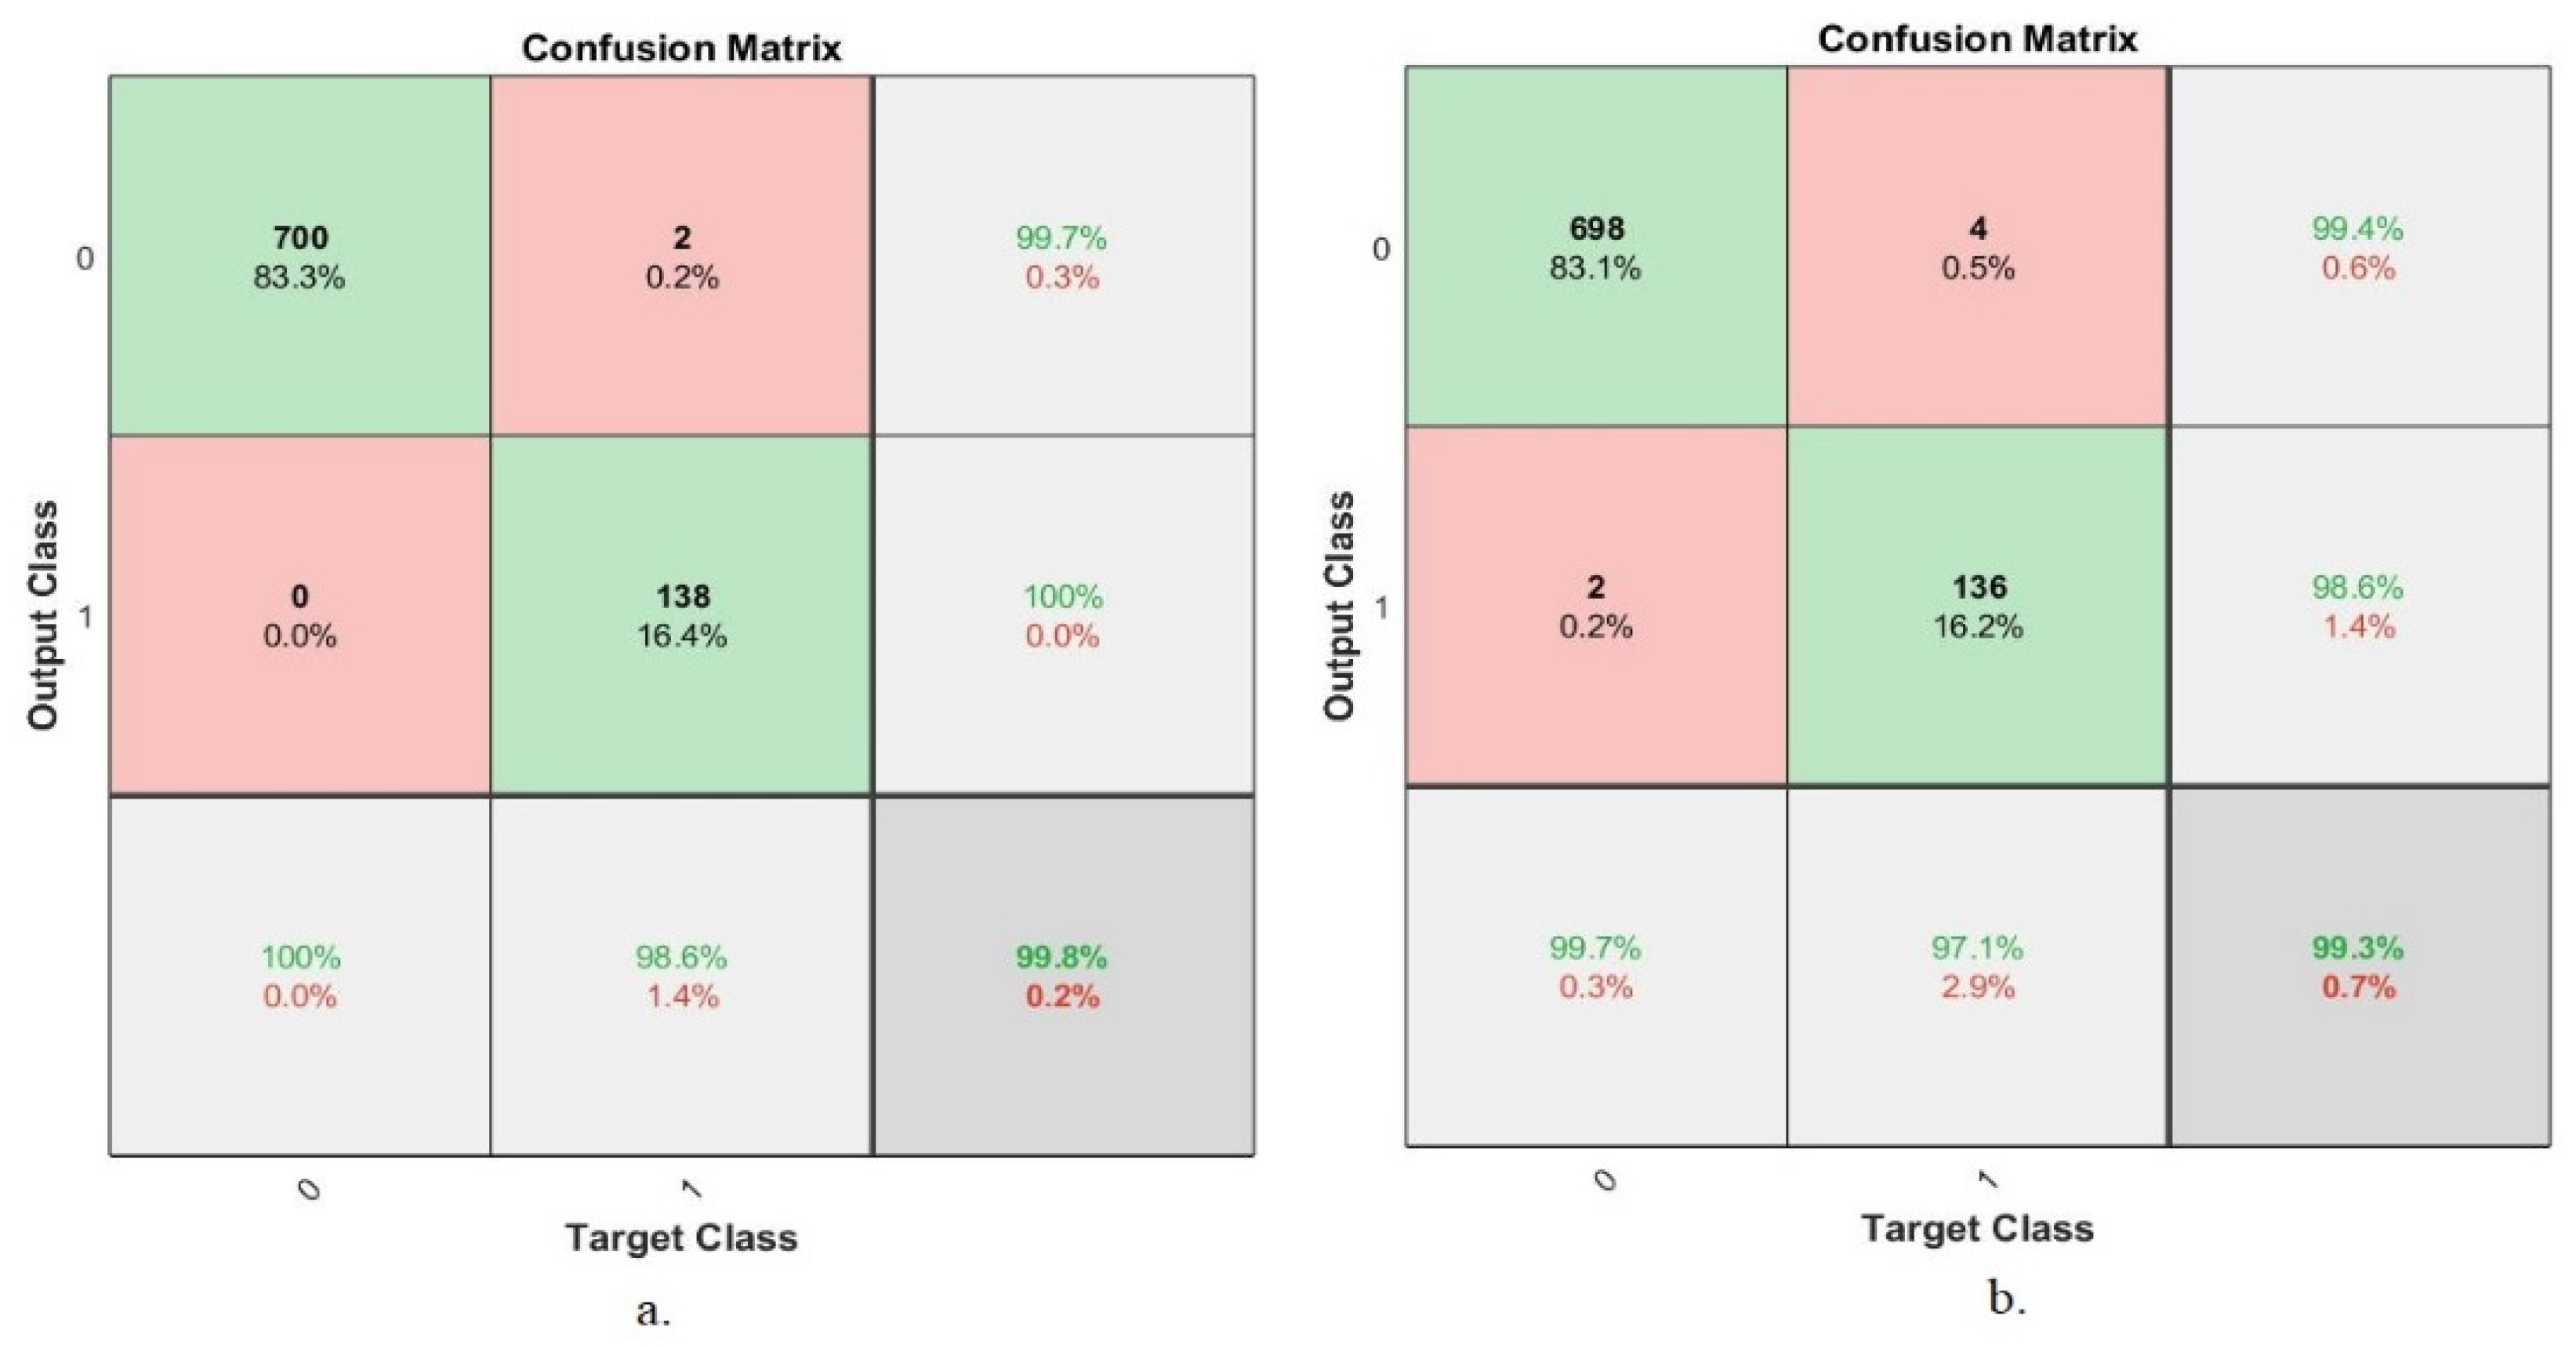
Figure 13 displays the ANN confusion matrix for classifying the second dataset’s tuberculosis X-rays. The ANN classifier, when fed with the hybrid features extracted by ResNet-50, GLCM, DWT and LBP, obtained an overall accuracy of 99.8%, while the ANN classifier fed with the hybrid features extracted by GoogLeNet, GLCM, DWT and LBP obtained an overall accuracy of 99.3%.
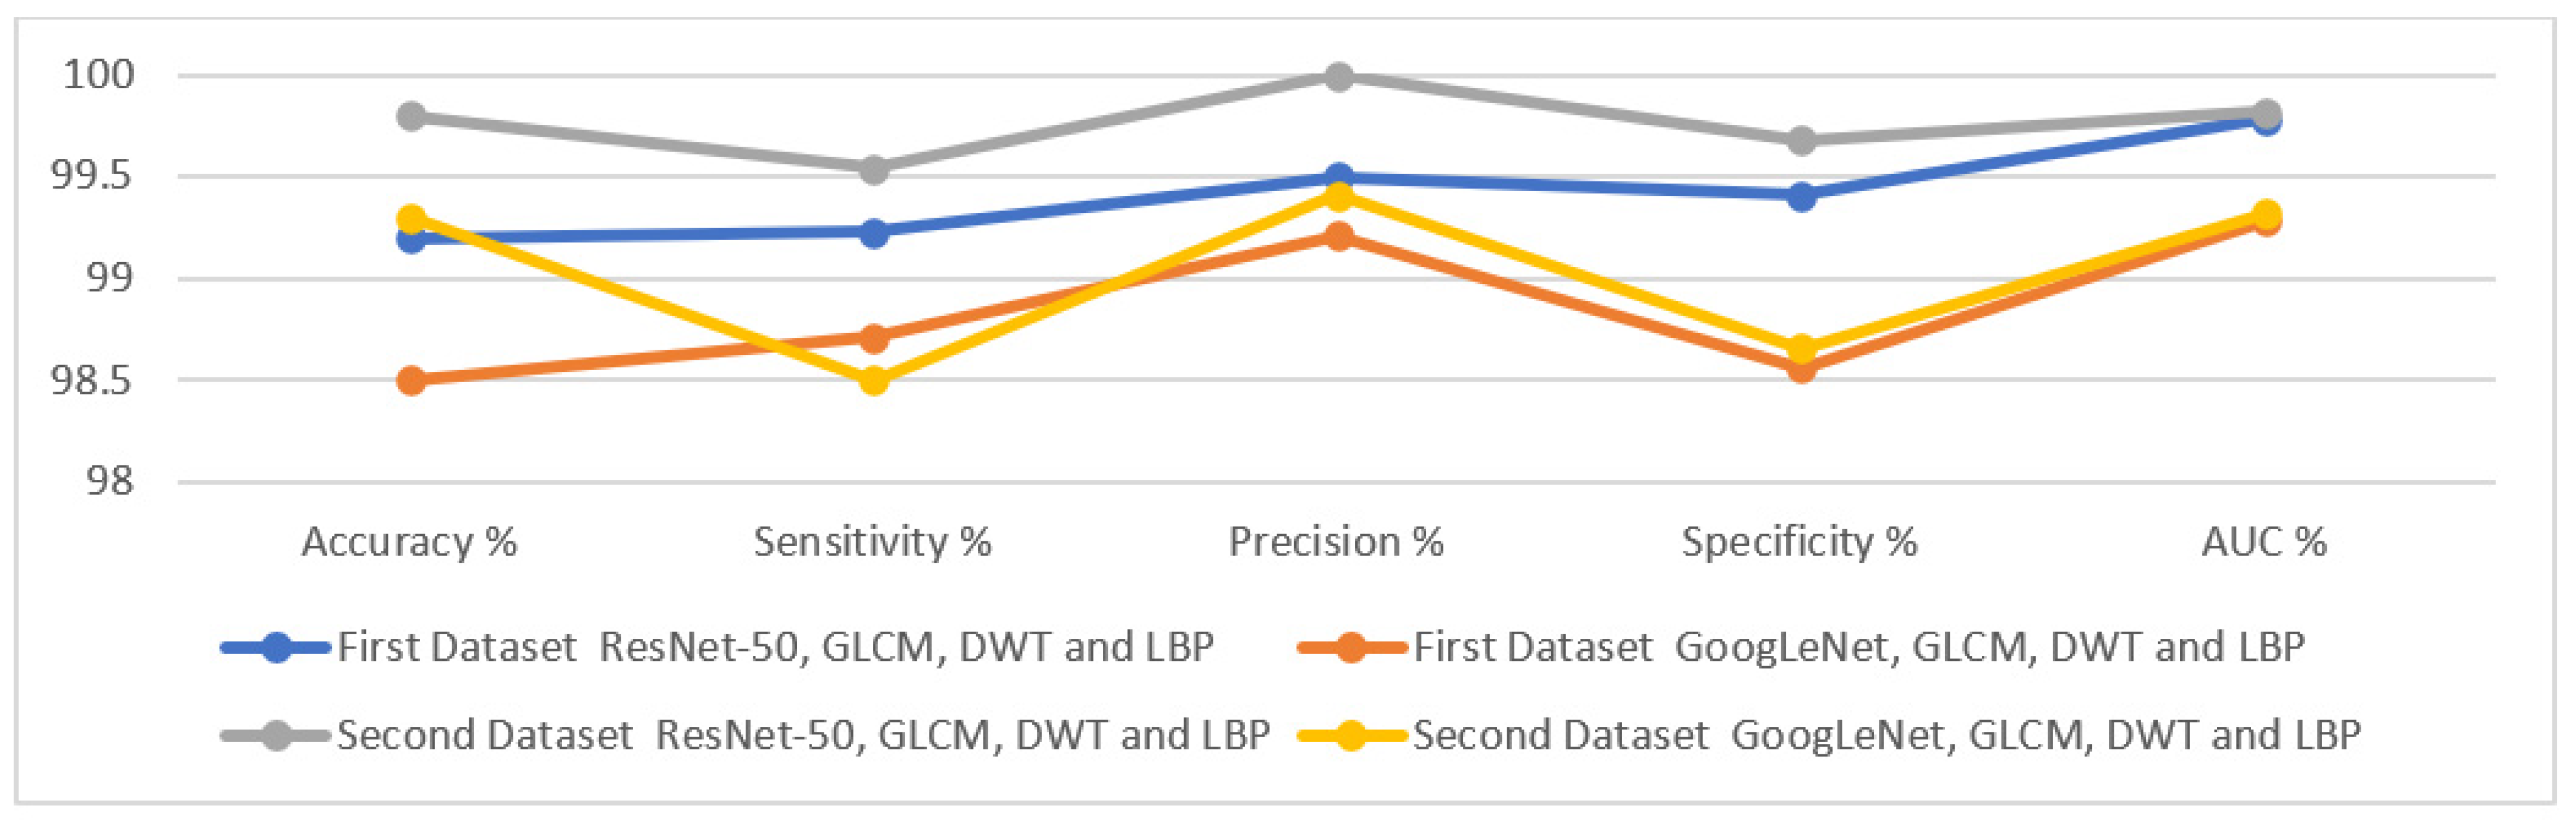
The technique of incorporating features extracted by CNN models and GLCM, DWT and LBP algorithms contributed to the accurate diagnosis of tuberculosis based on X-ray images. Table 4 summarizes the results achieved by the ANN algorithm when fed with hybrid features, which achieved promising results in the early detection of tuberculosis. The ANN classifier acheived the following results: first, for the first dataset, when the ANN was fed with the hybrid features extracted by ResNet-50, GLCM, DWT and LBP, it reached an accuracy of 99.2%, a sensitivity of 99.23%, a precision of 99.5%, a specificity of 99.41%, and an AUC of 99.78%. In contrast, when the ANN was fed with the hybrid features extracted by ResNet-50, GLCM, DWT and LBP, it obtained an accuracy of 98.5%, a sensitivity of 98.71%, a precision of 99.21%, a specificity of 98.56%, and an AUC of 99.28%.
Secondly, for the second dataset, when the ANN was fed with the hybrid features extracted by ResNet-50, GLCM, DWT and LBP, it obtained an accuracy of 99.8%, a sensitivity of 99.54%, a precision of 100%, a specificity of 99.68%, and an AUC of 99.82%. In contrast, when the ANN was fed with the hybrid features extracted by ResNet-50, GLCM, DWT and LBP, it obtained an accuracy of 99.3%, a sensitivity of 98.5%, a precision of 99.41%, a specificity of 98.66%, and an AUC of 99.32%.
Figure 14 presents the performance of the ANN when classifying the two X-ray datasets for the early detection of tuberculosis.
5. Discussion and Comparison of the Implementation of the Proposed Techniques
This study deals with modern and effective methodologies for classifying two X-ray datasets for the early detection of tuberculosis using two proposed approaches; each approach contains two different systems. Initially, due to the images containing noise and low contrast, all images of the two datasets were enhanced. Due to the scarcity of images in the two datasets, the data augmentation method was used for two purposes: to overcome the limitation of the lack of images, and to address the problem of unbalanced classes in the two datasets.
The first proposed approach is a hybrid method consisting of deep learning models (ResNet-50 and GoogLeNet), which receive optimized images and extract deep features through convolutional and auxiliary layers and store them in feature vectors. The PCA method was used to reduce the high dimensionality of the deep features. The last layers of the ResNet-50 and GoogLeNet models were removed and replaced with an SVM method that receives low-dimensionality features and classifies them with high accuracy and efficiency. Thus, the first proposed approach consists of two hybrid systems, ResNet-50 + SVM and GoogLeNet + SVM.
The second proposed approach is based on the hybrid features of several techniques and their classification by the ANN classifier. The second proposed approach consists of a single system, an ANN, which is fed with two different hybrid feature methods: first, a hybrid feature extracted by ResNet-50, GLCM, DWT and LBP; and second, the hybrid features extracted by GoogLeNet, GLCM, DWT and LBP.
The first proposed approach reached an overall accuracy of 95.5% and 97% for the two hybrid systems, namely ResNet-50 + SVM and GoogLeNet + SVM, respectively, when classifying the first dataset. Additionally, an overall accuracy of 98.1% and 97.1% was obtained for the two-hybrid systems, namely ResNet-50 + SVM and GoogLeNet + SVM, respectively, for the classification of the second dataset. The performance of the the second proposed is approach as follows: first, for the first dataset, the ANN classifier achieved an overall accuracy of 99.2% when fed with hybrid features from ResNet-50, GLCM, DWT and LBP; in contrast, it achieved an overall accuracy of 98.5% when fed with hybrid features from GoogLeNet, GLCM, DWT and LBP. Second, for the second dataset, the ANN classifier achieved an overall accuracy of 99.8% when fed with hybrid features from ResNet-50, GLCM, DWT and LBP; in contrast, it achieved an overall accuracy of 99.3% when fed with hybrid features from GoogLeNet, GLCM, DWT and LBP.
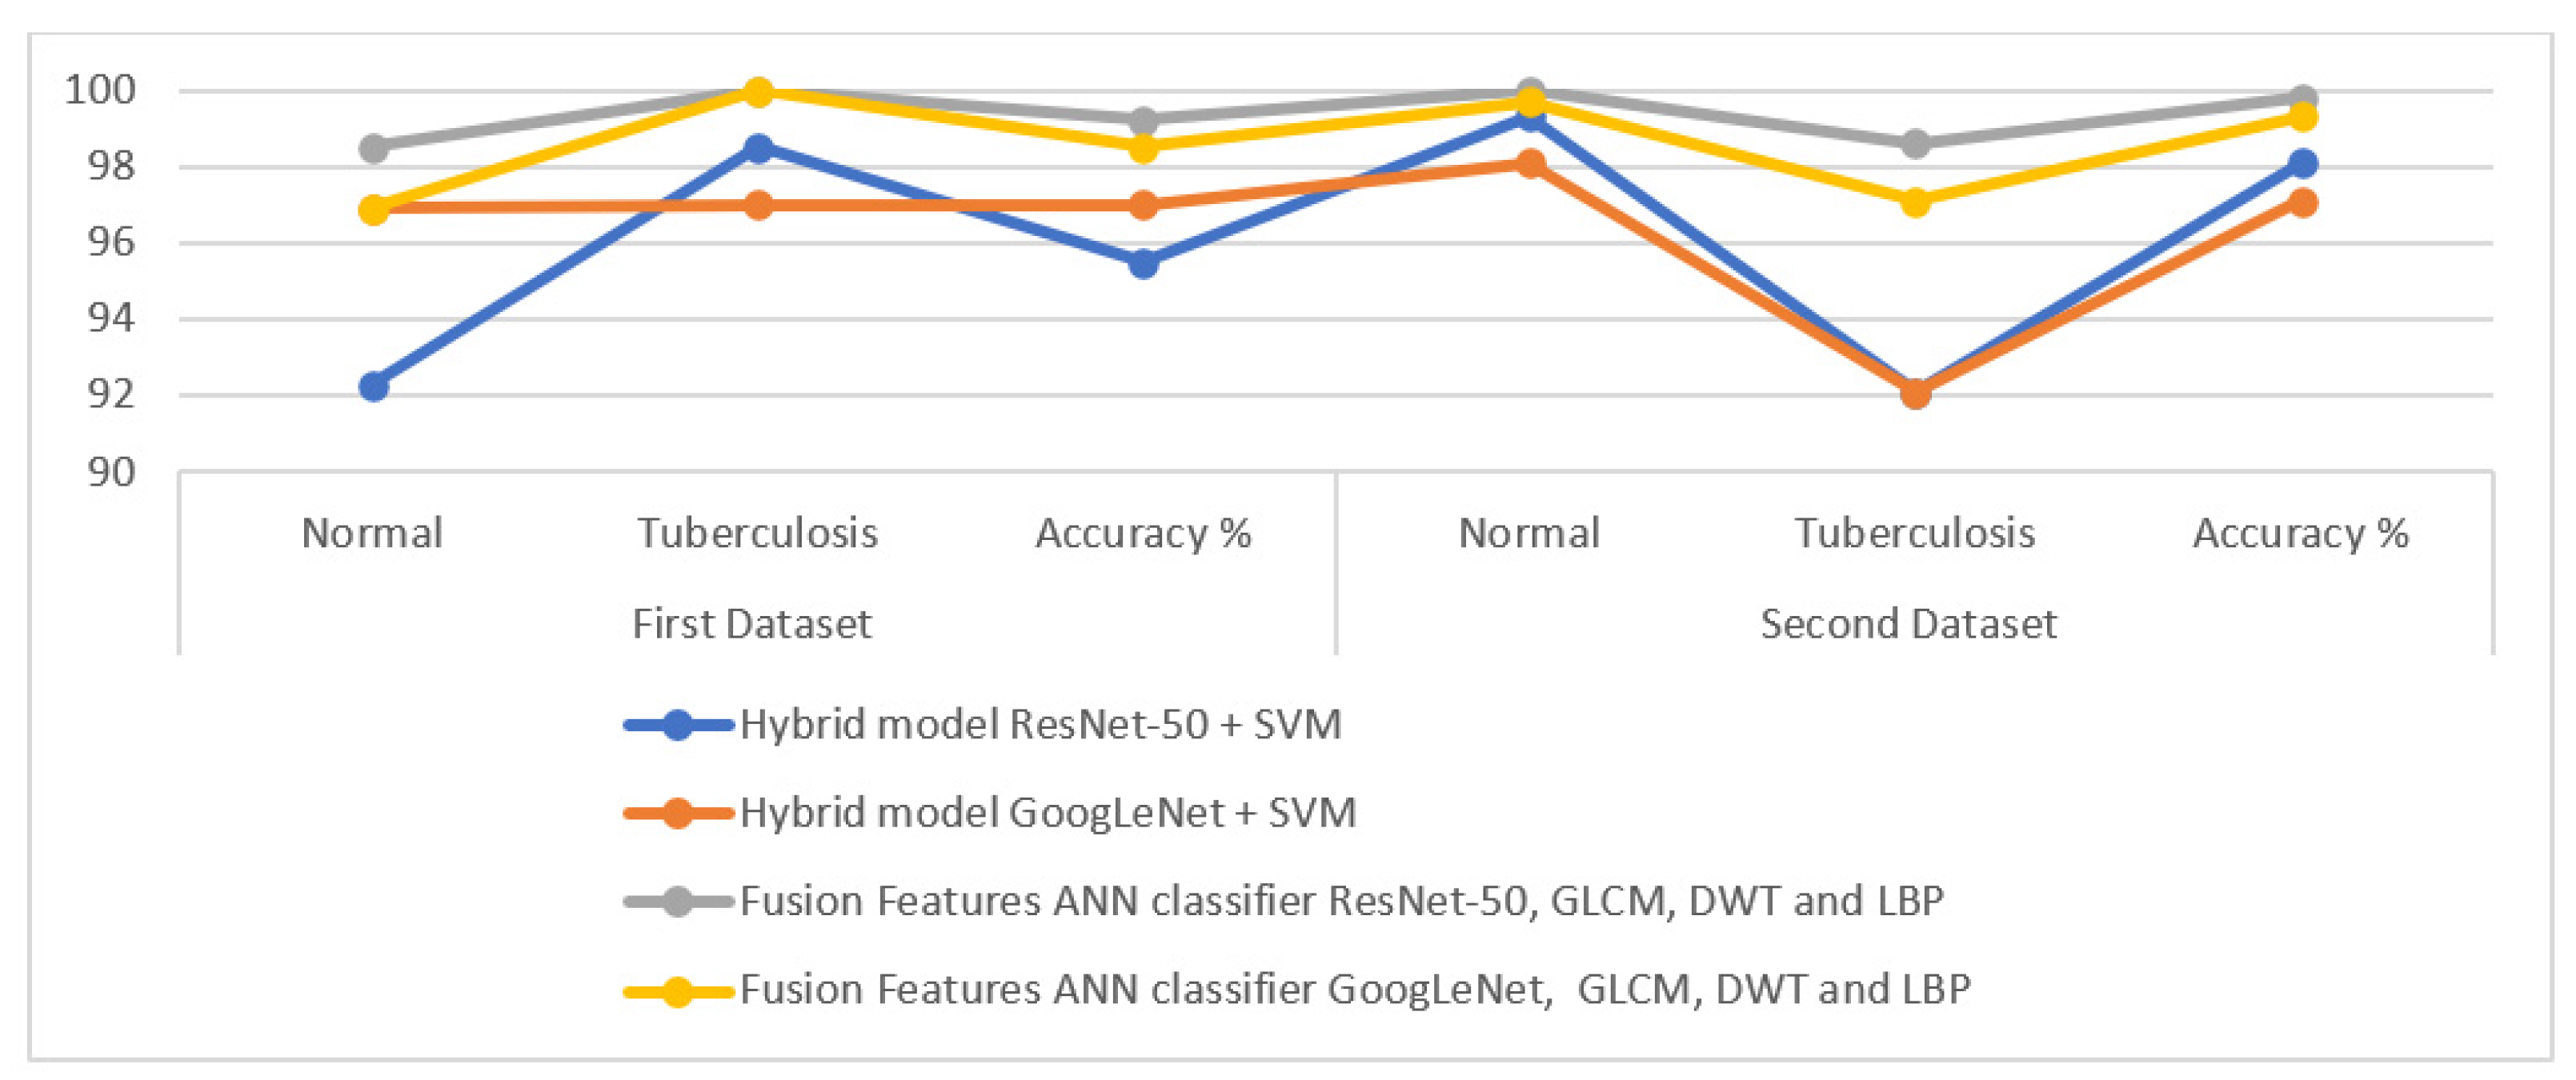
Table 5 describes the performance results of all of the proposed approaches for classifying the two X-ray datasets for the early detection of tuberculosis. First, for the first dataset, an ANN classifier with features of ResNet-50, GLCM, DWT and LBP achieved the best accuracy when classifying normal image classification of 98.5%, whereas ANN, based on the features of both methods, achieved the best accuracy for the classification of tuberculosis images of 100%. Second, for the second dataset, an ANN classifier with features from ResNet-50, GLCM, DWT and LBP achieved the best accuracy in normal image classification of 100% and the best accuracy in tuberculosis image classification of 98.6%.
Figure 15 presents the performance of all of the proposed X-ray diagnostic systems for the two tuberculosis datasets.
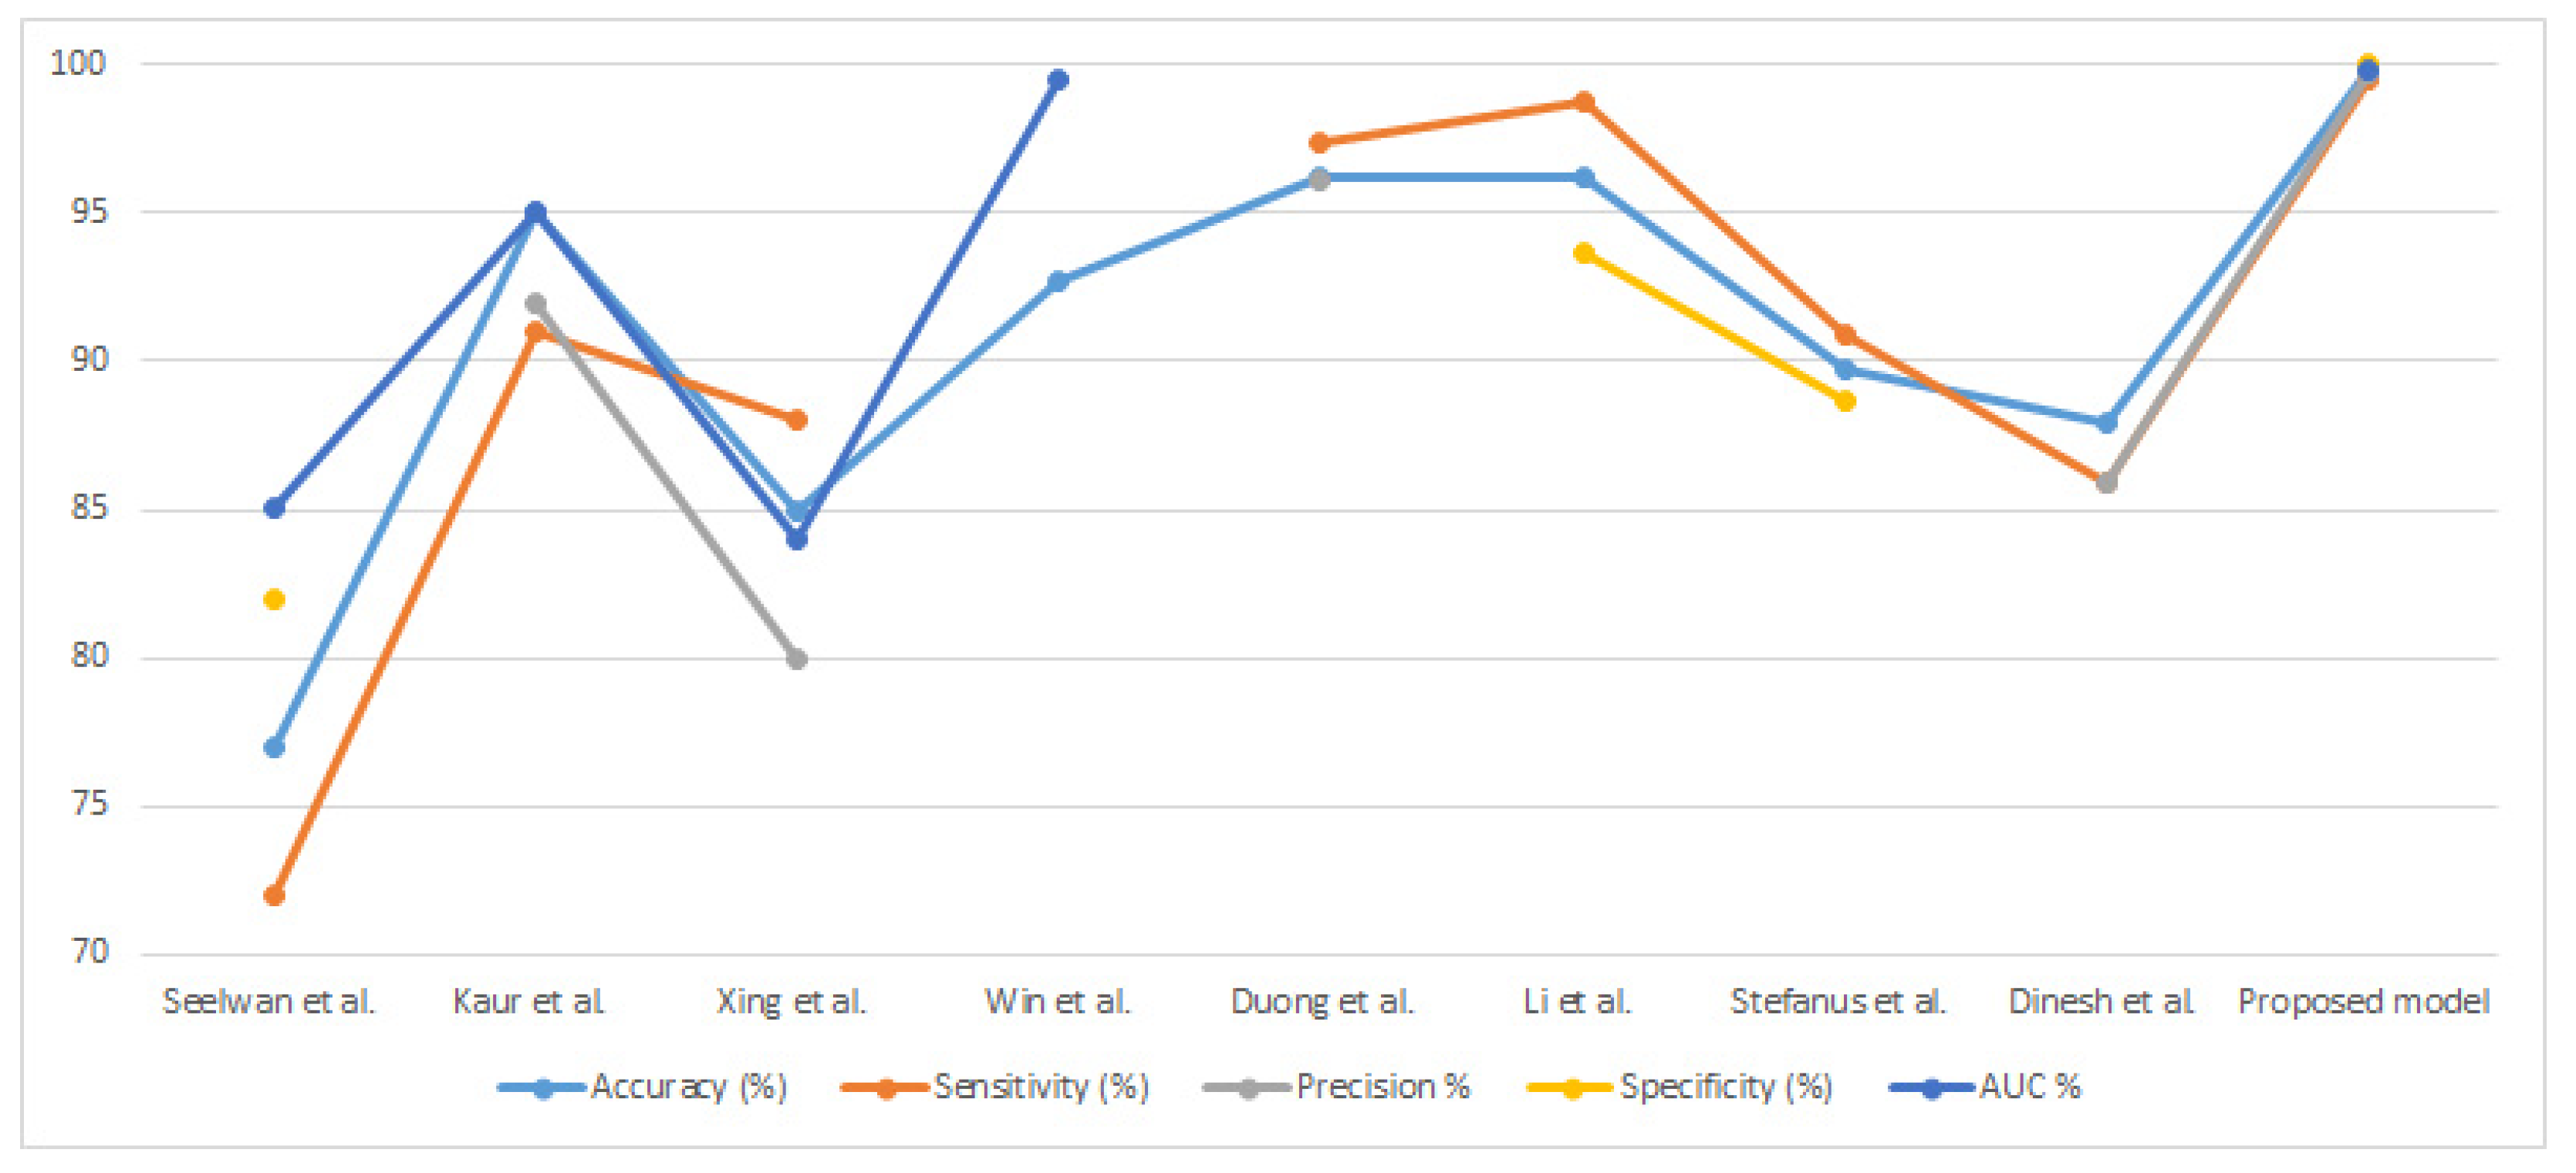
Table 6 and Figure 16 summarize a comparison between the performance of the proposed system in classifying the tuberculosis datasets and that of the systems in previous relevant studies. It is noted that the performance of our proposed system outperforms all previous systems. It is also noted that our systems were evaluated with many evaluation criteria, while the systems of previous studies were limited to some evaluation criteria. Previous systems achieved an accuracy of between 77% and 96.20%, while ours achieved an accuracy of 99.8%. Previous systems achieved a sensitivity between 72% and 98.7%, while our system achieved a sensitivity of 99.54%. Previous systems achieved a precision range of 80% to 96.1%, while our system achieved a precision of 99.68%. The previous systems achieved a specificity between 82% and 93.7%, while our system achieved a specificity of 100%. Finally, the previous systems achieved an AUC between 85.02% and 99.5%, while our system achieved an AUC of 99.82%. Therefore, our proposed systems outperformed the previous related systems in terms of performance.
6. Conclusions
Tuberculosis infection, with its rapid spread, has become a critical health problem. Such criticality may be reduced if the disease is detected at early stages, which can be achieved using a chest X-ray. Thus, this study deals with the classification of chest X-rays for the early detection of tuberculosis. In this study, two new proposed approaches are discussed; each approach has two different systems for classifying the two tuberculosis datasets. The first proposed approach is a two-part hybrid technology: the ResNet-50 and GoogLeNet CNN models and the SVM algorithm. The goal of CNN models is to extract deep features and store them in feature vectors. Since CNN models extract high-dimensionality features, the PCA technique was applied to reduce the dimensions of high-dimensionality features. The advantages of the SVM algorithm are its speed in training the dataset and its high accuracy in diagnosing the tuberculosis dataset. The hybrid techniques yielded promising results in diagnosing the two tuberculosis datasets. The second proposed approach is an ANN based on fused features extracted by the ResNet-50, GLCM, DWT and LBP and the GoogLeNet, GLCM, DWT and LBP. These approaches yielded promising results in diagnosing tuberculosis in the two datasets. An ANN network with features of ResNet-50, GLCM, DWT and LBP achieved an accuracy of 99.2%, a sensitivity of 99.23%, and a specificity of 99.41% for the first dataset; with the second dataset, it achieved an accuracy of 99.8%, a sensitivity of 99.54%, and a specificity of 99.68%.
Future work should involve extracting deep features using CNN models and integrating them into feature vectors to classify them using machine learning algorithms and neural networks.
The limitations encountered in this study include the lack of images in the tuberculosis dataset, which was overcome by means of the technique of artificially augmenting the data.
Author Contributions
Conceptualization, S.M.F., E.M.S. and N.E.; methodology, E.M.S., S.M.F. and N.E.; validation, S.M.F., N.E. and E.M.S.; formal analysis, N.E., S.M.F. and E.M.S.; investigation, E.M.S., S.M.F. and N.E.; resources, S.M.F., E.M.S. and N.E.; data curation E.M.S., S.M.F. and N.E.; writing—original draft preparation, E.M.S.; writing—review and editing, S.M.F. and N.E.; visualization, N.E., S.M.F. and E.M.S.; supervision, S.M.F., E.M.S. and N.E.; project administration, S.M.F. and N.E.; funding acquisition, S.M.F. and N.E. All authors have read and agreed to the published version of the manuscript.
Funding
The APC was funded by Prince Sultan University.
Data Availability Statement
Data supporting the proposed approaches in this study were collected from two public datasets that are publicly available at: https://www.kaggle.com/datasets/kmader/pulmonary-chest-xray-abnormalities/code?select=Montgomery (accessed on 9 April 2022). https://www.kaggle.com/datasets/tawsifurrahman/tuberculosis-tb-chest-xray-dataset (accessed on 9 April 2022).
Acknowledgments
The authors would like to acknowledge the support of Prince Sultan University for paying the Article Processing Charges (APC) of this publication.
Conflicts of Interest
The authors declare no conflict of interest.
References
- Yemen Incidence of Tuberculosis, 1960–2021—Knoema.com. Available online: https://knoema.com/atlas/Yemen/Incidence-of-tuberculosis (accessed on 15 June 2022).
- Al Jahdali, H.H.; Baharoon, S.; Abba, A.A.; Memish, Z.A.; Alrajhi, A.A.; AlBarrak, A.; Menzies, D. Saudi guidelines for testing and treatment of latent tuberculosis infection. Ann. Saudi Med. 2010, 30, 38–49. [Google Scholar] [CrossRef]
- Tuberculosis. Available online: https://www.who.int/news-room/fact-sheets/detail/tuberculosis (accessed on 29 May 2022).
- Zellweger, J.P.; Sotgiu, G.; Corradi, M.; Durando, P. The diagnosis of latent tuberculosis infection (LTBI): Currently available tests, future developments, and perspectives to eliminate tuberculosis (TB). Med. Lav. 2020, 111, 170. [Google Scholar] [CrossRef]
- Cao, X.F.; Li, Y.; Xin, H.N.; Zhang, H.R.; Pai, M.; Gao, L. Application of artificial intelligence in digital chest radiography reading for pulmonary tuberculosis screening. Chronic Dis. Transl. Med. 2021, 7, 35–40. [Google Scholar] [CrossRef]
- Qin, Z.Z.; Ahmed, S.; Sarker, M.S.; Paul, K.; Adel, A.S.S.; Naheyan, T.; Creswell, J. Can Artificial Intelligence (AI) Be Used to Accurately Detect Tuberculosis (TB) from Chest X-ray? A Multiplatform Evaluation of Five AI Products Used for TB Screening in a High TB-Burden Setting. 2022. Available online: http://arxiv.org/abs/2006.05509 (accessed on 29 May 2022).
- Satya, P.G.A.N.; Parikesit, A.A. Revolution in Detecting Tuberculosis using Radiology with Application of Deep Learning Algorithm. Cermin Dunia Kedokt. 2021, 48, 261–263. [Google Scholar] [CrossRef]
- Siddiqui, A.K.; Garg, V.K. An Analysis of Adaptable Intelligent Models for Pulmonary Tuberculosis Detection and Classification. SN Comput. Sci. 2021, 3, 34. [Google Scholar] [CrossRef]
- Sathitratanacheewin, S.; Sunanta, P.; Pongpirul, K. Deep learning for automated classification of tuberculosis-related chest X-Ray: Dataset distribution shift limits diagnostic performance generalizability. Heliyon 2020, 6, e04614. [Google Scholar] [CrossRef]
- Kaur, R.; Sharma, A. An Accurate Integrated System to detect Pulmonary and Extra Pulmonary Tuberculosis using Machine Learning Algorithms. Intel. Artif. 2021, 24, 104–122. [Google Scholar] [CrossRef]
- Ghorakavi, R.S. TBNet: Pulmonary tuberculosis diagnosing system using deep neural networks. arXiv 2019, arXiv:1902.08897. [Google Scholar] [CrossRef]
- Xing, Z.; Ding, W.; Zhang, S.; Zhong, L.; Wang, L.; Wang, J.; Ye, Z. Machine learning-based differentiation of nontuberculous mycobacteria lung disease and pulmonary tuberculosis using CT images. BioMed Res. Int. 2020, 2020, 6287545. [Google Scholar] [CrossRef]
- Hrizi, O.; Gasmi, K.; Ben Ltaifa, I.; Alshammari, H.; Karamti, H.; Krichen, M.; Mahmood, M.A. Tuberculosis Disease Diagnosis Based on an Optimized Machine Learning Model. J. Healthc. Eng. 2022, 2022, 8950243. [Google Scholar] [CrossRef]
- Oloko-Oba, M.; Viriri, S. Ensemble of EfficientNets for the Diagnosis of Tuberculosis. Comput. Intell. Neurosci. 2021, 2021, 9790894. Available online: https://www.hindawi.com/journals/cin/2021/9790894/ (accessed on 9 April 2022). [CrossRef]
- Dasanayaka, C.; Dissanayake, M.B. Deep learning methods for screening pulmonary tuberculosis using chest X-rays. Comput. Methods Biomech. Biomed. Eng. Imaging Vis. 2021, 9, 39–49. [Google Scholar] [CrossRef]
- Win, K.Y.; Maneerat, N.; Hamamoto, K.; Sreng, S. Hybrid learning of hand-crafted and deep-activated features using particle swarm optimization and optimized support vector machine for tuberculosis screening. Appl. Sci. 2020, 10, 5749. [Google Scholar] [CrossRef]
- Ayaz, M.; Shaukat, F.; Raja, G. Ensemble learning based automatic detection of tuberculosis in chest X-ray images using hybrid feature descriptors. Phys. Eng. Sci. Med. 2021, 44, 183–194. [Google Scholar] [CrossRef]
- Pasa, F.; Golkov, V.; Pfeiffer, F.; Cremers, D.; Pfeiffer, D. Efficient deep network architectures for fast chest X-ray tuberculosis screening and visualization. Sci. Rep. 2019, 9, 6268. [Google Scholar] [CrossRef] [Green Version]
- Heo, S.J.; Kim, Y.; Yun, S.; Lim, S.S.; Kim, J.; Nam, C.M.; Yoon, J.H. Deep learning algorithms with demographic information help to detect tuberculosis in chest radiographs in annual workers’ health examination data. Int. J. Environ. Res. Public Health 2019, 16, 250. [Google Scholar] [CrossRef] [Green Version]
- Munadi, K.; Muchtar, K.; Maulina, N.; Pradhan, B. Image enhancement for tuberculosis detection using deep learning. IEEE Access 2020, 8, 217897–217907. [Google Scholar] [CrossRef]
- Rahman, M.; Cao, Y.; Sun, X.; Li, B.; Hao, Y. Deep pre-trained networks as a feature extractor with XGBoost to detect tuberculosis from chest X-ray. Comput. Electr. Eng. 2021, 93, 107252. Available online: https://www.sciencedirect.com/science/article/pii/S004579062100238X (accessed on 9 April 2022). [CrossRef]
- Duong, L.T.; Le, N.H.; Tran, T.B.; Ngo, V.M.; Nguyen, P.T. Detection of tuberculosis from chest X-ray images: Boosting the performance with vision transformer and transfer learning. Expert Syst. Appl. 2021, 184, 115519. [Google Scholar] [CrossRef]
- Chithra, R.S.; Jagatheeswari, P. Severity detection and infection level identification of tuberculosis using deep learning. Int. J. Imaging Syst. Technol. 2020, 30, 994–1011. [Google Scholar] [CrossRef]
- Pulmonary Chest X-ray Abnormalities|Kaggle. Available online: https://www.kaggle.com/datasets/kmader/pulmonary-chest-xray-abnormalities?select=Montgomery (accessed on 2 June 2022).
- Rahman, T.; Khandakar, A.; Kadir, M.A.; Islam, K.R.; Islam, K.F.; Mazhar, R.; Chowdhury, M.E. Reliable tuberculosis detection using chest X-ray with deep learning, segmentation and visualization. IEEE Access 2020, 8, 191586–191601. [Google Scholar] [CrossRef]
- Al-Mekhlafi, Z.G.; Senan, E.M.; Rassem, T.H.; Mohammed, B.A.; Makbol, N.M.; Alanazi, A.A.; Ghaleb, F.A. Deep Learning and Machine Learning for Early Detection of Stroke and Haemorrhage. Comput. Mater. Contin. 2022, 72, 775–796. [Google Scholar] [CrossRef]
- Scarpiniti, M.; Sarv Ahrabi, S.; Baccarelli, E.; Piazzo, L.; Momenzadeh, A. A Histogram-Based Low-Complexity Approach for the Effective Detection of COVID-19 Disease from CT and X-ray Images. Appl. Sci. 2021, 11, 8867. [Google Scholar] [CrossRef]
- Mohammed, B.A.; Senan, E.M.; Rassem, T.H.; Makbol, N.M.; Alanazi, A.A.; Al-Mekhlafi, Z.G.; Ghaleb, F.A. Multi-method analysis of medical records and MRI images for early diagnosis of dementia and Alzheimer’s disease based on deep learning and hybrid methods. Electronics 2021, 10, 2860. [Google Scholar] [CrossRef]
- Abunadi, I.; Senan, E.M. Multi-Method Diagnosis of Blood Microscopic Sample for Early Detection of Acute Lymphoblastic Leukemia Based on Deep Learning and Hybrid Techniques. Sensors 2022, 22, 1629. [Google Scholar] [CrossRef]
- Sitaula, C.; Hossain, M.B. Attention-based VGG-16 model for COVID-19 chest X-ray image classification. Appl. Intell. 2021, 51, 2850–2863. [Google Scholar] [CrossRef]
- Alawi, A.E.B.; Al-basser, A.; Sallam, A.; Al-sabaeei, A.; Al-khateeb, H. Convolutional neural networks model for screening tuberculosis disease. In Proceedings of the 2021 International Conference of Technology, Science and Administration (ICTSA), Taiz, Yemen, 22–24 March 2021; IEEE: New York, NY, USA, 2021; pp. 1–5. [Google Scholar] [CrossRef]
- Ali, R.; Hardie, R.C.; Narayanan, B.N.; Kebede, T.M. IMNets: Deep Learning Using an Incremental Modular Network Synthesis Approach for Medical Imaging Applications. Appl. Sci. 2022, 12, 5500. [Google Scholar] [CrossRef]
- Sitaula, C.; Shahi, T.B.; Aryal, S.; Marzbanrad, F. Fusion of multi-scale bag of deep visual words features of chest X-ray images to detect COVID-19 infection. Sci. Rep. 2021, 11, 23914. [Google Scholar]
- Abunadi, I.; Senan, E.M. Deep learning and machine learning techniques of diagnosis dermoscopy images for early detection of skin diseases. Electronics 2021, 10, 3158. [Google Scholar] [CrossRef]
- Ahmed, I.A.; Senan, E.M.; Rassem, T.H.; Ali, M.A.; Shatnawi, H.S.A.; Alwazer, S.M.; Alshahrani, M. Eye Tracking-Based Diagnosis and Early Detection of Autism Spectrum Disorder Using Machine Learning and Deep Learning Techniques. Electronics 2022, 11, 530. [Google Scholar] [CrossRef]
- Senan, E.M.; Jadhav, M.E.; Kadam, A. Classification of PH2 images for early detection of skin diseases. In Proceedings of the 2021 6th International Conference for Convergence in Technology (I2CT), Maharashtra, India, 2–4 April 2021; pp. 1–7. [Google Scholar] [CrossRef]
- Zhang, Y.D.; Wang, W.; Zhang, X.; Wang, S.H. Secondary pulmonary tuberculosis recognition by 4-direction varying-distance GLCM and fuzzy SVM. Mob. Netw. Appl. 2022, 10, 1–14. [Google Scholar] [CrossRef]
- Rizwan, A.; Iqbal, N.; Ahmad, R.; Kim, D.-H. WR-SVM Model Based on the Margin Radius Approach for Solving the Minimum Enclosing Ball Problem in Support Vector Machine Classification. Appl. Sci. 2021, 11, 4657. [Google Scholar] [CrossRef]
- Alshudukhi, J.; Aljaloud, S.; Alharbi, T.S.; Abebaw, S. Convolutional Neural Network Architectures to Solve a Problem of Tuberculosis Classification Using X-Ray Images of the Lungs. J. Nanomater. 2022, 2022, 2509830. [Google Scholar] [CrossRef]
- Fati, S.M.; Senan, E.M.; Azar, A.T. Hybrid and Deep Learning Approach for Early Diagnosis of Lower Gastrointestinal Diseases. Sensors 2022, 22, 4079. [Google Scholar] [CrossRef]
- Hussain, L.; Alsolai, H.; Hassine, S.B.H.; Nour, M.K.; Duhayyim, M.A.; Hilal, A.M.; Salama, A.S.; Motwakel, A.; Yaseen, I.; Rizwanullah, M. Lung Cancer Prediction Using Robust Machine Learning and Image Enhancement Methods on Extracted Gray-Level Co-Occurrence Matrix Features. Appl. Sci. 2022, 12, 6517. [Google Scholar] [CrossRef]
- Senan, E.M.; Jadhav, M.E. Diagnosis of dermoscopy images for the detection of skin lesions using SVM and KNN. In Proceedings of Third International Conference on Sustainable Computing; Springer: Singapore, 2022; pp. 125–134. [Google Scholar] [CrossRef]
- He, Z.; Ma, S.; Wang, L.; Peng, P. A Novel Wavelet Selection Method for Seismic Signal Intelligent Processing. Appl. Sci. 2022, 12, 6470. [Google Scholar] [CrossRef]
- Dave, V.; Singh, S.; Vakharia, V. Diagnosis of bearing faults using multi fusion signal processing techniques and mutual information. Indian J. Eng. Mater. Sci. (IJEMS) 2021, 27, 878–888. [Google Scholar]
- Priya, E. An automated approach for the identification of TB images enhanced by non-uniform illumination correction. In Signal and Image Processing Techniques for the Development of Intelligent Healthcare Systems; Springer: Singapore, 2021; pp. 261–283. [Google Scholar] [CrossRef]
- Alrowais, F.; Alotaibi, S.S.; Al-Wesabi, F.N.; Negm, N.; Alabdan, R.; Marzouk, R.; Mehanna, A.S.; Al Duhayyim, M. Deep Transfer Learning Enabled Intelligent Object Detection for Crowd Density Analysis on Video Surveillance Systems. Appl. Sci. 2022, 12, 6665. [Google Scholar] [CrossRef]
- Senan, E.M.; Jadhav, M.E. Techniques for the Detection of Skin Lesions in PH 2 Dermoscopy Images Using Local Binary Pattern (LBP). In International Conference on Recent Trends in Image Processing and Pattern Recognition; Springer: Singapore, 2020; pp. 14–25. [Google Scholar] [CrossRef]
- Senan, E.M.; Abunadi, I.; Jadhav, M.E.; Fati, S.M. Score and Correlation Coefficient-Based Feature Selection for Predicting Heart Failure Diagnosis by Using Machine Learning Algorithms. Comput. Math. Methods Med. 2021, 2021, 8500314. [Google Scholar] [CrossRef]
- Senan, E.M.; Jadhav, M.E.; Rassem, T.H.; Aljaloud, A.S.; Mohammed, B.A.; Al-Mekhlafi, Z.G. Early Diagnosis of Brain Tumour MRI Images Using Hybrid Techniques between Deep and Machine Learning. Comput. Math. Methods Med. 2022, 2022, 8330833. [Google Scholar] [CrossRef]
- Khafaji, H.Q.A.; Abdul Wahhab, H.A.; Alsaedi, S.S.; Al-Maliki, W.A.K.; Alobaid, F.; Epple, B. Thermal Performance Evaluation of a Tubular Heat Exchanger Fitted with Combined Basket–Twisted Tape Inserts. Appl. Sci. 2022, 12, 4807. [Google Scholar] [CrossRef]
- Li, X.; Zhou, Y.; Du, P.; Lang, G.; Xu, M.; Wu, W. A deep learning system that generates quantitative CT reports for diagnosing pulmonary tuberculosis. Appl. Intell. 2021, 51, 4082–4093. [Google Scholar] [CrossRef]
- Hijazi, M.H.A.; Hwa, S.K.T.; Bade, A.; Yaakob, R.; Jeffree, M.S. Ensemble deep learning for tuberculosis detection using chest X-ray and canny edge detected images. IAES Int. J. Artif. Intell. 2019, 8, 429. [Google Scholar] [CrossRef]
- Dinesh Jackson Samuel, R.; Rajesh Kanna, B. Tuberculosis (TB) detection system using deep neural networks. Neural Comput. Appl. 2019, 31, 1533–1545. [Google Scholar] [CrossRef]
Figure 1.
The basic structure of classifying X-ray images from the two datasets for the early detection of tuberculosis.
Figure 1.
The basic structure of classifying X-ray images from the two datasets for the early detection of tuberculosis.

Figure 2.
A set of X-ray images of tuberculosis. (a) Shenzhen dataset. (b) TB Chest Radiography Database.
Figure 2.
A set of X-ray images of tuberculosis. (a) Shenzhen dataset. (b) TB Chest Radiography Database.

Figure 3.
The set of X-ray images of tuberculosis after the enhancement process. (a) Shenzhen dataset. (b) TB Chest Radiography Database.
Figure 3.
The set of X-ray images of tuberculosis after the enhancement process. (a) Shenzhen dataset. (b) TB Chest Radiography Database.

Figure 4.
The basic structure of the first proposed system for diagnosing tuberculosis based on the two datasets.
Figure 4.
The basic structure of the first proposed system for diagnosing tuberculosis based on the two datasets.

Figure 5.
The basic structure of the second proposal system for diagnosing tuberculosis based on the two datasets.
Figure 5.
The basic structure of the second proposal system for diagnosing tuberculosis based on the two datasets.

Figure 6.
Results of the hybrid approaches to diagnosing tuberculosis based on the two datasets.

Figure 7.
Confusion matrix for the classification of the first dataset of tuberculosis using the hybrid approaches. (a) ResNet-50 + SVM. (b) GoogLeNet + SVM.
Figure 7.
Confusion matrix for the classification of the first dataset of tuberculosis using the hybrid approaches. (a) ResNet-50 + SVM. (b) GoogLeNet + SVM.

Figure 8.
Confusion matrix for the classification of the second dataset of tuberculosis using the hybrid approaches. (a) ResNet-50 +SVM. (b) GoogLeNet + SVM.
Figure 8.
Confusion matrix for the classification of the second dataset of tuberculosis using the hybrid approaches. (a) ResNet-50 +SVM. (b) GoogLeNet + SVM.

Figure 9.
Display validation checks and gradient of the ANN to classify the two datasets based on the hybrid features. (a) ResNet-50, GLCM, DWT first dataset and LBP. (b) GoogLeNet, GLCM, DWT and LBP first dataset. (c) ResNet-50, GLCM, DWT and LBP second dataset. (d) GoogLeNet, GLCM, DWT and LBP second dataset.

Figure 10.
Display validation performance of the ANN to classify the two datasets based on the hybrid features. (a) ResNet-50, GLCM, DWT first dataset and LBP. (b) GoogLeNet, GLCM, DWT and LBP first dataset. (c) ResNet-50, GLCM, DWT and LBP second dataset. (d) GoogLeNet, GLCM, DWT and LBP second dataset.

Figure 11.
Display error histogram of the ANN to classify the two datasets based on the hybrid features. (a) ResNet-50, GLCM, DWT first dataset and LBP. (b) GoogLeNet, GLCM, DWT and LBP first dataset. (c) ResNet-50, GLCM, DWT and LBP second dataset. (d) GoogLeNet, GLCM, DWT and LBP second dataset.
Figure 11.
Display error histogram of the ANN to classify the two datasets based on the hybrid features. (a) ResNet-50, GLCM, DWT first dataset and LBP. (b) GoogLeNet, GLCM, DWT and LBP first dataset. (c) ResNet-50, GLCM, DWT and LBP second dataset. (d) GoogLeNet, GLCM, DWT and LBP second dataset.

Figure 12.
Confusion matrix of the ANN to classify the first dataset based on the hybrid features. (a) ResNet-50, GLCM, DWT and LBP. (b) GoogLeNet, GLCM, DWT and LBP.
Figure 12.
Confusion matrix of the ANN to classify the first dataset based on the hybrid features. (a) ResNet-50, GLCM, DWT and LBP. (b) GoogLeNet, GLCM, DWT and LBP.

Figure 13.
Confusion matrix of the ANN to classify the second dataset based on the hybrid features. (a) ResNet-50, GLCM, DWT and LBP. (b) GoogLeNet, GLCM, DWT and LBP.
Figure 13.
Confusion matrix of the ANN to classify the second dataset based on the hybrid features. (a) ResNet-50, GLCM, DWT and LBP. (b) GoogLeNet, GLCM, DWT and LBP.

Figure 14.
Displaying the performance of the ANN when classifying two tuberculosis datasets.

Figure 15.
Performance of all of the proposed approaches when classifying the two tuberculosis datasets.
Figure 15.
Performance of all of the proposed approaches when classifying the two tuberculosis datasets.

Figure 16.
Comparison between the proposed system and previous related studies.


Table 1.
Splitting the two X-ray datasets for TB.
| Datasets | First Dataset | Second Dataset | ||||
|---|---|---|---|---|---|---|
| Phase | Training and Validation | Testing 20% | Training and Validation | Testing 20% | ||
| Classes | Training (80%) | Validation (20%) | Training (80%) | Validation (20%) | ||
| Normal | 209 | 52 | 65 | 2240 | 560 | 700 |
| Tuberculosis | 215 | 54 | 67 | 448 | 112 | 140 |
Table 2.
Data augmentation for X-ray tuberculosis images to balance the two datasets.
| Phase | Training Phase | |||
|---|---|---|---|---|
| Datasets | First Dataset | Second Dataset | ||
| Classes | Normal | Tuberculosis | Normal | Tuberculosis |
| Before augmentation | 209 | 215 | 2240 | 448 |
| After augmentation | 2090 | 2150 | 2240 | 2240 |
Table 3.
Results of the performance of hybrid systems on the two tuberculosis datasets.
| Datasets | First Dataset | Second Dataset | ||
|---|---|---|---|---|
| Measure | ResNet-50 + SVM | GoogLeNet + SVM | ResNet-50 + SVM | GoogLeNet + SVM |
| Accuracy % | 95.5 | 97 | 98.1 | 97.1 |
| Sensitivity % | 96.14 | 97.21 | 95.52 | 95 |
| Precision % | 95.72 | 97.45 | 97.11 | 94.5 |
| Specificity % | 95.84 | 97.38 | 95.61 | 94.85 |
| AUC % | 97.28 | 98.13 | 98.43 | 97.63 |
Table 4.
Results of the ANN classifier based on the hybrid features for the two tuberculosis datasets.
Table 4.
Results of the ANN classifier based on the hybrid features for the two tuberculosis datasets.
| Datasets | First Dataset | Second Dataset | ||
|---|---|---|---|---|
| Hybrid Features | ResNet-50, GLCM, DWT and LBP | GoogLeNet, GLCM, DWT and LBP | ResNet-50, GLCM, DWT and LBP | GoogLeNet, GLCM, DWT and LBP |
| Accuracy % | 99.2 | 98.5 | 99.8 | 99.3 |
| Sensitivity % | 99.23 | 98.71 | 99.54 | 98.5 |
| Precision % | 99.5 | 99.21 | 100 | 99.41 |
| Specificity % | 99.41 | 98.56 | 99.68 | 98.66 |
| AUC % | 99.78 | 99.28 | 99.82 | 99.32 |
Table 5.
Performance of all proposed approaches for the early detection of tuberculosis.
| Datasets | First Dataset | Second Dataset | ||||||
|---|---|---|---|---|---|---|---|---|
| Systems | Normal | Tuberculosis | Accuracy % | Normal | Tuberculosis | Accuracy % | ||
| Hybrid model | ResNet-50 + SVM | 92.3 | 98.5 | 95.5 | 99.3 | 92.1 | 98.1 | |
| GoogLeNet + SVM | 96.9 | 97 | 97 | 98.1 | 92.1 | 97.1 | ||
| Fusion Features | ANN classifier | ResNet-50, GLCM, DWT and LBP | 98.5 | 100 | 99.2 | 100 | 98.6 | 99.8 |
| GoogLeNet GLCM, DWT and LBP | 96.9 | 100 | 98.5 | 99.7 | 97.1 | 99.3 | ||
Table 6.
Comparison of the performance of the proposed systems with that of the previous related systems.
Table 6.
Comparison of the performance of the proposed systems with that of the previous related systems.
| Previous Research | Accuracy (%) | Sensitivity (%) | Precision % | Specificity (%) | AUC % | Training/Testing Ratio |
|---|---|---|---|---|---|---|
| Seelwan et al. [9] | 77 | 72 | - | 82 | 85.02 | 75:25 |
| Kaur et al. [10] | 95 | 91 | 92 | - | 95 | 80:20 |
| Xing et al. [12] | 85 | 88 | 80 | - | 84 | 80:20 |
| Win et al. [16] | 92.7 | - | - | - | 99.5 | 70:30 |
| Duong et al. [22] | 96.17 | 97.4 | 96.1 | - | - | 88:12 |
| Li et al. [51] | 96.2 | 98.7 | - | 93.7 | - | 75:25 |
| Stefanus et al. [52] | 89.77 | 90.91 | - | 88.64 | - | - |
| Dinesh et al. [53] | 87.9 | 85.9 | 85.9 | - | - | 80:20 |
| Proposed model | 99.8 | 99.54 | 99.68 | 100 | 99.82 | 80:20 |
Publisher’s Note: MDPI stays neutral with regard to jurisdictional claims in published maps and institutional affiliations. |
© 2022 by the authors. Licensee MDPI, Basel, Switzerland. This article is an open access article distributed under the terms and conditions of the Creative Commons Attribution (CC BY) license (https://creativecommons.org/licenses/by/4.0/).
Share and Cite
MDPI and ACS Style
Fati, S.M.; Senan, E.M.; ElHakim, N. Deep and Hybrid Learning Technique for Early Detection of Tuberculosis Based on X-ray Images Using Feature Fusion. Appl. Sci. 2022, 12, 7092. https://doi.org/10.3390/app12147092
AMA Style
Fati SM, Senan EM, ElHakim N. Deep and Hybrid Learning Technique for Early Detection of Tuberculosis Based on X-ray Images Using Feature Fusion. Applied Sciences. 2022; 12(14):7092. https://doi.org/10.3390/app12147092
Chicago/Turabian StyleFati, Suliman Mohamed, Ebrahim Mohammed Senan, and Narmine ElHakim. 2022. "Deep and Hybrid Learning Technique for Early Detection of Tuberculosis Based on X-ray Images Using Feature Fusion" Applied Sciences 12, no. 14: 7092. https://doi.org/10.3390/app12147092
Note that from the first issue of 2016, this journal uses article numbers instead of page numbers. See further details here.