Article

In Vitro and In Silico Studies to Assess Edible Flowers’ Antioxidant Activities

by
Eftichia Kritsi
1,2,
Thalia Tsiaka
1,2,
Alexandros-George Ioannou
1,
Vassiliki Mantanika
1,
Irini F. Strati
1,
Irene Panderi
3,
Panagiotis Zoumpoulakis
1,2,* and
Vassilia J. Sinanoglou
1,*
1
Laboratory of Chemistry, Analysis & Design of Food Processes, Department of Food Science and Technology, University of West Attica, Agiou Spyridonos, 12243 Egaleo, Greece
2
Institute of Chemical Biology, National Hellenic Research Foundation, 48 Vas. Constantinou Avenue, 11635 Athens, Greece
3
Department of Pharmacy, Division of Pharmaceutical Chemistry, University of Athens, 15771 Athens, Greece
*
Authors to whom correspondence should be addressed.
Appl. Sci. 2022, 12(14), 7331; https://doi.org/10.3390/app12147331
Submission received: 24 June 2022 / Revised: 14 July 2022 / Accepted: 19 July 2022 / Published: 21 July 2022
(This article belongs to the Special Issue Phytochemicals and Antioxidant Properties of Edible Plants)

Abstract

:
The incorporation of edible flowers in the human diet and culinary preparations dates back to ancient times. Nowadays, edible flowers have gained great attention due to their health-promoting and nutritive effects and their widespread acceptance by consumers. Therefore, edible flowers are ideal candidates for use in the design and development of functional foods and dietary supplements, representing a new and promising trend in the food industry. Thus, the present study attempts to assess the potential of various edible flowers against oxidative stress by applying a combination of in vitro, in silico and spectroscopic techniques. Specifically, the spectroscopic profiles of edible flower extracts were evaluated using ATR-FTIR spectroscopy, while their total phenolic contents and antioxidant/antiradical activities were determined spectrophotometrically. The most abundant phytochemicals in the studied flowers were examined as enzyme inhibitors through molecular docking studies over targets that mediate antioxidant mechanisms in vivo. Based on the results, the red China rose followed by the orange Mexican marigold exhibited the highest TPCs and antioxidant activities. All samples showed the characteristic FTIR band of the skeletal vibration of phenolic aromatic rings. Phenolic compounds seem to exhibit antioxidant activity with respect to NADPH oxidase, myeloperoxidase (MP), cytochrome P450 and, to a lesser extent, xanthine oxidase (XO) enzymes.

1. Introduction

Edible flowers are defined as non-toxic, harmless food products with important nutraceutical properties beneficial for human health. Therefore, they can be safely incorporated in human nutrition [1,2]. The most popular edible flowers include chrysanthemum, rose, hibiscus, violet, carnation, pansy, marigold, calendula, among others [2]. Edible flowers can enhance the aroma, taste and appearance of meals and can be used in the development of functional foods [3]. They are of great nutritional interest as they are almost free of calories and constitute rich sources of phytochemicals, such as phenolics, carotenoids, other pigments, terpenoids, alkaloids, and vitamins, all associated with significant health benefits [4]. The composition of edible flowers in terms of bioactive constituents depends on the botanical part of the flower (petal, pollen, nectar, etc.), the flowering stage, the seasonality of flower production, color differentiation among the cultivars, soil and climatic conditions, production processes, geographical origin, among other factors [5,6]. Edible flowers and their extracts have been reported to exhibit high antioxidant, antiradical, antimicrobial, antibacterial, antithrombotic, anti-inflammatory, anti-obesity, anti-hyperglycemic, anti-cholesterol, anti-hypertensive, antitumor and anti-diabetic activities [5,7,8,9]. Their phytochemical profiles have been studied using a variety of analytical methods. Indicatively, flowers belonging to Calendula, Carthamus, Cassia, Centaurea, Chamaemelum, Chrysanthemum, Dahlia, Hibiscus, Lavandula, Lonicera, Monarda, Ocimum, Rosa, Salvia, Spilanthes, Tagetes, Theobroma and Tropaeolum species were investigated by Fourier-transform infrared (FTIR) spectral analysis [10,11,12], high-performance liquid chromatography coupled with mass spectrometry or with diode-array detection (HPLC–DAD, LC–DAD–ESI/MSn) [11,13,14,15,16], proton nuclear magnetic resonance spectroscopy (1H-NMR) [17,18], direct-infusion high-resolution mass spectrometry (DI-HRMS) [17] and gas chromatography–mass spectrometry (GC–MS) [19,20].
Apart from analytical methodologies, in silico techniques, such as molecular docking, have been widely utilized to evaluate the potential of phytochemicals to inhibit enzymes that negatively influence antioxidant activity [21,22,23,24,25]. Several enzymes, such as NADPH oxidase, cytochrome P450 (CP450), lipoxygenase (LOX), myeloperoxidase (MP) and xanthine oxidase (XO), are responsible for the generation of reactive oxygen species (ROS) during the metabolism of arachidonic acid and their inhibition is of paramount importance, since the ROS production cycle is thereby interrupted. As a result, redox homeostasis is regulated and oxidative stress is decreased [23,26].
Hence, it would be particularly interesting to studythe application of in vitro and in silico methodologies in combination with thespectroscopic profiling for the phytochemical evaluation of edible flowers and next their potential exploitation in the food industry. Therefore, the first goal of the study was to extract the bioactive compounds of the petals of selected edible flowers, to evaluate the extracts’ spectroscopic profiles by attenuated total reflectance Fourier-transform infrared (ATR-FTIR) spectroscopy and to establish their total phenolic contents and antioxidant and antiradical activities. In a step further, the most frequently encountered phytochemicals in edible flowers, based on data reported in the literature, were subjected to molecular docking studies to identify their binding affinities and inhibition potential in relation to multiple molecular targets mediating antioxidant activity. The ultimate goal was to evaluate the effectiveness of flower extracts as potential sources of antioxidants either through their radical scavenging and reducting power capacities or through their antioxidant enzymatic activities.

2. Materials and Methods

2.1. Standards and Reagents

All solvents used for the spectrophotometric assays were of HPLC grade and were obtained from Mallinckrodt Chemical Works (St. Louis, MO, USA). Folin–Ciocalteu phenol reagent, Trolox (6-hydroxy-2,5,7,8-tetramethylchroman-2-carboxylic acid), Ferrous sulfate heptahydrate, 2,4,6-tris(2-pyridyl)-S-triazine (TPTZ) and iron(III) chloride hexahydrate were obtained from the Sigma Chemical Co. (St. Louis, MO, USA); ABTS (2,20-azinobis(3-ethylbenzothiazoline-6-sulfonic acid)) was obtained from the Tokyo Chemical Industry Co. Ltd. (Tokyo, Japan); and gallic acid (3,4,5-trihydroxybenzoic acid) was obtained from Alfa Aesar (Karlsruh, Germany).

2.2. Sample Collection and Characterization

The flowers were collected during autumn from the flower market in central Athens. Three flowerpots for each studied flower, containing at least thirty flowers in total, were purchased. The petals were carefully removed from the flowers and then weighed in order to be used for phenolic compound extraction. The family, scientific and common names, together with the colors of the flower samples, are given in Table 1. The moisture content of fresh flower petals was determined by a moisture analyzer—the Kern MLS 50-3 (Balingen, Germany).

2.3. Extraction of Phenolic Compounds

Each sample of fresh flower petals (1 g) was extracted with 20 mL of methanol–water, 80:20 (v:v), at room temperature, for 72 h. This procedure was repeated six times. The extracts were filtered using a Büchner funnel and stored at −5 °C for all the spectrophotometric assays. After the spectrophotometric studies, the remaining flower extracts were freeze-dried in a Modulyo D Freeze Dryer equipped with a Thermo Savant ValuPump VLP200 (Thermo Electron Corporation, Thermo Fisher Scientific, Waltham, MA, USA) at −50 °C for 48 h at 2 × 10⁻¹ mbar. Following freeze-drying, each extract powder was ground using a blender in order to perform the ATR-FTIR analysis.

2.4. Spectrophotometric Studies

2.4.1. Total Phenolic Content (TPC)

The total phenolic content (TPC) of the flower extracts was determined by applying a modified micromethod of the Folin–Ciocalteu (FC) colorimetric assay, as described by Andreou et al. [27]. The results were expressed as mg of gallic acid equivalents (GAE) per 1 g of flower, using standard solutions with a range of 25–500 mg L−1 of gallic acid. The photometric measurements were performed at 750 nm using a Vis spectrophotometer (Spectro 23 Digital Spectrophotometer, Labomed, Inc., Los Angeles, CA, USA).

2.4.2. Scavenging Activity on 2,2′-Azino-Bis-(3-Ethylbenzothiazoline-6-Sulfonic Acid) Radical (ABTS●+)

The antiradical activity of flower extracts was determined according to the method described by Lantzouraki et al. [28]. Trolox was used as the standard compound and the antiradical activity of samples was expressed as mg of Trolox Equivalents (TE) per 1 g of flower, using standard solutions with a concentration range of 0.20–1.5 mM. Absorbance was measured at 734 nm with a Vis spectrophotometer (Spectro 23 Digital Spectrophotometer, Labomed, Inc., Los Angeles, CA, USA).

2.4.3. Ferric Reducing/Antioxidant Power Assay (FRAP)

The ferric reducing/antioxidant power (FRAP) assay of the flower extracts was carried out according to the modified method of Lantzouraki et al. [29]. A standard curve was prepared using various concentrations (600–2000 μM) of FeSO4·7H2O stock solutions. The results were expressed as mg of Fe (II) per 1g of flower. Absorbance was measured at 595 nm on a Vis spectrophotometer (Spectro 23 Digital Spectrophotometer, Labomed, Inc., Los Angeles, CA, USA).

2.5. Fourier-Transform Infrared Spectroscopy with Attenuated Total Reflectance (ATR-FTIR)

The FTIR spectrum was recorded at room temperature using attenuated total reflectance (ATR). Each powdered sample was loaded in an FTIR spectrometer (Shimadzu, IRAffinity-1S FTIR Spectrometer, Kyoto, Japan). The ATR reference was set at 3284.77 cm−1. The samples and the background spectra were obtained from 4000 to 499 cm−1 and the average of 20 scans at a resolution of 4 cm−1 was recorded. Data processing and analysis were performed using LabSolutions IR software (version 2.21 (25 April 2018), Shimadzu, IRAffinity-1S FTIR Spectrometer, Kyoto, Japan).
The FTIR spectra of flower samples were subjected to ATR correction, normalization, derivatization and smoothing treatment using the Savitzky–Golay method. All peaks with relative intensities less than 10% were omitted during the process. Then, all data corresponding to frequency peaks were selected and subjected to further processing via OriginPro 2022b software in order to acquire the exact percentage relative intensity for each peak.

2.6. Statistical Analysis

Spectrophotometric data (n = 6) were averaged and reported along with their standard deviations (SDs). The data regarding TPC and antiradical/antioxidant activity were analyzed with one-way ANOVA post hoc tests (IBM SPSS Statistics, version 19.0, Chicago, IL, USA), using Tukey’s test for pairwise multiple comparisons, with statistical significance set at p < 0.05. The correlation among the results was performed using Pearson’s correlation test. All statistical calculations were performed with the SPSS statistical software for Windows (IBM SPSS Statistics, version 19.0, Chicago, IL, USA).

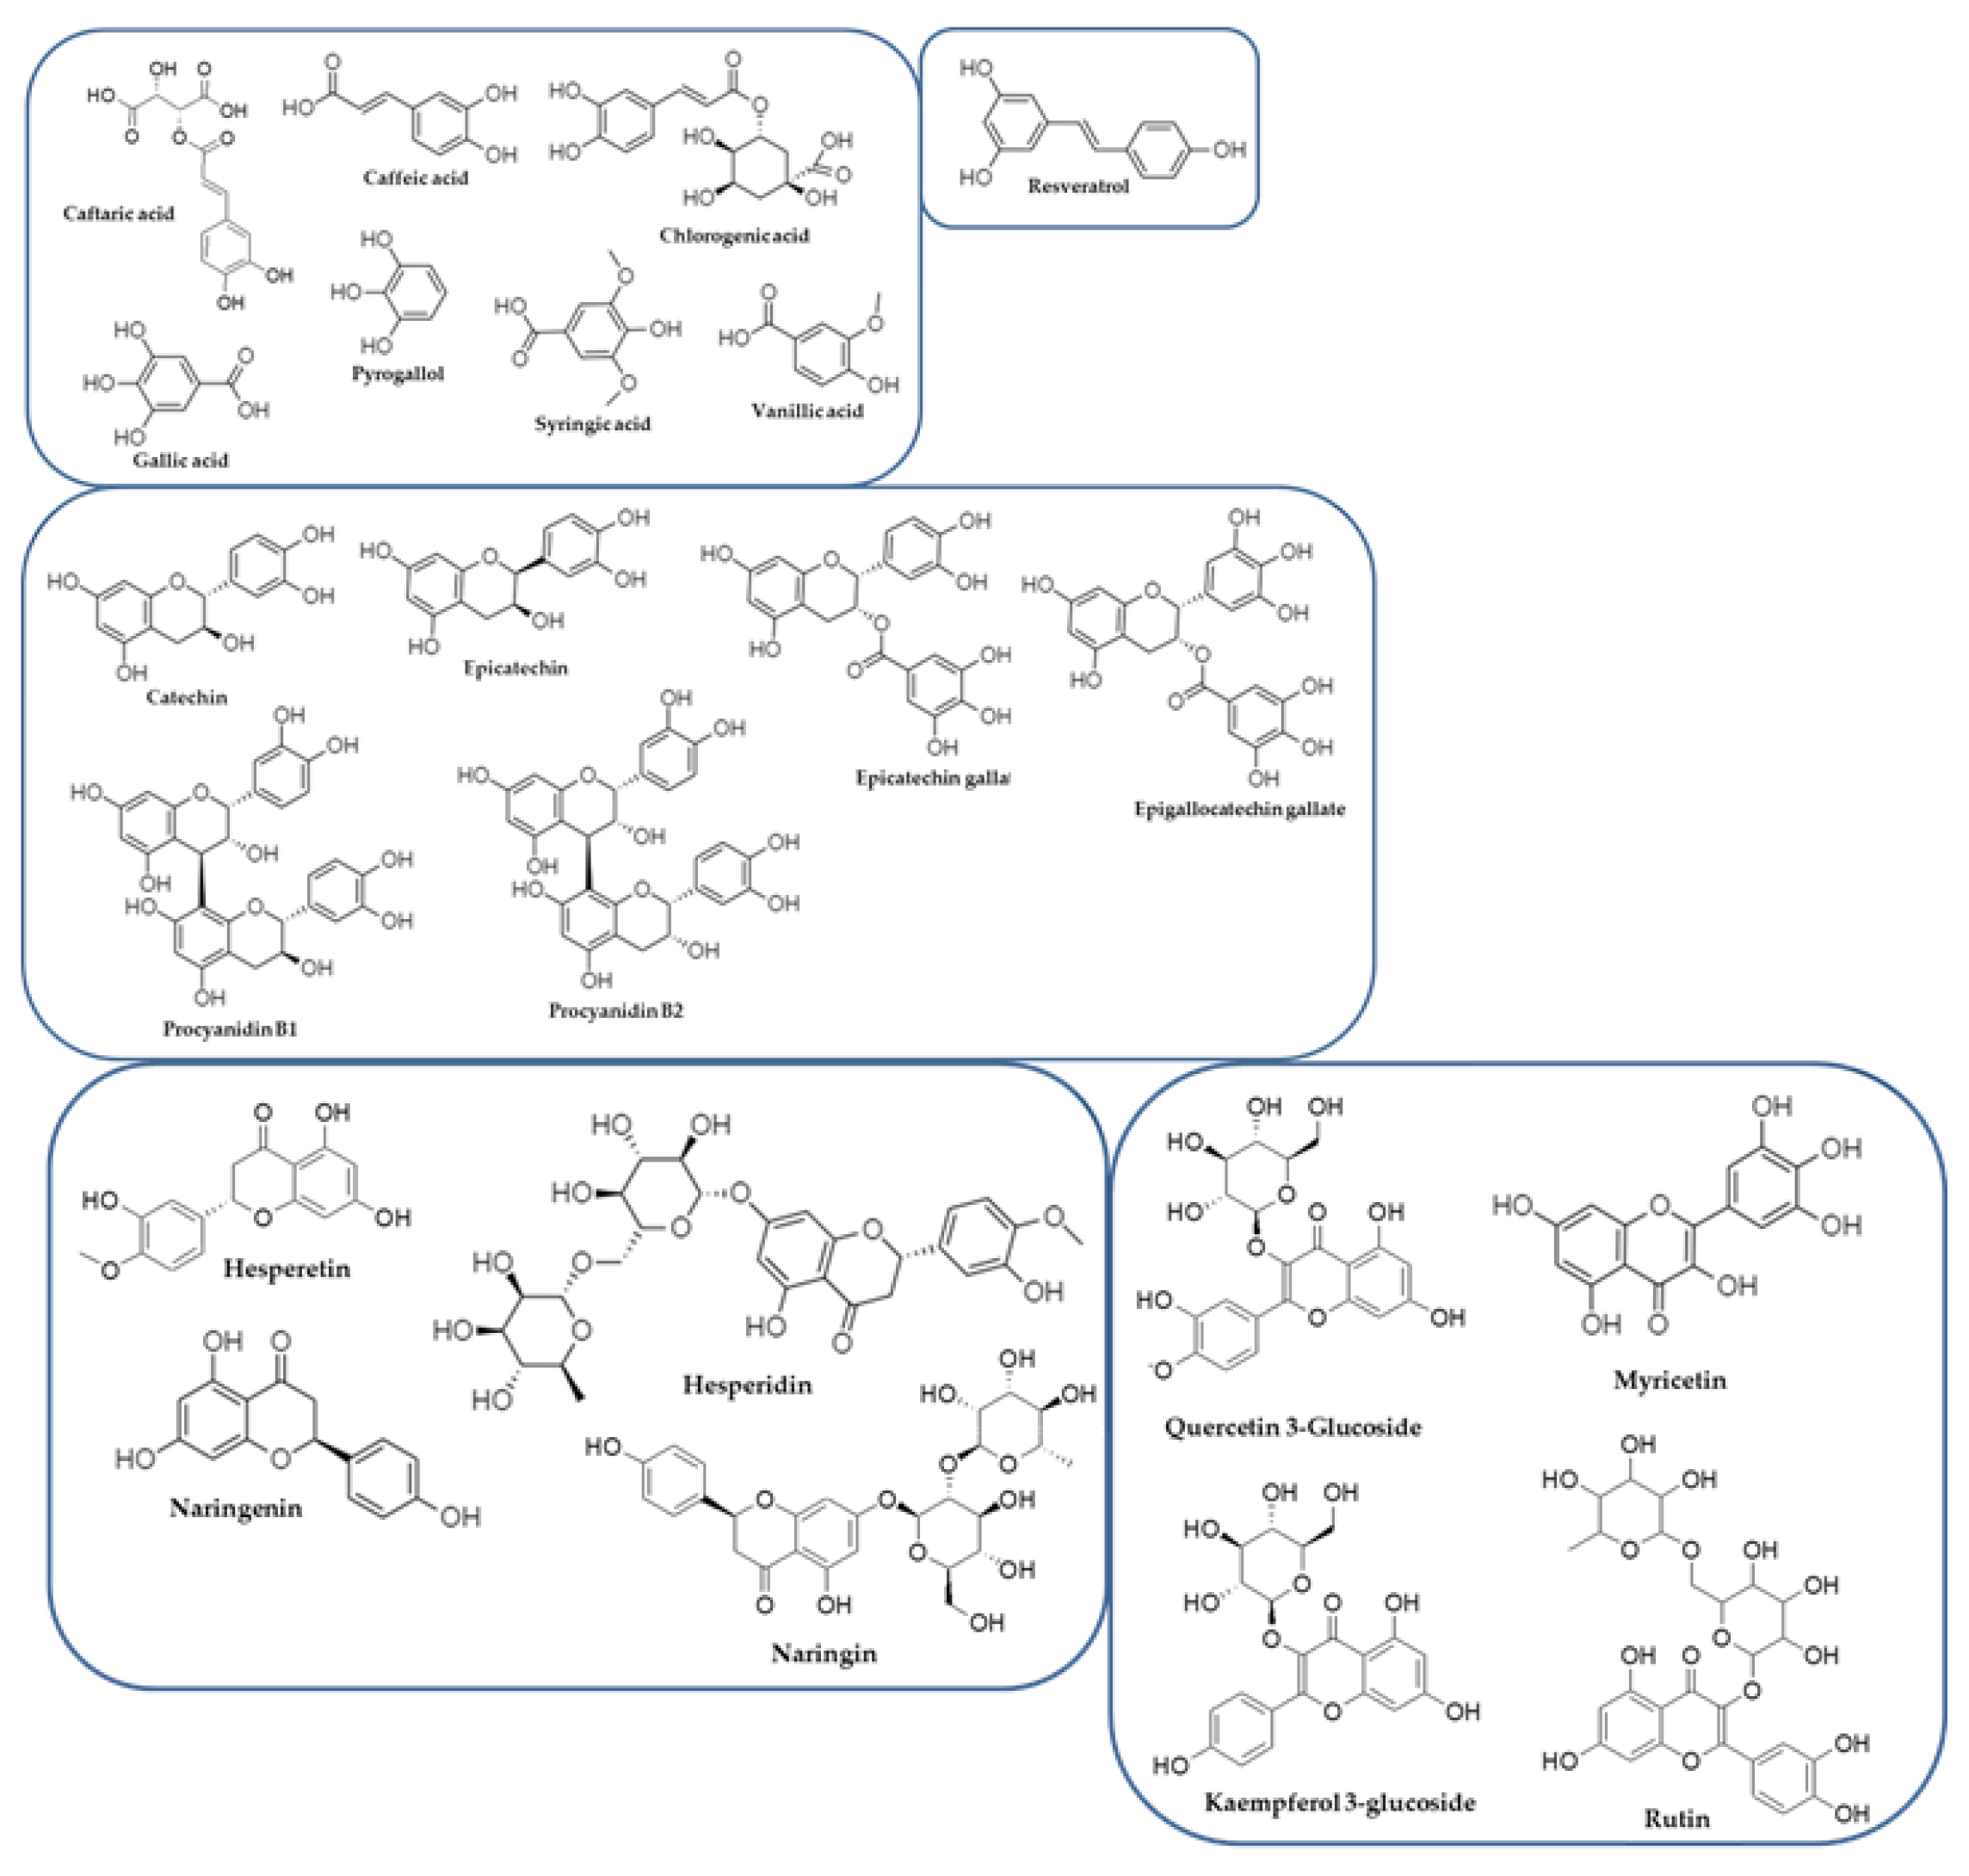
2.7. Molecular Docking Studies

Multiple molecular targets that mediate antioxidant activity were retrieved from the Protein Data Bank (PDB) as .pdb files, including NADPH oxidase enzyme (PDB: 2CDU), cytochrome P450 (CP450) enzyme (PDB: 1OG5), lipoxygenase (LOX) enzyme (PDB: 1N8Q), myeloperoxidase (MP) enzyme (PDB: 1DNU) and xanthine oxidase (XO) enzyme (PDB: 3NRZ) and were subjected to protein preparation [30]. Specifically, all water molecules were removed, missing residues and hydrogens were added, and restrained energy minimization was followed using an OPLS2005 force field.
A total of 22 phenolic compounds (Figure 1), present in most of the studied flowers [5,31,32], were sketched and prepared at pH = 7.0 ± 0.5, using LigPrep of MAESTRO [33].
Validation was performed based on the RMSD values, expressing the similarity between the overlapping crystallographic and docking poses of the co-crystallized ligands. Figure S1 (Supplementary Materials) presents the superimposition of the crystallographic and predicted poses together with their RMSD values. Additionally, dextromethorphan, 5-fluorouracil, zileuton, melatonin and febuxostat, molecules with known activity against NADPH oxidase, CP450, LOX, MP and XO enzymes, respectively, were also rendered as positive controls, reinforcing the validation process. Through the validation process, the critical protein–ligand interactions, which may positively contribute to antioxidant capacity were identified, in accordance with previous studies [23,24].
Subsequently, molecular docking simulations were performed for all compounds by applying Glide in standard precision (SP) mode [34] to identify their favorable binding poses. The maximum number of docking poses was set equal to 10 and each of them was visually inspected and analyzed.

3. Results and Discussion

3.1. Spectrophotometric Profiles of Flowers

The flowers were assessed for total phenolic content (TPC) and antiradical (ABTS●+) and antioxidant (FRAP) activity on wet basis. The results are given in Table 2. It was observed that TPC and antiradical and antioxidant activity significantly varied among the studied flower extracts. Therefore, TPC ranged from 0.92 to 18.55 mg GAE per g of flower. The antiradical capacity of flowers varied from 2.42 to 43.88 mg of TE per g of flower, while the antioxidant activity of flowers extended from 3.06 to 130.96 mg of Fe(II) per g of flower. The highest TPC and antioxidant activity, as determined by FRAP assay, were found in the red China rose, followed by the orange Mexican marigold. The lowest TPCs and antiradical and antioxidant activities were found in pink lily, in pink carnation and white lantana, and in purple common snapdragon, respectively. In accordance with our results, Gonçalves et al. [8] reported that red rose and Mexican marigold possessed high total phenolic and flavonoid contents.
High positive Pearson’s correlations (p < 0.01) were found between TPC and antiradical activity (R = 0.936), TPC and antioxidant activity (R = 0.816) as well as antiradical and antioxidant activity (R = 0.731). This indicates that phenolic compounds measured by the Folin–Ciocalteu assay contribute significantly to the antiradical and antioxidant activities of flower extracts. In accordance with the above result, other studies reported that the antioxidant activities of flowers were significantly correlated with total phenolic contents [1,35]. Moreover, the in vitro biological activities of edible flowers are possibly attributed to the presence of various compounds, such as natural pigments and other substances, especially carotenoids, flavonoids (flavonols, flavones and flavanols), coumarins, phenolic acids (hydroxybenzoic and hydroxycinnamic acids), anthocyanins, tannins, terpenoids and alkaloids [1,7,35].
Another interesting finding was that the flowers belonging to the family Rosaceae, Compositae, Primulaceae, Violaceae and Plumbaginaceae appeared to have higher TPCs as well as antiradical and antioxidant activities than the flowers of other families. Furthermore, in some cases, the colors of flowers of the same family seemed to significantly affect TPC, antiradical and antioxidant activity values, as shown in the case of lantana flowers (yellow lantana versus white and pink lantana) and sowbread flowers (red spring sowbread versus white and fuchsia spring sowbread). According to the study of Iwashina et al. [36], flower color is associated with the presence of specific compounds. Therefore, it was shown that red-, pink-, magenta- and red-purple-colored flowers are generally rich in anthocyanidins, such as pelargonidin, cyanidin, delphinidin, peonidin, petunidin and malvidin. The blue, purple and violet colors of flowers are mainly attributed to the presence of petunidin, malvidin, delphinidin and their methylated derivatives. In addition, the yellow hue of flowers is due to the presence of carotenoids and some flavonoids. Finally, flavonols and flavonoids, such as quercetin and apigenin, are found in almost all white flowers.

3.2. Interpretation of FTIR Spectra

The attenuated total reflectance Fourier-transform infrared (ATR-FTIR) spectroscopy of flower extract samples revealed 20 different bands (Figure 1, Table 3), which were located between the wavenumbers from 3300 to 550 cm−1. All spectra exhibited a strong double peak from 3300 to 3500 cm−1, due to N–H stretching, indicating the presence of amines and amides, as well as a broad absorption band between 3200 and 3300 cm−1, which is assigned to O-H stretching vibrations of alcohols or phenols [37]. The moderate peak at 2920–2940 cm−1 of C-H stretching exhibited the presence of methyl and methylene groups in carbohydrates or carboxylic acids [38]. The band from 1740 to 1700 cm−1 is assigned to C=O stretching vibration of carbonyl compounds, such as aldehydes, ketones, esters, carboxylic acids, or carbohydrates and polyphenols [37]. The band from 1640 to 1680 cm−1 is defined either as the olefin compound absorption band due to carbon double bonds or as the amide band due to C=O stretching, whereas the double peak at 1490–1610 cm−1 is related to the skeletal vibrations of phenolic aromatic rings [11,39]. The peak at 1430–1470 cm−1 is associated with CH3 and CH2 bending vibrations and deformation of aliphatic compounds, whereas the peak at 1390–1410 cm−1 is ascribed to C-C stretching vibration of phenyl groups [11]. The band at 1350–1380 cm−1 is related to O-H bending vibrations of organic acids, while the existence of a double peak at 1500–1610 and at 1330–1350 cm−1 is attributed to N=O symmetrical and asymmetric stretching vibration [37]. The strong bands at 1280–1310 and 1220–1270 cm−1 are related to N-O stretching vibration of amides and to C-O stretching vibration of esters or ethers or phenolic compounds, respectively [39]. The band at 1180–1210 cm−1 could be associated with C-C stretching vibration of carbohydrates or phenolics, whilst the band at 1140–1160 cm−1 could be related to C–H deformation vibrations of carbohydrates [40,41]. All spectra exhibited absorption bands at 1020–1110 cm−1, which are assigned to glycoside C-O stretching vibration and/or to C-O-H and C-O-C bond deformation, pertaining to carbohydrates [41]. The band at 960–970 cm−1 is related to the C-H out-of-plane deformations of trans vinyl groups of carotenoids [42]. The band at 840–890 cm−1 is attributed to C-H out-of-plane bending vibrations of 1,3,5-tri-substituted aromatic derivatives, whereas the bands at 810–840, 760–810 and 730–680 cm−1 are associated with C-H out-of-plane bending vibrations of para-, ortho- and meta-substituted aromatic derivatives, respectively [43].
According to the percentage relative intensities of the ATR-FTIR spectra bands of the flower samples that emerged after derivatization, smoothing and normalization (Table S1), all samples showed the characteristic band of skeletal vibrations of phenolic aromatic rings, at 1490–1610 cm−1, with a relative intensity higher than 90%, in most cases. Furthermore, most of the extracts’ FTIR spectra demonstrated the stretching vibrations of phenolic hydroxyl groups at 3200–3300 cm−1 and of phenolic C-O groups at 1220–1270 cm−1. Moreover, the bands of substituted phenolics, at 840–890, 810–840 and 760–810 cm−1, were observed in all samples as having medium or elevated relative intensities. These observations indicated that the flower extracts are rich in phenolics, which can be correlated with the TPCs and antiradical and antioxidant activities demonstrated by the spectrophotometric assays. These phenolic compounds stemming from the flower extracts could emerge as good candidates for molecular docking studies, also clarifying the mechanism by which phenolic compounds could act as antioxidants in vivo.

3.3. Molecular Docking Studies

A set of 22 characteristic phenolic compounds (Figure 2), abundant in the studied edible flowers, was generated for further exploration. This comprised phenolic acids, stilbenes, flavanols, flavanones and flavonols [5,31,32,44].
The molecular target selection was based on the inhibition of reactive oxygen species (ROS) overproduction which negatively affects antioxidant activity. Therefore, five enzymes that are responsible for reactive oxygen species (ROS) production during metabolism, NADPH oxidase (PDB: 2CDU), cytochrome P450 (CP450) (PDB: 1OG5), lipoxygenase (LOX) (PDB: 1N8Q), myeloperoxidase (MP) (PDB: 1DNU) and xanthine oxidase (XO) (PDB: 3NRZ) enzymes, were utilized for docking studies [23,26]. Additionally, dextromethorphan (DEX), 5-fluorouracil (FLU), zileuton (ZIL), melatonin (MEL) and febuxostat (FEB) were utilized as positive controls against NO, CP450, LOX, MP and XO enzymes, respectively, and were subjected to docking studies. Representative binding poses of phenolic compounds at the binding sites of NADPH oxidase, CP450, LOX, MP and XO enzymes are illustrated in Figure 3.
Analysis of the docking results indicated that the tested molecules exhibited similar or greater binding energy values compared to positive controls at all targets, ranging from −9.00 kcal·mol−1 to −4.00 kcal·mol−1 (Table 4). Therefore, the evaluation of docking poses was based not only on docking scores but also on the common interactions between the co-crystallized ligands and positive controls. The interactions of positive controls, co-crystallized ligands and examined phytochemicals for each enzyme target are illustrated in Table 5. It is critical to highlight that the presented interactions are in accordance with the results of recent published studies [23,24].
In general, the visual inspection of the derived docking poses revealed that the examined compounds are stabilized into the binding pockets of the enzymes via the formation of hydrogen bonds and by pi–pi and pi–c interactions. However, several phenolic compounds did not seem to bind to lipoxygenase (LOX) and xanthine oxidase (XO) enzymes, probably due to steric hindrances. In contrast, all of the compounds exhibited binding capacity to NADPH oxidase, cytochrome P450 (CP450) and myeloperoxidase (MP) enzymes and could potentially inhibit ROS reproduction, thus providing oxidative stress reduction.
In the case of the NADPH oxidase enzyme, docking results showed a significantly higher binding affinity for all tested compounds compared to the positive control DEX. Additionally, docking poses indicated that all phenolic acids included in the set form direct hydrogen bonds with Asp179 and/or Val214, similar to the co-crystallized ligand and the positive control. The group of flavanols presents a common interaction pattern, including crucial interactions, such as hydrogen bonds with Asp179 and Val214. Additionally, it was observed that within the group of flavonols, rutin, kaempferol 3-glucoside and myricetin present similar interaction patterns, including interactions with Lys213 and Val214, while quercetin 3-glucoside is capable of a variety of interactions and direct hydrogen bonding with Asp179. Furthermore, the aglycones hesperetin and naringenin present the same interaction motif, different from their glucosides. The above-mentioned interactions have been found to be positively correlated with increased (predicted) antioxidant activity in recent publications [23,24,45].
Based on our in silico results regarding the CP450 enzyme, the formation of pi–pi interactions with Phe476 and/or Phe214 was observed for all of the examined compounds. In a recent publication, Costa et al. [23] suggested that interactions with Phe100, Phe214 and Phe467 may be crucial for CP450 binding, confirming our findings. Among tested compounds, naringin presents the most interesting results because it exhibits the highest docking score but also interacts via hydrogen bonds with Phe100 and Thr301, like the co-crystallized ligand, and via pi–pi interaction with Phe114. Interestingly, its aromatic ring is found at a close proximity to the heme ring.
From the results (Table 4 and Table 5), it is obvious that several phenolic compounds could not bind to the lipoxygenase (LOX) enzyme. However, five compounds belonging to the phenolic acid group exhibited common interactions, including a pi–pi interaction with His518, an interaction crucial for the binding.
The docked poses of the examined compounds at the MP binding sites indicated greater docking scores compared to the positive control (MEL) and also pointed out a variety of interactions, including direct hydrogen bonds. Notably, among the examined compounds, caftaric acid and kaempherol 3-glucoside form five hydrogen bonds. The hydrogen bonds with Asn189, Val199 and Gln201 residues are common to MEL [23].
Regarding the XO enzyme, the binding energies of the examined compounds present higher values in almost all cases compared to the positive control (FEB). The docking scores of resveratrol, gallic acid and catechin are significantly high, providing a strong indication of their binding and consequent antioxidant activity. Furthermore, an interesting observation related to the docking pose analysis was that all glucosylated forms of phenolic compounds could not bind the XO enzyme. The potential antioxidant activity of the rest of the compounds is highlighted by similar interaction patterns with the positive control.

4. Conclusions

Edible flowers have gained substantial attention due to their bioactive properties, their high nutritional values and their acceptance by consumers. In light of this, in the present study, in vitro and in silico techniques combined with spectroscopy were applied to evaluate a range of edible flowers and their potential application in the food industry. The results indicated the highest TPC and antioxidant activity, as identified by FRAP assay, in red China rose, followed by orange Mexican marigold. Additionally, ATR-FTIR spectra analysis revealed that the examined flower extracts were rich in phenolics, with a good correlation between TPC and antiradical and antioxidant activity. Molecular docking results showed that most phenolic compounds could bind and potentially inhibit multiple molecular targets that mediate antioxidant activity. The results indicate synergistic effects based on different mechanisms for increased antioxidant activity.

Supplementary Materials

The following supporting information can be downloaded at: https://www.mdpi.com/article/10.3390/app12147331/s1, Figure S1: The similarity in the overlaps between crystallographic (green) and docked (orange) poses, derived from the following examined molecular targets: (a) NADPH oxidase, (b) cytochrome P450 (CP450), (c) lipoxygenase (LOX), (d) myeloperoxidase (MP) and (e) xanthine oxidase (XO) enzymes; Table S1: Percentage relative intensities of ATR-FTIR spectra bands of flower samples.

Author Contributions

Conceptualization, E.K., V.J.S. and P.Z.; methodology, E.K., T.T., A.-G.I., I.F.S. and I.P.; software, E.K., A.-G.I. and V.J.S.; validation, E.K., T.T., A.-G.I., I.F.S. and I.P.; formal analysis, E.K., V.M., I.F.S. and V.J.S.; investigation, E.K., T.T., V.M., I.F.S. and V.J.S.; resources, I.P., P.Z. and V.J.S.; data curation, E.K., A.-G.I., I.F.S. and V.J.S.; writing—original draft preparation, E.K. and V.J.S.; writing—review and editing, T.T. and P.Z.; visualization, E.K., I.F.S., P.Z. and V.J.S.; supervision, E.K., I.F.S. and V.J.S.; project administration, P.Z. and V.J.S. All authors have read and agreed to the published version of the manuscript.

Funding

This research received no external funding.

Institutional Review Board Statement

Not applicable.

Informed Consent Statement

Not applicable.

Data Availability Statement

Not applicable.

Conflicts of Interest

The authors declare no conflict of interest.

References

  1. Fernandes, L.; Casal, S.; Pereira, J.A.; Saraiva, J.A.; Ramalhosa, E. Edible flowers: A review of the nutritional, antioxidant, antimicrobial properties and effects on human health. J. Food Compos. Anal. 2017, 60, 38–50. [Google Scholar] [CrossRef]
  2. Rivas-García, L.; Navarro-Hortal, M.D.; Romero-Márquez, J.M.; Forbes-Hernández, T.Y.; Varela-López, A.; Llopis, J.; Sánchez-González, C.; Quiles, J.L. Edible flowers as a health promoter: An evidence-based review. Trends Food Sci. Technol. 2021, 117, 46–59. [Google Scholar] [CrossRef]
  3. de Franzen, F.L.; Lidório, H.F.; de Oliveira, M.S.R. Edible flower considerations as nbsp ingredients in food medicine and cosmetics. J. Anal. Pharm. Res. 2018, 7, 271–273. [Google Scholar] [CrossRef] [Green Version]
  4. Pires, T.C.S.P.; Barros, L.; Santos-Buelga, C.; Ferreira, I.C.F.R. Edible flowers: Emerging components in the diet. Trends Food Sci. Technol. 2019, 93, 244–258. [Google Scholar] [CrossRef]
  5. de Pires, E.O.; Di Gioia, F.; Rouphael, Y.; Ferreira, I.C.F.R.; Caleja, C.; Barros, L.; Petropoulos, S.A. The Compositional Aspects of Edible Flowers as an Emerging Horticultural Product. Molecules 2021, 26, 6940. [Google Scholar] [CrossRef]
  6. Benvenuti, S.; Mazzoncini, M. The Biodiversity of Edible Flowers: Discovering New Tastes and New Health Benefits. Front. Plant Sci. 2020, 11, 569499. [Google Scholar] [CrossRef]
  7. Purohit, S.R.; Rana, S.S.; Idrishi, R.; Sharma, V.; Ghosh, P. A review on nutritional, bioactive, toxicological properties and preservation of edible flowers. Future Foods 2021, 4, 100078. [Google Scholar] [CrossRef]
  8. Gonçalves, F.; Gonçalves, J.C.; Ferrão, A.C.; Correia, P.; Guiné, R.P.F. Evaluation of phenolic compounds and antioxidant activity in some edible flowers. Open Agric. 2020, 5, 857–870. [Google Scholar] [CrossRef]
  9. Takahashi, J.A.; Rezende, F.A.G.G.; Moura, M.A.F.; Dominguete, L.C.B.; Sande, D. Edible flowers: Bioactive profile and its potential to be used in food development. Food Res. Int. 2020, 129, 108868. [Google Scholar] [CrossRef]
  10. Mak, Y.W.; Chuah, L.; Ahmad, R.; Bhat, R. Antioxidant and antibacterial activities of hibiscus (Hibiscus rosa-sinensis L.) and Cassia (Senna bicapsularis L.) flower extracts. J. King Saud Univ. 2013, 25, 275–282. [Google Scholar] [CrossRef] [Green Version]
  11. Li, Y.; Kong, D.; Wu, H. Comprehensive chemical analysis of the flower buds of five Lonicera species by ATR-FTIR, HPLC-DAD, and chemometric methods. Revista Brasileira de Farmacognosia 2018, 28, 533–541. [Google Scholar] [CrossRef]
  12. Qiu, L.; Zhang, M.; Bhandari, B.; Wang, B. Effects of infrared freeze drying on volatile profile, FTIR molecular structure profile and nutritional properties of edible rose flower (Rosa rugosa flower). J. Sci. Food Agric. 2020, 100, 4791–4800. [Google Scholar] [CrossRef]
  13. Pavelková, P.; Krmela, A.; Schulzova, V. Determination of carotenoids in flowers and food supplements by HPLC-DAD. Acta Chim. Slovaca 2020, 13, 6–12. [Google Scholar] [CrossRef]
  14. Lopes, C.L.; Pereira, E.; Soković, M.; Carvalho, A.M.; Barata, A.M.; Lopes, V.; Rocha, F.; Calhelha, R.C.; Barros, L.; Ferreira, I.C.F.R. Phenolic Composition and Bioactivity of Lavandula pedunculata (Mill.) Cav. Samples from Different Geographical Origin. Molecules 2018, 23, 1037. [Google Scholar] [CrossRef] [Green Version]
  15. Pires, T.C.S.P.; Dias, M.I.; Barros, L.; Calhelha, R.C.; Alves, M.J.; Oliveira, M.B.P.P.; Santos-Buelga, C.; Ferreira, I.C.F.R. Edible flowers as sources of phenolic compounds with bioactive potential. Food Res. Int. 2018, 105, 580–588. [Google Scholar] [CrossRef] [Green Version]
  16. Navarro-González, I.; González-Barrio, R.; García-Valverde, V.; Bautista-Ortín, A.B.; Periago, M.J. Nutritional Composition and Antioxidant Capacity in Edible Flowers: Characterisation of Phenolic Compounds by HPLC-DAD-ESI/MSn. Int. J. Mol. Sci. 2014, 16, 805–822. [Google Scholar] [CrossRef] [Green Version]
  17. Mar, J.M.; da Silva, L.S.; Moreira, W.P.; Biondo, M.M.; Pontes, F.L.D.; Campos, F.R.; Kinupp, V.F.; Campelo, P.H.; Sanches, E.A.; de Bezerra, J.A. Edible flowers from Theobroma speciosum: Aqueous extract rich in antioxidant compounds. Food Chem. 2021, 356, 129723. [Google Scholar] [CrossRef]
  18. Wongsa, P.; Rattanapanone, N. 1H-NMR analysis, antioxidant activity, and α-amylase and α-glucosidase inhibitory potential of ten common Thai edible flowers. J. Sci. Food Agric. 2021, 101, 4380–4389. [Google Scholar] [CrossRef]
  19. Marchioni, I.; Najar, B.; Ruffoni, B.; Copetta, A.; Pistelli, L.; Pistelli, L. Bioactive Compounds and Aroma Profile of Some Lamiaceae Edible Flowers. Plants 2020, 9, 691. [Google Scholar] [CrossRef]
  20. Ruth, C.C.; Thoufikanashrin, A. Evaluation of Bioactive Compounds in the Edible Hibiscus Rosa Sinensis L. Flower Petals by Gc Ms Analysis. World J. Pharm. Res. 2018, 7, 403–409. [Google Scholar]
  21. Bandari, S.K.; Kammari, B.R.; Madda, J.; Kommu, N.; Lakkadi, A.; Vuppala, S.; Tigulla, P. Synthesis of new chromeno-carbamodithioate derivatives and preliminary evaluation of their antioxidant activity and molecular docking studies. Bioorg. Med. Chem. Lett. 2017, 27, 1256–1260. [Google Scholar] [CrossRef] [PubMed]
  22. Niu, H.; Wang, W.; Li, J.; Lei, Y.; Zhao, Y.; Yang, W.; Zhao, C.; Lin, B.; Song, S.; Wang, S. A novel structural class of coumarin-chalcone fibrates as PPARα/γ agonists with potent antioxidant activities: Design, synthesis, biological evaluation and molecular docking studies. Eur. J. Med. Chem. 2017, 138, 212–220. [Google Scholar] [CrossRef] [PubMed]
  23. da Costa, J.S.; da Ramos, R.S.; da Costa, K.S.L.; do Brasil, D.S.B.; de Paula da Silva, C.H.T.; Ferreira, E.F.B.; dos Borges, R.S.; Campos, J.M.; da Macêdo, W.J.C.; dos Santos, C.B.R. An In Silico Study of the Antioxidant Ability for Two Caffeine Analogs Using Molecular Docking and Quantum Chemical Methods. Molecules 2018, 23, 2801. [Google Scholar] [CrossRef] [PubMed] [Green Version]
  24. Farouk, A.; Mohsen, M.; Ali, H.; Shaaban, H.; Albaridi, N. Antioxidant Activity and Molecular Docking Study of Volatile Constituents from Different Aromatic Lamiaceous Plants Cultivated in Madinah Monawara, Saudi Arabia. Molecules 2021, 26, 4145. [Google Scholar] [CrossRef]
  25. Shehab, W.S.; Aziz, M.A.; Elhoseni, N.K.R.; Assy, M.G.; Abdellattif, M.H.; Hamed, E.O. Design, Synthesis, Molecular Docking, and Evaluation Antioxidant and Antimicrobial Activities for Novel 3-phenylimidazolidin-4-one and 2-aminothiazol-4-one Derivatives. Molecules 2022, 27, 767. [Google Scholar] [CrossRef]
  26. Dharmaraja, A.T. Role of Reactive Oxygen Species (ROS) in Therapeutics and Drug Resistance in Cancer and Bacteria. J. Med. Chem. 2017, 60, 3221–3240. [Google Scholar] [CrossRef]
  27. Andreou, V.; Strati, I.F.; Fotakis, C.; Liouni, M.; Zoumpoulakis, P.; Sinanoglou, V.J. Herbal distillates: A new era of grape marc distillates with enriched antioxidant profile. Food Chem. 2018, 253, 171–178. [Google Scholar] [CrossRef]
  28. Lantzouraki, D.Z.; Sinanoglou, V.J.; Zoumpoulakis, P.G.; Glamočlija, J.; Ćirić, A.; Soković, M.; Heropoulos, G.; Proestos, C. Antiradical–antimicrobial activity and phenolic profile of pomegranate (Punica granatum L.) juices from different cultivars: A comparative study. RSC Adv. 2014, 5, 2602–2614. [Google Scholar] [CrossRef]
  29. Lantzouraki, D.Z.; Sinanoglou, V.J.; Zoumpoulakis, P.; Proestos, C. Comparison of the Antioxidant and Antiradical Activity of Pomegranate (Punica granatum L.) by Ultrasound-Assisted and Classical Extraction. Anal. Lett. 2016, 49, 969–978. [Google Scholar] [CrossRef]
  30. Schrödinger Release 2020-3, Protein Preparation Wizard; Schrödinger, LLC: New York, NY, USA, 2021.
  31. De Morais, J.S.; Sant’Ana, A.S.; Dantas, A.M.; Silva, B.S.; Lima, M.S.; Borges, G.C.; Magnani, M. Antioxidant activity and bioaccessibility of phenolic compounds in white, red, blue, purple, yellow and orange edible flowers through a simulated intestinal barrier. Food Res. Int. 2020, 131, 109046. [Google Scholar] [CrossRef]
  32. Youssef, H.; Ali, S.; Sanad, M.; Dawood, D. Chemical Investigation of Flavonoid, Phenolic acids Composition and Antioxidant activity of Tagetes erecta Flowers. Egypt. J. Chem. 2020, 63, 2605–2615. [Google Scholar] [CrossRef]
  33. Schrödinger Release 2020-3, Maestro; Schrödinger, LLC: New York, NY, USA, 2020.
  34. Schrödinger Release 2020-3, Glide; Schrödinger, LLC: New York, NY, USA, 2020.
  35. Lu, B.; Li, M.; Yin, R. Phytochemical Content, Health Benefits, and Toxicology of Common Edible Flowers: A Review (2000–2015). Crit. Rev. Food Sci. Nutr. 2016, 56 (Suppl. S1), S130–S148. [Google Scholar] [CrossRef]
  36. Iwashina, T. Contribution to flower colors of flavonoids including anthocyanins: A review. Nat. Prod. Commun. 2015, 10, 529–544. [Google Scholar] [CrossRef] [Green Version]
  37. Gomare, K.; Mishra, D. FTIR spectroscopic analysis of phytochemical extracts from Hibiscus rosa-sinensis L. used for hair disorder. Int. J. Recent Trends Sci. Technol. 2018, 70–75. [Google Scholar]
  38. Brangule, A.; Šukele, R.; Bandere, D. Herbal Medicine Characterization Perspectives Using Advanced FTIR Sample Techniques–Diffuse Reflectance (DRIFT) and Photoacoustic Spectroscopy (PAS). Front. Plant Sci. 2020, 11, 356. [Google Scholar] [CrossRef]
  39. Oliveira, R.N.; Mancini, M.C.; de Oliveira, F.C.S.; Passos, T.M.; Quilty, B.; da Thiré, R.M.S.M.; McGuinness, G.B. FTIR analysis and quantification of phenols and flavonoids of five commercially available plants extracts used in wound healing. Matéria 2016, 21, 767–779. [Google Scholar] [CrossRef] [Green Version]
  40. Pop, R.; Buzoianu, A.; Rati, I.V.; Socaciu, C. Untargeted Metabolomics for Sea Buckthorn (Hippophae rhamnoides ssp. carpatica) Berries and Leaves: Fourier Transform Infrared Spectroscopy as a Rapid Approach for Evaluation and Discrimination. Notulae Botanicae Horti Agrobotanici Cluj-Napoca 2014, 42, 545–550. [Google Scholar] [CrossRef] [Green Version]
  41. Kozłowicz, K.; Różyło, R.; Gładyszewska, B.; Matwijczuk, A.; Gładyszewski, G.; Chocyk, D.; Samborska, K.; Piekut, J.; Smolewska, M. Identification of sugars and phenolic compounds in honey powders with the use of GC-MS, FTIR spectroscopy, and X-ray diffraction. Sci. Rep. 2020, 10, 16269. [Google Scholar] [CrossRef]
  42. Quijano-Ortega, N.; Fuenmayor, C.A.; Zuluaga-Dominguez, C.; Diaz-Moreno, C.; Ortiz-Grisales, S.; García-Mahecha, M.; Grassi, S. FTIR-ATR Spectroscopy Combined with Multivariate Regression Modeling as a Preliminary Approach for Carotenoids Determination in Cucurbita spp. Appl. Sci. 2020, 10, 3722. [Google Scholar] [CrossRef]
  43. Konteles, S.J.; Strati, I.F.; Giannakourou, M.; Batrinou, A.; Papadakis, S.; Ourailoglou, D.; Zoumpoulakis, P.; Sinanoglou, V.J. Instant Herbal Powder: Functionality Assessment through Chemical, Microbiological and Shelf Life Kinetics. Anal. Lett. 2022, 55, 1505–1516. [Google Scholar] [CrossRef]
  44. Prabawati, N.B.; Oktavirina, V.; Palma, M.; Setyaningsih, W. Edible Flowers: Antioxidant Compounds and Their Functional Properties. Horticulturae 2021, 7, 66. [Google Scholar] [CrossRef]
  45. Lountos, G.T.; Jiang, R.; Wellborn, W.B.; Thaler, T.L.; Bommarius, A.S.; Orville, A.M. The crystal structure of NAD(P)H oxidase from Lactobacillus sanfranciscensis: Insights into the conversion of O2 into two water molecules by the flavoenzyme. Biochemistry 2006, 45, 9648–9659. [Google Scholar] [CrossRef]
Figure 1. Overlay of ATR−FTIR spectra, acquired from 4000 to 499 cm−1 for the flower samples. Different spectrum color line correspond to different flower sample.
Applsci 12 07331 g001
Figure 2. The chemical structures of the examined phenolic compounds.
Applsci 12 07331 g002
Figure 3. Representative binding poses of (a) caftaric acid, (b) naringin, (c) vanillic acid, (d) kaempherol 3-glucoside and (e) resveratrol, derived from molecular docking studies of NADPH oxidase, CP450, LOX, MP and XO enzymes. Hydrogen bonds are depicted with dashed yellow lines and pi–pi interactions with dashed blue lines.
Applsci 12 07331 g003
Table 1. Classification of flower samples used in the present study.
Common Name and Flower ColorScientific NameFamily Name
Purple Mexican petuniaRuellia simpex C. WrightAcanthaceae
Yellow black-eyed Susan vineThunbergia alata Bojer ex Sims
Pink periwinkleCatharanthus roseus L. G. DonApocynaceae
Orange Cape honeysuckleTecomaria capensis (Thunb.) SpachBegoniaceae
Pink carnationDianthus caryophyllus L. Caryophyllaceae
Orange marigoldTagetes erecta L. Compositae
Purple Indian chrysanthemumChrysanthemum indicum L.
Dark red Indian chrysanthemumChrysanthemum indicum L.
Pink azaleaRhododendron simsii Planch.Ericaceae
Pink lilyLilium candidum L. Liliaceae
Red hibiscusHibiscus rosa-sinensis L. Malvaceae
White hibiscusHibiscus rosa-sinensis L.
Red wax mallowMalvaviscus arboreus Cav.
White jasmineJasminum Officinale L. Oleaceae
Purple common snapdragonAntirrhinum majus L. Plantaginaceae
Blue plumbagoPlumbago auriculata Lam.Plumbaginaceae
Red spring sowbreadCyclamen repandum Sm. Primulaceae
White spring sowbreadCyclamen hederifolium Aiton
Fuchsia spring sowbreadCyclamen hederifolium Aiton
Red China roseRosa chinensis Jacq.Rosaceae
Yellow lantanaLantana camara L. Verbenaceae
White lantanaLantana camara L.
Pink lantanaLantana camara L.
Yellow heartseaseViola tricolor L. Violaceae
Purple heartseaseViola tricolor L.
Table 2. Total phenolic contents and antiradical (ABTS●+ assay) and antioxidant activities (FRAP assay) of fresh flowers.
No.Common Name and Flower ColorMoisture (%)TPC (mg GAE/g Fresh Flowers)ABTS (mg Trolox (TE)/g Fresh Flowers)FRAP (mg Fe(II)/g Fresh Flowers)
1Red China rose84.3218.55 ± 0.63 a43.88 ± 0.97 a130.96 ± 2.80 a
2Orange Mexican marigold83.267.58 ± 0.58 b17.67 ± 1.20 b124.27 ± 1.41 b
3Red spring sowbread89.317.35 ± 0.61 b24.65 ± 0.38 c25.08 ± 0.83 c
4Yellow heartsease87.237.15 ± 0.48 b21.72 ± 0.21 d24.39 ± 0.58 c
5Purple heartsease87.316.91 ± 0.59 bc13.84 ± 1.01 e24.78 ± 0.47 c
6White spring sowbread88.246.39 ± 0.11 c23.77 ± 0.49 f17.22 ± 0.39 d
7Blue plumbago90.756.25 ± 0.18 c10.68 ± 0.61 g26.94 ± 0.35 e
8Fuchsia spring sowbread89.175.46 ± 0.13 d18.81 ± 0.78 h15.51 ± 0.85 f
9White jasmine89.424.59 ± 0.17 e6.38 ± 0.13 j7.58 ± 0.37 g
10Purple Mexican petunia87.224.30 ± 0.27 e3.89 ± 0.13 k11.06 ± 0.32 h
11Red hibiscus83.084.30 ± 0.32 e10.91 ± 0.42 g26.44 ± 0.37 e
12White hibiscus82.874.20 ± 0.30 e7.32 ± 0.26 l26.56 ± 0.13 e
13Pink periwinkle85.343.51 ± 0.25 f3.18 ± 0.33 m14.44 ± 1.51 f
14Yellow lantana86.932.59 ± 0.09 g3.52 ± 0.14 m4.83 ± 0.42 jo
15Orange cape honeysuckle88.902.49 ± 0.08 g3.34 ± 0.17 m4.08 ± 0.36 j
16Red wax mallow91.232.25 ± 0.10 h5.18 ± 0.20 n11.60 ± 0.32 h
17Purple Indian chrysanthemum82.162.13 ± 0.12 hj4.45 ± 0.82 n12.73 ± 0.44 k
18Yellow black-eyed Susan vine90.712.02 ± 0.28 hj2.94 ± 0.38 mn3.34 ± 0.25 l
19Dark red Indian chrysanthemum82.751.94 ± 0.13 jk3.40 ± 0.32 m9.58 ± 0.46 m
20Pink azalea92.181.76 ± 0.11 kl3.99 ± 0.40k m12.95 ± 0.25 k
21White lantana86.231.68 ± 0.07 l2.42 ± 0.48 n3.38 ± 0.36 l
22Pink lantana87.161.40 ± 0.08 m2.56 ± 0.23 n3.38 ± 0.21 l
23Pink carnation83.101.30 ± 0.06 m2.42 ± 0.35 n6.30 ± 0.26 n
24Purple common snapdragon85.250.97 ± 0.05 n2.48 ± 0.56 n3.06 ± 0.35 l
25Pink lily88.480.92 ± 0.05 n3.32 ± 0.49 m5.18 ± 0.31 o
a–o Different letters in the same column indicate statistically different values (p < 0.05).
Table 3. Peaks detected in flower extract samples using ATR-FTIR.
Peaks
(cm−1)
Flower Samples 1
12345678910111213141516171819202122232425
3300–35002
3200–3300
2920–2940
1700–1740
1640–1680
1490–1610
1430–1470
1390–1410
1350–1380
1330–1350
1280–1310
1220–1270
1180–1210
1140–1160
1020–1110
960–970
840–890
810–840
760–810
680–730
1 Identity of samples as in table. 2 √: Presence of a specific wavelength in the sample.
Table 4. The docking scores of the examined compounds at the binding sites of various molecular targets.
CompoundsNADPH Oxidase (PDB: 2CDU)Cytochrome P450 (CP450)
(PDB: 1OG5)
Lipoxygenase (LOX)
(PDB: 1N8Q)
Myeloperoxidase (MP)
(PDB: 1DNU)
Xanthine Oxidase (XO)
(PDB: 3NRZ)
Docking Score (kcal·mol−1)
Dextromethorphan (DEX)−3.82NT 1NTNTNT
5-Fluorouracil (FLU)NT−6.13NTNTNT
Zileuton (ZIL)NTNT−2.35NTNT
Melatonin (MEL)NTNTNT−3.53NT
Febuxostat (FEB)NTNTNTNT−6.70
Caftaric acid−6.97−5.41NB 2−4.30−6.39
Caffeic acid−5.76−6.84−5.21−4.69−5.55
Catechin−6.75−5.78NB−5.19−7.83
Chlorogenic acid−5.97−5.88NB−5.14−5.40
Epicatechin−6.67−8.73NB−5.23−4.09
Epicatechin gallate−5.24−7.76NB−4.03−4.00
Epigallocatechin gallate−5.24−7.76NB−5.22NB
Gallic acid−5.27−5.87−6.36−4.84−7.68
Hesperetin−6.11−6.08NB−4.41−6.76
Hesperidin−4.88−6.83NB−5.32NB
Kaempferol 3-glucoside−6.01−6.60NB−4.56NB
Myricetin−6.56−6.18NB−4.84−7.31
Naringenin−6.43−6.99NB−5.10−5.44
Naringin−4.54−8.15NB−4.29NB
Procyanidin B1−4.01−7.72NB−4.13NB
Procyanidin B2−4.84−7.90NB−4.41NB
Pyrogallol−4.63−5.75−6.45−4.61−6.37
Quercitin 3-Glucoside−6.57−5.84NB−5.01NB
Resveratrol−6.84−5.62NB−4.86−8.23
Rutin−4.91−8.13NB−5.18NB
Syringic acid−5.96−5.39−5.49−4.70−5.94
Vanillic acid−5.77−5.78−6.08−4.67−6.54
1 NT: Not tested, 2 NB: Not bound.
Table 5. The interaction patterns of co-crystallized ligands, positive controls and examined compounds at the binding sites of NO, CP450, LOX, MP and XO enzymes. The common interactions among the tested compounds and co-crystallized ligands/positive controls are marked in bold font.
CompoundsNADPH Oxidase
(PDB: 2CDU)
Cytochrome P450 (CP450)
(PDB: 1OG5)
Lipoxygenase
(LOX)
(PDB: 1N8Q)
Myeloperoxidase
(MP)
(PDB: 1DNU)
Xanthine Oxidase (XO)
(PDB: 3NRZ)
Interactions
Dextromethorphan (DEX) and adenosine-5′-diphosphateHB 1: Ile160, Gly161, Ile178, Asp179, His181, Tyr188, Cys242
Pi–c: Lys187, Lys213
5-Fluorouracil (FLU)
and warfarin
HB: Gly98, Phe100, Ala103, Asn217
pi–c: Arg97, Phe476
Zileuton (ZIL) and
protocatechuic acid
pi–pi His518
Melatonin (MEL) and N-acetyl-D-glucosamine HB: Asn189, Asn192, Val199, Gln201
Febuxostat (FEB) and
hypoxanthine
HB: Glu802, Arg880, Thr1010
pi–pi: Phe914, Phe1009
Caftaric acidHB: Asp179 2, Leu185, Tyr186, Tyr188, Val214HB: Thr301, Ser365NO 1HB: Arg185, Asn189, Ser191, Val199, Gln201HB: Ser876, Arg880, Thr1010
pi–pi: Phe914, Phe1009
Caffeic acidHB: Asp179, Val214HB: Ala103, Thr364, Ser365
pi–pi: Phe476
HB: Ile857
pi–pi: Trp519
HB: Asn186, Gln201, Phe214HB: Glu802, Arg880, Thr1010
pi–pi: Phe914, Phe1009
CatechinHB: Asp179, Tyr188, Val214
pi–c: Lys187
HB: Ser365
pi–pi: Phe476
NOHB: Asn186, Arg188, Asn189, Phe213HB: Glu802, Thr1010
pi–pi: Phe914, Phe1009
Chlorogenic acidHB: Asp179, Gly180, Val214HB: Leu208, Asn217, Thr364, Ser365
pi–pi: Phe476
NOHB: Asn186, Asn189, Ser191, Gln201, Phe213HB: Lys771, Thr1010
pi–pi: Phe914, Phe1009
EpicatechinHB: Asp179, Hie181, Val214
pi–c: Lys213
HB: Leu208, Thr364, Ser365
pi–pi: Phe476
NOHB: Arg188, Val199, Phe213HB: Ser876
Epicatechin gallateHB: His181, Val214
pi–c: Lys187, Lys213
HB: Gly98, Gly296, Thr301, Thr364, Ser365
pi–pi: Phe476
NOHB: Arg185, Gln201, Phe213NO
Epigallocatechin gallateHB: His181, Val214
pi–c: Lys187, Lys213
HB: Gly98, Gly296, Thr301, Thr364, Ser365
pi–pi: Phe476
NOHB: Asn186, Arg188, Asn189, Phe213NO
Gallic acidHB: Asp179, Tyr188, Cys242HB: Thr364, Ser365
pi–pi: Phe476
HB: Gln514, Ile857
pi–pi: His518
HB: Arg188, Met190, Val199HB: Glu802, Arg880, Thr1010
pi–pi: Phe914, Phe1009
HesperetinHB: Val214
pi–pi: His181
HB: Ser365
pi–pi: Phe476
NOHB: Arg188, Val199, Gln201HB: Thr1010
pi–pi: Phe914, Phe1009
HesperidinHB: Ile243, Arg246HB: Leu208
pi–pi: Phe114
NOHB: Arg188, Met190, Ser191, Gln201, Gln204, Phe213 NO
Kaempferol 3-glucosideHB: Lys213, Val214
pi–pi: His181
HB: Gly98, Ser365
pi–c: Arg97
NOHB: Arg185, Asn186, Asn189, Val199, Gln201NO
MyricetinHB: Val214
pi–c: Lys213
HB: Ser365
pi–c: Phe476
NOHB: Asn186, Ser191, Gln201, Phe213HB: Glu802, Thr1010
pi–pi: Phe914, Phe1009
NaringeninHB: His181, Val214HB: Ser365
pi–pi: Phe476
NOHB: Asn186, Asn189, Phe213HB: Leu648
pi–pi: Phe1009
NaringinHB: Lys187, Lys213, Arg246HB: Phe100, Thr301
pi–pi: heme, Phe214
NOHB: Asn186, Arg188, Met190, Phe214NO
Procyanidin B1HB: Lys213, Val214HB: Ala106, Leu208, Ser365
pi–pi: Phe214
NOHB: Gln201, Gln204, Gly207NO
Procyanidin B2HB: Asp179, Lys189, Tyr188, Lys213HB: Gly98, Ser365
pi–pi: Phe476
NOHB: Asn192, Gln201, Gly207, Asp539NO
PyrogallolHB: Asp179, Lys187HB: Thr364, Ser365
pi–pi: Phe476
HB: Gln514
pi–pi: His518, His523
HB: Asn186, Met190HB: Glu802, Thr1010
pi–pi: Phe914, Phe1009
Quercitin 3-glucosideHB: Asp179, Gly180, Lys213, Ile243, Arg246HB: Ala106, Leu208, Asn217, Phe476
pi–pi: Phe114
NOHB: Asn186, Arg188, Asn189, Met190, Ser191, Val199, Phe213 NO
ResveratrolHB: His181, Lys187, Tyr188, Val214
pi–c: Lys187
HB: Ser365
pi–pi: Phe476
NOHB: Asn200, Gln201, Gln204HB: Glu802, Thr1010
pi–pi: Phe914, Phe
1009
RutinHB: Lys213, Val214HB: Asn107, Leu208, Gln214
pi–c: Arg97
NOHB: Asn189, Gln201, Asn258, Asn540NO
Syringic acidHB: Val214HB: Leu208, Ser365HB: Ile857
pi–pi: His518
HB: Arg188, Met190, Ser191, Val199HB: Asn768, Glu802
Vanillic acidHB: Asp179, Val214HB: Thr364, Ser365
pi–pi: Phe476
HB: Gln514, Ile857
pi–pi: His518
HB: Arg188, Met190, Val199HB: Glu802, Arg880, Thr1010
pi–pi: Phe914, Phe1009
1 HB: Hydrogen bond; NO: Not observed. 2 Notes in bold refer to the crucial amino acids for the binding
Publisher’s Note: MDPI stays neutral with regard to jurisdictional claims in published maps and institutional affiliations.

