
Deep Learning Based Detector YOLOv5 for Identifying Insect Pests
by
 ,
,
Iftikhar Ahmad
1,2,
Yayun Yang
1,2,
Yi Yue
1,2,
Chen Ye
1,2,
Muhammad Hassan
3,
Xi Cheng
4,
Yunzhi Wu
1,2,* and
Youhua Zhang
1,2,* 1
Anhui Provincial Engineering Laboratory for Beidou Precision Agriculture Information, School of Information and Computer, Anhui Agricultural University, Hefei 230036, China
2
School of Information and Computer, Anhui Agricultural University, Hefei 230036, China
3
Shenzhen International Graduate School, Tsinghua University, Shenzhen 518055, China
4
School of Computing and Information Sciences, Caritas Institute of Higher Education Hong Kong, Hong Kong, China
*
Authors to whom correspondence should be addressed.
Appl. Sci. 2022, 12(19), 10167; https://doi.org/10.3390/app121910167
Submission received: 31 August 2022
/
Revised: 30 September 2022
/
Accepted: 5 October 2022
/
Published: 10 October 2022
Abstract
:Insect pests are a major element influencing agricultural production. According to the Food and Agriculture Organization (FAO), an estimated 20–40% of pest damage occurs each year, which reduces global production and becomes a major challenge to crop production. These insect pests cause sooty mold disease by sucking the sap from the crop’s organs, especially leaves, fruits, stems, and roots. To control these pests, pesticides are frequently used because they are fast-acting and scalable. Due to environmental pollution and health awareness, less use of pesticides is recommended. One of the salient approaches could be to reduce the wide use of pesticides by spraying on demand. To perform spot spraying, the location of the pest must first be determined. Therefore, the growing population and increasing food demand emphasize the development of novel methods and systems for agricultural production to address environmental concerns and ensure efficiency and sustainability. To accurately identify these insect pests at an early stage, insect pest detection and classification have recently become in high demand. Thus, this study aims to develop an object recognition system for the detection of crops damaging insect pests and their classification. The current work proposes an automatic system in the form of a smartphone IP- camera to detect insect pests from digital images/videos to reduce farmers’ reliance on pesticides. The proposed approach is based on YOLO object detection architectures including YOLOv5 (n, s, m, l, and x), YOLOv3, YOLO-Lite, and YOLOR. For this purpose, we collected 7046 images in the wild under different illumination and background conditions to train the underlying object detection approaches. We trained and test the object recognition system with different parameters from scratch. The eight models are compared and analyzed. The experimental results show that the average precision ([email protected]) of the eight models including YOLO-Lite, YOLOv3, YOLOR, and YOLOv5 with five different scales (n, s, m, l, and x) reach 51.7%, 97.6%, 96.80%, 83.85%, 94.61%, 97.18%, 97.04%, and 98.3% respectively. The larger the model, the higher the average accuracy of the detection validation results. We observed that the YOLOv5x model is fully functional and can correctly identify the twenty-three species of insect pests at 40.5 milliseconds (ms). The developed model YOLOv5x performs the state-of-the-art model with an average precision value of ([email protected]) 98.3%, ([email protected]:0.95) value of 79.8%, precision of 94.5% and a recall of 97.8%, and F1-score with 96% on our IP-23 dataset. The results show that the system works efficiently and was able to correctly detect and identify insect pests, which can be employed for realistic application while farming.
1. Introduction
Agricultural productivity worldwide is influenced by a variety of biotic and abiotic factors. An estimated 40% of agricultural production is affected by insects, pests, diseases, and weed infestations. [1]. The targeted level of pest and disease control is not achieved due to a lack of accurate diagnosis at the right time. This can lead to financial and environmental problems due to the inappropriate and excessive use of agrochemicals. According to the food and agricultural organization (FAO) pest damage 20% and 40% of worldwide production each year [2,3]. Similarly, plant diseases cause an economic loss of $220 billion, while pests cause a loss of $70 billion each year [4]. Therefore, farmers use a variety of pesticides to increase the quality and shelf life of their yields. Continued use of these pesticides can lead to environmental pollution and potentially hazardous diseases, such as cancer, severe respiratory and hereditary infections, and fetal death [5].
Advanced technological techniques in agriculture are highly needed to identify pests at the primary stage and to avoid the widespread use of hazardous pesticides. These insects can cause sooty mold disease by sucking the sap from plants’ leaves, fruits, stems, and roots. The disease impairs photosynthesis and causes tissue infections leading to the damage of plants and reducing the market value of harvested products in terms of quality and quantity. When farmers face a pest infestation, they rely on their own experience and knowledge for diagnosis. Due to insufficient knowledge, pesticide spraying is the preferred method of pest control, because it is fast-acting and scalable [6]. However, due to increasing environmental and health concerns, less pesticide use is needed. Spraying only where necessary is one of the most important ways to reduce pesticide use. It is known that the cost of spraying pesticides can be reduced by 90% through spot spraying [6,7,8], which can decrease environmental contamination and restrain beneficial insects such as honeybees. To perform spot spraying, the location of the insect pest must first be determined. Usually, manual methods are used to detect pests, which are labor-intensive and therefore highly prone to error [9]. With recent developments in computer vision in precision agriculture, insect pests and disease detection has become an integral part of gathering information about crop growth and health [3]. Detecting objects at different stages of agricultural growth is critical for estimating future yields, activating intelligent spraying systems, and controlling autonomous pesticide spraying robots for large farms and orchards. However, due to the similarity of shape, complex background, overlying of target objects due to dense distribution, variability of light in the large topography of orchards, and various other factors, detecting target objects with reasonable accuracy is challenging. However, the evolving technology makes it possible to detect insect pests using image processing methods.
To address these challenges, people became increasingly interested in precision agriculture. Precision agriculture made agricultural management more precise and controlled. These technologies comprised the global positioning system (GPS) for tractor navigation, robotics, remote sensing, data analytics, drones, and land vehicles [10]. Accurate insect pest detection is the mainstay of precision agriculture.
Visual information acquisition and processing via computer vision are inevitable to carry out pest detection and spot spraying. Therefore, deep neural networks (DNNs) are commonly used in computer vision applications to map complex correlations and to carry automatic feature extractions [11,12,13]. Advances in graphical processing units (GPUs) have enabled the training of deeper artificial neural networks with speedy and improved outcomes. The DNNs have shown significant results for object classification. Object recognition algorithms are mainly divided into classification-based (two-stage detectors) and regression-based object detectors (single-stage detectors) [14]. The two-stage object detectors outperform the single-stage object detectors in terms of the accuracy metric but are slower in terms of inference speed [15].
This study aims to detect insect pests of 23 different species using red-green-blue (RGB) digital images/videos for YOLOv5, YOLOv3, YOLOR, and YOLO-Lite object detection architectures based on the You Look Only Once (YOLO) [16] and You Only Learn One Representation (YOLOR) [17] single-stage object detector. The YOLOv5 versions with different sizes, YOLOv5n, YOLOv5s, YOLOv5m, YOLOv5l, and YOLOv5x architectures were compared in terms of precision, recall, F1-score, mean average precision (mAP) and inference speed with agricultural damage causing by insect pests using training from scratch. In this study, we created a new dataset of twenty-three different insect pests (IP-23) was created. We train and evaluate eight different scales of YOLOv5, YOLOR, YOLOv3, and YOLO-Lite on the newly established IP-23 dataset. After training and validating the model, we used a total of 296 unseen images of insect pests to test the models to select the optimal model for detecting the insect pests. The experimental results show that the developed YOLOv5x model is fully functional and can detect 23 different species of insect pests. We observed that the developed system can detect an object at 40.5 ms with the use of NVIDIA GEFORCE RTX 3060 GPU. Finally, we investigate the diagnosis of pest infestation on mobile device internet protocol (IP) cameras. The IP camera of a mobile device for real-time recognition of insect pests in agricultural fields and conserve beneficial insects such as honeybees. Bees play an important starring role in agriculture. They pollinate yields, increase harvests, and have spawned a thriving honey industry. More than one-third of the food we eat is pollinated directly or indirectly by bees.
The rest of the paper is organized as follows: Section 2 articulates the related studies, Section 3 introduces the methodology, Section 4 illustrates the insect pest detection models and experimental setup, Section 5 presents the results and relevant metrics, Section 6 presents the discussion regarding the underlying studies, and Section 7 concludes the study.
2. Related Work
With the rapid growth of artificial intelligence (AI), convolutional neural networks (CNNs) have been successfully applied in agricultural research to overcome the drawbacks of machine learning [18]. CNN models outperform conventional methods in the automatic detection and classification of pest infestations [19]. The pest classification is composed of the detection and localization of individual pests in realistic captured images. Using CNN as feature extractors in conjunction with an ensemble model can better address computer vision problems. The region-based convolutional neural networks (R-CNNs) [20], fast region-based convolutional network method (Fast R-CNNs) [21], faster region-based convolutional networks (Faster R-CNNs) [20,22], single-shot multi-box detectors (SSDs) [20,23,24], and YOLO [24,25] are examples of methods that have been successfully employed for object detection and recognition.
Several researchers have recently investigated the detection of insect pests using object detection techniques. Fuentes et al. combined R-CNN, faster R-CNN, and SSD deep learning meta-learning with a visual geometry group network (VGG) and residual network to detect nine types of diseases and pests on tomato plants [20]. Lin et al. developed an anchor-free regional convolutional network using a fast R-CNN as an endwise model to categorize 24 pest classes. [21]. On a dataset of 24 pest classes, the result showed a mAP of 56.4% and a recall of 85.1%, which are higher than the fast R-CNN and YOLO detectors. Sabanci et al. proposed a new convolutional recurrent hybrid network for pest-damaged wheat grain recognition, AlexNet, and bidirectional short-term memory (BiLSTM). A cumulative accuracy of 98.50% was obtained for non-hybrid and 99.50% for hybrid architectures [26].
In addition, Koklu et al. developed a deep feature based on CNN-SVM to classify 5 species of grapevine leaves, in which a classification accuracy of 97.60% was achieved [27]. Gambhir et al. developed a CNN-based interactive android and web interface for the diagnosis of pests and diseases on crops [28]. Li et al. developed a real-time plant disease and pest recognition system on video through faster R-CNN as an object detection framework [22]. The results indicated that the proposed approach could detect unseen rice diseases on video. To estimate the number of flying insects and categorize them using an SVM model, Zhong et al. proposed a visual flying insect detection system on a Raspberry Pi using the YOLO architecture as a detector. They achieved a classification accuracy of 90.18% and a cumulative accuracy of 92.50% [24]. Roy et al. propose a real-time object recognition system Dense-YOLOv4 based on an improved version of the YOLOv4 algorithm by integrating DenseNet into the backbone to optimize feature transfer and reused [29]. A modified path aggregation network (PANet) was implemented to obtain location-based information and detect different stages of mango growth in a complex scenario of an orchard with a high degree of cover. The [email protected] average accuracy of the proposed model is 96.20%. Lawal proposed YO-LO -Tomato-A, and YOLO- Tomato-B models based on YOLOv3 to detect tomatoes in a complex environment [30], using the label approach, dense architecture, spatial pyramid pooling, and the mish activation function to the YOLOv3 model was added. The AP and the recognition rate of the modified models reached 98.3%, 48 ms, and 99.3%, 44 ms, respectively. Roy et al. proposed a fast, accurate fine-grained object recognition model based on the YOLOv4 deep neural network [31]. Several obstacles in the detection of plant diseases that affect the performance of conventional methods are to be removed. The detection rate and mAP of the proposed model reached 70.19 FPS and 96.29%, respectively. The model provides effective and efficient results in complex scenarios in the detection of various plant diseases.
Several researchers have explored object recognition techniques based on DL for pest detection. However, none of these studies discussed scale insect identification to conserve beneficial insects. The problem of pests is still not effectively addressed. Insect pests are the core cause of the infestation in agriculture, resulting in huge economic losses. Thus, this study aims to detect and identify 23 categories of insect pests. We proposed a DL-based detector YOLOv5x to identify insect pests to prevent economic losses and conserve beneficial insects.
Bees play a crucial role in agriculture. They pollinate crops, boost yields, and have led to a flourishing honey industry. Bees are so essential that farmers spend millions of dollars to rent hives to pollinate their crops. More than one-third of the diet we eat is pollinated directly or indirectly by bees.
3. Methods
Our proposed approach consists of 5 consecutive steps (Figure 1). In the first step, we collect insect pest images for training and evaluation of the DL models. Secondly, we preprocess the entire dataset by annotation and augmentation to increase the samples in the dataset. Image data augmentation is a technique for increasing the size of a training dataset artificially by slightly altering existing images based on certain parameters. Third, we employ the YOLO object detection models to train on the IP-23 dataset. Using the dataset split for validation, we validated the detection performance of the fine-tuned models and evaluated the results. Finally, we select an optimal model for the realistic application while farming.
3.1. Dataset Collection
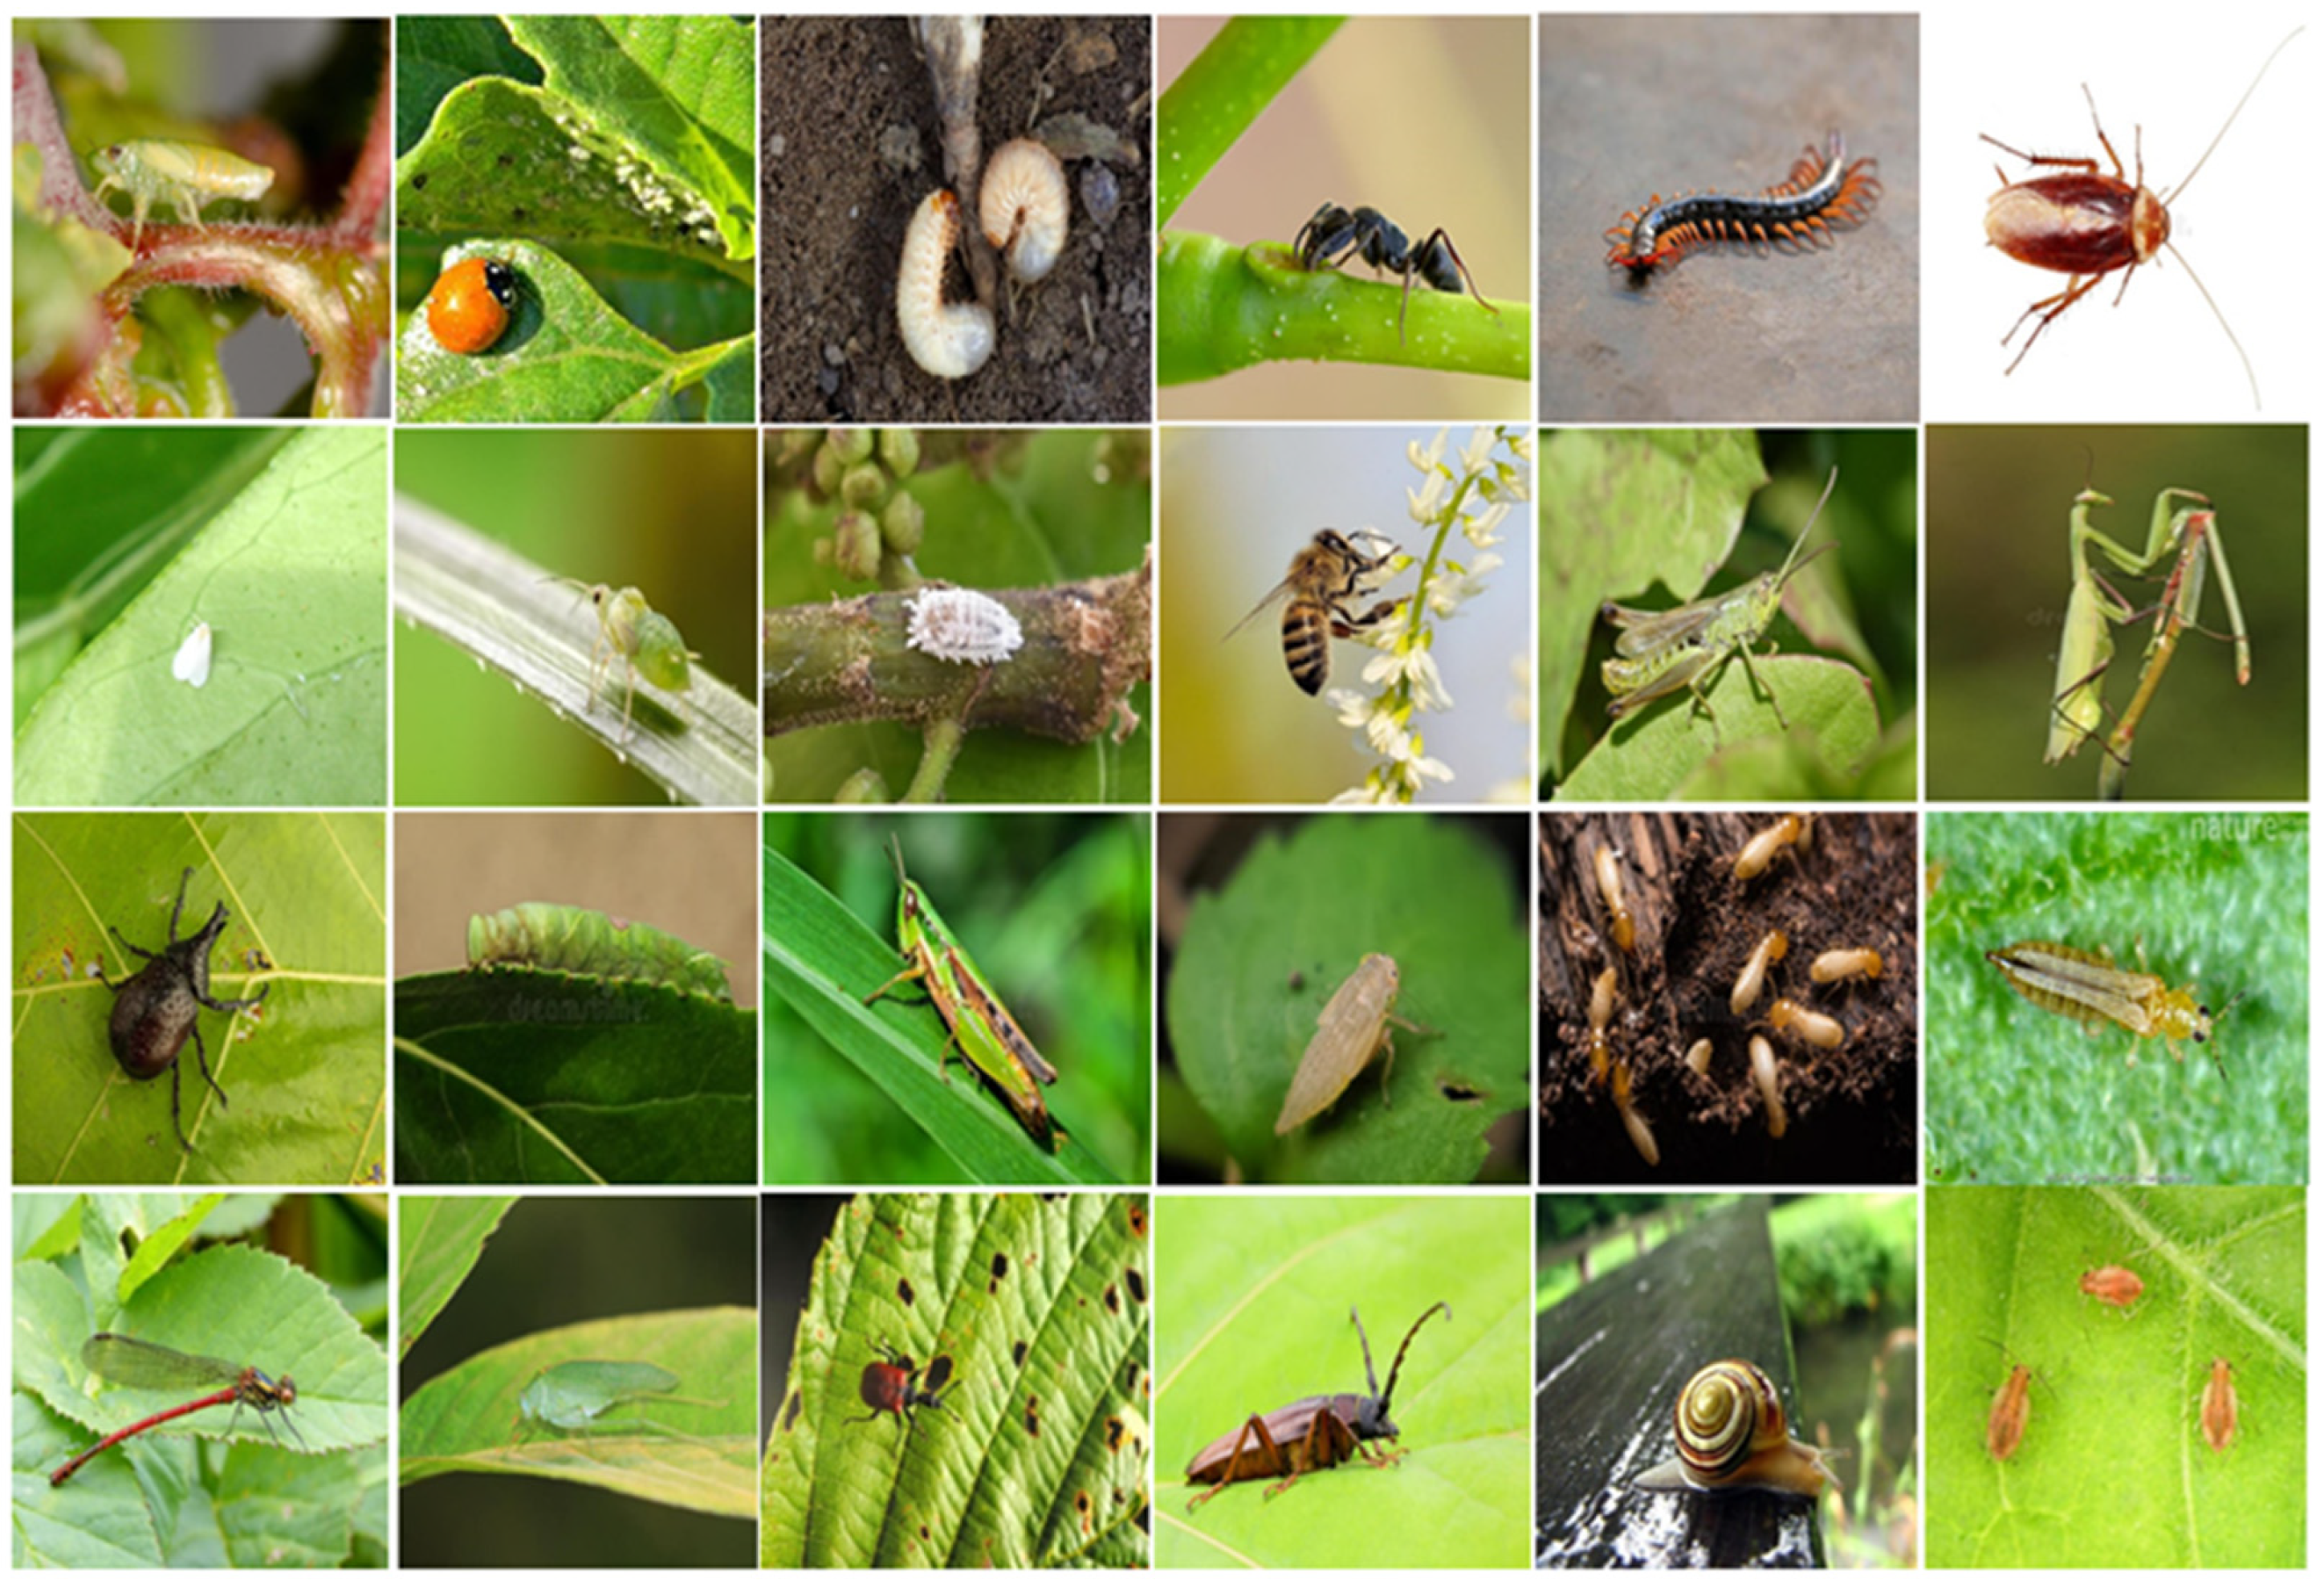
To train and validate the insect pest detection system, we used the internet as a source for collecting images. Insect pests as the research object was mainly to identify and detect the twenty-three categories. In the data collection, first, we searched the images from different databases and search engines, such as Kaggle, Google, Baidu, Iostock, Dream, Flickr, and Bing. We collected 7046 images and divided them into 23 different classes, as illustrated in Table 1. We resized the images into the same dimension as 640 × 640 representing the corresponding width and height. Some representative samples from our dataset are presented in Figure 2.
3.2. Data Annotation
Before training DL models, image annotation is an important step in image preprocessing. A feature of information extracted from an image and based on the selected features inputs labeled features are assigned. During the training process, a machine can learn features from the labeled image. Consequently, the correctness of feature labeling has a great impact on the accuracy of the training model. As many insect pest species are similar to each other, DL models must learn features that are important for different insect pests. In the annotation process, the species and locations of the insect’s pests are indicated on the labeled image. The result of the labeling is coordinates and bounding boxes of the different species and sizes of the insect pests. The labeling is an open-source graphical image labeling tool LabelImg [32]. As can be seen in Figure 3, the location and class of the insect pests in the image have been located and saved as a text file. The text file has one object per line with the corresponding class of the object, height, and width for each bounding box. The coordinates of the rectangle are normalized between 0 and 1. Finally, data enhancement processing was performed on the training set. To increase the samples in the IP-23 dataset to better extract the features of insect pests belonging to different labeled categories and to avoid over-fitting of the model obtained from training.
3.3. Data Augmentation
In general, the DL models perform better with more data. However, collecting large amounts of data for training purposes is a challenging task. Therefore, the problem of insufficient amount of data often occurs in data analysis. Increasing the number of training samples can help in overfitting and generalizing the DL model.
In addition, an insufficient amount of data also affects the overfitting issue that might occur during training. Data augmentation is helpful to solve overfitting problems. Among the current methods of data augmentation is geometric transformation. In this study, we used the geometric transformation process of rotation, horizontal flipping, hue, blur, and saturation. Figure 4 demonstrates the application of the data augmentation technique to the insect pest images.
3.4. Data Splitting
The IP-23 dataset contains a total of 7046 samples distributed among 23 classes of insect pests, with the smallest class containing 210 samples. For each class, there are sufficient images in the training and validation set. For training the pest detection models, we split all datasets into a training set and a validation set in a ratio of 7:3. The training and validation sets are split at the class level. The IP-23 dataset was divided into 4933 training images and 2113 validation images for the detection task.
4. Object Detection Models
4.1. You Only Learn One Representation
The YOLOR is a state-of-the-art (SOTA) machine-learning algorithm for object recognition [17]. The main difference between YOLOR and YOLO is the infusion of both implicit and explicit knowledge in YOLOR while vice versa for YOLO. Implicit knowledge is used for multiple tasks specifically for object recognition not for other machine learning use cases such as object identification or analysis. Object recognition focuses on the general identifiers by which the object can be assigned to a particular category or class. In contrast, other types of machine learning use cases require more detailed processes. Object identification requires a tuned machine-learning model that can distinguish objects.
4.2. You Only Look Once, Version 3
Darknet53 [33] is used in YOLOv3 as a backbone to extract features from an input image. A convolutional layer extracts essential features from the input image and serves as the backbone of a deep neural network. YOLOv3 uses a feature pyramid network (FPN) [34,35] as a model neck. The model neck is essential for extracting feature maps from multiple stages consisting of numerous top-down and bottom-up paths, while the head consists of the YOLO layer. The head in a single-stage detector is responsible for the final prediction, which is a vector with the width and height of the bounding box, the class label, and the class probability. The images are fed into the darknet53 for feature extraction, followed by the feature pyramid for feature fusion. Finally, the results are generated by its head, the head of the model, also known as the output and YOLO layer.
4.3. You Only Look Once, Version 5
The YOLOv5 is a state-of-the-art, single-stage, real-time object detector based on the YOLOv1, YOLOv2, YOLOv3, and YOLOv4 models. The continuous developments have resulted in top performances on two official datasets. The pascal visual object classes (VOC) [36] and Microsoft common objects in context (COCO) [37]. One-level object recognition architectures treat object recognition as a regression problem. On the input image, the class probability and the coordinates of the bounding box enclosing the object are calculated simultaneously. [14]. Like single-step object recognition architectures (SSD, YOLOv3, YOLOv4, RetinaNet, etc.). However, YOLOv5 is different from the previous releases. It utilizes Pytorch instead of Darknet. The YOLOv5 utilizes CSPDarknet53 as a backbone. The YOLOv5 network contains three parts: backbone, neck, and head as illustrated in Figure 5. The head layer is also known as the YOLO layer. The task of the model backbone is to extract the unique features from the particular image. YOLOv5 added the cross-stage partial network (CSPNet) [38] to Darknet and made CSPDarknet its backbone architecture. CSPNet boosts the learning capacity of the convolutional neural network that it constructed, to attribute the issue to the duplication of the gradient information within network optimization. To maintain accuracy, network complexity can be reduced to a certain level. SSP block is used to increase the receptive field and separate out the important features from the backbone. It takes an input image and uses convolution layers to extracts its feature map, then use the maximum pooling of n-times windows size to generate a feature set. Different feature maps in height and width dimensions, thus making pyramids.
This backbone solves the repetitive gradient information in large backbones and integrates gradient changes into the feature map, which reduces inference speed, increases accuracy, and reduces the model size by reducing parameters. It uses a path aggregation network (PANet) as a neck to improve information flow. PANet uses a new feature pyramid network (FPN) that includes multiple bottom-up and top-down layers. This improves the propagation of low-level features in the model. PANet improves localization in the lower layers, which increases the localization accuracy of the object. In addition, the head in YOLOv5 is the same as in YOLOv4 and YOLOv3, which produces three different outputs of feature maps to achieve multi-level prediction. This also helps to efficiently improve the prediction of small to large objects in the model. The image is passed to CSPDarknet53 for feature extraction and again to PANet for feature fusion. Finally, the YOLO layer generates the results. In insect pest detection, speed and accuracy are very important, and the size of the model can be counted for smart devices. YOLOv5 uses a path aggregation network (PANet) as a neck to increase the flow of information [39]. PANet uses a novel FPN topology with an enhanced bottom-up path for low-level feature propagation. Similarly, adaptive feature pooling is used to interconnect the feature grid and all feature layers so that critical information in each feature layer can be propagated directly to the subsequent subnet. The PANet model maximizes the use of reliable localization signs in the lower layers, significantly improving the accuracy of object localization. This allows the model to perform detection at multiple scales [40] and to process and detect objects of interest at different sizes [41].
The main difference between the architecture of YOLOv3, YOLOv4, and YOLOv5 is the Darknet53 backbone used by YOLOv3. The backbone of YOLOv4 architecture is CSPdarknet53, and YOLOv5 uses the focus structure of CSPDarknet53 as the backbone. In YOLOv5, the focus layer is added for the first time. The focusing layer swaps the original three layers of the YOLOv3 algorithm. The benefits of the focus layer include decreased memory requirements, reduction in layer weights, and onward and backward propagation optimization [42].
The model neck is used to create feature pyramids. Feature pyramid is used for as a feature extractor to take a single scale image of random size as input, and output with proportionate-sized feature maps at multiple levels. Feature pyramids can be used to generalize the model to include objects of different dimensions (Figure 6). Thus, it is possible to recognize images of the similar object at different sizes and scales. YOLOv5 uses the PANet pyramid function. It establishes information linkage in the transmission of PANet features to localize signals from lower levels that can reach the upper feature levels without losing signal strength. This is achieved by augmenting the classical FPN with a path augmentation from bottom to top [43,44,45]. The bottom-up approach is the feedforward computation of the backbone convolutional network. One pyramid level for each stage. The output of the last layer of each stage is used as a reference set of feature maps. While from top to down it constructs higher resolution layers from a semantic layer.
The model head also known as the YOLO layer which is used to predict objects’ location-like information. The YOLO layer sends out vectors containing the class probability, confidence value, and bounding box coordinates.
4.4. Classifier Modification
In the dataset COCO [37], there are 80 object categories and the output tensor has dimension 3 × (5 + 80) = 255, where 3 represents the template fields for each grid prediction, 5 signifies the coordinates (x, y, w, h) and confidence of each prediction field, and 80 denotes the number of classes in the dataset COCO. In our IP-23 dataset, we have twenty-three classes, which are shown in (Table 1). The output dimension of the classifier is 3 × (5 + 23) = 140 to meet the challenge of detecting small objects as insect pests. We used YOLOv5 for detection and classification. We condensed the number of parameters in the network considering the computational cost, which increases the detection accuracy and speed.
4.5. Networks Training, Validation, and Testing
For neural network training, we used 4933 images to train each underlying model for object recognition. Regularization was performed from the BN layer to update the weight of the model. For training the network, the momentum factor was set to 0.937, the decay rate of the weights was set to 0.0005, the initial vector and IoU threshold were set to 0.01, and the gain coefficients of hue (H), saturation (S), and lightness (L) were set to 0.015, 0.7, and 0.4, respectively. Images were resized to 640 × 640 pixels, stack size was set to 4 for YOLOR and YOLOv5x, 16 for YOLOv5n, YOLOv5s, and YOLO-Lite, and 6 for YOLOv5m and YOLOv5l. The model runs for 300 epochs to tune and adjust the weights. We used Stochastic Gradient Descent (SGD) [46] as the optimization algorithm [42]. Each model was created using Pytorch [47,48]. The final output of the model was the location bounding box of the target insect pest categories (the prediction box of the position), and the probability of a particular class. Table 2 shows the detailed training strategies of each model while Table 3 shows the model variation used in the training. We used a validation set of 2113 images to evaluate the underlying models’ performance. To test the models, we used a total of 296 unexposed images for insect pest detection.
5. Results
5.1. Metrics Evaluation of the Trained Models
In object recognition methods, the detection result and the performance of the classifier are the two primary indices used to calculate the performance of the models. IoU, precision, F1 score, recall and mAP@IoU = 0.5, mAP@IoU = 0.5:0.95 are commonly used to evaluate the bounding box positioning results. The IoU is a basic metric used to compare object recognition systems [49]. A confusion matrix is a general analysis tool for describing a classifier’s performance. For model recognition, IOU calculates the distance between the expected and actual bounding boxes to assess the scenario (Figure 7). IoU is a ratio that is calculated by intersecting and joining the actual and anticipated boxes. The classified object detection findings are regarded as true positives (TP) if the IOU value is greater than 0.5. If the IoU value is less than 0.5, the result is a false positive (FP).
In object detection, a false negative (FN) denotes that the models should have predicted a positive result but detected it incorrectly. Using the output from IoU, the indicators precision, recall, F1 score, and mAP compute object recognition models performance. For object recognition models, precision, recall, and mAP is popular technical indicators to evaluate overall performance. Precision, recall, and mAP are defined in Equations (1) to (4) respectively. With the obtained values TP, TN, FP, and FN. For mAP@IoU = 0.5, the threshold was set 0.5, and for mAP: IOU = 0.5:0.95, the threshold has taken 10 different values between 0.5 and 0.95 in steps of 0.05.
Our goal is to develop an algorithm suitable for real-time applications, such as insect pest infestation detection, reducing labor costs, avoiding economic losses, and retaining beneficial insects.
5.2. Training Loss Analysis
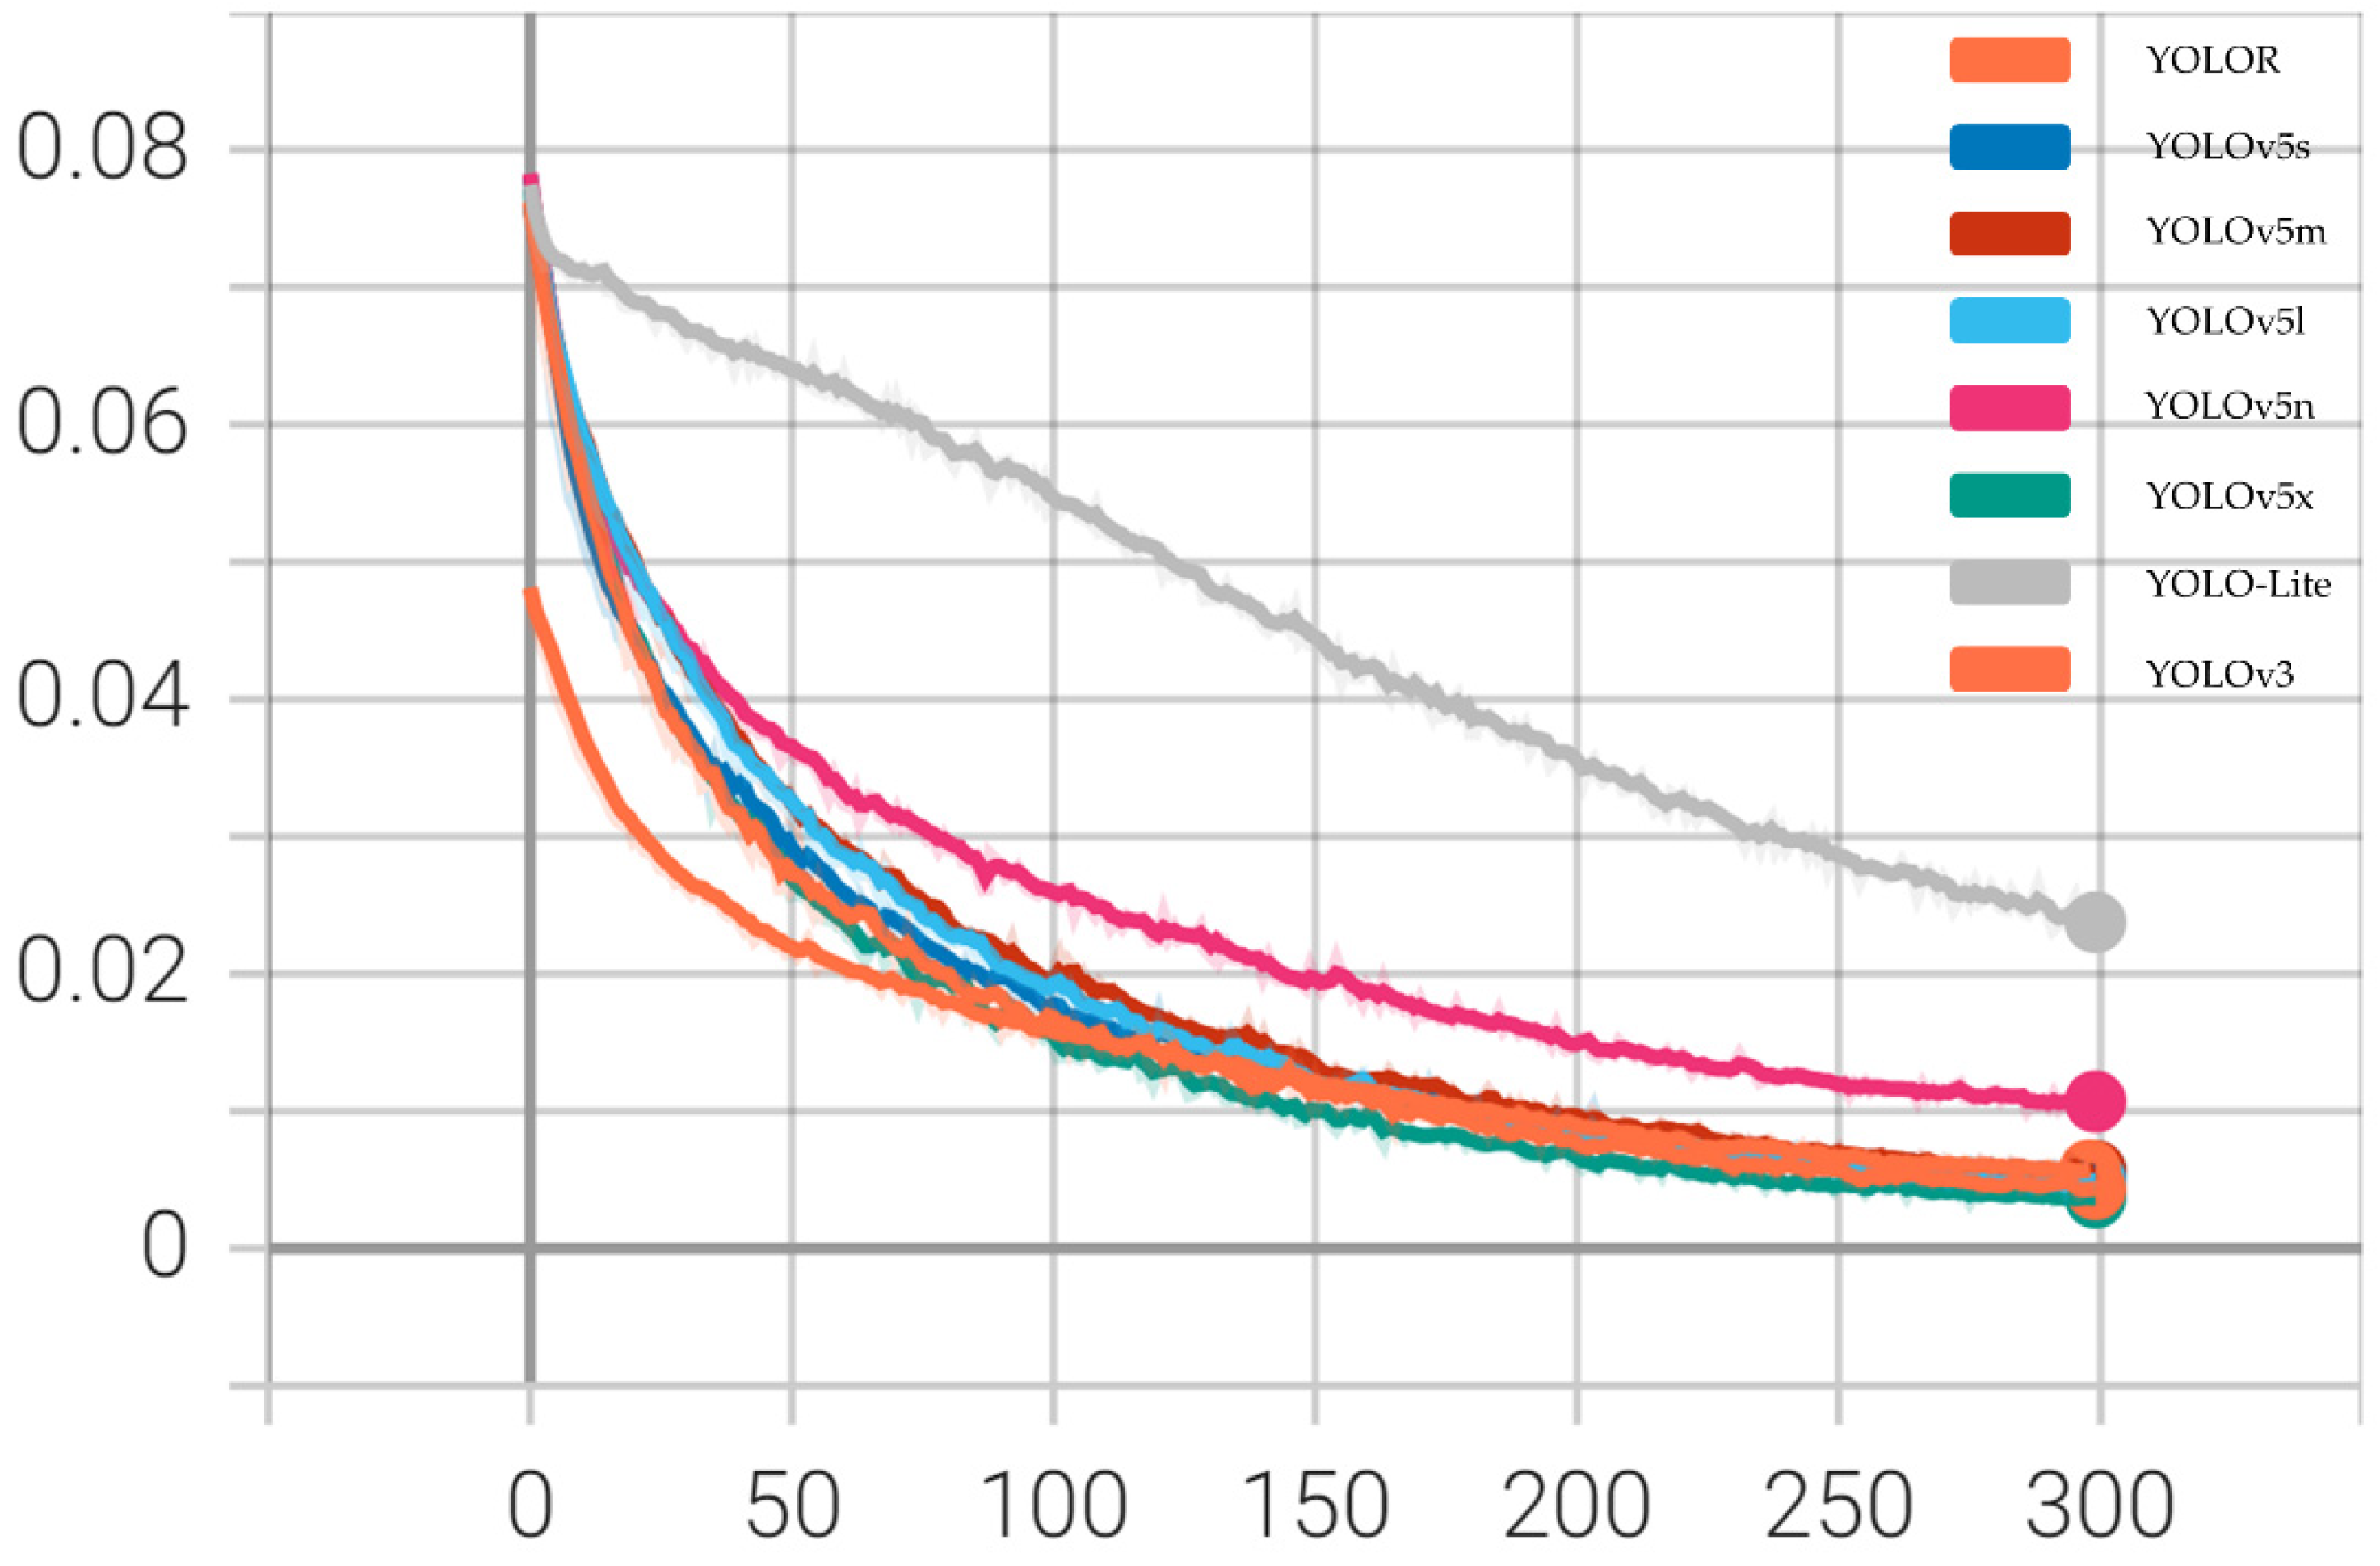
As can be seen in Figure 8, the training loss curves show a decreased loss trend as training progresses. This indicates that our models perform superior at early learning and detecting the insect pest in the training phase. As the networks go through more epochs, the training loss decreases slowly. After 200 epochs, the models reach convergence. Therefore, in our experiments, we choose 300 epochs as the best training parameter for training our model. In (Figure 8) we can also see that the YOLOv5x architectures could achieve a lower loss than the other networks.
5.3. Comparing the Algorithms
To further evaluate and compare 296 unseen images were used as a test set to investigate the experimental results of the YOLOv5 (n, s, m, l, and x), YOLO-Lite, YOLOR, and YOLOv3. The results of the models are shown in (Figure 9) and illustrated in Table 4. The above statistical indicators such as precision, recall, F1 score, and mAP@IoU = 0.5, mAP@IoU = 0.5:0.95 were used to evaluate the robustness of the object recognition models. For the robustness of the model, we use precision, recall, F1 score, and mAP. The evaluation of the recognition performance of eight different YOLO architectures using the statistical indicators is presented in Table 4. All eight models were trained on our new custom-built IP-23 dataset. The hyper-parameters were kept constant when comparing the models. The comparison results show that the performance of YOLO-Lite was the worst compared to the other models, with a minimum of [email protected], [email protected]:0.95, precision, recall, and F1 score of 47.0%, 51.7%, 27.9, 53.3%, 47.0%, respectively. Among the counter models, the results revealed that the YOLOv5x model outperforms significantly with a precision of 94.5%, recall of 97.8%, F1 score of 96%, and mAP@IoU = 0.5 98.3, mAP@IoU = 0.5:0.95 79.8%. In addition, the inference time of the YOLOv5x model was 40.5 ms on the test set, YOLOv5l required 22.6 ms, YOLOv5m required 14.0 ms, YOLOv5s required 9.9 ms, YOLOv5n required 9.0 ms, YOLOv3 required 27.5 ms, YOLO-Lite required 10.01 ms and YOLOR required 13.38 ms respectively. To summarize the YOLOv5x developed in the trained models has achieved significant results in terms of detection accuracy making it a promising model for high-performance real-time insect pest detection. The proposed approach can be employed for a realistic application while farming.
5.4. Confusion Matrices
Confusion matrices were used to visualize and analyze the performance of the tested neural network models in identification and recognition. A confusion matrix contains information about the actual and expected object classifications of a categorization system [40]. The diagonal line in the middle of the confusion matrix shows the significance of the prediction results. The vertical line represents false positives, while the horizontal line represents false negatives. The data in (Figure 10A–G) show the confusion matrices of the Yolo models.
5.5. Detection Results of YOLOv5x
To better illustrate the results of our experiments, we randomly chose images from the test set. The YOLOv5x has good recognition performance for the different categories of insect pests because the convolutional neural network algorithm does not require manual feature extraction and improves generalization ability (Figure 11).
5.6. Results with IP-Camera
Figure 12 shows the flow of the real-time detection of the internet protocol (IP) camera of a smartphone. As you can see in the following Figure 12, the connection between the smartphone and the computer is established, there are two conditions, such as the mutual establishment of IP addresses and sharing of the local network, must be met. The IP address refers to your network environment.
The performance of the model was also tested on an IP camera. To illustrate the results of our experiments we selected unseen random images from the test set. The result reveals that the developed YOLOv5x model outperforms the cell phone IP-Camera. The predicted results are presented in (Figure 13).
During the detection process, the video has a delay of about 5 s, because YOLOv5x is time-consuming when it comes to image slicing. The delay gradually decreases with the improvement of the network and graphics card.
6. Discussion
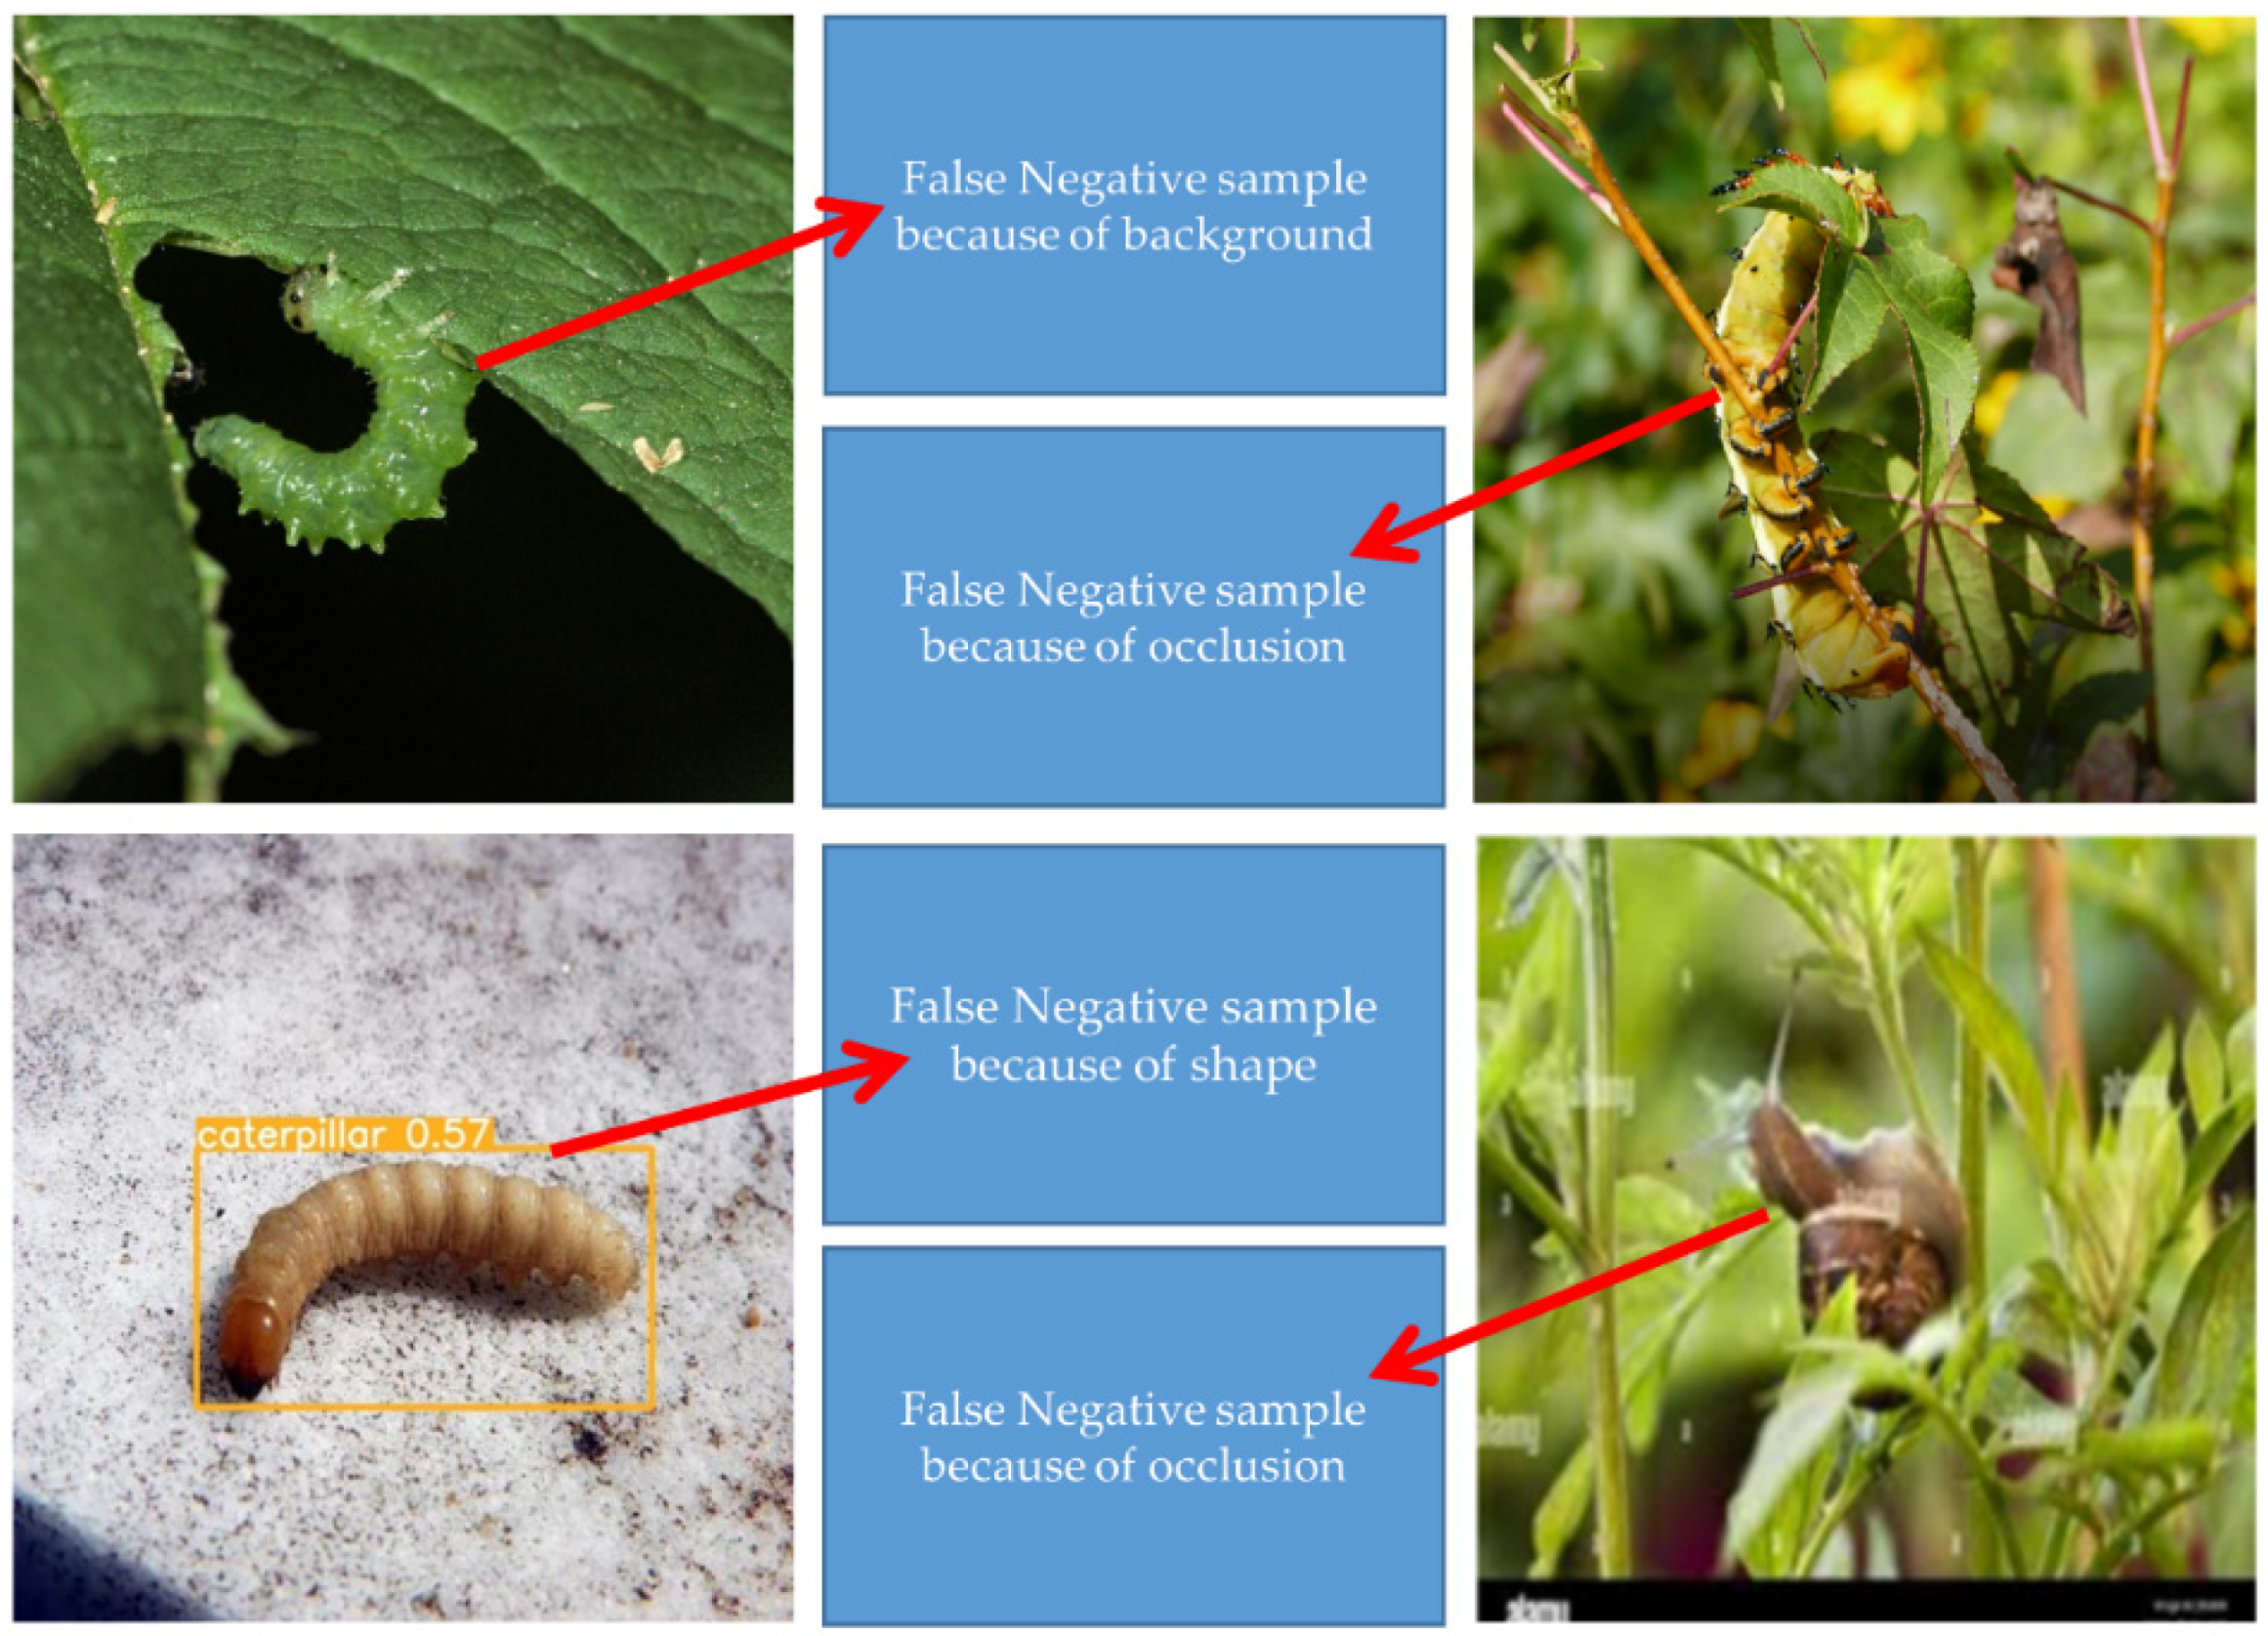
Among the trained and validated models without transfer learning, the YOLOv5x was the most successful one. These YOLO models were studied in terms of real-time object recognition. We found that YOLOv5x recognizes efficiently twenty-three different categories of insect pests against different backgrounds.
The object recognition problems in the developed model can be distributed into three parts (Figure 14). The following problems include examples that were misidentified due to a similarity in shape and the inability to recognize the object due to its blurriness in the image. The YOLOv5x architecture achieves the highest mAP (98.3%) at real-time inference speed. These values are comparable to studies using two-level object recognition architectures, whose detection accuracy is higher than that of the single-stage architectures we used [50]. Magnifying images similar to the object recognition errors we encounter in the dataset, as well as using data augmentation methods such as image blurring, increase the object recognition accuracy. In other YOLO-based studies, it has been observed that mAP can be increased with appropriate data augmentation methods [9].
7. Conclusions
Deep learning models are commonly used to detect insect pests in plants. However, a major problem is low accuracy when real-world images are presented to the model. In this study, after conducting a comprehensive comparison of the eight frameworks from DL, we developed an object detection system that can detect insect pests in digital images in real-time using the single-stage object detection architectures of YOLO-Lite, YOLOv3, YOLOR, and YOLOv5 with five different scales (n, s, m, l, and x). To implement the proposed approach, we created a new IP-23 dataset with twenty-three classes. We performed training, validation, and testing with our IP-23 dataset on an Asus computer with Intel(R) Core (TM) i7-11370H CPU @ 3.30 GHz (8 CPU) 3.3 GHz, 16 G RAM, GPU NVIDIA GeForce RTX 3060, 6 G video memory and GPU acceleration software CUDA11.1 and CUDNN 8.0.5. We also used matpool cloud GPU RTX NVIDIA 2080Ti for training the models with CUDA11.0, and CUDNN 8.0, and then we test our developed model both on our personal Asus computer and on the IP camera of our smartphone. Among the counter models, YOLOv5x was found the most successful model with a significant result. In terms of detection rate, our developed YOLOv5x model with trained parameters achieved an average precision value ([email protected]) of 98.3%, ([email protected]:0.95) of 79.8%, a precision value of 94.5%, and recall value of 97.8%, and F1 score of 96%. In addition, the YOLOv5x model is fully functional and capable of correctly identifying the twenty-three species of insect pests with a detection rate of 40.5 milliseconds (ms). The results revealed that our proposed approach performs better on both smartphone IP cameras and our PC which can be used for realistic applications in agriculture. We have also observed some false negative detections due to shape, background, and occlusion which can be improved by adding more images with different complex scenarios, environments, and complex orchards. The accuracy of the model can be improved by adding more images to the dataset and applying pre-processing and data augmentation methods such as cropping, adding brightness, noise, and blur to the image.
In our future work, we will increase the amount of data in each class with a few samples and add more insect pest species. To put our insect pest detection system into practice, we will embed the model into mobile devices such as Android and IOS, which could be useful for promoting agricultural production. The accuracy of the object detection system can be improved by increasing the size of the dataset using data augmentation methods. Moreover, the dataset can be expanded by adding images of the different pest species to detect the pests in earlier periods.
Author Contributions
Conceptualization, I.A. and Y.W.; methodology, Y.Y. (Yi Yue); software, I.A.; formal analysis, Y.Y. (Yayun Yang); investigation, C.Y. and I.A.; resources, I.A.; data curation, I.A.; writing—original draft preparation, I.A.; writing—review and editing, I.A., X.C. and M.H.; visualization, I.A.; supervision, Y.W.; project administration, Y.W.; funding acquisition, Y.W. and Y.Z. All authors have read and agreed to the published version of the manuscript.
Funding
This work was supported by the Anhui Provincial Engineering Laboratory for Beidou Precision Agriculture Information Open Fund Project (BDSYS2021003); 2020 Natural Science Foundation of Anhui Province (2008085QF293); Special Fund for Anhui Characteristic Agriculture Industry Technology System (2021–2025).
Institutional Review Board Statement
Not applicable.
Informed Consent Statement
Not applicable.
Data Availability Statement
Not applicable.
Acknowledgments
We thank to Anhui Provincial Engineering Laboratory for Beidou Precision Agriculture Information for supporting our work and provide funding to us. We also thank all of the authors of the primary studies includes in this article. We also wish to thank anonymous reviewers for their kind advice.
Conflicts of Interest
The authors declare no conflict of interest.
References
- Carvajal-Yepes, M.; Cardwell, K.; Nelson, A.; Garrett, K.A.; Giovani, B.; Saunders, D.G.O.; Kamoun, S.; Legg, J.P.; Verdier, V.; Lessel, J.; et al. A global surveillance system for crop diseases. Science 2019, 364, 1237–1239. [Google Scholar] [CrossRef] [PubMed] [Green Version]
- Boedeker, W.; Watts, M.; Clausing, P.; Marquez, E. The global distribution of acute unintentional pesticide poisoning: Estimations based on a systematic review. BMC Public Health 2020, 20, 1875. [Google Scholar] [CrossRef] [PubMed]
- Karar, M.E.; Alsunaydi, F.; Albusaymi, S.; Alotaibi, S. A New Mobile Application of Agricultural Pests Recognition Using Deep Learning in Cloud Computing System. Alex. Eng. J. 2021, 60, 4423–4432. [Google Scholar] [CrossRef]
- Hu, Z.; Xu, L.; Cao, L.; Liu, S.; Luo, Z.; Wang, J.; Li, X.; Wang, L. Application of Non-Orthogonal Multiple Access in Wireless Sensor Networks for Smart Agriculture. IEEE Access 2019, 7, 87582–87592. [Google Scholar] [CrossRef]
- Narenderan, S.; Meyyanathan, S.; Babu, B. Review of pesticide residue analysis in fruits and vegetables. Pre-treatment, extraction and detection techniques. Food Res. Int. 2020, 133, 109141. [Google Scholar] [CrossRef] [PubMed]
- Onler, E. Real Time Pest Detection Using YOLOv5. Int. J. Agric. Nat. Sci. 2021, 14, 232–246. [Google Scholar]
- McCarthy, C.; Rees, S.; Baillie, C. Machine Vision-Based Weed Spot Spraying: A Review and Where Next for Sugarcane. In Proceedings of the 32nd Annual Conference of the Australian Society of Sugar Cane Technologists (ASSCT 2010), Bundaberg, Australia, 11–14 May 2010; Volume 32, pp. 424–432. [Google Scholar]
- Oberti, R.; Marchi, M.; Tirelli, P.; Calcante, A.; Iriti, M.; Tona, E.; Hočevar, M.; Baur, J.; Pfaff, J.; Schütz, C.; et al. Selective spraying of grapevines for disease control using a modular agricultural robot. Biosyst. Eng. 2016, 146, 203–215. [Google Scholar] [CrossRef]
- Lippi, M.; Bonucci, N.; Carpio, R.F.; Contarini, M.; Speranza, S.; Gasparri, A. A YOLO-Based Pest Detection System for Precision Agriculture. In Proceedings of the 2021 29th Mediterranean Conference on Control and Automation (MED), Puglia, Italy, 22–25 June 2021; pp. 342–347. [Google Scholar] [CrossRef]
- Shanwad, U.K.; Patil, V.C.; Dasog, S.G.; Mansur, C.P.; Shashidhar, K.C. Global Positioning System (GPS) in Precision Agriculture. In Proceedings of the Asian GPS Conference, New Delhi, India, 24–25 October 2002; Volume 1. [Google Scholar]
- Bengio, Y.; LeCun, Y. Scaling Learning Algorithms towards AI. In Large-Scale Kernel Machines; MIT Press: Cambridge, MA, USA, 2007; Volume 34, pp. 1–41. [Google Scholar]
- Hassan, M.; Wang, Y.; Wang, D.; Li, D.; Liang, Y.; Zhou, Y.; Xu, D. Deep learning analysis and age prediction from shoeprints. Forensic Sci. Int. 2021, 327, 110987. [Google Scholar] [CrossRef]
- Hassan, M.; Wang, Y.; Pang, W.; Wang, D.; Li, D.; Zhou, Y.; Xu, D. GUV-Net for high fidelity shoeprint generation. Complex Intell. Syst. 2021, 8, 933–947. [Google Scholar] [CrossRef]
- Soviany, P.; Ionescu, R.T. Optimizing the Trade-Off between Single-Stage and Two-Stage Deep Object Detectors using Image Difficulty Prediction. In Proceedings of the 2018 20th International Symposium on Symbolic and Numeric Algorithms for Scientific Computing (SYNASC), Timisoara, Romania, 20–23 September 2018. [Google Scholar] [CrossRef]
- Murthy, C.B.; Hashmi, M.F.; Bokde, N.D.; Geem, Z.W. Investigations of Object Detection in Images/Videos Using Various Deep Learning Techniques and Embedded Platforms—A Comprehensive Review. Appl. Sci. 2020, 10, 3280. [Google Scholar] [CrossRef]
- Redmon, J.; Divvala, S.; Girshick, R.; Farhadi, A. You Only Look Once: Unified, Real-Time Object Detection. In Proceedings of the 2016 IEEE Conference on Computer Vision and Pattern Recognition (CVPR), Las Vegas, NV, USA, 27–30 June 2016; pp. 779–788. [Google Scholar] [CrossRef] [Green Version]
- Wang, C.-Y.; Yeh, I.-H.; Liao, H.-Y.M. You Only Learn One Representation: Unified Network for Multiple Tasks. arXiv 2021, arXiv:2105.04206. [Google Scholar]
- Kamilaris, A.; Prenafeta-Boldú, F.X. Deep learning in agriculture: A survey. Comput. Electron. Agric. 2018, 147, 70–90. [Google Scholar] [CrossRef] [Green Version]
- Nam, N.T.; Hung, P.D. Pest Detection on Traps Using Deep Convolutional Neural Networks. In Proceedings of the 2018 International Conference on Control and Computer Vision (ICCCV ’18), Singapore, 15–18 June 2018; pp. 33–38. [Google Scholar]
- Fuentes, A.; Yoon, S.; Kim, S.C.; Park, D.S. A Robust Deep-Learning-Based Detector for Real-Time Tomato Plant Diseases and Pests Recognition. Sensors 2017, 17, 2022. [Google Scholar] [CrossRef] [PubMed] [Green Version]
- Jiao, L.; Dong, S.; Zhang, S.; Xie, C.; Wang, H. AF-RCNN: An anchor-free convolutional neural network for multi-categories agricultural pest detection. Comput. Electron. Agric. 2020, 174, 105522. [Google Scholar] [CrossRef]
- Li, D.; Wang, R.; Xie, C.; Liu, L.; Zhang, J.; Li, R.; Wang, F.; Zhou, M.; Liu, W. A Recognition Method for Rice Plant Diseases and Pests Video Detection Based on Deep Convolutional Neural Network. Sensors 2020, 20, 578. [Google Scholar] [CrossRef] [Green Version]
- Liu, W.; Anguelov, D.; Erhan, D.; Szegedy, C.; Reed, S.; Fu, C.-Y.; Berg, A.C. SSD: Single Shot Multibox Detector. In Computer Vision–ECCV 2016; Springer: Cham, Switzerland, 2016; pp. 21–37. [Google Scholar]
- Zhong, Y.; Gao, J.; Lei, Q.; Zhou, Y. A Vision-Based Counting and Recognition System for Flying Insects in Intelligent Agriculture. Sensors 2018, 18, 1489. [Google Scholar] [CrossRef] [Green Version]
- Du, J. Understanding of Object Detection Based on CNN Family and YOLO. J. Phys. Conf. Ser. 2018, 1004, 012029. [Google Scholar] [CrossRef]
- Sabanci, K.; Aslan, M.F.; Ropelewska, E.; Unlersen, M.F.; Durdu, A. A Novel Convolutional-Recurrent Hybrid Network for Sunn Pest–Damaged Wheat Grain Detection. Food Anal. Methods 2022, 15, 1748–1760. [Google Scholar] [CrossRef]
- Koklu, M.; Unlersen, M.F.; Ozkan, I.A.; Aslan, M.F.; Sabanci, K. A CNN-SVM study based on selected deep features for grapevine leaves classification. Measurement 2021, 188, 110425. [Google Scholar] [CrossRef]
- Gambhir, J.; Patel, N.; Patil, S.; Takale, P.; Chougule, A.; Prabhakar, C.S.; Managanvi, K.; Raghavan, A.S.; Sohane, R.K. Deep Learning for Real-Time Diagnosis of Pest and Diseases on Crops. In Intelligent Data Engineering and Analytics; Springer: Singapore, 2022; pp. 189–197. [Google Scholar] [CrossRef]
- Roy, A.M.; Bhaduri, J. Real-time growth stage detection model for high degree of occultation using DenseNet-fused YOLOv4. Comput. Electron. Agric. 2022, 193, 106694. [Google Scholar] [CrossRef]
- Lawal, M.O. Tomato detection based on modified YOLOv3 framework. Sci. Rep. 2021, 11, 1447. [Google Scholar] [CrossRef] [PubMed]
- Roy, A.M.; Bose, R.; Bhaduri, J. A fast accurate fine-grain object detection model based on YOLOv4 deep neural network. Neural Comput. Appl. 2022, 34, 3895–3921. [Google Scholar] [CrossRef]
- Tzutalin, D. GitHub. 2015. Available online: https://github.com/heartexlabs/labelImg (accessed on 30 August 2022).
- Wang, H.; Zhang, F.; Wang, L. Fruit Classification Model Based on Improved Darknet53 Convolutional Neural Network. In Proceedings of the 2020 International Conference on Intelligent Transportation, Big Data & Smart City (ICITBS), Vientiane, Laos, 11–12 January 2020; pp. 881–884. [Google Scholar] [CrossRef]
- Lin, T.-Y.; Goyal, P.; Girshick, R.; He, K.; Dollár, P. Focal Loss for Dense Object Detection. IEEE Trans. Pattern Anal. Mach. Intell. 2018, 42, 318–327. [Google Scholar] [CrossRef] [PubMed] [Green Version]
- Lin, T.-Y.; Dollár, P.; Girshick, R.; He, K.; Hariharan, B.; Belongie, S. Feature pyramid networks for object detection. In Proceedings of the 2017 IEEE Conference on Computer Vision and Pattern Recognition (CVPR), Honolulu, HI, USA, 21–26 July 2017; pp. 936–944. [Google Scholar] [CrossRef] [Green Version]
- Everingham, M.; Eslami, S.M.A.; Van Gool, L.; Williams, C.K.I.; Winn, J.; Zisserman, A. The Pascal Visual Object Classes Challenge: A Retrospective. Int. J. Comput. Vis. 2014, 111, 98–136. [Google Scholar] [CrossRef]
- Lin, T.-Y.; Maire, M.; Belongie, S.; Bourdev, L.; Girshick, R.; Hays, J.; Perona, P.; Zitnick, C.L.; Dollár, P. Microsoft COCO: Common Objects in Context. arXiv 2015, arXiv:1405.0312. Available online: https://cocodataset.org/ (accessed on 30 August 2022).
- Wang, C.-Y.; Liao, H.-Y.M.; Wu, Y.-H.; Chen, P.-Y.; Hsieh, J.-W.; Yeh, I.-H. CSPNet: A New Backbone that can Enhance Learning Capability of CNN. In Proceedings of the 2020 IEEE/CVF Conference on Computer Vision and Pattern Recognition Workshops (CVPRW), Seattle, WA, USA, 14–19 June 2020; pp. 1571–1580. [Google Scholar]
- Wang, K.; Liew, J.H.; Zou, Y.; Zhou, D.; Feng, J. PANet: Few-Shot Image Semantic Segmentation with Prototype Alignment. In Proceedings of the 2019 IEEE/CVF International Conference on Computer Vision (ICCV), Seoul, Korea, 27 October–2 November 2019; pp. 9197–9206. [Google Scholar]
- Redmon, J.; Farhadi, A. YOLO9000: Better, Faster, Stronger. In Proceedings of the IEEE Conference on Computer Vision and Pattern Recognition, Honolulu, HI, USA, 21–26 July 2017; pp. 7263–7271. [Google Scholar]
- Xu, R.; Lin, H.; Lu, K.; Cao, L.; Liu, Y. A Forest Fire Detection System Based on Ensemble Learning. Forests 2021, 12, 217. [Google Scholar] [CrossRef]
- Nepal, U.; Eslamiat, H. Comparing YOLOv3, YOLOv4 and YOLOv5 for Autonomous Landing Spot Detection in Faulty UAVs. Sensors 2022, 22, 464. [Google Scholar] [CrossRef]
- Liu, S.; Qi, L.; Qin, H.; Shi, J.; Jia, J. Path Aggregation Network for Instance Segmentation. In Proceedings of the 2018 IEEE/CVF Conference on Computer Vision and Pattern Recognition (CVPR), Salt Lake City, UT, USA, 18–23 June 2018; Institute of Electrical and Electronics Engineers (IEEE): New York, NY, USA, 2018; pp. 8759–8768. [Google Scholar] [CrossRef] [Green Version]
- Chen, K.; Ouyang, W.; Loy, C.C.; Lin, D.; Pang, J.; Wang, J.; Xiong, Y.; Li, X.; Sun, S.; Feng, W.; et al. Hybrid Task Cascade for Instance Segmentation. In Proceedings of the 2019 IEEE/CVF Conference on Computer Vision and Pattern Recognition (CVPR), Long Beach, CA, USA, 15–20 June 2019; pp. 4969–4978. [Google Scholar] [CrossRef] [Green Version]
- Tan, M.; Pang, R.; Le, Q.V. EfficientDet: Scalable and Efficient Object Detection. In Proceedings of the 2020 IEEE/CVF Conference on Computer Vision and Pattern Recognition (CVPR), Seattle, WA, USA, 13–19 June 2020; pp. 10778–10787. [Google Scholar] [CrossRef]
- Ruder, S. An Overview of Gradient Descent Optimization Algorithms. arXiv 2016, arXiv:1609.04747. [Google Scholar]
- Stevens, E.; Antiga, L.; Viehmann, T. Deep Learning with PyTorch; Manning Publications Co.: Shelter Island, NY, USA, 2020. [Google Scholar]
- Paszke, A.; Gross, S.; Massa, F.; Lerer, A.; Bradbury, J.; Chanan, G.; Killeen, T.; Lin, Z.; Gimelshein, N.; Antiga, L.; et al. PyTorch: An Imperative Style, High-Performance Deep Learning Library. In Proceedings of the Advances in Neural Information Processing Systems 32: Annual Conference on Neural Information Processing Systems 2019, NeurIPS 2019, Vancouver, BC, Canada, 8–14 December 2019; Volume 32. [Google Scholar]
- Rezatofighi, H.; Tsoi, N.; Gwak, J.; Sadeghian, A.; Reid, I.; Savarese, S. Generalized Intersection Over union: A metric and a Loss for Bounding Box Regression. In Proceedings of the IEEE Conference on Computer Vision and Pattern Recognition 2019, Long Beach, CA, USA, 15–20 June 2019; pp. 658–666. [Google Scholar] [CrossRef] [Green Version]
- Liu, L.; Wang, R.; Xie, C.; Yang, P.; Wang, F.; Sudirman, S.; Liu, W. PestNet: An End-to-End Deep Learning Approach for Large-Scale Multi-Class Pest Detection and Classification. IEEE Access 2019, 7, 45301–45312. [Google Scholar] [CrossRef]
Figure 1.
Schematic flowchart of the research approach.

Figure 2.
Images of the IP-23 dataset we used in training and validation of the object detection model.
Figure 2.
Images of the IP-23 dataset we used in training and validation of the object detection model.

Figure 3.
Image annotation tool LabelImg.

Figure 4.
The augmentation is carried out by applying shifts in horizontal and vertical directions, rotation, horizontal flipping, hue, blur, and saturation. (a) Original image. (b) Augmented images.
Figure 4.
The augmentation is carried out by applying shifts in horizontal and vertical directions, rotation, horizontal flipping, hue, blur, and saturation. (a) Original image. (b) Augmented images.

Figure 5.
The general architecture YOLOv5 [42].
Figure 5.
The general architecture YOLOv5 [42].

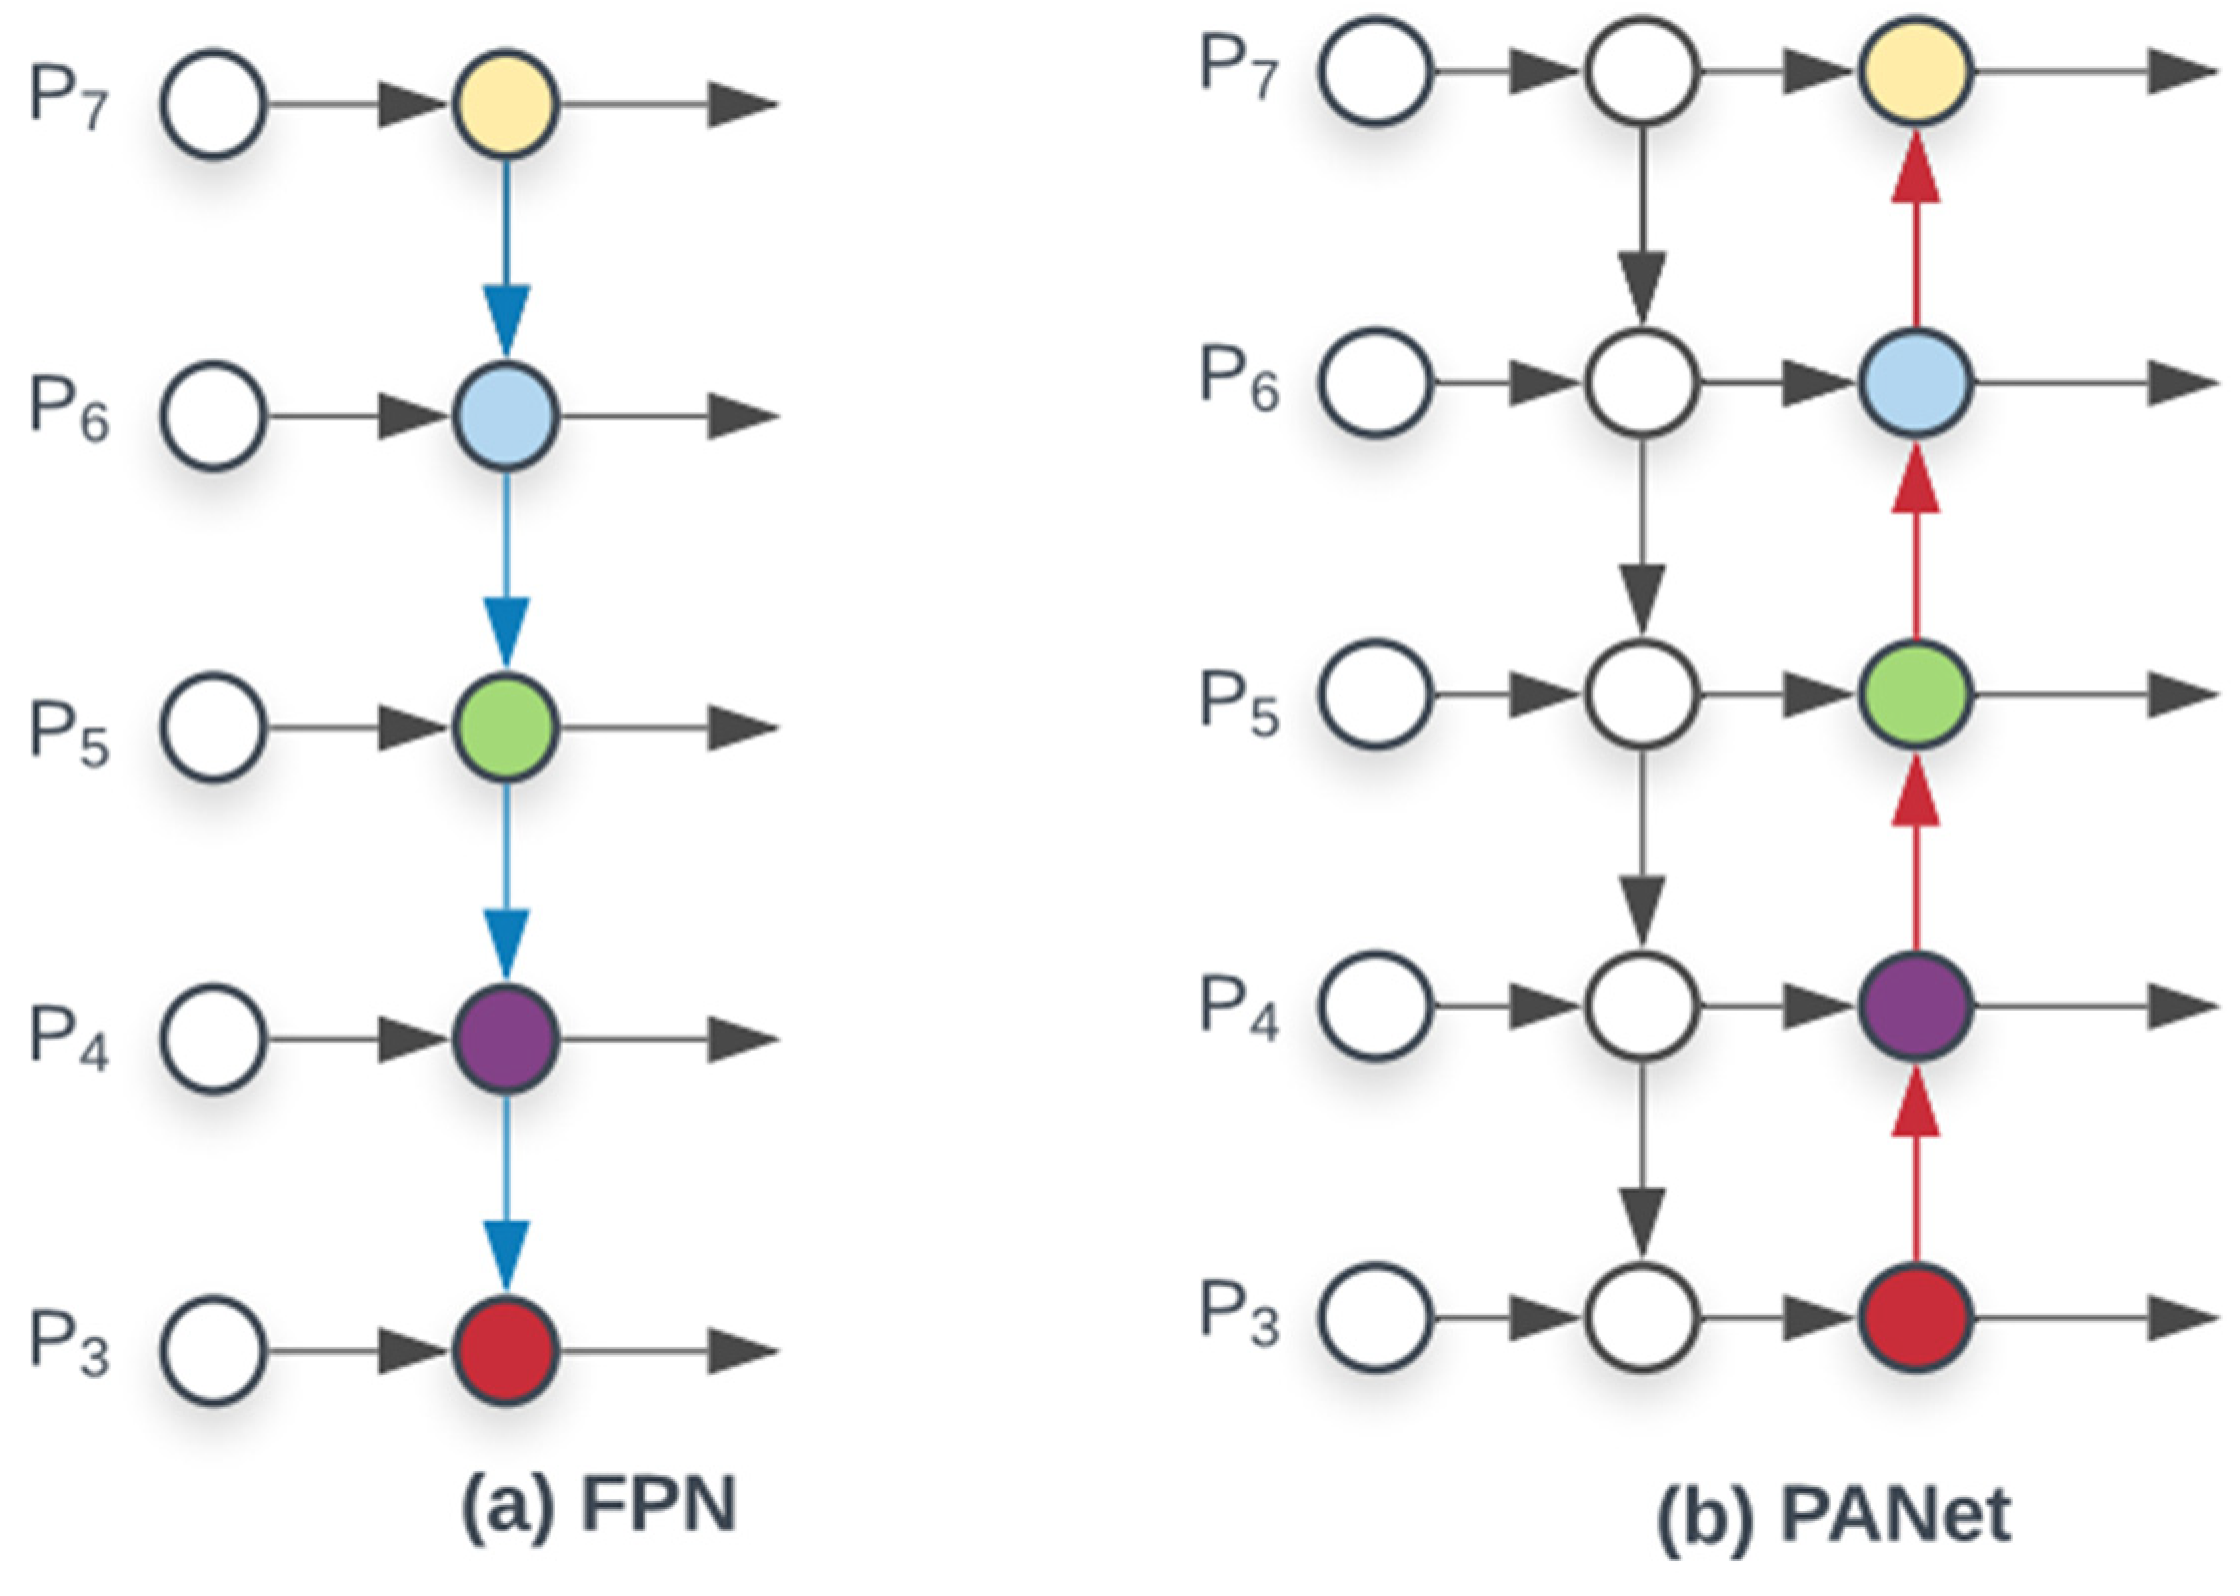
Figure 6.
Feature pyramid network (FPN) (a) introduces a top-down pathway to fuse multi-scale features from level 3 to 7 (P3–P7); (b) PANet adds an additional bottom-up pathway on top of FPN [45].
Figure 6.
Feature pyramid network (FPN) (a) introduces a top-down pathway to fuse multi-scale features from level 3 to 7 (P3–P7); (b) PANet adds an additional bottom-up pathway on top of FPN [45].

Figure 7.
IOU calculation.

Figure 8.
Training loss of eight different architectures. Training loss is computed by summing loss with bounding box regression.
Figure 8.
Training loss of eight different architectures. Training loss is computed by summing loss with bounding box regression.

Figure 9.
Performance comparison of [email protected], [email protected]:0.95, precision and recall. The IoU threshold [email protected] means the average precision when the IoU > 0.5, and the [email protected]:0.95 denotes the average precision when the IoU has taken 10 values between 0.5 and 0.95. These charts represent YOLOv5x, YOLOv5l, YOLOv5m, YOLOv5s, YOLOv5n, YOLOv3, YOLO-Lite, and YOLOR separately.

Figure 10.
Confusion Matrix of (A) YOLO-Lite (B) YOLOv5n (C) YOLOv5s (D) YOLOv5m (E) YOLOv5l (F) YOLOv5x (G) YOLOv3.
Figure 10.
Confusion Matrix of (A) YOLO-Lite (B) YOLOv5n (C) YOLOv5s (D) YOLOv5m (E) YOLOv5l (F) YOLOv5x (G) YOLOv3.

Figure 11.
Detection results of YOLOv5x.

Figure 12.
A flowchart of real-time detection on a mobile IP camera.

Figure 13.
Detection results of the cell phone IP camera.

Figure 14.
Common problems encountered in our object detection system.


Table 1.
Details of the collected IP-23 images dataset.
| ID | Name | Number of Samples |
|---|---|---|
| 1 | Aphid | 325 |
| 2 | Bees | 320 |
| 3 | Beetle | 322 |
| 4 | Caterpillar | 325 |
| 5 | Centipede | 325 |
| 6 | Cockroach | 325 |
| 7 | Damselfly | 329 |
| 8 | Grasshopper | 325 |
| 9 | Grub | 325 |
| 10 | Jassid | 325 |
| 11 | Katydid | 325 |
| 12 | Ladybugs | 292 |
| 13 | Locust | 325 |
| 14 | Mantis | 325 |
| 15 | Ant | 291 |
| 16 | Mealybugs | 258 |
| 17 | Root-borer | 265 |
| 18 | Snail | 301 |
| 19 | Spittlebugs | 332 |
| 20 | Termite | 210 |
| 21 | Thrips | 293 |
| 22 | Weevil | 305 |
| 23 | Whitefly | 278 |
Table 2.
The detailed training strategies of underlying models.
| Model | Train Set | Test Set | Optimizer | LR (Learning Rate) | Momentum | Image-Size | Batch-Size | Epochs |
|---|---|---|---|---|---|---|---|---|
| YOLO-Lite | 4933 | 2113 | SGD [18] | 0.001 | 0.937 | 640 × 640 | 16 | 300 |
| YOLOv5n | 4933 | 2113 | SGD | 0.001 | 0.937 | 640 × 640 | 16 | 300 |
| YOLOv5s | 4933 | 2113 | SGD | 0.001 | 0.937 | 640 × 640 | 16 | 300 |
| YOLOv5m | 4933 | 2113 | SGD | 0.001 | 0.937 | 640 × 640 | 6 | 300 |
| YOLOv5l | 4933 | 2113 | SGD | 0.001 | 0.937 | 640 × 640 | 6 | 300 |
| YOLOv5x | 4933 | 2113 | SGD | 0.001 | 0.937 | 640 × 640 | 4 | 300 |
| YOLOv3 | 4933 | 2113 | SGD | 0.001 | 0.937 | 640 × 640 | 8 | 300 |
| YOLOR | 4933 | 2113 | SGD | 0.001 | 0.937 | 640 × 640 | 4 | 300 |
Table 3.
Information of model variation used in training.
| Model | Number of Layers | Training Parameters |
|---|---|---|
| YOLO-Lite | 362 | 5,467,452 |
| YOLOv5n | 213 | 1,790,284 |
| YOLOv5s | 270 | 7,072,156 |
| YOLOv5m | 290 | 20,941,836 |
| YOLOv5l | 468 | 46,256,764 |
| YOLOv5x | 567 | 83,365,852 |
| YOLOv3 | 269 | 62,664,988 |
| YOLOR | 665 | 36,957,216 |
Table 4.
Comparison of YOLO-Lite, YOLOv5n, YOLOv5s, YOLOv5m, YOLOv5l, YOLOv5x, YOLOv3, and YOLOR Models.
Table 4.
Comparison of YOLO-Lite, YOLOv5n, YOLOv5s, YOLOv5m, YOLOv5l, YOLOv5x, YOLOv3, and YOLOR Models.
| Model | mAP 0.5% | mAP 0.5:0.95% | Precision% | Recall | F1-Score | GFLOPS | Weights Megabytes (MB) | Inference Time Millisecond (ms) |
|---|---|---|---|---|---|---|---|---|
| YOLO-Lite | 51.7 | 27.9 | 53.3 | 48.1 | 47.0 | 14.8 | 11.3 | 10.01 |
| YOLOv5n | 83.85 | 46.35 | 74.53 | 83.91 | 77.0 | 4.2 | 3.79 | 9.0 |
| YOLOv5s | 94.61 | 63.0 | 86.70 | 93.78 | 90.0 | 16.0 | 13.8 | 9.9 |
| YOLOv5m | 97.18 | 71.69 | 90.13 | 96.86 | 92.0 | 448.2 | 42.4 | 14.0 |
| YOLOv5l | 97.04 | 72.76 | 91.60 | 95.50 | 93.0 | 108.2 | 93.1 | 22.6 |
| YOLOv5x | 98.3 | 79.8 | 94.5 | 98.84 | 96.0 | 204.4 | 173.5 | 40.5 |
| YOLOv3 | 97.6 | 74.6 | 93.8 | 95.7 | 95.0 | 155.9 | 125.9 | 27.5 |
| YOLOR | 96.80 | 75.75 | 77.58 | 97.8 | - | 80.69 | 282 | 13.38 |
Publisher’s Note: MDPI stays neutral with regard to jurisdictional claims in published maps and institutional affiliations. |
© 2022 by the authors. Licensee MDPI, Basel, Switzerland. This article is an open access article distributed under the terms and conditions of the Creative Commons Attribution (CC BY) license (https://creativecommons.org/licenses/by/4.0/).
Share and Cite
MDPI and ACS Style
Ahmad, I.; Yang, Y.; Yue, Y.; Ye, C.; Hassan, M.; Cheng, X.; Wu, Y.; Zhang, Y. Deep Learning Based Detector YOLOv5 for Identifying Insect Pests. Appl. Sci. 2022, 12, 10167. https://doi.org/10.3390/app121910167
AMA Style
Ahmad I, Yang Y, Yue Y, Ye C, Hassan M, Cheng X, Wu Y, Zhang Y. Deep Learning Based Detector YOLOv5 for Identifying Insect Pests. Applied Sciences. 2022; 12(19):10167. https://doi.org/10.3390/app121910167
Chicago/Turabian StyleAhmad, Iftikhar, Yayun Yang, Yi Yue, Chen Ye, Muhammad Hassan, Xi Cheng, Yunzhi Wu, and Youhua Zhang. 2022. "Deep Learning Based Detector YOLOv5 for Identifying Insect Pests" Applied Sciences 12, no. 19: 10167. https://doi.org/10.3390/app121910167
Note that from the first issue of 2016, this journal uses article numbers instead of page numbers. See further details here.