Article

Temporal and Spatial Variation Characteristics of Actual Evapotranspiration in the Yiluo River Basin Based on the Priestley–Taylor Jet Propulsion Laboratory Model

1
School of Water Conservancy and Civil Engineering, Zhengzhou University, Zhengzhou 450001, China
2
General Institute of Water Resources and Hydropower Planning and Design, Ministry of Water Resources, Beijing 100032, China
3
Bureau of Hydrology and Water Resources in Henan Province, Zhengzhou 450003, China
*
Author to whom correspondence should be addressed.
Appl. Sci. 2022, 12(19), 9784; https://doi.org/10.3390/app12199784
Submission received: 15 August 2022 / Revised: 22 September 2022 / Accepted: 26 September 2022 / Published: 28 September 2022
(This article belongs to the Section Environmental Sciences)

Abstract

:
Evapotranspiration is an important part of the hydrological cycle, affecting the terrestrial hydrological process and the relationship between water resource transformation. Analyzing and mastering the temporal and spatial variations in evapotranspiration are of great significance for the rational development, utilization, and protection of water resources in the basin. Based on MODIS remote sensing data and combined with meteorological and hydrological data, the PT-JPL model was used to estimate the actual evapotranspiration of the Yiluo River Basin, and the applicability of the PT-JPL model for estimating actual evapotranspiration in the basin was analyzed. The spatial and temporal characteristics of actual evapotranspiration in the Yiluo River Basin were analyzed, and the correlation between actual evapotranspiration in the basin and influencing factors such as precipitation, temperature, and vegetation was explored. The main conclusions are as follows: the PT-JPL model has good applicability in the Yiluo River Basin; the total actual evapotranspiration in the basin showed a decreasing trend, which was consistent with the trend of precipitation, indicating that the actual evapotranspiration may be limited by water conditions in the study area. The evapotranspiration of the basin was higher in the upstream and lower in the downstream, which may be related to the better vegetation coverage in the upper basin than in the downstream. As an important indicator of vegetation change, NDVI showed a good correlation with evapotranspiration, which also verified this. In addition, the correlation between evapotranspiration and temperature was also good.

1. Introduction

Evapotranspiration is the evaporation of water from water bodies, soils, and vegetation surfaces and the transpiration of water from plants. As a key element and an important link in the hydrological cycle, it affects the water cycle, plant growth and development, energy cycle, and terrestrial water distribution in surface ecosystems and has a significant impact on the availability of runoff water resources. The study of the temporal and spatial variations in evapotranspiration is useful for understanding the mechanisms of water resource evolution and the rational utilization of water resources [1,2].
The evapotranspiration process can be divided into canopy interception evaporation, soil evaporation, and vegetation transpiration [3]. Canopy interception evaporation is the first link in the redistribution of precipitation by vegetation and is mainly influenced by the wetting condition of the leaf surface; soil evaporation is the process by which water in the soil enters the atmosphere from the soil surface through ascent and vaporization, and is influenced by both the surface and internal soil water content; vegetation transpiration refers to the process of water loss from plants in the form of water vapor through leaves, which is mainly influenced by vegetation morphology, vegetation growth, water supply, air temperature and air humidity [4,5].
Vegetation, as an important component of the subsurface, is a major factor influencing actual evapotranspiration. The vegetation index allows us to monitor seasonal, interannual, and long-term changes in vegetation structure, phenology, and biophysical parameters. NDVI is one of the most widely used vegetation indices and is related to biological characteristics such as leaf area index of vegetation canopy, vegetation cover, vegetation condition, and biomass. The study of Chen, Parton [6] showed a good correlation between NDVI and vegetation primary productivity. Huete, Didan [7] found that NDVI is sensitive to multi-temporal (seasonal) vegetation changes, land cover changes, and changes in biophysical parameters, and can be used to monitor and assess spatial and temporal changes in vegetation quantity and condition. NDVI is a good indicator of vegetation growth and vegetation cover changes and can be effectively used for monitoring surface evapotranspiration, which is widely used in studies related to evapotranspiration. Srivastava, Jayaraman [8] constructed the relationship between cumulative NDVI and transpiration in six arid zones of India, starting from the analysis of the relationship between vegetation index and plant dry matter production; Zhou, Ishidaira [9] used the Shuttleworth–Wallace model and NOAA-AVHRR NDVI data to estimate the potential evapotranspiration in the Mekong River basin; Maselli, Papale [10] proposed a method combining meteorological and NDVI data to simulate actual evapotranspiration of various terrestrial ecosystems; and Cihlar, Stlaurent [11] and Kerr, Imbernon [12] found that there was a high correlation between NDVI and evapotranspiration.
Global climate change, urbanization, afforestation, and the construction of water conservancy projects have changed the hydrological balance of the basin, and the trend of aridification in the Yellow River Basin is obvious [13]. The Yiluo River is one of the ten tributaries of the Yellow River and the largest tributary below the Sanmenxia Reservoir of the Yellow River. The Yiluo River Basin belongs to the area with abundant precipitation in the Yellow River Basin, it is located in the center of the Yellow River Basin and is an important water source in the middle reaches of the Yellow River. The topography of the Yiluo River Basin is higher in the upper reaches and lower in the lower reaches, the terrain is steep, the surface types are complex, and the water resources are unevenly distributed in time and space, which have a profound impact on the production and living conditions in the basin and even in the lower reaches of the Yellow River [14]. Therefore, it is important to understand the spatial and temporal characteristics of evapotranspiration in the Yiluo River Basin to help understand the relationship between water balance and the evolution of water resources in the basin and solve the ecological and environmental problems, water shortage problems and rational development and utilization of water resources. Evapotranspiration varies greatly across watersheds or regions, and it is difficult to observe it directly. The evapotranspiration in watersheds or regions is often obtained through estimation. Common evapotranspiration estimation methods include the Bowen ratio energy balance method, instrument measurement methods, water balance methods, the Penman equation method, the Priestley–Taylor formula method, remote sensing estimations, etc. The instrumental method can accurately estimate evapotranspiration at the site scale but cannot fully consider the complex topographical physical properties and the temporal and spatial heterogeneity of the geometric structure [2]; the water balance method can obtain a relatively accurate total evapotranspiration in a basin within a period of time, but it cannot reflect the spatial and temporal dynamic changes in watersheds or regions. Remote sensing cannot directly observe evapotranspiration but indirectly estimates evapotranspiration by measuring environmental parameters related to evapotranspiration, which can obtain the temporal variation and spatial distribution of evapotranspiration, which has obvious advantages in regional evapotranspiration monitoring [15]. Remote sensing models for estimating evapotranspiration include the RS-PM model [16], Priestley–Taylor model [17], SEBAL model [18], S–W double-layer model [19], Ts-VI model, MEP model, Empirical Model [20] and so on. There have been many studies using remote sensing to estimate evapotranspiration. For example, Jiang and Islam [21] used remote sensing data to estimate surface evapotranspiration over a large heterogeneous area; Wang, Wang [22] proposed a simple method to estimate actual evapotranspiration using net radiation, vegetation index and temperature; Hu, Li [23] combined a two-source model, a leaf stomatal model and a light-use model to calculate the evapotranspiration of ecosystems; and Nema, Thakur [24] estimated the evapotranspiration of mountainous watersheds in the Lesser Himalayas of the North Akhand Himalayas, India, using the METRIC model based on the surface energy balance algorithm. The estimation of evapotranspiration by remote sensing models requires a large amount of data, such as hydrological data, meteorological data, and remote sensing images, but basin/regional scale evapotranspiration estimation is still difficult due to the lack of air resistance data (e.g., wind speed, impedance, and vegetation height). The PT-JPL model [25] requires less driving data and all of them conventional remote sensing data and meteorological observation data, which are easy to obtain and solve the problem of difficult-to-obtain data such as ground impedance data. The PT-JPL is widely used for the estimation of evapotranspiration and its components at sites, regions and even globally and has shown high simulation accuracy. Ren, Lu [26] Ren, Lu [26] Ren, Lu [26] indicated that the PT-JPL model has high stability and applicability in estimating evapotranspiration and component simulation of deep forest ecosystems in eastern China; Miralles, Jimenez [27] compared four models, PM-MOD, GLEAM, PT-JPL, and SEBS, and found that the PT-JPL model showed better applicability in most ecosystems and climate zones; Niu, Kemei [5] studied the spatial and temporal variability of evapotranspiration in terrestrial ecosystems in China based on the PT-JPL model; and Ershadi, McCabe [28] compared the evapotranspiration calculated by the PT-JPL, Penman–Monteith, and SEBS models with the data observed from flux towers and found that the PT-JPL model performed best overall.
In the Yiluo River Basin, there are relatively few studies using remote sensing models to invert the actual evapotranspiration in the basin. Wang and Qian [13], Wang, Wang [29] and Zhang and Wang [30] applied the SEBS model to estimate the actual evapotranspiration in the Yiluo River Basin and explored the spatial distribution characteristics of evapotranspiration. However, the SEBS model requires too many parameters that are difficult to obtain directly, and it has high data requirements; moreover, these studies only simulated the actual evapotranspiration for a day or typical days, failing to explore the temporal variation characteristics of evapotranspiration over continuous time periods (e.g., multiple years).
Therefore, in this paper, the actual evapotranspiration of the Yiluo River Basin from 2001 to 2020 was estimated based on the PT-JPL model, and the applicability of the PT-JPL model in the Yiluo River Basin was verified and analyzed by using meteorological, hydrological and remote sensing data. On this basis, the spatial and temporal characteristics of actual evapotranspiration in the Yiluo River Basin were analyzed, and the relationships between actual evapotranspiration and influencing factors such as precipitation, temperature, and vegetation were explored, with a view to providing scientific references for the rational development and utilization of water resources in the basin.

2. Data and Methods

2.1. Study Area

The Yiluo River flows through Shaanxi and Henan provinces, involving 21 counties and cities in the two provinces, with a total length of 974.0 km and a drop of 4480 m. The geographical location is located at 109°45′~113°06′ E and 33°33′~35°05′ N (Figure 1). The Yiluo River Basin is located in a continental monsoon climate zone with dry and windy spring, high temperature, and rainy summer, fine and cool autumn, as well as cold and dry winter. The average annual precipitation is 660 mm, of which approximately 410 mm is received during the flood season from June to September, accounting for approximately 60% of the annual precipitation [31]. The Yiluo River is composed of the Luo River and Yi River, which is a typical twin river, among which the Luo River originates in Luonan County at the southern foot of Mount Huashan in the Qinling Mountains, with a total length of 410 km; the Yi River originates in Zhangjia Village in Luanchuan County in the Xionger Mountain area of the eastern branch of the Qinling Mountains and is injected into the Luo River at Zaozhuang in Yanshi city, with a total length of 268 km [13]. The basin covers an area of 18,881 km2, with mountains accounting for 52.4%, loess hills accounting for 39.7%, and alluvial plains (valleys) accounting for 7.9%. The upper reaches of the watershed are mountainous areas with good vegetation cover, while the lower reaches are covered with loess, with relatively sparse vegetation and more serious soil erosion [31]. There are 24 meteorological stations in and around the basin, and the Heishiguan hydrological station is located at the outlet section of the basin, as shown in Figure 1.

2.2. Data Source and Preprocessing

2.2.1. Remote Sensing Data Acquisition and Preprocessing

The remote sensing data come from the MODIS product of NASA (http://search.earthdata.nasa.gov/) (accessed on 31 March 2022). The MODIS satellite was launched in 1999, and most of the MODIS data products started in 2000. The orbit number of the remote sensing satellite is h27v05, and the data format is hdf format. The surface reflectance data were obtained from the MOD09A1 product with a temporal resolution of 8 d and a spatial resolution of 500 m; NDVI and EVI data were obtained from the MOD13Q1 vegetation index product with a temporal resolution of 16 d and a spatial resolution of 250 m; LAI (leaf area index) data were obtained from the MOD15A2H product with a temporal resolution of 8 d and a spatial resolution of 500 m; and surface cover type data were obtained from the MCD12Q1 product with a temporal resolution of 1 a and a spatial resolution of 500 m.
By using the MRT (MODIS Reprojection Tool) software batch process, the image projection was converted to the WGS84 projection, the resampling method used was the nearest neighbor natural method, the resampling resolution was 250 m, and the data format was converted to geotiff format. The nearest neighbor natural method was used for any resampling required to go from coarse to high resolution to limit any loss of information [32].
The land surface albedo calculation was carried out by the method of Liang [33] and the Modis algorithm formula is as follows:
Ashort   = 0.160 a 1 + 0.291 a 2 + 0.243 a 3 + 0.116 a 4 + 0.112 a 5 + 0.081 a 7 0.0015
Monthly NDVI and LAI data were obtained by the maximum value synthesis method; monthly EVI and surface albedo data were obtained by the mean value method.

2.2.2. Meteorological Data Acquisition and Preprocessing

The month-by-month meteorological data were obtained from the China National Meteorological Science Data Sharing Service Platform (http://data.cma.cn/) (accessed on 13 January 2022), including monthly average temperature, monthly maximum temperature, monthly minimum temperature, wind speed, sunshine hours, relative humidity, barometric pressure data, and other elements. The station meteorological data were interpolated into raster data with the same resolution and coordinate system as the vegetation index product NDVI by using the kriging interpolation tool in ArcGIS spatial analysis tools. The kriging interpolation used was ordinary kriging.

2.3. Methods

2.3.1. PT-JPL Model

For the inland surface of the basin, the PT-JPL model was used to estimate the actual evapotranspiration (ETa) per pixel (raster). The PT-JPL model (Priestley–Taylor Jet Propulsion Laboratory Model) is an actual evapotranspiration estimation model developed by Fisher, Tu [25] based on the Priestley–Taylor equation, which can be divided into soil evaporation (ETs), canopy interception evaporation (ETi) and vegetation transpiration (ETc). The model is driven by remote sensing data and meteorological data and is suitable for situations where soil moisture data, surface impedance data, and wind speed data are lacking. The model equations and parameters are shown in Table 1.

2.3.2. Water Surface Evaporation Estimation

Since the PT-JPL model is mainly used for estimating land surface evaporation, it is not suitable for estimating water surface evaporation. Therefore, for water bodies in the watershed, the FAO-24 Penman formula [37], which is widely used and has high calculation accuracy, was used to calculate the water surface evaporation:
ET W = 1 λ ( Δ Δ + γ ( R n G ) + 6.43 γ Δ + γ ( 1 + 0.862 u 2 ) D )
D = e s e a
where Rn is the surface net radiation (MJ/(m2*d)); G is the soil heat flux; u2 is the wind speed at a height of 2 m (m/s); D is the saturated water pressure difference (kPa); Δ is the slope of the saturated water pressure curve (kPa/°C); γ is the surface hygrometer constant (kPa/°C), taken as 0.066; D is the water pressure difference (kPa); es is the saturated water pressure (kPa); ea is the actual water pressure (kPa); and λ is the latent heat of evaporation, taken as 2.45 MJ/kg.

2.3.3. Trend Analysis and Test Methods

In this paper, the combination of the Theil–Sen median trend analysis and the Mann–Kendall trend test (M–K) [38] was used to analyze the trend change characteristics of ETa in the Yiluo River Basin.
Sen trend analysis calculates the median slope of (n(n−1))/2 data combinations with the following formula:
S = Meadian ( X i X j j     i ) ,   1 < i < j < n
where Xi and Xj are the values at times i and j, respectively, and n is the length of the time series. When S > 0, the time series is in an upward trend, and when S < 0, the time series is in a downward trend.
The Mann–Kendall trend test was used to evaluate the significance of the trend of ETa changes from 2001 to 2020. The principle is: the original hypothesis H0 is n (x1, x2, …, xn) independent time series samples with the same distribution; the alternative hypothesis H1 is a bilateral test. The formula is as follows:
V ( s ) = n ( n 1 ) ( 2 n + 5 ) 18
sgn ( X j X i ) = { 1 , X j X i < 0   0 ,   X j X i = 0   1 ,   X j X i > 0
S = x = 1 n 1 y = x + 1 n sgn ( X j X i )
Define statistic Z:
Z = { S + 1 V ( s ) ,   S   <   0   0 ,   S = 0 S 1 V ( s )   ,   S   >   0
where S is the test statistic, Z is the standardized test statistic, and the value range is (−∞, +∞); Xi and Xj denote the values of year i and year j, respectively, n is the time series constant, and sgn is a symbolic function. If |Z|>Z1−α/2, the H0 hypothesis is rejected at a given confidence level α; namely, there is a significant trend in the time series data. When α is equal to 0.05, Z1−α/2 is equal to 1.96. In this paper, the significance of each time series trend is judged based on the 0.05 confidence level. The Z value is used to assess the trend of the statistical data; a positive Z value indicates an upward trend and a negative Z value indicates a downward trend.
Superimposing the classification results of the Theil–Sen trend analysis and Mann–Kendall trend test, the statistical results were divided into 5 types: S greater than or equal to 0.001 and Z greater than 1.96 as significantly increased; S greater than or equal to 0.001 and Z at −1.96 to 1.96 as slightly increased; S between −0.001 and 0.001 and Z at −1.96 to 1.96 as stable; S less than −0.001 and Z at −1.96 to 1.96 as slightly decreased; S less than −0.001 and Z less than −1.96 as significantly decreased.

2.3.4. Pearson Correlation Analysis Method

In this paper, the correlation between actual evapotranspiration and NDVI, precipitation, and the air temperature was explored by the Pearson correlation analysis [39]. The calculation formula is:
R x , y = i = 1 n ( x i x ¯ ) ( y i y ¯ ) i = 1 n ( x i x ¯ ) 2 i = 1 n ( y i y ¯ ) 2
where n is the number of years; R is the simple linear correlation coefficient; x i and y i are the values of the two Factors x and y in the ith year, respectively; and x ¯ and y ¯ are the average values of the two factors in the study period.

2.3.5. Water Balance Equation

The quantitative relationship between precipitation, runoff, and actual evapotranspiration was analyzed according to the principle of water balance to verify the applicability of the PT-JPL model in the Yiluo River Basin:
ETa = P R S
where P is the average precipitation of the basin surface, mm; R is the natural runoff at the outlet section of the basin, mm; and ΔS is the dynamic change in the basin subsurface storage, mm. The dynamic change in the basin subsurface storage at the annual or multiyear time scale can be neglected [40], and the difference between precipitation and runoff is the actual evapotranspiration.

3. Results

3.1. Model Results Validation

To verify the applicability of the PT-JPL model in the Yiluo River Basin, the actual evapotranspiration from 2001 to 2016 in the basin was estimated based on the water balance equation using natural runoff data and precipitation data from the Heishiguan hydrological station of the Third National Water Resources Survey. The comparison results of precipitation, runoff depth, evapotranspiration calculated by water balance (WB_ETa) and evapotranspiration calculated by the PT-JPL model (PT-JPL_ETa) for each year in the basin are shown in Figure 2. The multiyear average precipitation was 684.7 mm, the multiyear average runoff depth was 141.4 mm, and the multiyear average WB_Eta was 543.3 mm. The multiyear average PT-JPL_ETa was 523.8 mm in the same period. Compared with the multiyear WB_ETa, the result was small, with an absolute error of 19.5 mm and a relative error of 3.6%. Referring to relevant studies [41], we believe that the accuracy of the PT-JPL model meets the requirements and can be used to analyze and explore the temporal and spatial characteristics of evapotranspiration in the Yiluo River Basin.

3.2. Evapotranspiration Variation Characteristics

3.2.1. Interannual Variability

According to the actual evapotranspiration of each pixel from 2001 to 2020, the total actual evapotranspiration of the basin from 2001 to 2020 was obtained statistically (Figure 3a). The interannual fluctuation of the total evapotranspiration in the Yiluo River Basin was large; the maximum value of 656.6 mm appeared in 2003, and the minimum value of 457.2 mm appeared in 2011. The total evapotranspiration of the basin showed a decreasing trend with a multiyear average value of 521.3 mm and a decrease rate of 2.5 mm/a, which was basically consistent with the findings of Gu, Guan [42] Gu, Guan [42] Gu, Guan [42].
The spatial distribution of the multiyear average ETa value in the Yiluo River Basin from 2001 to 2020 is shown in Figure 3b. The spatial distribution of actual evapotranspiration in the Yiluo River Basin generally showed the characteristics of high in the mountainous area and low in the river valley, high in the south and low in the north; the annual evapotranspiration was mainly 550–700 mm in the earthy and rocky mountainous area in the upper part of the basin; the annual evapotranspiration was mainly 380–500 mm in the loess covered area in the lower part of the basin.
The spatial distribution of the ETa coefficient of variation (Cv) of each pixel in the Yiluo River Basin is shown in Figure 3c. Based on the Cv values, the variation intensity was divided into four classes: relatively stable (Cv ≤ 0.1), stable (0.1 < Cv ≤ 0.2), unstable (0.2 < Cv ≤ 0.3), and very unstable (Cv > 0.3) [39]. Among them, the proportion of relatively stable and stable pixels was only 0.1%, and the proportion of unstable and very unstable pixels was 99.9%. The mean value of Cv of all pixels in the basin was 0.64, and the Cv value of most of the pixels was greater than 0.2, which indicated that the interannual variation in ETa in the Yiluo River Basin had large interannual variability and strong interannual fluctuations.
The trend of actual evapotranspiration in the basin from 2001 to 2020 is shown in Figure 3d. The areas with decreasing ETa trends were mainly located in the middle and lower reaches of the basin, and the areas with increasing ETa trends were mainly located in the upper Shaanxi section of the basin. The actual evapotranspiration of most pixels showed nonsignificant changes, and the proportions of the actual evapotranspiration that showed significantly increased, slightly increased, stable, slightly decreased, and significantly decreased in the number of pixels to the total number of pixels were 2.8%, 10.4%, 7.1%, 57.4%, and 22.3%, respectively. Overall, the basin evapotranspiration showed a decreasing trend.

3.2.2. Changes during the Year

Based on the calculated actual monthly evapotranspiration for each image from 2001 to 2020, the multiyear monthly average actual evapotranspiration in the Yiluo River Basin from January to December (Figure 4a) and the actual evapotranspiration in spring (March–May), summer (June–August), autumn (September–November), and winter (December–February) for each year (Figure 4b) were calculated. In terms of distribution within a year, ETa in January and December were the two lowest months in a year, and ETa in July was the highest month in a year. In terms of seasonal variation, ETa varied significantly among the four seasons, with the highest ETa in summer, followed by spring and autumn, and lower ETa in winter. From the variation trend, evapotranspiration showed a decreasing trend in all four seasons, and the rate of decrease was the fastest in summer.

3.3. Influencing Factors of Evapotranspiration Change

The state of the substratum vegetation is an important factor influencing the actual evapotranspiration process, temperature and precipitation changes affect the regional hydrothermal distribution, and the actual evapotranspiration changes are in turn closely related to the hydrothermal variation pattern [43]. Therefore, to investigate the causes of evapotranspiration changes in the Yiluo River Basin, normalized difference vegetation index (NDVI), precipitation (P) and mean temperature (T) were selected for correlation analysis of actual evapotranspiration in the Yiluo River Basin. The correlation analysis of ETa with the influencing factors was carried out based on month-by-month data, and the monthly values were averaged over the entire basin. The scatter distributions of correlations between ETa and NDVI, P, and T by Pearson correlation analysis are shown in Figure 5a,c,e, respectively. ETa was positively correlated with NDVI, P, and T, with correlation coefficients of 0.87, 0.66, and 0.93, respectively (all passed the 0.01 significance test), indicating that temperature may be the dominant factor affecting ET variation. The spatial distribution of the correlation coefficient between ETa and NDVI, P, and T is shown in Figure 5b,d,f, and the proportion of the watershed area in the areas showing significant positive correlation reached 99%. From the spatial distribution of the correlation coefficient between ETa and NDVI, P, and T, the areas with negative correlation and low correlation coefficient were mainly distributed around towns, reservoirs, and rivers in the downstream area. In general, ETa has a positive correlation with NDVI, precipitation, and temperature in the Yiluo River Basin. The correlation coefficient between ETa and NDVI was −0.09 to 0.91, with an average value of 0.74; the correlation coefficient with precipitation was −0.26 to 0.75, with an average value of 0.63; and the correlation coefficient with air temperature was −0.002 to 0.94, with an average of 0.87. From the correlation analysis results, ETa showed the best correlation with temperature, followed by NDVI and then precipitation.
The interannual and intra-annual changes in NDVI, precipitation, and temperature are shown in Figure 6. From the intra-annual variation in evapotranspiration (Figure 6d), the monthly variation in actual evapotranspiration was consistent with the growth pattern of vegetation and the monthly variation in precipitation and temperature. From January, the temperature increased monthly, precipitation was gradually abundant, vegetation entered the budding stage in spring and the growth peak in summer, and the actual evapotranspiration increased accordingly, reaching the annual maximum in July. After August, the temperature decreased monthly, precipitation decreased, vegetation started to leaf out in autumn and entered dormancy in winter, and actual evapotranspiration decreased accordingly. From 2001 to 2020, NDVI and temperature showed an increasing trend, the growth rate of NDVI was 0.0046/a, and the growth rate of temperature was 0.024 °C/a; the precipitation showed a decreasing trend, and the decrease rate of precipitation was 6.01 mm/a. It can be seen from the previous section that the change in actual evapotranspiration showed a decreasing trend, the same as that of precipitation, and opposite to that of NDVI and temperature.

4. Discussion

The water balance equation proposed by L’vovich (1979) for estimating basin evapotranspiration is accurate, involves few parameters, and is easy to apply, the P, R in the equation can be obtained from ground-based observations, ΔSW can only be obtained with GRACE (Gravity Recovery and Climate Experiment) at present, so the use of the water balance equation for estimating evapotranspiration is usually used within the basin and on monthly or even coarser time scales. Since the water balance does not consider the spatial distribution of evapotranspiration, to further verify the accuracy of the model, the water balance results, PT-JPL model calculations, and the evapotranspiration results obtained from the MODIS evapotranspiration product MOD16A2 for the same period were compared: MODIS_ETa was 512.3 mm, which was lower than WB_ETa, with an absolute error of 31 mm and a relative error of 6%; MODIS_ETa was also lower than PT-JPL_ETa, with an absolute error of 11.5 mm and a relative error of 2%. It can be seen that the evapotranspiration results obtained by the three methods were very close, which also indicates that the PT-JPL model is applicable in the Yiluo River Basin.
The study of Gu, Guan [42] showed a general decreasing trend in the middle and lower reaches of the Yellow River Basin, which is consistent with the findings of this paper; however, the study of Gu, Xue [44] showed that the evapotranspiration in the upper, middle and lower reaches of the Yellow River Basin were in an increasing state. The differences in the length of time series and data sources make the actual spatial and temporal variability of evapotranspiration different. Extending the time series is more beneficial to grasp the actual spatial and temporal variation of evapotranspiration in the watershed. The PT-JPL model does not involve the calculation of evapotranspiration from artificial objects near rivers, but there are many artificial objects in river networks and systems, and this part of evapotranspiration should be taken into account in future studies. In addition, we did not take into account the effect of processes such as sublimation on the measurement of evapotranspiration when exploring the intra-annual variation of evapotranspiration, which is an area for improvement in future studies.
Actual regional evapotranspiration is influenced by a combination of factors, such as solar radiation, temperature, humidity, wind speed, subsurface changes, and precipitation. Climate elements change the water vapor transport environment/influence energy supply and determine the maximum amount of actual evapotranspiration possible, precipitation influences water supply conditions and water supply capacity, and vegetation, as a carrier of interception and transpiration processes, further influences the magnitude of actual evapotranspiration [45].
From the results of the correlation analysis, the actual Eta showed a good correlation with NDVI, precipitation, and temperature. A good correlation between NDVI and evapotranspiration was also found in the study of Gu, Xue [44]. In this paper, the best correlation was with temperature, which indicated that the ETa in the Yiluo River Basin might be most influenced by air temperature; however, the change trend of ETa and temperature was opposite and the same as that of precipitation, which indicated that the main factor that might influence ETa was precipitation. In summary, the combination of all influencing factors caused changes in evapotranspiration. However, the actual evapotranspiration is influenced by vegetation, climate, soil, topography, human activities, etc. The mechanisms and drivers of evapotranspiration changes need to be studied in more depth in order to better grasp the evolution of evapotranspiration.

5. Conclusions

Based on the PT-JPL model, the actual evapotranspiration in the Yiluo River Basin was estimated, and the temporal and spatial variation characteristics and influencing factors of evapotranspiration in the basin from 2001 to 2020 were analyzed by combining mathematical statistics methods. The main conclusions are as follows:
(1)
The actual evapotranspiration of the basin was tested against the actual evapotranspiration estimated by the PT-JPL model through the water balance equation, and the results of the PT-JPL model were generally small, but the accuracy in the Yiluo River Basin basically met the requirements. The PT-JPL model has good applicability, and the characteristics of evapotranspiration changes in the Yiluo River Basin can be analyzed based on this.
(2)
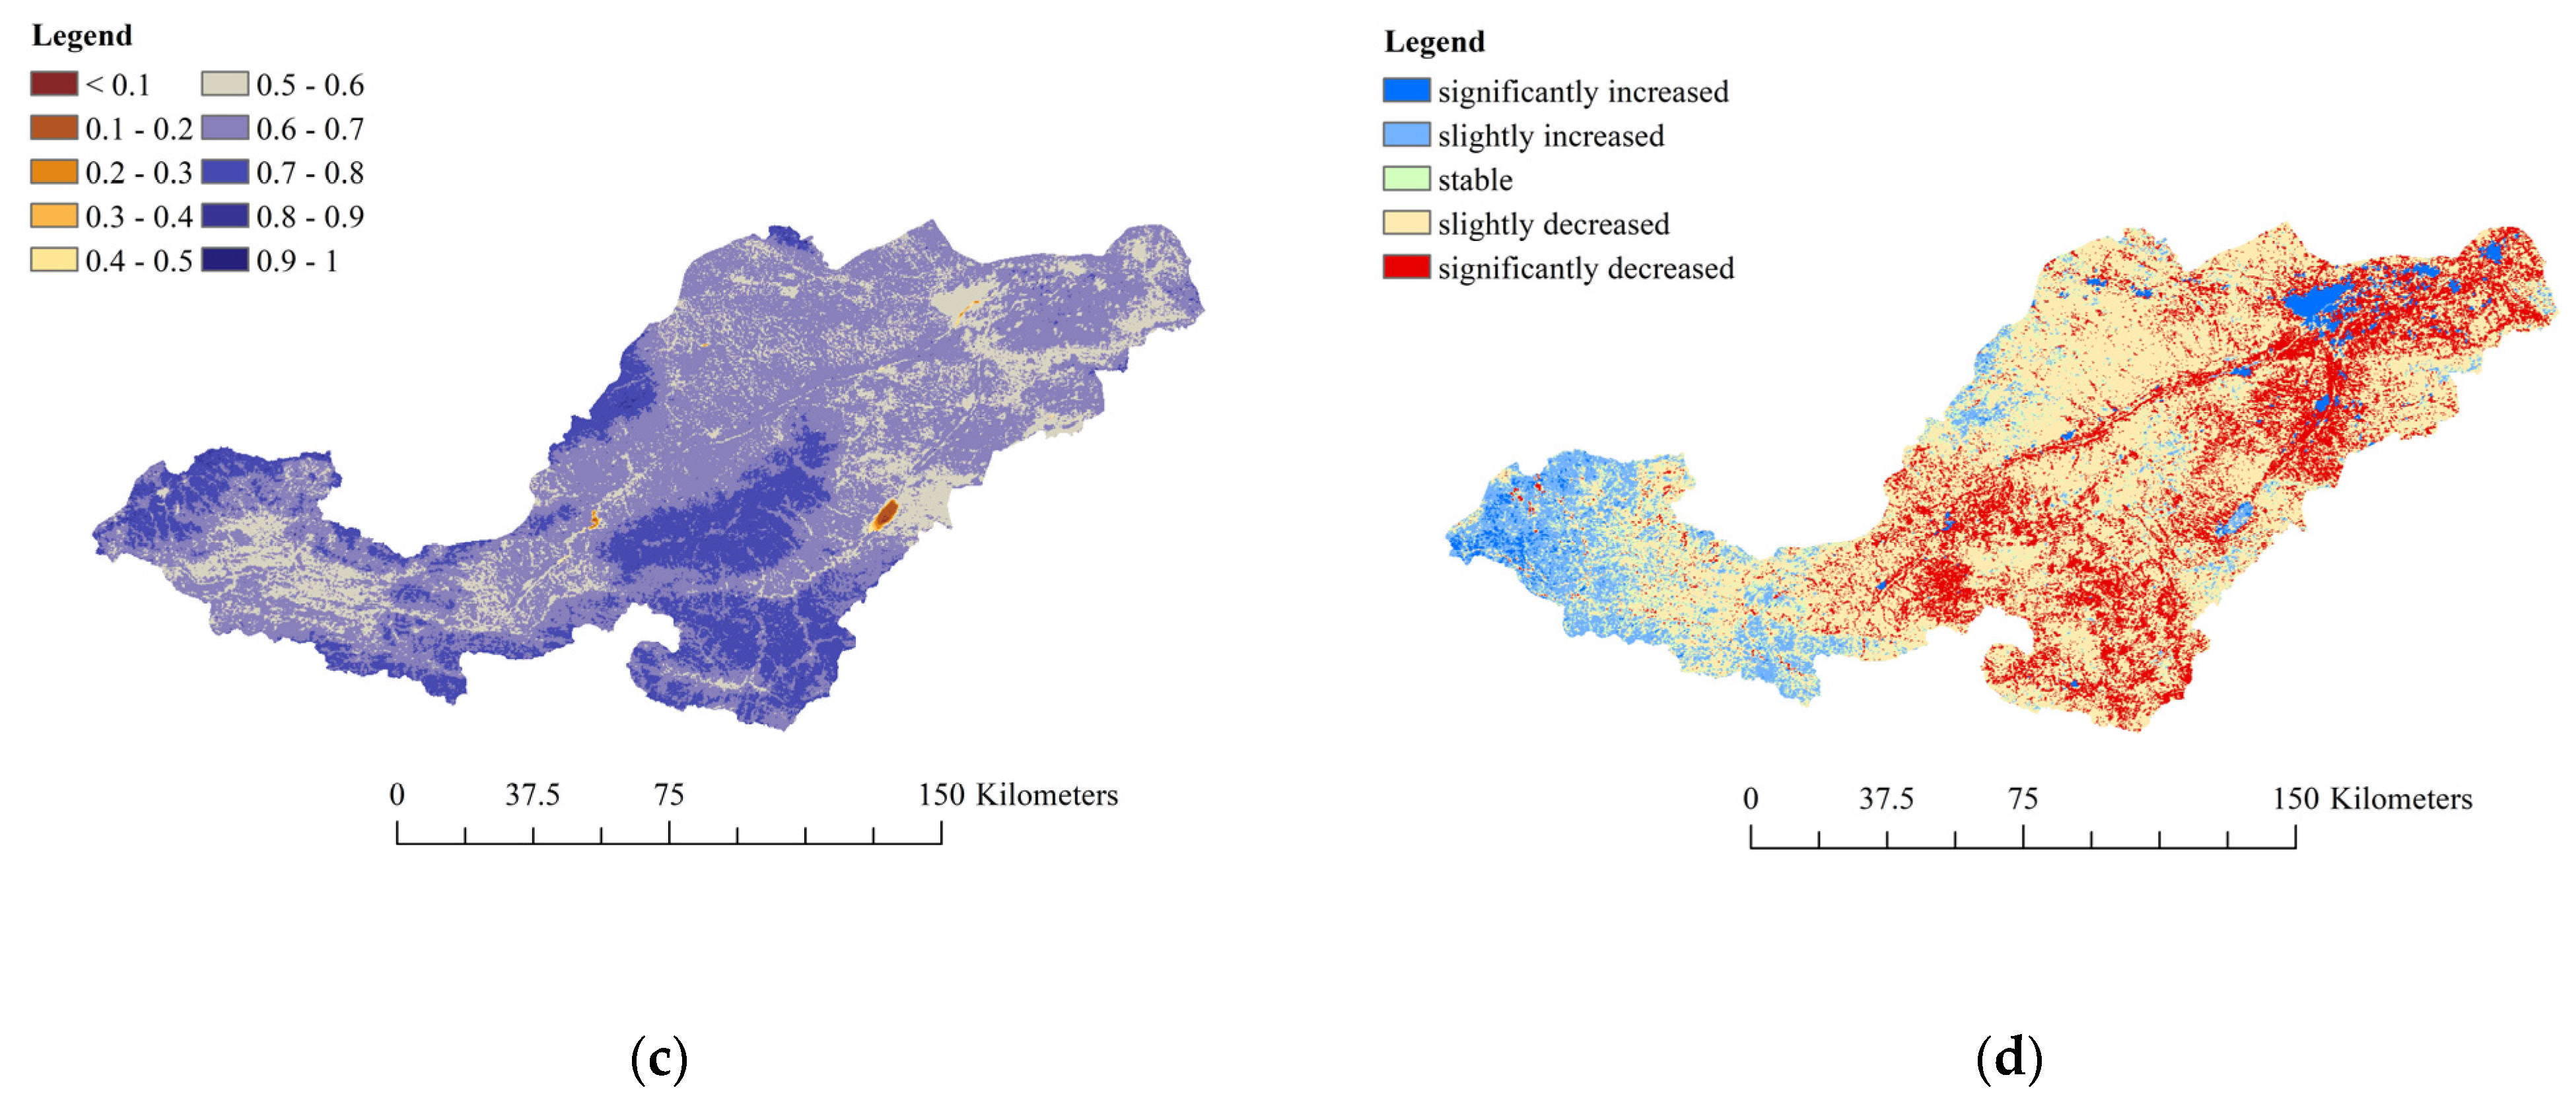
From the interannual variation of actual evapotranspiration, the total actual evapotranspiration in the Yiluo River Basin showed a decreasing trend, with a decreasing rate of 2.5 mm/a; the Cv values of most of the pixels were high, which indicated a large degree of interannual ETa variability in the basin; the ETa distribution in the basin generally showed the characteristics of high in the south and low in the north, high in the upper mountainous area and low in the lower river valley; and from the results of the Sen slope and the M–K test, the area where ETa showed a decreasing trend accounted for the total area of the basin approximately 80% of the total, and the area with an increasing trend only accounted for approximately 13%.
(3)
From the intra-annual variation of actual evapotranspiration, the lowest multiyear average ETa was found in January and December, and the highest in July; ETa in all seasons showed a decreasing trend; and the actual evapotranspiration in all seasons differed significantly, in descending order: summer (240 mm) > spring (120 mm) > autumn (119 mm) > winter (45 mm).
(4)
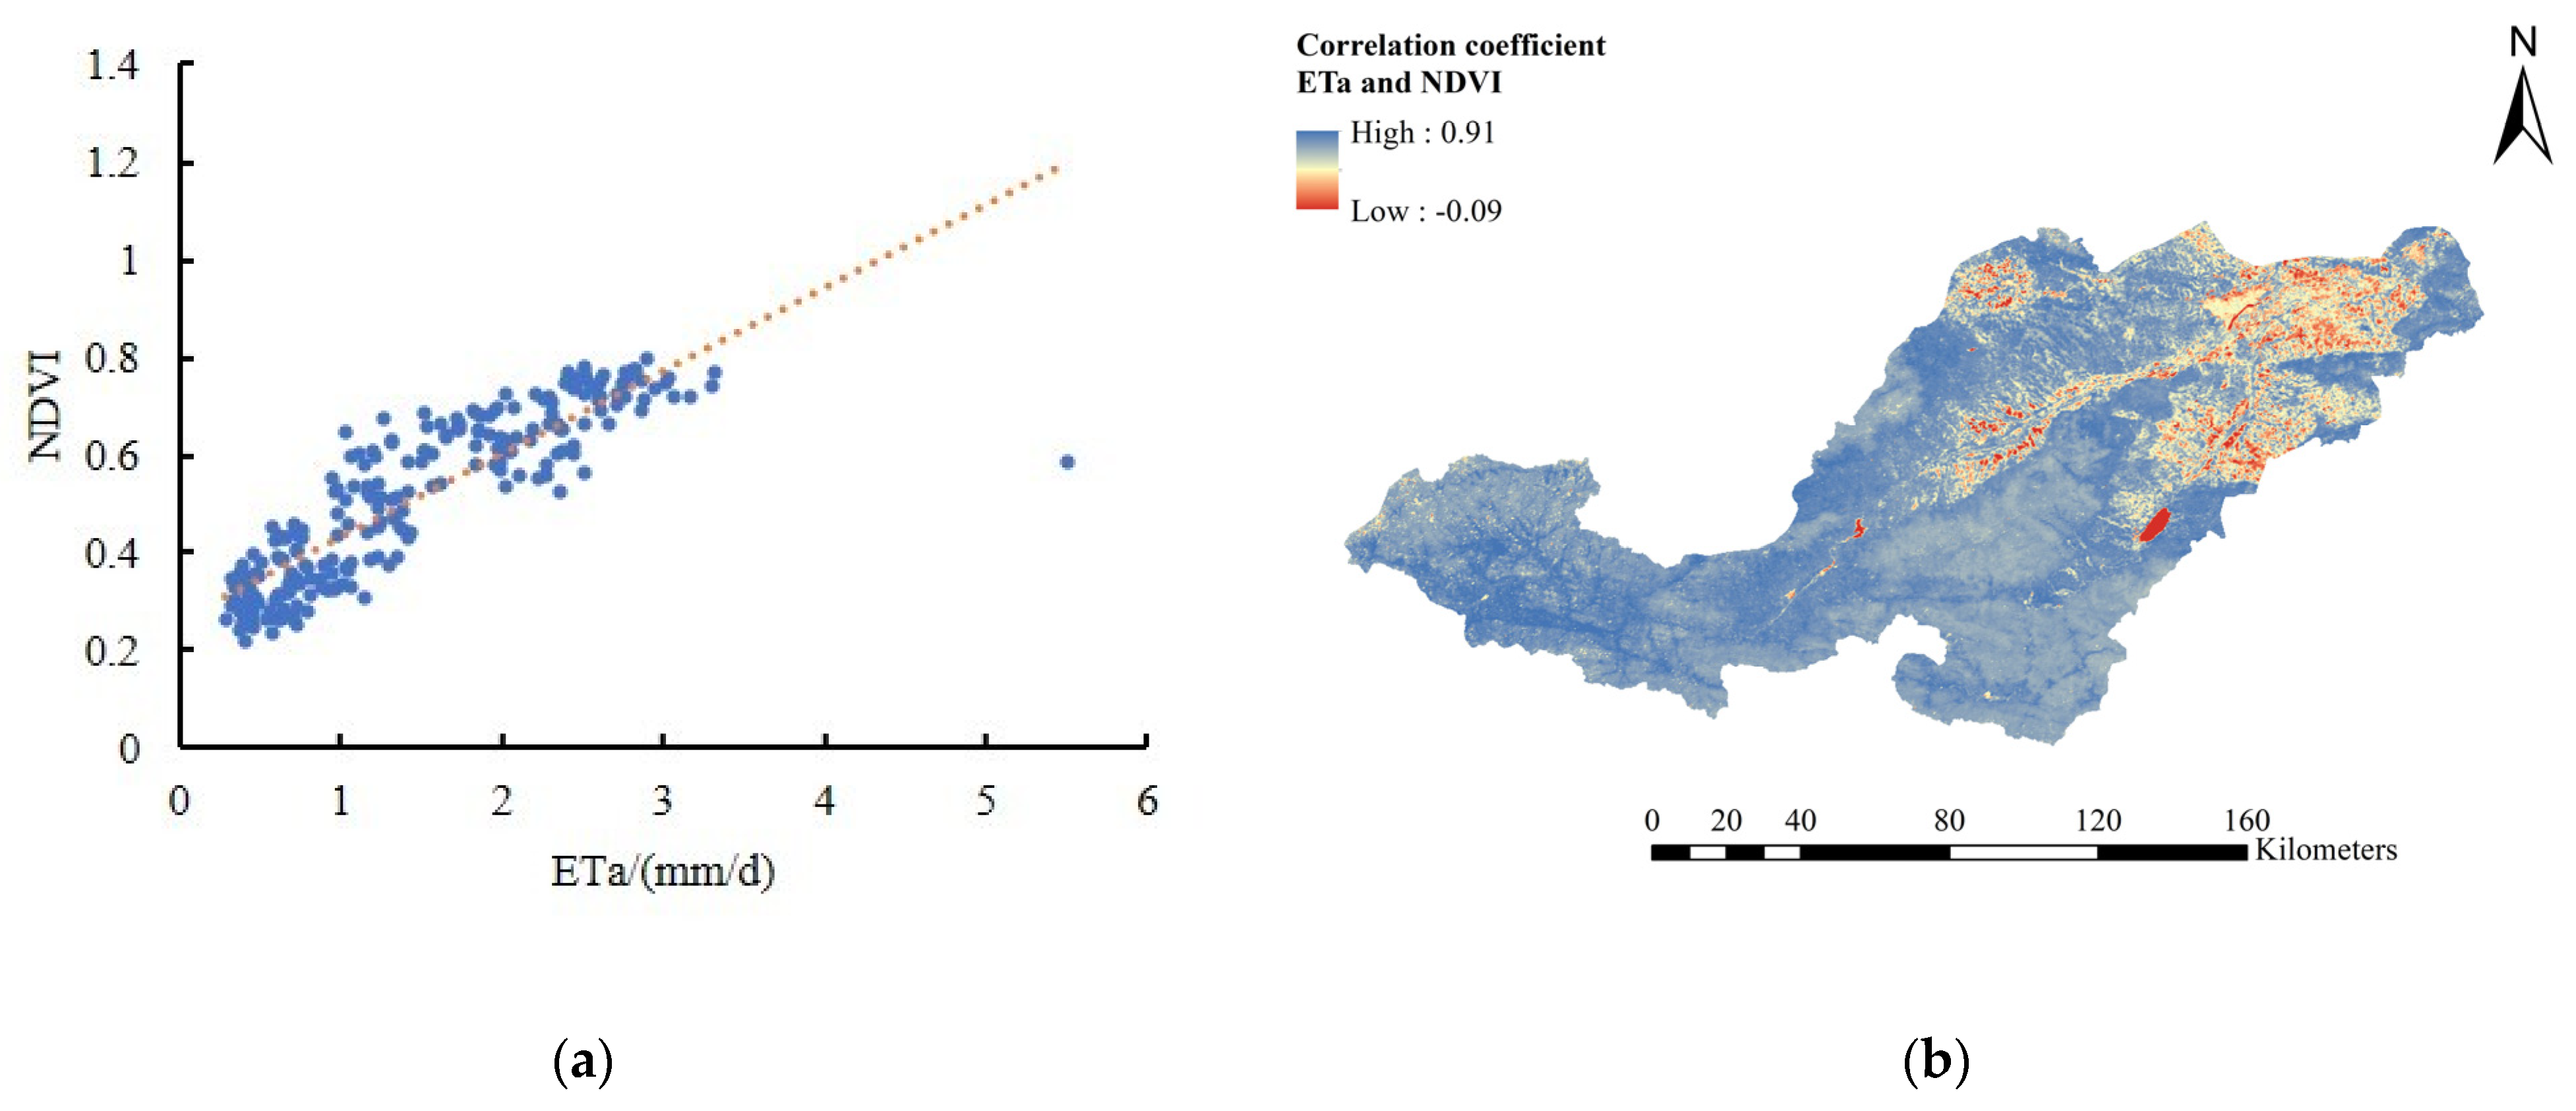
The monthly trends of actual evapotranspiration were consistent with the vegetation growth pattern and the intra-annual variation process of temperature and precipitation. Monthly ETa correlated well with monthly temperature, monthly NDVI, and monthly precipitation, with ETa having the strongest correlation with temperature. This was contrary to the results of the interannual variation in ETa, NDVI, P, and T (ETa and P both showed a decreasing trend, and NDVI and T both showed an increasing trend).

Author Contributions

Conceptualization, M.L.; methodology, M.L.; software, Y.Y.; validation, M.L., Y.Y. and X.G.; data curation, C.X., L.Y., Q.X. and M.L.; writing—original draft preparation, Y.Y.; writing—review and editing, M.L., Y.Y., X.G. and C.X.; visualization, Y.Y. All authors have read and agreed to the published version of the manuscript.

Funding

This research was funded by the National Key R&D Program of China (2021YFC3200204) and the National Natural Science Foundation of China (NO. 52079125).

Institutional Review Board Statement

Not applicable.

Informed Consent Statement

Not applicable.

Data Availability Statement

Restrictions apply to the availability of these data. The remote sensing data was obtained from the MODIS product of NASA and are available at http://search.earthdata.nasa.gov/ with the permission of the MODIS product of NASA. The meteorological data were obtained from the China National Meteorological Science Data Sharing Service Platform and available at http://data.cma.cn/ with the permission of the China National Meteorological Science Data Sharing Service Platform.

Conflicts of Interest

The authors declare no conflict of interest.

References

  1. Luo, Y.; Yin, D.; Mu, X.; Gao, P.; Zhao, G. Analysis of temporal and spatial characteristics of actual evapotranspiration and its influence factors in Yanhe River Basin. Sci. Soil Water Conserv. 2021, 19, 51–59. [Google Scholar]
  2. Li, X.; Yu, D. Progress on Evapotranspiration Estimation Methods and Driving Forces in Arid and Semiarid Regions. Arid. Zone Res. 2020, 37, 26–36. [Google Scholar]
  3. Jiang, Z.Y.; Yang, Z.G.; Zhang, S.Y.; Liao, C.M.; Hu, Z.M.; Cao, R.C.; Wu, H.W. Revealing the spatio-temporal variability of evapotranspiration and its components based on an improved Shuttleworth-Wallace model in the Yellow River Basin. J. Environ. Manag. 2020, 262, 110310. [Google Scholar] [CrossRef]
  4. Valjarevic, A.; Filipovic, D.; Valjarevic, D.; Milanovic, M.; Milosevic, S.; Zivic, N.; Lukic, T. GISand remote sensing techniques for the estimation of dew volume in the Republic of Serbia. Meteorol. Appl. 2020, 27, 14. [Google Scholar] [CrossRef]
  5. Niu, Z.; Kemei, H.; He, H.; Ren, X.; Zhang, L.; Ge, R.; Li, P.; Zheng, H.; Zhu, X.; Zeng, N. The spatial-temporal patterns of evapotranspiration and its influencing factors in Chinese terrestrial ecosystem from 2000 to 2015. Acta Ecol. Sin. 2019, 39, 4697–4709. [Google Scholar]
  6. Chen, M.S.; Parton, W.J.; Hartman, M.D.; Del Grosso, S.; Smith, W.K.; Knapp, A.K.; Lutz, S.; Derner, J.; Tucker, C.J.; Ojima, D.S.; et al. Assessing precipitation, evapotranspiration, and NDVI as controls of US Great Plains plant production. Ecosphere 2019, 10, 17. [Google Scholar] [CrossRef]
  7. Huete, A.; Didan, K.; Miura, T.; Rodriguez, E.P.; Gao, X.; Ferreira, L.G. Overview of the radiometric and biophysical performance of the MODIS vegetation indices. Remote Sens. Environ. 2002, 83, 195–213. [Google Scholar] [CrossRef]
  8. Srivastava, S.K.; Jayaraman, V.; Rao, P.P.N.; Manikiam, B.; Chandrasekhar, M.G. Interlinkages of NOAA/AVHRR derived integrated NDVI to seasonal precipitation and transpiration in dryland tropics. Int. J. Remote Sens. 1997, 18, 2931–2952. [Google Scholar] [CrossRef]
  9. Zhou, M.C.; Ishidaira, H.; Hapuarachchi, H.P.; Magome, J.; Kiem, A.S.; Takeuchi, K. Estimating potential evapotranspiration using Shuttleworth-Wallace model and NOAA-AVHRR NDVI data to feed a distributed hydrological model over the Mekong River basin. J. Hydrol. 2006, 327, 151–173. [Google Scholar] [CrossRef]
  10. Maselli, F.; Papale, D.; Chiesi, M.; Matteucci, G.; Angeli, L.; Raschi, A.; Seufert, G. Operational monitoring of daily evapotranspiration by the combination of MODIS NDVI and ground meteorological data: Application and evaluation in Central Italy. Remote Sens. Environ. 2014, 152, 279–290. [Google Scholar] [CrossRef]
  11. Cihlar, J.; Stlaurent, L.; Dyer, J.A. Relation between the Normalized Difference Vegetation Index and Ecological Variables. Remote Sens. Environ. 1991, 35, 279–298. [Google Scholar] [CrossRef]
  12. Kerr, Y.H.; Imbernon, J.; Dedieu, G.; Hautecoeur, O.; Lagouarde, J.P.; Seguin, B. Noaa Avhrr and its uses for Rainfall and Evapotranspiration Monitoring. Int. J. Remote Sens. 1989, 10, 847–854. [Google Scholar] [CrossRef]
  13. Wang, W.; Qian, L. Spatial Distribution and Seasonal Variation of Evapotranspiration in Yiluo River Basin Based on MODIS Data. Resour. Sci. 2012, 34, 1582–1590. [Google Scholar]
  14. Zhao, L.; Xu, S.; Zhao, X.; Li, X.; Sun, J. Analysis on runoff variation characteristics and trend in Yiluo River Basin in Henan Province. China Flood Drought Manag. 2020, 30, 70–73, 97. [Google Scholar]
  15. Zhang, R.; Du, J.; Sun, R. Review of Estimation and Validation of Regional Evapotranspiration Based on Remote Sensing. Adv. Earth Sci. 2012, 27, 1295–1307. [Google Scholar]
  16. Cleugh, H.A.; Leuning, R.; Mu, Q.; Running, S.W. Regional evaporation estimates from flux tower and MODIS satellite data. Remote Sens. Environ. 2007, 106, 285–304. [Google Scholar] [CrossRef]
  17. Priestley, C.H.B.; Taylor, R.J. On the Assessment of Surface Heat Flux and Evaporation Using Large Scale Parameters. Mon. Weather Rev. 1972, 100, 81–92. [Google Scholar] [CrossRef]
  18. Bastiaanssen, W.G.M. SEBAL-based sensible and latent heat fluxes in the irrigated Gediz Basin, Turkey. J. Hydrol. 2000, 229, 87–100. [Google Scholar] [CrossRef]
  19. Yuan, F. Hydrological Processes Modeling Considering the Effect of Vegetation. Ph.D. Thesis, Hohai University, Nanjing, China, 2006. [Google Scholar]
  20. Zhang, K.; Kimball, J.S.; Running, S.W. A review of remote sensing based actual evapotranspiration estimation. Wiley Interdiscip. Rev.-Water 2016, 3, 834–853. [Google Scholar] [CrossRef]
  21. Jiang, L.; Islam, S. A methodology for estimation of surface evapotranspiration over large areas using remote sensing observations. Geophys. Res. Lett. 1999, 26, 2773–2776. [Google Scholar] [CrossRef]
  22. Wang, K.C.; Wang, P.; Li, Z.Q.; Cribb, M.; Sparrow, M. A simple method to estimate actual evapotranspiration from a combination of net radiation, vegetation index, and temperature. J. Geophys. Res.-Atmos. 2007, 112, 14. [Google Scholar] [CrossRef]
  23. Hu, Z.M.; Li, S.G.; Yu, G.R.; Sun, X.M.; Zhang, L.M.; Han, S.J.; Li, Y.N. Modeling evapotranspiration by combing a two-source model, a leaf stomatal model, and a light-use efficiency model. J. Hydrol. 2013, 501, 186–192. [Google Scholar] [CrossRef]
  24. Nema, M.K.; Thakur, H.P.; Upreti, H.; Jain, S.K.; Mishra, P.K.; Thayyen, R.J.; Singh, P.K.; Jain, S.K. Estimation of evapotranspiration in lesser Himalayas using remote sensing based surface energy balance algorithm. Geocarto Int. 2022, 37, 841–859. [Google Scholar] [CrossRef]
  25. Fisher, J.B.; Tu, K.P.; Baldocchi, D.D. Global estimates of the land-atmosphere water flux based on monthly AVHRR and ISLSCP-II data, validated at 16 FLUXNET sites. Remote Sens. Environ. 2008, 112, 901–919. [Google Scholar] [CrossRef]
  26. Ren, X.; Lu, Q.; He, H.; Zhang, L.; Niu, Z. Spatio-temporal variations of the ratio of transpiration to evapotranspiration in forest ecosystems along the North-South Transect of Eastern China. Acta Geogr. Sin. 2019, 74, 63–75. [Google Scholar]
  27. Miralles, D.G.; Jimenez, C.; Jung, M.; Michel, D.; Ershadi, A.; McCabe, M.F.; Hirschi, M.; Martens, B.; Dolman, A.J.; Fisher, J.B.; et al. The WACMOS-ET project—Part 2: Evaluation of global terrestrial evaporation data sets. Hydrol. Earth Syst. Sci. 2016, 20, 823–842. [Google Scholar] [CrossRef]
  28. Ershadi, A.; McCabe, M.F.; Evans, J.P.; Chaney, N.W.; Wood, E.F. Multi-site evaluation of terrestrial evaporation models using FLUXNET data. Agric. For. Meteorol. 2014, 187, 46–61. [Google Scholar] [CrossRef]
  29. Wang, W.; Wang, J.; Du, J. Land surface evapotranspiration estimation of Yiluo River Basin based on fusion of ETM+ and MODIS data. Geogr. Res. 2013, 32, 817–827. [Google Scholar]
  30. Zhang, Y.; Wang, W. Spatial Scaling Transformation of Evapotranspiration based on Remote Sensing in Yiluo River Basin. Acta Geod. Cartogr. Sin. 2013, 42, 906–912. [Google Scholar]
  31. He, R.; Wang, G.; Zhang, J. Impacts of Environmental Change on Runoff in the Yiluohe River Basin of the Middle Yellow River. Res. Soil Water Conserv. 2007, 14, 297–298, 301. [Google Scholar]
  32. Weerasinghe, I.; Bastiaanssen, W.; Mul, M.; Jia, L.; van Griensven, A. Can we trust remote sensing evapotranspiration products over Africa? Hydrol. Earth Syst. Sci. 2020, 24, 1565–1586. [Google Scholar] [CrossRef]
  33. Liang, S.L. Narrowband to broadband conversions of land surface albedo I Algorithms. Remote Sens. Environ. 2001, 76, 213–238. [Google Scholar] [CrossRef]
  34. Chen, H.L.; Zhu, G.F.; Zhang, K.; Bi, J.; Jia, X.P.; Ding, B.Y.; Zhang, Y.; Shang, S.S.; Zhao, N.; Qin, W.H. Evaluation of Evapotranspiration Models Using Different LAI and Meteorological Forcing Data from 1982 to 2017. Remote Sens. 2020, 12, 2473. [Google Scholar] [CrossRef]
  35. Zhang, B.; Shao, R.; Su, T.; Long, B.; Zhao, X.; Wei, J.; Wu, P. Construction of A Regional-Scale Dual-Source Evapotranspiration Model Considering Dynamic Changes in Vegetation. Patent CN110059362A, 26 July 2019. [Google Scholar]
  36. Wei, H.; He, H.; Liu, M.; Zhang, L.; Yu, G.; Min, C.; Wang, H.; Liu, Y. Modeling Evapotranspiration and Its Components in Qianyanzhou Plantation Based on Remote Sensing Data. J. Nat. Resour. 2012, 27, 778–789. [Google Scholar]
  37. Doorenboos, J.; Pruitt, W.O. Guidelines for Predicting Crop Water Requirements; Irrigation and Drainage Paper 24; Food and Agriculture Organization of the United Nations: Rome, Italy, 1977. [Google Scholar]
  38. Xiao, Y.; Zhou, X.; Luo, X.; Li, H.; Liang, R.; Yang, D. Spatiotemporal Variation Characteristics of Potential Evapotranspiration and Identification of Leading Factors in Central Guizhou in Recent 60Years. Res. Soil Water Conserv. 2021, 28, 190–198. [Google Scholar]
  39. Liang, H.; Wang, D.; Zheng, J. Temporal and Spatial Characteristics of Surface Evapotranspiration in the Ili River Basin. J. Irrig. Drain. 2020, 39, 100–110. [Google Scholar]
  40. Yang, X.; Wang, L.; Wang, K. Spatio-temporal distribution of terrestrial evapotranspiration in the Huaihe River basin based on MOD16 products. J. Glaciol. Geocryol. 2015, 37, 1343–1352. [Google Scholar]
  41. Deng, X.; Yao, J.; Liu, Z.; Liu, Y. Spatiotemporal Dynamic Change Characteristics of Evapotranspiration in Tianshan Mountains from 2000 to 2014. Res. Soil Water Conserv. 2017, 24, 266–273. [Google Scholar]
  42. Gu, T.; Guan, X.; Gao, Z.; Huang, X.; Guo, S. Correlation analysis of evapotranspiration with air temperature, precipitation, and wind speed over the Yellow River Basin. J. Meteorol. Environ. 2022, 38, 48–56. [Google Scholar]
  43. Ma, J.; Chen, Y.; Hao, X.; Li, D. Temporal and Spatial Changes of Surface Evapotranspiration and Its Influencing Factors in Henan Province from 2001 to 2019. Res. Soil Water Conserv. 2021, 28, 134–141+151. [Google Scholar]
  44. Gu, J.; Xue, H.; Dong, G.; Zhou, L.; Li, J.; Dang, S.; Li, S. Effects of NDVI/land-use on spatiotemporal changes of evapotranspiration in the Yellow River Basin. Arid. Land Geogr. 2021, 44, 158–167. [Google Scholar]
  45. Zhan, Y.; Zhang, W.; Yan, Y.; Wang, C.; Rong, Y.; Zhu, J.; Lu, H.; Zheng, T. Analysis of actual evapotranspiration evolution and influencing factors in the Yangtze River Basin. Acta Ecol. Sin. 2021, 41, 6924–6935. [Google Scholar]
Figure 1. Location of the Yiluo River Basin.
Applsci 12 09784 g001
Figure 2. Comparison of precipitation, runoff depth, and evapotranspiration calculated by water balance and evapotranspiration calculated by the PT-JPL model from 2001 to 2016.
Applsci 12 09784 g002
Figure 3. Interannual variation characteristics of actual evapotranspiration: (a) interannual variation of actual evapotranspiration (ETa); (b) spatial distribution of ETa multiyear mean; (c) the Cv spatial distribution of ETa; (d) spatial distribution of ETa trend change.
Applsci 12 09784 g003aApplsci 12 09784 g003b
Figure 4. ETa change within a year: (a) monthly change; (b) seasonal change.
Applsci 12 09784 g004
Figure 5. Correlation between ET and NDVI, precipitation and temperature: (a) scatter distribution of correlation between ET and NDVI; (b) spatial distribution of correlation coefficient between ET and NDVI; (c) scatter distribution of correlation between ET and p (d) spatial distribution of correlation coefficient between ET and p; (e) scatter distribution of correlation between ET and T; (f) spatial distribution of correlation coefficient between ET and T.
Applsci 12 09784 g005aApplsci 12 09784 g005b
Figure 6. Interannual and intra-annual changes in NDVI, precipitation, and temperature: (a) NDVI interannual change; (b) precipitation interannual change; (c) temperature interannual change; (d) NDVI, precipitation, and temperature monthly change.
Applsci 12 09784 g006
Table 1. Model equations and parameters.
ParameterDescriptionEquationUnit/
Value Range
References
ETaActual evapotranspiration ET a = ( E v + E s + E i ) / λ mm[34]
ETcVegetation transpiration E v = ( 1 f wet ) f g f 1 f m α Δ Δ + γ R nc W/m2[25]
ETsSoil evaporation E s = ( f wet + f sm ( 1 f wet ) ) α Δ Δ + γ ( R ns G ) W/m2[25]
ETiCanopy interception evaporation E i = f wet α Δ Δ + γ R nc W/m2[25]
RnsNet radiation reaching the soil surface R ns = exp ( k Rn LAI ) W/m2[35]
RncNet radiation intercepted by the canopy R nc = R n R ns W/m2[35]
GSoil heat flux G = R n [ Γ c + ( 1 F c ) ( Γ s Γ c ) ] W/m2[35]
FwetRelative surface humidity f wet = RH 4 0~1[25]
FgProportion of green canopy f g = f ARAR f IPAR 0~1[25]
FtTemperature limiting factor f 1 = exp ( ( T max T opt T opt 2 ) 2 ) 0~1[25]
FmWater limiting factor f m = δ + f APAR δ + f APAR max ( δ =1)0~1[36]
FsmSoil moisture limiting factor f sm = RH D / β 0~1[25]
FAPARCanopy absorption PAR coefficient f APAR = m 1 EVI + b 1 0~1[36]
FIPARCanopy intercept PAR coefficient f IPAR = m 2 NDVI + b 2 0~0.95[36]
FcVegetation coverage NDVI NDVImin NDVImax NDVImin 0~1[35]
Note: λ is the latent heat of evaporation, taken as 2.45 MJ/kg; α is the Priestley–Taylor model coefficient, taken as 1.26; γ is the psychrometric constant, kPa/°C, taken as 0.066; Δ is temperature-saturated water vapor pressure slope, kPa/°C; parameters m1 = 1.2, b1 = 0; m2 = 1.0, b2 = −0.05 [36]; EVI is enhanced vegetation index; NDVI is normalized vegetation index; β is the sensitivity of fsm to D; KRn is the extinction coefficient, valued at 0.6, RH is the relative humidity, %; Topt is the optimum growth temperature of vegetation, °C, which is the average temperature of the basin in the multiyear growing season; Tmax is the maximum temperature, °C; D is the saturated water vapor pressure difference, kPa; parameter β value: shrub β = 0.2; farmland: β = 0.8; broad-leaved forest: β = 0.5; coniferous forest: β = 1; tropical rainforest: β = 0.1; typical grassland: β = 0.4; mixed forest: β = 0.2; meadow: β = 0.2; ice: β = 0.2; dryland farmland: β = 0.6; wetland: β = 0.8; town: β = 1 [35].
Publisher’s Note: MDPI stays neutral with regard to jurisdictional claims in published maps and institutional affiliations.

