
Directionally Solidified Cobalt-Doped MgO-MgAl2O4 Eutectic Composites for Selective Emitters
by
 , and
, and
Rosa I. Merino
1, 
Patricia B. Oliete
1,*,
Bibi Malmal Moshtaghioun
1,2,
Daniel Sola
3,4 and
José I. Peña
1 1
Instituto de Nanociencia y Materiales de Aragón, Universidad de Zaragoza-CSIC, 50018 Zaragoza, Spain
2
Departamento de Física de Materia Condensada, Universidad de Sevilla, Apartado 1065, 41080 Sevilla, Spain
3
Laboratorio de Óptica, Centro de Investigación en Óptica y Nanofísica, Campus Espinardo, Universidad de Murcia, 30100 Murcia, Spain
4
Aragonese Foundation for Research and Development (ARAID), Government of Aragon, 50018 Zaragoza, Spain
*
Author to whom correspondence should be addressed.
Appl. Sci. 2022, 12(20), 10254; https://doi.org/10.3390/app122010254
Submission received: 8 September 2022
/
Revised: 6 October 2022
/
Accepted: 10 October 2022
/
Published: 12 October 2022
(This article belongs to the Special Issue Advanced Characterization of Functional Materials)
Abstract
:Featured Application
Selective emitters for thermophotovoltaic devices.
Abstract
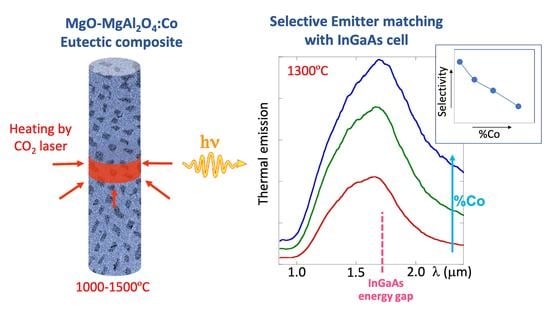
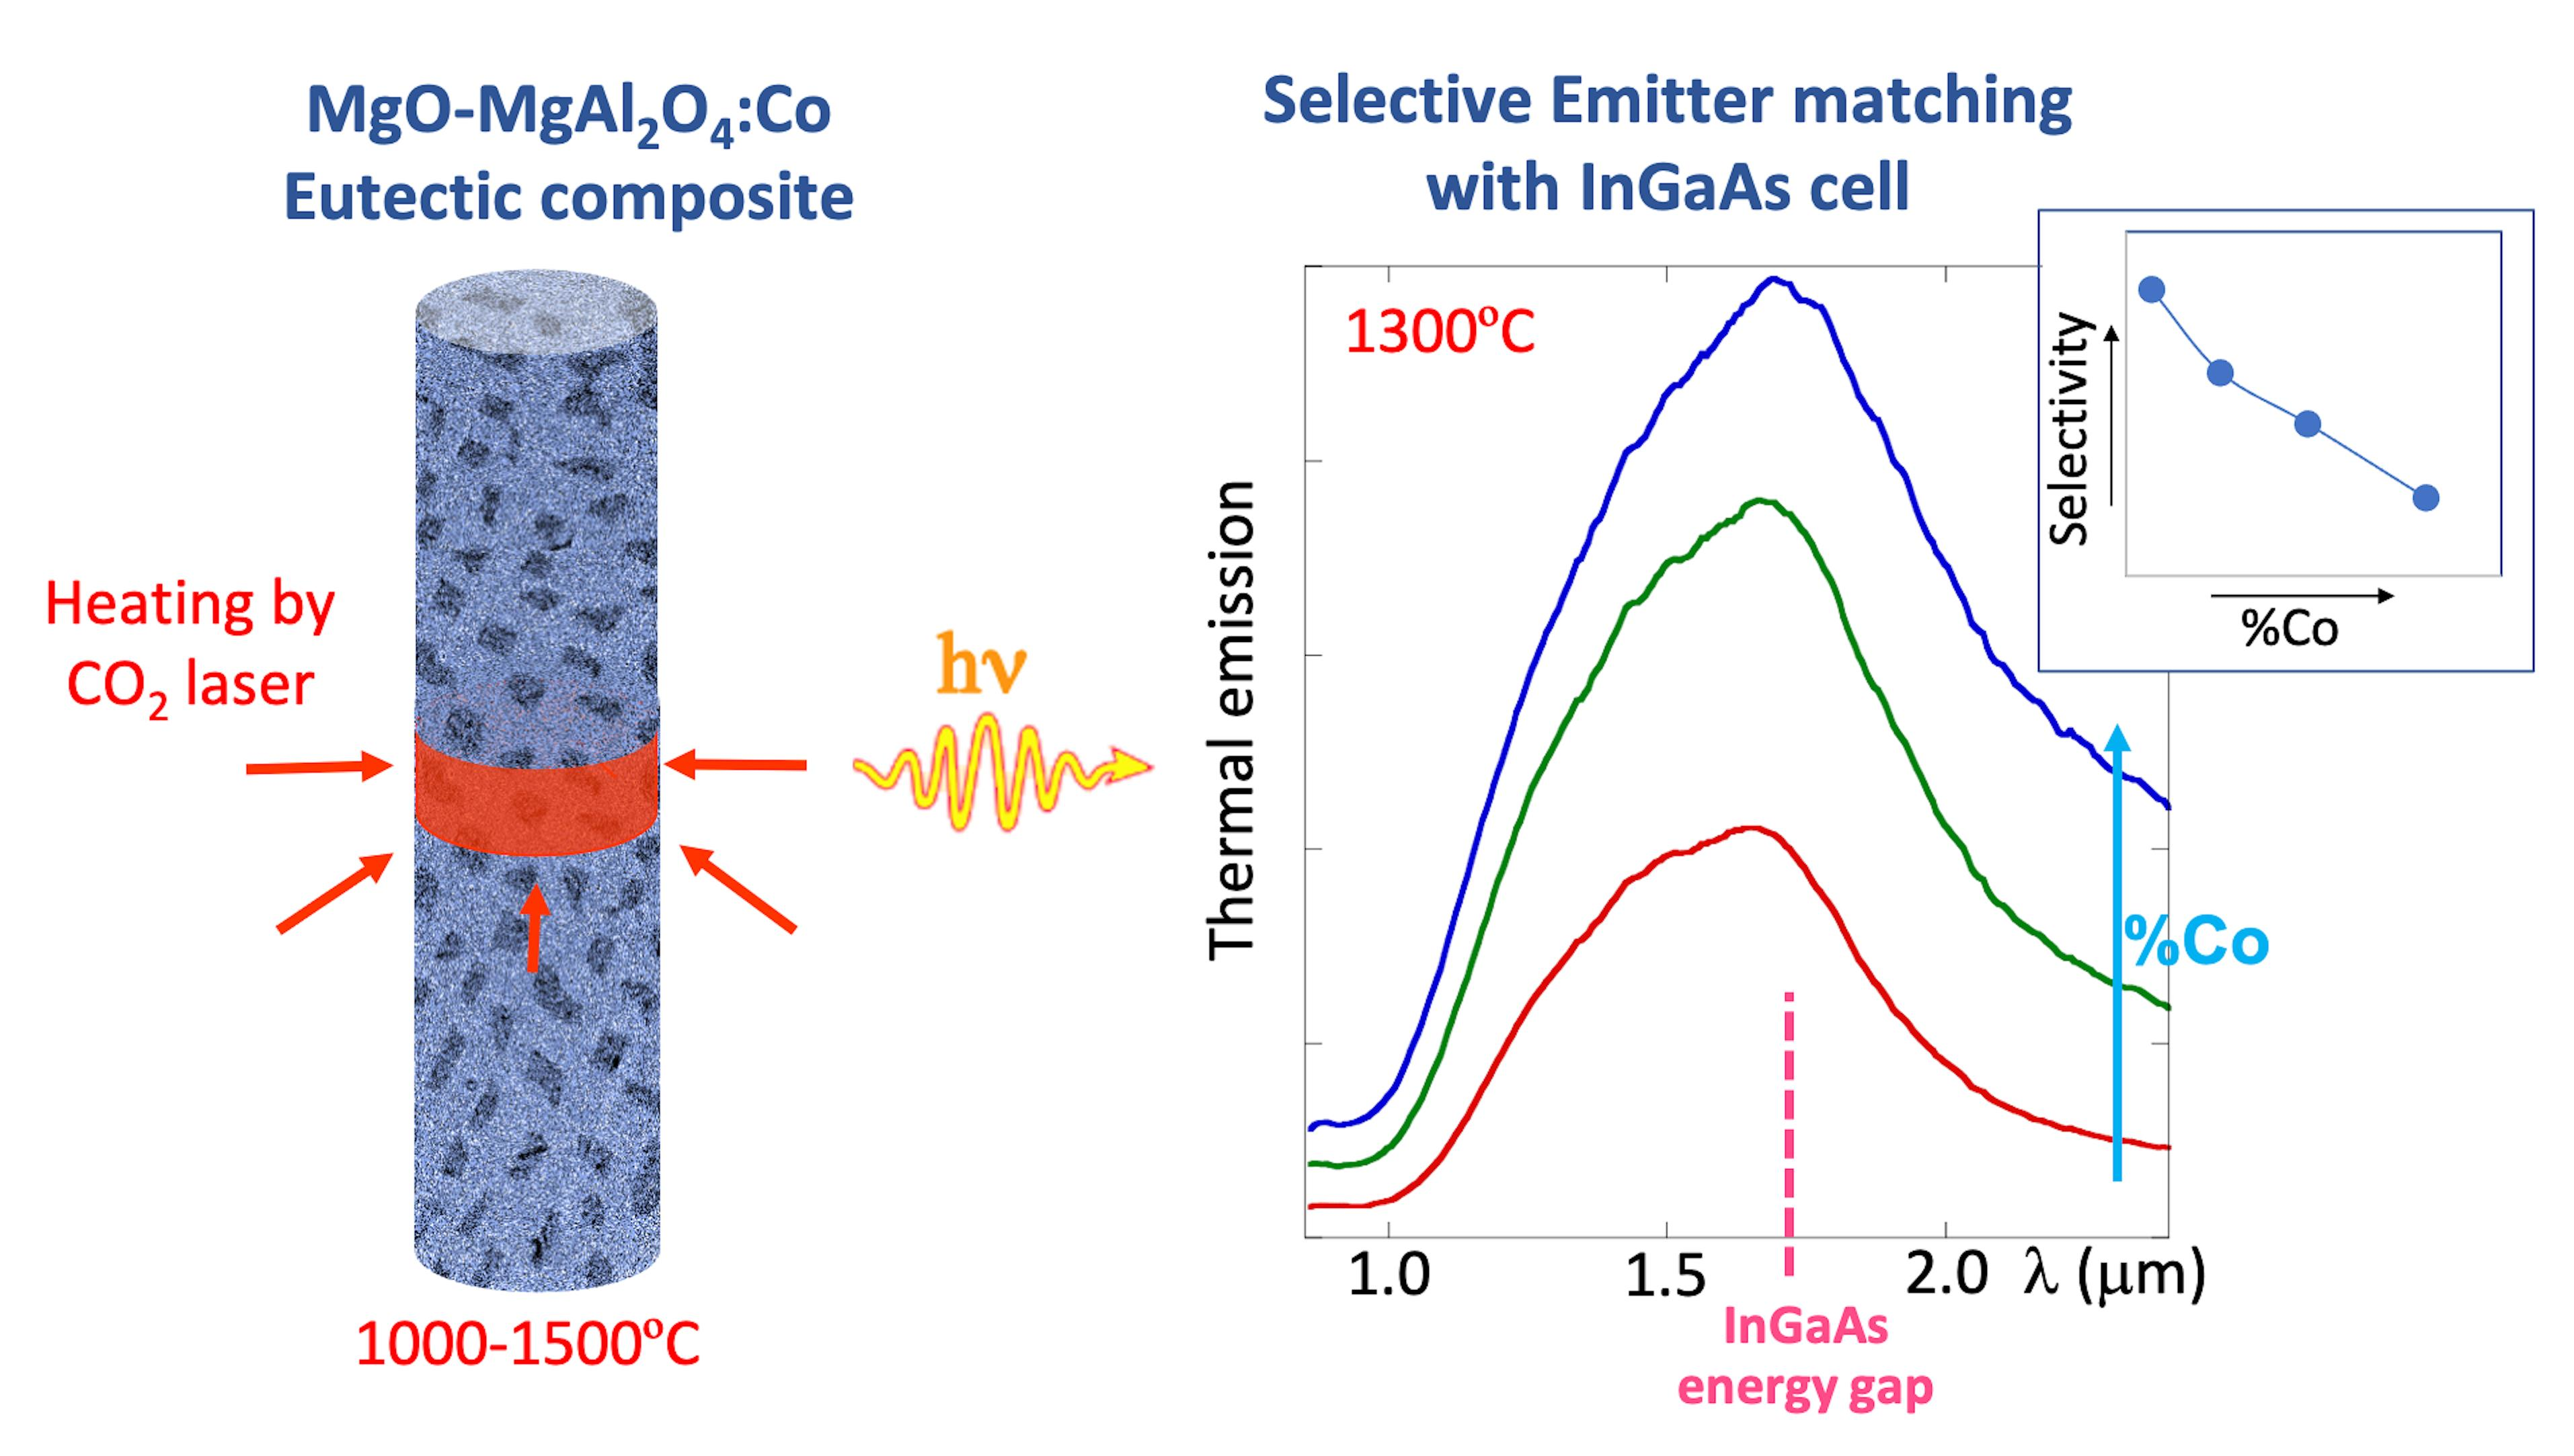
Cobalt-doped MgO-MgAl2O4 eutectic composites were explored for their use as selective emitters for thermophotovoltaic devices. Eutectic ceramic rods with different cobalt content were directionally solidified by using the laser floating zone technique at two processing rates to obtain microstructures with different domain sizes. Thermal emission between 1000 °C and 1500 °C and optical properties (reflectance and transmittance) at room temperature were measured in the Co-doped composites and the effect on microstructure and cobalt content was investigated. Thermal emission consisted of an intense broad band at about 1.67 µm matching with the bandgap of the InGaAs cell. The emission was ascribed to the de-excitation from the 4T1(F) multiplet to the 4A2(F) ground state of the thermally excited Co ions located in the tetrahedral sites of the MgAl2O4 phase. The selectivity of the thermal emission showed a decrease with the cobalt content due to the enhancement of other electronic transitions, which leads to keeping the cobalt content in these composites at low levels (<0.15% at Co) for their use as selective emitters.
1. Introduction
Thermophotovoltaic (TPV) devices convert infrared electromagnetic radiation into electrical energy by using photovoltaic cells. The electromagnetic radiation emitted by a hot material (emitter) is used as radiation source [1]. In order to obtain a significant amount of energy in the spectral range where the photovoltaic cell can operate, emitters have to be heated at temperatures in the range of 800–1600 °C. Most of the common emitters emit at these temperatures as a grey body, with a spectral broad thermal emission which results in a large amount of energy not being converted.
In order to achieve a major efficiency of the TPV generation, selective emitters, which irradiate in a spectral band matching with the semiconductor gap, have been investigated [2]. Most of this research has addressed ceramic oxides containing rare earth ions due to their narrow emissions in the spectral range of the most used photovoltaic cells [3,4]. In particular, ceramics containing Er3+ and Yb3+ have been largely investigated to be used in TPV devices with GaAs and Si cells, respectively [5,6]. Recently, selective emitters based in Er- and Yb-doped directionally solidified eutectic ceramics (DSEC) have been reported [7,8,9,10]. The outstanding mechanical and functional properties at high temperatures of the Al2O3 based eutectic ceramics as a result of their unpaired microstructure [11] make them relevant materials to work under the extreme operating conditions of TPV devices.
However, the narrowness of the 4f band emission of the rare earth ions maintains the converted energy at low levels which have moved the research to the study of ceramics doped with transition metal ions. The broader selective emission required for the TPV conversion can be obtained by the use of 3d ions, with intense absorption bands in the near infrared range. Thermal emission of Ni2+ and Co2+ ions in some ceramic oxides have been previously studied [12]. Intense selective emission in the 1–2 µm spectral range was reported in MgO:Ni and MgO:Co ceramics [13,14]. Recently, thermal emission of Ni2+-doped MgO-ZrO2 eutectic has been reported [15]. An intense broad emission band centred in 1.5 µm matching with the sensitive region of the GaSb photovoltaic cell was found. The emission was attributed to the radiative de-excitation of the nickel ions in the MgO lattice. However, the selectivity in the emission was lower than in the case of the rare earth-doped DSEC due to a non-negligible matrix emission, ascribed to the emission of the zirconia phase, and to the increase of the thermal emission at non-convertible wavelengths when the nickel doping content was raised.
The aim of the present work is to study the thermal emission of directionally solidified Co-doped MgO-MgAl2O4 ceramic composites. The choice of Co2+ as the selective emitter ion for this eutectic is relevant as, considering that cobalt ions can enter substituting Mg2+ ions in both MgO and MgAl2O4 eutectic phases, the content of the dopant ion in the composite could be higher than in the case of nickel, increasing the thermal emission of the composite. In addition, Co2+ ions show a high effective absorption cross section in MgAl2O4 [16,17], which would lead to a higher emission. Finally, recent results in directionally solidified MgO-MgAl2O4 eutectic ceramics show that this eutectic composite is translucent in the medium infrared range under some processing parameters [18], which would make it a suitable matrix for selective emission by reducing the emission out of the TPV convertible wavelength range. Nonetheless, both phases, MgO and MgAl2O4, have transparent windows extending deep into the infrared range (6.8 and 5.3 μm, respectively) [19]. In addition, materials based on MgO and MgAl2O4 have also been proposed for elevated temperature nuclear applications due to their radiation resistance [20].
Different directional solidification procedures can be used to process ceramic oxides from the melt. In this study, eutectic ceramics were obtained by means of the Laser Floating Zone (LFZ) technique, which achieves very large gradients at the liquid/solid interface allowing for the use of high growth rates and the crystal microstructure control in a wide variety of processing parameters [11]. In this work, two growth rates (50 and 750 mm/h) were used in order to develop different microstructures. The thermal emission of the Co-doped MgO-MgAl2O4 eutectic ceramics was measured up to 1500 °C and the influence of the microstructure and cobalt content was investigated in order to optimize the performance of the composite as selective emitter in TPV devices.
2. Materials and Methods
Eutectic rods of Co-doped MgO-MgAl2O4 were obtained by directional solidification by using the LFZ method. There is only one eutectic point in the Al2O3–MgAl2O4 system with a molar composition of 67.43%MgO-32.57%Al2O3 and a melting temperature of 1995 °C [21]. Ceramic powders were prepared using a mixture of commercial powders of MgO (Sigma-Aldrich, Burlington, MA, United States, >99%), Al2O3 (Sigma-Aldrich, Burlington, MA, United States, 99.99%) and Co3O4 (Alfa Aesar, Ward Hill, MA, United States, 99.7%) with the compositions given in Table 1. Cylindrical feed-rods were fabricated by isostatically pressing the powder for 3 min at 200 MPa and sintering at 1500 °C during 12 h.
Ceramic rods were directionally solidified in air using a continuous-wave CO2 laser as a heating source. To eliminate the feed-rod porosity, different densification stages were applied at a low pulling rate (in the range 25–200 mm/h).
The final directional solidification was always performed with the grown crystal travelling downwards to obtain bubble-free samples. Eutectic rods were grown using a processing rate of 50 and 750 mm/h at the final stage without rotation. The solidified rods had a final diameter in the range 2–2.5 mm. For comparison purposes, Co-doped MgAl2O4 single crystals and undoped MgO-MgAl2O4 eutectic rods were also grown in air using the same procedure and a growth rate of 50 mm/h and 100 mm/h, respectively.
Due to some cobalt evaporation during the laser processing, the final dopant level could significantly vary from the nominal composition, being strongly dependent on the number and solidification rate of the densification stages. From now, the different processed ceramics will be referred to using the acronym Cox-y and Spinelx-y, for the MgO-MgAl2O4 eutectic and MgAl2O4 single crystal, respectively, where x is the cobalt content (%at Co) estimated by Energy-dispersive X-ray spectroscopy (EDS) and y is the processing rate (mm/h). Table 1 presents all the samples used in this research and their cobalt content, as determined by EDS, in the composite and in each eutectic phase. A cobalt-doped MgO single crystal (MgO:Co, courtesy of Prof. V.M. Orera) was also used in the experiments. Its cobalt content was measured by EDS and is included in Table 1.
Microstructural characterization was performed in polished transverse cross sections of rods by means of back-scattered electron images obtained in a Field Emission SEM (FESEM, model Carl Zeiss MERLIN). Specimens for this characterization were prepared using conventional metallographic methods. Semiquantitative compositional characterization was carried out by means of the EDS detector coupled to the FESEM.
Thermal emission spectra were measured on the as-grown rods by heating the samples with the CO2-laser focused annularly on the sample surface. Emitted light was collected using an optical fiber and the emission spectrum was measured in the 850–2400 nm range using an NIR 256-2.5 spectrophotometer from Ocean Optics. The spectral sensitivity of the spectrometer was calibrated using a halogen lamp with a brightness temperature of 2968 K. The temperature of the samples was measured using a two-colour pyrometer (Impac, ISR12-LO MB33) and varied from 1000 °C to 1500 °C by changing the laser power.
The optical absorption of the doped crystals, MgAl2O4 and MgO, was measured with a Cary5000 UV-VIS-NIR spectrophotometer from Agilent Technologies. Polished slices of MgAl2O4 cobalt-doped crystals around 0.7 mm thick and a 2.4 mm thick prism of MgO:Co were used for the in-line absorption measurements.
Directional hemispherical transmittance and reflectance was measured on 7 mm long pieces of the as-grown rods. The internal-DRA accessory coupled to the Cary UV-VIS-NIR spectrometer was used. It consists of a 110 mm diameter integrating sphere coated with PTFE and with transmittance and reflectance sample ports. The sample bars were inserted into a 2 × 7 mm2 slit cut in an absorbing flexible diaphragm fitted into the respective port for the measurements. Transmittance measurements were made against the empty slit-cut diaphragm, and for 100% reflectance reference we used a flat Halon reflector on the slit-cut diaphragm. The incident light beam hit the samples perpendicularly to the rod axis.
3. Results
3.1. Microstructure
Eutectic rods of Co-doped MgO-MgAl2O4 were obtained by directional solidification using two different solidification rates in order to achieve different microstructures. Large transverse cracks were observed in the eutectic rods grown at 50 mm/h whereas the rods grown at 750 mm/h were free of cracks. This cracking in samples grown at low rates has been previously reported in undoped MgO-MgAl2O4 eutectic ceramics [21,22] and is related to the thermal expansion mismatch and the high aspect ratio of microstructure at these rates.
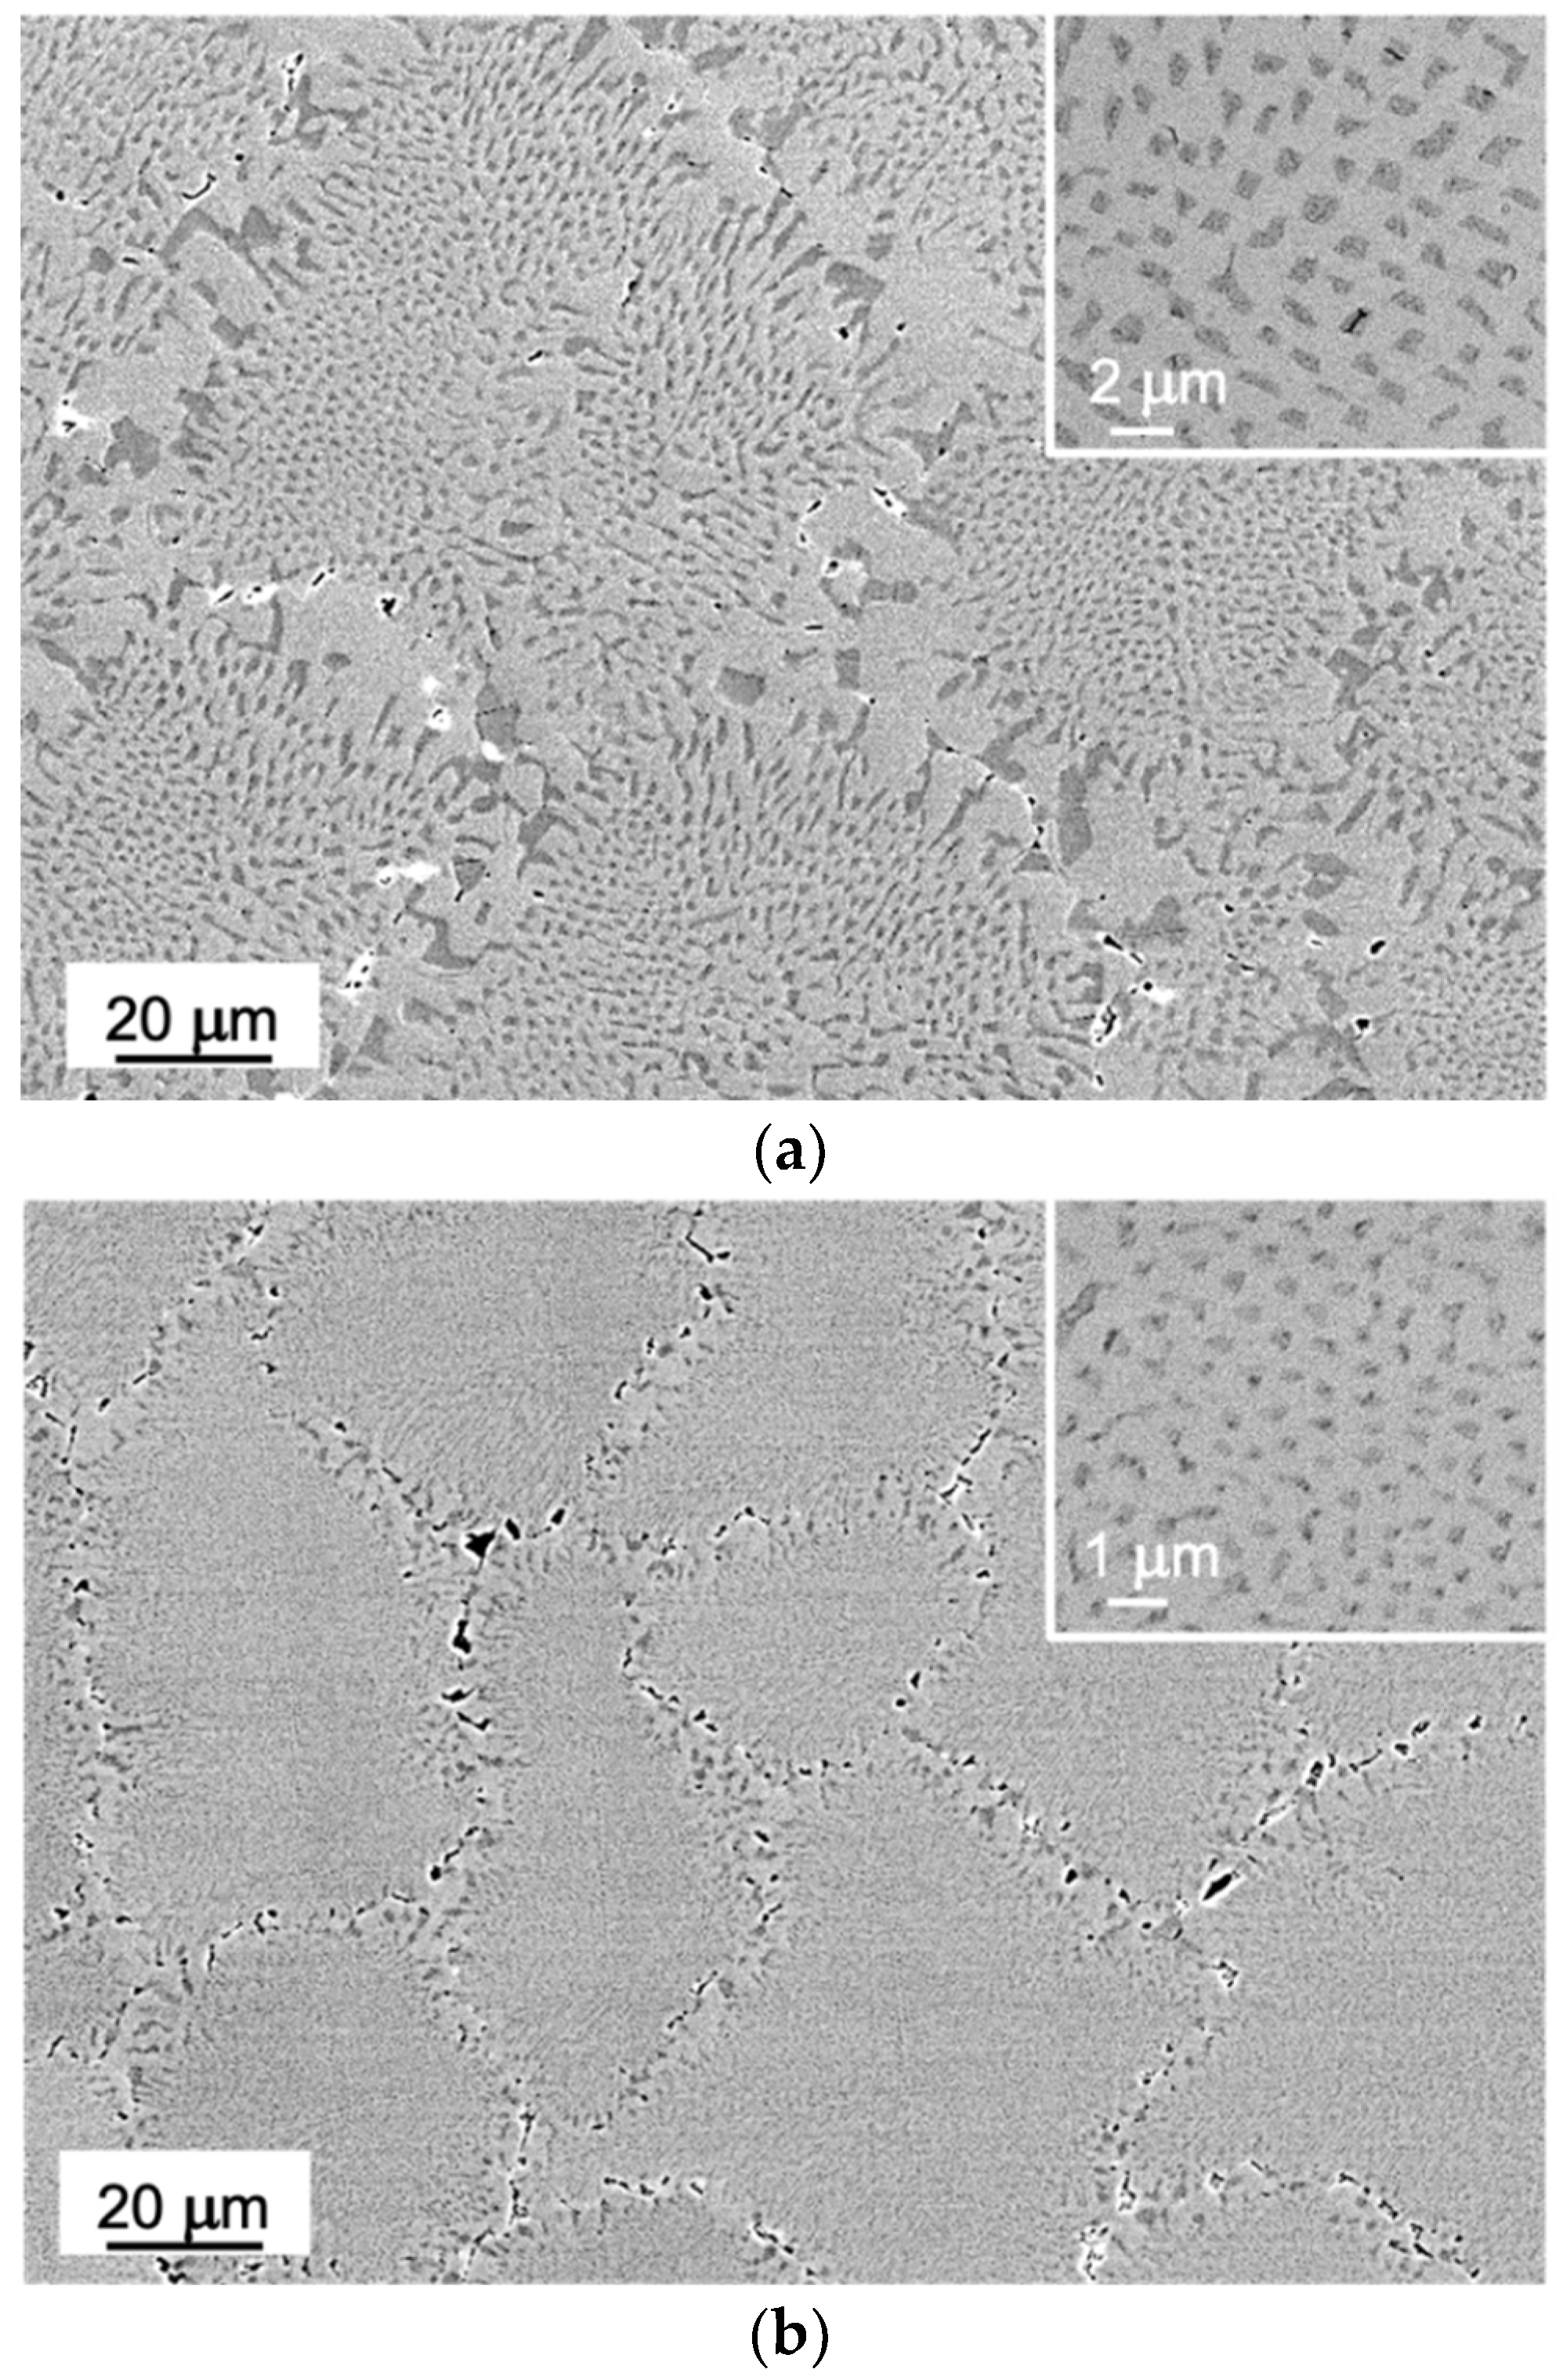
Figure 1 shows transverse cross sections of Co-0.12-50 and Co-0.15-750 eutectic rods grown at 50 mm/h and 750 mm/h, respectively. Two different phases were observed corresponding to the eutectic phases, MgO (dark contrast) and MgAl2O4 (light contrast). Table 1 shows EDS estimation of the Co content in both eutectic phases. We can see that cobalt ions enter mostly in the MgO eutectic phase; the Co content in MgAl2O4 phase is in some samples near the EDS detection level. No primary phases were found in any of the samples. Microstructure features did not show significant dependence on the cobalt content.
Formation of colonies were observed for both processing rates. The colonies presented a boundary formed by coarsened eutectic phases. Colonies in eutectic ceramics processed at 50 mm/h, with a 70–90 µm diameter, showed a boundary of 15–25 µm in thickness whereas the samples solidified at 750 mm/h presented colonies with a diameter about 30–40 µm and a boundary of ~10 µm in thickness. Inside the colony, the eutectic microstructure consisted of MgO fibers embedded in a spinel matrix. The observed fibrillar microstructure is consistent with the volume fractions of the eutectic phases calculated from the eutectic composition (23.4%vol), as fibrous geometries are favored when the volume fraction of the minority phase is lower than 28% [11]. The presence of colonies has been previously observed in undoped MgO-MgAl2O4 eutectic ceramics when using high solidification rates [21,22]. However, homogeneous eutectic microstructures have been achieved in MgO-MgAl2O4 eutectic composites solidified using the LFZ technique at rates of 50 mm/h [22], contrary to the observed in the present research. This may be related to the slight deviation of the ceramic composition from the true eutectic composition due to the cobalt addition, which leads to a non-planar growth and the formation of colonies.
A refinement of the microstructure was observed when the solidification rate increases, in agreement with Hunt–Jackson law, which predicts a decrease of the eutectic interphase spacing, λ, when the processing rate increases [23]. The interphase spacing was calculated by linear interception methods using the transverse cross section SEM images for both processing rates. λ-values of 1.4 ± 0.2 µm and 0.6 ± 0.1 µm were obtained for Co0.12-50 and Co0.15-750 eutectic rods, respectively. The interphase spacings measured for Co-doped eutectic were slightly larger than those obtained for undoped eutectic samples (1.06 µm and 0.53 µm for samples processed at 50 mm/h and 750 mm/h, respectively) [22], and a bit smaller than the one measured by Orlinski et al. in eutectic rods prepared by the micro-pulling down method at 50 mm/h [24].
3.2. Thermal Emission
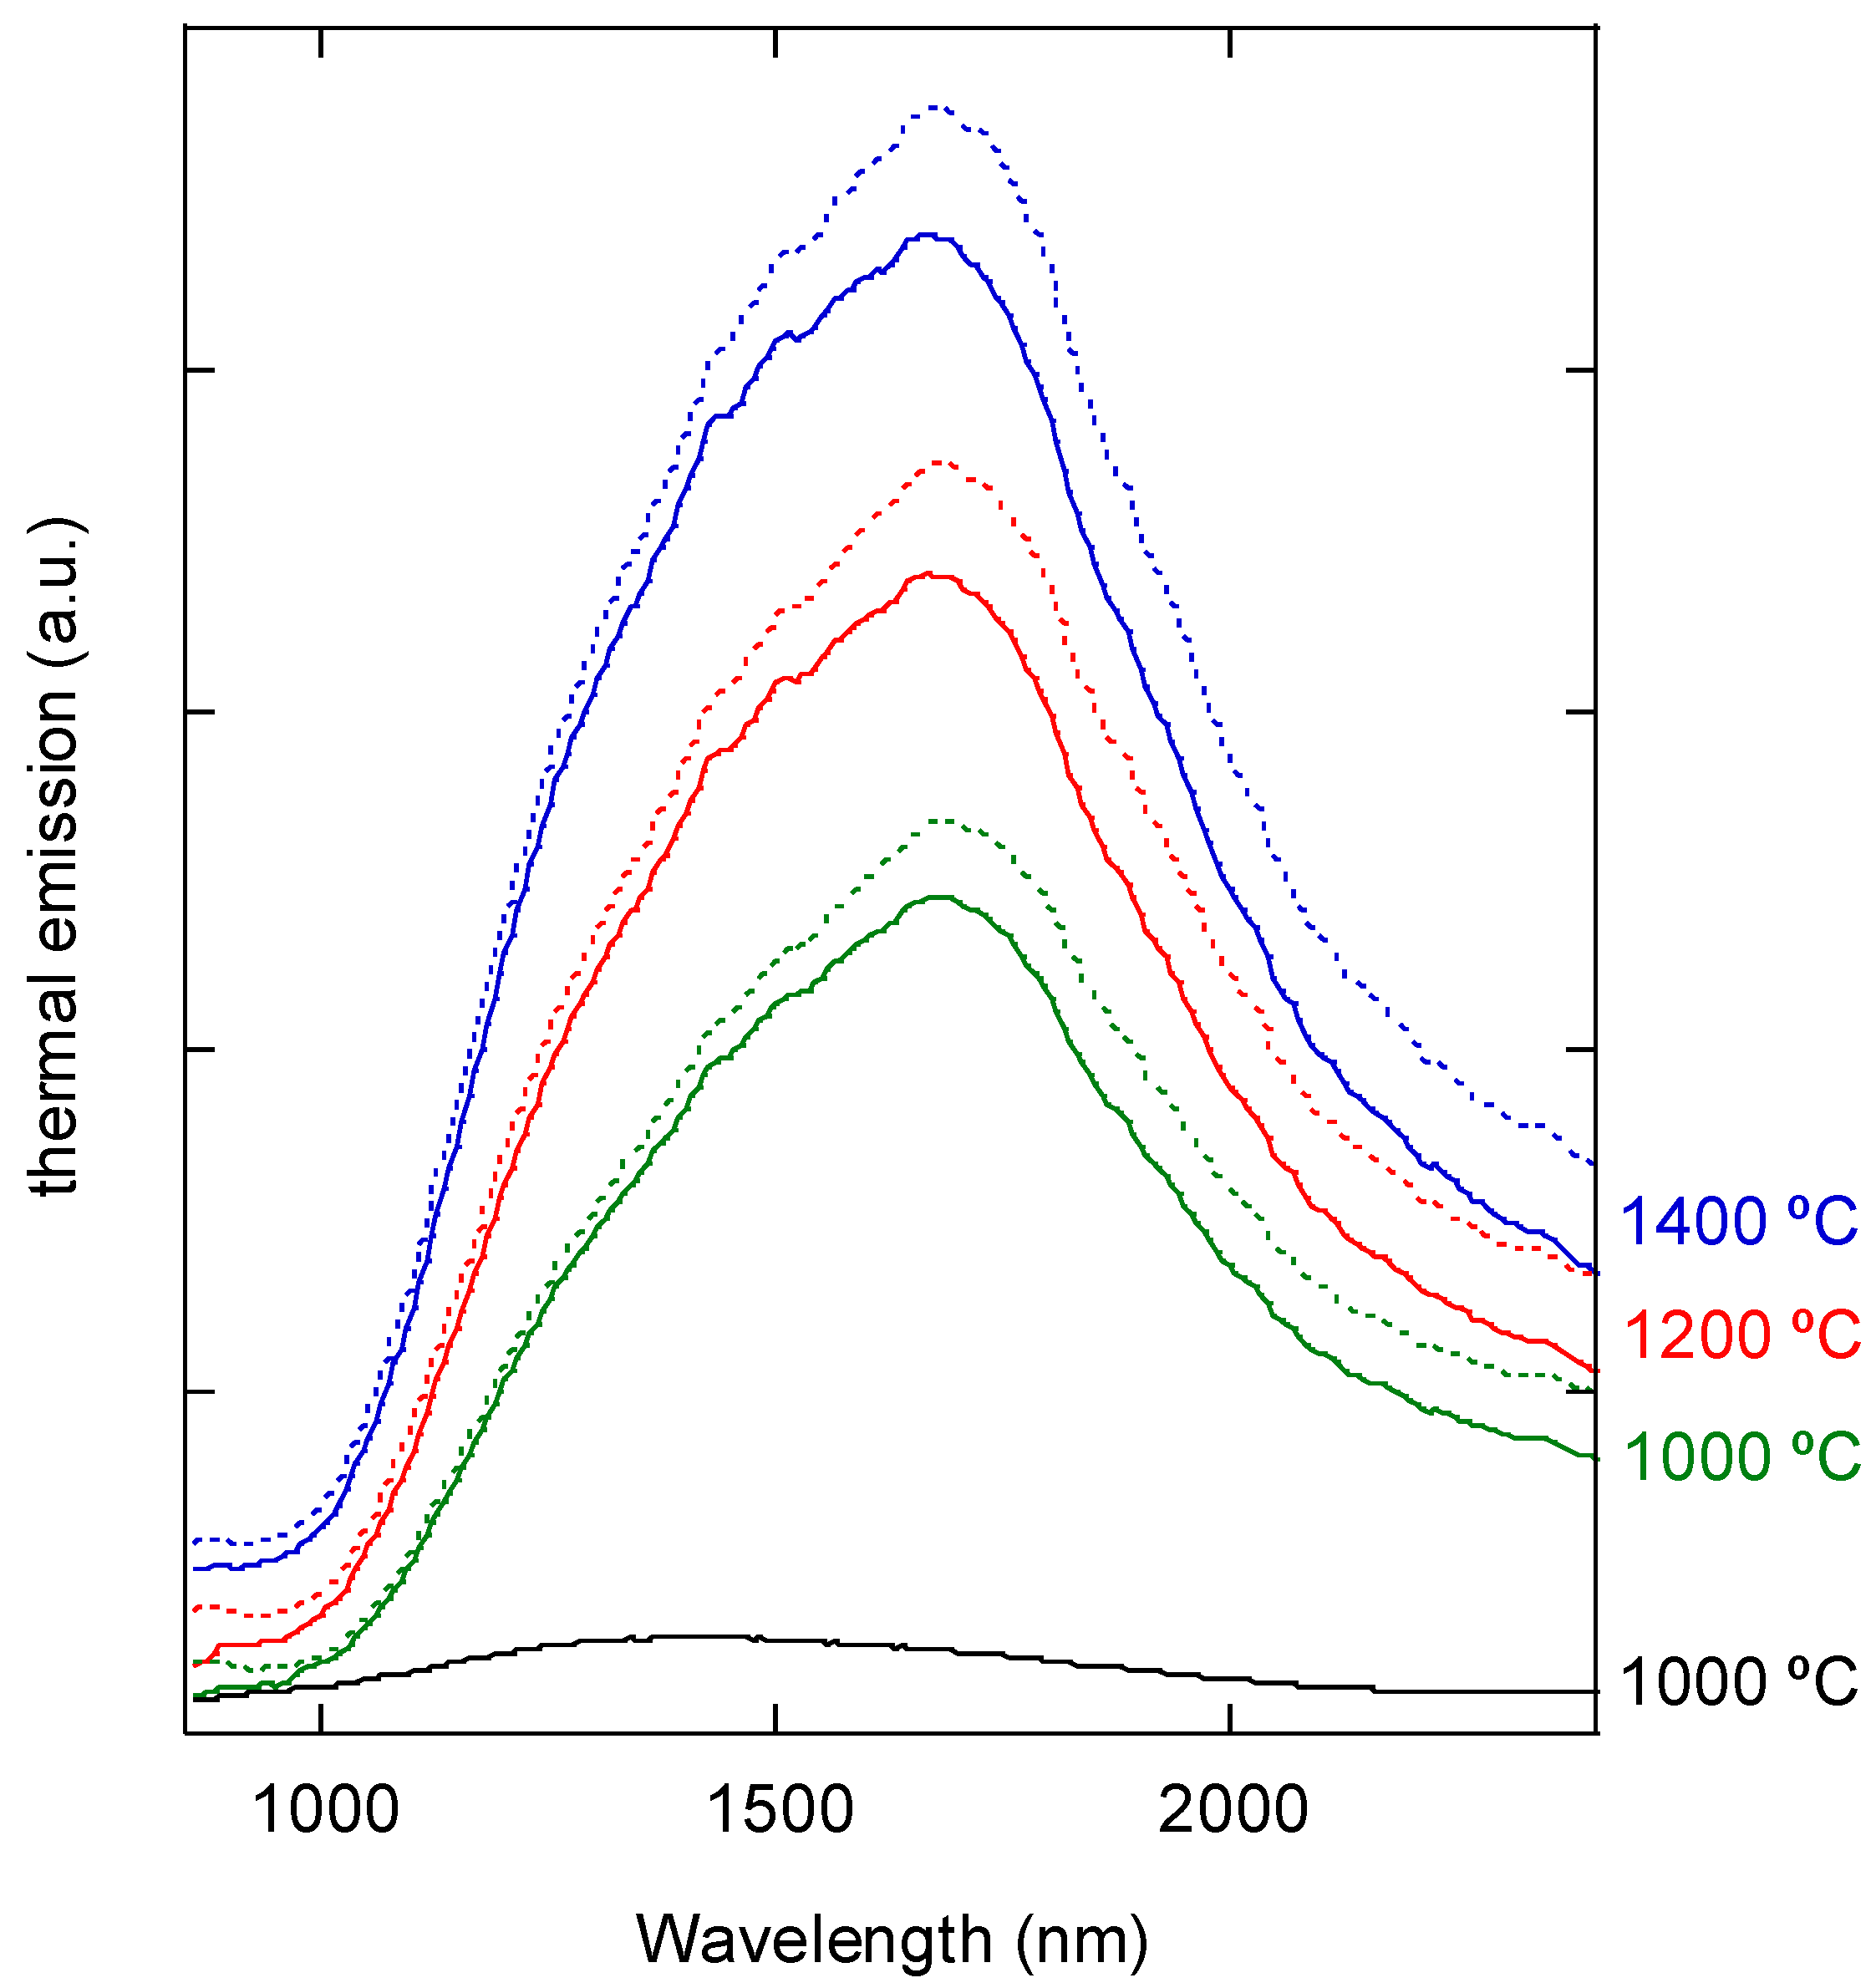
Figure 2 shows the thermal emission spectra of Co0.12-50 and Co0.15-750 for several temperatures in the infrared range. For comparison, the thermal emission measured at 1000 °C in the undoped MgO-MgAl2O4 eutectic is also presented. We can observe an intense band centered at 1675 nm in the spectra of the cobalt-doped composites. The strong emission was attributed to the radiative deexcitation of the thermally excited Co2+ ions, with an almost negligible contribution of the matrix.
When comparing spectra from eutectics processed at 50 mm/h (solid lines) and at 750 mm/h (dotted lines) we can observe that the effect of the microstructure was negligible in the maximum position and half-width of the band, although slightly more intense spectra were detected for the samples grown at higher rate. The thermal emission increased when the temperature raised, as expected from the greater number of thermally excited ions.
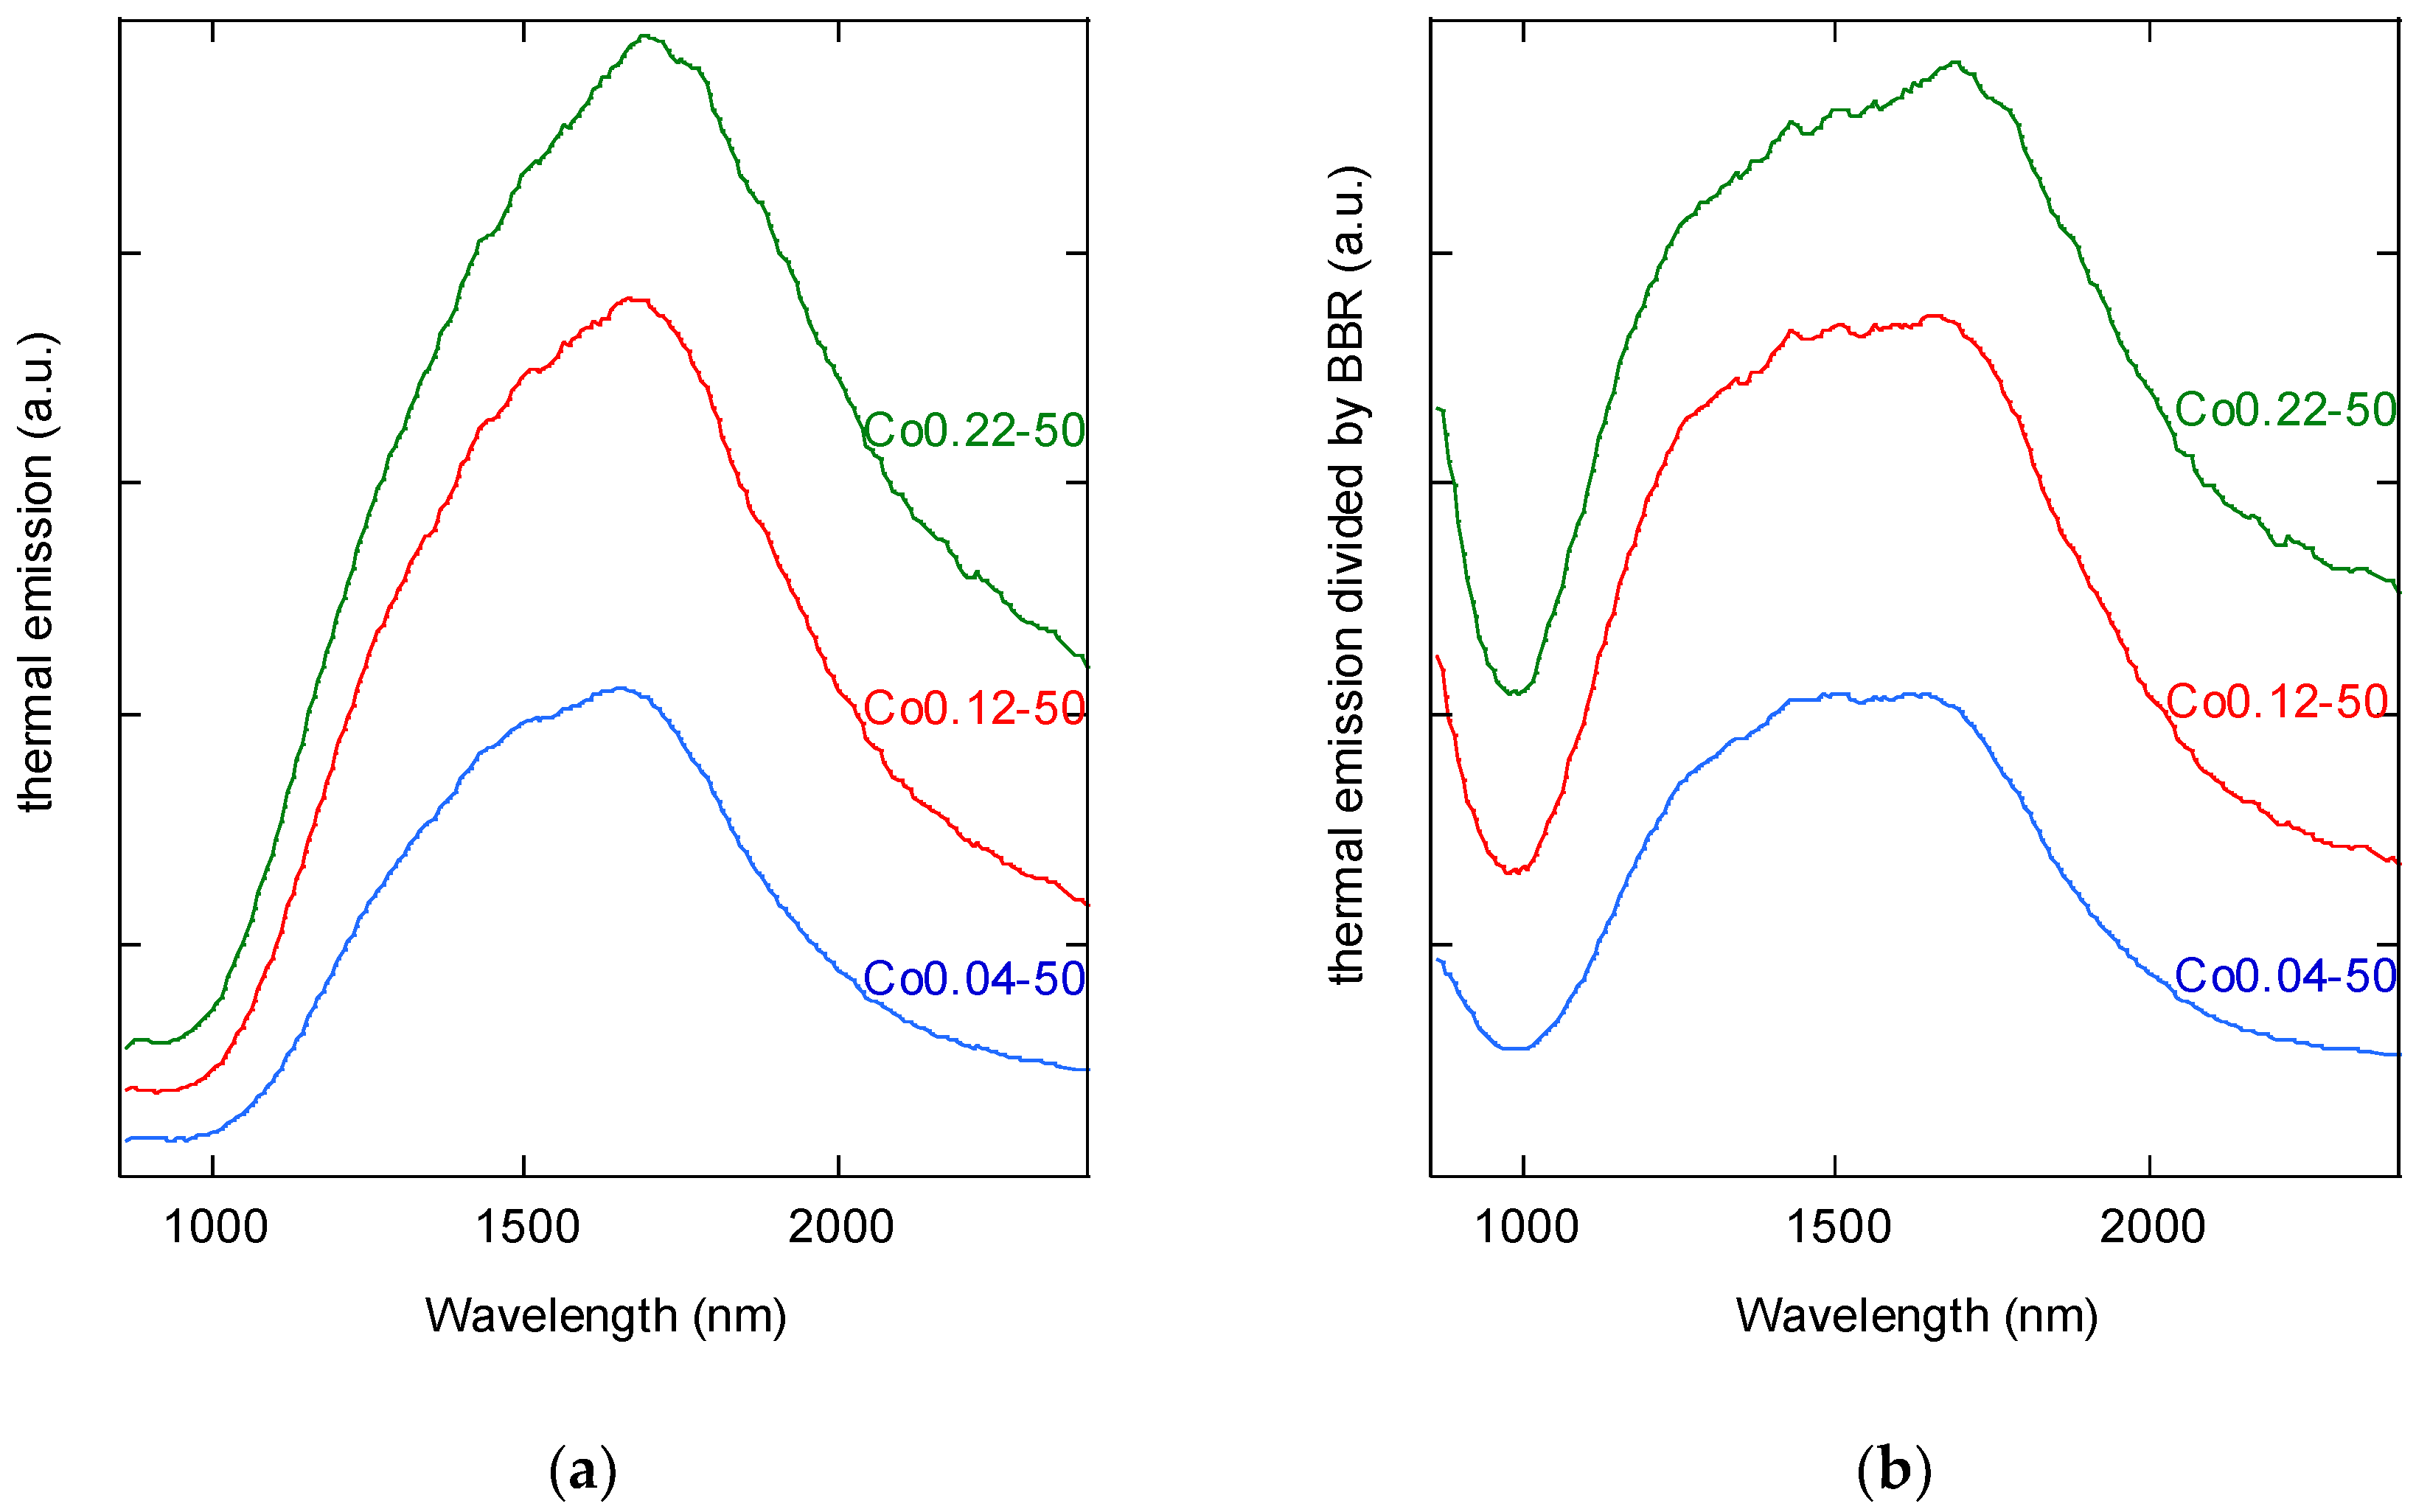
The effect of the composition of the eutectic rods in the thermal emission was also investigated. Figure 3a shows the emission spectra at 1300 °C for samples solidified at 50 mm/h (with the same microstructure) for different Co content. In order to analyze the spectral features of the band in more detail, we have to take into account that the thermal emission is modulated by the Plank profile. Figure 3b shows the thermal emission divided by the blackbody radiance (BBR), which, in fact, corresponds to the emissivity of the sample. An increase of the emission at wavelengths lower than 1000 nm can be observed in these spectra which was attributed to the Co2+ very intense electronic transitions peaking in the visible range. Other transitions to and from excited state levels might also contribute, as explained below.
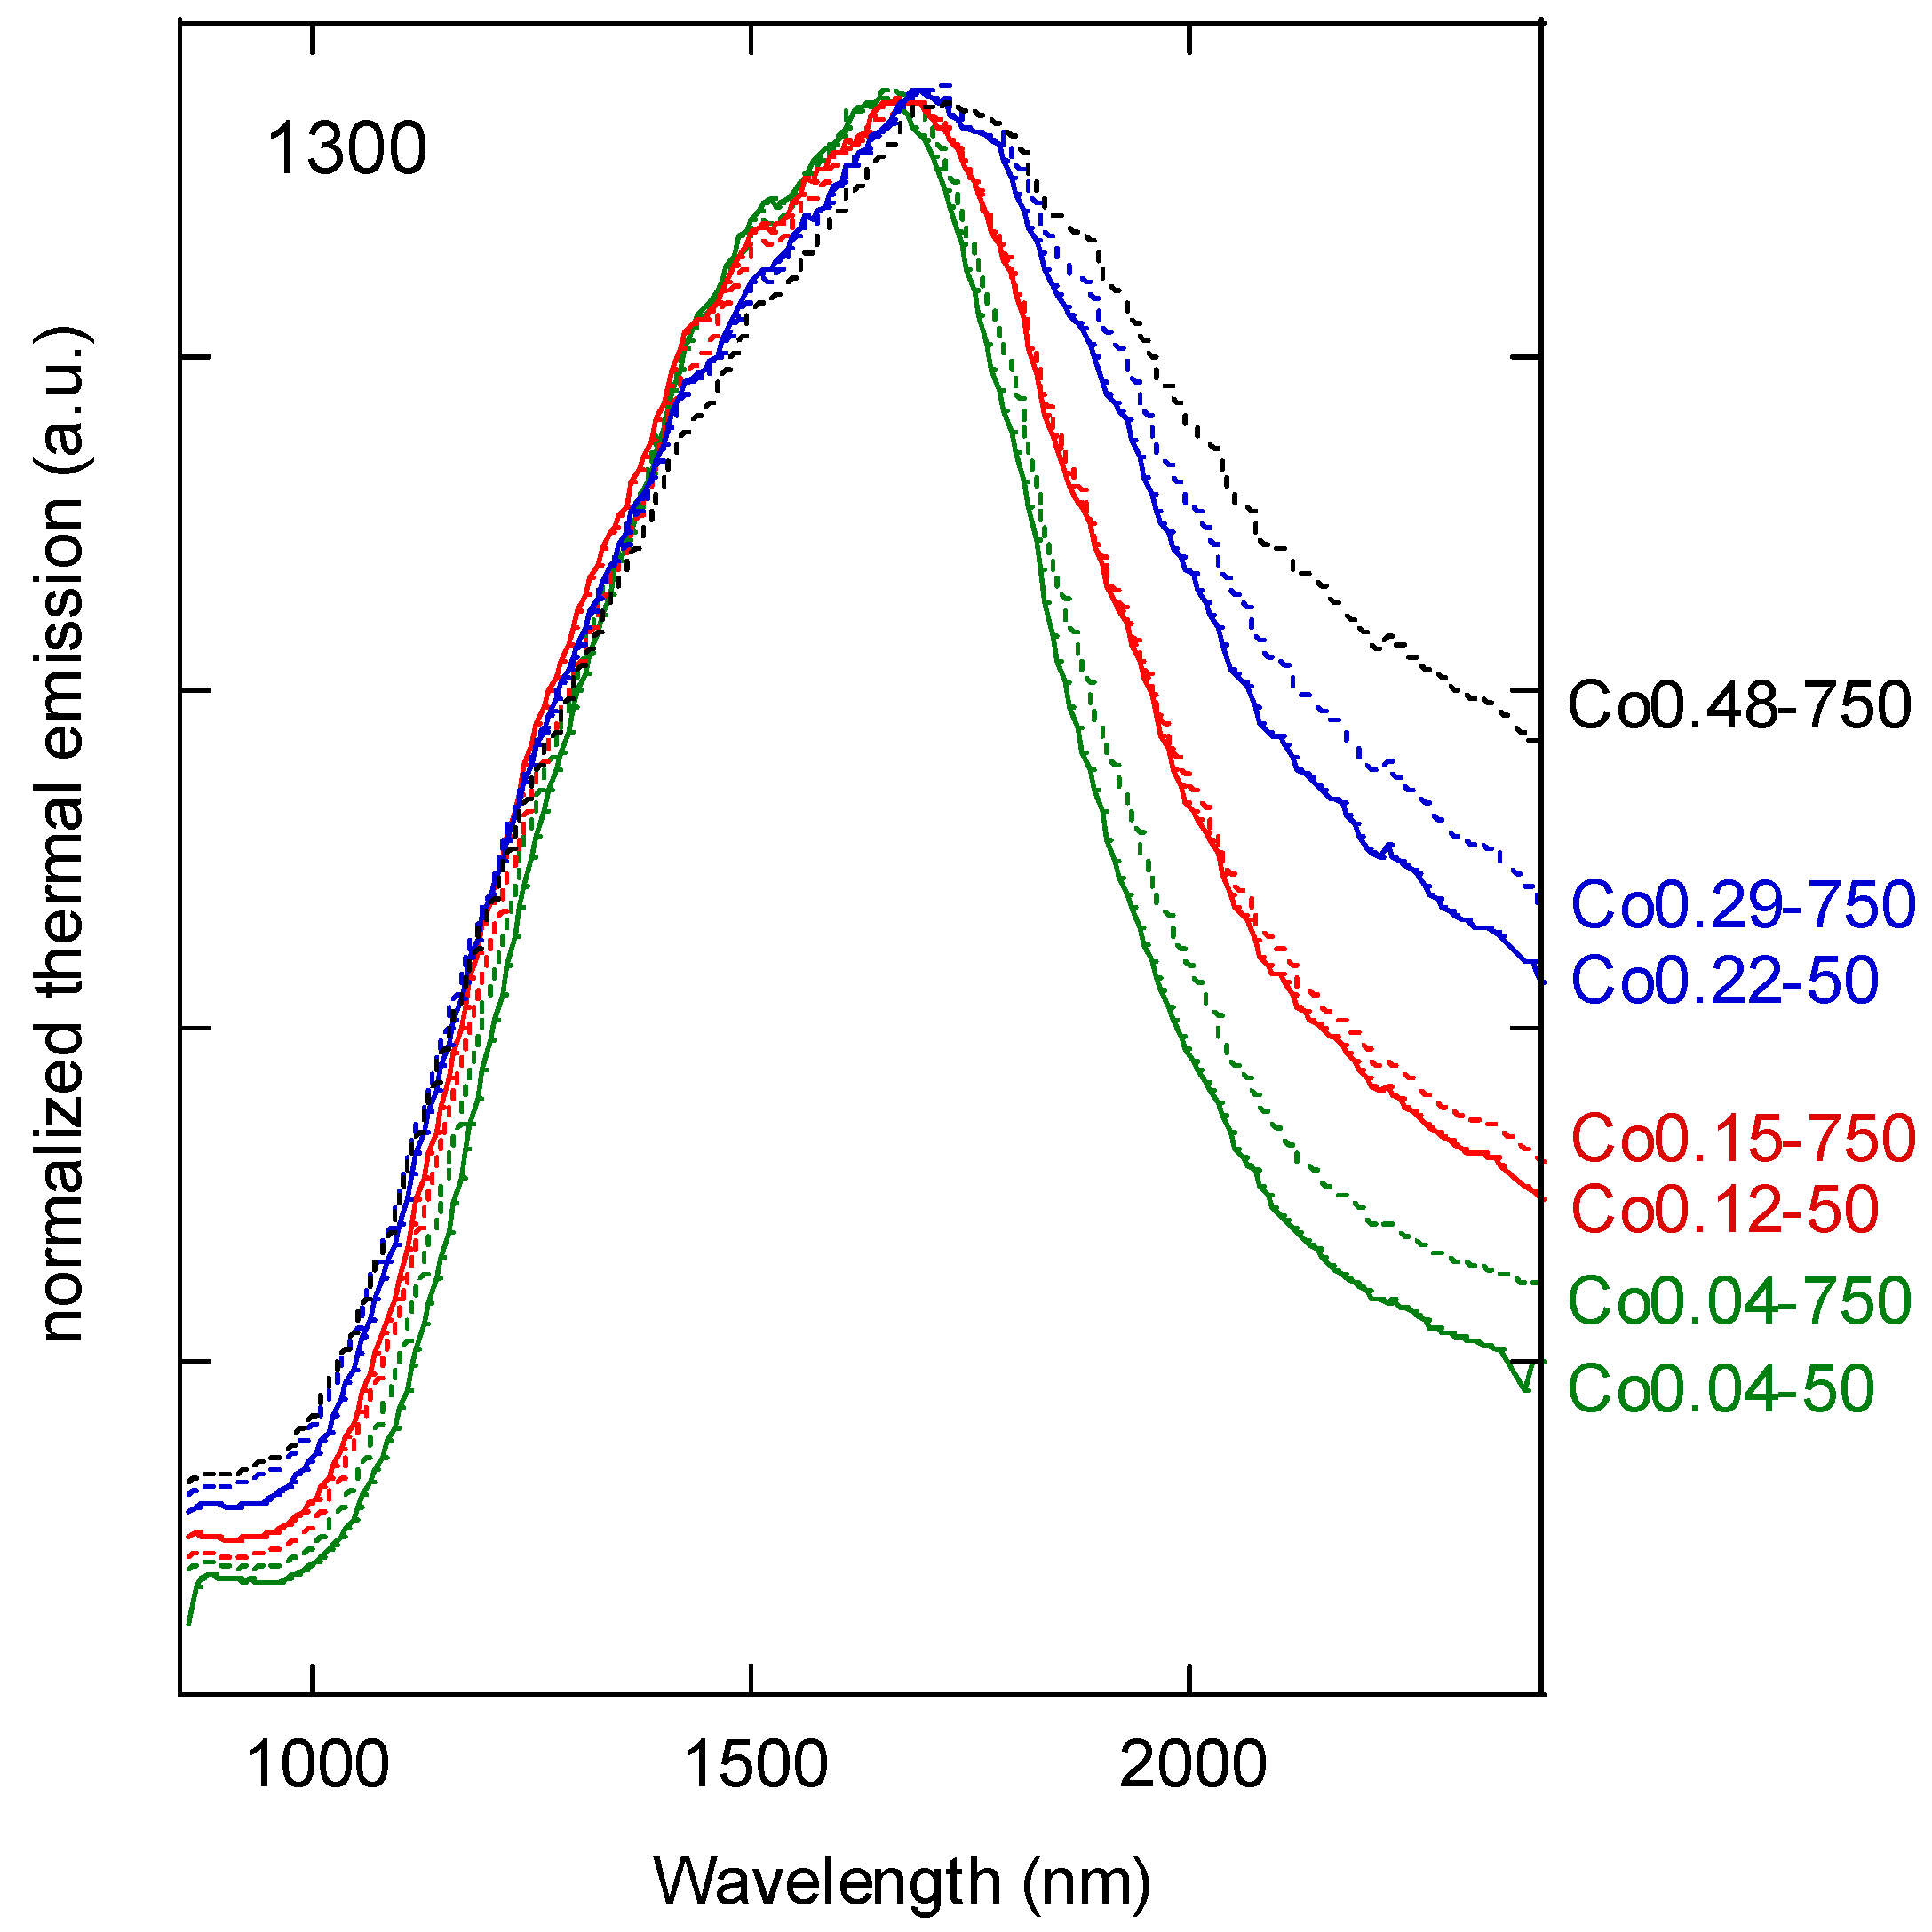
The features of the spectra strongly depended on the cobalt percentage of the composite, thermal emission becoming more intense when the cobalt content increased. However, this increase is not linear with the dopant level, the thermal emission clearly saturating for Co0.22-50. In addition, an enhancement of the emission at low energies (at wavelength >2000 nm) was observed when raising the cobalt content, which lowered the selectivity of the emission. This behavior is more clearly noted when comparing the normalized spectra of the thermal emission for all the eutectic samples investigated in this work (Figure 4). It is found that a high contribution to the emission is present in the spectral range of 2000–2400 nm for samples with a cobalt content >0.2% at Co.
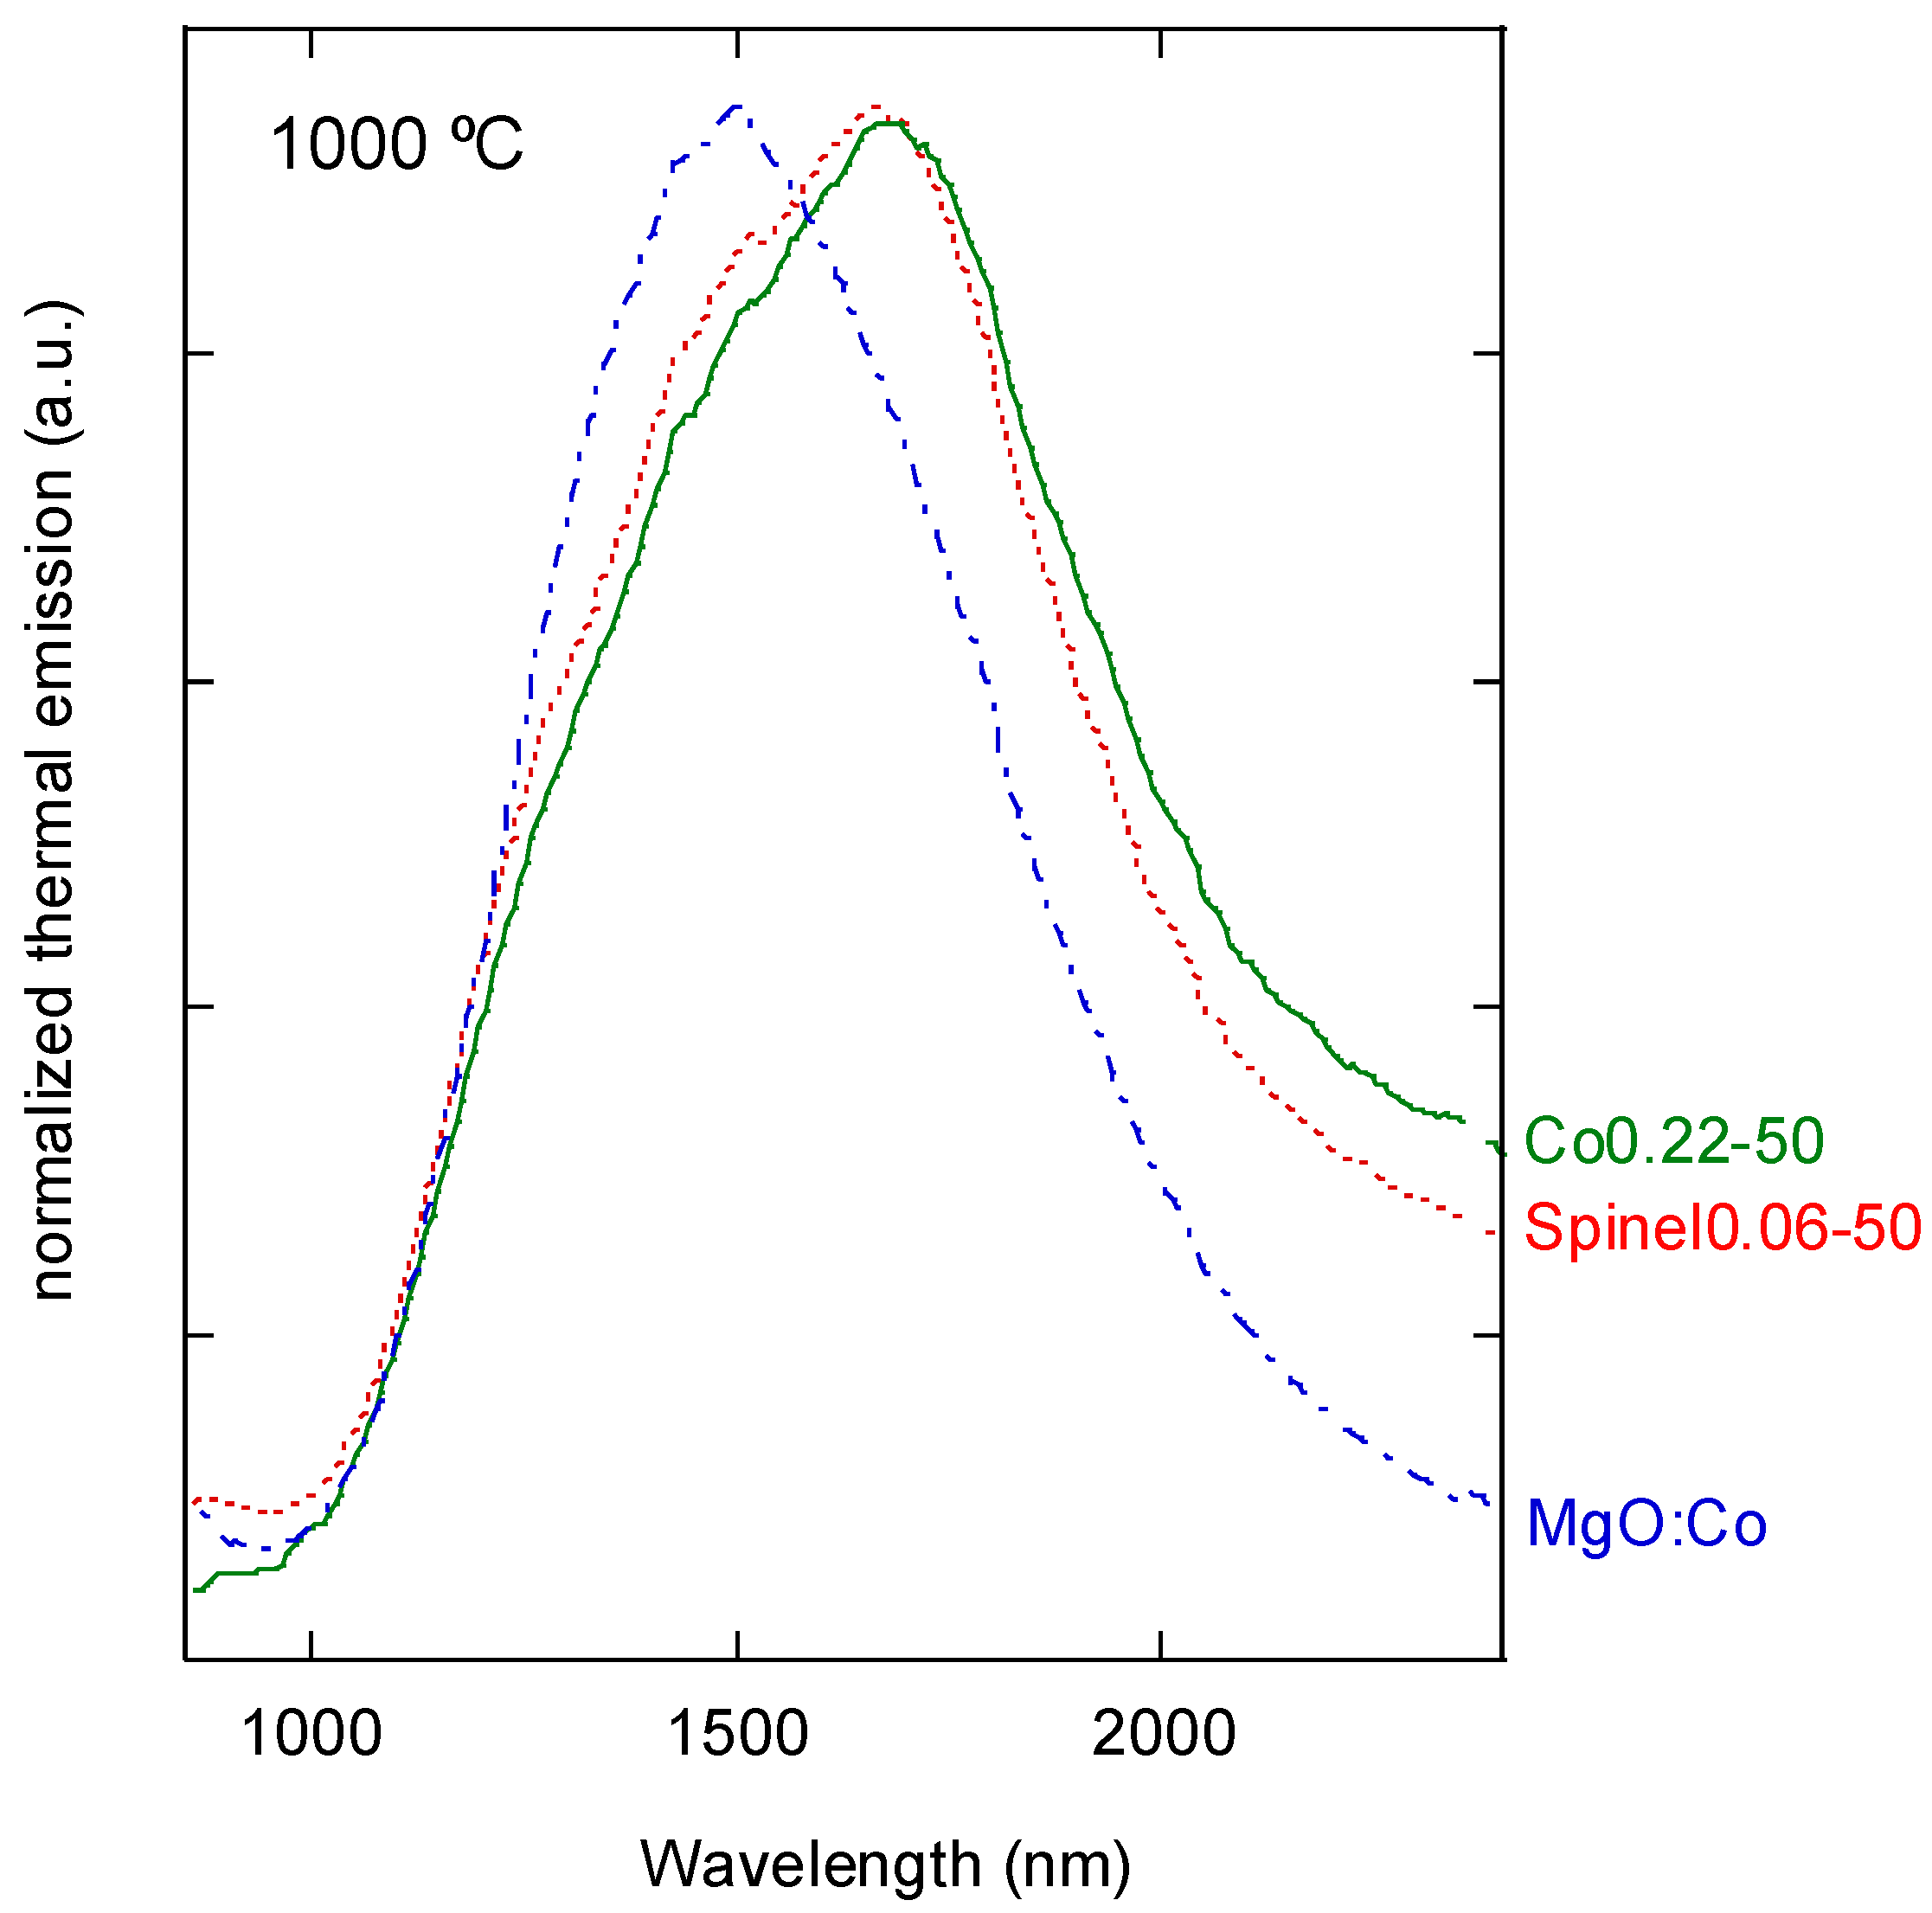
Cobalt ions can enter both MgO and MgAl2O4 eutectic phases. In order to elucidate in what lattice the cobalt ions responsible of the thermal emission enter, thermal emission in MgO:Co and MgAl2O4:Co single crystals was studied. Figure 5 shows the spectra measured at 1000 °C for MgO:Co and Spinel0.06-50. From the comparison of these spectra with those obtained for the Co-doped eutectic samples investigated in this work, we can conclude that the measured emission is mainly due to the radiative emission of the cobalt ions in the spinel matrix. Although, from the EDS estimation, cobalt concentration in the MgO phase is higher than in MgAl2O4, with 70 to 80% of the Co present in the sample located in the MgO phase, the contribution to the thermal emission of Co2+ ions in MgO seems to be negligible. It is worth noting here that the oscillator strength of Co2+ in MgAl2O4 is greater by three orders of magnitude than in MgO ([17], see below for more details) which could explain the dominant emission of the MgAl2O4:Co phase in the eutectics.
Co2+ ions in MgAl2O4 can occupy sites with tetrahedral symmetry and sites with octahedral symmetry. From previously reported studies [17] the optical properties of MgAl2O4:Co are in agreement with the cobalt located in the tetrahedral sites. Therefore, we performed the analysis of the emission spectra assuming a purely tetrahedral symmetry for the dopant ion environment. The ground state of Co2+ (d7) ions occupying tetrahedral sites is 4A2(4F). The measured thermal emission was attributed to the de-excitation of the cobalt ions from the excited state 4T1(4F) to the ground state 4A2. From Figure 3b, we can observe that some structure is present in the broad emission band. Four lines located at around 1300, 1430, 1500 and 1685 nm were found and related to the spin-orbit splitting of the parent 4F ionic state (4F9/2 + 4F7/2 + 4F5/2 + 4F3/2). The positions of these peaks were red-shifted with respect to the absorption bands measured at room temperature [16,25]. This shift towards low energies of the emission at a high temperature is expected as the thermal expansion of the crystal produces a lengthening of the Co2+–O2- ligand distance, which decreases the cubic crystal field intensity. A similar red shift at high temperatures was also observed in the thermal emission of Ni-doped MgO-MgSZ eutectic composites [15] and in the absorption band of NiO measured up to 1200 °C [26].
3.3. Room Temperature Absorption and Emittance
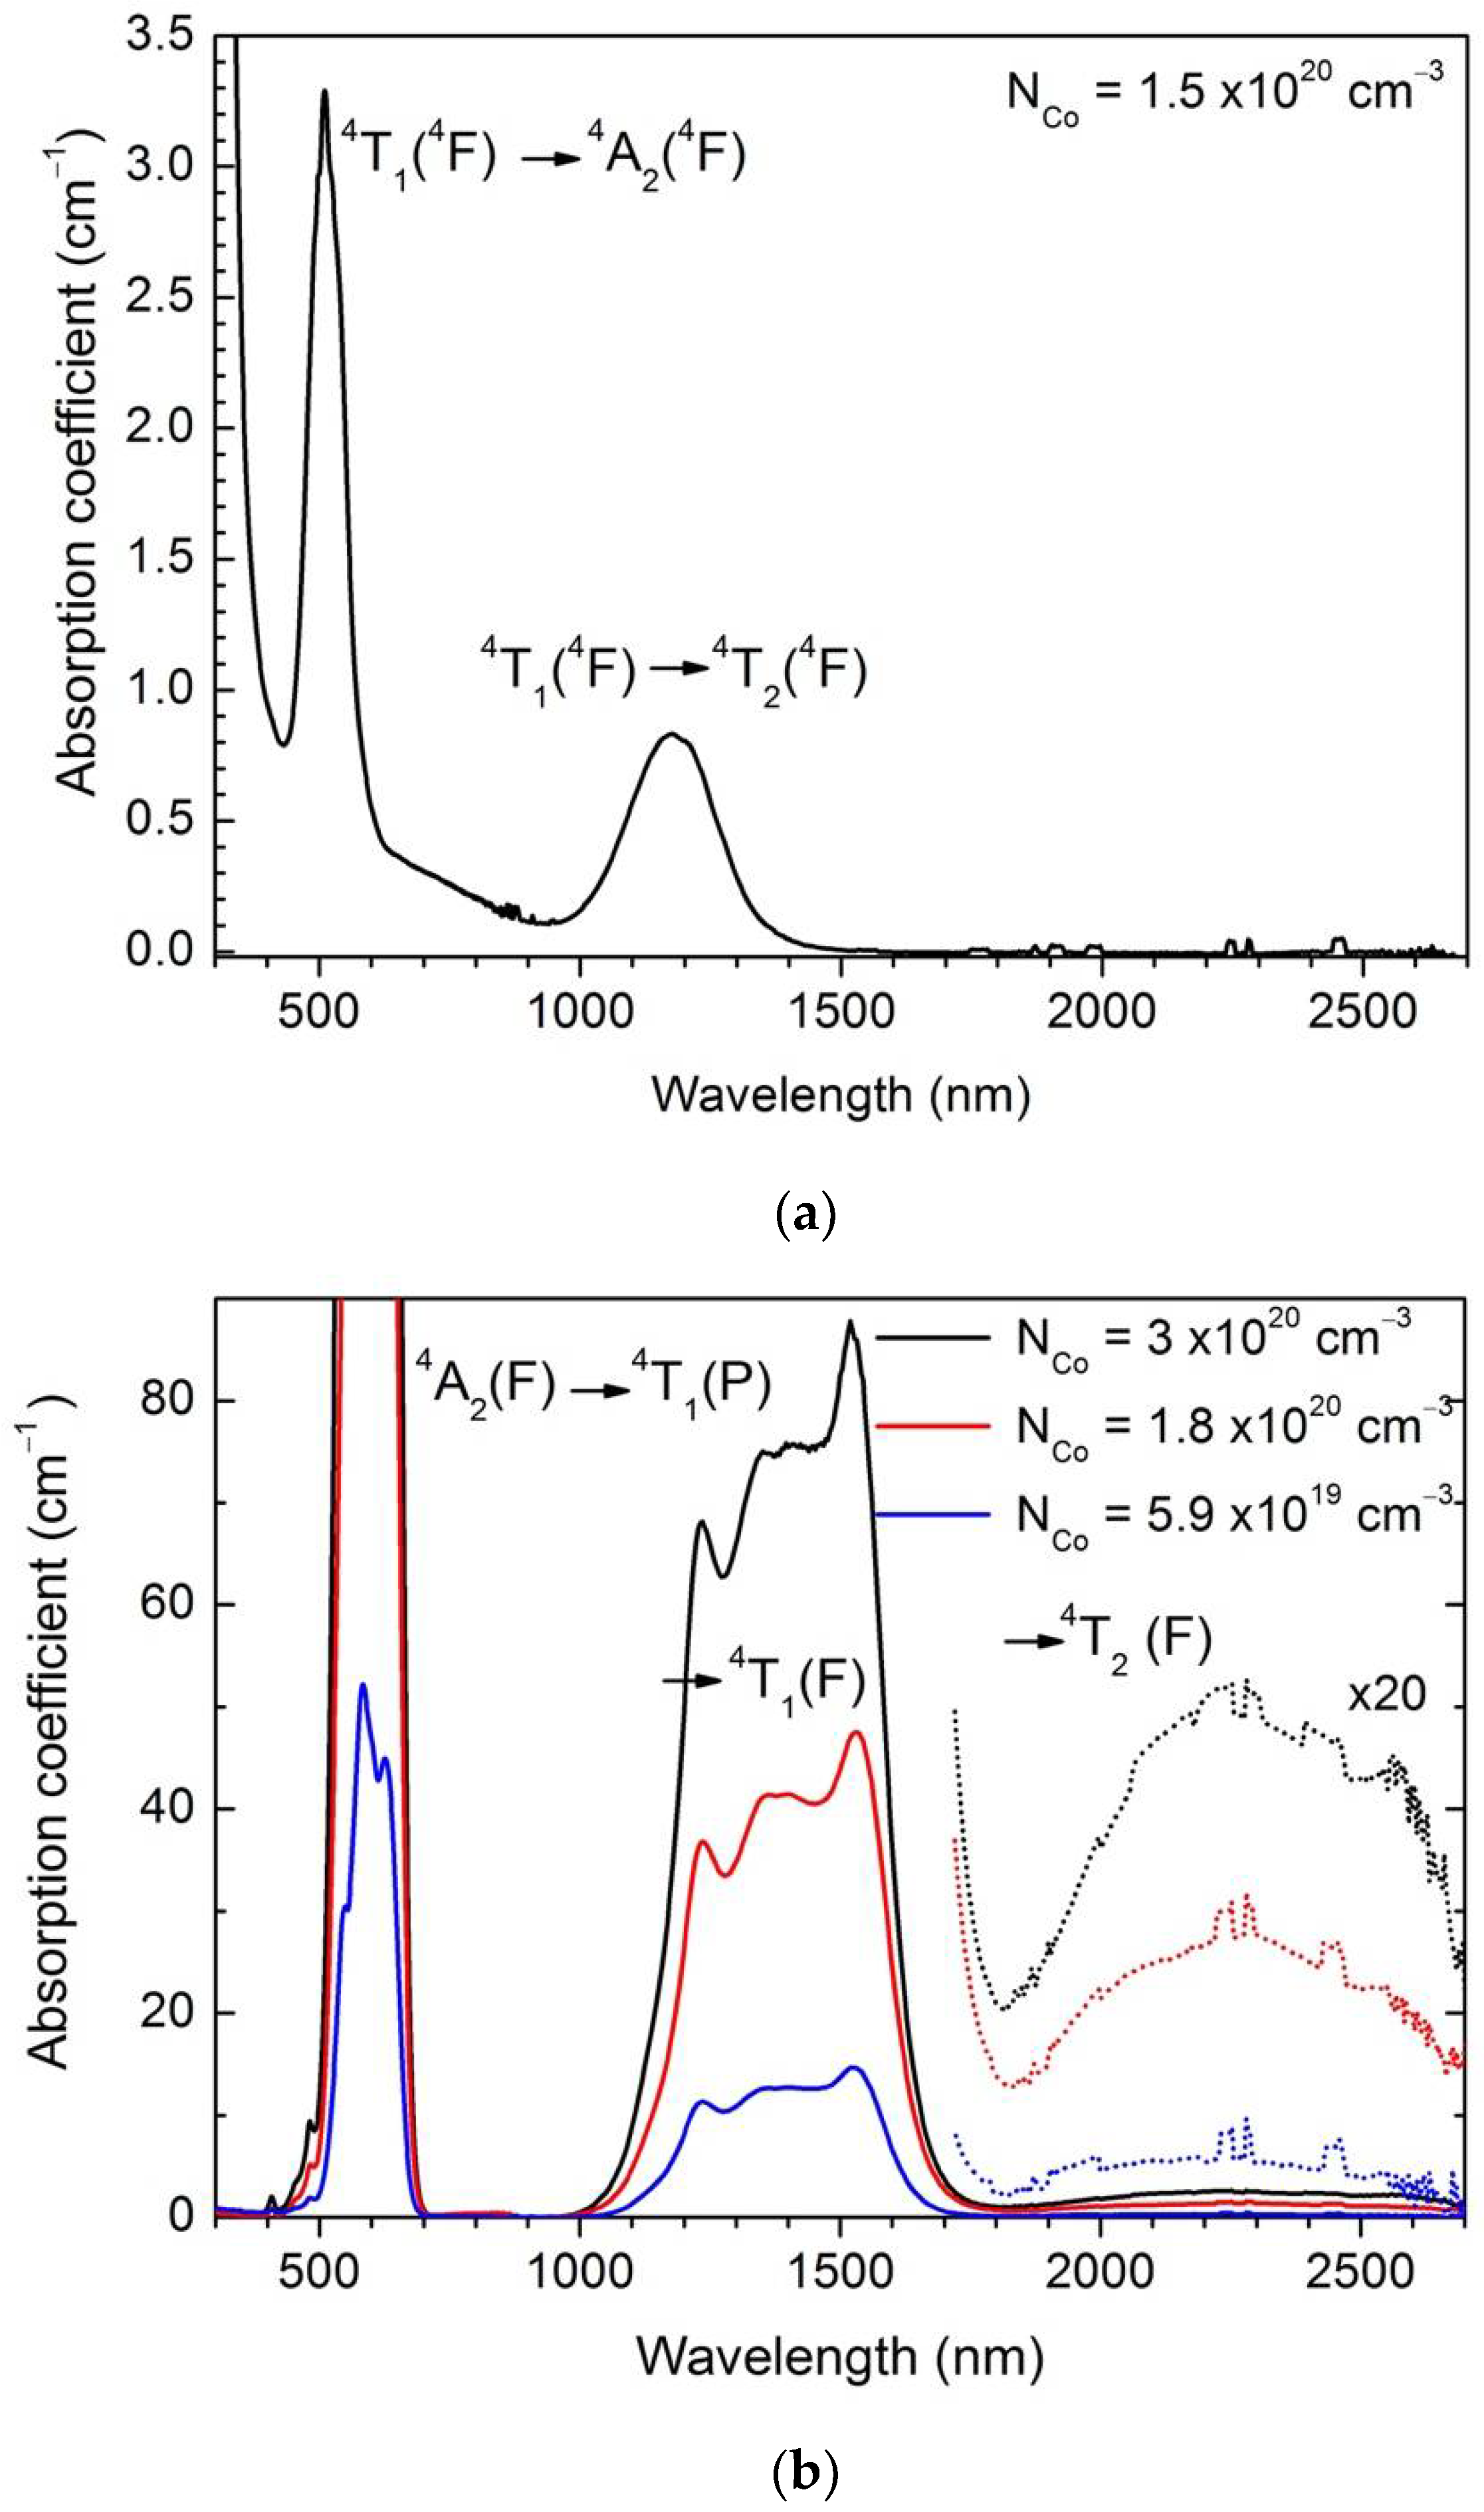
Complementary information and estimates of the sample emittance can be obtained from optical measurements at room temperature (RT). The absorption spectra measured at RT in the single crystals are given in Figure 6. The MgO:Co spectra show strong absorption bands corresponding to the intraconfigurational transitions of octahedrally coordinated Co2+ [17]. The bands correspond to transitions within crystal field levels from the 4F free ion term, namely, 4T1 to 4T2 at 1180 nm and 4T1 to 4A2 at 510 nm. MgAl2O4:Co absorption spectra correspond to tetrahedrally coordinated Co2+ in MgAl2O4 [17]. The band in the visible range (around 590 nm) corresponds to transition from the 4A2 ground state to the 4T1(4P) and the one around 1528 nm to the transition 4A2 to 4T1(4F).
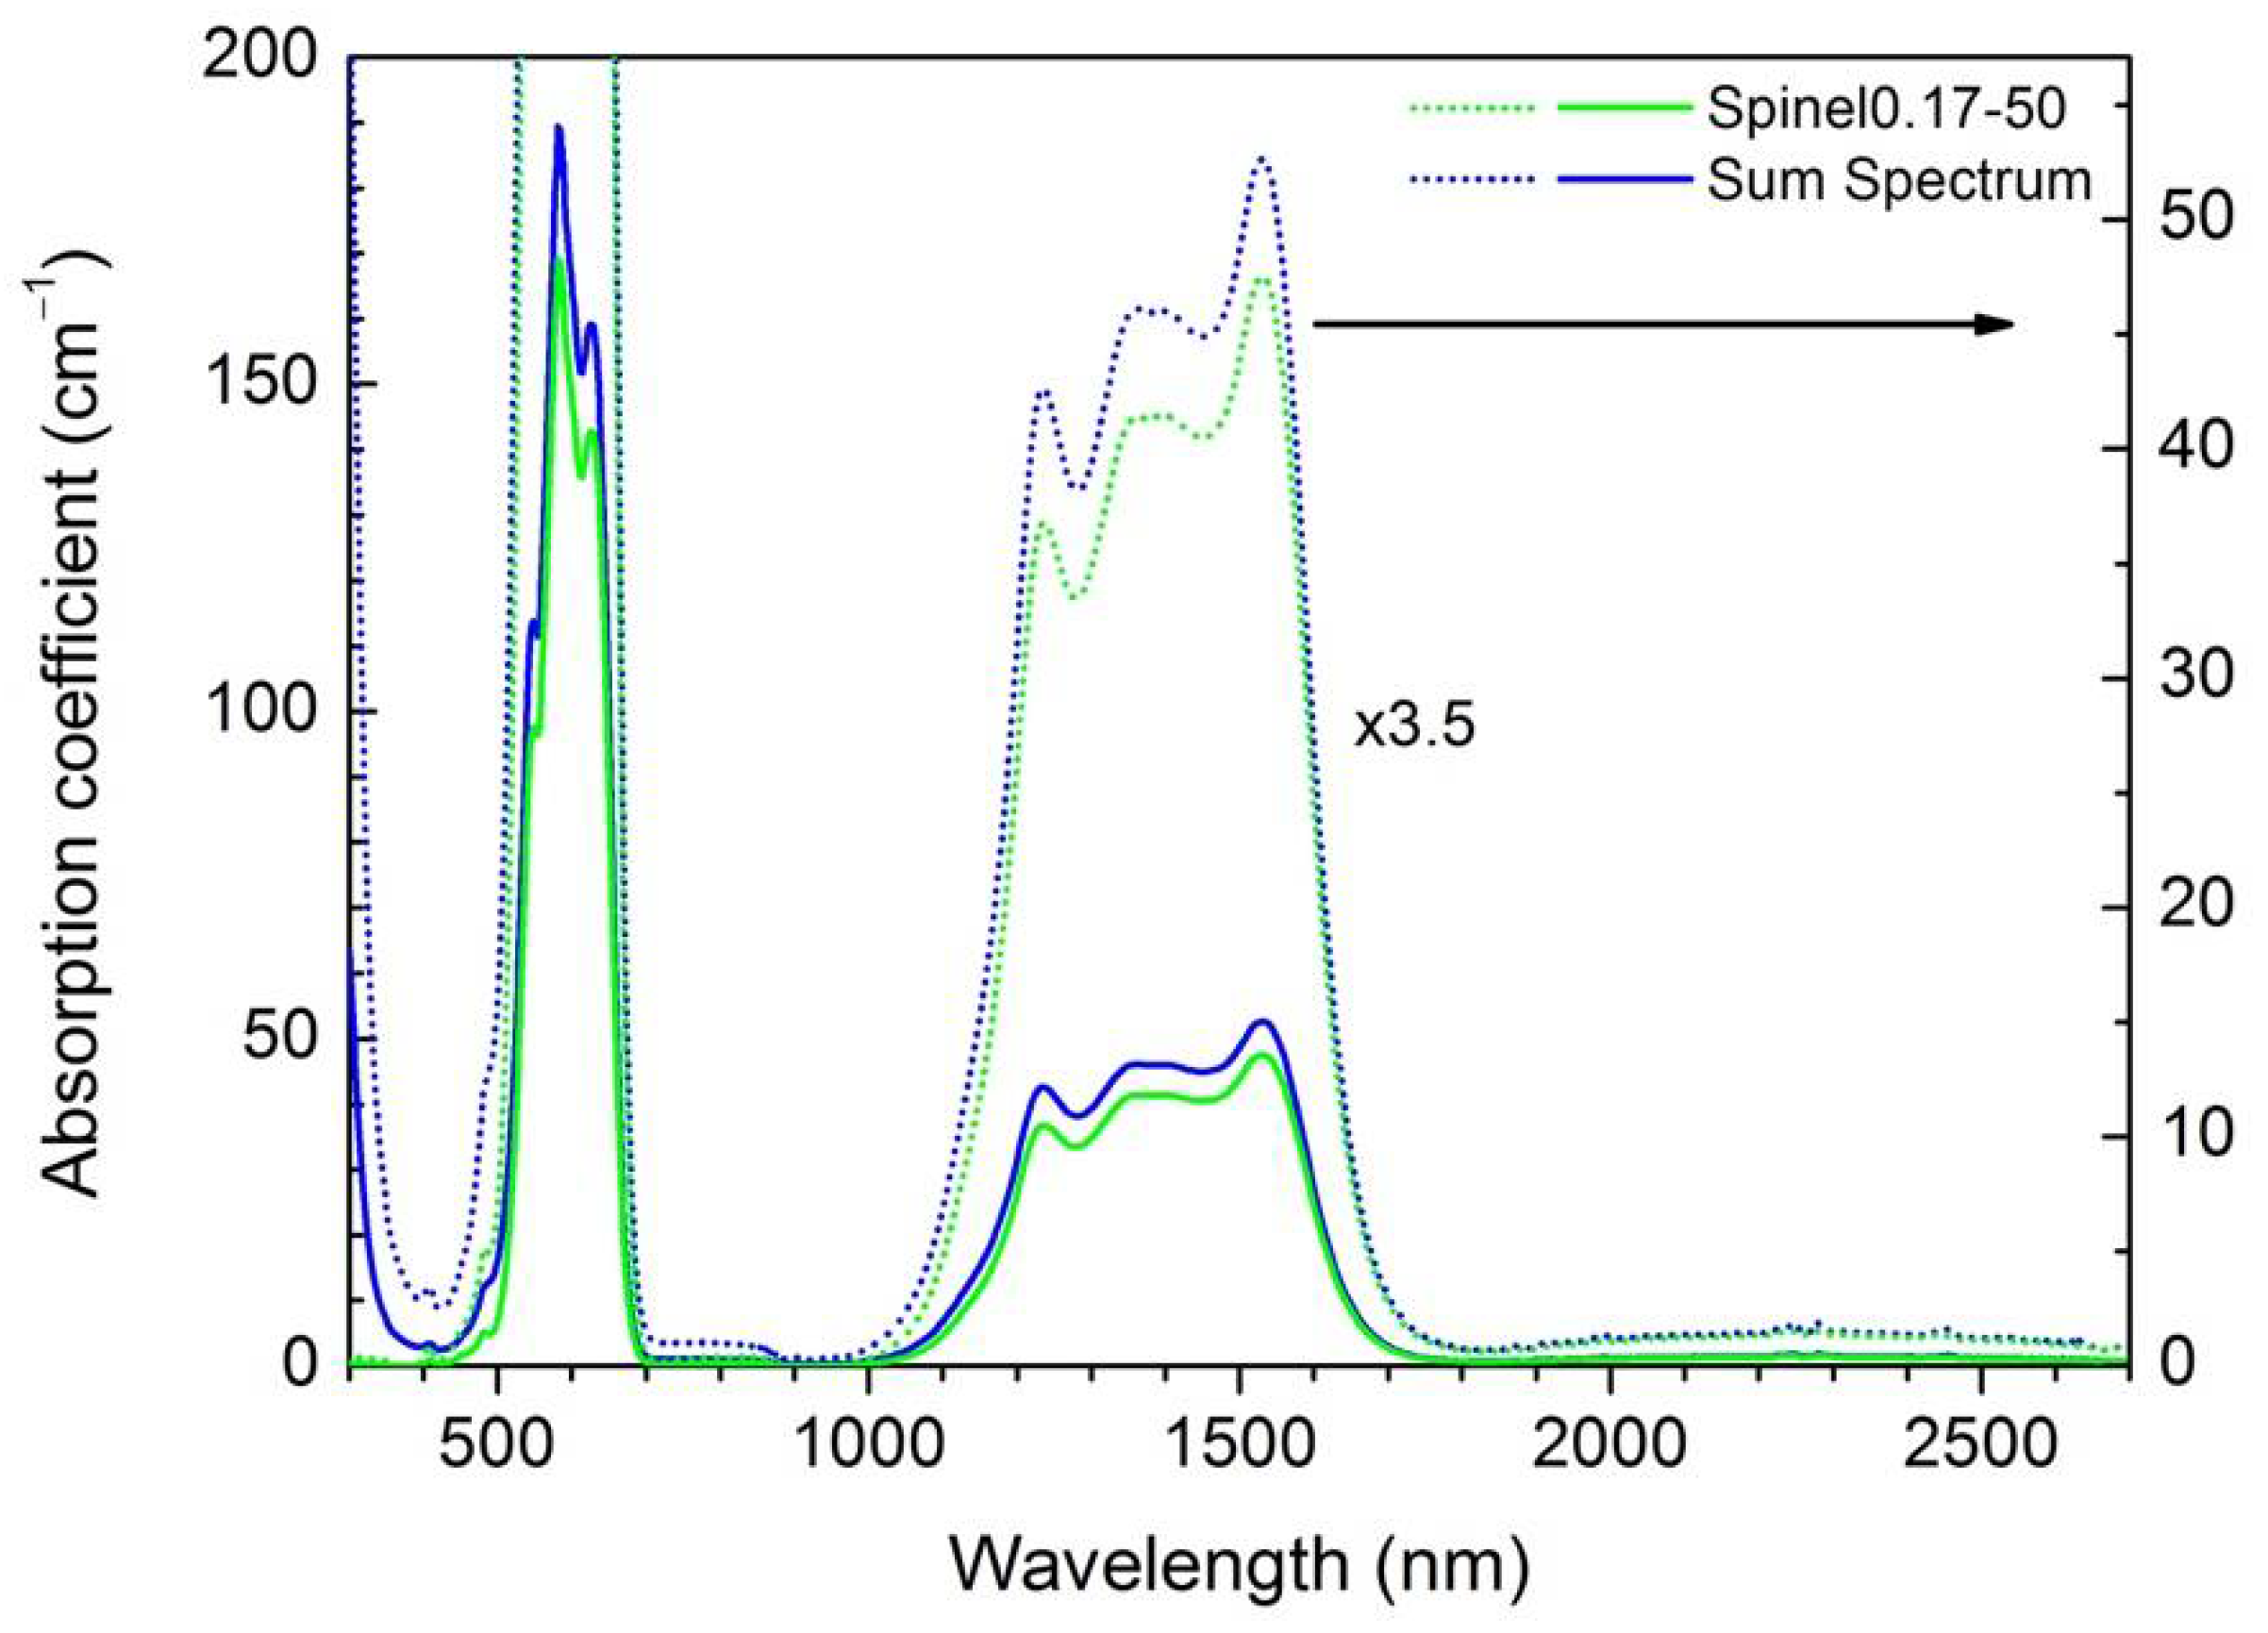
The absorption cross sections can be estimated by calculating the absorption coefficient per Co ion in the sample, α/NCo, where α is the absorption coefficient in cm−1 and NCo is the concentration of Co2+ ions in ions/cm3 in the respective crystals. This is an approximation as long as we do not know for sure the proportion of Co2+ ions sitting in tetrahedrally coordinated sites in MgAl2O4, but according to the literature [27,28] it is the vast majority of cobalt introduced in the spinel. The absorption cross-section in the NIR band amounts to 2.7 × 10⁻¹⁹ cm2 at 1528 nm in MgAl2O4:Co and to 5.8 × 10⁻²¹ cm2 at 1180 nm in MgO:Co. At 1180 nm, the value for MgAl2O4:Co is 1.1 × 10⁻¹⁹ cm2. Even if five times more Co2+ ions were located in MgO inside the eutectic samples, only 20% of the absorption at 1180 nm would be due to cobalt in MgO. Moreover, the bandwidth is around two times larger (in nm) in MgAl2O4, the band is red-shifted and structured. In fact, the weighed sum spectrum given in Figure 7, calculated with cobalt concentrations in each phase corresponding to sample Co0.48-750, is essentially the same as the spectra measured in Spinel0.17-50 (green lines in Figure 7).
A third absorption farther in the IR is also observed in MgAl2O4:Co (Figure 6), with the maximum around 2270 nm and absorption cross-section of 8 × 10⁻²¹ cm2 at room temperature. This is due to the transition 4A2(F) to 4T2(F), electric dipole is forbidden, hence its low absorption cross-section. This band is similar to the one observed in (Mg1−xCox)Al2O4 solid solutions by Bosi et al. [27].
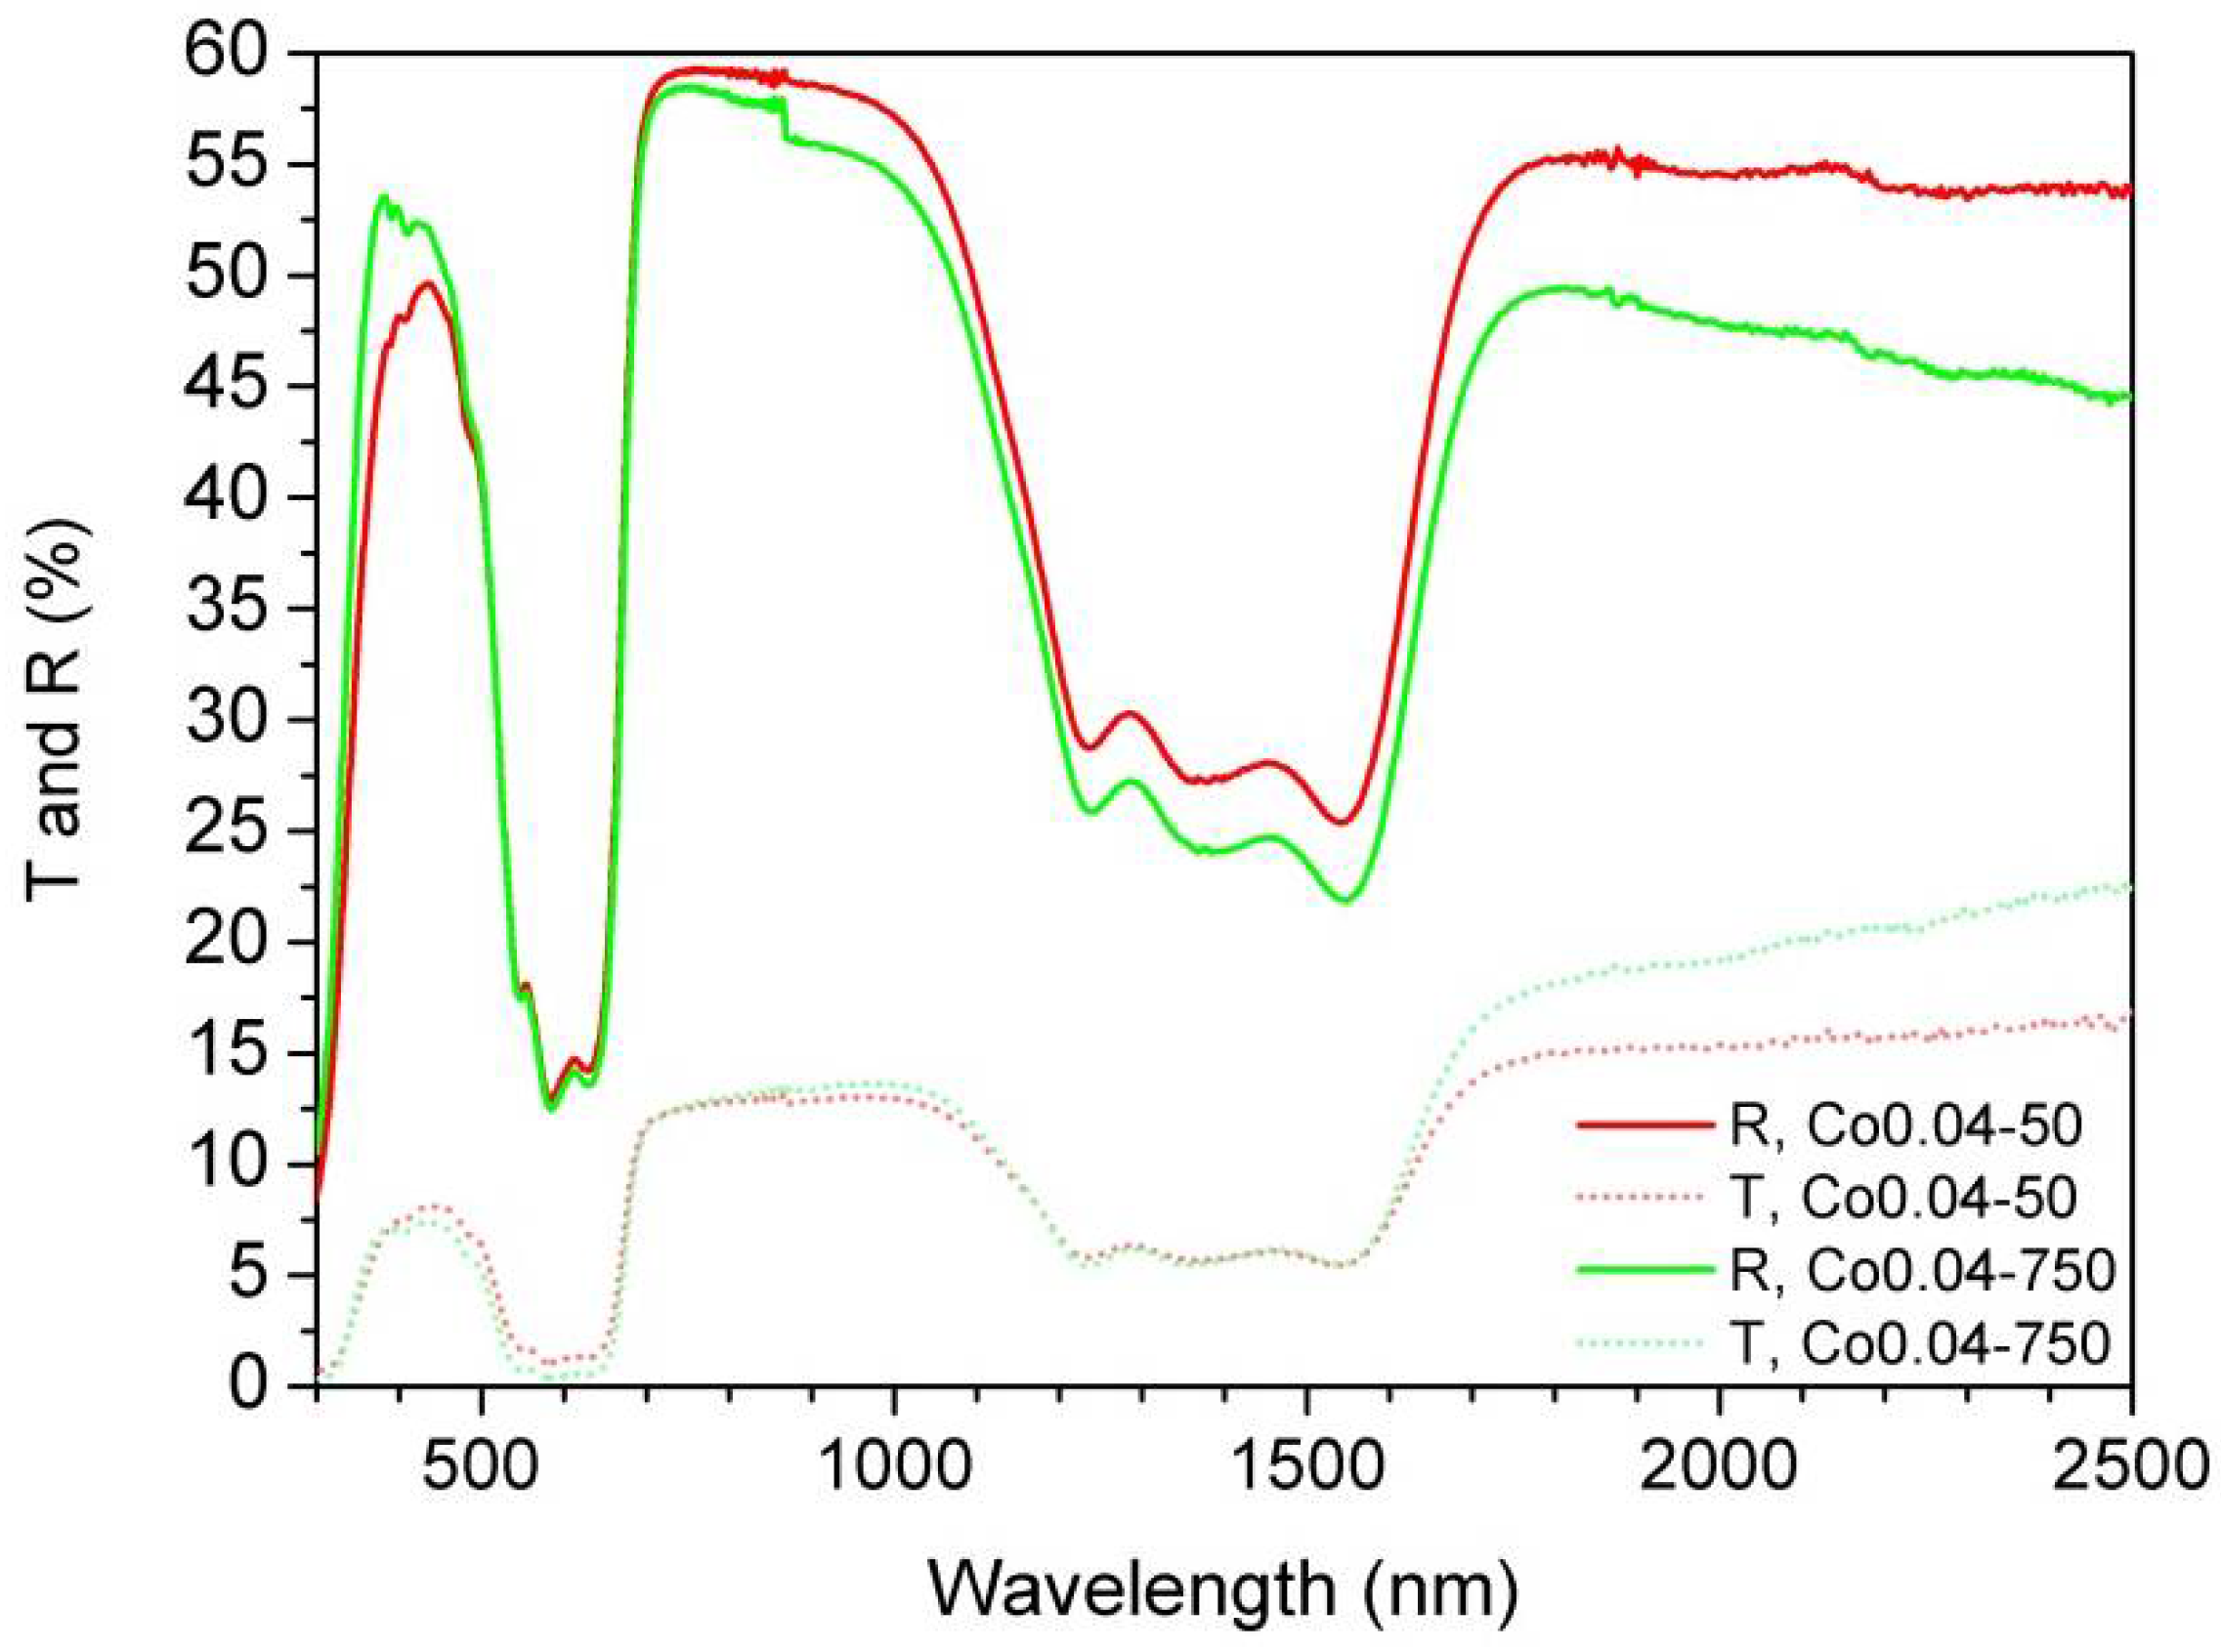
Measured directional-hemispherical reflectance and transmittance of the samples with the least cobalt content grown at 50 and 750 mm/h are given in Figure 8. Note first that the material is not opaque, although transmittance is smaller than reflectance. Non-zero transmittance is expected as the refractive index contrast between MgO and MgAl2O4 is relatively small. The structured absorption bands due to Co2+ in MgAl2O4 at around 590 nm and 1400 nm give rise to bands of diminished reflectance and transmittance with respect to their background. There is no evidence of the band around 2300 nm, which is a consequence of its small absorption coefficient and the low dopant content of these samples. Absorption is also present at the short wavelength edge as one approaches the transmittance cut-off of the material. For higher dopant content (not shown), all bands are deeper and the one at the long wavelength shows up.
Outside the absorption bands, the transmittance and reflectance backgrounds show an approximate linear dependence with wavelength. As the wavelength increases the measured reflectance decreases and the transmittance increases. These trends are stronger for the samples solidified at 750 mm/h than for the samples solidified at 50 mm/h (with coarser microstructural features). This is the consequence of smaller scattering and increased transmittance as the microstructure size decreases, and which is expected from the microstructural data given above. This behavior is different to the one observed before in undoped samples, with a 1 mm diameter, from in-line transmission measurements [18]. In that work, the samples grown at 50 mm/h solidified in the coupled regime without forming colonies, so that their microstructural size was, in fact, smaller than in samples solidified at larger pulling rates.
From Kirchhoff’s laws [29], the spectral directional emissivity of the material along the direction perpendicular to the rod-axis equals the directional-hemispherical absorptance. Absorptance (A) is calculated, by energy conservation, as A = 1 − R − T, with R being the directional-hemispherical reflectance and T the transmittance. The measured values, named Rm and Tm in the following, are not the real T and R. This is evident from Figure 8, as outside the absorption bands, for example at long wavelengths or at 800 nm where there is no absorption in this very low-doped samples, Rm + Tm do not add to give 1. This is most probably a consequence of integrating sphere measurements for small samples with cylindrical shape. Some of the reflected or transmitted intensity emerges from the sample, backward or forward scattered, respectively, at angles which are not collected by the integrating sphere. We will assume that R and T are related to Rm and Tm by a factor, which is a good approximation in the case of uniform reflectance or transmittance. Note that as a reference white diffuse surface we have used a flat Halon reference. The values of the proportionality factors were estimated as follows. First, Rm and Tm for each sample were normalized to give 1 at a wavelength of 850 nm, where there is virtually no absorption. This corrects difference in sample position among measurements.
Then, the absorptance is estimated as:
where fr and ft are found by trial and error to obtain an A curve for sample Co0.04-50 with flat A ≈ 1 at long wavelengths. These are fr = 0.781 and ft = 0.219 and were used to evaluate A for all the samples. As cross-check, for sample Co0.04-750, a flat A ≈ 1 background results at long wavelength, as expected. For the other samples the absorption band around 2300 nm begins to become evident. The directional emissivity (or emittance, as it is a volume-dependent property) is estimated as
A = 1 − fr Rnorm − ft Tnorm,
ε = A = 1 − fr Rnorm − ft Tnorm.
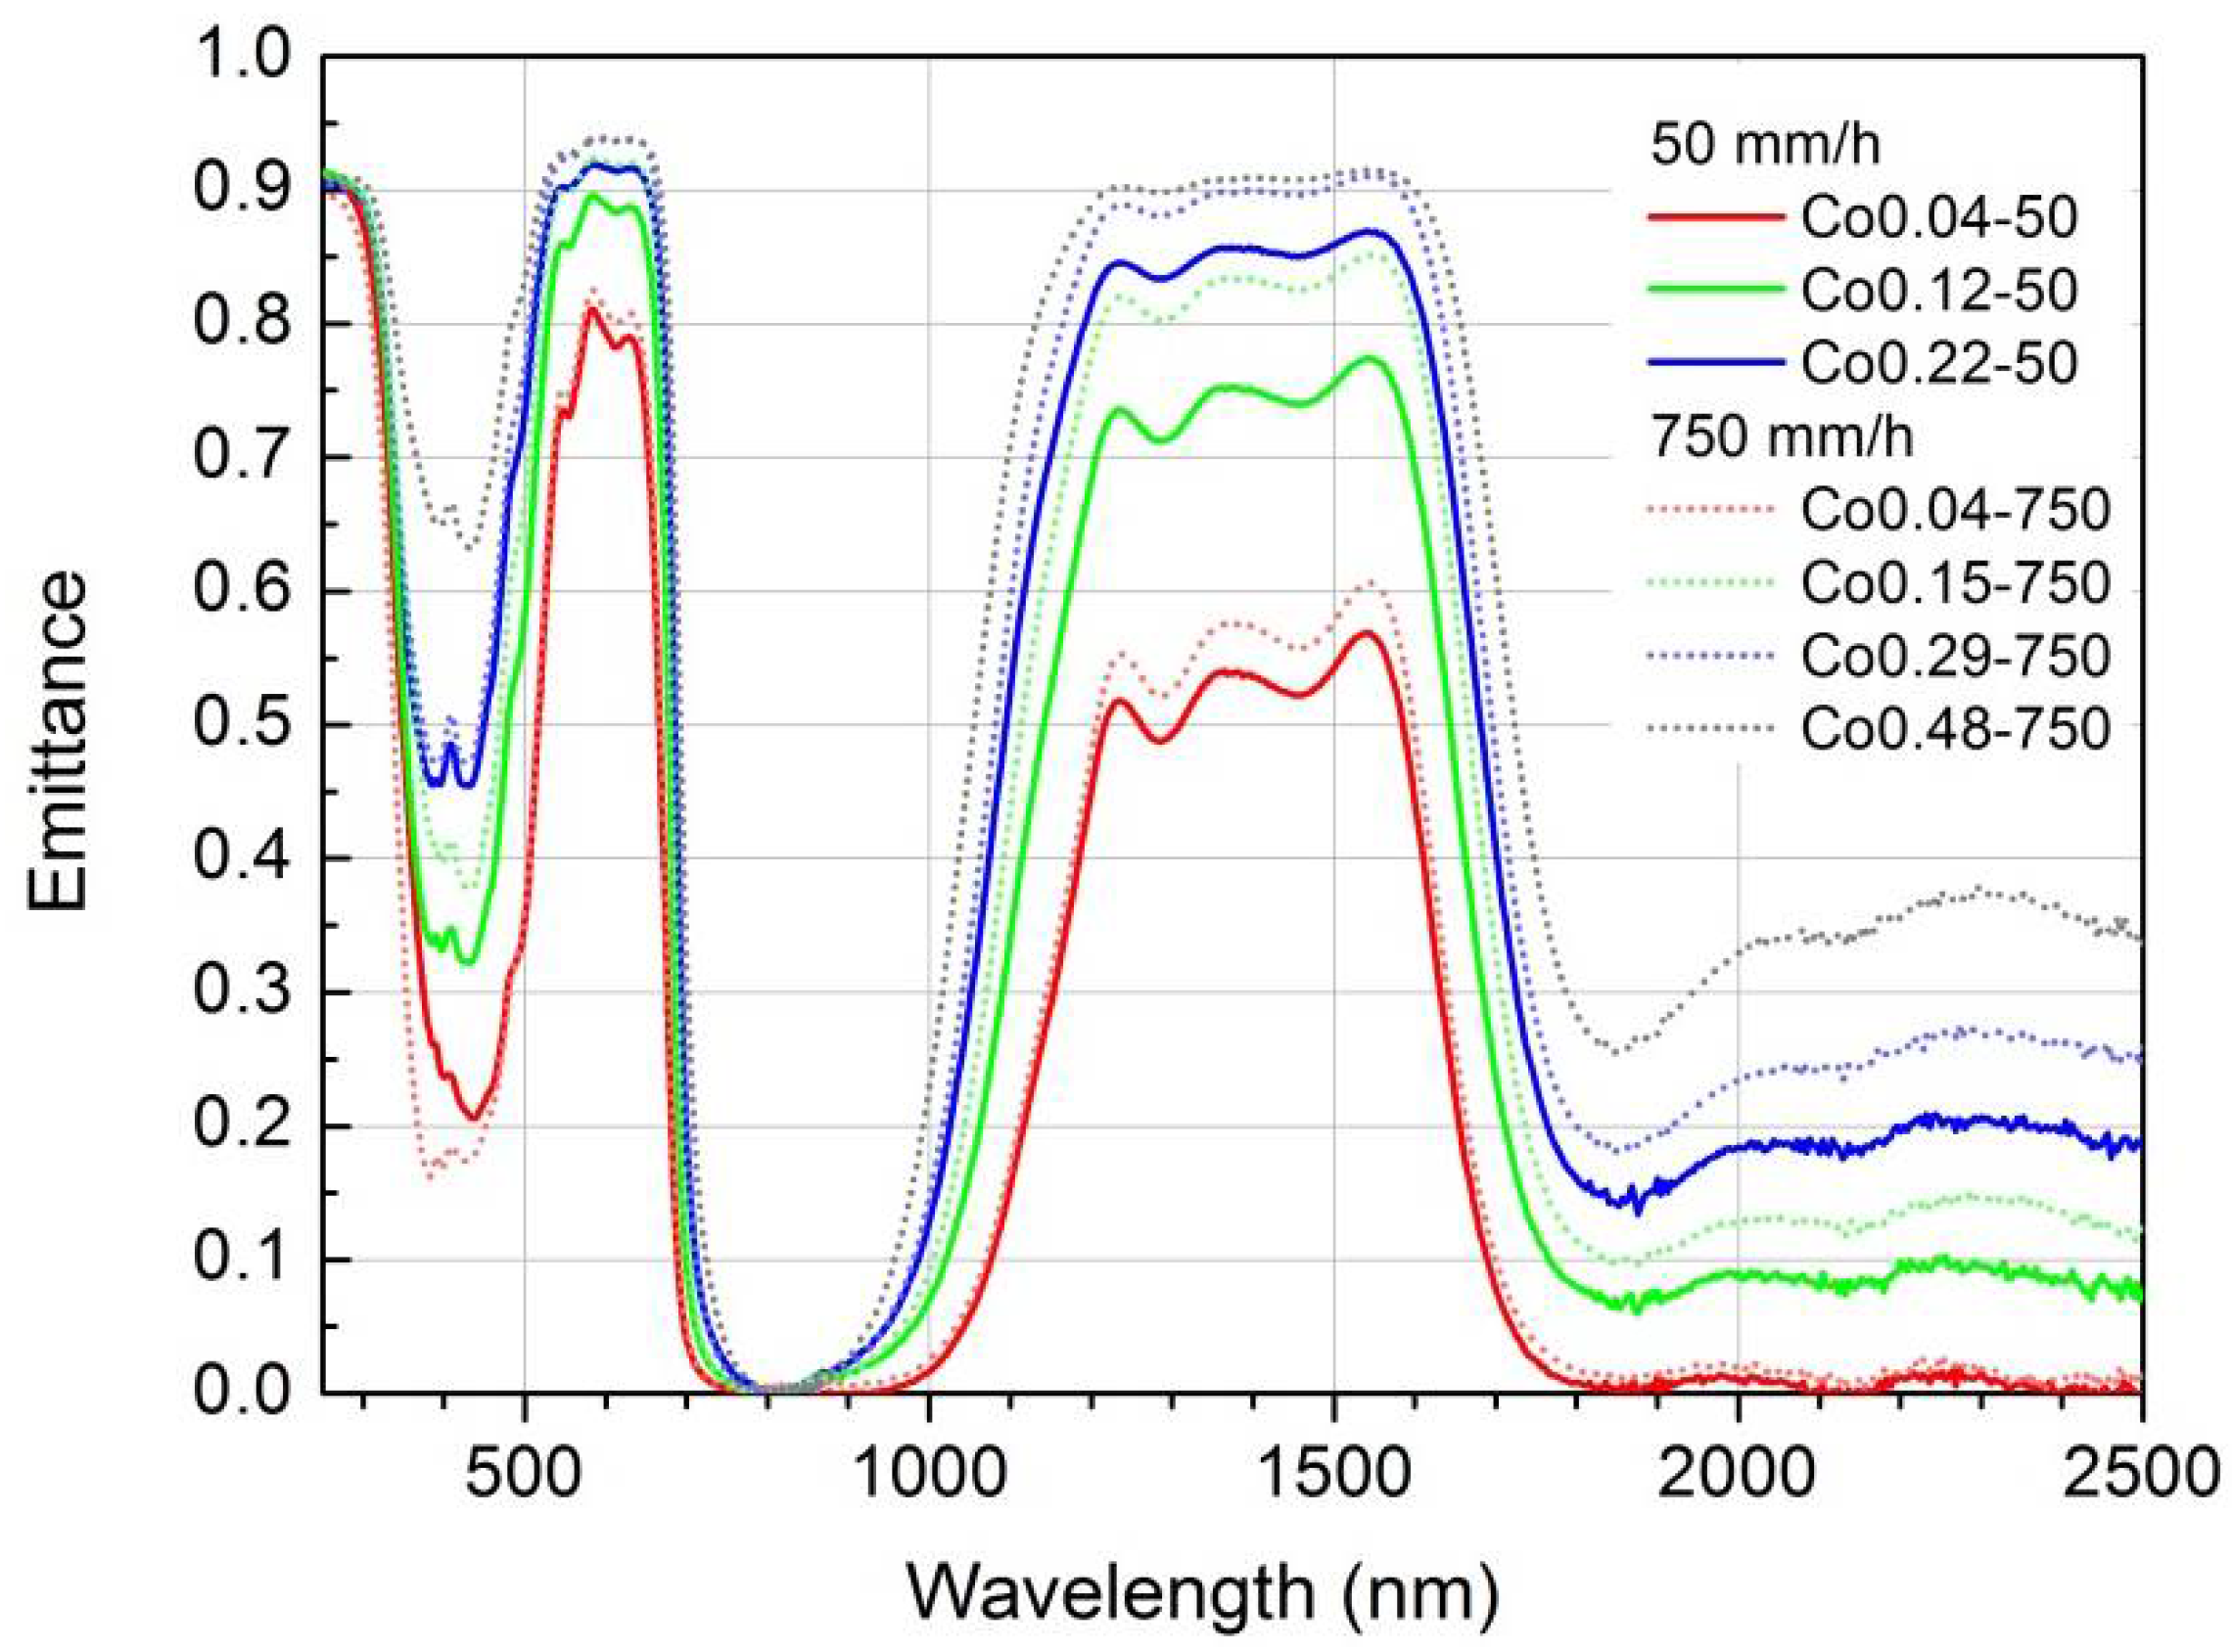
The estimated directional emittances of the different eutectic samples are given in Figure 9. In the spectral range of interest, around 1500 nm, the emittance at RT is higher than 0.5 for all the compositions. As the cobalt content increases, the emittance at 1500 nm saturates and the emittance at 2400 nm increases almost linearly. Consequently, the selectivity decreases severely.
4. Discussion
From the results presented above for the emittance at RT (Figure 9) and at 1300 °C (calculated as thermal emission divided by the blackbody profile, Figure 3b), we can observe that the band maxima shift to longer wavelengths at high temperature, as illustrated above and ascribed to the crystal thermal expansion. Added to that, the spectral bandwidth of the emittance is larger at high temperatures. For example, for sample Co0.04-50, the full width at half maximum (FWHM) at RT is 2680 cm−1, while at 1300 °C one finds values up to 3400 cm−1. Assuming that we are far enough from saturation for this cobalt content (small absorption) these widths are near to the spectral bandwidths of true absorption bands, thus being 13 to 30% wider at 1300 °C than at room temperature. Such broadening is usual for 3d ions, as they present large electron–phonon coupling that mediates the shape of the absorption bands [30]. As a first approximation, the oscillator strength of the absorption band is independent of temperature, such that if the FWHM increases, its peak absorption decreases, and we can assume that the absorption coefficient at the band maximum could be from 13 to 30% smaller at 1300 °C than at RT. We can therefore conclude that the emittance at high temperatures associated to the cobalt dopant might be from 0.9 to 0.7 times that at RT for low dopant concentrations, slowing down slightly the increase as cobalt content increases. Another difference between absolute emittance values of the intense NIR band at RT and 1300 °C may arise from the known increase of the inversion parameter with temperature. Estimates for the present samples, as shown in Appendix A, would add an extra factor around 0.84, a smaller emittance at 1300 °C. At high enough cobalt content, emittance saturates at the maximum emittance, which for these samples is around 0.93, due to the reflectance at the external surface.
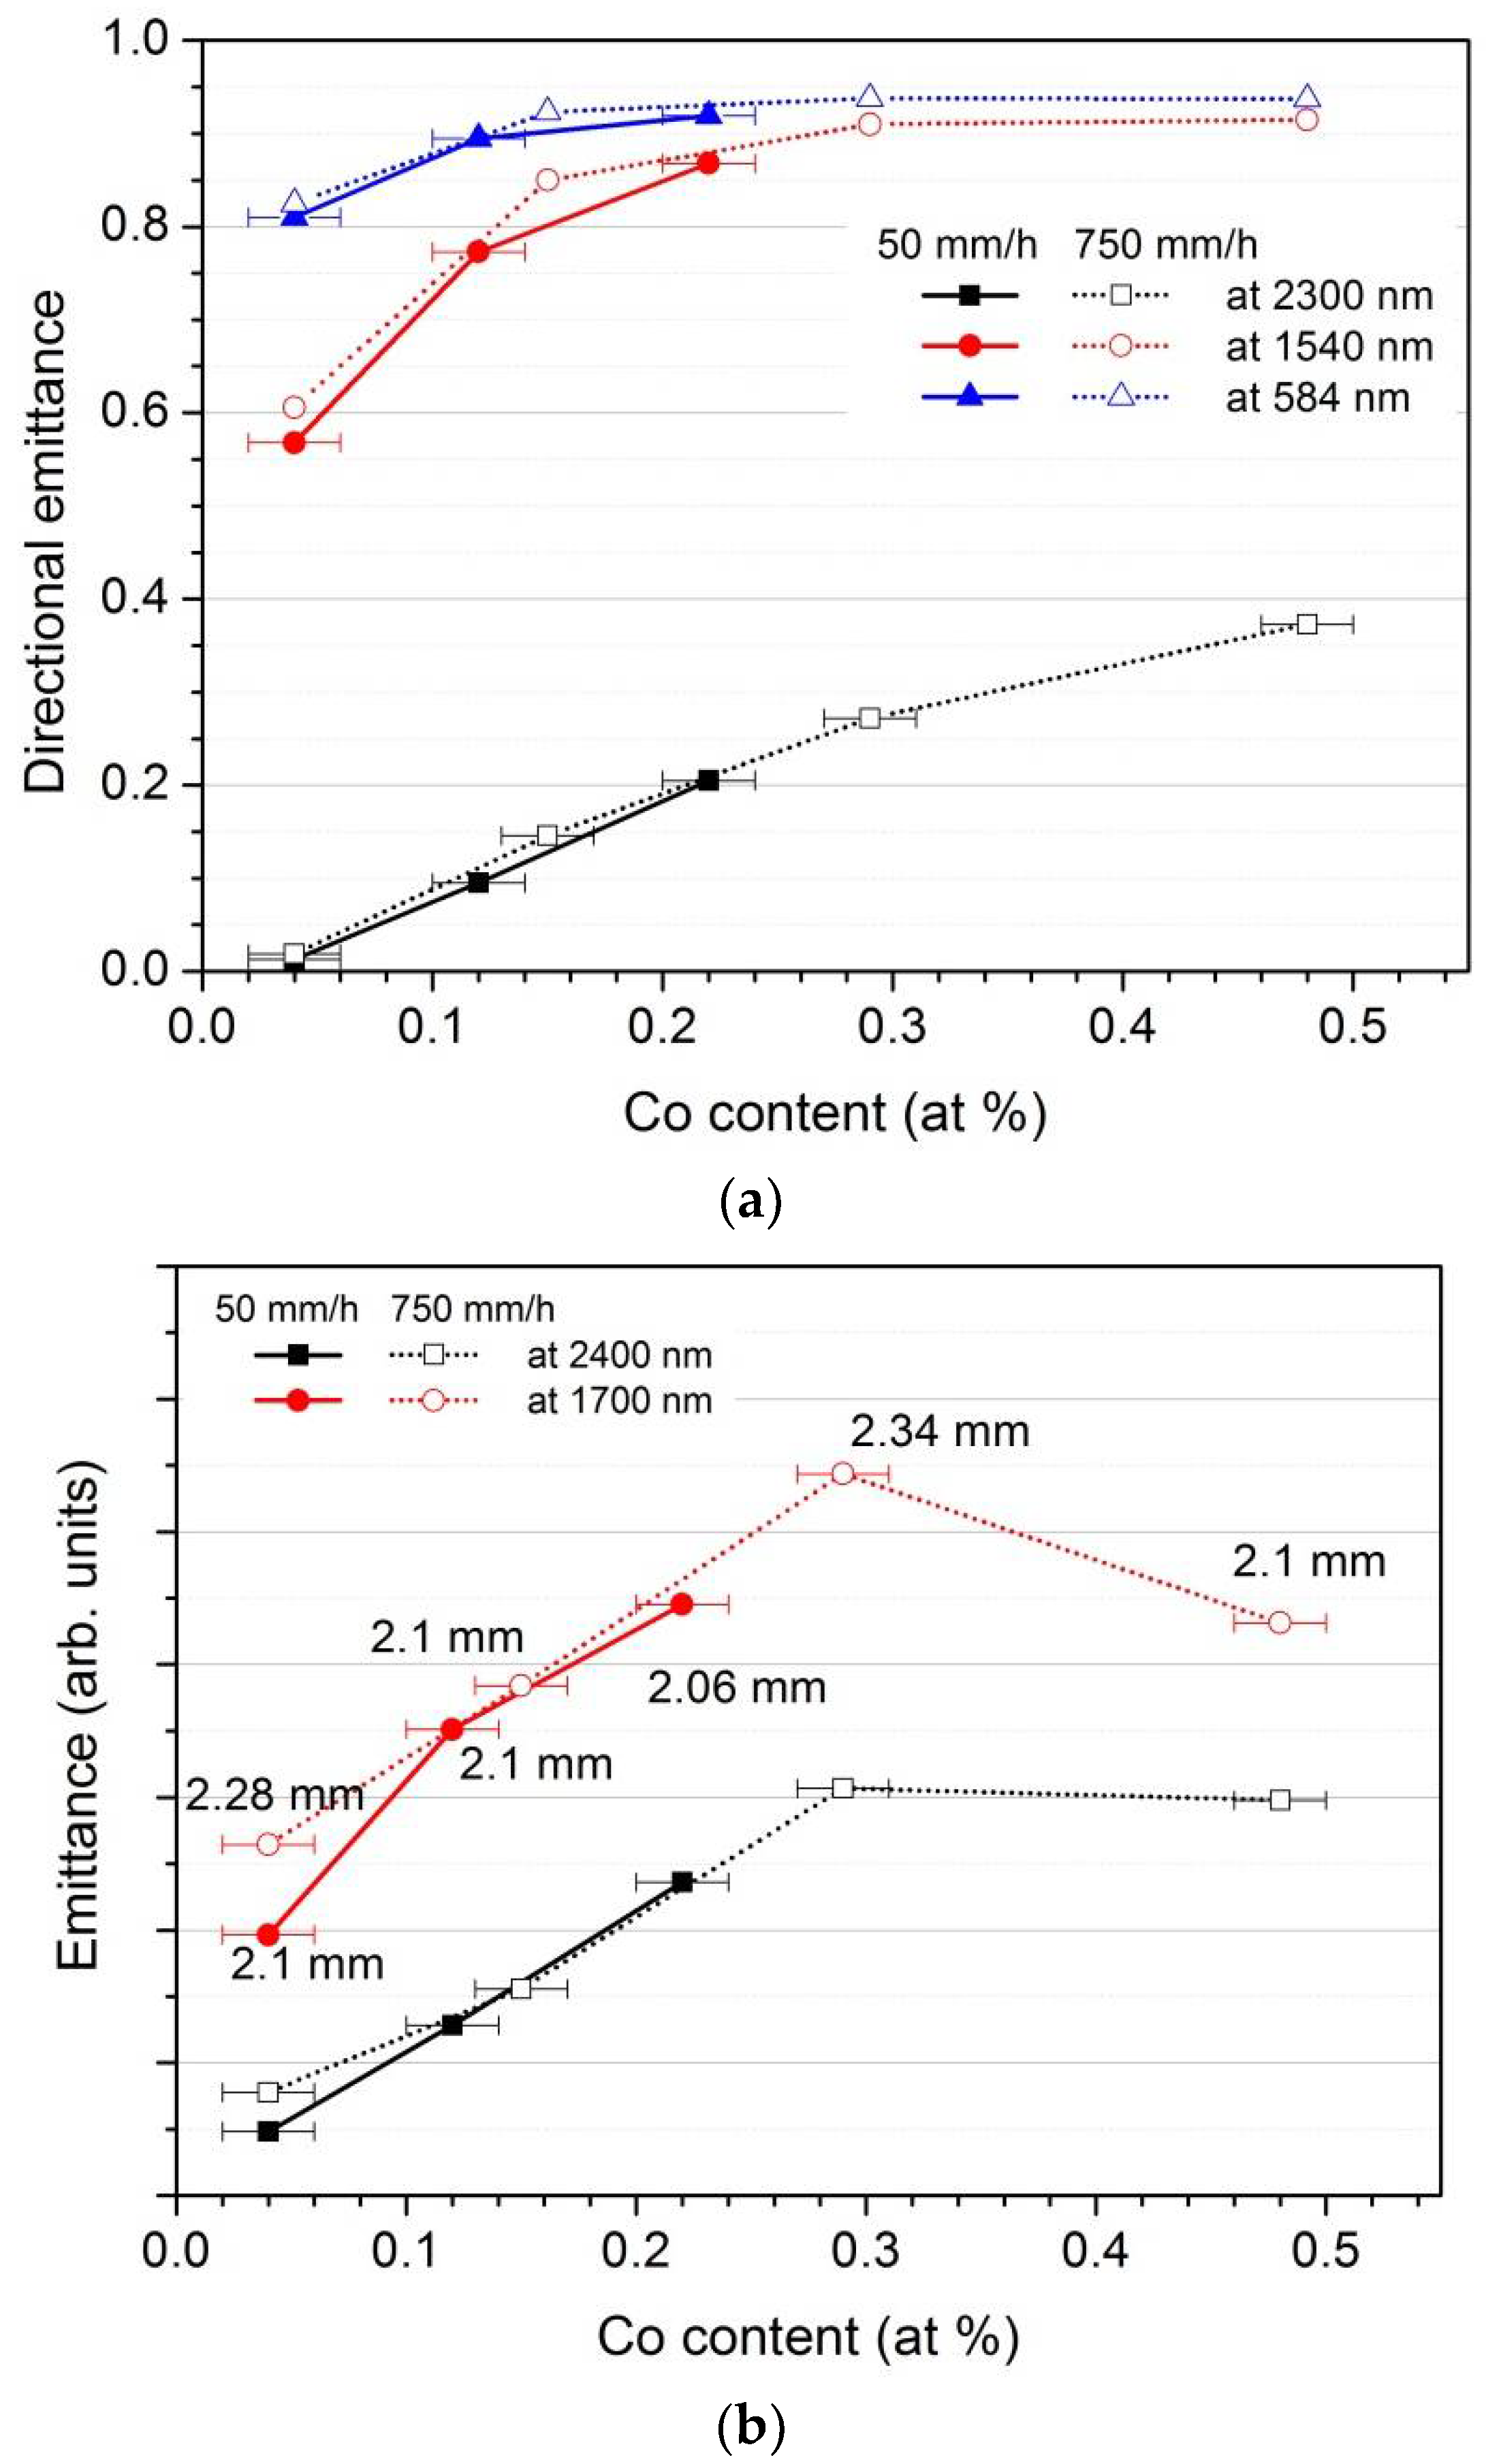
The dependence of the emittance with cobalt content at selected wavelengths is plotted in Figure 10a for both processing rates. The emittance depends very slightly on the microstructure, if any, with slightly higher values for the samples solidified at 750 mm/h. On the contrary, it is determined by the cobalt concentration. This is also true for the emittance estimated from the thermal emission measured at 1300 °C (Figure 10b). In the measurements at high temperature the data have a larger scatter, as they are sensitive to misalignment or sample diameter. The actual diameter of the sample on which the given data were measured is written on the plot. The figures highlight the same overall trend for the RT and high temperature emittances. The emission at 1500 nm shows a saturation behavior while the emission at 2400 nm increases more or less linearly up to around 0.3 at% Co in the samples. However, a clear difference in the relative values between both spectral ranges and temperatures is observed.
If we take as a quantitative reference the saturation value of the 1500 nm band, it is evident that the emittance at 2300–2400 nm is higher at 1300 °C than at RT. From the above given absorption spectra, the absorption cross-section of cobalt-doped spinel at 2300 nm is ≈8 × 10⁻²¹ cm2, corresponding to the transition 4A2(4F) to 4T2(4F). This is a very weak absorption as the transition is electric dipole forbidden. Using level positions as given by Bosi [27], the transition of 4T2(4F) to 4T1(4F) is expected at wavelengths from 2250 nm to 4470 nm at RT (and around 500 cm−1 red shifted at 1300 °C, as observed for the 1500 nm transition), that is, it would overlap to the electric dipole forbidden transition. This one is electric dipole allowed; therefore, one can expect an absorption cross section similar to the ones observed for the allowed transition of 4A2 to 4T1(4F), that is, from the above given data, around a 35 times larger absorption cross section than the absorption from 4A2 to 4T2(4F). The 4T2(4F) levels are located around 3800 to 4900 cm−1 above the 4A2 ground state, so that at 1300 °C, Boltzmann statistics tells us that they are populated from 3 to 1%. That is, absorption cross-sections from 30 to 100 times the one of the forbidden 4A2 to 4T2(F) as estimated above, this would give rise to a comparable absorption. Therefore, both transitions contribute to the long-wavelength band at 1300 °C. This contribution can explain the higher thermal emission at long-wavelength than the emittance estimated at room temperature in the same spectral range. This, together with the expected small decrease of absorption coefficient at the maximum (around 1700 nm) due to thermal broadening, contributes sensibly to a smaller selectivity of the thermal emission than the expected one from RT data. Note that other bands in the region 800 to 1000 nm, corresponding to transitions between 4T2(4F) and 4T1(4P), can also appear at high temperatures [26].
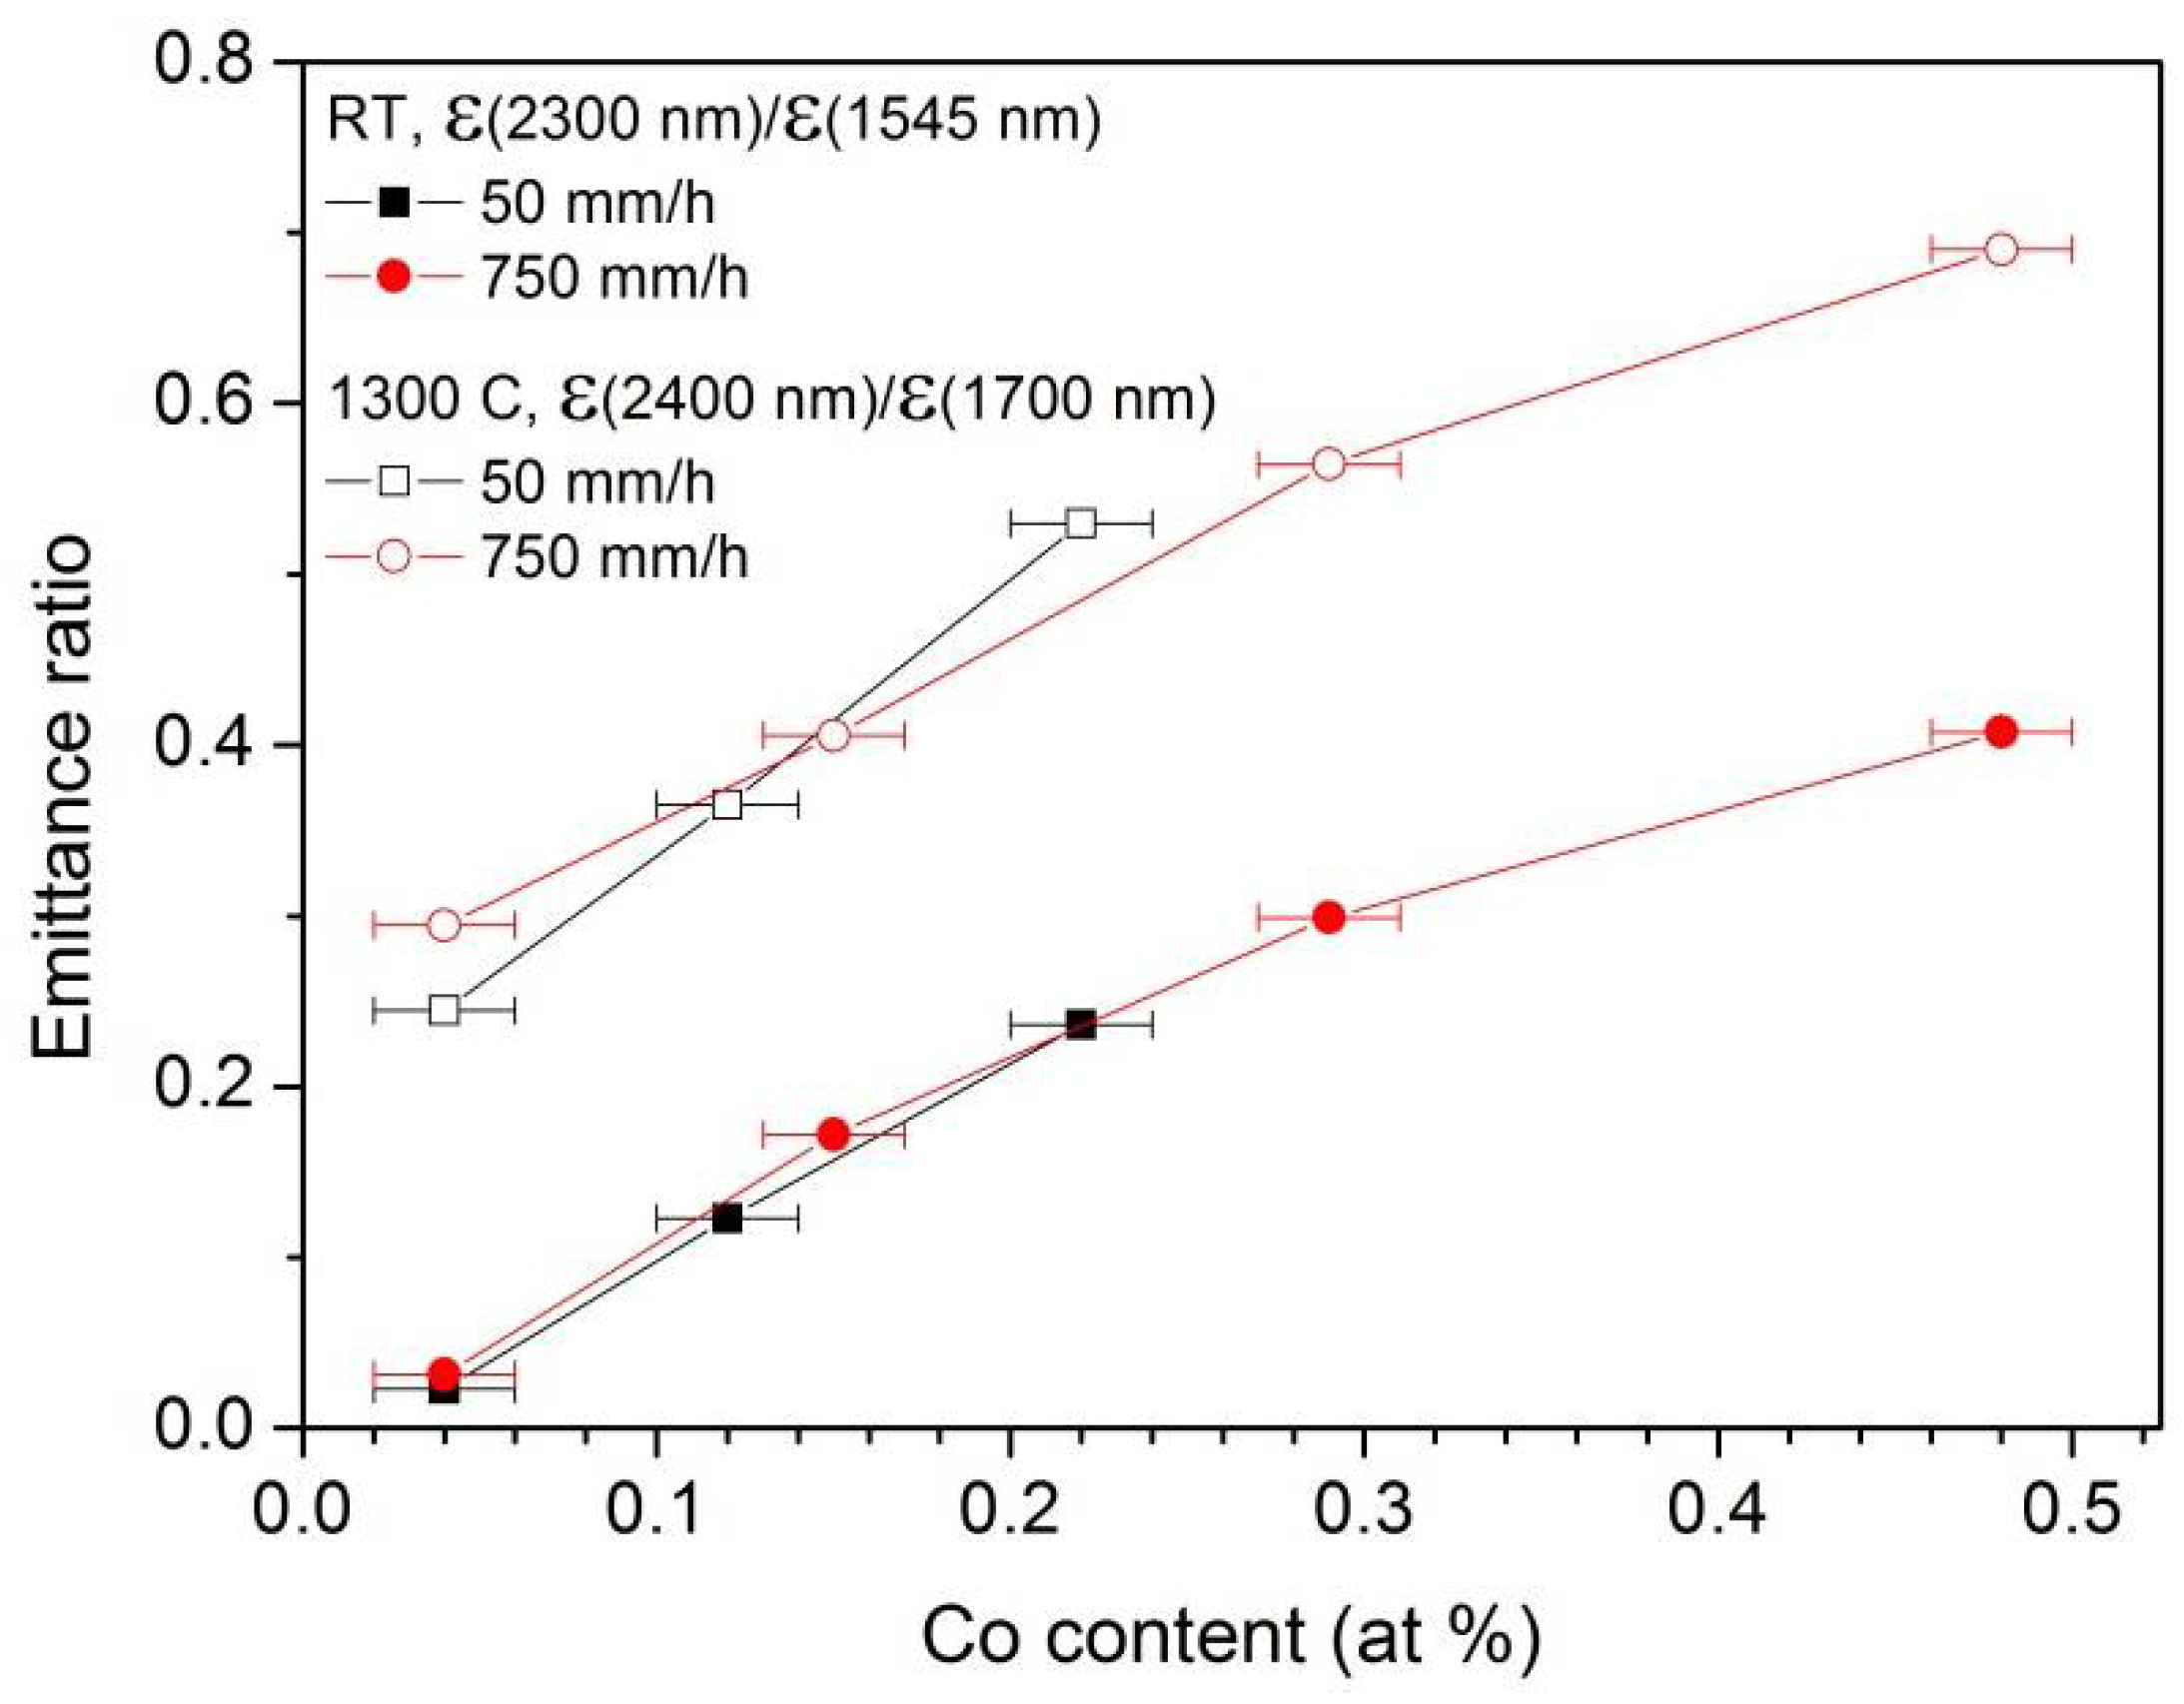
The different selectivity at different temperatures is clearly seen in Figure 11, where the ratio of the emittance out of the band vs the emittance at the maximum of the band at RT and at 1300 °C is given. Selectivity is higher the smaller the Co content. Nevertheless, for practical purposes, a compromise between selectivity and appropriate values of emittance should be taken. Note also that no matter how much we diminish the cobalt content, selectivity does not grow indefinitely at high temperatures (the shown ratio does not go to 0). Other contributions to thermal emission might be present.
5. Conclusions
In this work, cobalt-doped MgO-MgAl2O4 2 mm diameter rods with a eutectic microstructure have been successfully solidified by means of the LFZ technique at 50 mm/h and 750 mm/h. The emittance at RT and the thermal emission between 1000 and 1500 °C have been studied as a function of the microstructure and the cobalt content. The main conclusions are as follows:
- -
- Most of the cobalt was introduced in the material sites in the MgO phase. Around 30% of Cobalt located in the MgAl2O4 phase is responsible for the optical properties of the material which are relevant to the thermal emission, due to the much larger optical activity of cobalt in tetrahedrally coordinated sites.
- -
- The materials have a high emittance band around 1500–1700 nm, even for low cobalt ion concentration, which would make the material appropriate as selective emitter for thermophotovoltaic systems based on InGaAs detector. Very low cobalt concentration (0.04% at Co; 0.2 wt % CoO) is enough to produce emittances above 0.5 at 1.5 µm.
- -
- However, the multiple levels of Co2+ in tetrahedral coordination diminish the selectivity further at high temperatures and higher cobalt content. Low intense electric dipole forbidden transitions show up in emittance and thermal emission spectra at lower energies than the useful emission band as the cobalt concentration increases. Added to that, other radiative transitions involving the first excited state to higher levels may also contribute at high temperatures.
- -
- The microstructural size is not relevant to the thermal emission properties.
- -
- To conclude, as a selective emitter, the cobalt content in the eutectic composite must be kept to a low level in order to avoid selectivity loss. With this limitation, the peak emissivity a 1700 nm remains at 0.6.
Author Contributions
Methodology, all authors; validation, all authors; investigation, all authors; writing—original draft preparation, P.B.O. and R.I.M.; writing—review, all authors; funding acquisition, P.B.O., R.I.M. and J.I.P. All authors have read and agreed to the published version of the manuscript.
Funding
This research was funded by the Spanish Ministerio de Economía, Industria y Competitividad (MINECO) and the CE (FEDER FUNDS), grants number MAT2013-41045-R-EMITEME and MAT-2016-77769R-FLASCERAMAT. The Departamento de Ciencia, Universidad y Sociedad del Conocimiento del Gobierno de Aragón also contributed through the financial support to the Research Group T02-20R. B.M.M. wants to acknowledge the support of the Spanish MINECO by means of a “Juan de la Cierva- Incorporación” fellowship during her sabbatical stay in Zaragoza. D.S. thanks the PIT2 program of the University of Murcia´s own research plan.
Institutional Review Board Statement
Not applicable.
Informed Consent Statement
Not applicable.
Data Availability Statement
The data presented in this study are available on request from the corresponding author.
Acknowledgments
Authors acknowledge the use of Servicio de Microscopia Electrónica (Servicios de Apoyo a la Investigación), Universidad de Zaragoza. The authors also wish to thank Víctor M. Orera for providing the Co-doped MgO single crystals.
Conflicts of Interest
The authors declare no conflict of interest.
Appendix A. Tetrahedrally and Octahedrally Coordinated Co2+ Ions in Mg1-yCoyAl2O4 Spinel
It is well known that antisite defects in CoAl2O4 or MgAl2O4 spinels consisting of Co and Al changing crystallographic sites occur. This disorder is normally quantified with an inversion parameter, x, where 1 − x is the fraction of Co or Mg ions in the tetrahedral site. It is also well known that the inversion parameter increases with temperature. Since the optical activity of Co2+ depends strongly on the crystallographic site, this disorder includes another temperature-dependent contribution to the emittance.
At high temperatures the x value corresponding to thermodynamic equilibrium is reached in a very short time, while the x value of the crystals at room temperature is very much dependent on their thermal history. The crystals used in the present work reach temperatures below 600 °C from the melting temperature in a relatively short time. Very roughly, this time can be estimated to be some minutes. This cooling down in the air from the solidification temperature presumably quenches the spinel to inversion parameter values corresponding to equilibration temperatures well above 850 K. In fact, according to Redfern et al. [31], who use 40 min annealing times, MgAl2O4 spinels start to reach equilibrium at around 1123 °C, while He et al. [32] find the equilibrium relaxation time (τ) in CoAl2O4 spinels is 50 min at 700 °C. Following He, if we assume that the present samples cool to temperatures below 600 °C in less than 6 min, equating this time to τ, the x values of the samples we have studied at room temperature could correspond to values equilibrated near to 730 °C, or x ≈ 0.16 for MgAl2O4. At 1300 °C, x ≈ 0.29 in MgAl2O4. Similar values may be taken for CoAl2O4 [33]. With these numbers, the concentration of tetrahedrally coordinated Co2+ (Co[T]) is at 1300 °C 0.84 times the value of the one of the samples at room temperature. Correspondingly, the concentration of Co2+ in octahedral sites (Co[O]) would increase by a factor of 1.8.
The emittance values at the band maxima estimated from RT measurements and associated to Co[T] species have to be diminished, taking into account the smaller Co[T] values, at least for low concentrated samples, diminishing the initial slope of the emittance vs. total cobalt concentration. This inversion adds to the other temperature-dependent contributions, such as band broadening.
The effect of the increase of the amount of Co[O] is irrelevant, as the optical activity is mainly determined by Co[T]. The absorption bands Co[O] in cobalt-doped spinels at RT are expected in the long wavelength tail of the VIS band associated to Co[T] and another one at higher energies, according to the O-Co[O] bond lengths being longer in the spinel crystals than in MgO:Co. In the measured absorption spectra of the cobalt-doped spinel at room temperature (Figure 6b), with an estimated 16% Co[O], its contribution cannot be separated from the adjacent VIS band due to Co[T]. At high temperatures, band broadening would make band separation even worse, even if the concentration of Co[O] doubles. This effect of increased inversion, if any, would be akin to very slightly larger band broadening of the VIS band and its shifting towards longer wavelengths than the one expected from the sole temperature effects on the Co[T] bands. No extra contribution to the NIR is expected from the octahedrally coordinated Co2+ ions, as no absorption bands are expected in this region.
References
- Coutts, T.J. A review of progress in thermophotovoltaic generation of electricity. Renew. Sustain. Energy Rev. 1999, 3, 77–184. [Google Scholar] [CrossRef]
- Licciulli, A.; Diso, D.; Torsello, G.; Tundo, S.; Maffezzoli, A.; Lomascolo, M.; Mazzer, M. The challenge of high-performance selective emitters for thermophotovoltaic applications. Semicond. Sci. Technol. 2003, 18, S174–S183. [Google Scholar] [CrossRef]
- Guazzoni, G.E. High-Temperature Spectral Emittance of Oxides of Erbium, Samarium, Neodymium and Ytterbium. Appl. Spectr. 1972, 26, 60–65. [Google Scholar] [CrossRef]
- Diso, D.; Licciulli, A.; Bianco, A.; Leo, G.; Torsello, G.; Tundo, S.; De Risi, A.; Mazzer, M. Selective emitters for high efficiency TPV conversion: Materials preparation and characterisation. In AIP Conference Proceedings; American Institute of Physics: Melville, NY, USA, 2003; Volume 653, pp. 132–141. [Google Scholar]
- Chubb, D.L.; Pal, A.M.T.; Patton, M.O.; Jenkins, P.P. Rare Earth Doped High Temperature Ceramic Selective Emitters. J. Eur. Ceram. Soc. 1999, 19, 2551–2562. [Google Scholar] [CrossRef] [Green Version]
- Ghanashyam Krishna, M.; Rajendran, M.; Pyke, D.R.; Bhattacharya, A.K. Spectral emissivity of ytterbium oxide-based materials for application as selective emitters in thermophotovoltaic devices. Energy Mater. Sol. Cells 1999, 59, 337–348. [Google Scholar] [CrossRef]
- Nakagawa, N.; Ohtsubo, H.; Waku, Y.; Yugami, H. Thermal emission properties of Al2O3/Er3Al5O12 eutectic ceramics. J. Eur. Ceram. Soc. 2005, 25, 1285–1291. [Google Scholar] [CrossRef]
- Mesa, M.C.; Oliete, P.B.; Merino, R.I.; Orera, V.M. Optical absorption and selective thermal emission in directionally solidified Al2O3-Er3Al5O12 and Al2O3-Er3Al5O12-ZrO2 eutectics. J. Eur. Ceram. 2013, 33, 2587–2596. [Google Scholar] [CrossRef]
- Oliete, P.B.; Mesa, M.C.; Merino, R.I.; Orera, V.M. Directionally solidified Al2O3-Yb3Al5O12 eutectics for selective emitters. Sol. Energy Mater. Sol. Cells 2016, 144, 405–410. [Google Scholar] [CrossRef] [Green Version]
- Oliete, P.B.; Orera, A.; Sanjuán, M.L.; Merino, R.I. Selective thermal emission of directionally solidified Al2O3/Y3−xErxAl5O12 eutectics: Influence of the microstructure, temperature and erbium content. Sol. Energy Mater. Sol. Cells 2018, 174, 460–468. [Google Scholar] [CrossRef] [Green Version]
- Llorca, J.; Orera, V.M. Directionally-solidified eutectic ceramic oxides. Prog. Mater. Sci. 2006, 51, 711–809. [Google Scholar] [CrossRef]
- Ferguson, L.; Fraas, L. Matched Infrared emitters for use with GaSb TPV cells. AIP Conf. Proc. 1997, 401, 169–179. [Google Scholar] [CrossRef]
- Ferguson, L.G.; Dogan, F. A highly efficient NiO-Doped MgO matched emitter for thermophotovoltaic energy conversion. Mater. Sci. Eng. B 2001, 83, 35–41. [Google Scholar] [CrossRef]
- Ferguson, L.G.; Dogan, F. Spectral analysis of transition metal-doped MgO “matched emitters” for thermophotovoltaic energy conversion. J. Mater. Sci. 2002, 37, 1301–1308. [Google Scholar] [CrossRef]
- Sola, D.; Oliete, P.B.; Merino, R.I.; Peña, J.I. Directionally solidified Ni-doped MgO-MgSZ eutectic composites for thermophotovoltaic devices. J. Eur. Ceram. Soc. 2019, 39, 1206–1213. [Google Scholar] [CrossRef]
- Su, S.; Liu, Q.; Hu, Z.; Chen, X.; Pan, H.; Liu, X.; Wu, L.; Li, J. A simple way to prepare Co:MgAl2O4 transparent ceramics for saturable absorber. J. Alloys Compd. 2019, 797, 1288–1294. [Google Scholar] [CrossRef]
- Pappalardo, R.; Wood, D.I.; Linares, R.C., Jr. Optical absorption study of Co-doped oxide systems II. J. Chem. Phys. 1961, 35, 2041–2059. [Google Scholar] [CrossRef]
- Moshtaghioun, B.M.; Peña, J.I.; Merino, R.I. Medium infrared transparency of MgO-MgAl2O4 directionally solidified eutectics. J. Eur. Ceram. Soc. 2020, 40, 1703–1708. [Google Scholar] [CrossRef]
- Tropf, W.J.; Thomas, M.E.; Harris, T.J. Chapter 33: Properties of Crystals end Glasses. In Handbook of Optics. Vol. 2, Devices Measurements and Properties, 2nd ed.; Bass, M., Ed.; Mc. Graw-Hill, Inc.: New York, NY, USA, 1995. [Google Scholar]
- Lushchik, A.; Feldbach, E.; Kotomin, E.A.; Kudryavtseva, I.; Kuzovkov, V.N.; Popov, A.I.; Seeman, V.; Shablonin, E. Distinctive features of diffusion-controlled radiation defect recombination in stoichiometric magnesium aluminate spinel single crystals and transparent polycrystalline ceramics. Sci. Rep. 2020, 10, 7810. [Google Scholar] [CrossRef]
- Kennard, F.L.; Bradt, R.C.; Stubican, V.S. Eutectic solidification of MgO-MgAl2O4. J. Am. Ceram. Soc. 1973, 56, 566–569. [Google Scholar] [CrossRef]
- Moshtaghioun, B.M.; Peña, J.I. Non-Hall-Petch hardness dependence in ultrafine fibrous MgO-MgAl2O4 eutectic ceramics fabricated by the laser-heated flating zome (LFZ) method. J. Eur. Ceram. Soc. 2019, 39, 3208–3212. [Google Scholar] [CrossRef]
- Jackson, K.A.; Hunt, J.D. Lamellar and rod eutetic growth. Trans. Metall. SoC AIME 1966, 236, 1129–1142. [Google Scholar]
- Orkinski, K.; Romaniec, M.; Malinowska, A.; Diduszko, R. Growth-microstructure relationship in MgO-MgAl2O4 eutectic fabricated by micro-pulling down method with MgAl2O4 seed crystals. J. Eur. Ceram. Soc. 2019, 39, 3843–3847. [Google Scholar] [CrossRef]
- Goldstein, A.; Loiko, P.; Burshtein, Z.; Skoptsov, N.; Glazunov, I.; Galun, E.; Kuleshov, N.; Yumashev, K. Development of saturable absorbers for laser passive Q-switching near 1.5 mm based on transparent ceramic Co2+: MgAl2O4. J. Am. Ceram. Soc. 2016, 99, 1324–1331. [Google Scholar] [CrossRef]
- Becker, K.D.; Rau, F. A high-temperature study of defect-induced optical absorption in nickel oxide, Ni1-δO. Ber. Bunsenges. Phys. Chem. 1992, 96, 1017–1027. [Google Scholar] [CrossRef]
- Bosi, F.; Hålenius, U.; D’Hippolito, V.; Andreozzi, G.B. Blue spinel crystals in the MgAl2O4-CoAl2O4 series: Part II. Cation ordering over short-range and long-range scales. Am. Mineral. 2012, 97, 1834–1840. [Google Scholar] [CrossRef]
- Wajler, A.; Kozlowska, A.; Nakielska, M.; Lesniewska-Matys, K.; Sidorowicz, A.; Podniesinski, D.; Putyra, P. Nonlinear absorption of submicrometer grainsize cobalt-doped magnesium aluminates transparent ceramics. J. Am. Ceram. Soc. 2014, 97, 1692–1695. [Google Scholar] [CrossRef]
- Howell, J.R.; Siegel, R.; Mengüç, M.P. Thermal Radiation Heat Transfer, 5th ed.; CRC Press, Taylor and Francis: Boca Raton, FL, USA, 2010. [Google Scholar]
- Henderson, B.; Imbush, G.G. Optical Spectroscopy of Inorganic Solids; Oxford University Press: New York, NY, USA, 2006. [Google Scholar]
- Redfern, S.A.T.; Harrison, R.J.; O’Neill, H.S.C.; Wood, D.R.R. Thermodynamics and kinetics of cation ordering in MgAl2O4 spinel up to 1600 °C. Am. Mineral. 1999, 84, 299–310. [Google Scholar] [CrossRef]
- He, T.; Becker, K.D. An optical in-situ study of a reacting spinel crystal. Solid State Ion. 1997, 101, 337–342. [Google Scholar] [CrossRef]
- O’Neill, H.S.C. Temperature dependence of the cation distribution in CoAl2O4 spinel. Eur. J. Mineral. 1994, 6, 603–609. [Google Scholar] [CrossRef]
Figure 1.
SEM micrographs of the transverse cross section of (a) Co0.12-50 and (b) Co0.15-750 eutectic rods. Insets: amplification of the microstructure inside the colony.
Figure 1.
SEM micrographs of the transverse cross section of (a) Co0.12-50 and (b) Co0.15-750 eutectic rods. Insets: amplification of the microstructure inside the colony.

Figure 2.
Thermal emission spectra of Co0.12-50 (solid lines) and Co0.15-750 (dotted lines) eutectic rods measured at 1000, 1200 and 1400 °C. Black solid line shows the emission measured in the undoped MgO-MgSZ eutectic rod at 1000 °C.
Figure 2.
Thermal emission spectra of Co0.12-50 (solid lines) and Co0.15-750 (dotted lines) eutectic rods measured at 1000, 1200 and 1400 °C. Black solid line shows the emission measured in the undoped MgO-MgSZ eutectic rod at 1000 °C.

Figure 3.
(a) Thermal emission of Co0.04-50, Co0.12-50 and Co0.22-50 eutectic rods measured at 1300 °C; (b) spectra obtained by dividing the thermal emission spectra by the Planck profile at 1300 °C.
Figure 3.
(a) Thermal emission of Co0.04-50, Co0.12-50 and Co0.22-50 eutectic rods measured at 1300 °C; (b) spectra obtained by dividing the thermal emission spectra by the Planck profile at 1300 °C.

Figure 4.
Thermal emission of all the samples grown at 50 mm/h (solid lines) and 750 mm/h (dotted lines) measured at 1300 °C. Spectra, labeled with the sample names (see Table 1), are presented normalized for comparison purposes.
Figure 4.
Thermal emission of all the samples grown at 50 mm/h (solid lines) and 750 mm/h (dotted lines) measured at 1300 °C. Spectra, labeled with the sample names (see Table 1), are presented normalized for comparison purposes.

Figure 5.
Thermal emission of MgO:Co (blue dash-point line), Spinel0.06-50 (red dotted line) and Co0.22-50 (green solid line) measured at 1000 °C. Spectra are presented normalized for comparison purposes.
Figure 5.
Thermal emission of MgO:Co (blue dash-point line), Spinel0.06-50 (red dotted line) and Co0.22-50 (green solid line) measured at 1000 °C. Spectra are presented normalized for comparison purposes.

Figure 6.
Optical absorption spectra of (a) MgO:Co and (b) MgAl2O4:Co single crystals. Cobalt ion concentration, measured by EDS, is given in the legend. The dotted lines in the MgAl2O4 spectra are magnified ×20 to better appreciate the long wavelength absorption band.
Figure 6.
Optical absorption spectra of (a) MgO:Co and (b) MgAl2O4:Co single crystals. Cobalt ion concentration, measured by EDS, is given in the legend. The dotted lines in the MgAl2O4 spectra are magnified ×20 to better appreciate the long wavelength absorption band.

Figure 7.
Sum spectrum (blue curve) calculated as the volume fraction × NCo weighted sum of MgO:Co and MgAl2O4:Co absorption cross-section spectra, as to represent absorption of sample Co0.48-750. The green line is the absorption coefficient of the single crystal Spinel0.17-50. The dotted lines show the spectra magnified ×3.5.

Figure 8.
Measured directional-hemispherical reflectance (continuous lines) and transmittance (dotted lines) of as-grown samples Co0.04-50 (red and light-red) and Co0.04-750 (green and light-green). The incident light beam is perpendicular to the samples rod-axes.
Figure 8.
Measured directional-hemispherical reflectance (continuous lines) and transmittance (dotted lines) of as-grown samples Co0.04-50 (red and light-red) and Co0.04-750 (green and light-green). The incident light beam is perpendicular to the samples rod-axes.

Figure 9.
Estimated directional spectral emittance at room temperature of the different eutectic samples. The apparent structure of the band above 1900 nm might be an artifact of the spectrograph.
Figure 9.
Estimated directional spectral emittance at room temperature of the different eutectic samples. The apparent structure of the band above 1900 nm might be an artifact of the spectrograph.

Figure 10.
(a) Directional emittance at RT and (b) emittance at 1300 °C (calculated as thermal emission intensity divided by black body Planck profile) at selected wavelengths as a function of the total Co content (at %) in the sample. The diameter on which the actual data were measured is written on the plot.

Figure 11.
Ratio of emittances at 2300 nm vs. 1545 nm at room temperature (filled symbols), and at 2400 nm vs. 1700 nm at 1300 °C (open symbols). With black symbols, eutectic bar-samples solidified at 50 mm/h, with red symbols, samples solidified at 750 mm/h. Emittance at 1300 °C estimated as the thermal emission intensity divided by the black body profile.


Table 1.
Nominal composition (%mol) and composite-, MgO- and MgAl2O4- cobalt contents (% at) for all the samples. Atomic Co percentages were determined by EDS; Co2+ ions/cm3 in each phase were calculated using cobalt atomic content obtained by EDS and volume of MgO and MgAl2O4 single crystal lattices. The atomic Co percentages are given relative to the total number of ions in the sample or phase, including oxide ions calculated by stoichiometry.
| Sample | Nominal Composition | %at Co Sample | %at Co MgO | %at Co MgAl2O4 | Co2+/cm3 MgO | Co2+/cm3 MgAl2O4 |
|---|---|---|---|---|---|---|
| Co0.04-750 | 67.32MgO-32.53Al2O3-0.15Co3O4 | 0.04 ± 0.02 | 0.14 ± 0.02 | 0.03 ± 0.02 | 1.5 × 10²⁰ | 2.7 × 10¹⁹ |
| Co0.04-50 | 0.04 ± 0.02 | 0.13 ± 0.02 | 0.03 ± 0.02 | 1.4 × 10²⁰ | 2.7 × 10¹⁹ | |
| Co0.12-50 | 0.12 ± 0.02 | 0.36 ± 0.02 | 0.08 ± 0.02 | 3.9 × 10²⁰ | 8.6 × 10¹⁹ | |
| Co0.15-750 | 0.15 ± 0.02 | 0.53 ± 0.025 | 0.07 ± 0.02 | 5.7 × 10²⁰ | 7.6 × 10¹⁹ | |
| Co0.22-50 | 67.09MgO-32.41Al2O3-0.5Co3O4 | 0.22 ± 0.02 | 0.69 ± 0.03 | 0.12 ± 0.02 | 7.4 × 10²⁰ | 1.3 × 10²⁰ |
| Co0.29-750 | 0.29 ± 0.02 | 1.02 ± 0.03 | 0.16 ± 0.02 | 1.1 × 10²¹ | 1.7 × 10²⁰ | |
| Co0.48-750 | 0.48 ± 0.02 | 1.69 ± 0.03 | 0.26 ± 0.02 | 1.8 × 10²¹ | 2.8 × 10²⁰ | |
| Spinel0.06-50 | 49.89MgO-49.89Al2O3-0.22Co3O4 | 0.06 ± 0.01 | - | 0.06 ± 0.01 | - | 5.9 × 10¹⁹ |
| Spinel0.17-50 | 49.62MgO-49.62Al2O3-0.76Co3O4 | 0.17 ± 0.01 | - | 0.17 ± 0.01 | - | 1.8 × 10²⁰ |
| Spinel0.29-50 | 48.75MgO-48.75Al2O3-2.5Co3O4 | 0.29 ± 0.014 | - | 0.29 ± 0.014 | - | 3.0 × 10²⁰ |
| MgO:Co | - | - | 0.14 ± 0.01 | - | 1.5 × 10²⁰ | - |
Publisher’s Note: MDPI stays neutral with regard to jurisdictional claims in published maps and institutional affiliations. |
© 2022 by the authors. Licensee MDPI, Basel, Switzerland. This article is an open access article distributed under the terms and conditions of the Creative Commons Attribution (CC BY) license (https://creativecommons.org/licenses/by/4.0/).
Share and Cite
MDPI and ACS Style
Merino, R.I.; Oliete, P.B.; Moshtaghioun, B.M.; Sola, D.; Peña, J.I. Directionally Solidified Cobalt-Doped MgO-MgAl2O4 Eutectic Composites for Selective Emitters. Appl. Sci. 2022, 12, 10254. https://doi.org/10.3390/app122010254
AMA Style
Merino RI, Oliete PB, Moshtaghioun BM, Sola D, Peña JI. Directionally Solidified Cobalt-Doped MgO-MgAl2O4 Eutectic Composites for Selective Emitters. Applied Sciences. 2022; 12(20):10254. https://doi.org/10.3390/app122010254
Chicago/Turabian StyleMerino, Rosa I., Patricia B. Oliete, Bibi Malmal Moshtaghioun, Daniel Sola, and José I. Peña. 2022. "Directionally Solidified Cobalt-Doped MgO-MgAl2O4 Eutectic Composites for Selective Emitters" Applied Sciences 12, no. 20: 10254. https://doi.org/10.3390/app122010254
Note that from the first issue of 2016, this journal uses article numbers instead of page numbers. See further details here.