
Drag Reduction Analysis of the Hydrostatic Bearing with Surface Micro Textures


1
School of Mechatronics Engineering, Harbin Institue of Technology, Harbin 150001, China
2
Department of Mechanical and Aerospace Engineering, Brunel University London, Uxbridge UB8 3PH, UK
*
Author to whom correspondence should be addressed.
†
These authors contributed equally to this work.
Appl. Sci. 2022, 12(21), 10831; https://doi.org/10.3390/app122110831
Submission received: 9 August 2022
/
Revised: 8 October 2022
/
Accepted: 17 October 2022
/
Published: 26 October 2022
(This article belongs to the Special Issue Flow Control, Active and Passive Applications)
Abstract
:Surface microtexturing has been widely used due to its good hydrophobic or drag reduction characteristics, and become an effective method to improve product performance and reduce energy consumption. This paper mainly discusses the improvement of microtextures on the dynamic pressure characteristics of hydrostatic bearings, and explores the effects of texture parameters on carrying capacity, macroscopic wall two-plane shear force, cavity area and other factors. In the oil film model calculation of the smooth wall surface of the radial hydrostatic bearing under the action of high speed and large external load, the oil film divergent wedge often has a negative pressure area, which is obviously not in line with the actual situation, so the cavitation effect needs to be considered. The CFD analysis method of the “gas-oil” two-phase flow model was carried out by using the mixture model to seek the optimal texture model scheme and thus to improve the load carrying capacity (LCC) and reduce the wall shear force. The effects of the texture area arrangement and geometric parameters on the lubrication characteristics were compared and analyzed. It is found that the carrying capacity of local texture is better than that of global texture, and different texture arrangements can achieve better drag reduction rates. The work presented in this paper studies the lubrication of the surface texture of a hydrostatic bearing. Taking the oil film carrying capacity and shear force as the target parameters, the factors, such as texture morphology, geometric parameters, texture distribution and cavitation phenomenon, are investigated through simulation and experimental methods. The surface textured hydrostatic bearing is expected to obtain the maximum oil film carrying capacity and the minimum friction resistance. The analysis results show that by arranging the partial streamwise texture at the rear end of the diverging wedge, the maximum shear force of the wall can be reduced by about 15%, and the LCC can be increased by about 18%.
1. Introduction
Surface microtexturing has gradually attracted attention due to its good hydrophobicity and drag reduction properties, which has become an effective way to improve the performance of new products and reduce energy consumption. Since Hamilton and Halavit [1] first proposed to process the microstructure on the surface of the friction pair to obtain the dynamic pressure effect, many scholars have carried out research in this area. The effects of texture morphology, geometric parameters, texture distribution and environmental factors on the lubricating performance were investigated by simulation and experiment. Rahmani et al. [2] combined the Reynolds equation and surface discontinuity of the hydrostatic bearing to establish a model and studied the influence of various forms of surface texture on the friction and carrying capacity of the hydrostatic bearing and believed that the form of texture has a significant impact on the bearing lubrication performance; waist triangle, right triangle and rectangular microtextures significantly improved the lubricating performance. Sinanoğlu et al., used experimental methods to verify that the trapezoid has a higher load-carrying capacity than the zigzag texture, and the maximum pressure value is reduced by 36% compared to the smooth journal. In terms of pit-like textures, Tala-Ighil et al. [3] analyzed the effects of spherical, cylindrical and parallelepiped textures on the minimum oil film thickness, maximum pressure, axial flow velocity and friction force on the shaft diameter surface under the condition of stable flow field by using the finite element method, and the cylindrical texture performance improved more. Wang [4] found through experiments that with a reasonable design of geometric shapes and distributions, micropits can obtain nearly 2.5 times the carrying capacity of smooth surfaces.
Rahmani’s [2] research shows that texture height has a greater impact on tribological properties than texture area ratio. Through experimental comparison, Sinanoğlu [5] found that reducing the texture height and inclination would reduce the LCC. Cupillard [6] applied numerical methods to study the effect of microgrooves on the axial direction of the bearing pad wall on the lubricity of radial hydrostatic bearings when cavitation effects were considered. It shows that the microgrooves can increase the minimum oil film thickness and reduce the frictional resistance under the condition of small depth and low load (eccentricity < 0.15); under the condition of large depth and high load ( > 0.15), the microgrooves can reduce the friction force, but simultaneously, the thickness of the oil film is reduced. In terms of thrust hydrostatic bearing research, Wang [4] used the load capacity/friction coefficient transition point to measure the performance of the bearing, and studied the effects of the ratio of the area of the crater, the depth of the crater and the diameter of the crater in the transition point of the LCC and obtained the best result. Zhang [7] optimized the geometrical parameters of the fan-shaped straight groove texture on the bearing surface and considered that the microtexture had different optimal parameters under different constraints and objectives. He analyzed the effect of groove texture on the fluid thrust lubrication mechanism of thrust washers and found that the width and number of grooves have optimal values for load carrying capacity.
Regarding the location of texture distribution, Cupillard [6] simulation found that the microtexture model arranged in the maximum pressure region can reduce friction and oil film thickness compared with the smooth wall model. Liu Hongbin’s numerical study found that there is a reasonable density and distribution for the oil film LCC. Brizmer [8,9] found in the micropit texture research that the global texture model cannot effectively improve the LCC, but it is suitable for mechanical seals.
Hamilton [1] proposed the “lubrication effect of microbumps”, which believes that the microbumps on the surface hinder the movement of the fluid. When the fluid flows through the microbumps, the pressure rises rapidly and cavitation causes the pressure asymmetry, resulting in additional LCC. Cupillard’s [10,11] numerical analysis of textured slider bearings found a “reflow phenomenon”. When the texture depth increases to a certain value, backflow will occur, and the backflow will reduce the pressure gradient and LCC. Lo [12] found that the pit-textured surface lubricating fluid penetrates into the surrounding area to reduce friction and wear. Wang experimentally verified this phenomenon and summarized it as “secondary lubrication effect”. Fowell [4] discovered the phenomenon of “inlet suction” when studying low-convergence textured wall bearings: unlike the classical shear force that entrains the lubricating oil to form hydrodynamic pressure, the phenomenon is that the textured area at the bearing inlet produces a lower pressure than the outside air. The high pressure causes the lubricating oil to be squeezed into the bearing, thereby increasing the LCC of the bearing. Tauviqirrahman et al. [13] believed that the surface microstructure affects the slip length of the fluid–solid surface, the journal bearings lubricated by Newtonian fluid and non-Newtonian fluid are compared, and it is concluded that non-Newtonian fluid is more effective in improving the load-carrying capacity in the case of high eccentricity.
Numerous studies have shown that applying a reasonable surface texture can lead to better tribological performance than smooth surfaces, but some issues still need to be investigated [14]. Whether there are some special textures that can achieve the best results performance in any situation; how different calculation models used affect the accuracy of the calculation results.
2. Analysis of Smooth-Walled Radial Bearing Ignoring Cavitation Effects
2.1. Governing Equations
In the process of high-speed rotation of hydrostatic bearings, the oil film of journal bearings will form negative pressure under the action of oil wedge. This cavitation phenomenon has been considered by a large number of scholars, and the most common is the half-Sommerfeld method. However, it is more practical to explain this phenomenon through gas–liquid two-phase flow [13,15]. Therefore, the conservation of momentum and energy are formulated as follows:
Mass conservation equation:
Momentum equation:
We can see that the momentum equation is related to the density, viscosity and the volume velocity of the micro element, extending Equation (2):
Energy equation:
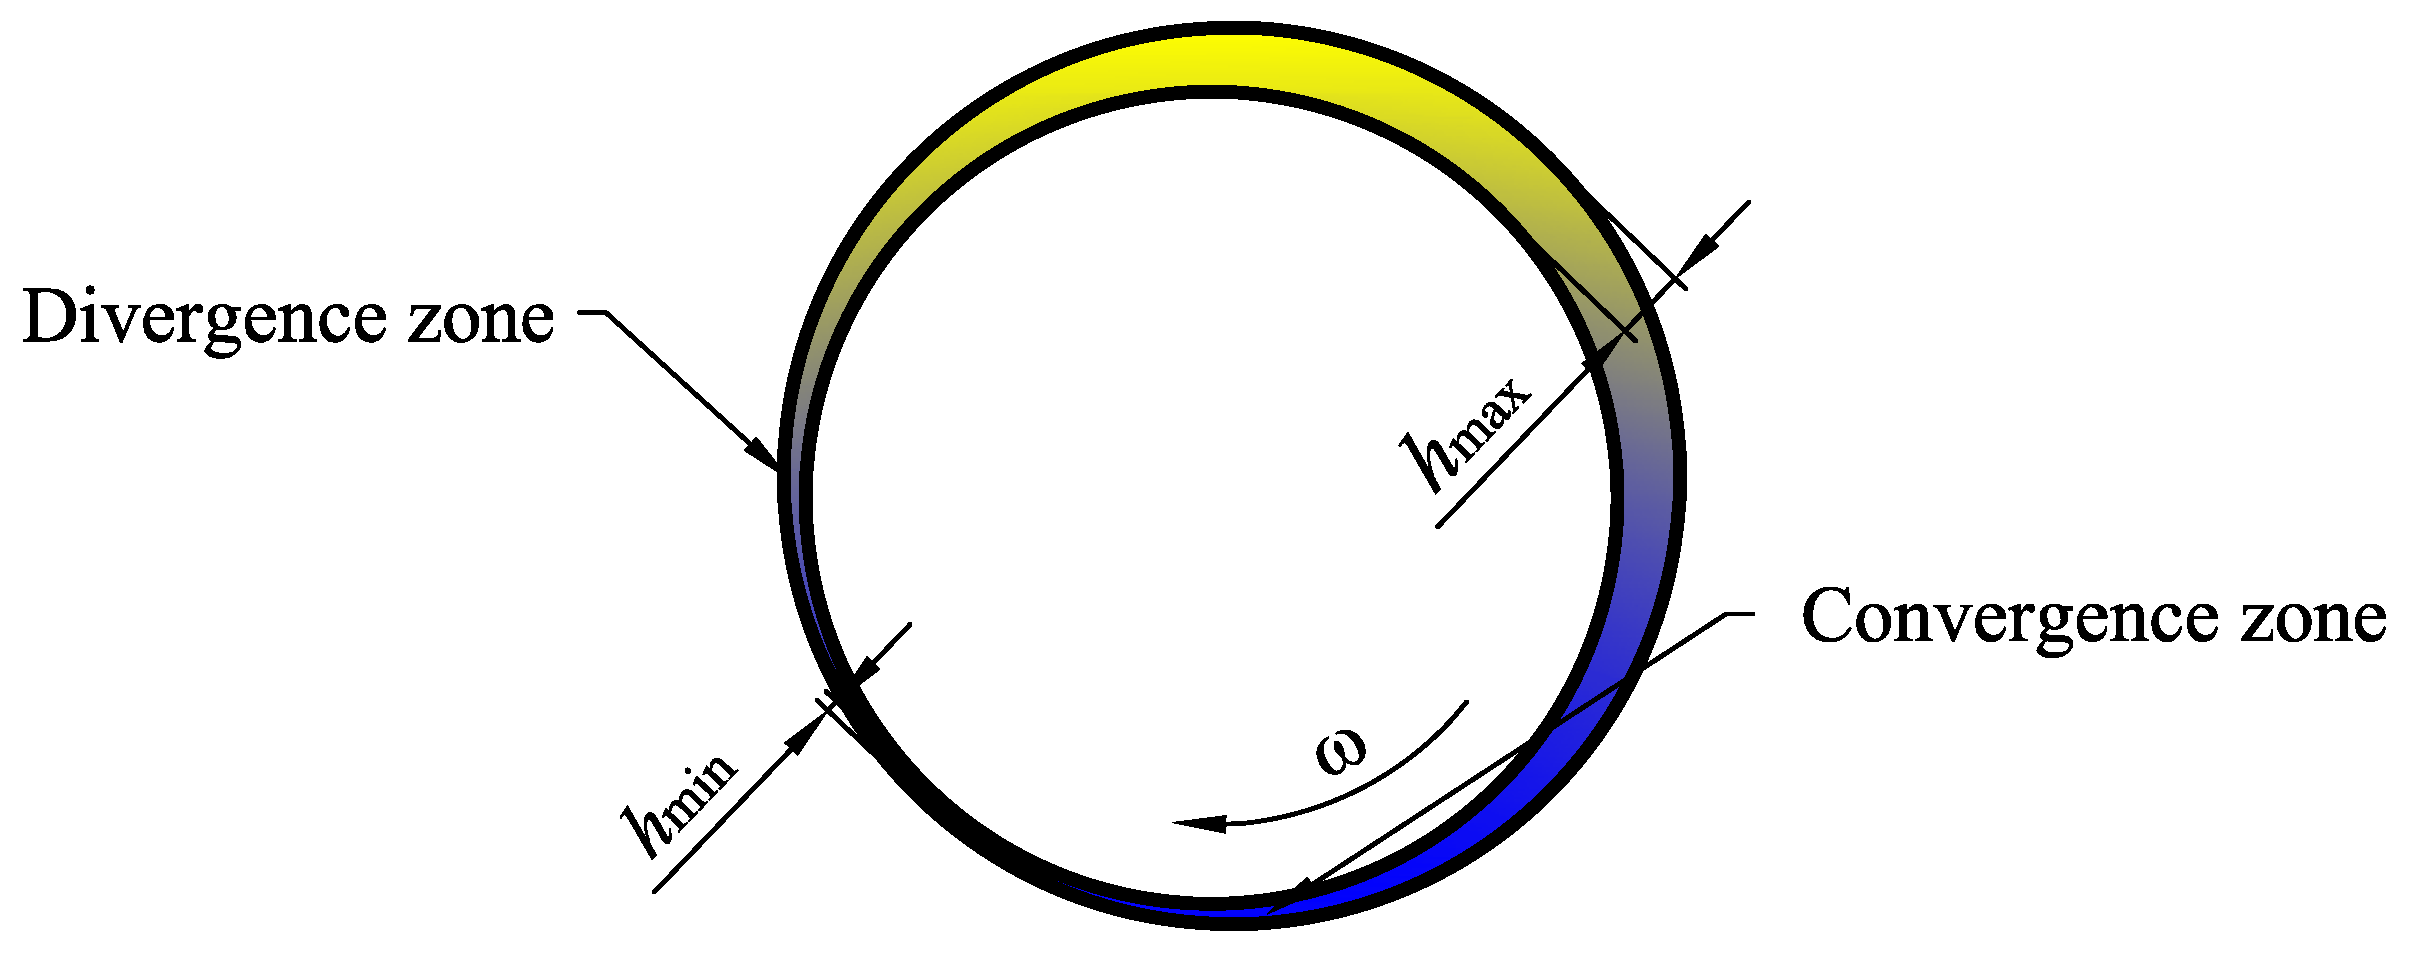
The two-dimensional schematic diagram of a radial hydrostatic bearing, shown in Figure 1.
The main parameters of oil are: density 810 kg/m3; specific heat capacity 2000 J/(kg · K); thermal conductivity 0.37 W/(m · K); dynamic viscosity of lubricating oil is (temperature T = 293 K). Analysis parameters are shown in Table 1.
According to the Reynolds number calculation formula:
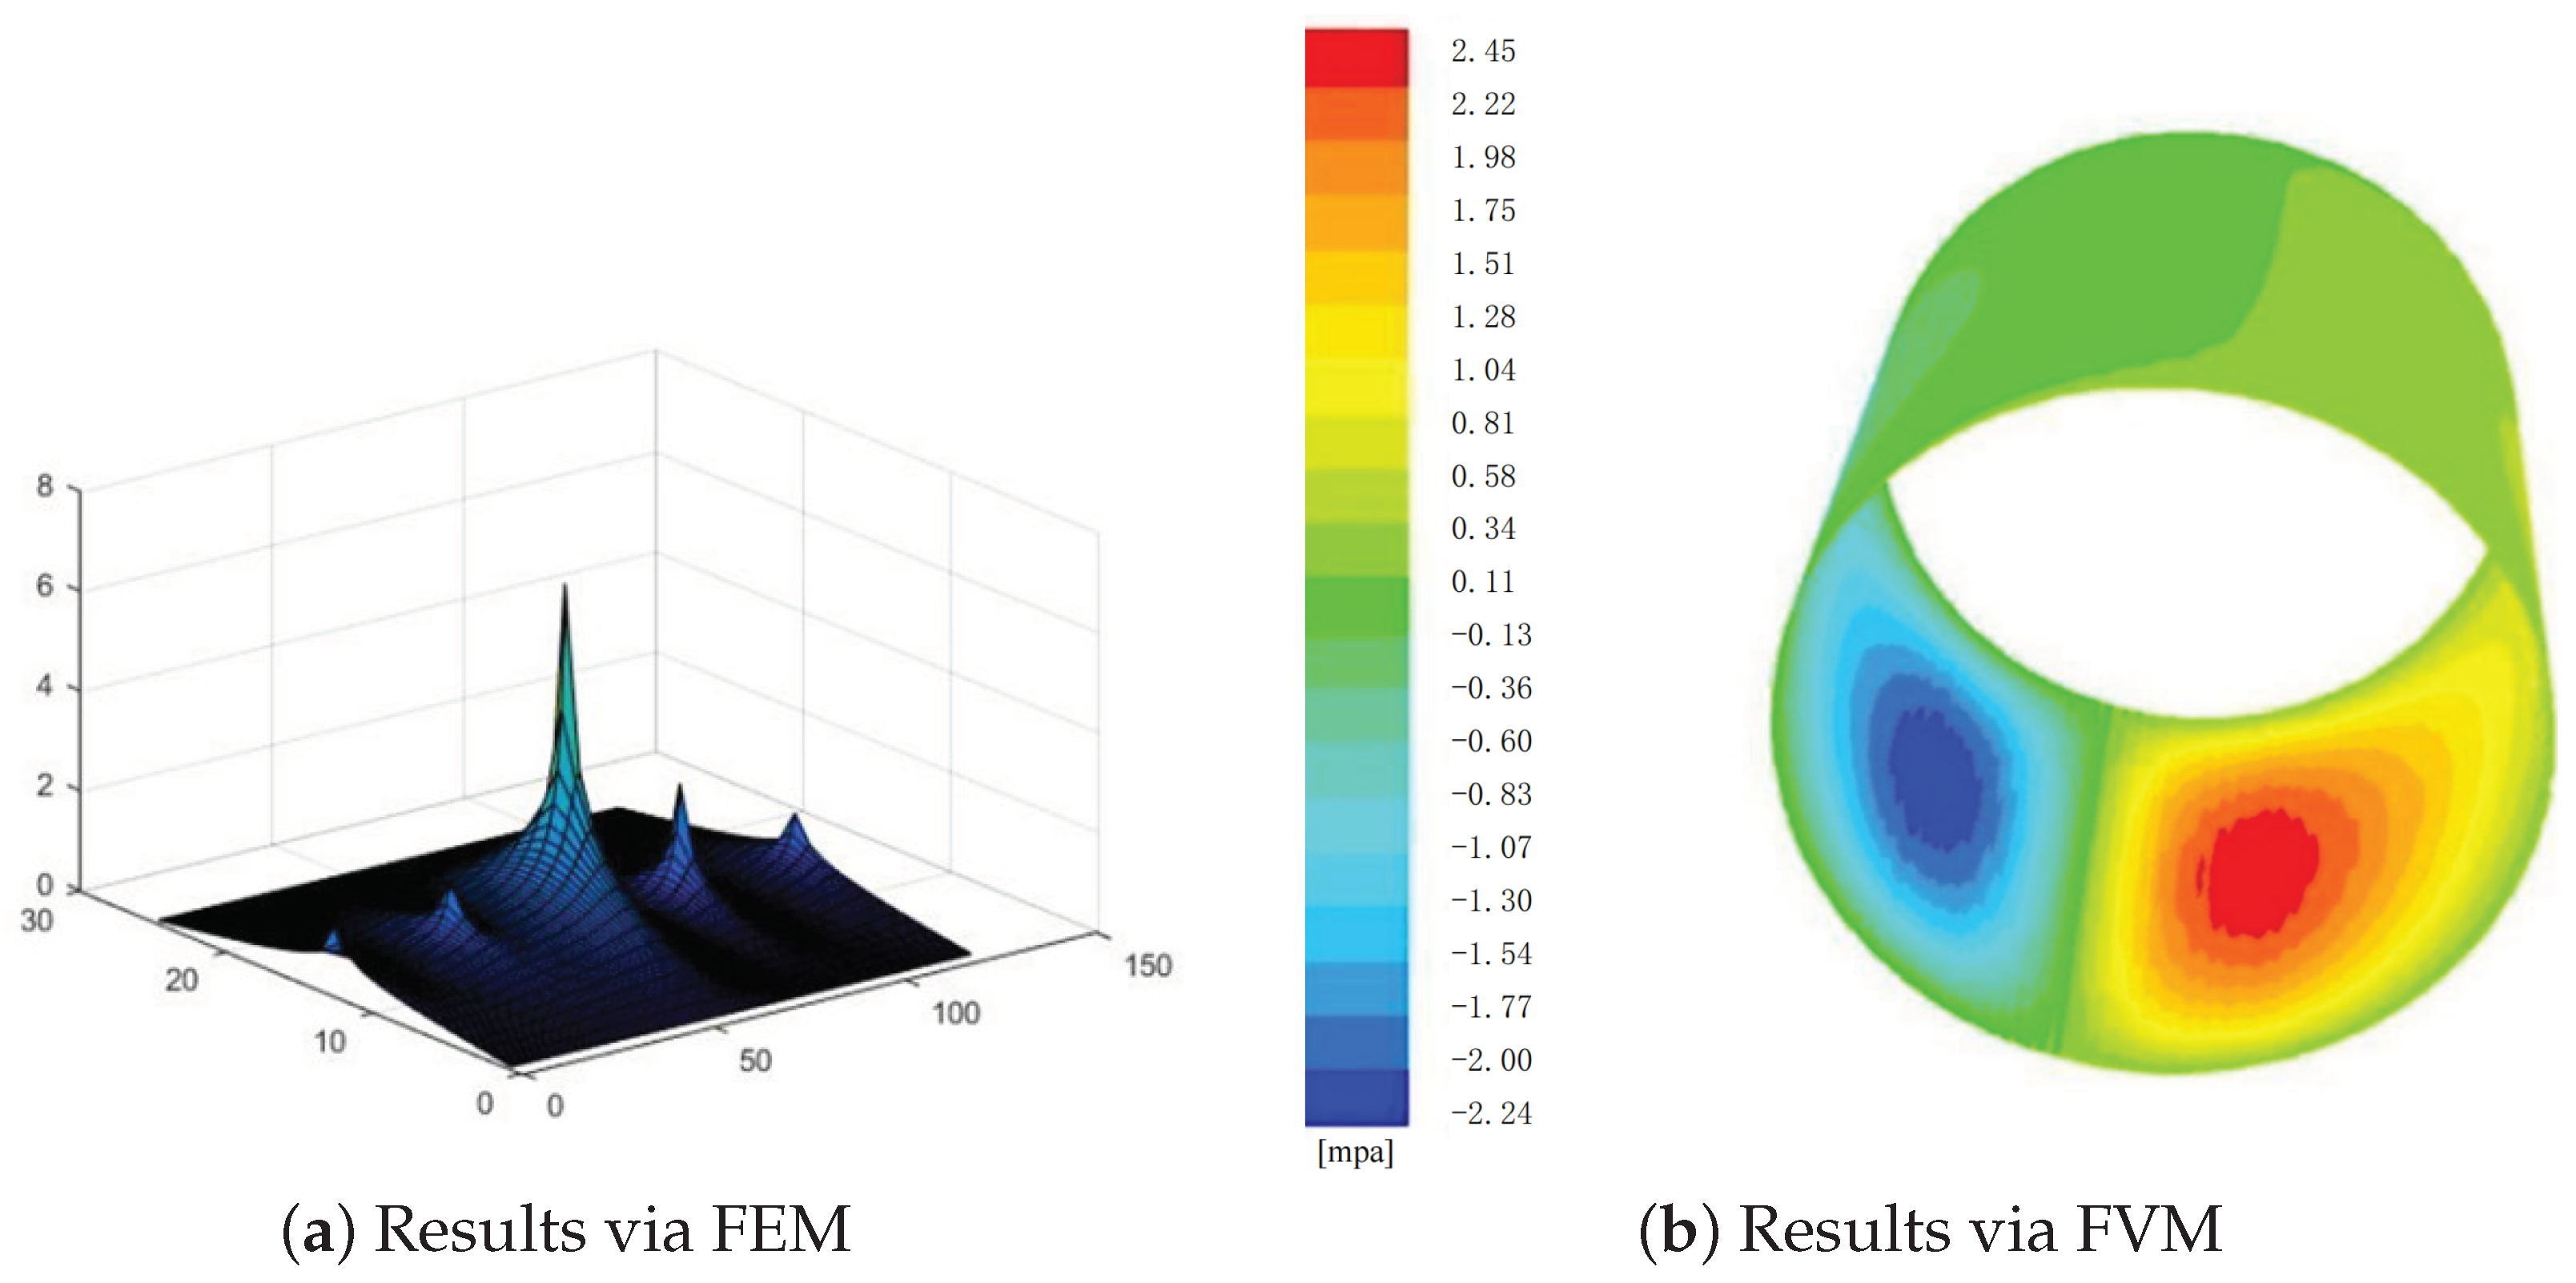
where d is length scale, and v is reference velocity. Based on the maximum oil film thickness, let , the Reynolds number calculated as about 75, which is much lower than the range of 1000 to 2000, which can generate turbulent flow. Therefore, this problem can be calculated according to the laminar flow theory, and the obtained pressure distribution in the oil film is shown in Figure 2.
Based on the maximum oil film thickness, the Reynolds number is calculated as about 75, which is much lower than the range of 1000 to 2000, which can generate a turbulent flow. Therefore, this problem can be calculated according to the laminar flow theory, and the obtained pressure distribution in the oil film is shown in Figure 2.
In order to verify mesh independence, three different proportions of mesh number are compared with the FEM method. As shown in Table 2.
It can be seen that without considering the cavitation effect, the minimum pressure may be negative pressure, which is obviously inconsistent with the actual situation. Therefore, the cavitation effect must be considered to obtain reasonable results. At the same time, the number of the mesh has little influence on the calculation results, which proves the independence of the mesh.
The process of generating, compressing, expanding and collapsing of tiny bubbles in a liquid is called cavitation. Several scholars have made outstanding contributions to the mathematical theory of cavitation effects. It was first predicted by the physicist Reynolds in 1873 that the high-speed relative motion between the propeller and the water would create a vacuum cavity that affects the performance of the propeller during the travel of the ship. Later, S.W. Barnaby et al. [16]. However, cavitation is not the only disadvantage. Along with the cavitation process, the bubbles generated by the fluid and the moving wall reduce the macroscopic shear force during the movement. For example, supercavitation technology is used to generate cavitation on the surface of the torpedo, so that the resistance of the torpedo can be reduced by 90% [17], among which the “full cavitation model” was studied by Singhal et al. It accounts for phase change, bubble dynamics, turbulent pressure fluctuations, and noncondensable gases. It is able to take into account multiphase flows or flows with multiphase transport of matter, the effect of sliding velocity between liquid and gas phases, as well as the thermal effects and compressibility of liquid and gas phases, establishing the Rayleigh–Plessset equation, also known as the Porisky equation, which is also a widely used cavitation model [18].
Since the negative pressure problem in the diverging wedge region needs to be solved in combination with the cavitation phenomenon, the bearing oil film model is divided into two simplified slider bearings, the convergent wedge and the diverging wedge, which are analyzed separately.
With the multiphase cavitation modeling approach, a basic two-phase cavitation model consists of using the standard viscous flow equations governing the transport of mixture phases. In cavitation, the liquid–vapor mass transfer equation has the following form:
In the equations mentioned above, t is time, is volume fraction, is vapor density, is vapor velocity, and are mass transfer source terms connect to the growth and collapse of the vapor bubbles. For different cavitation models, the definition of or other assumptions are different, resulting in different calculation methods of and . However, several cavitation models can be written as similar formulas with different calculation methods of coefficients and .
The saturation pressure is corrected by an estimation of the local values of the turbulent pressure fluctuations:
where k is kinetic energy.
2.2. Method Selection for Cavitation Effect Calculation
To account for cavitation in oil film CFD calculations, a multiphase flow model needs to be enabled. There are three commonly used multiphase flow models, namely the VOF model, the mixture model and the Eulerian model, and their characteristics are as follows.
- The VOF (Volume of Fluid) model is used in situations where the interface between two or more incompatible fluids needs to be obtained. It is used in slug flow, liquid flow, sloshing, free surface flow, and CFD calculation of stratified flow and dam collapse.
- The mixture model is used for the calculation of two-phase flow or multi-phase flow. It is a simplification of the Eulerian model based on the assumption that the Stokes number is very small. The result of this assumption is that the size and direction of the particle phase and the main phase are basically the same. Applications include bubbly flow, settling, and agitators.
- The Eulerian model establishes a continuity equation and a momentum equation for each phase, so the solution process is the most complicated among the three equations. Applications include sedimentation, bubble columns, fluidized beds, suspended particles, etc.
For the bearing oil film model where the gas phase and liquid phase are mixed and the gas phase volume ratio is much greater than 10%, the VOF model mainly used to calculate the stratified flow or free surface flow is obviously not suitable. Therefore, the calculation model needs to compare the mixture model and the Eulerian model. Pull the model to make trade-offs. The selection of the mixture model and Eulerian model is mainly based on the following principles.
- The mixture model is used when the gas phase is widely distributed, and the Eulerian model is used when the gas phase is concentrated in a local area.
- The mixture model is used when the stability and efficiency of the calculation are pursued, and the Eulerian model is used when the calculation accuracy is pursued.
- When choosing the Eulerian model, the influence of the interphase drag force needs to be considered. If the interphase drag force rule is unknown, the mixture model is used.
For the bearing oil film model with micro-texture on the wall surface, the flow field is more complicated. In order to improve the stability of the calculation, the mixture model is used to calculate the cavitation phenomenon.
2.3. Simulation of Smooth-Walled Radial Bearing Considering Cavitation Effects
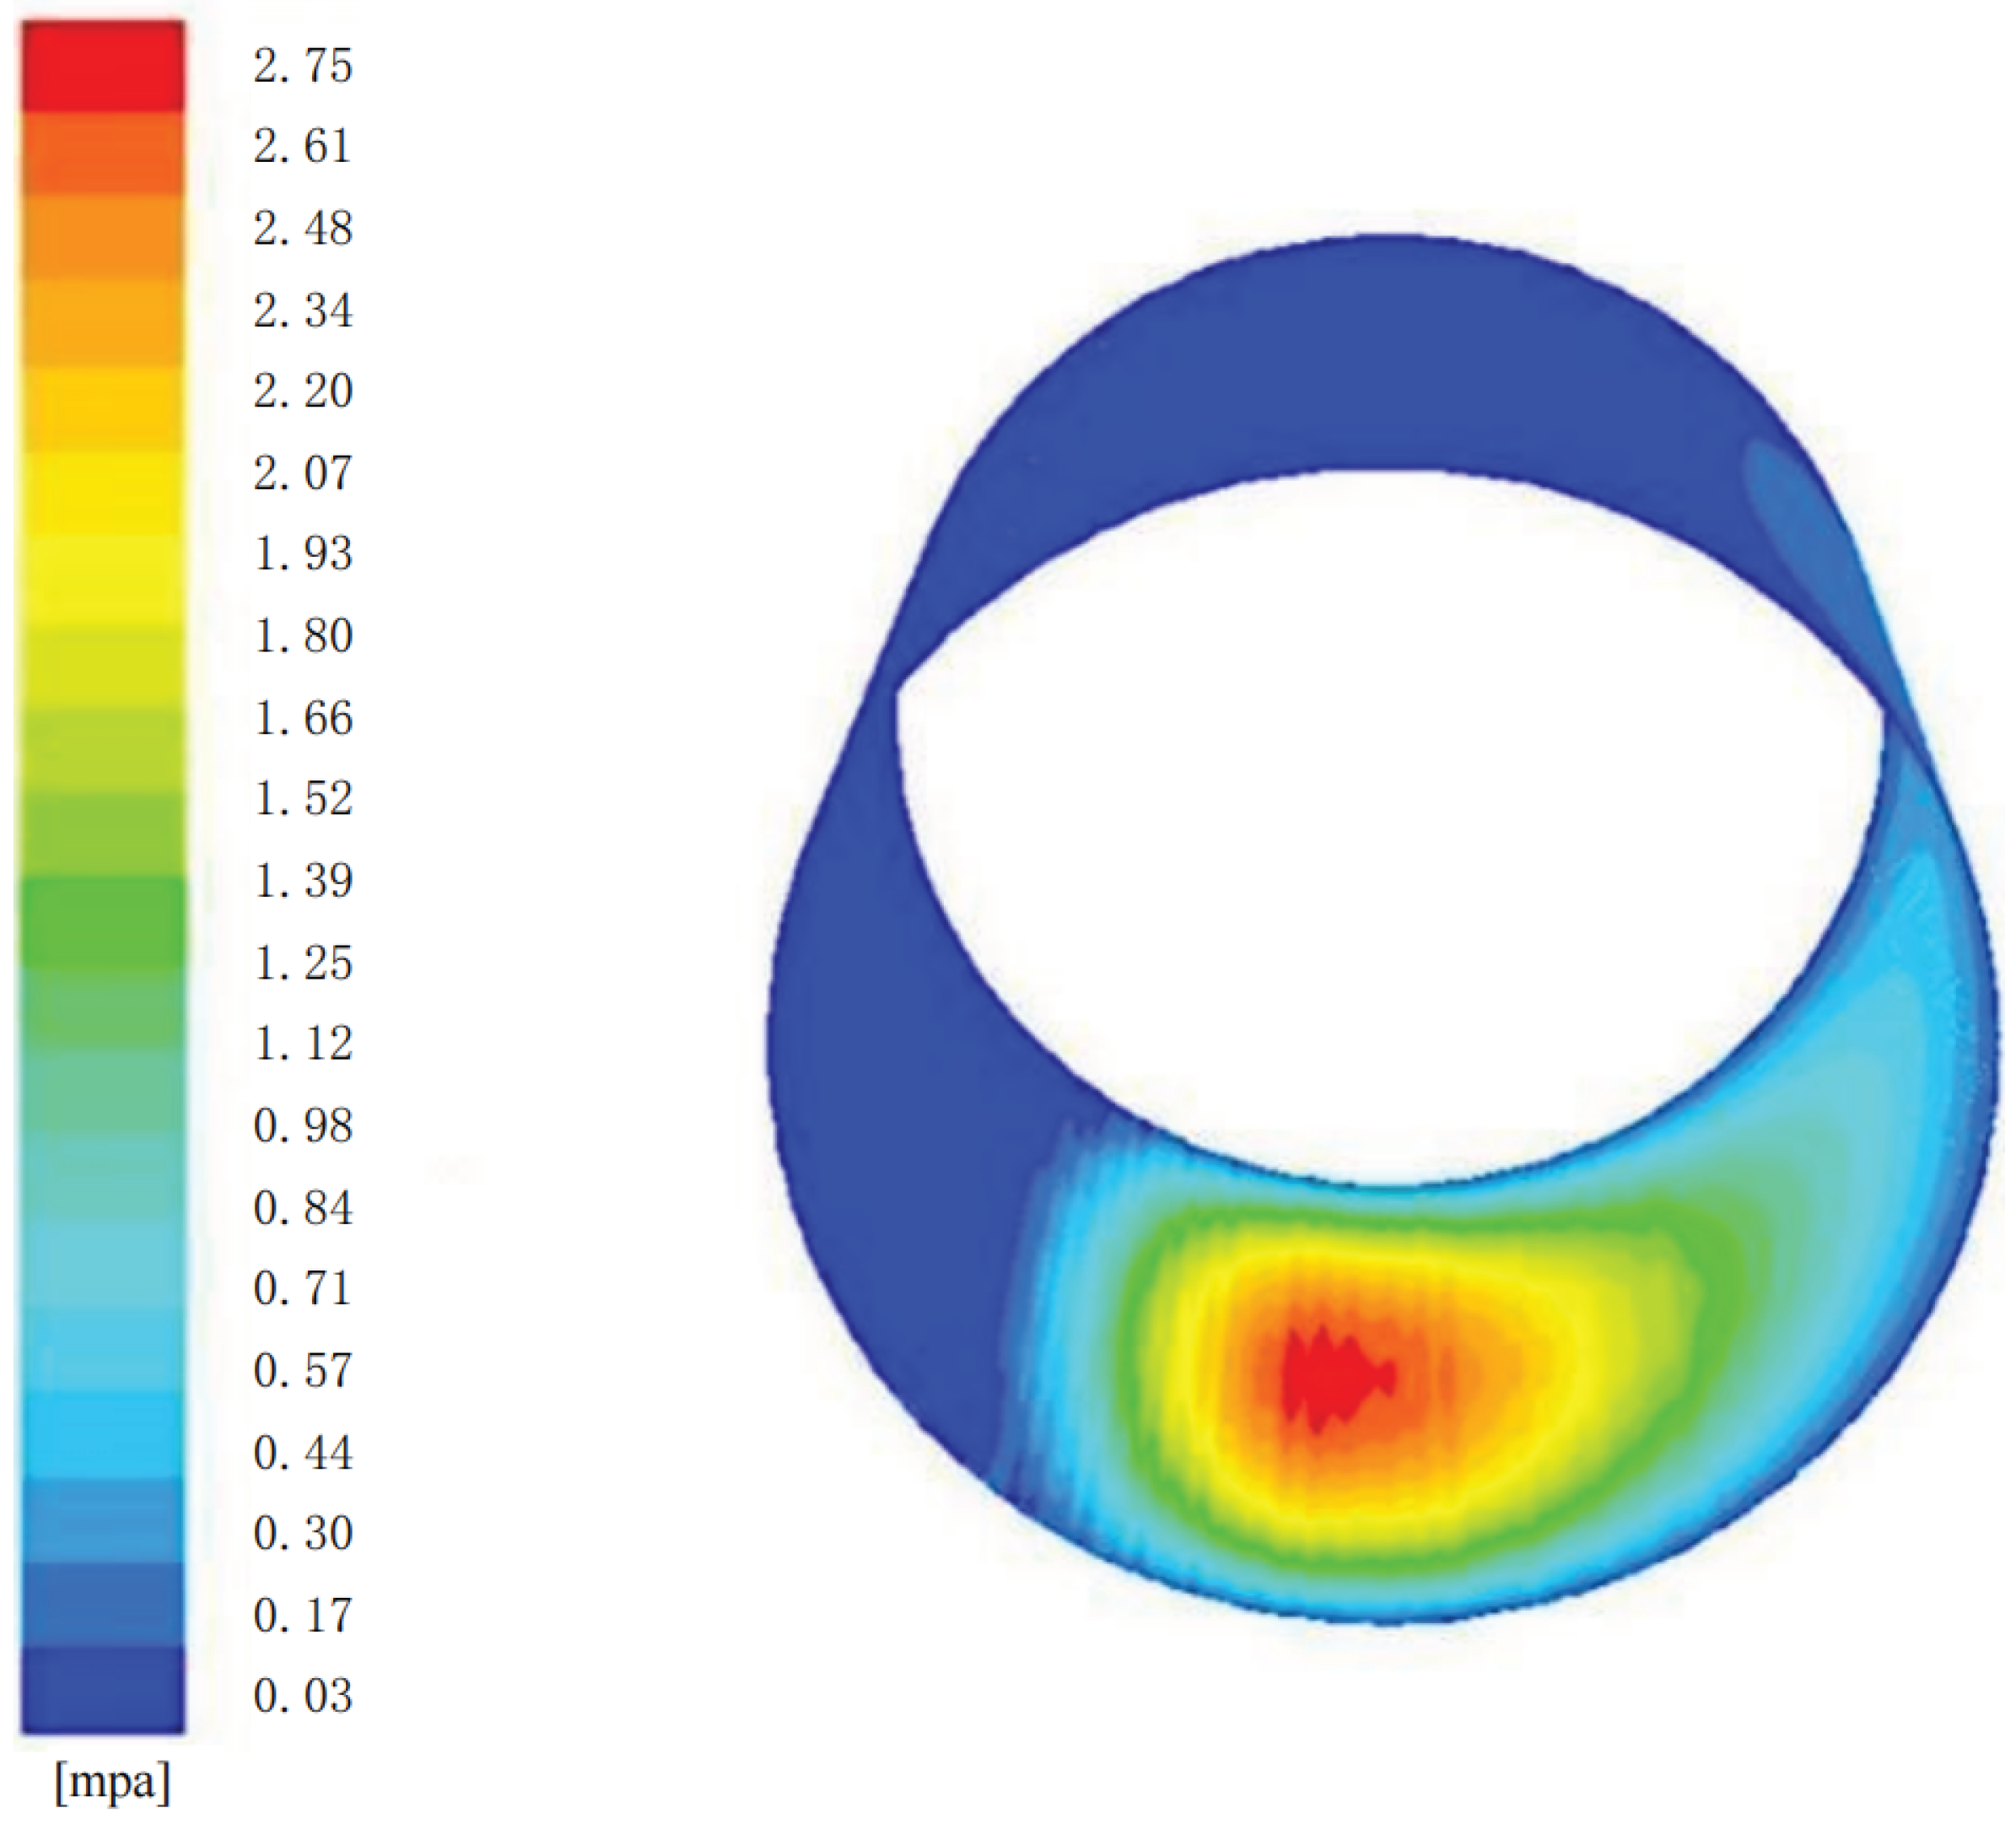
The pressure distribution of the smooth wall radial bearing calculate d in this paper is singular because cavitation effect is not considered. Here, the model considering cavitation effect is adopted, and the calculated pressure distribution is shown in Figure 3. The analysis results show that the results after considering the cavitation effect are more in line with the real situation, and the maximum pressure also increased.
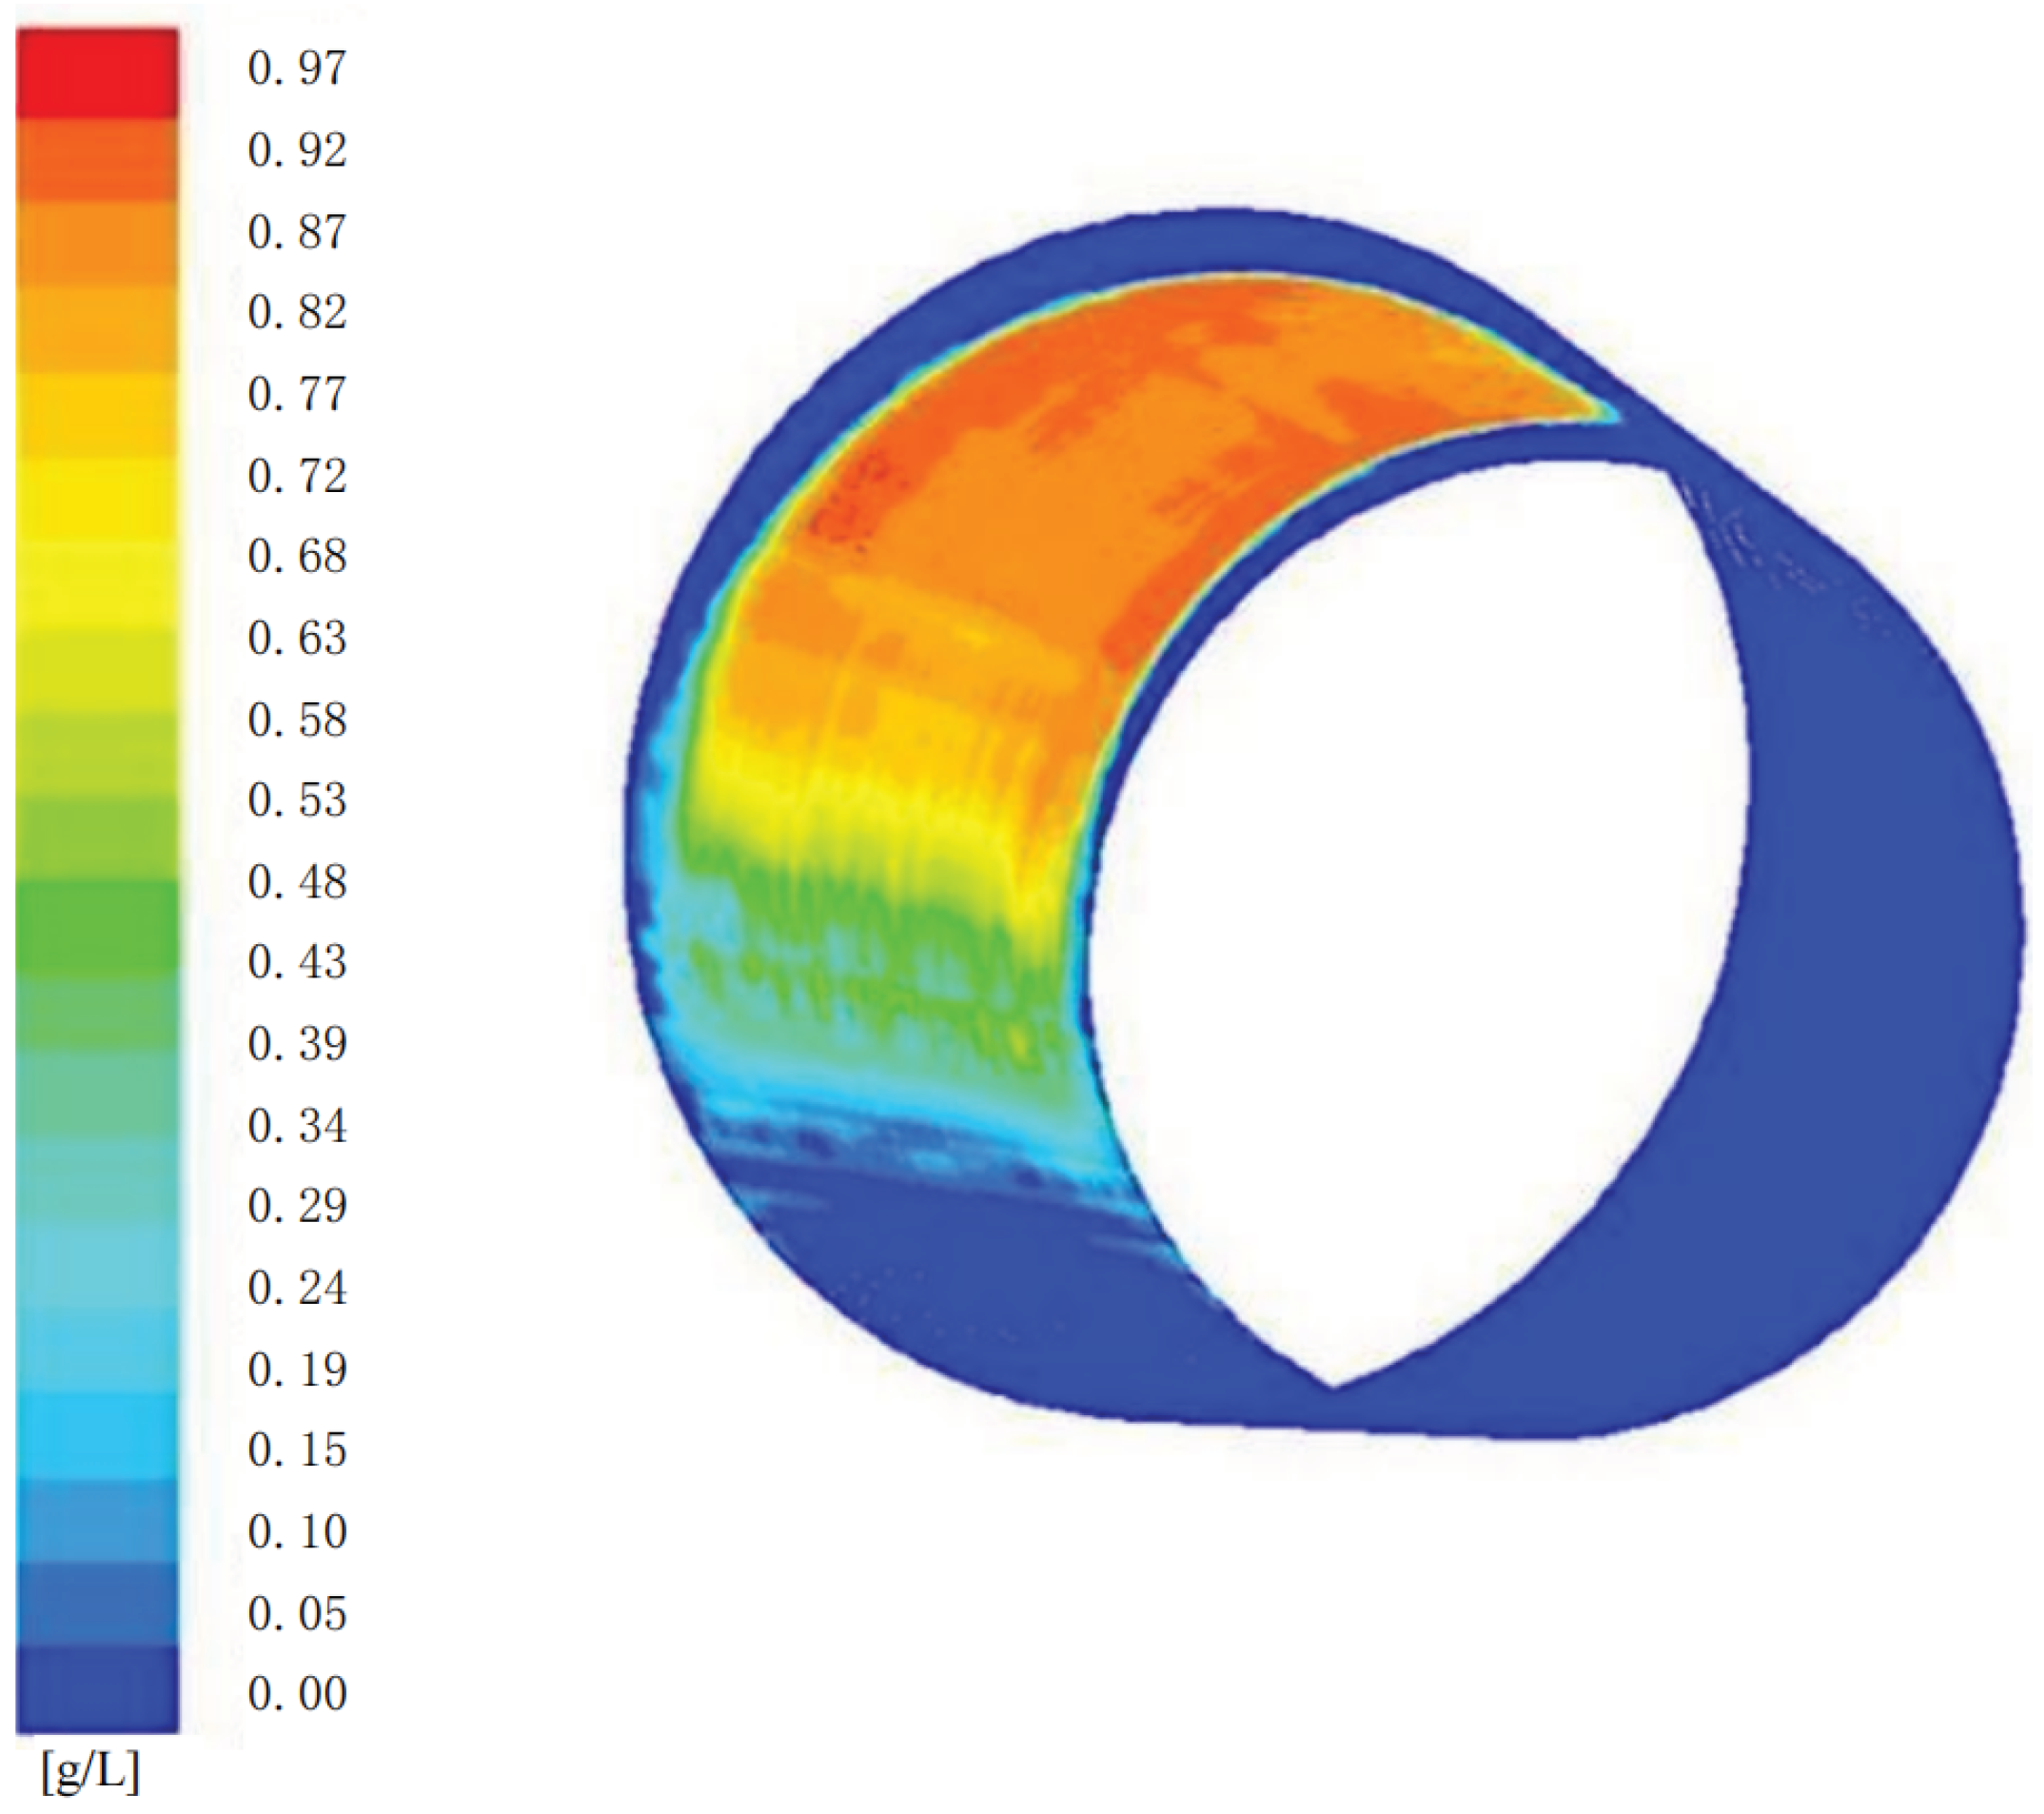
Figure 4 shows the cloud diagram of gas phase volume fraction distribution. The dark blue area indicates that the gas phase volume fraction is 0, that is, this area only contains oil, while other warm tone areas indicate that this area is a cavitation area. Obviously, the cavitation area is distributed in the bearing divergence wedge area. From the volume fraction of the gas phase in the cavitation area, it can be seen that the volume fraction of the gas phase increases gradually from the minimum oil film thickness to the maximum oil film thickness along the circumference. The area with less volume fraction of the gas phase corresponds to the initial stage of the cavitation. With the rotation of the journal, the cavitation is brought to the area with large oil wedge thickness and developed, and finally collapses and disappears in the area near the maximum oil film thickness.
The results show that the maximum velocity of the gas phase and the liquid phase are almost the same, and about 70% of the bubbles are distributed in units with a gas volume fraction of less than 9.71%.
3. Analysis of lUbrication Characteristics of Converging Wedge Slider Bearing Surface Texture
3.1. Pressure Distribution Simulation of Non-Textured Convergent Wedge Slide Bearing
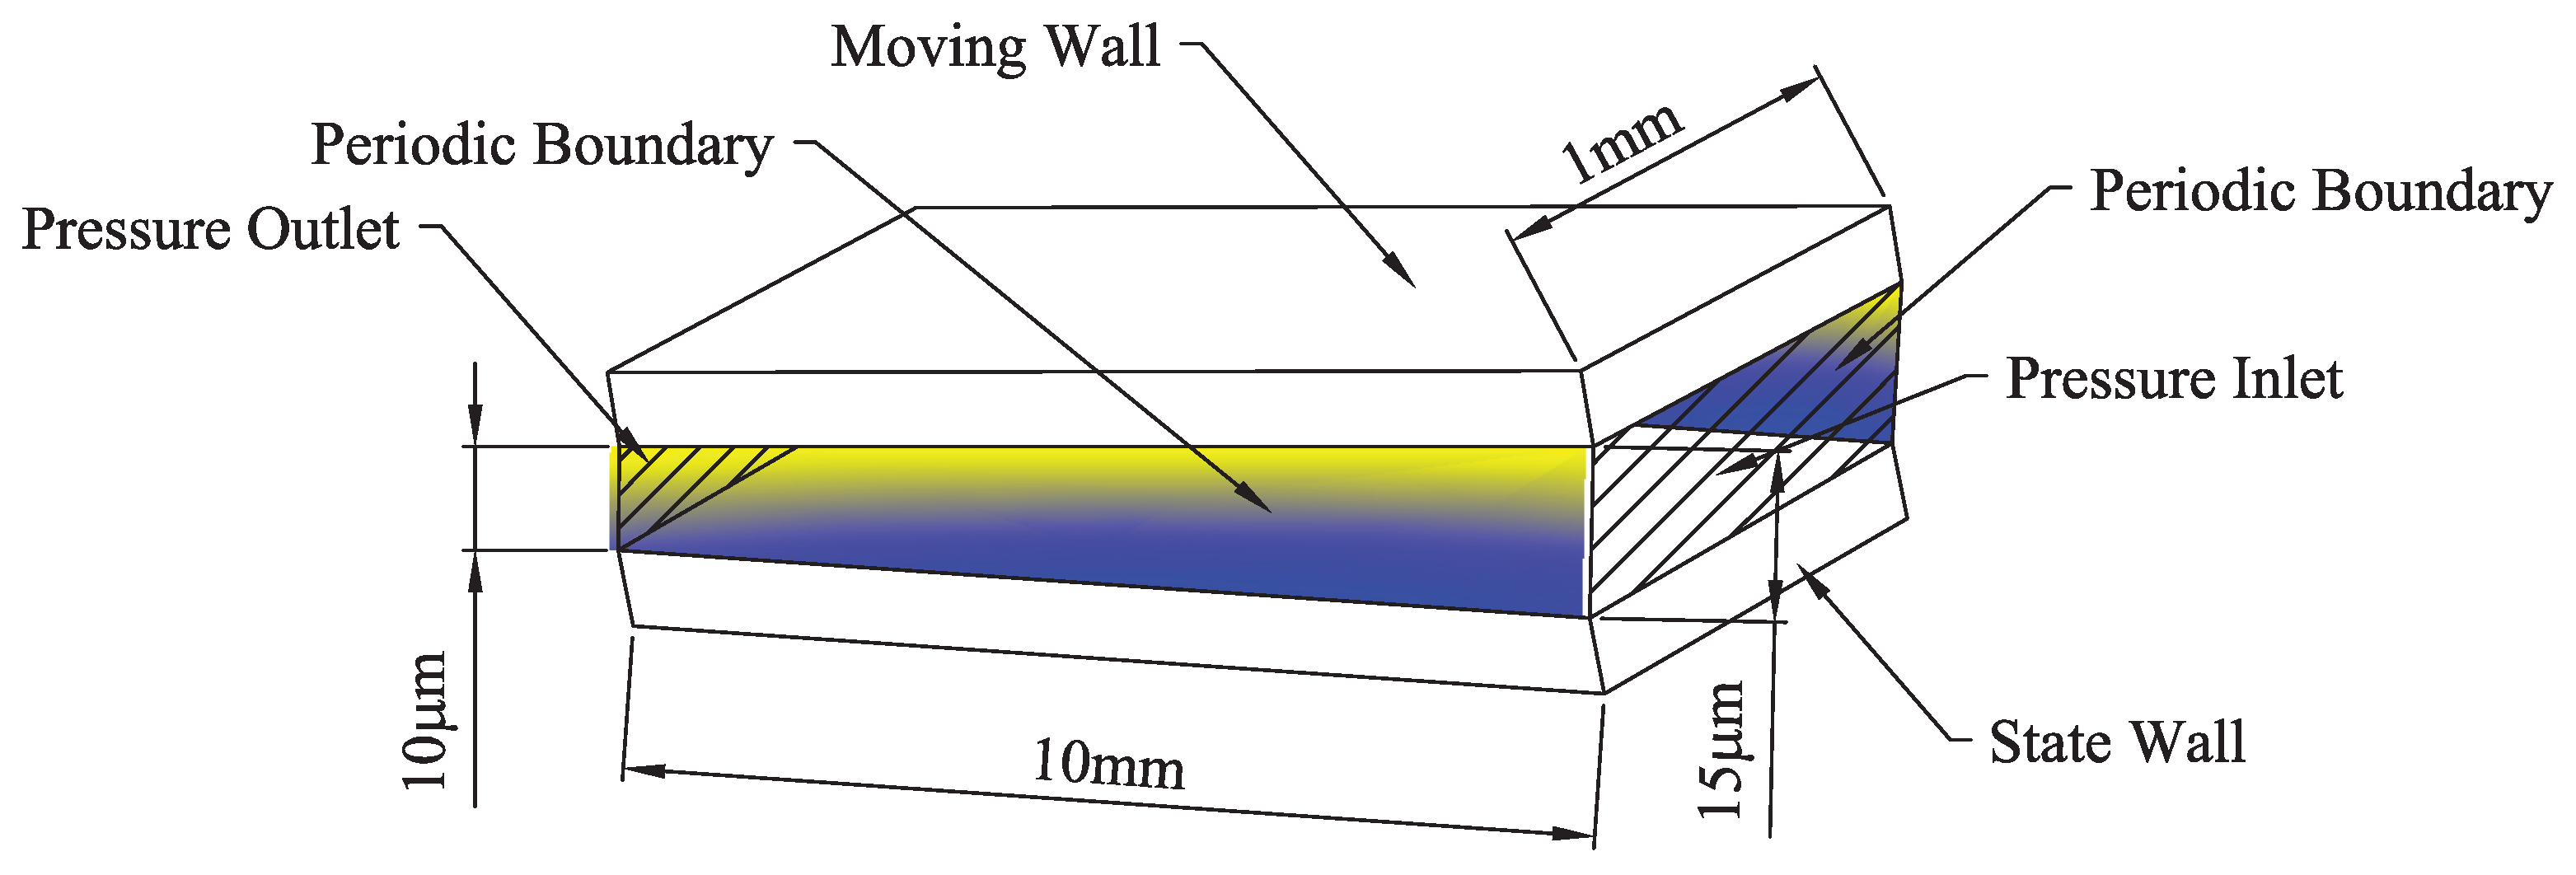
The slider bearing is a simplification of the convergent area and the divergent area of the radial hydrostatic bearing, so that the calculation can be more refined. The size of the slider bearing is selected as shown in Figure 5.
The lubricating oil is Mobil Velocite oil No 2, and the oil temperature is 293.15 K. The moving speed of the upper wall (Moving Wall) is v = 20 m/s, and the lower wall (state wall) is stationary. In order to ignore the influence of the two side walls facing the flow, the periodic boundary conditions are set in the analysis. The processing of periodic boundary conditions from the finite element analysis theory has the characteristics of accelerating the convergence, so it will not adversely affect the analysis results.
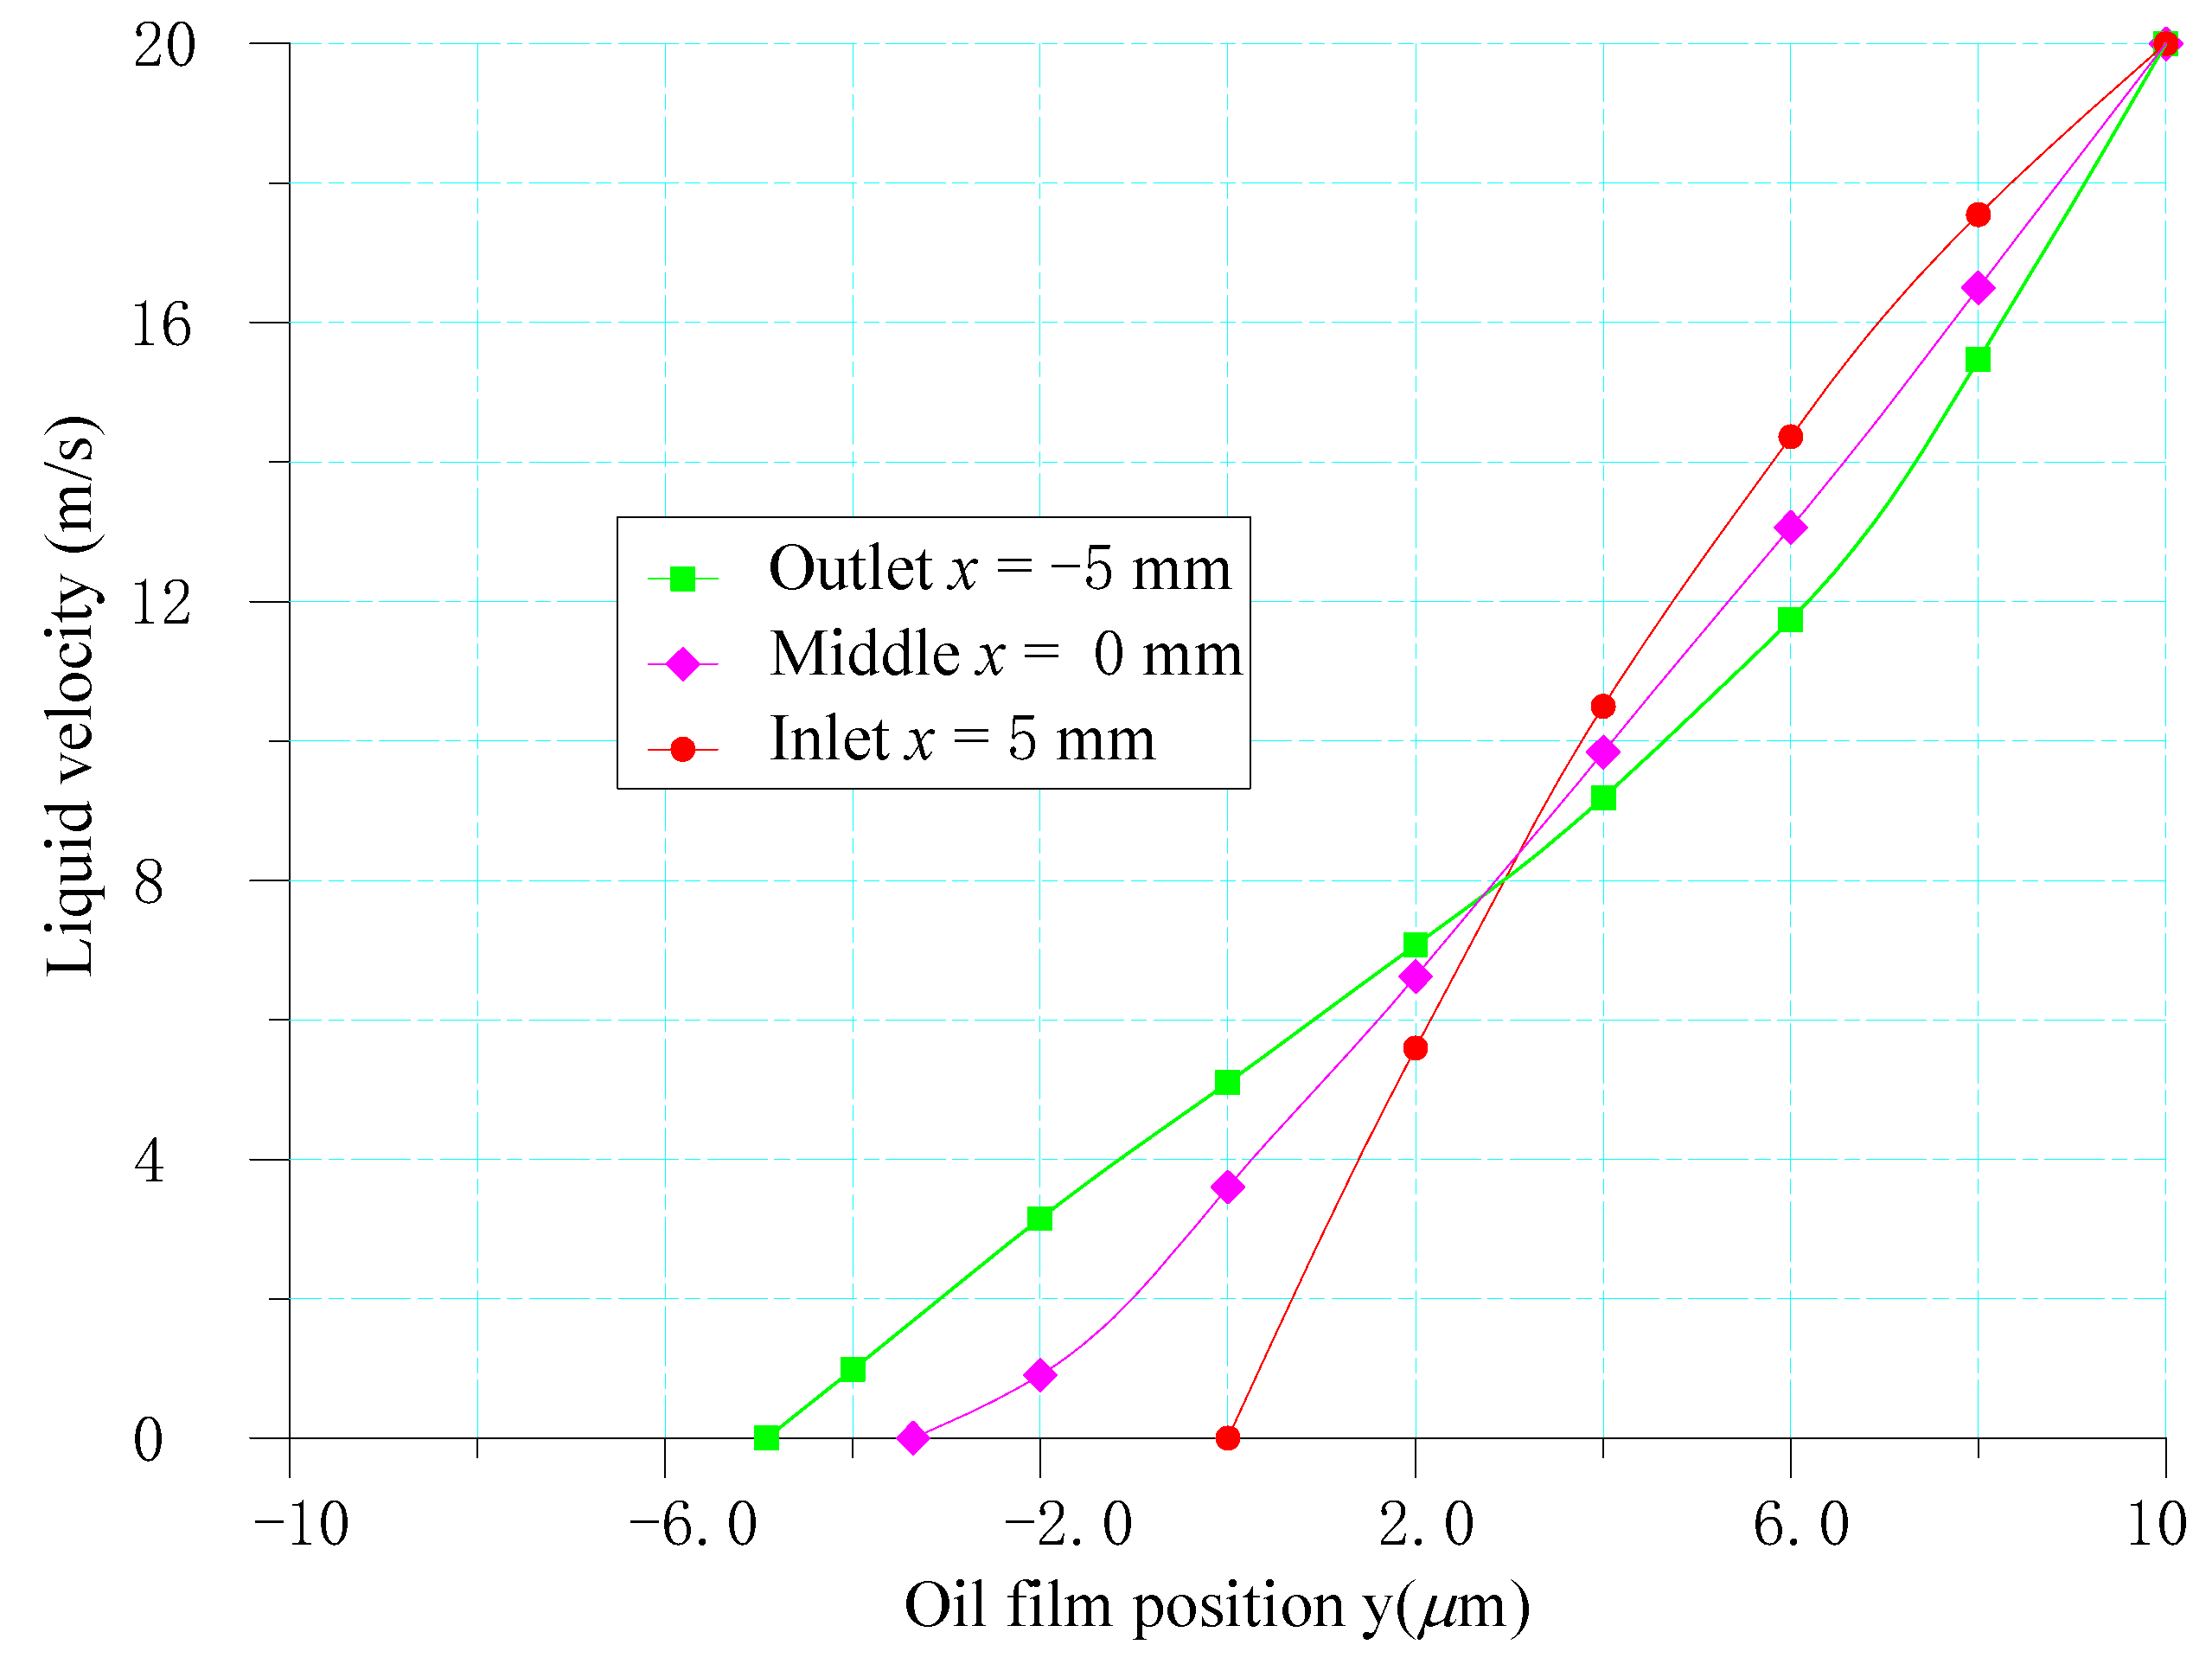
For the untextured smooth surface, applying CFD analysis, the flow velocity variation along the oil film thickness direction at the inlet position, the center position and the outlet position is obtained as shown in Figure 6.
In the figure, x = 5 mm is the entrance position, x = 0 mm is the center position, and x = −5 mm is the exit position.
3.2. Simulation of Convergence Wedge-Slide Bearing Pressure Distribution on the Streamwise and Transverse Textured Surfaces
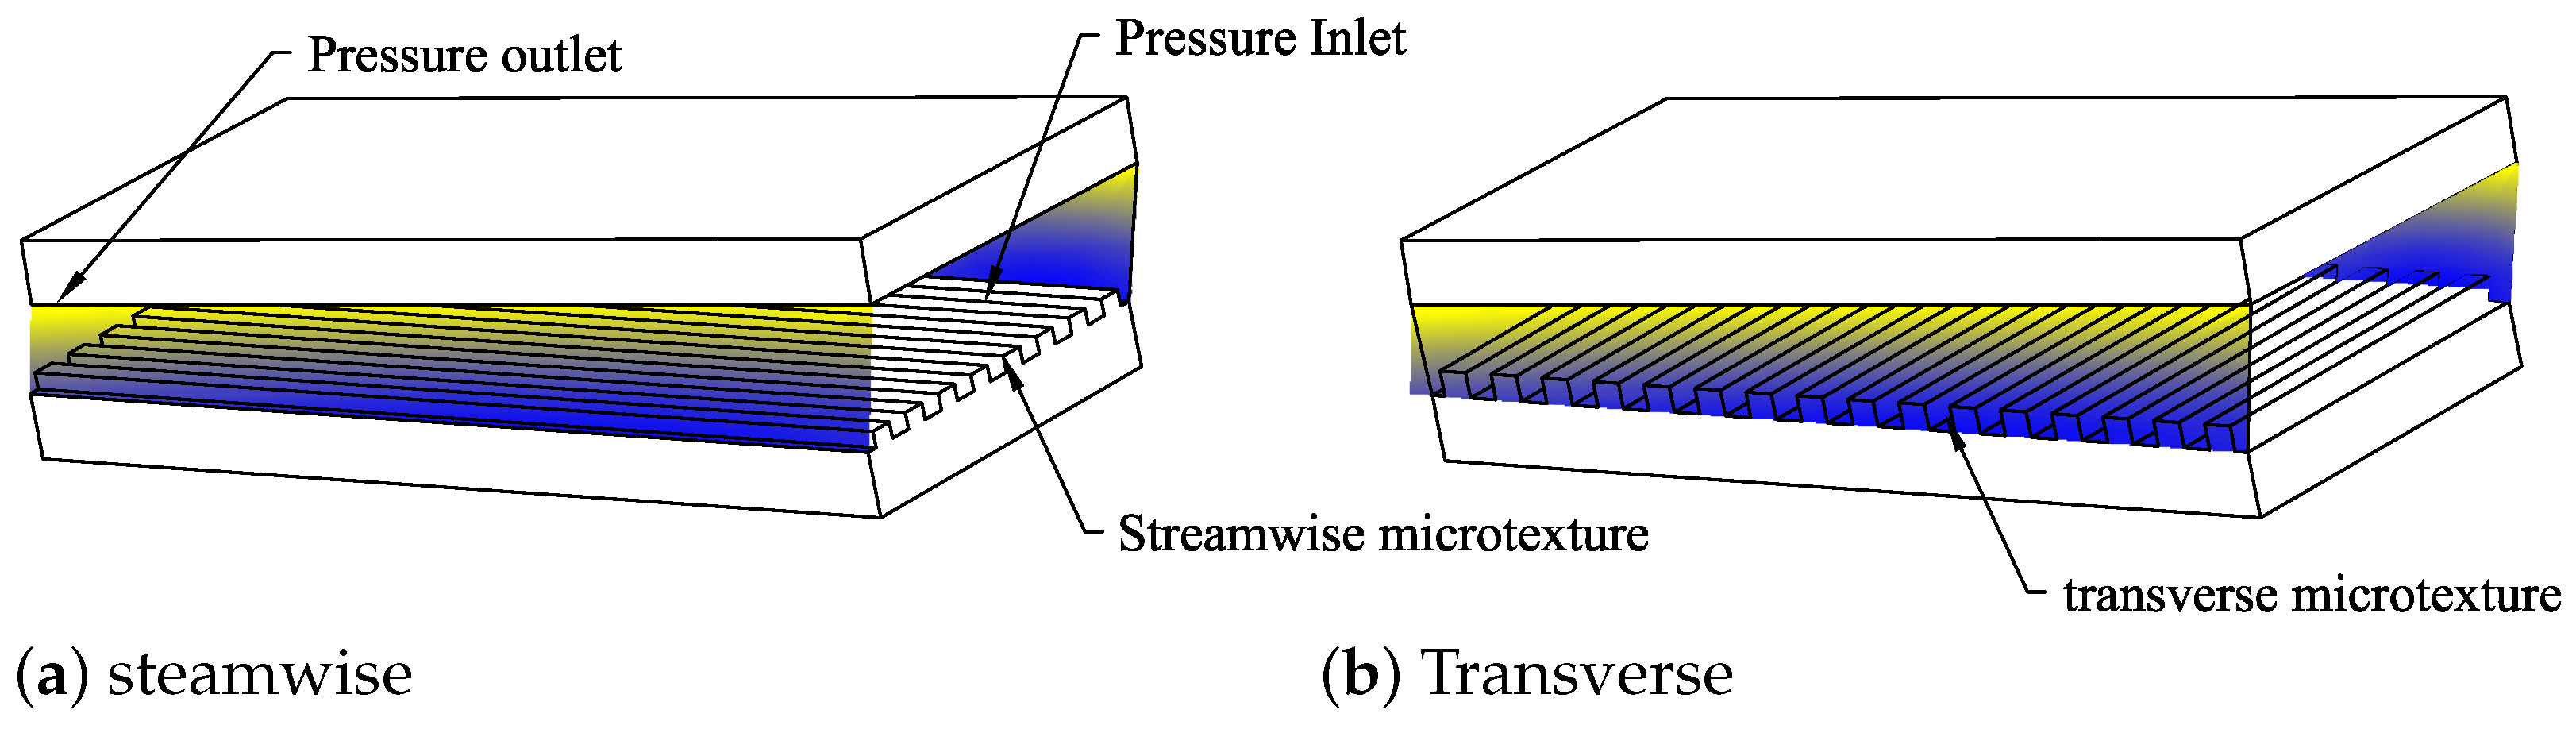
Figure 7 shows two microtexture models (streamwise and transverse) selected to analyze the effects of texture orientation on bearing performance.
The micro-texture topography only considers the rectangular cross-section, and the micro-texture is uniformly distributed, with a micro-textured surface in the whole area on the state wall.
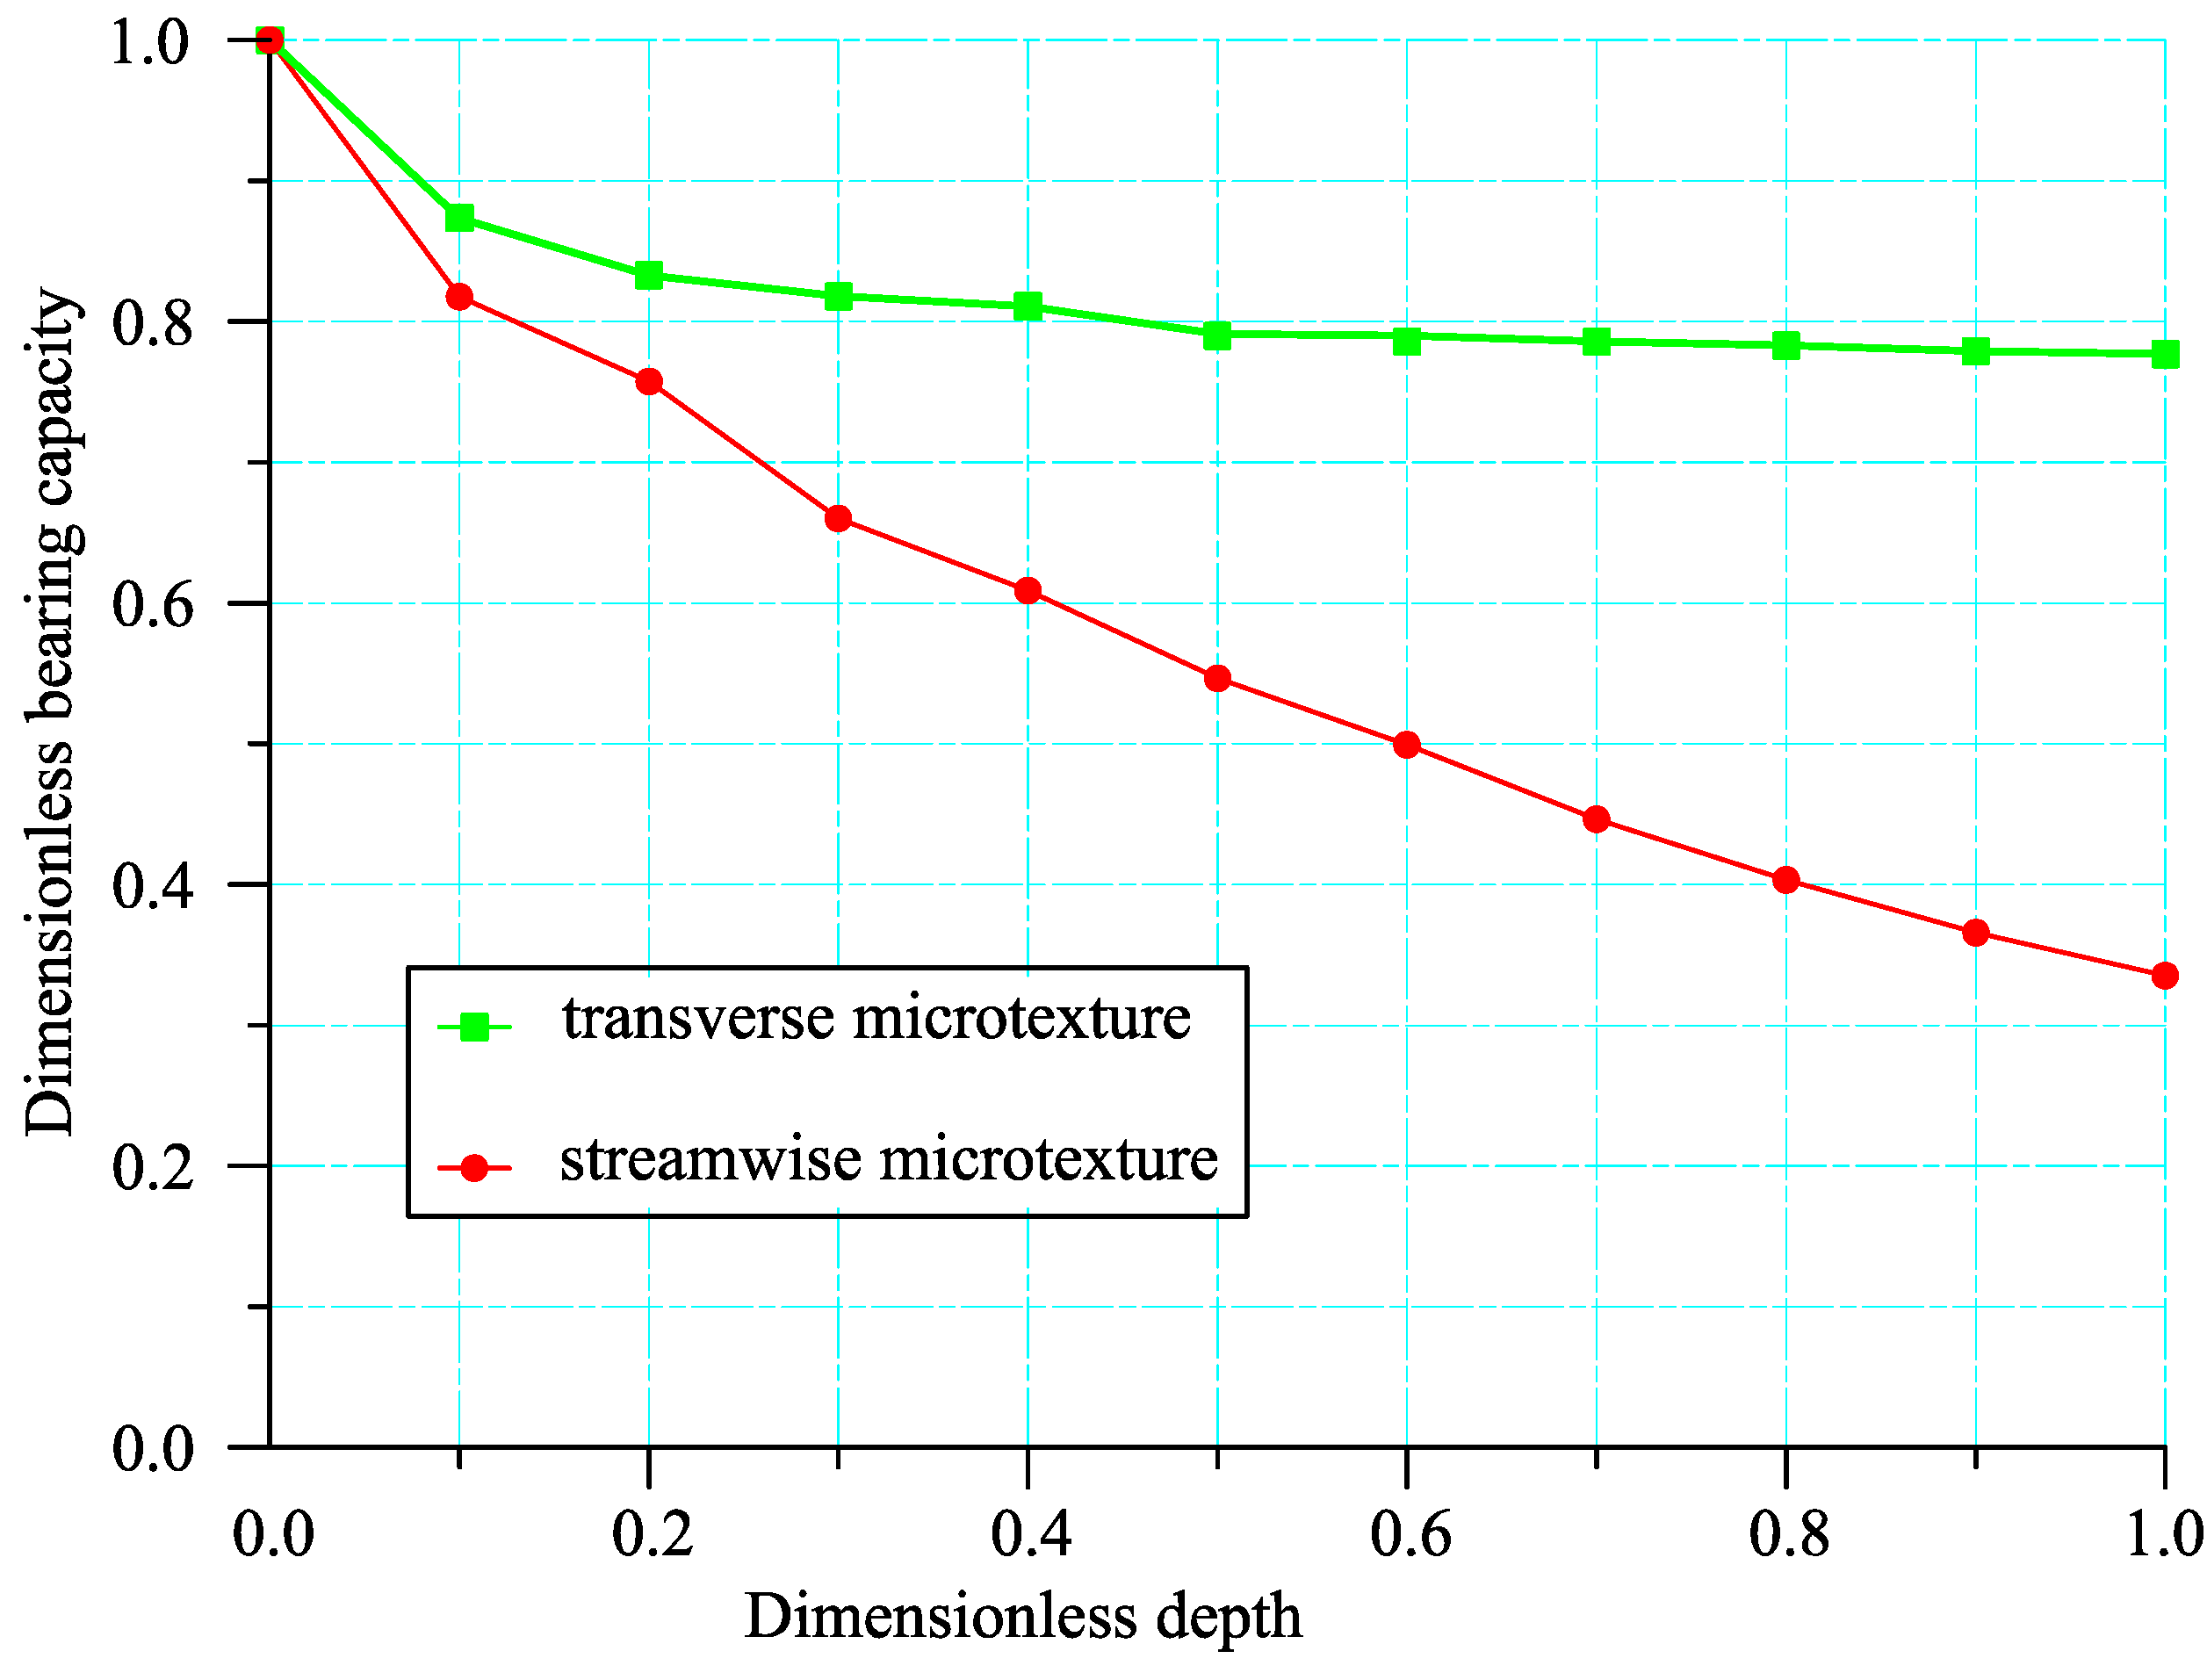
The dimensionless depth is defined as the ratio of the texture depth to the minimum oil film thickness. The minimum oil film thickness is set to 10 μm and the texture groove width is 50 μm. The effect of the dimensionless depth on the carrying capacity is calculated. As shown in Figure 8.
Figure 8 shows that the dimensionless LCC decreases with the increase of the dimensionless depth. The transverse texture has better LCC than the streamwise texture. With the increasing dimensionless texture depth, the dimensionless relative LCC of the transverse texture shows a decreasing trend, but it is not a rapid linear decrease like the streamwise texture, but is basically stable at around 0.78, that is, the transverse texture decreases. Compared with the smooth surface, the LCC of the structural model is reduced by about 22%.
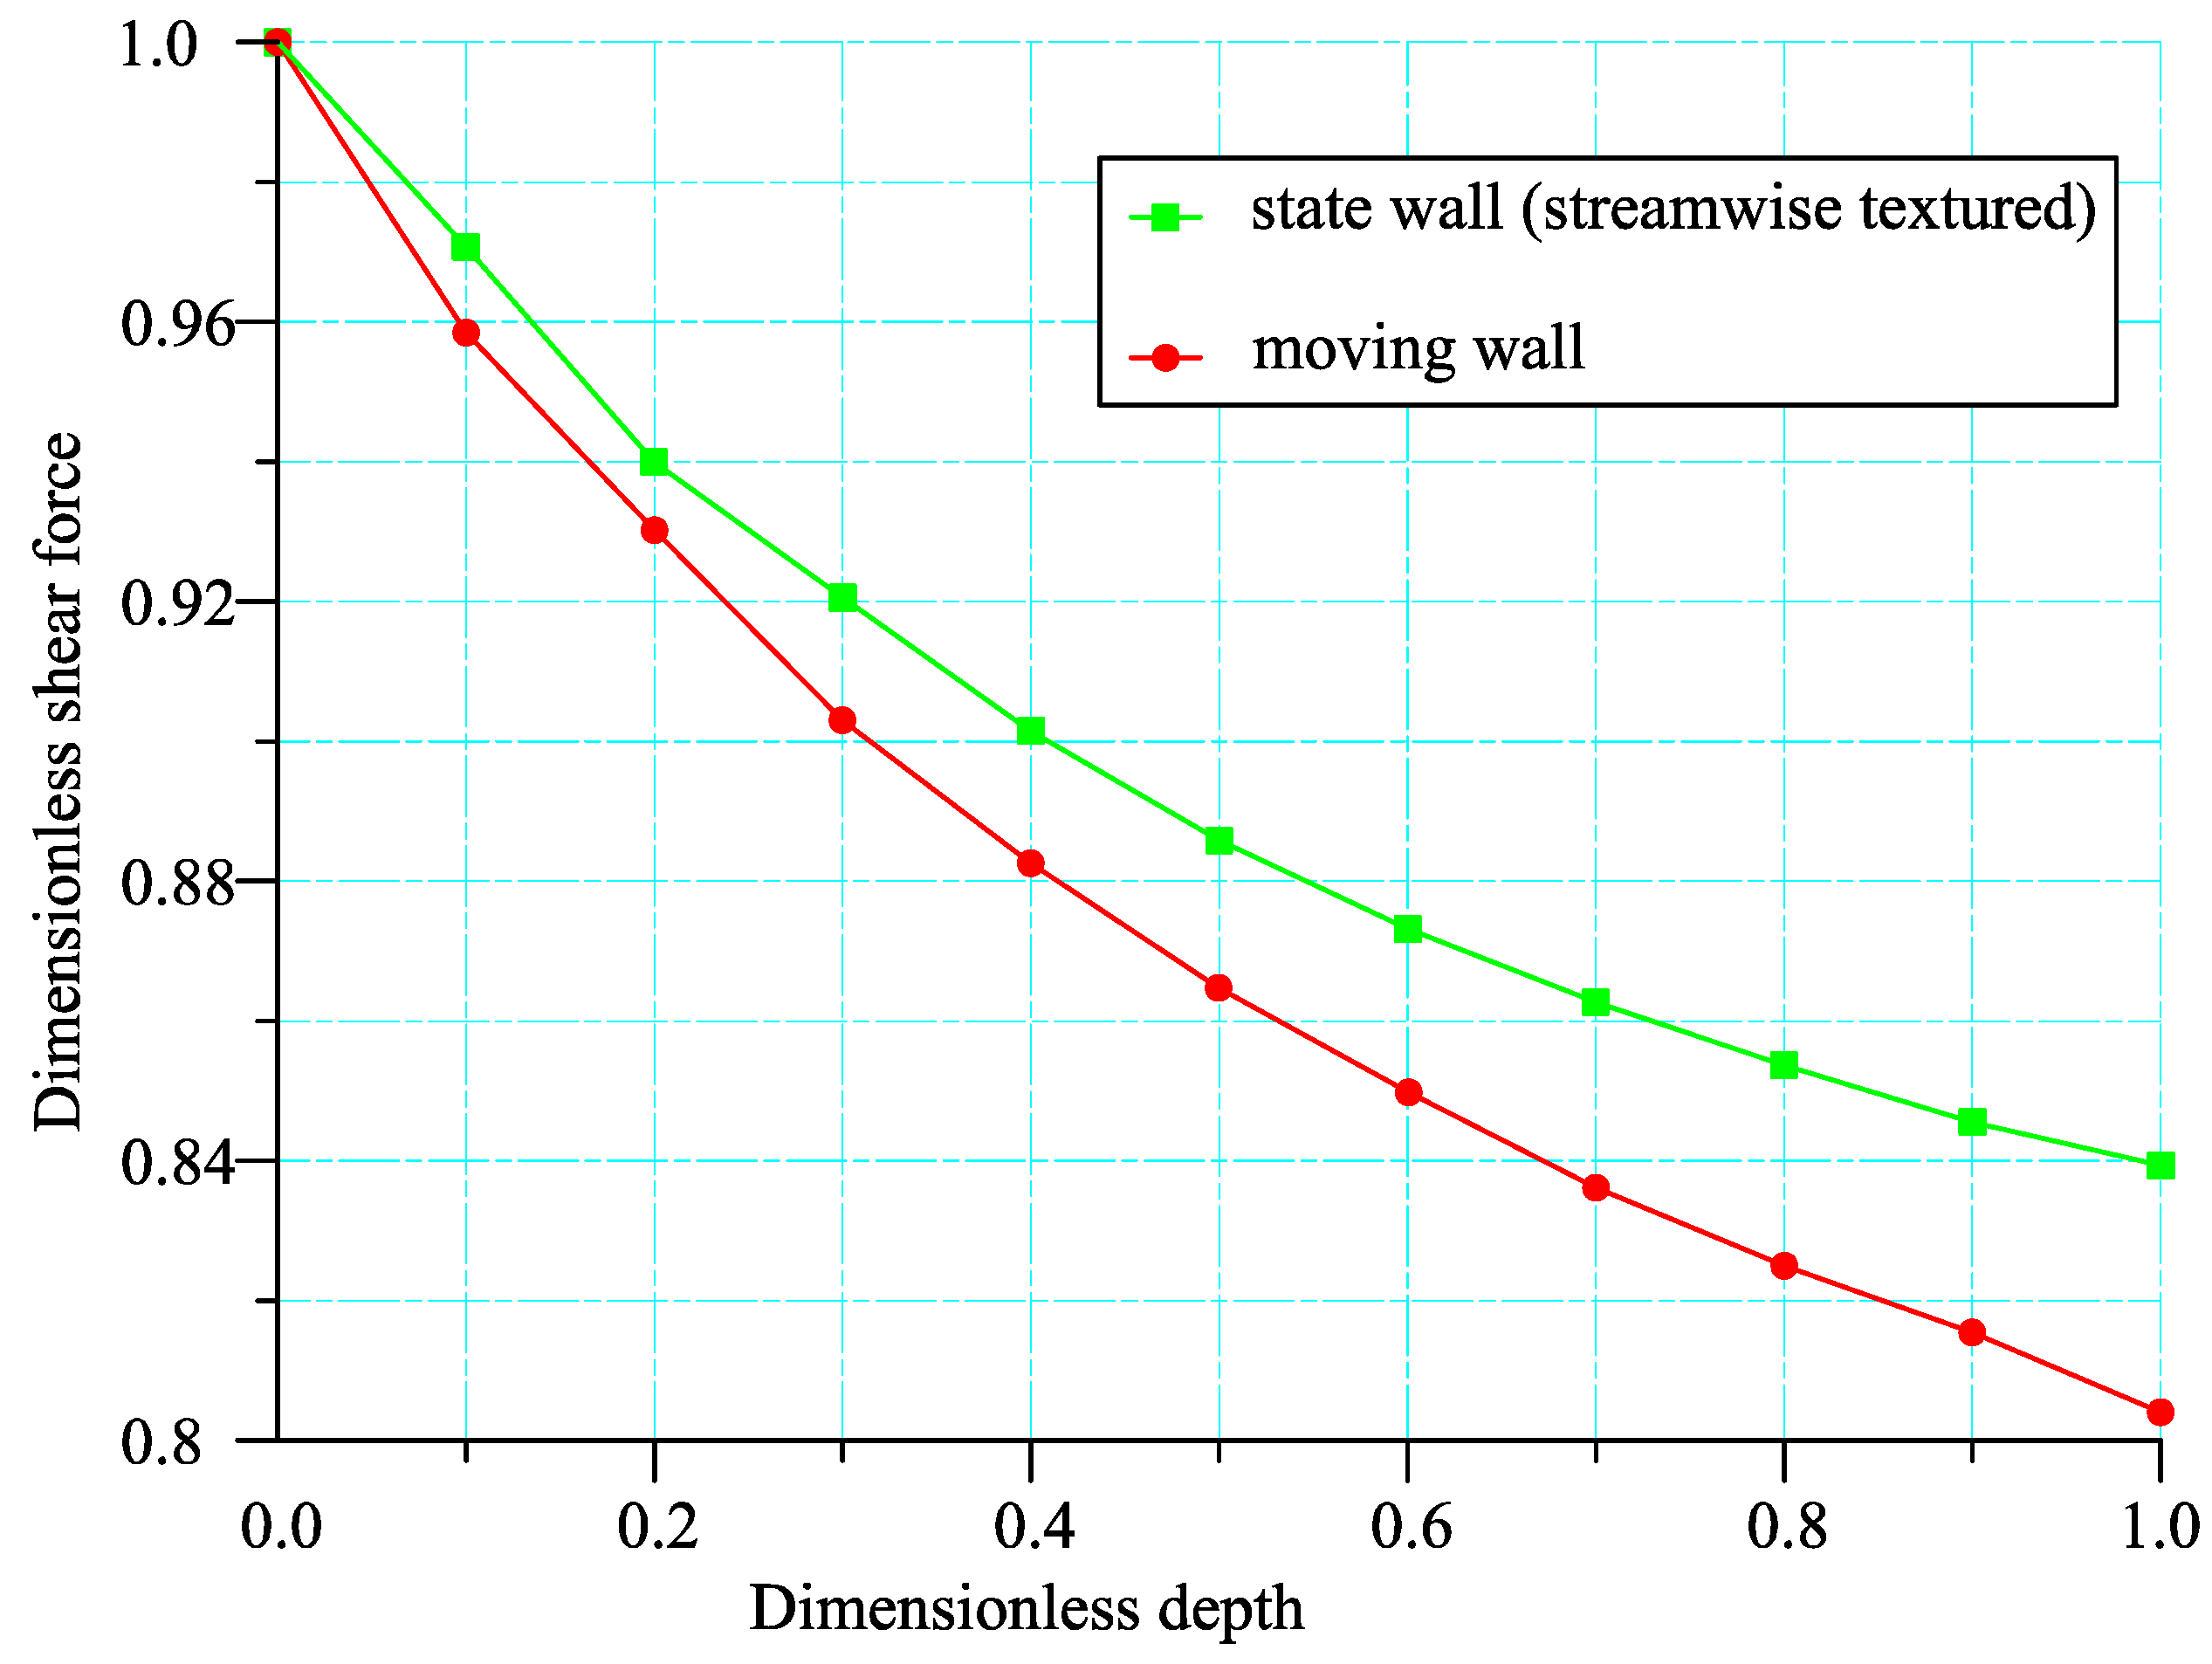
The variation of shear force on the fixed wall and moving wall of the streamwise and transverse microtextures with the dimensionless texture depth is obtained through analysis. Figure 9 shows the variation trend of the dimensionless shear force of the streamwise texture model.
Figure 10 shows that compared with the smooth model without texture, the wall shear force of the streamwise textured model is significantly reduced. The shear force of the moving wall is slightly lower than that of the fixed textured wall. When the dimensionless texture depth is 1, the dimensionless shear force of the upper plate wall is close to 0.8, that is, the drag reduction rate is about 20%.
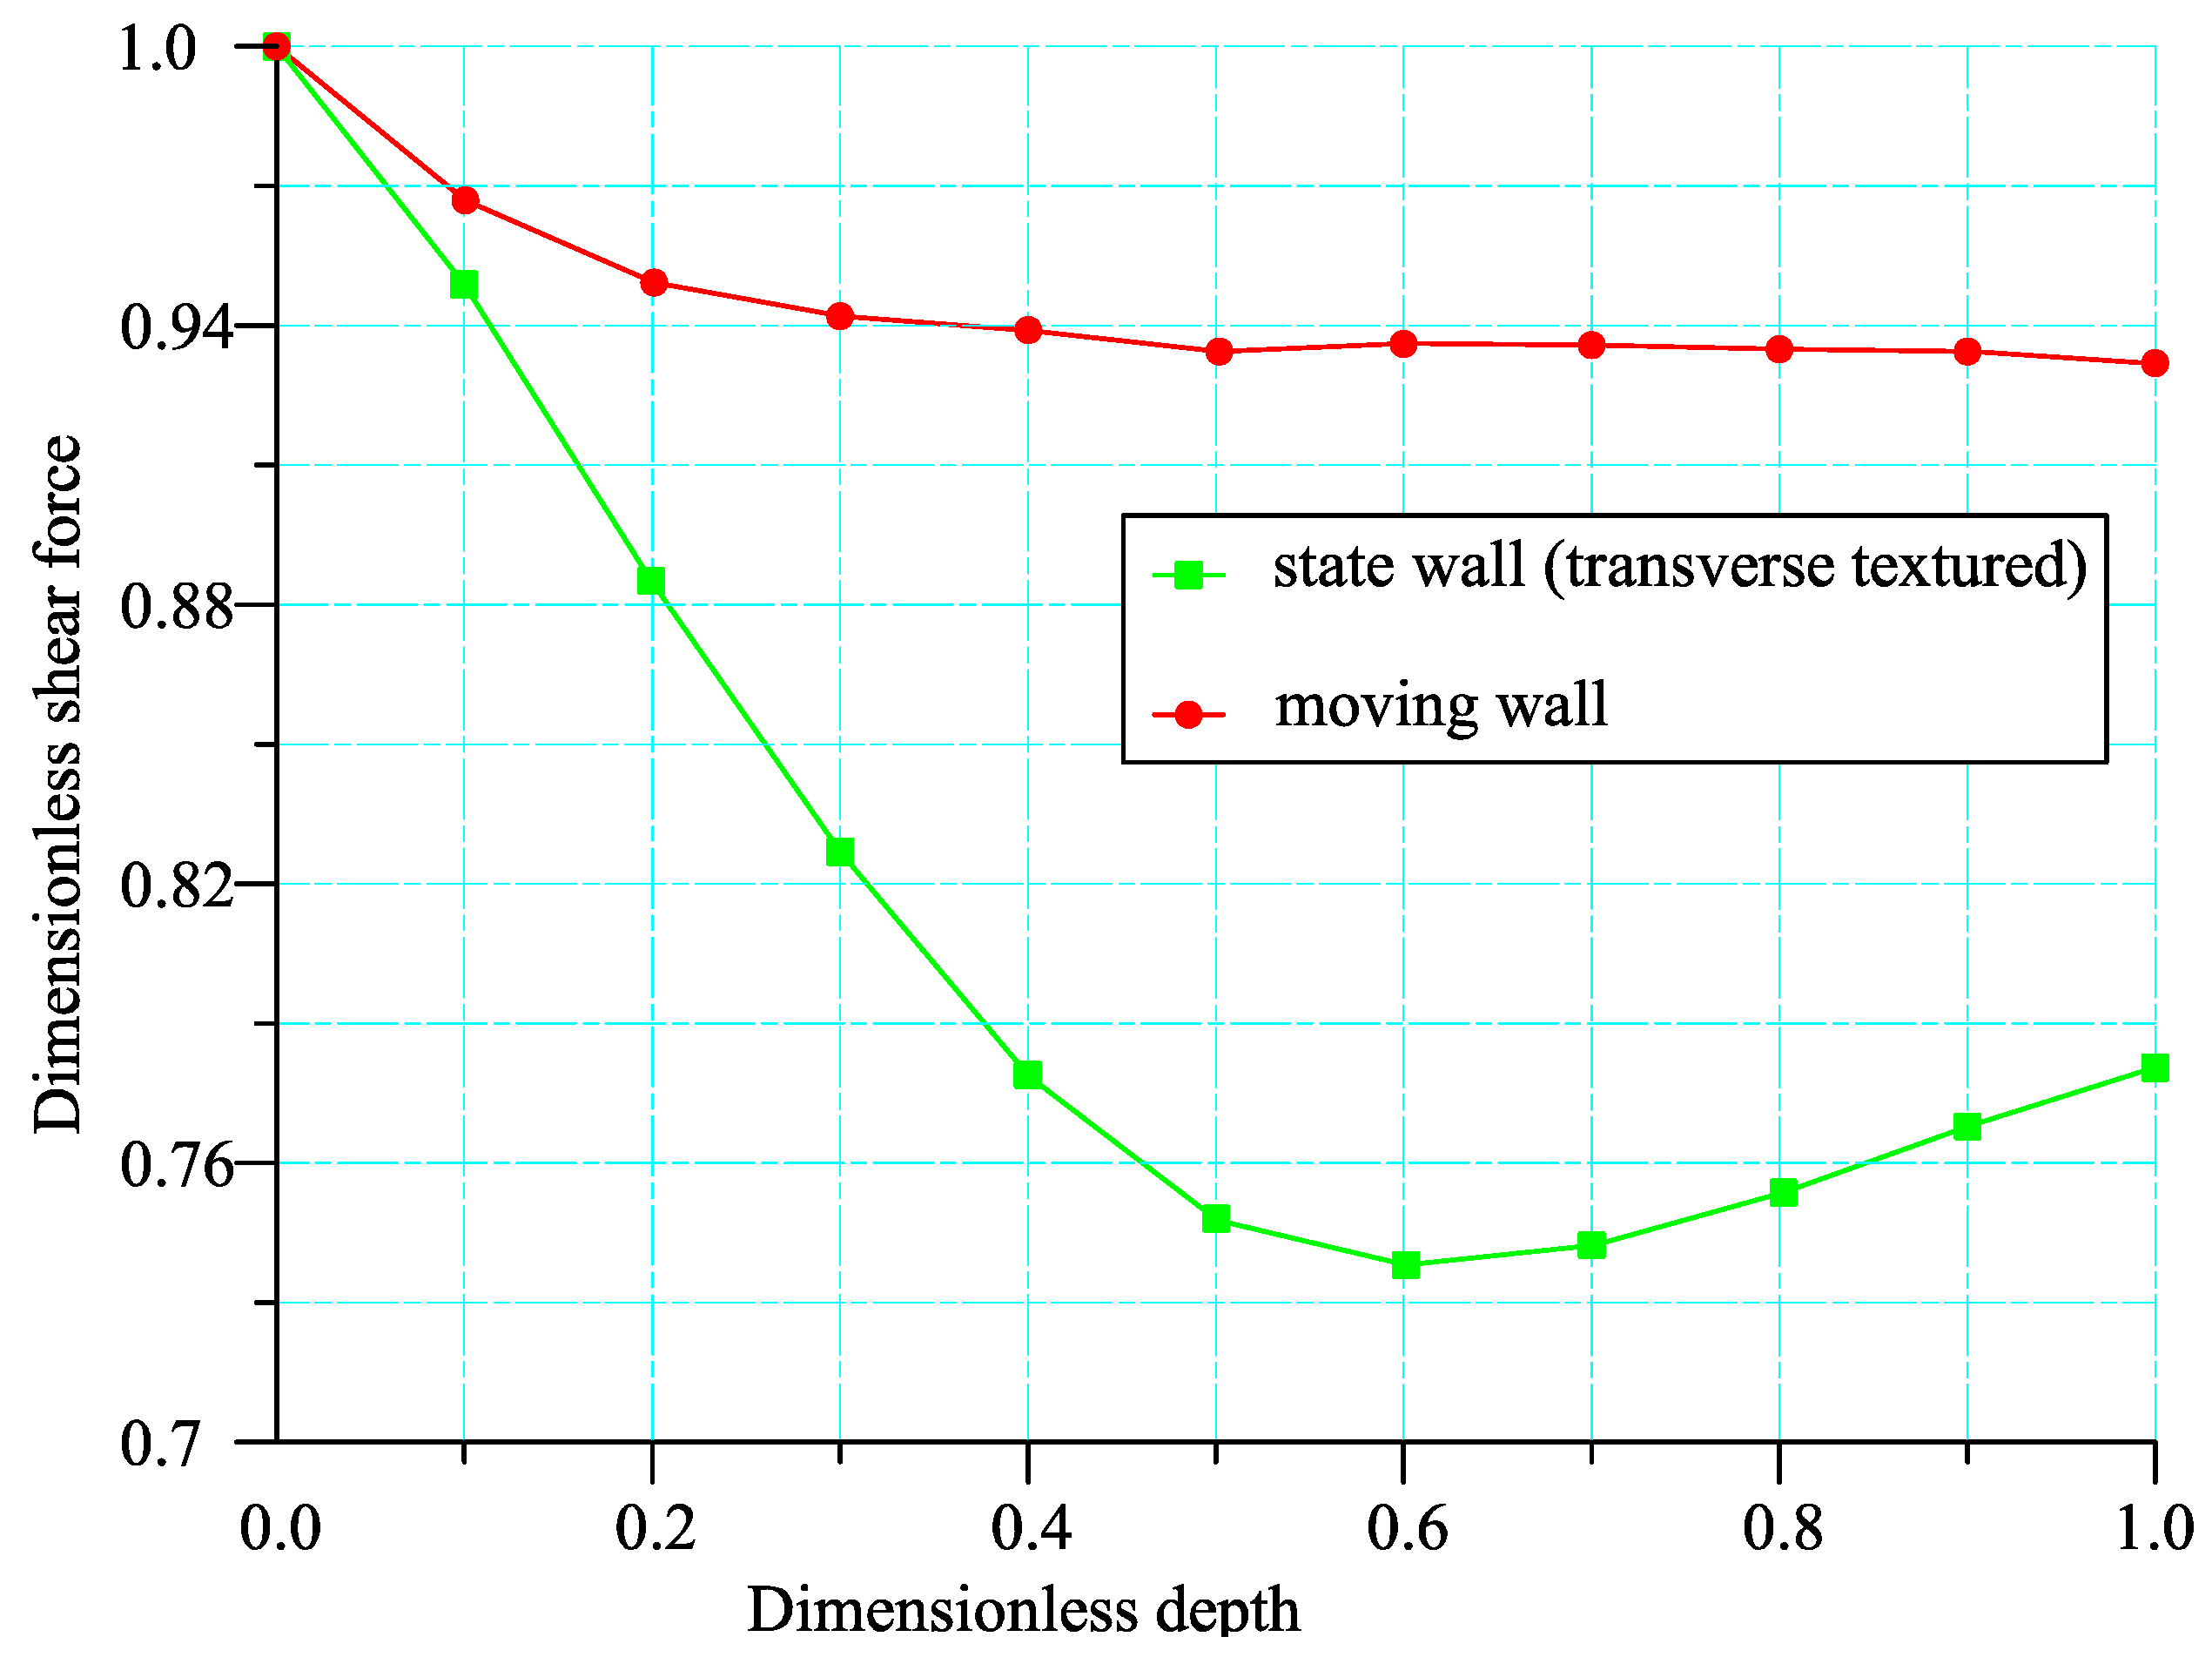
Figure 10 shows the variation trend of dimensionless shear force of the transeverse texture model.
Figure 10 shows that when the transverse micro-textured slider bearing is applied, the shear force between the moving wall and the fixed wall is quite different. The dimensionless depth is about 0.6 close to the minimum value, and then the shear force increases gradually. The dimensionless shear force of the moving wall is basically between 0.93 and 0.94. Usually, the drag reduction of hydrostatic bearings has no meaning for fixed walls, so the drag reduction characteristics reflected by the transverse texture are not obvious.
3.3. Lubrication Characteristic Analysis of Local Texture Model
No matter what texture type is used, the above analysis shows that the LCC is lower than that of the untextured smooth wall model, which obviously does not meet the lubrication goals of improving LCC and reducing wall friction. Therefore, the loss caused by changing the full texture model needs to be considered.
First of all, it is determined that only suitable microtextures are produced in the required bearing parts, the length of the slider bearing is set as L, and two parameters and are defined to describe the size and entrance distance of the microtextures. The length of the microtexture is and the entrance distance . Combining and , the wall shear force and pressure distribution of the slider bearing were analyzed. Among them, the dimensionless shear force on the wall surface of the streamwise texture is shown in Table 3.
The analysis shows that with the same value of , the texture distribution on the inlet side can obtain a higher drag reduction rate.
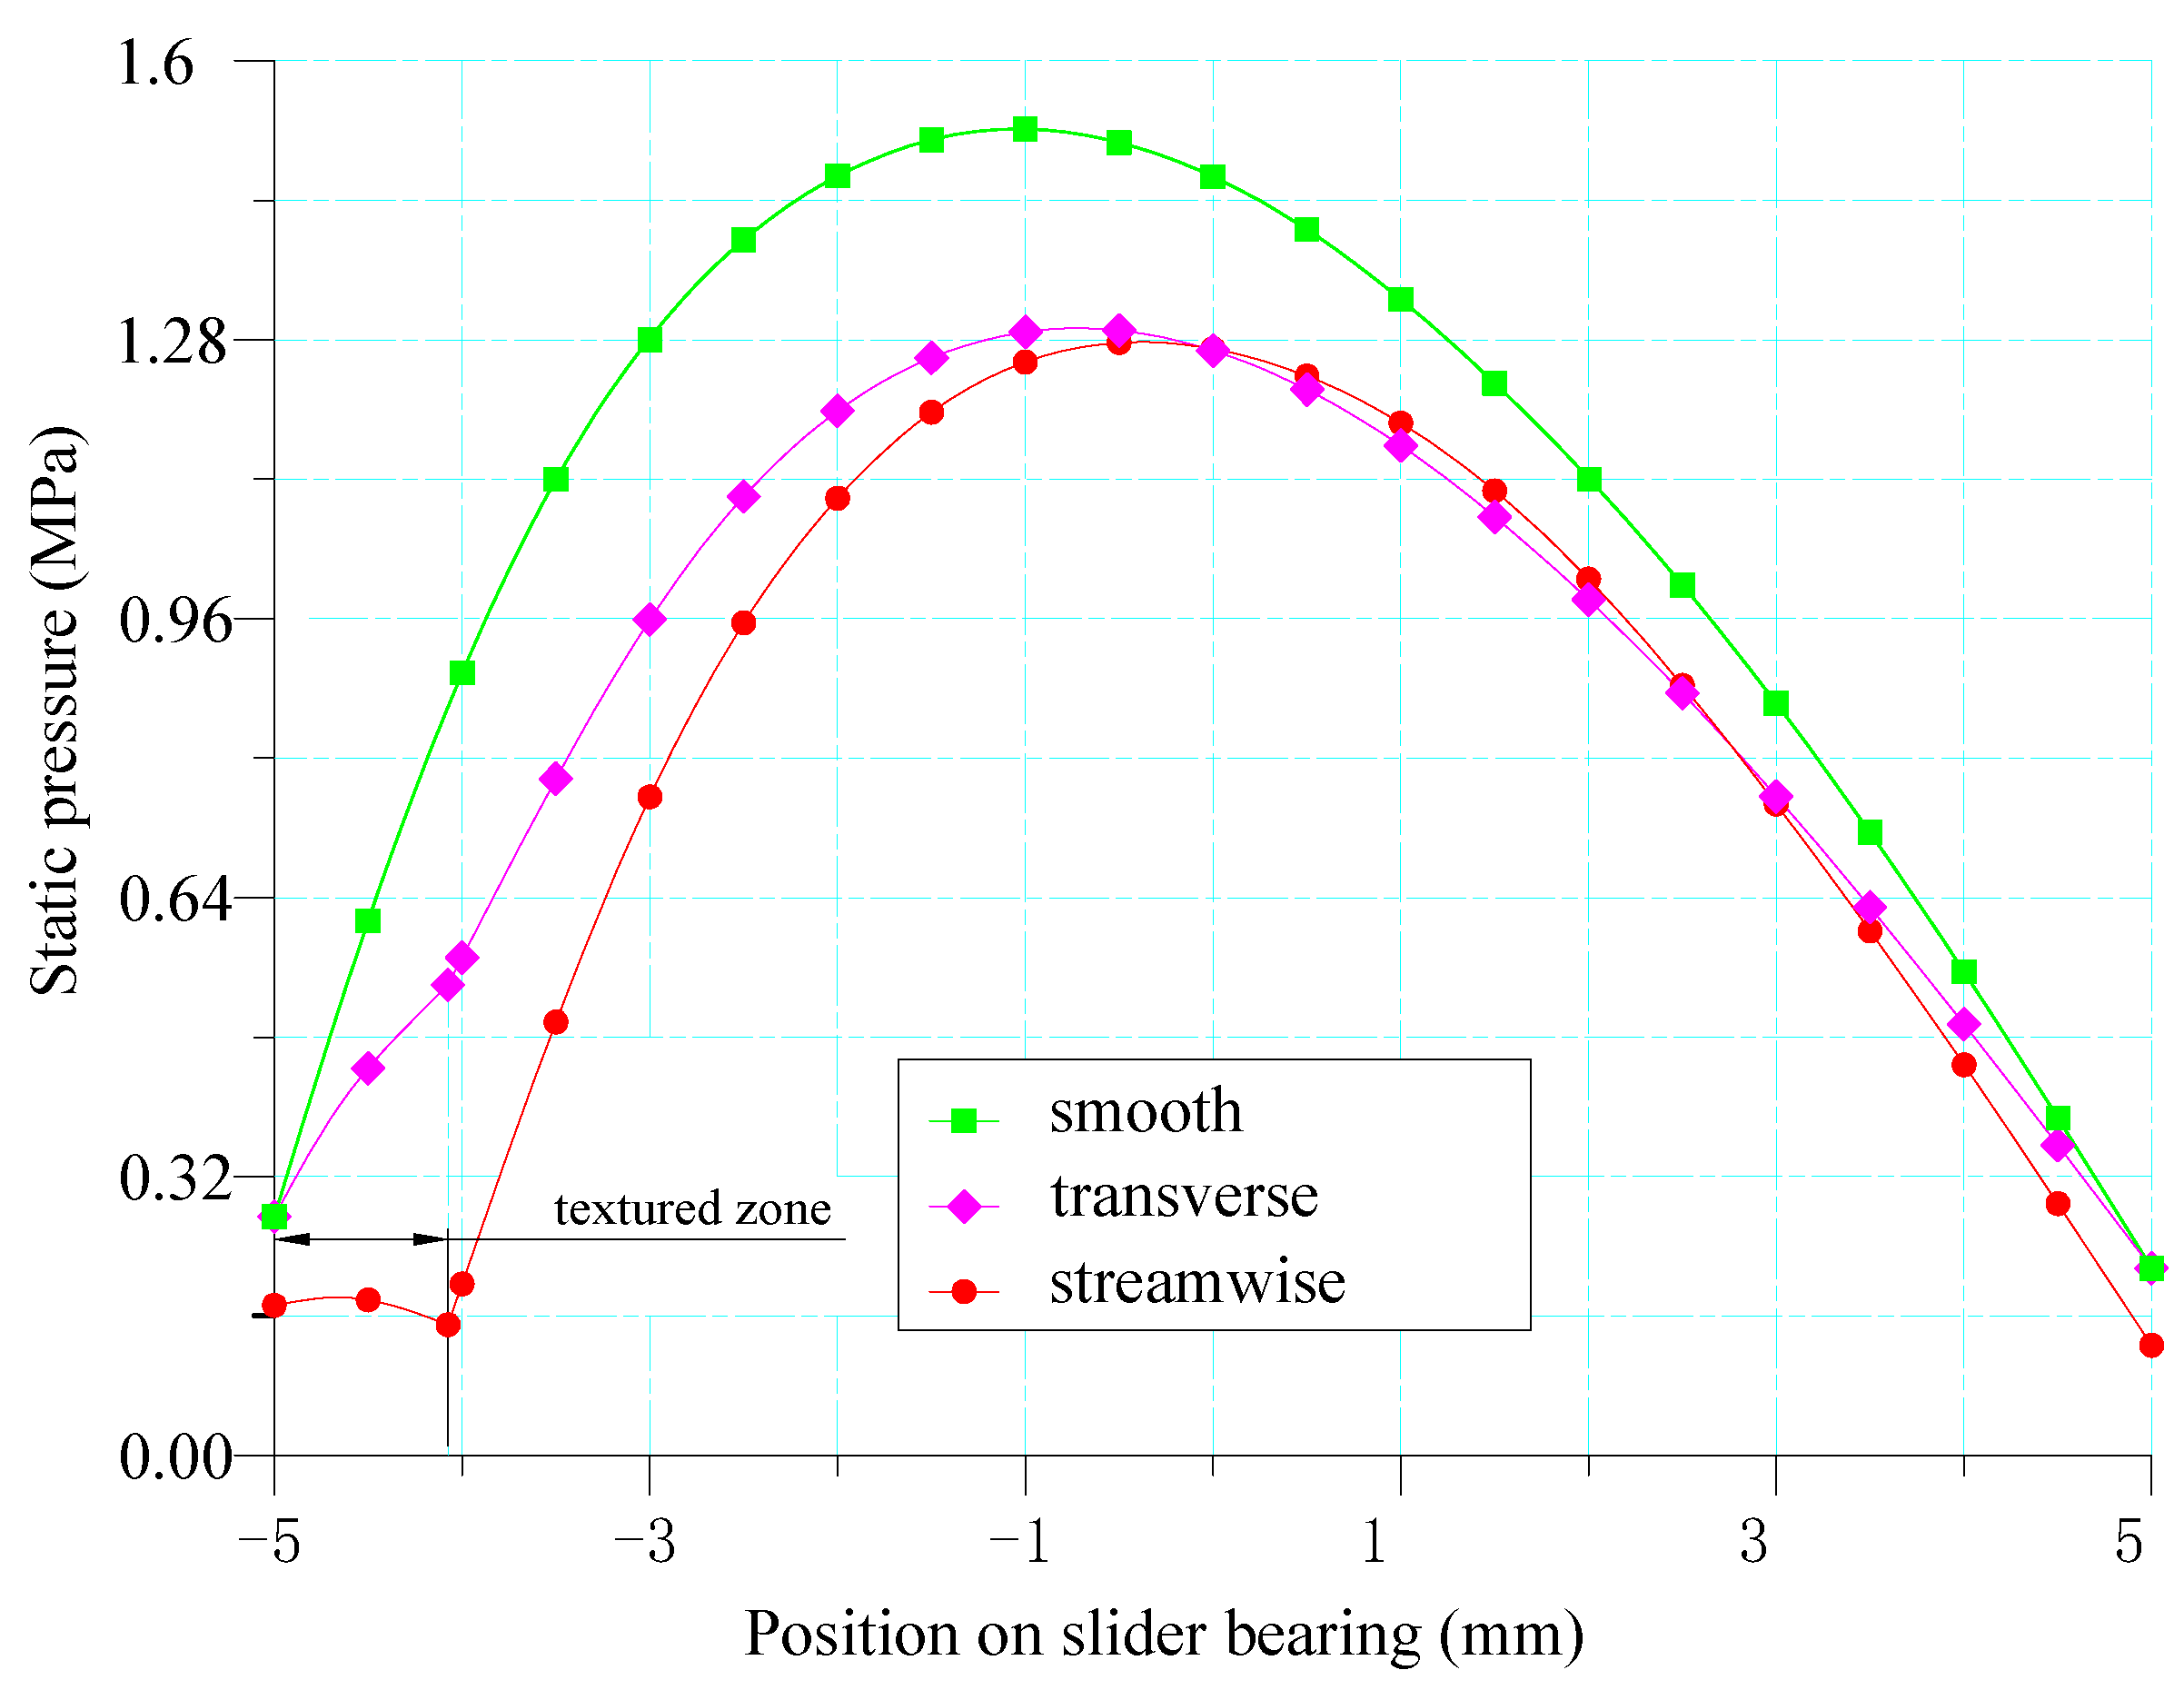
Figure 11 calculates the pressure distribution of the smooth surface, transverse textured and streamwise textured slider bearings for setting = 0.1, = 0.9.
It can be seen from the figure that the introduction of microtexture not only affects the small area of the texture distribution, but also affects the size and shape of the pressure distribution of the entire bearing. However, the maximum load-carrying capacity of a smooth bearing cannot be reached regardless of the distribution.
4. Analysis of Bearing Lubrication Characteristics under Cavitation Effect
4.1. Analysis of Lubrication Characteristics of Divergent Wedge Slider Bearing Based on Full Texture Model
In the analysis of a convergent wedge texture model, CFD calculation can be completed only by using a pressure-based solver. For the divergent wedge texture model, the influence of cavitation should be considered.
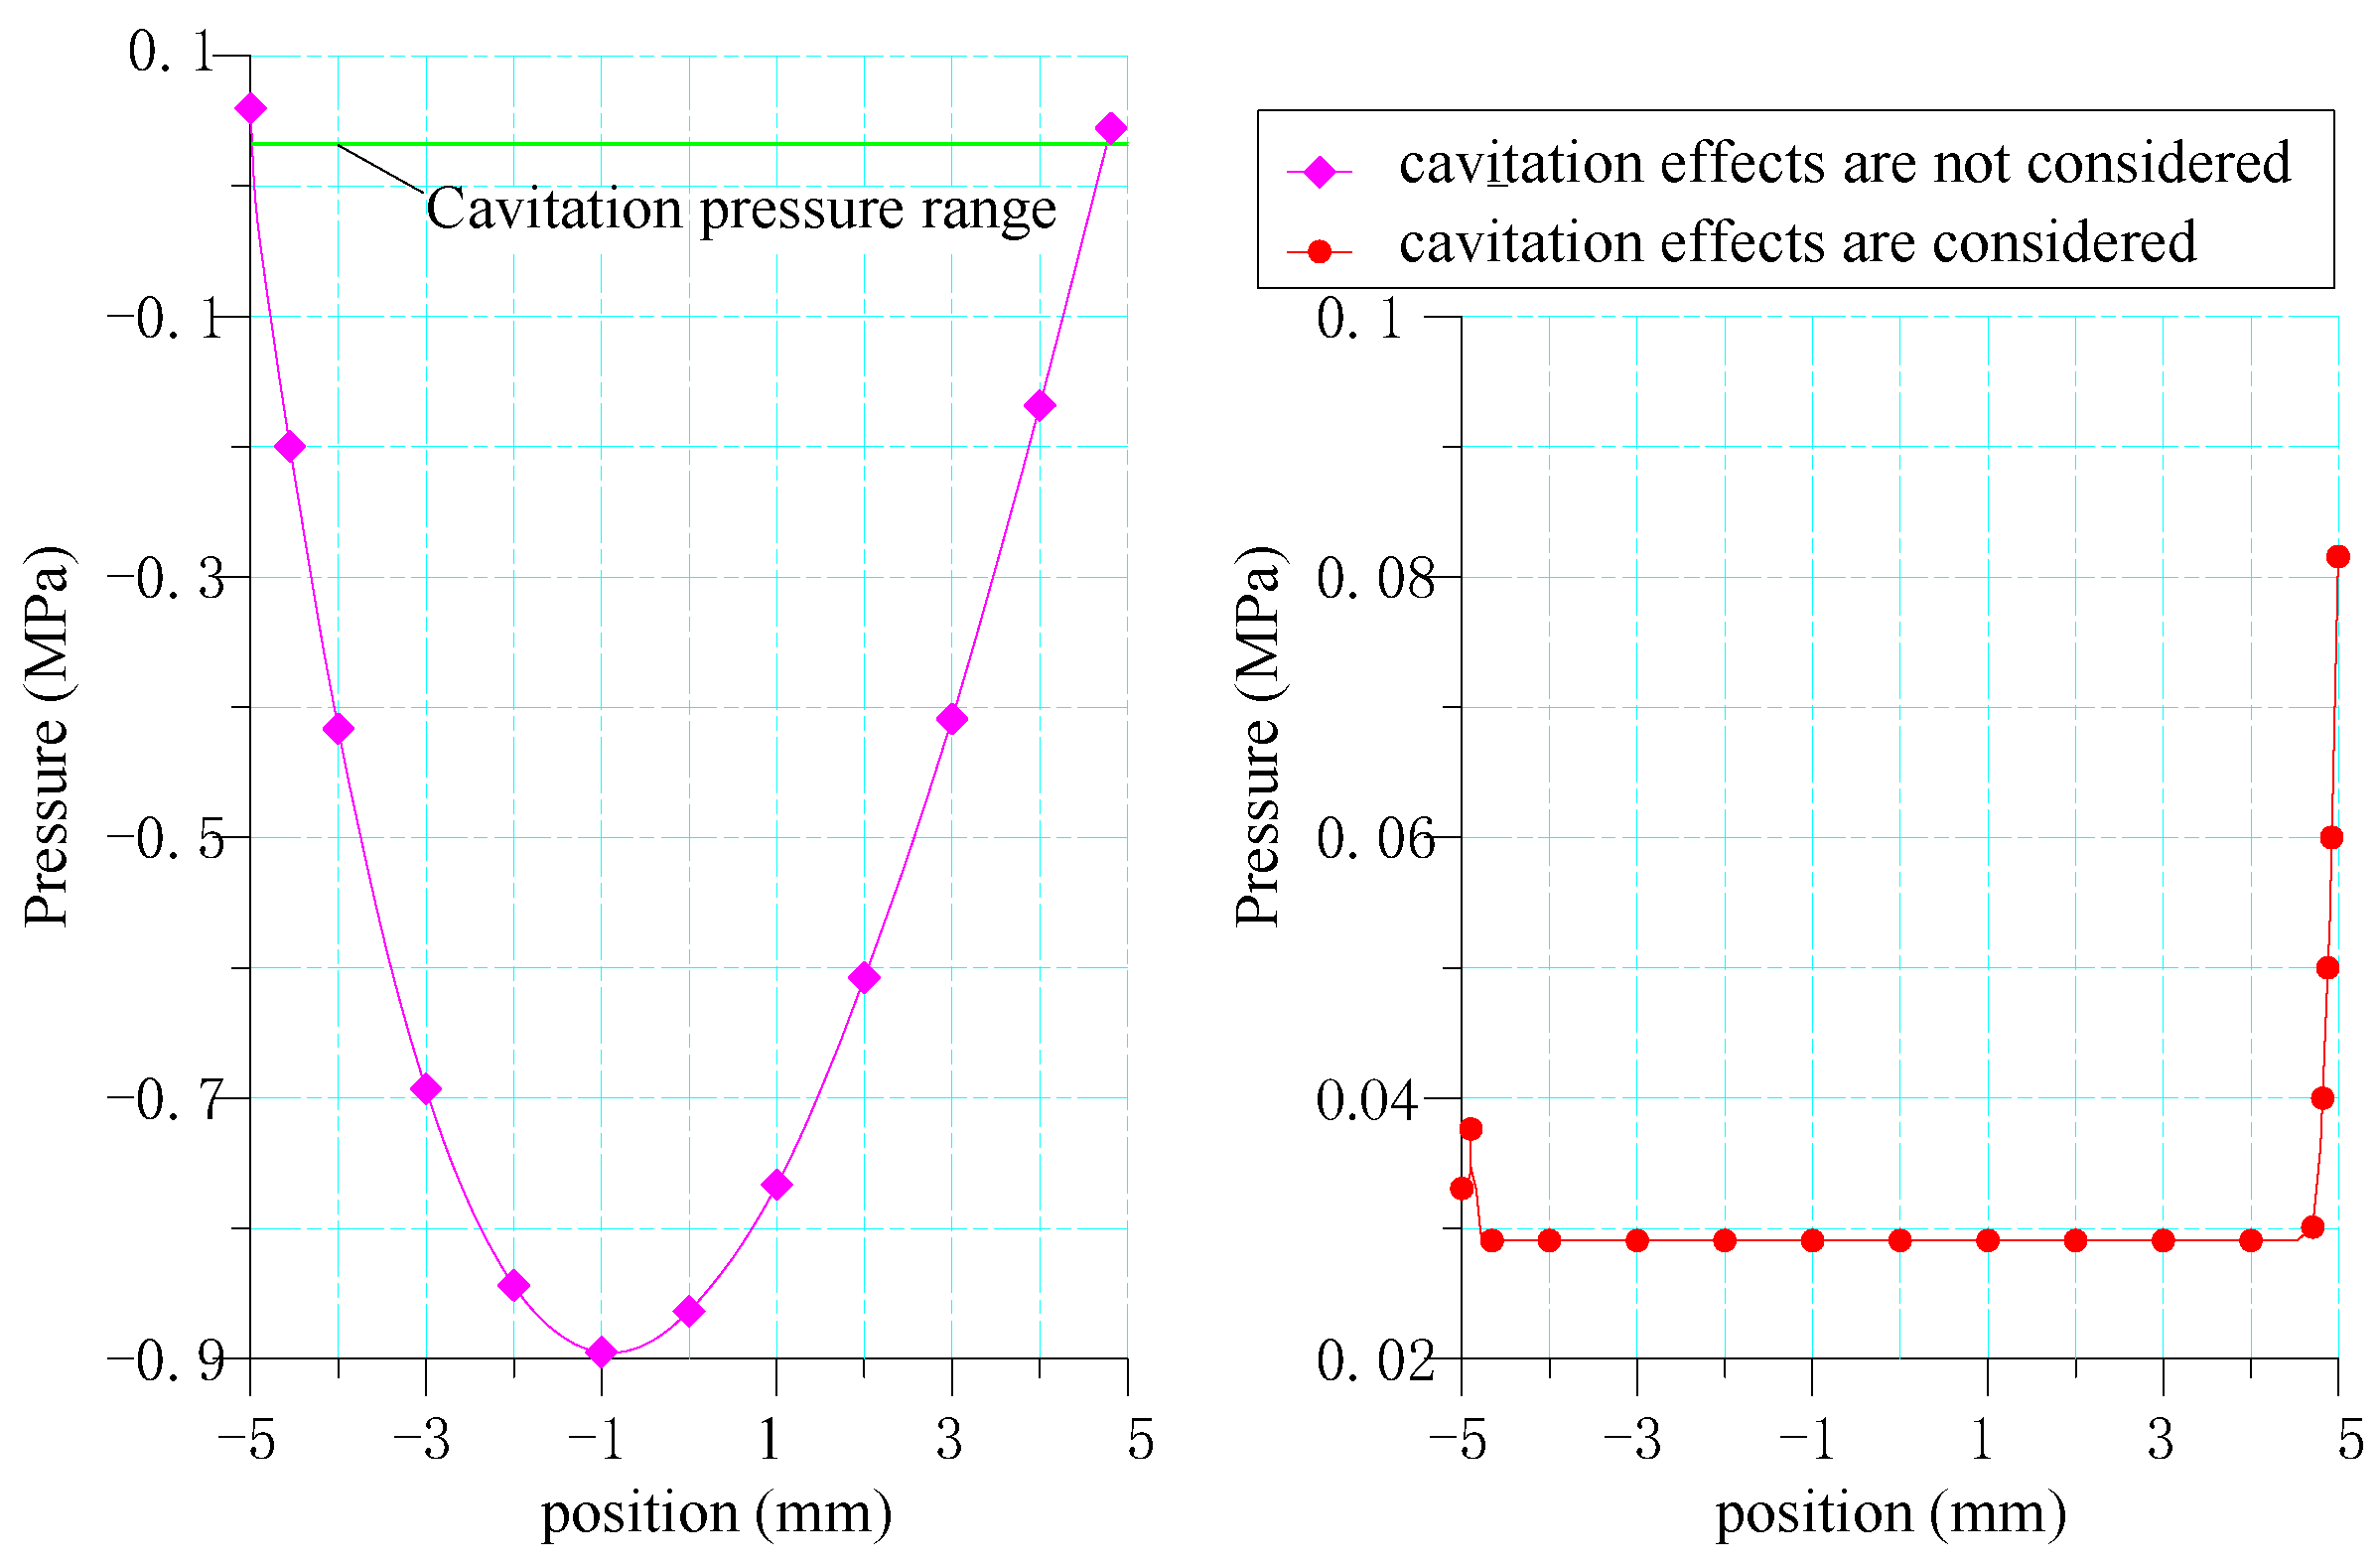
Figure 12 shows the distribution of oil film pressure on the moving wall before and after considering the cavitation effect when the streamwise dimensionless texture depth is 0.5. The abscissa −5 mm point in the figure corresponds to the oil film inlet, and +5 mm corresponds to the oil film outlet. The figure on the left shows the situation without considering the cavitation effect. The oil film pressure distribution is similar to a parabola. When the x-axis coordinate is about −1 mm, there is a minimum pressure of −0.9 MPa (absolute pressure); the picture on the right shows the case considering the cavitation effect. On the moving wall, the oil film pressure in the middle of the wall is equal to the cavitation pressure. There is a sudden change in the pressure value at the inlet and outlet of the oil film, and the oil film pressure at the inlet. The strength first increases to 0.038 MPa and then decreases to the cavitation pressure, while the oil film pressure at the outlet surges from the cavitation pressure to about 0.082 MPa. The upper part of the left figure shows the pressure position of cavitation pressure, showing the huge difference between considering and not considering cavitation.
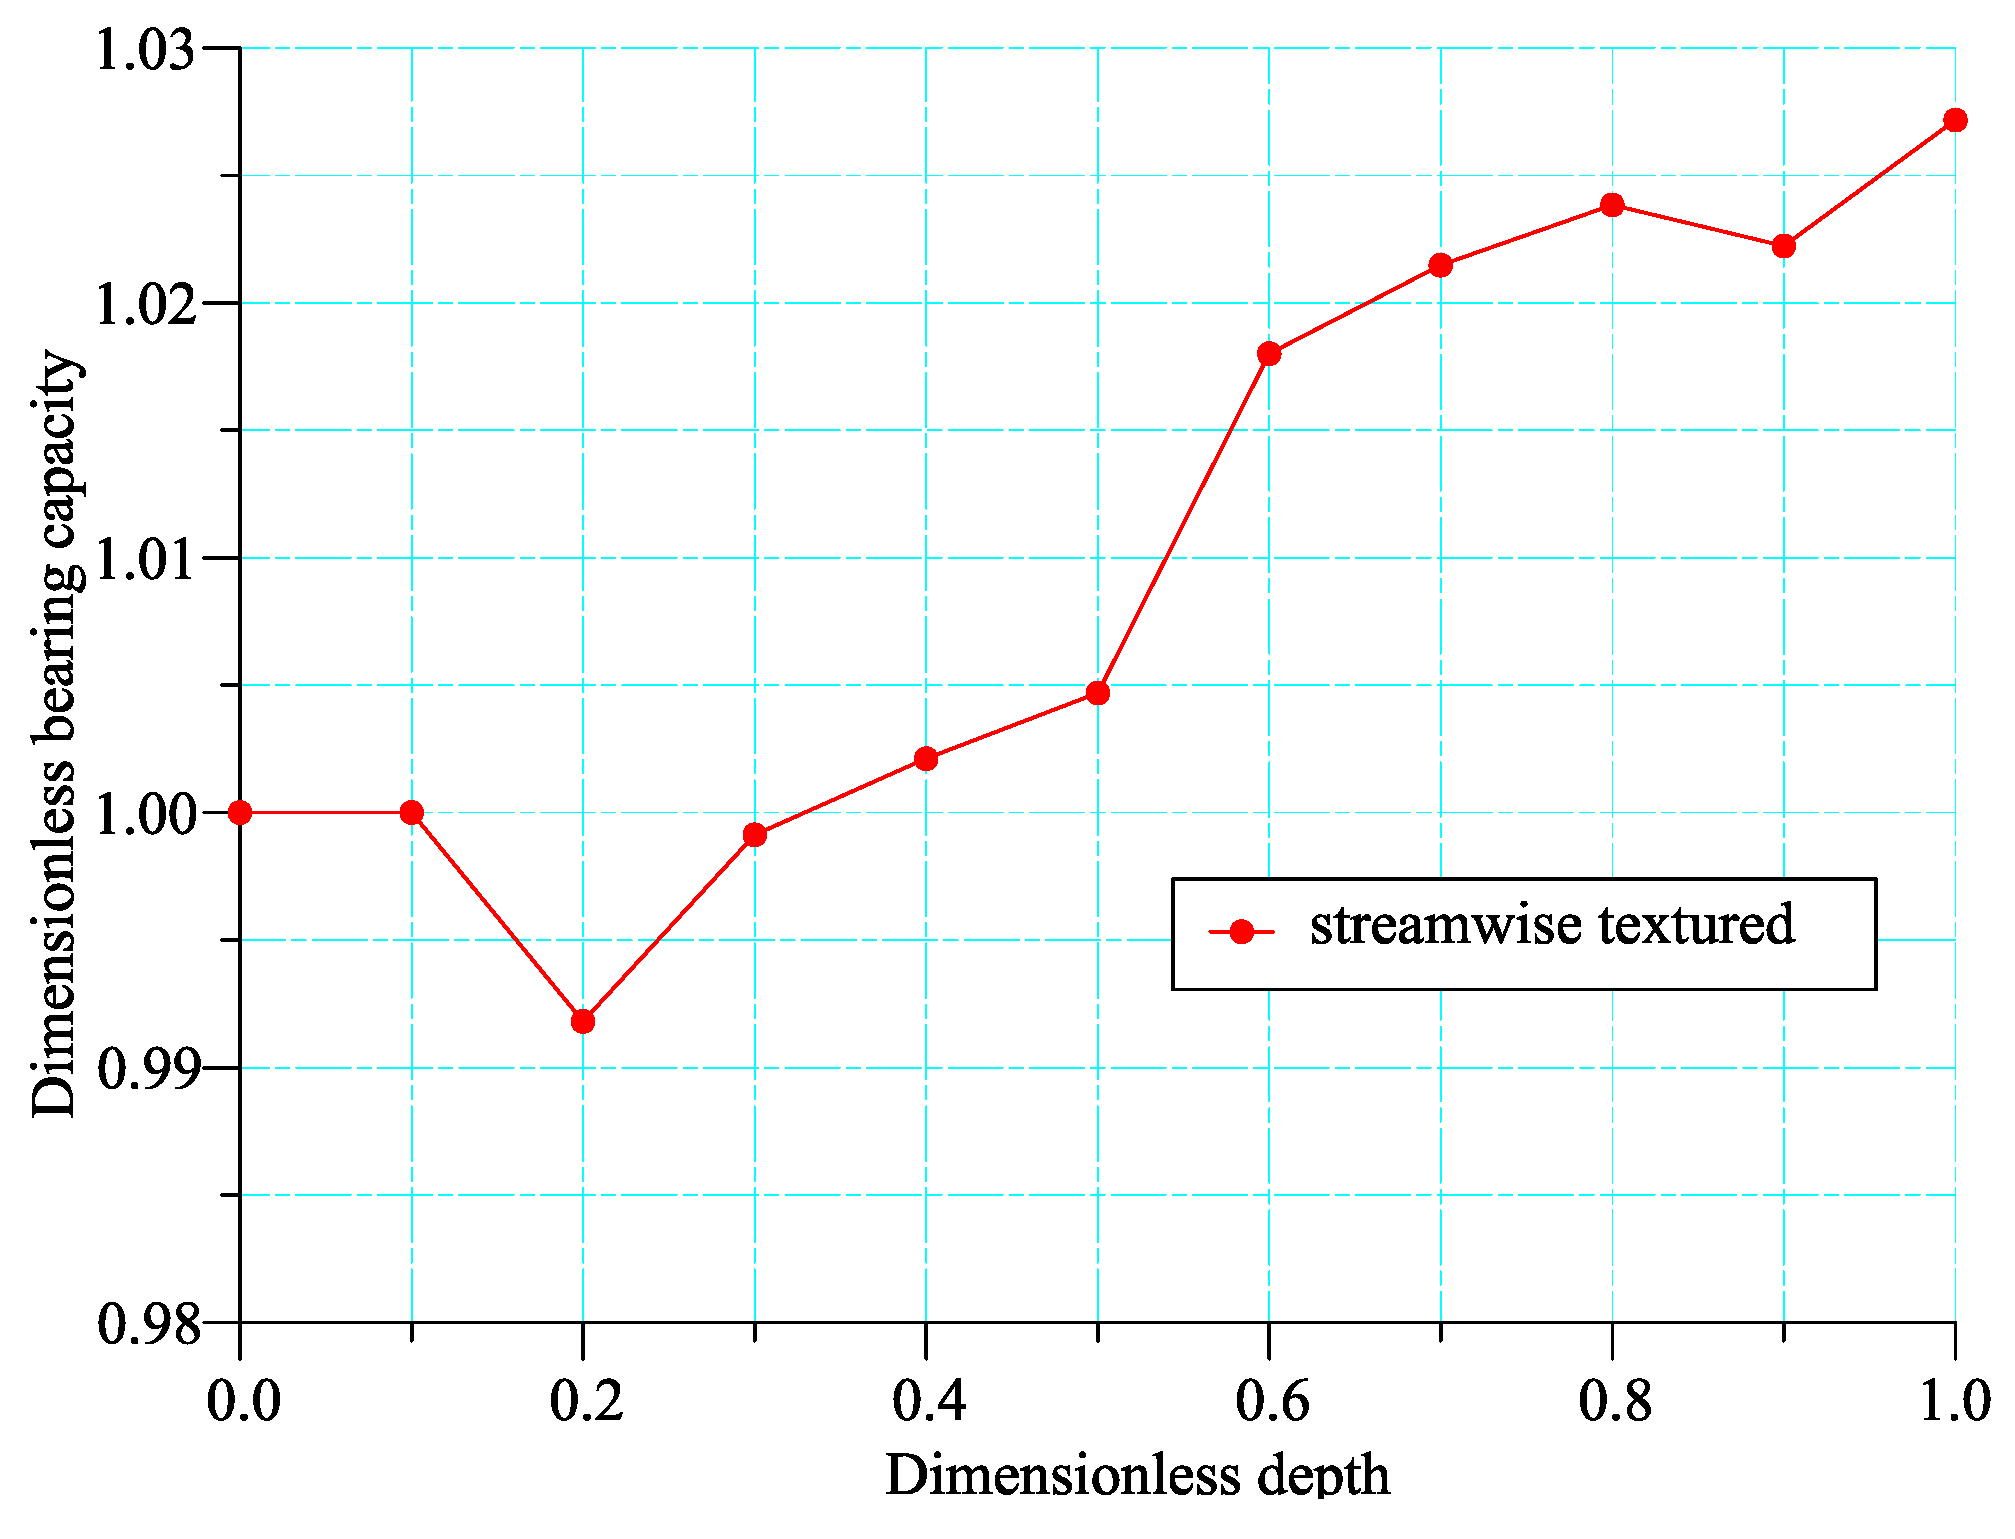
According to the previous analysis, the arrangement of the micro-texture at the inlet will lead to the reduction of LCC, while at the outlet, due to the consideration of cavitation effect, the negative pressure strength obtained without considering cavitation effect is corrected, which improves the LCC. Therefore, it can be imagined that if the cavitation effect is strengthened by using a micro-texture at the exit, the LCC may be improved. Figure 13 shows the corresponding dimensionless bearing capacities from the analysis of different dimensionless texture depths for a fully textured diverging wedge slider bearing.
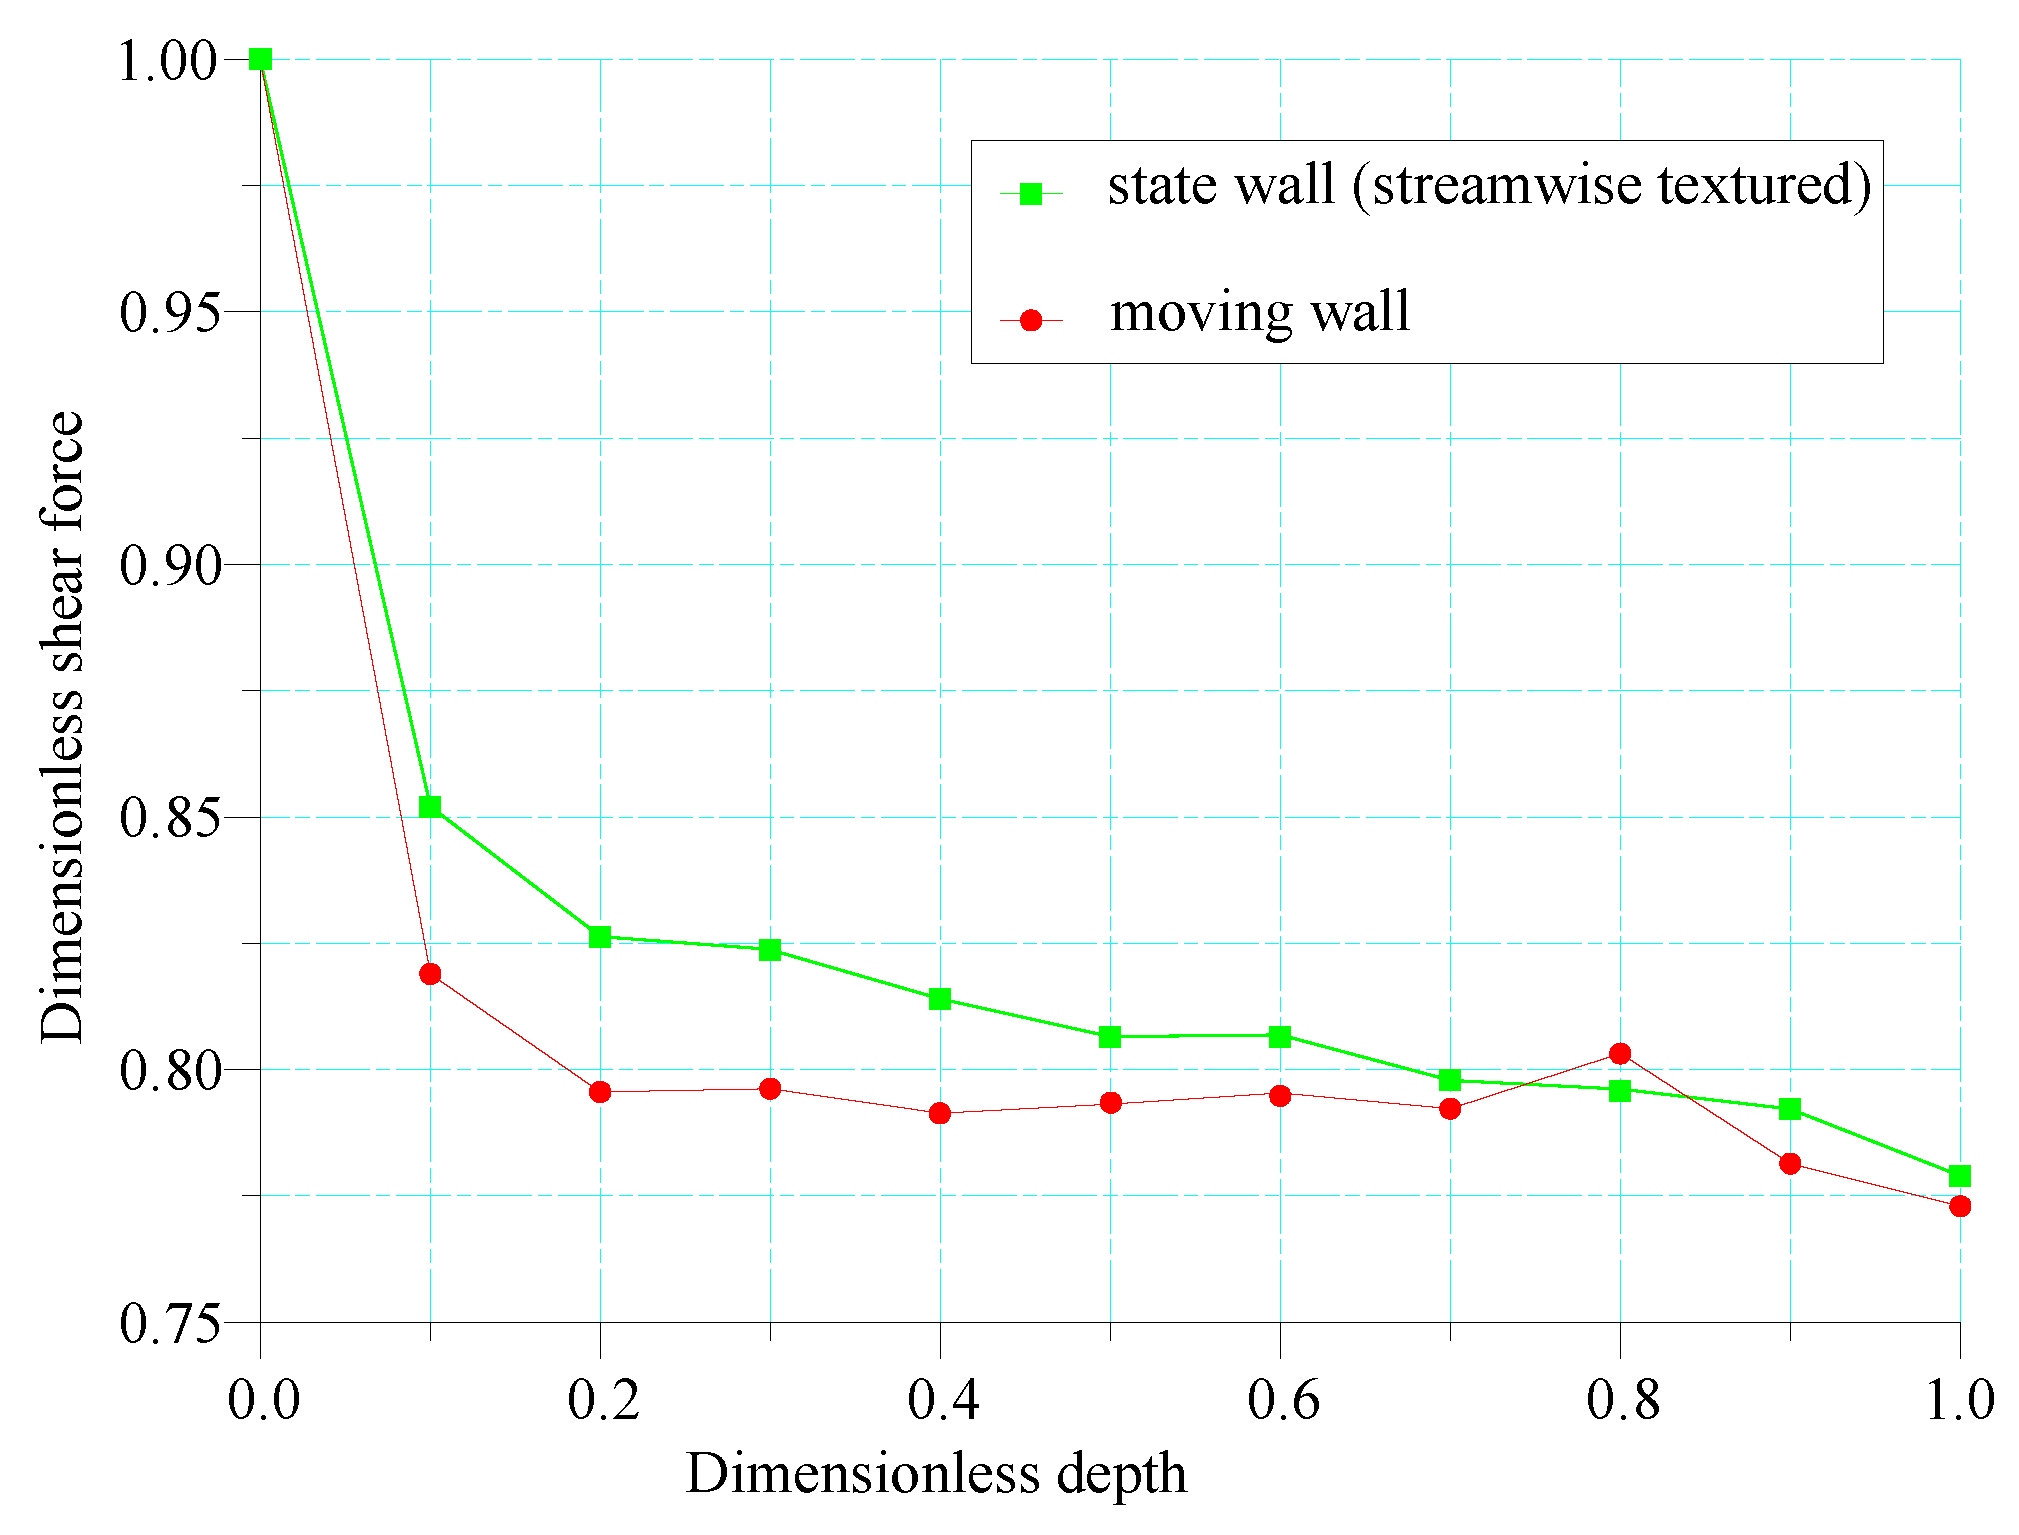
Figure 13 shows that changing the depth of the texture has no obvious effect on improving the LCC, but it usually does not reduce the LCC. Figure 14 shows the dimensionless shear force obtained by changing the dimensionless texture depth analysis.
It can be seen from Figure 14 that increasing the texture depth is very effective in reducing the wall shear force, and its maximum drag reduction rate is likely to reach 22%.
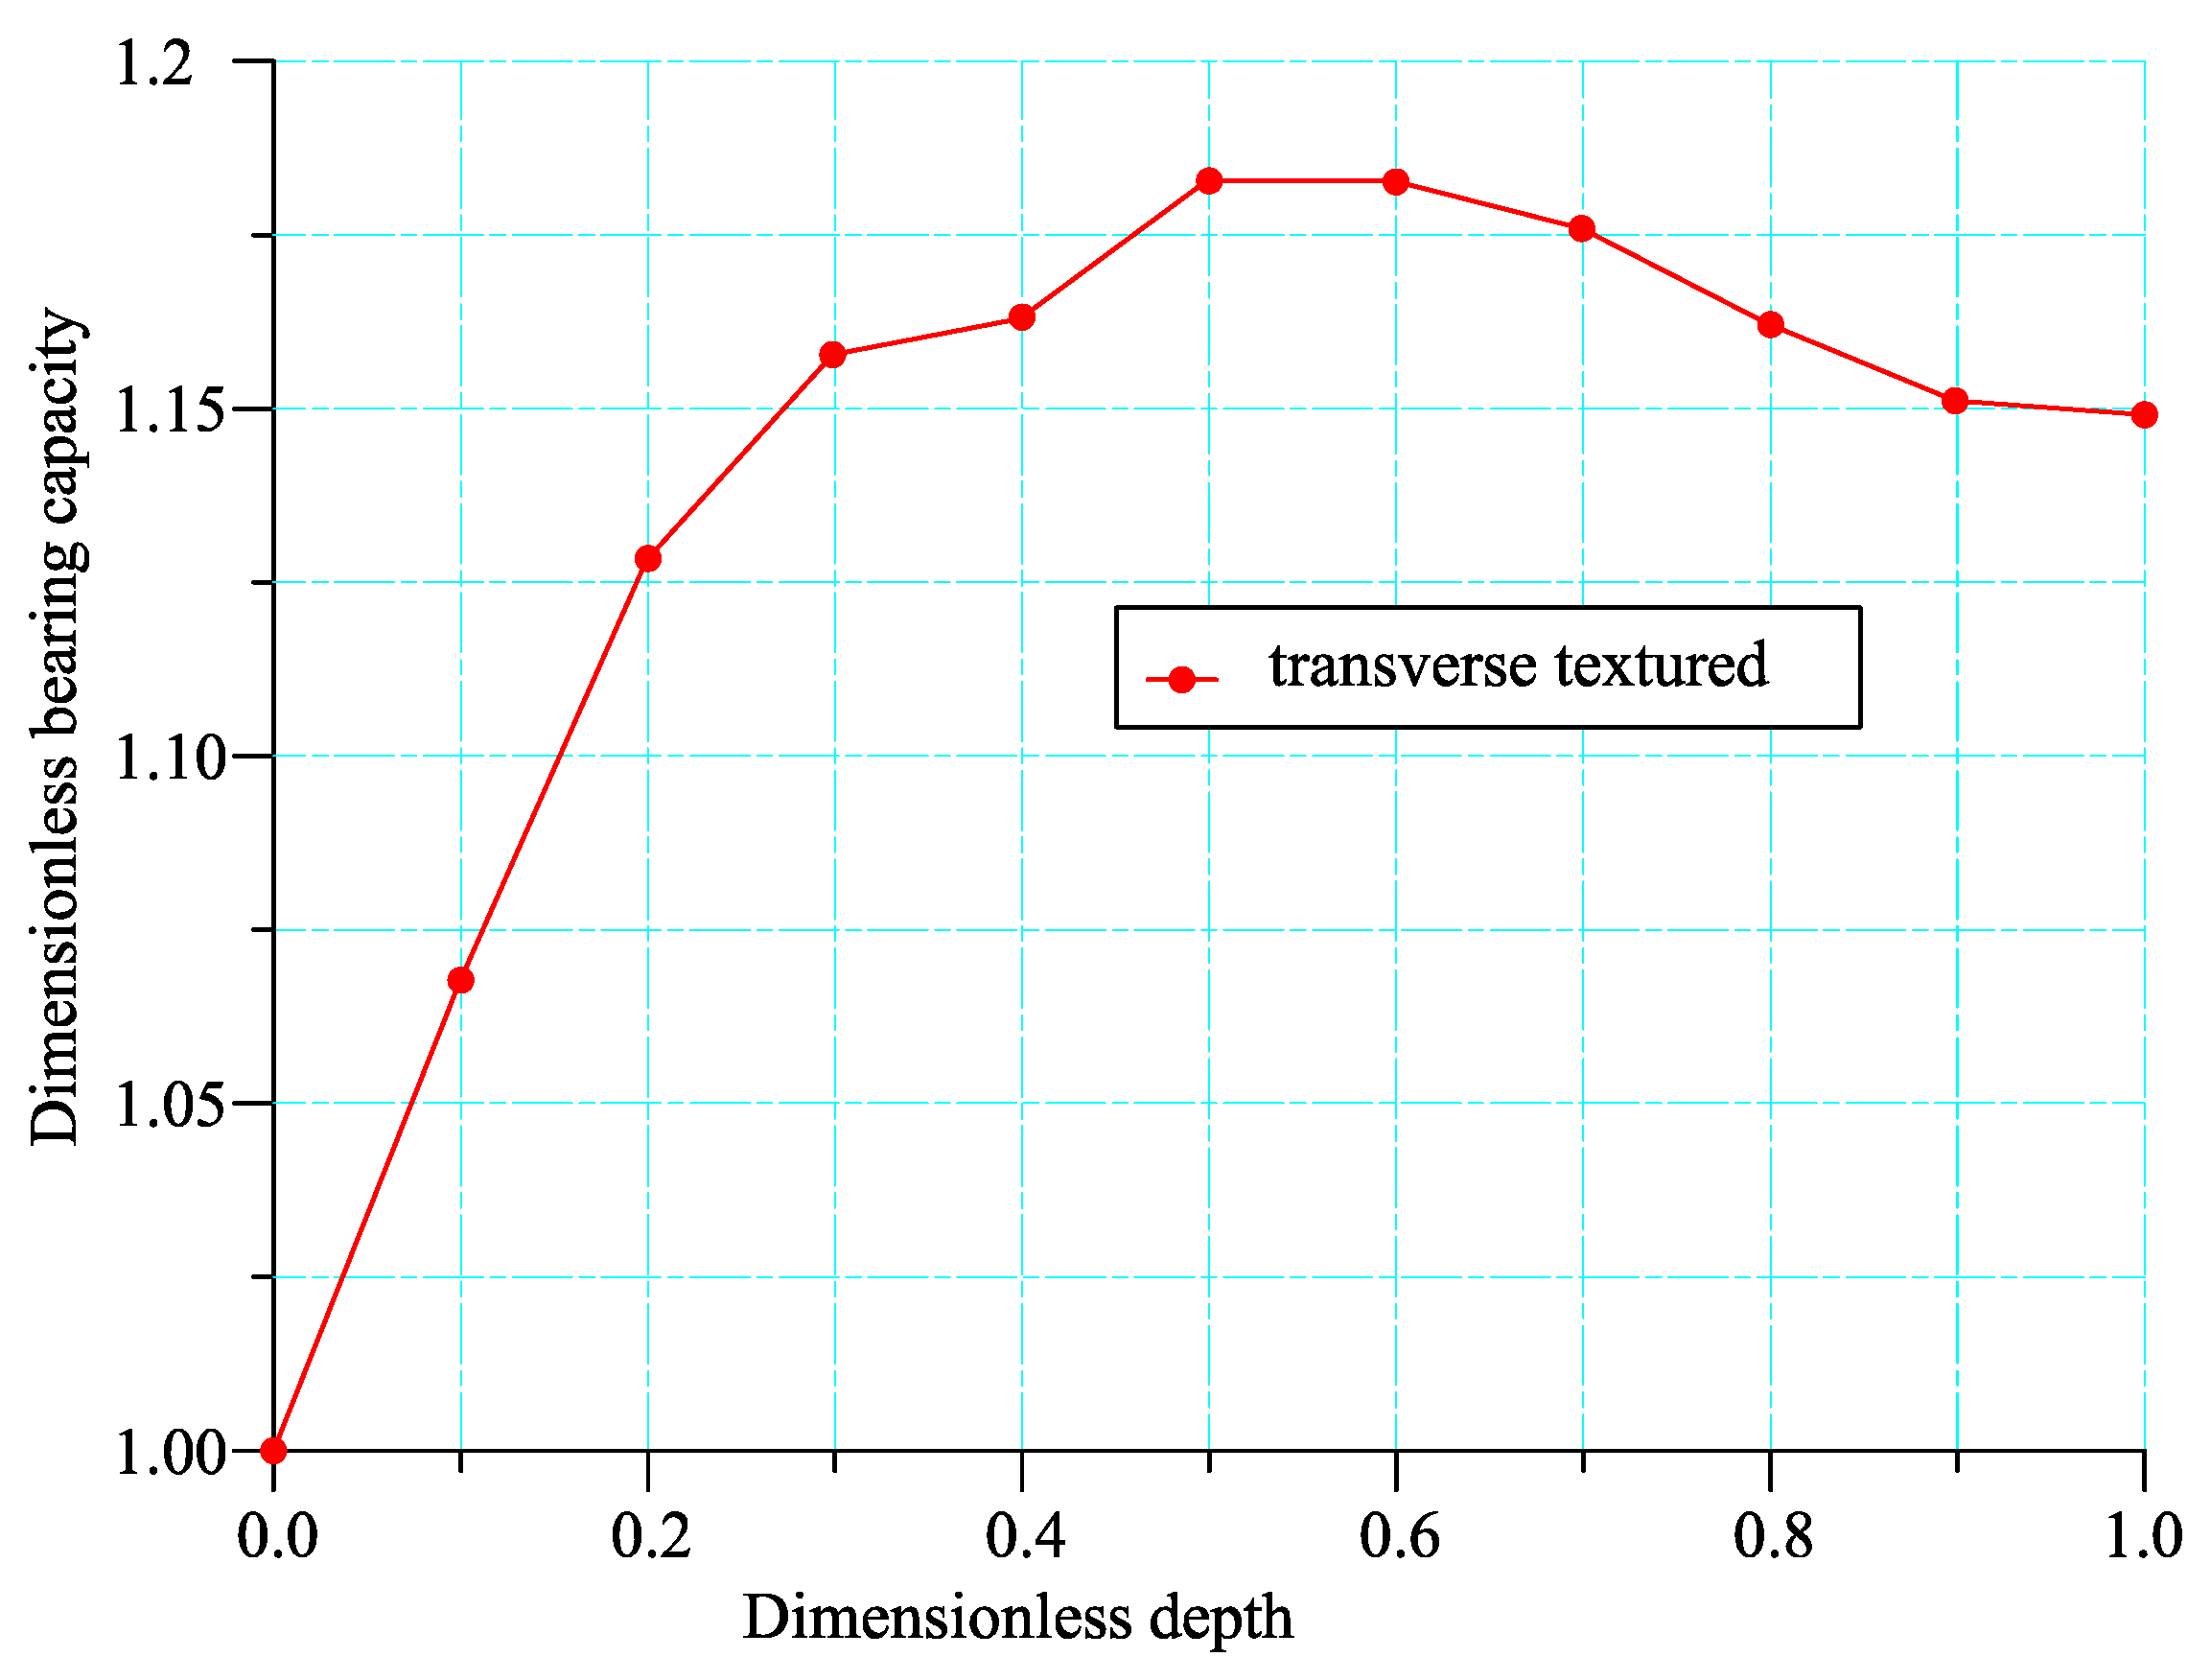
In order to compare the two different directions of micro texture used in the previous convergent wedge, the oil film pressure analysis, dimensionless LCC and dimensionless shear force analysis of the divergent wedge with a transverse micro-texture are carried out. The characteristics of oil film pressure are almost the same as those in the streamwise micro-texture pressure distribution in Figure 12, but the LCC and shear force are quite different. Figure 15 shows the dimensionless LCC obtained by changing the dimensionless texture depth analysis.
Figure 15 shows that the LCC of the transverse texture model is greater than that of the smooth model. The dimensionless LCC first increases rapidly with increasing dimensionless texture depth, and when the dimensionless texture depth is 0.6, the maximum dimensionless LCC is 1.18, and then the dimensionless LCC decreases slowly.
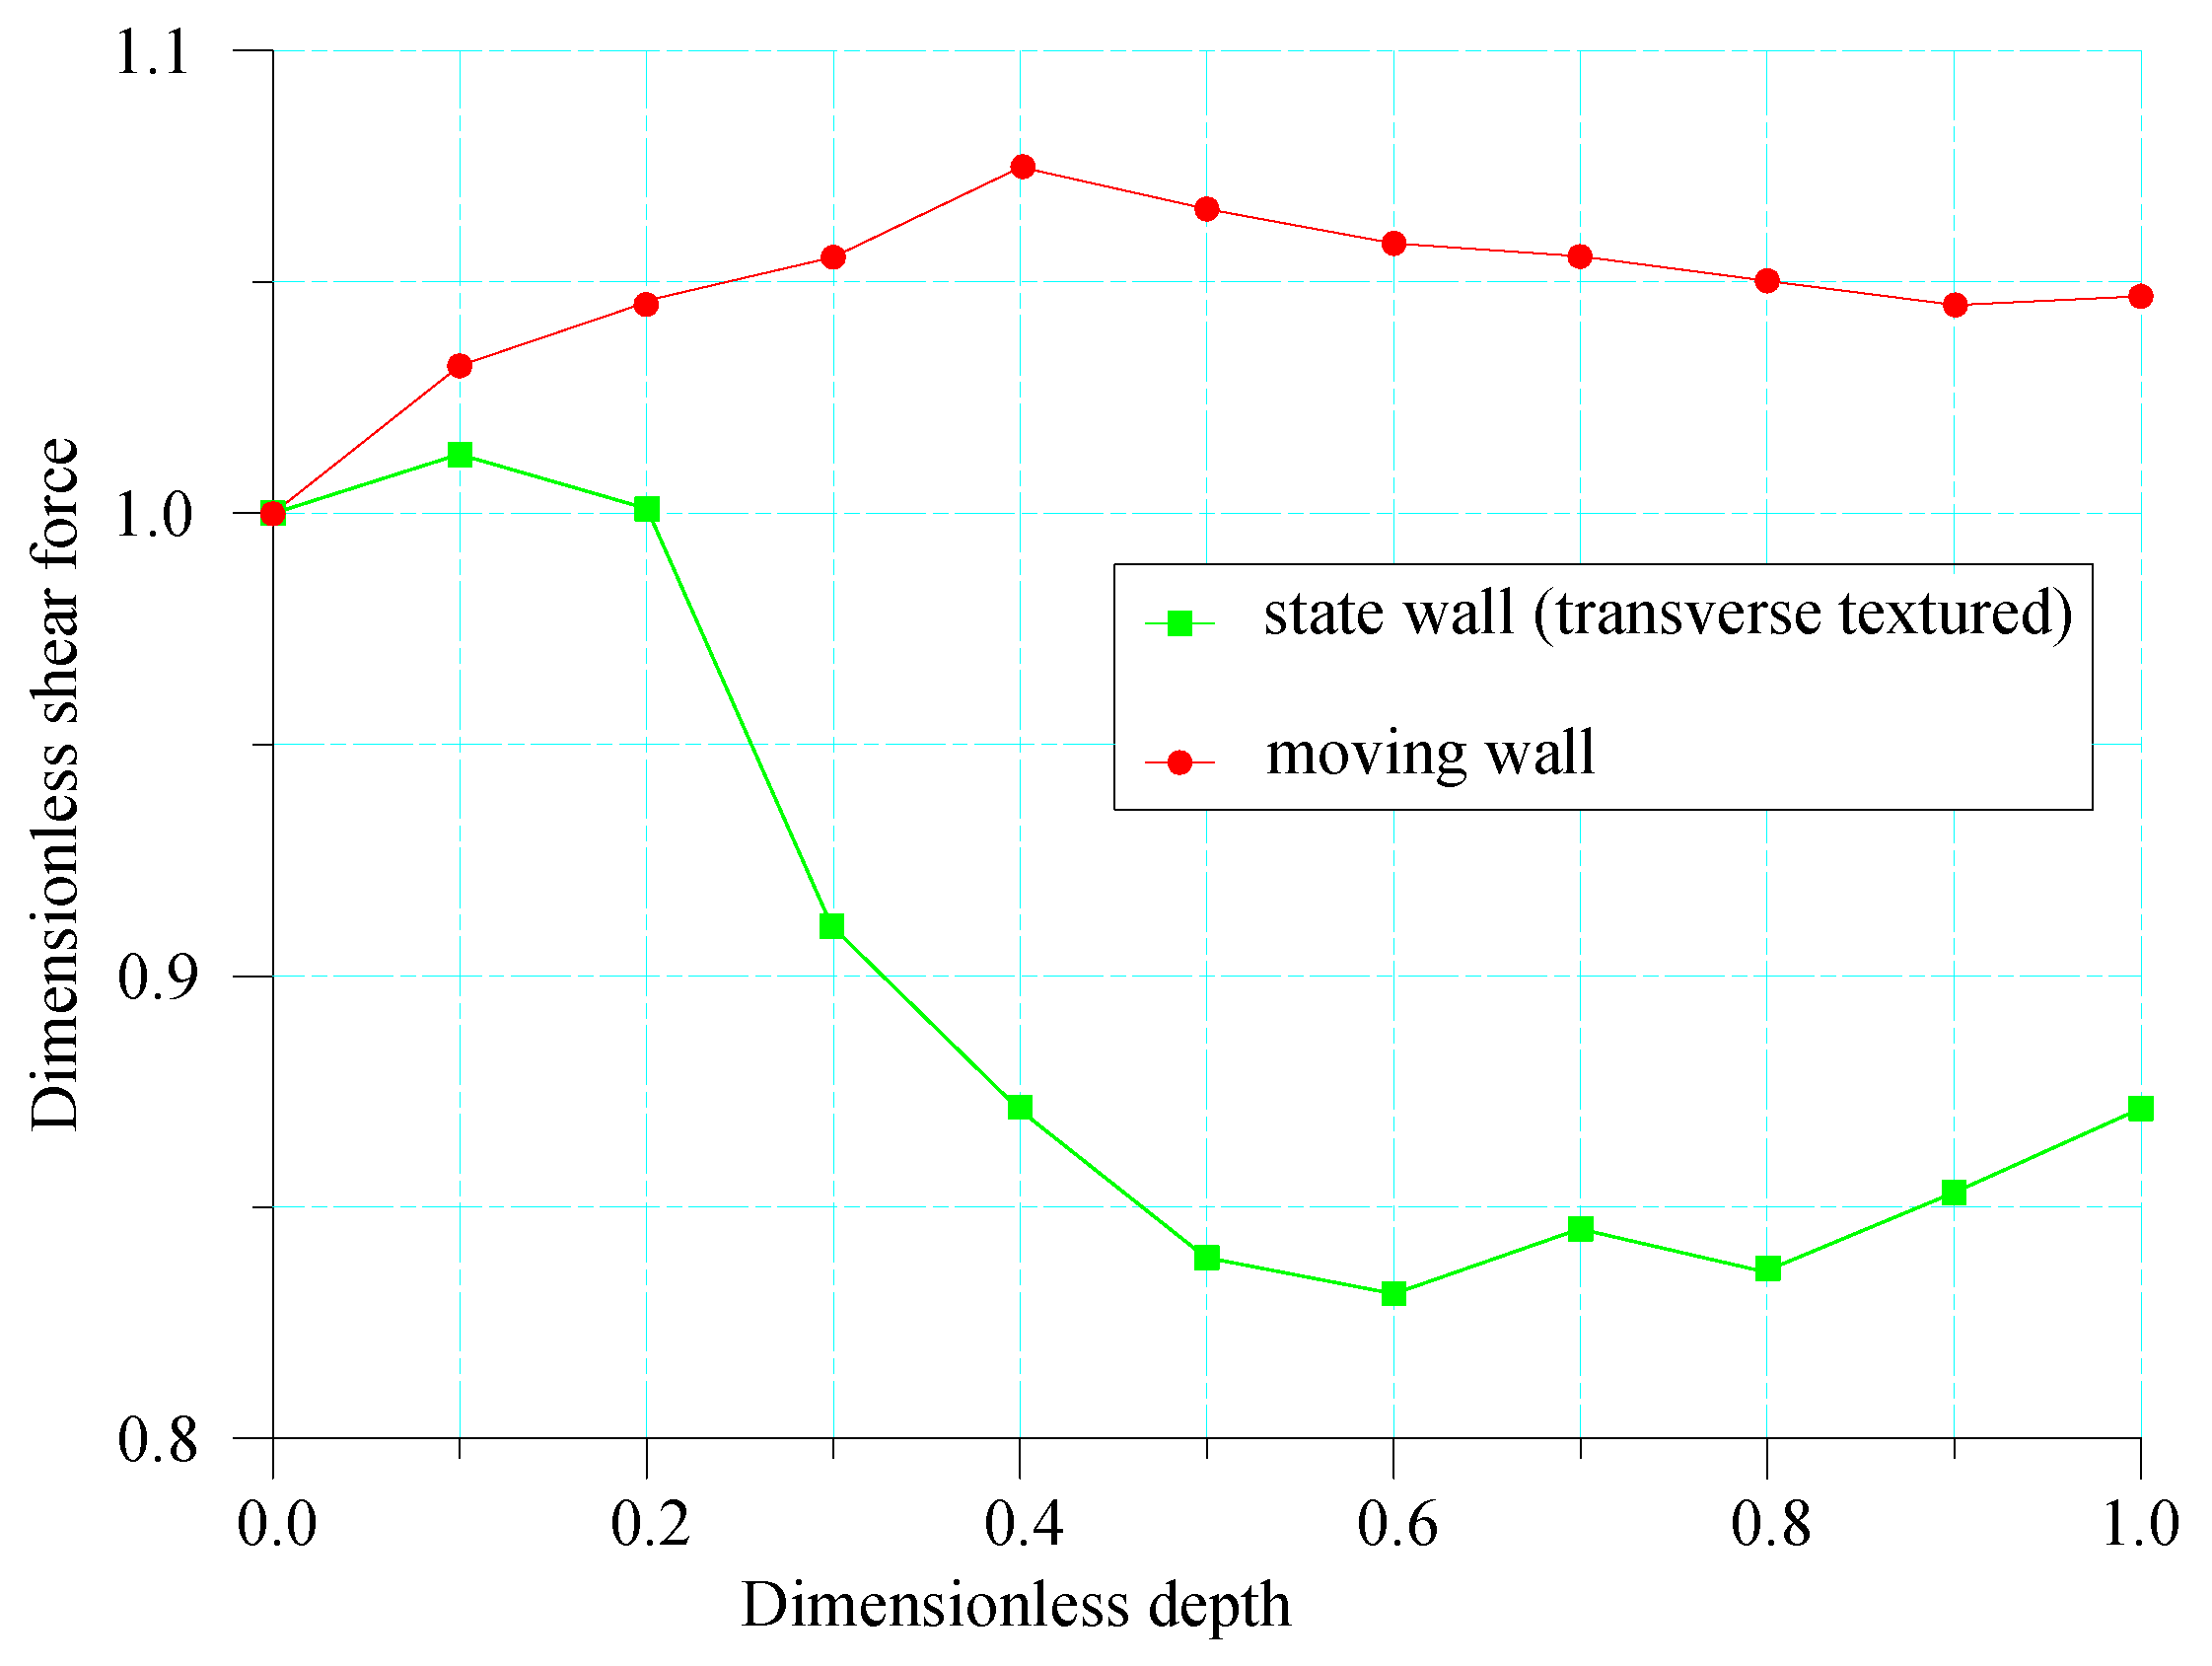
The variation of transverse wall dimensionless shear force with dimensionless texture depth is shown in Figure 16.
Transverse texture can effectively reduce the dimensionless shear force on the fixed wall, that is, the shear force lower than that of the smooth wall model can be obtained. When the dimensionless texture depth is 0.6, the minimum dimensionless shear force can be obtained as about 0.85, and the corresponding drag reduction rate is about 12%. However, while reducing the shear force on the state wall, the transverse texture model increases the dimensionless shear force on the moving wall. For example, when the dimensionless texture depth is 0.6, the shear force increases by 6.5% compared with the smooth wall. For the divergent wedge, the increase of the LCC of the moving wall and the increase of the shear force are unfavorable factors for lubrication.
4.2. Simulation of Drag Reduction Effect of Local Texture Model of Divergent Wedge Slider
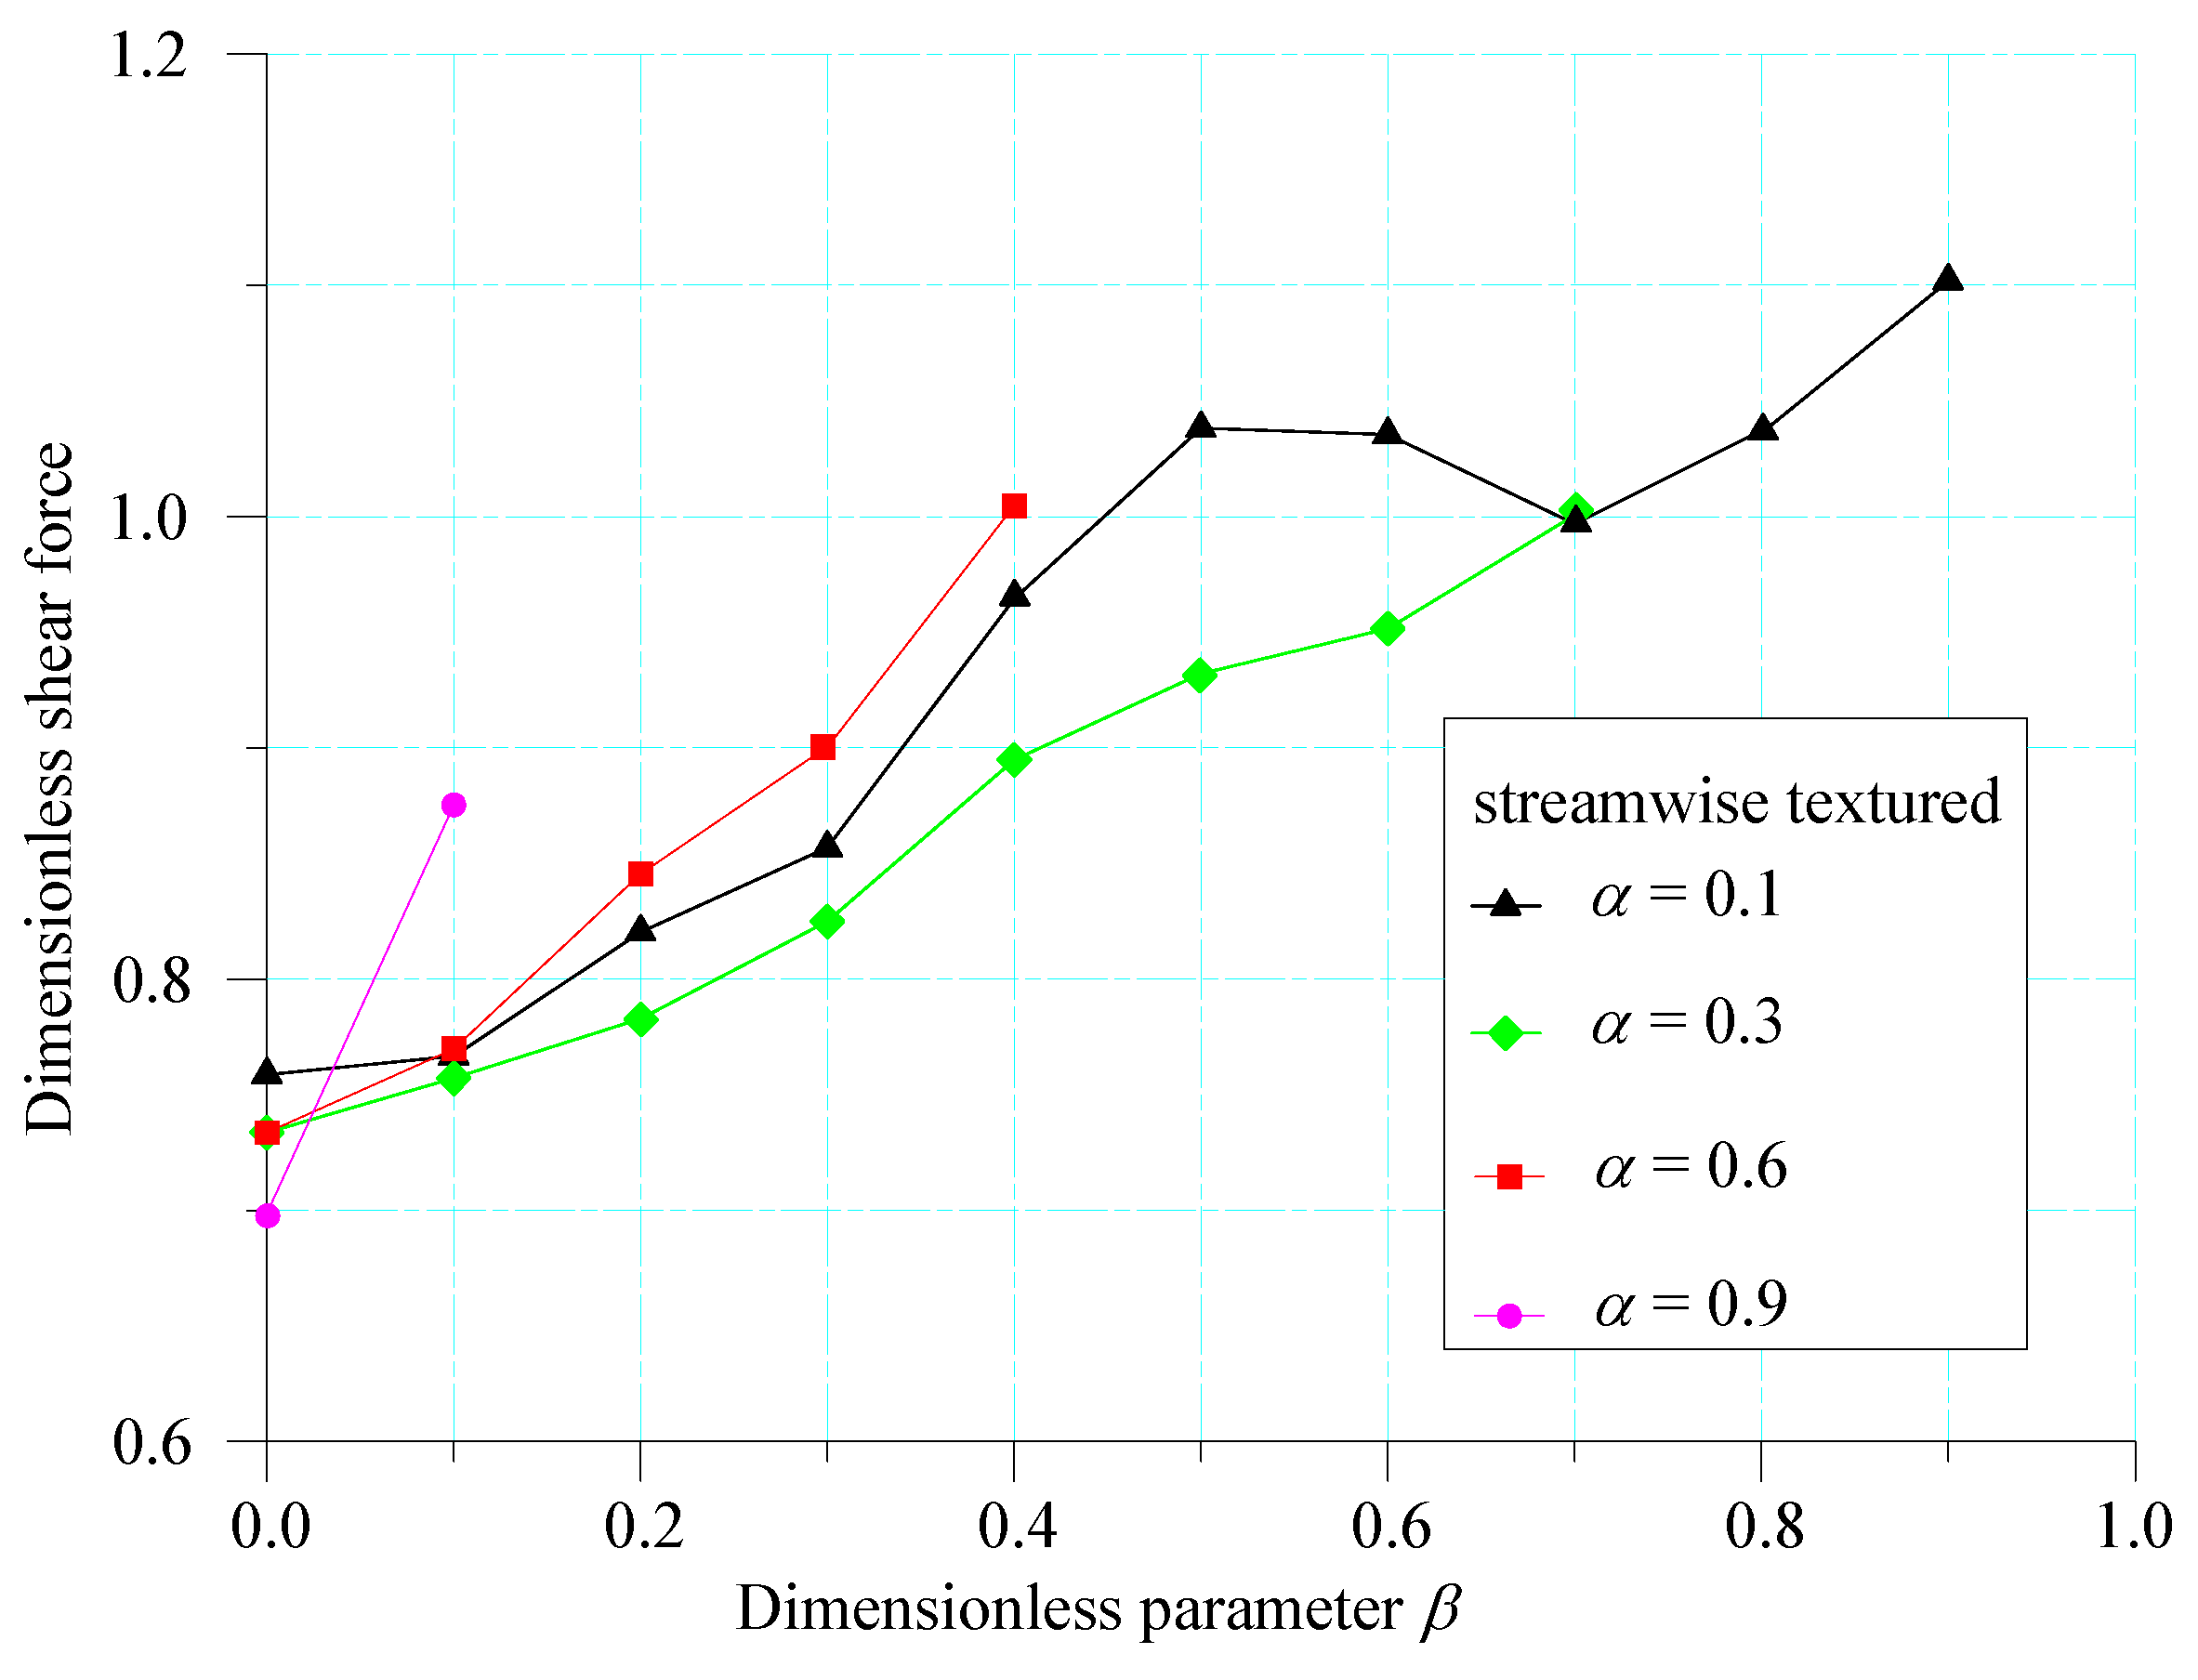
Dimensionless parameters are defined in the same way as in the previous convergence wedge and to represent the length of the texture area and the distance from the exit, that is, when at 0, the local texture is arranged at the exit. For the streamwise texture model, the dimensionless shear force of the moving wall obtained from the simulation analysis is consistent with , and the relationship is shown in Figure 17.
Figure 17 shows that the texture arrangement at the oil film outlet of the divergent wedge can obtain a lower wall shear force, for example and at 0, the dimensionless wall shear force of the moving wall can be reduced to left and right, respectively. As the distance from the outlet increases, the shear force will increase, and the texture is arranged in an inappropriate area. Compared with the smooth surface, the shear force can be increased. For example, from the pressure distribution, if , and if the texture is arranged at the entrance, it will be higher than the smooth wall by about 20%, because the texture area is in the pressure rise area of the oil film, and the corresponding texture boundary position just corresponds to the peak point.
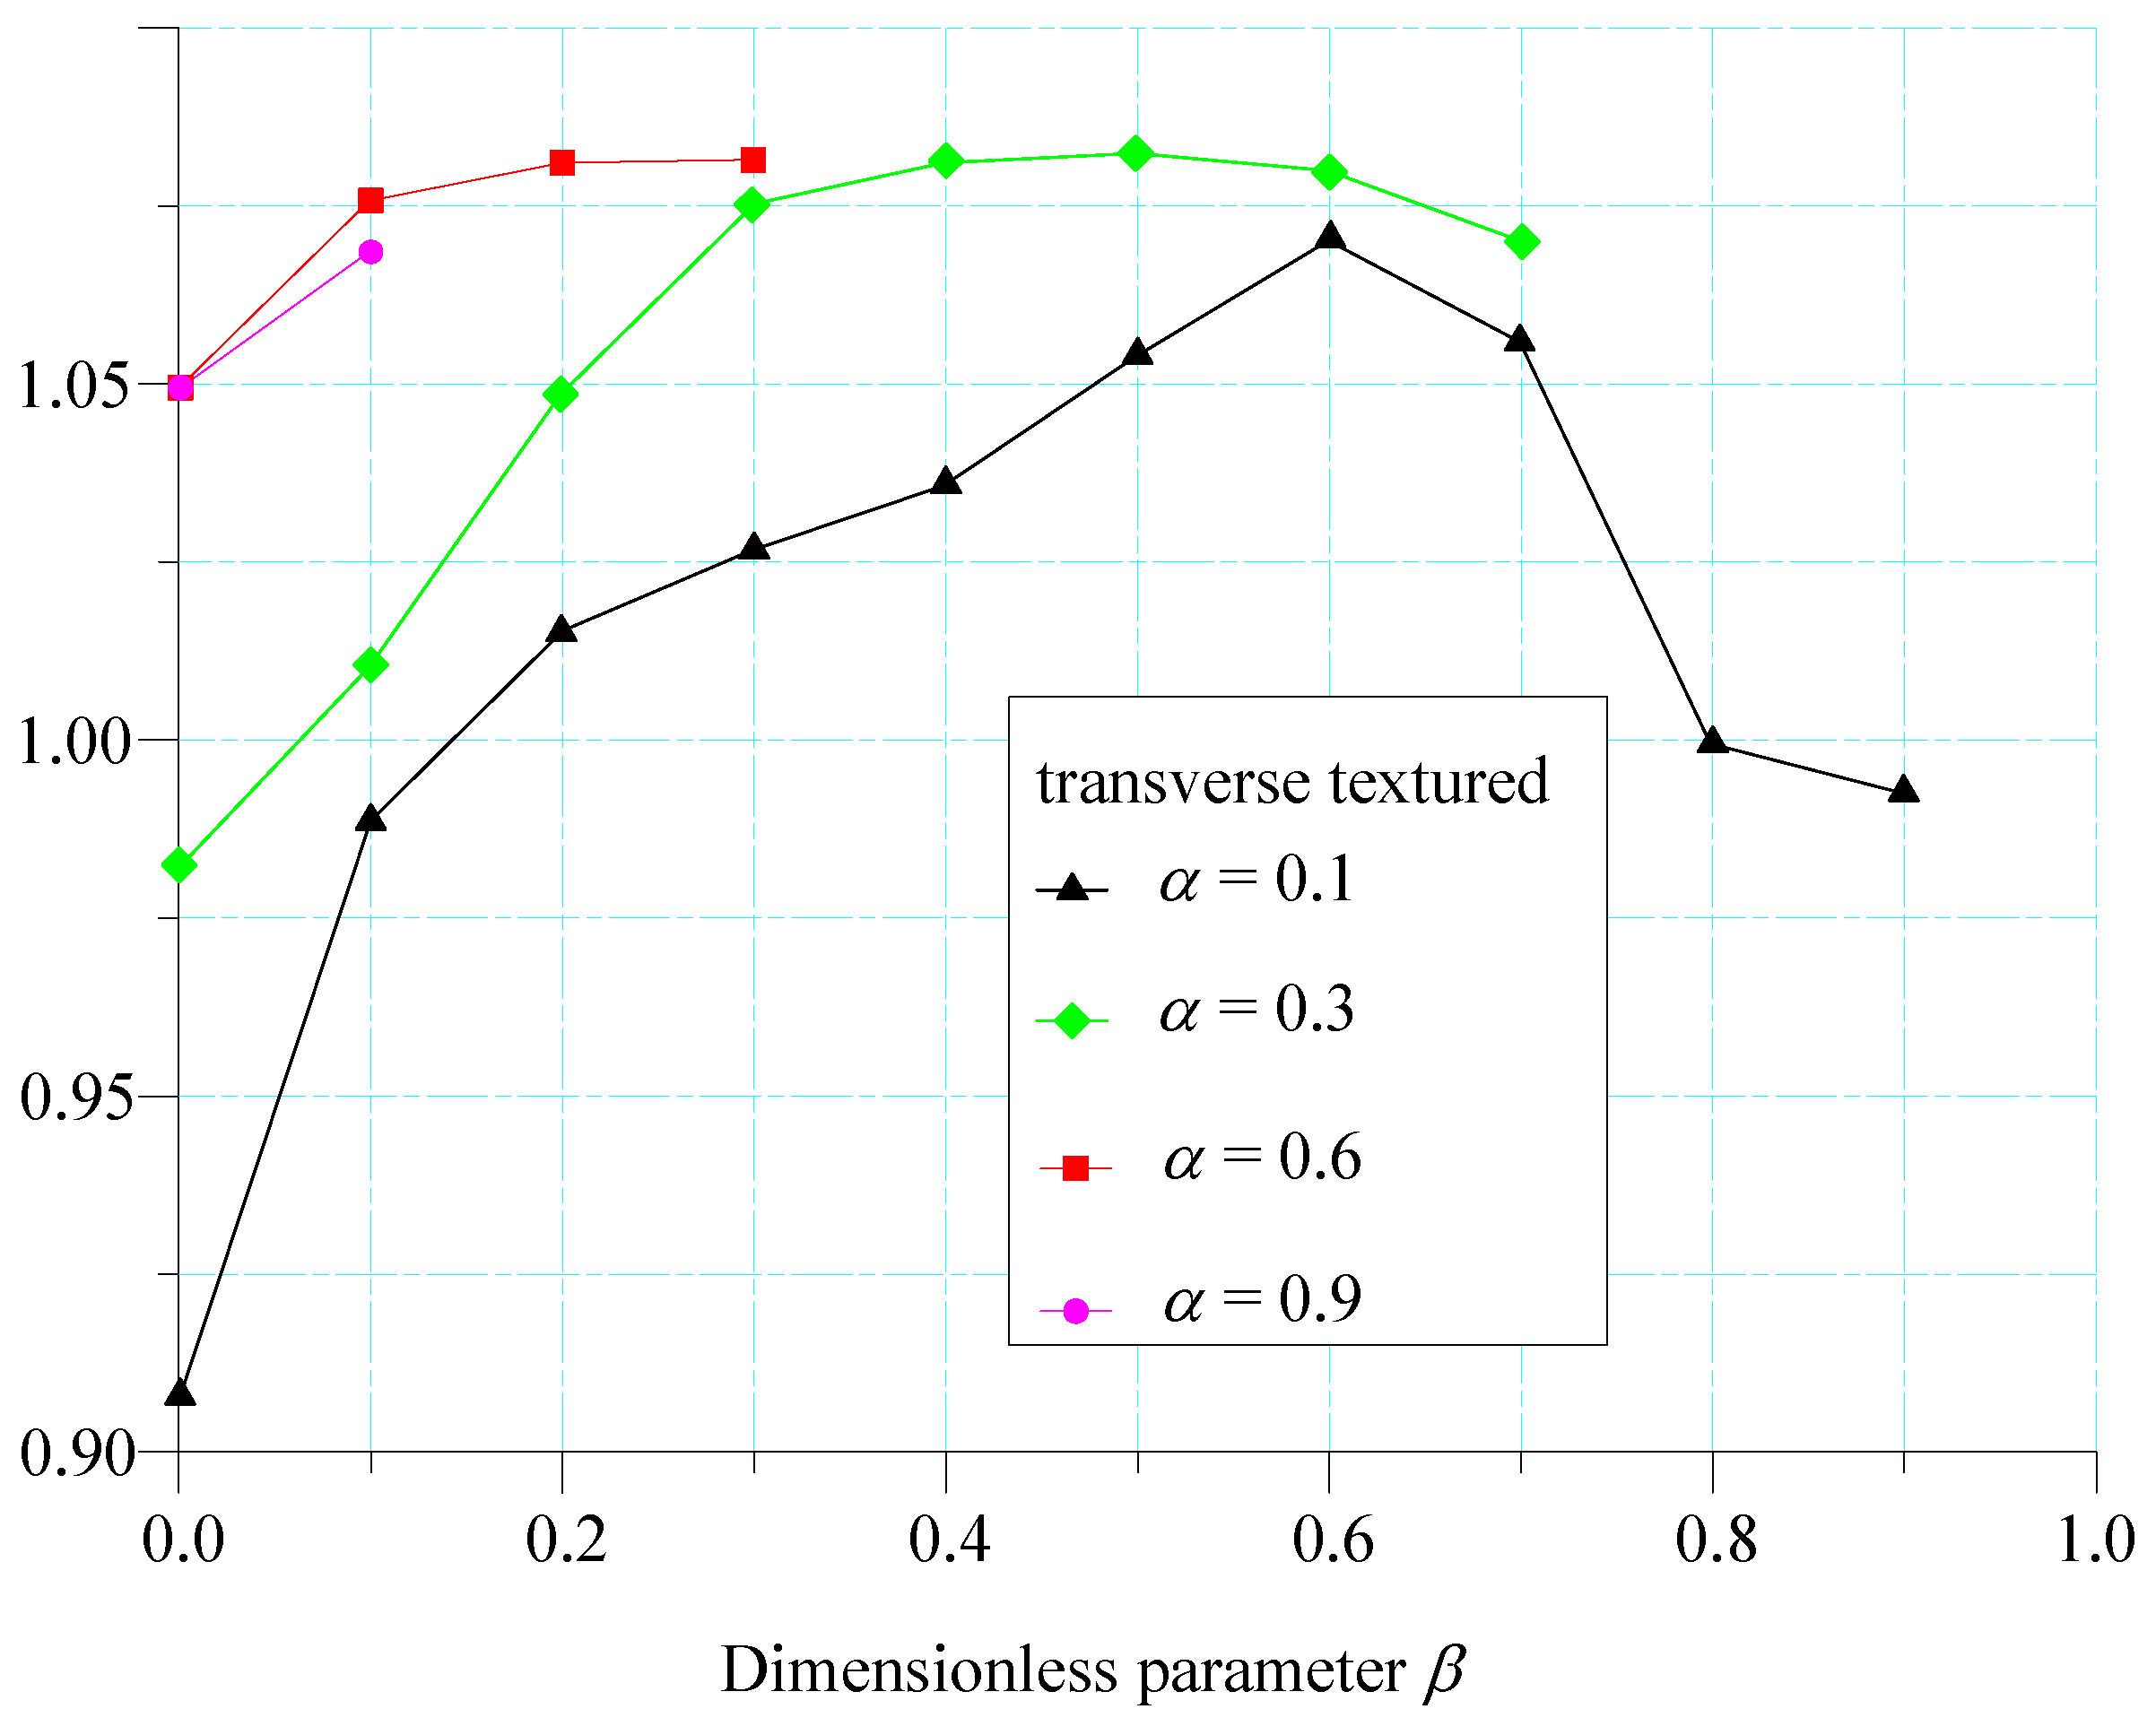
By analyzing the hydrostatic block bearing with transverse local texture, the dimensionless shear force on the moving wall and . The relationship is shown in Figure 18.
It can be seen from the figure that if the transverse micro-texture arrangement is adopted, it is possible to reduce the shear force only if it is arranged in a very narrow area at the outlet.
5. Verification Test of Micro Texture Drag Reduction Characteristics
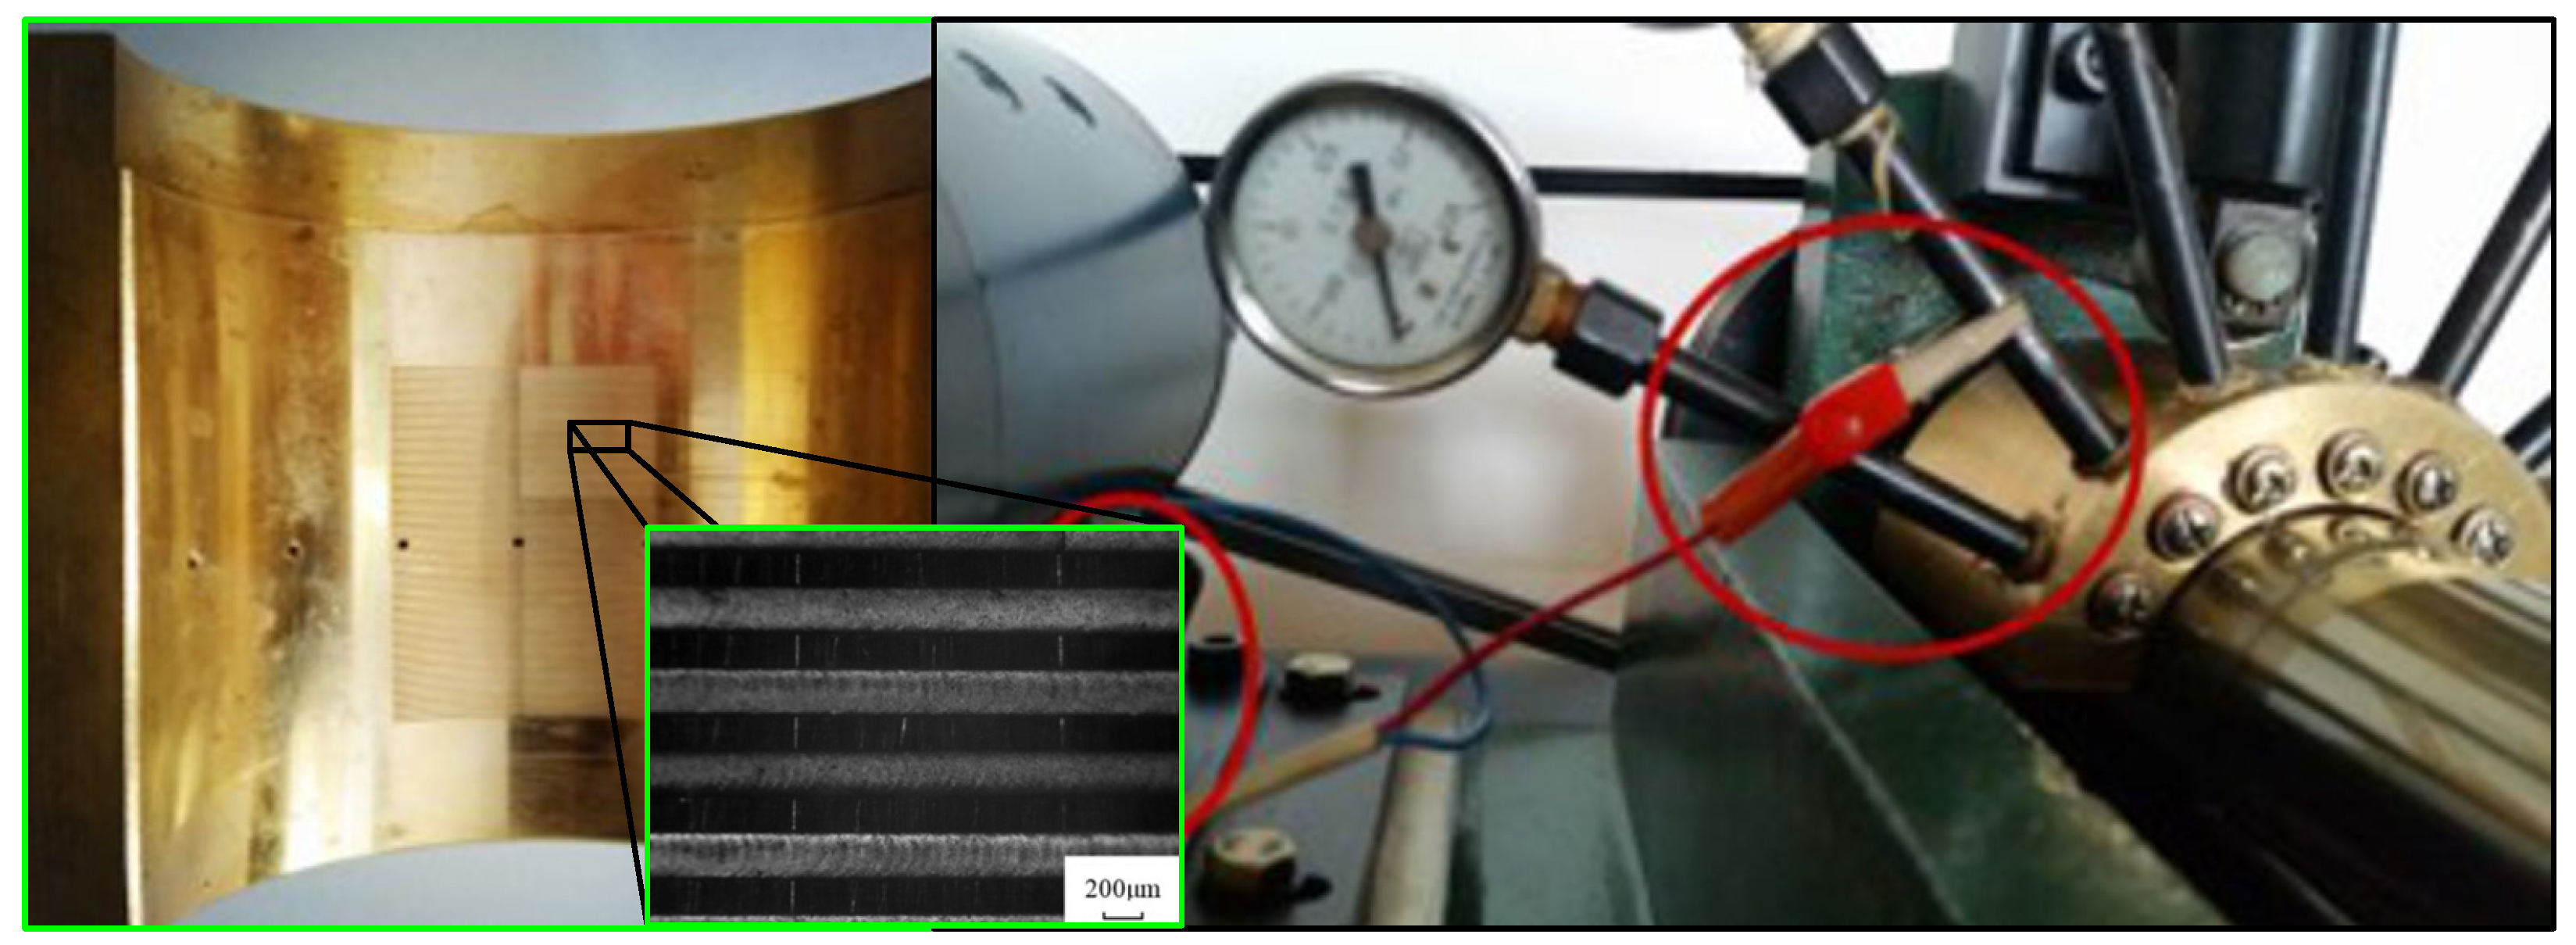
To verify the drag reduction effect of the streamwise micro-texture, half of the bearing bush is made of brass material, and the other half of the smooth bearing bush is used as the test reference, as shown in Figure 19, and the bearing test bench is on the right.
The inner radius of the bearing bush is 30 mm, the total axial length is 72 mm, the axial length of the micro texture is 52 mm, the width of the micro texture is 200 μm, the depth is 100 μm, and the micro texture envelope angle is and is set at the outlet of the divergent wedge according to the loading conditions.
The experimental loads are 650 N, 750 N and 1150 N, respectively, and the average speed of the bearing speed is 50 r/min, 75 r/min, 100 r/min, 125 r/min, 150 r/min, 175 r/min and 200 r/min, respectively. The lubricating oil used in the experiment is 45 # lubricating oil.
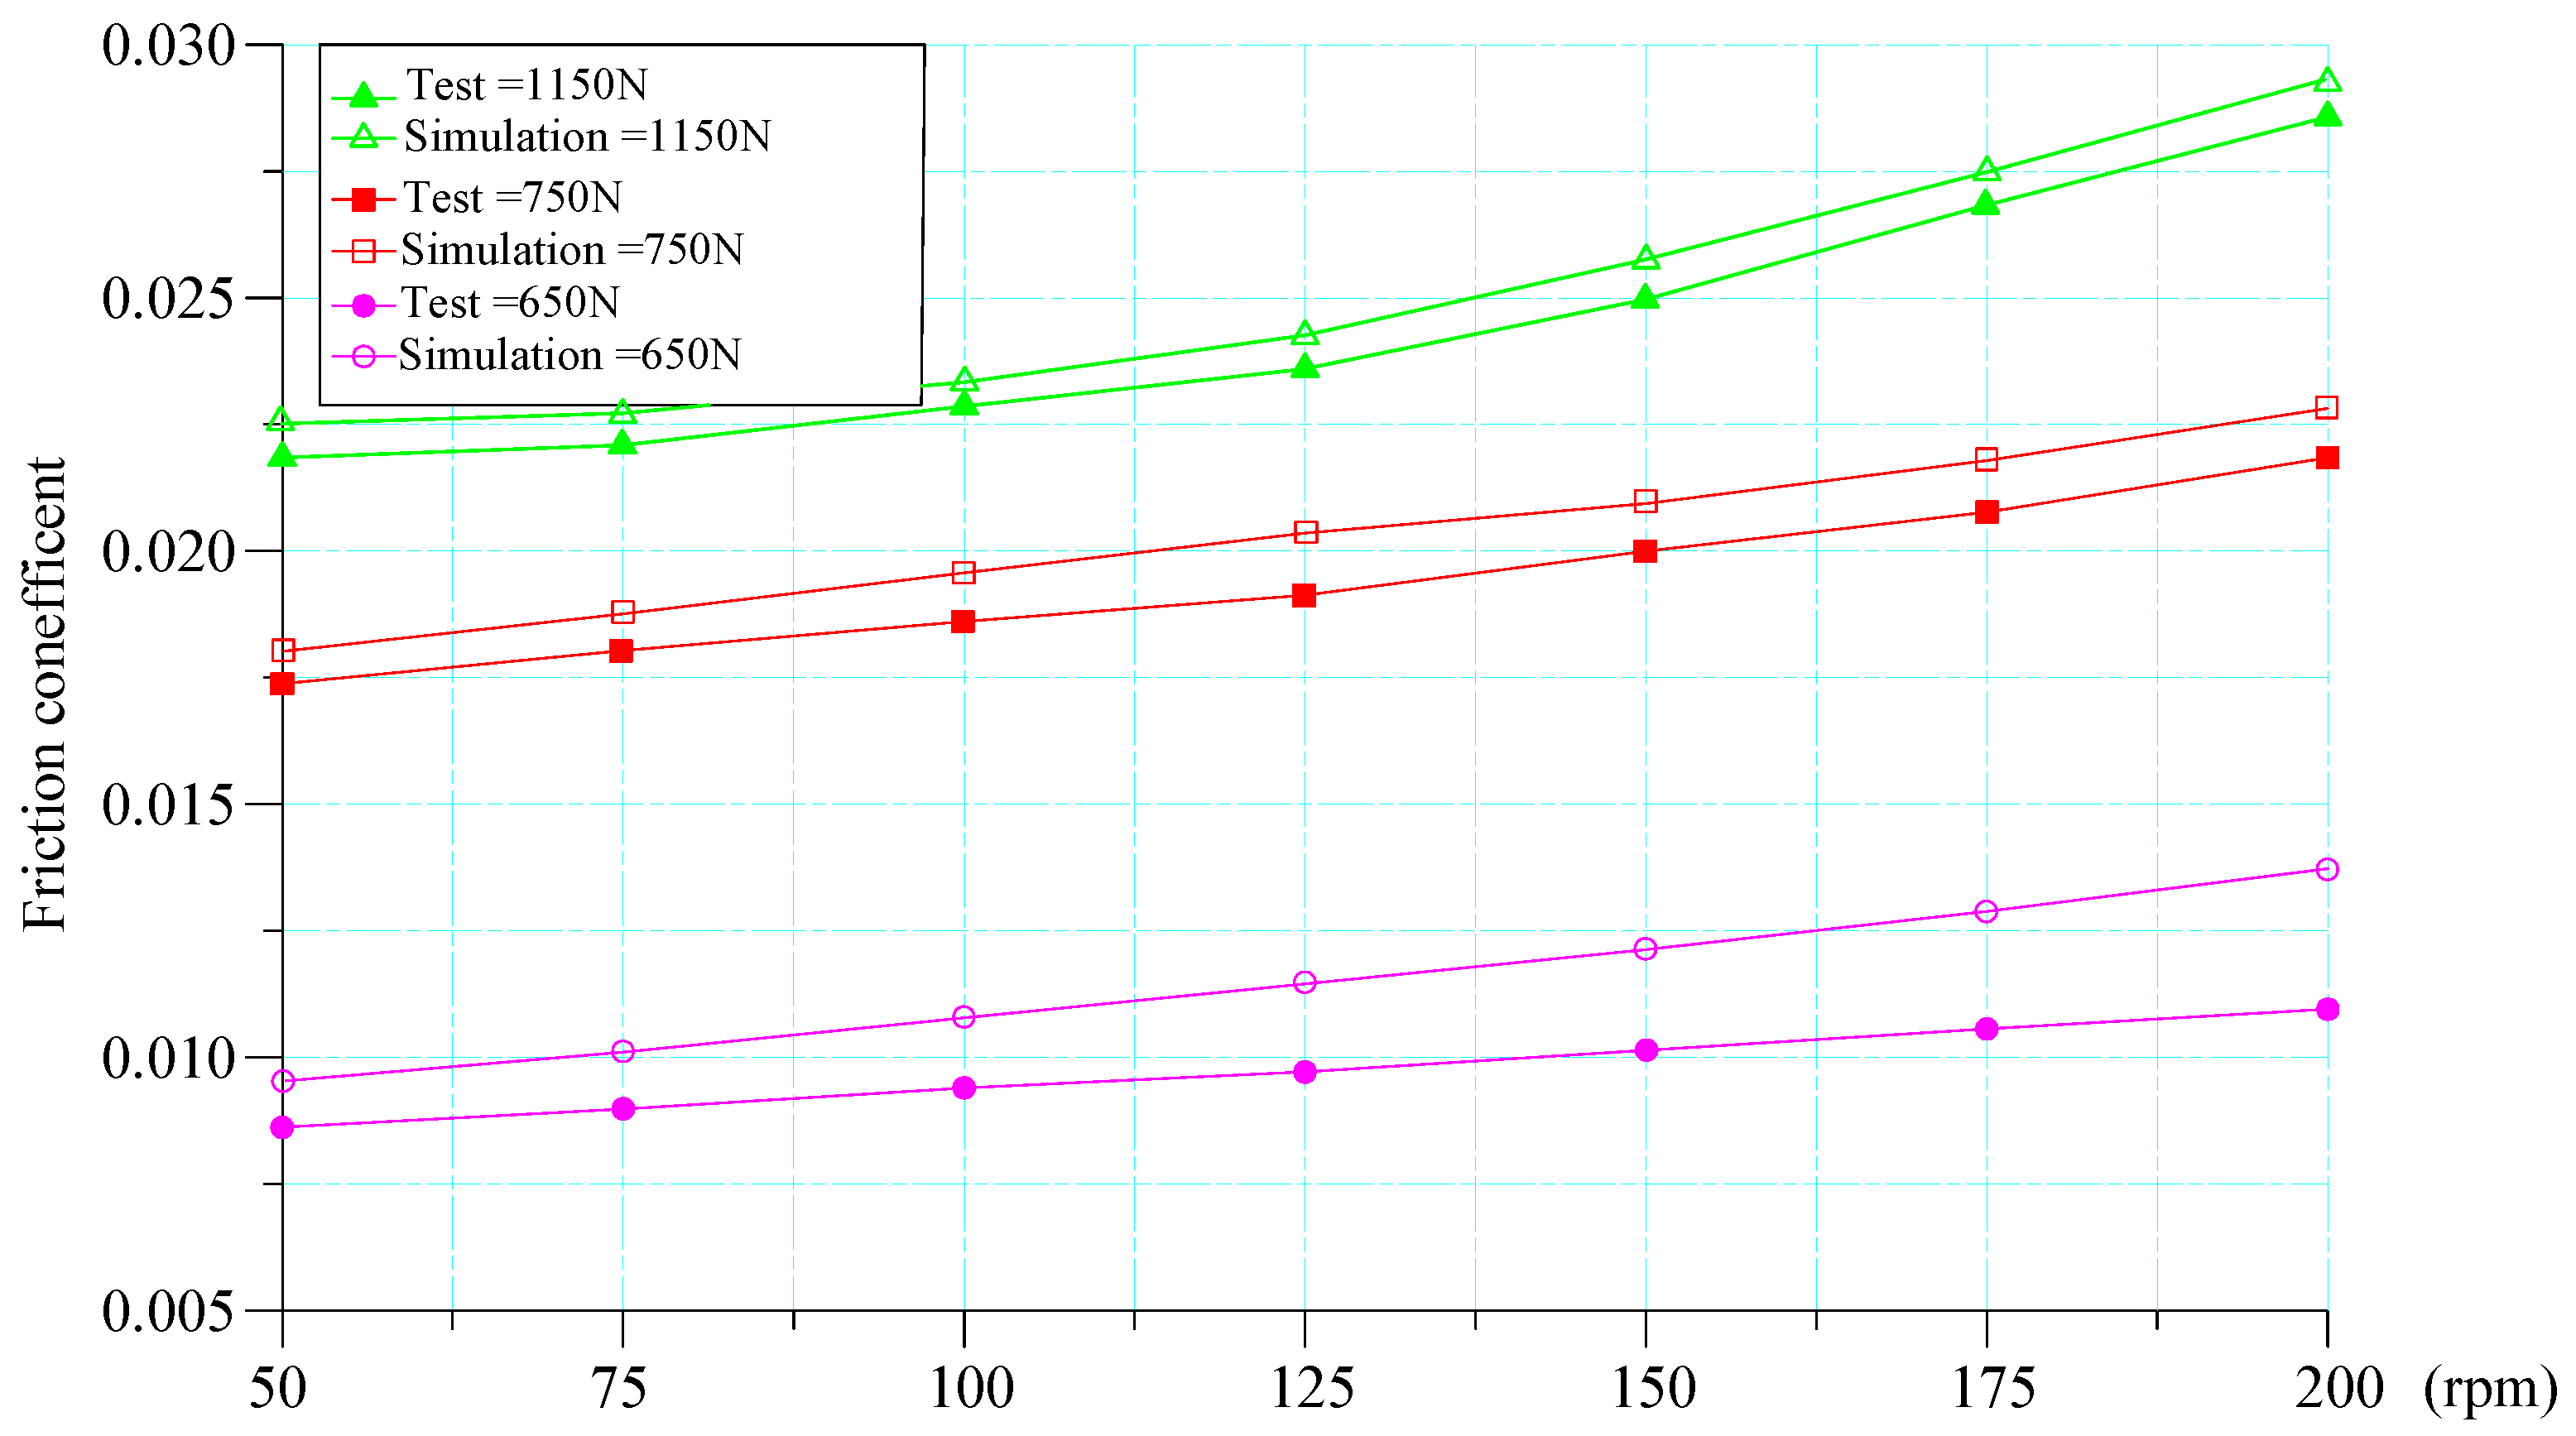
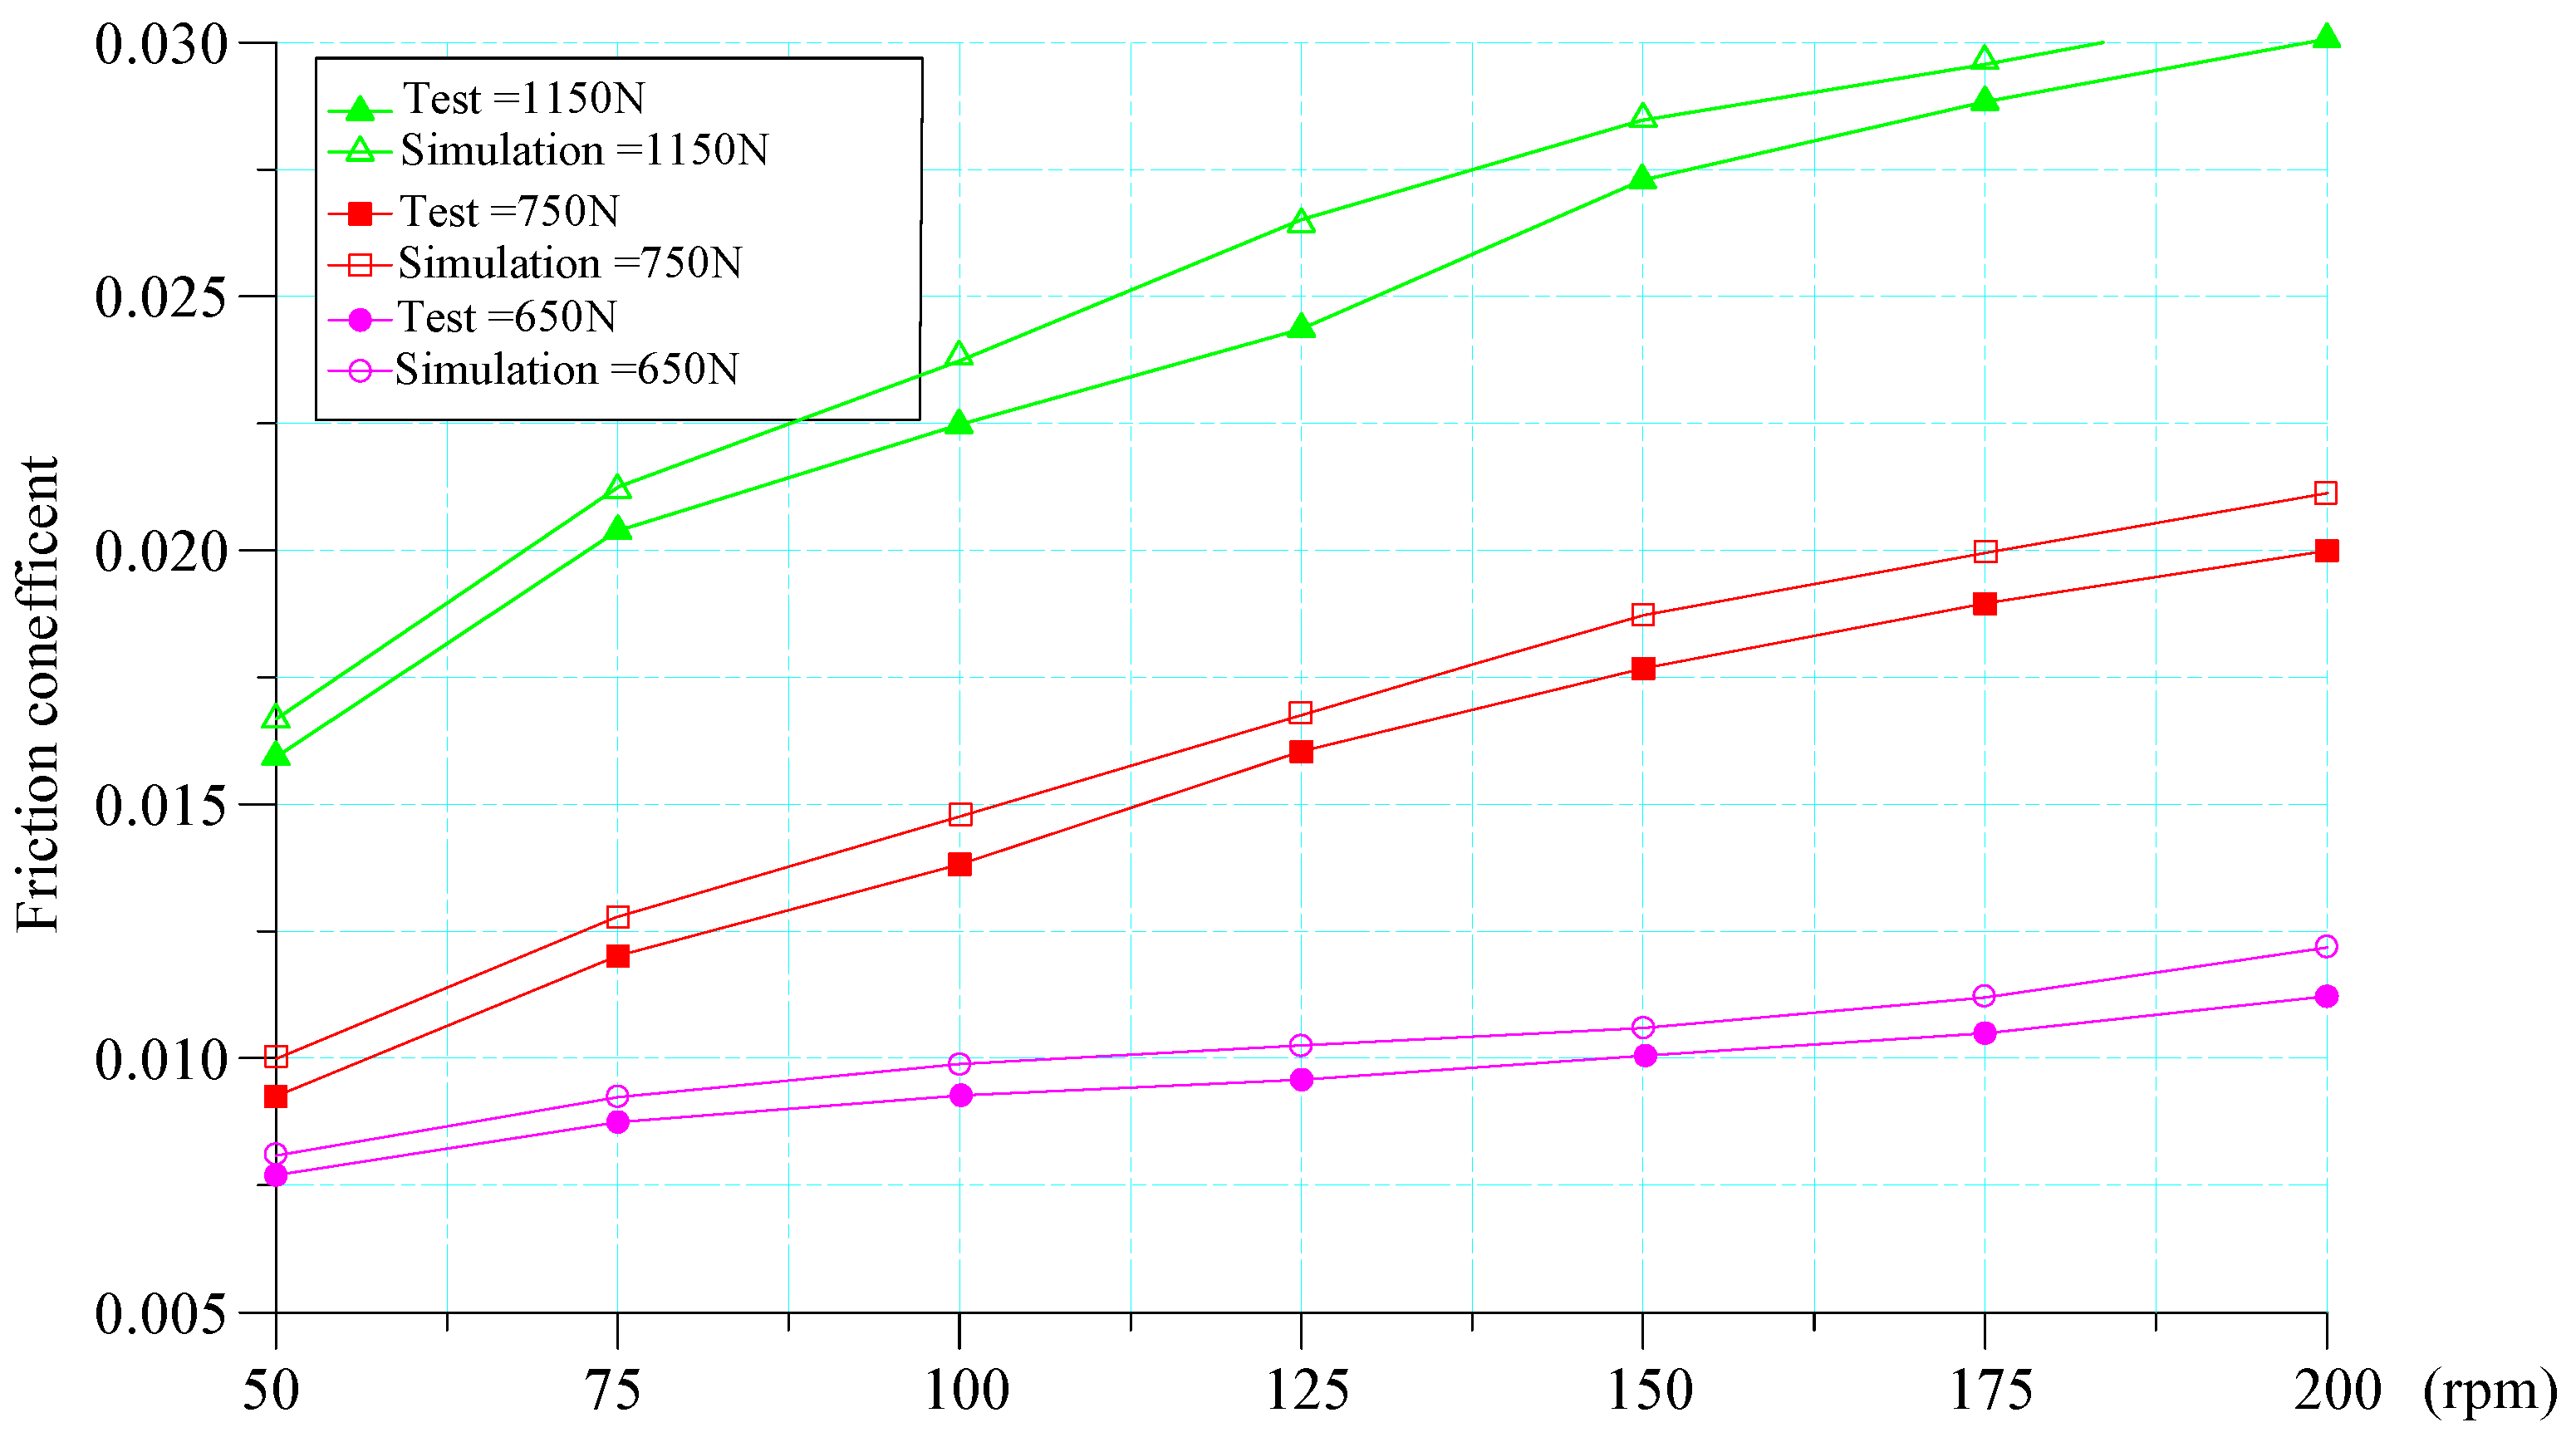
Theoretically, the viscosity changes with the change of pressure and temperature. However, because half of the bearing bush is used in the experiment, and the other half of the journal is immersed in an open oil groove, the temperature change is small, and the dynamic viscosity is approximately a constant, which is taken as . Figure 20 shows the measured friction coefficient of smooth bearing shells under different loads and different rotating speeds.
Since the friction coefficient is the ratio of shear force to a corresponding load, the variation law of the shear force and friction coefficient is basically the same. With the increase of rotating speed, the wall friction coefficient tend to increase; in addition, increasing the load will increase the wall shear force and friction coefficient. Figure 21 shows the friction coefficient measured by the streamwise textured bearing bush under different loads and different rotating speeds.
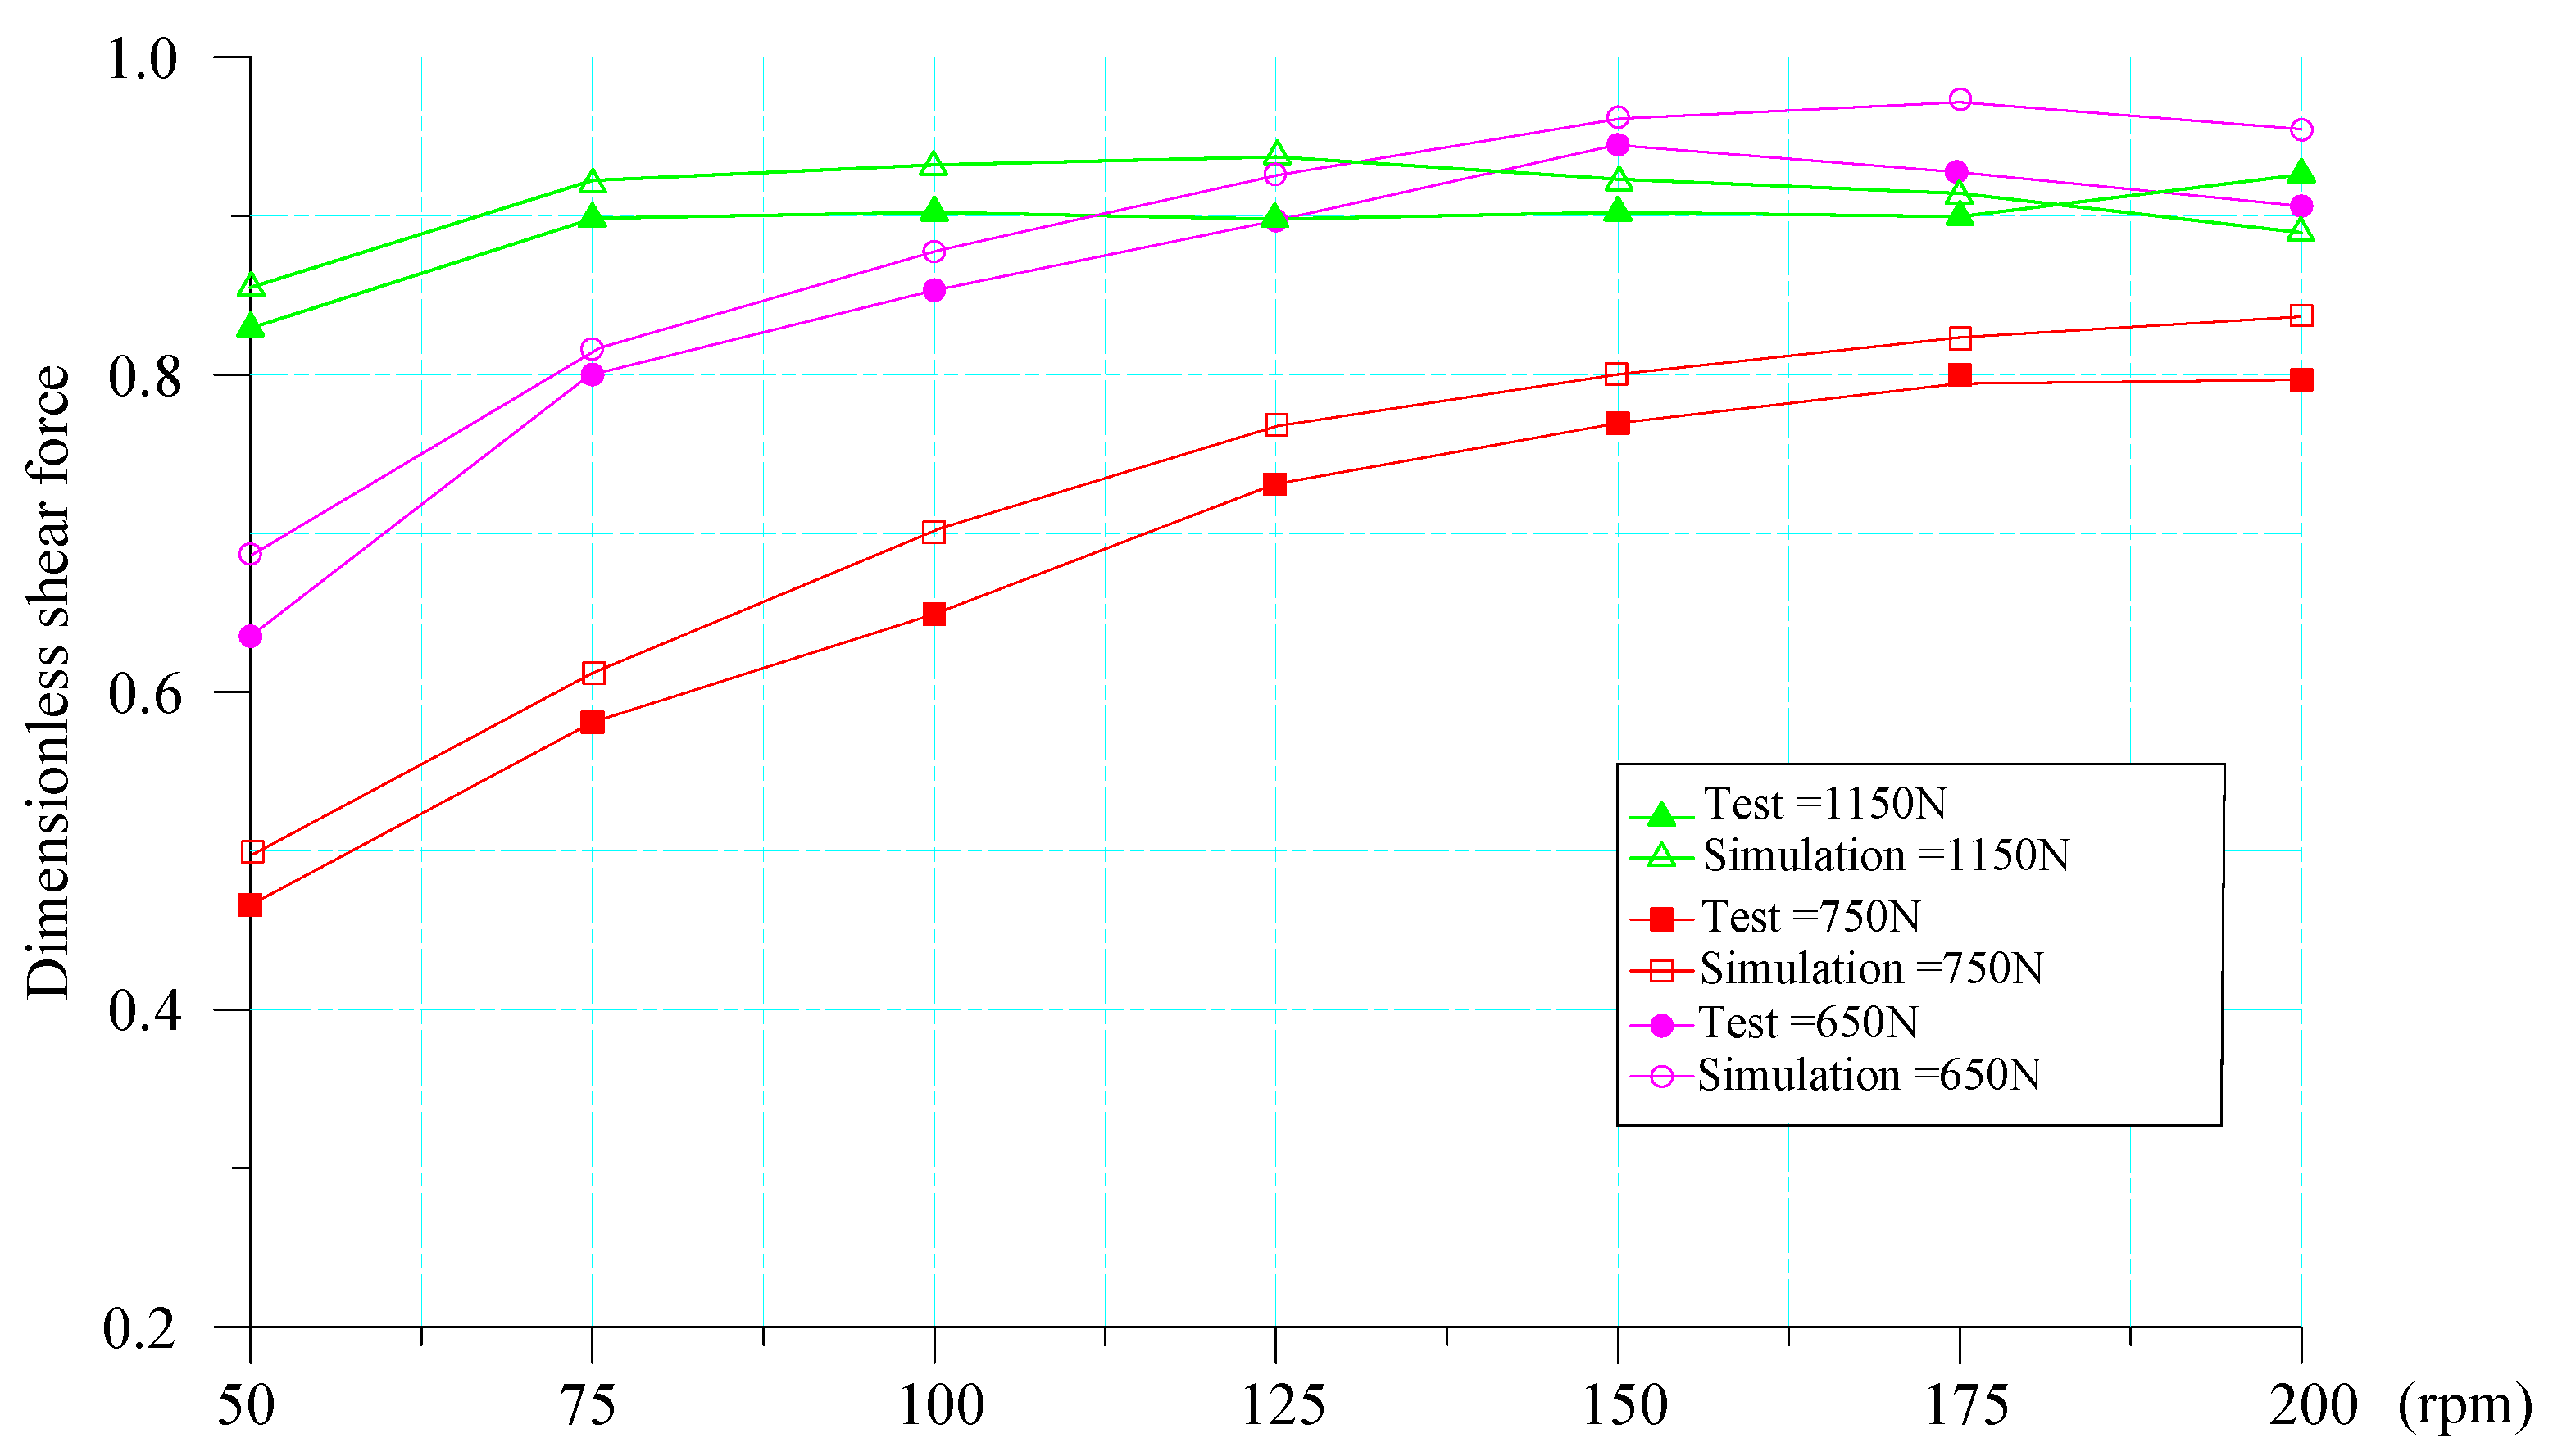
It can be seen from the test data that the shear force and friction coefficient of the bearing bush with local streamwise micro-texture are smaller than those of the smooth bearing. Taking the smooth bearing test data as a reference, the dimensionless shear force is calculated as shown in Figure 22.
From Figure 22, the dimensionless shear force in the whole region is less than 1, that is, the textured bearing bush can obtain a wall shear force lower than that of the smooth bearing bush, and the drag reduction rate is better than that of the high-speed state at low speed. However, the relationship with the load did not show up.
Compared with the simulation results, the friction force and friction coefficient of the surface texture are slightly lower in the experimental results, because the ideal airtight state cannot be achieved due to the limitation of experimental conditions, and part of the friction loss is carried away by the oil. Additionally, shear force is higher than the experimental measurement results, this is because the calculation of the shear stress is associated with speed, without considering energy loss and under the influence of external factors, with the increase of rotational speed, the simulation for the shear stress calculation results is slightly higher than that of the experimental results, but the overall trend, which verifies the correctness and effectiveness of the simulation method.
6. Discussion
By analyzing the LCC and dimensionless shear force of convergent wedge and divergent wedge with rectangular cross-section micro texture, it can be basically determined that in general, the use of a streamwise texture has a better drag reduction effect, and the possible reason is that the collapse position of bubbles is changed. The effect of local micro-textured surfaces is better than that of full micro-textured surfaces. From Figure 17 and Figure 18, when the micro-texture is arranged at the exit of the converging wedge or the entrance of the spreading wedge, it will lead to the reduction of the load capacity and the increase of the wall shear force, which proves that the arrangement of the micro-texture at the minimum oil film thickness of the journal bearing has no benefit to the performance improvement. The experimental results also prove the correctness of the numerical simulation. In the analysis of the divergent wedge considering cavitation, it is found that there is a region where the pressure almost does not change. The pressure in this region may be modified by the micro-textured surface to meet the requirements of the bearing performance.
There is no obvious direct relationship between load and dimensionless shear force from the experiment, because only a kind of micro-textured surface is used for experimental research, and it is impossible to draw a conclusion. However, further research may explore the optimal corresponding relationship between micro-textures for different loads and different speeds.
The initial convergence wedge analysis does not consider the cavitation model, so it cannot be directly determined that micro texture technology cannot be used in the convergence wedge to improve the LCC under special conditions and reduce the shear force.
When the high-speed fluid flows through the micro-textured surface, it will produce a bubble generation and collapse process, which will produce a periodic impact on the moving wall. There is no effective means to analyze the impact process on the rotation accuracy of the bearing. At present, most of the research content focuses on the use of CFD software for simulation, and the research on the residence time of bubbles on the micro-textured surface and the research on the boundary slip length are relatively few. For high-precision hydrostatic bearings, further research is needed on the effect of the microtextured surface on the axial drift.
Author Contributions
Conceptualization, Y.S. and K.C.; methodology, Y.S.; software, Y.S.; validation, Q.B., S.C. and K.C.; formal analysis, S.C.; investigation, Y.S.; resources, Q.B.; data curation, Q.B.; writing—original draft preparation, Y.S.; writing review and editing, Y.S.; visualization, S.C.; supervision, K.C.; project administration, K.C.; All authors have read and agreed to the published version of the manuscript.
Funding
This research received no external funding.
Institutional Review Board Statement
Not applicable.
Informed Consent Statement
Not applicable.
Data Availability Statement
Not applicable.
Conflicts of Interest
The authors declare no conflict of interest.
References
- Hamilton, D.B.; Walowit, J.A.; Allen, C.M. A Theory of Lubrication by Microirregularities. J. Basic Eng. 1966, 88, 177–185. [Google Scholar] [CrossRef]
- Rahmani, R.; Mirzaee, I.; Shirvani, A.; Shirvani, H. An analytical approach for analysis and optimisation of slider bearings with infinite width parallel textures. Tribol. Int. 2010, 43, 1551–1565. [Google Scholar] [CrossRef] [Green Version]
- Tala-Ighil, N.; Maspeyrot, P.; Fillon, M.; Bounif, A. Hydrodynamic effects of texture geometries on journal bearing surfaces. In Proceedings of the 10th International Conference on Tribology ROTRIB’07, Bucharest, Romania, 8–10 November 2007. [Google Scholar]
- Wang, X.; Kato, K.; Adachi, K.; Aizawa, K. Loads carrying capacity map for the surface texture design of SiC thrust bearing sliding in water. Tribol. Int. 2003, 36, 189–197. [Google Scholar] [CrossRef]
- Sinanoğlu, C.; Nair, F.; Karamış, M.B. Effects of shaft surface texture on journal bearing pressure distribution. J. Mater. Process. Technol. 2005, 168, 344–353. [Google Scholar] [CrossRef]
- Cupillard, S.; Cervantes, M.; Glavatskih, S. A CFD study of a finite textured journal bearing. In Proceedings of the Symposium on Hydraulic Machinery and Systems, IAHR 24, Foz do Iguassu, Brazil, 27–31 October 2008. [Google Scholar]
- Zhang, J.; Meng, Y. Optimal Design of Surface Texture in Parallel Trust Bearings. J. Mech. Eng. 2012, 48, 91–99. [Google Scholar] [CrossRef]
- Liu, H.; Meng, Y. Hydrodynamic Lubrication Analysis of Textured Surfaces with the Domain Decomposition Method-effect of Texture Distribution Patterns. Tribology 2007, 27, 555–561. [Google Scholar]
- Liu, H.; Niu, R. Hhe Effect of Surface Tetures on Loading Capacity of Journal Bearing Lubricating Film. Lubr. Eng. 2010, 35, 18–22. [Google Scholar]
- Cupillard, S.; Cervantes, M.; Glavatskih, S. Pressure buildup mechanism in a textured inlet of a hydrodynamic contact. J. Tribol. 2008, 130, 1–10. [Google Scholar] [CrossRef]
- Cupillard, S.; Glavatskih, S.; Cervantes, M.J. 3D thermohydrodynamic analysis of a textured slider. Tribol. Int. 2009, 42, 1487–1495. [Google Scholar] [CrossRef]
- Lo, S.W.; Horng, T.C. Lubricant permeation from micro oil pits under intimate contact condition. J. Tribol. 1999, 121, 633–638. [Google Scholar] [CrossRef]
- Tauviqirrahman, M.; Jamari, J.; Susilowati, S.; Pujiastuti, C.; Setiyana, B.; Pasaribu, A.H.; Ammarullah, M.I. Performance Comparison of Newtonian and Non-Newtonian Fluid on a Heterogeneous Slip/No-Slip Journal Bearing System Based on CFD-FSI Method. Fluids 2022, 7, 225. [Google Scholar] [CrossRef]
- Jiao, F.; Saravi, S.S.; Cheng, K. Investigation on an integrated approach to design and micro fly-cutting of micro-structured riblet surfaces. Proc. Inst. Mech. Eng. Part C J. Mech. Eng. Sci. 2017, 231, 3291–3300. [Google Scholar] [CrossRef]
- Xu, R.s.; Wang, J.j.; Chen, X.w.; Ju, S.s. Numerical simulation of two-phase air/oil flow characteristic in bearing chamber. In Proceedings of the International Conference on Electric Information and Control Engineering, Wuhan, China, 15–17 April 2011; pp. 2412–2415. [Google Scholar]
- Thornycroft, J.I.; Barnaby, S.W. Torpedo-boat destroyers.(Including appendix and plate at back of volume). In Minutes of the Proceedings of the Institution of Civil Engineers; Institution of Civil Engineers: London, UK, 1895; Volume 122, pp. 51–69. [Google Scholar]
- Kuklinski, R. Experimental studies in the control of cavitating bodies. In Proceedings of the AIAA Guidance, Navigation, and Control Conference and Exhibit, Keystone, CO, USA, 21–24 August 2006; p. 6443. [Google Scholar]
- Singhal, A.K.; Athavale, M.M.; Li, H.; Jiang, Y. Mathematical basis and validation of the full cavitation model. J. Fluids Eng. 2002, 124, 617–624. [Google Scholar] [CrossRef]
Figure 1.
Schematic diagram of a radial hydrostatic bearing.

Figure 2.
Pressure distribution of oil film on the journal hydrostatic bearing: oil pressure (MPa).

Figure 3.
Oil film pressure distribution considering cavitation effect: Oil pressure (MPa).

Figure 4.
Gas phase volume fraction distribution considering cavitation effect: Volume fration (g/L).
Figure 4.
Gas phase volume fraction distribution considering cavitation effect: Volume fration (g/L).

Figure 5.
Schematic diagram of slider bearing dimensions.

Figure 6.
Velocity distribution along the thickness of the oil film.

Figure 7.
Schematic diagram of slider bearing microtexture.

Figure 8.
Effects of dimensionless depth of microtexture on carrying capacity.

Figure 9.
Influence of dimensionless depth of microtexture on wall shear force in streamwise texture model.
Figure 9.
Influence of dimensionless depth of microtexture on wall shear force in streamwise texture model.

Figure 10.
Influence of dimensionless depth of microtexture on wall shear force in transverse texture model.
Figure 10.
Influence of dimensionless depth of microtexture on wall shear force in transverse texture model.

Figure 11.
Influence of local texture on oil film pressure distribution.

Figure 12.
Pressure distribution on moving wall before and after considering cavitation effect in streamwise texture.
Figure 12.
Pressure distribution on moving wall before and after considering cavitation effect in streamwise texture.

Figure 13.
The influence of the depth of streamwise texture on the dimensionless LCC.

Figure 14.
The effect of the depth of streamwise texture on the dimensionless shear force.

Figure 15.
Influence of transverse texture depth on dimensionless LCC.

Figure 16.
Influence of transverse texture depth on dimensionless shear force.

Figure 17.
The influence of the position of the streamwise texture on the dimensionless shear force on the moving wall.
Figure 17.
The influence of the position of the streamwise texture on the dimensionless shear force on the moving wall.

Figure 18.
Influence of transverse texture position on dimensionless shear force on moving wall.

Figure 19.
Bearing bush and test bench with streamwise texture.

Figure 20.
Comparison between friction coefficient and simulation results under smooth bearing test conditions.
Figure 20.
Comparison between friction coefficient and simulation results under smooth bearing test conditions.

Figure 21.
Comparison between friction coefficient and simulation results under test conditions of axial bearing with flow direction texture.
Figure 21.
Comparison between friction coefficient and simulation results under test conditions of axial bearing with flow direction texture.

Figure 22.
Comparison between dimensionless shear force and simulation results in different working conditions.
Figure 22.
Comparison between dimensionless shear force and simulation results in different working conditions.


Table 1.
Calculation parameters for radial hydrostatic bearing.
| Journal Diameter | Bearing Length | Radius Clearance | Eccentricity | Lubricant | Rotating Speed |
|---|---|---|---|---|---|
| 20 mm | 20 mm | 0.02 mm | 0.7 | Mobil Velocite oil No. 2 | 5000 r/min |
Table 2.
Mesh independence verification.
| Calculation Scheme | Mesh Number | LCC | Error |
|---|---|---|---|
| FEM | 61,500 | 853.1 N | |
| Scheme 1 | 20,364 | 847.6 N | 0.65% |
| Scheme 2 | 61,179 | 853.6 N | 0.05% |
| Scheme 3 | 114,260 | 850.9 N | 0.26% |
Table 3.
Dimensionless shear forces for the streamwise local texture state wall.
| Texture Area from Entrance | Texture Area from Exit | Dimensionless Shear Force | ||
|---|---|---|---|---|
| 0.1 | 0.8 | 0.1 L | 0.1 L | 0.853 |
| 0.2 | 0.7 | 0.2 L | 0.1 L | 0.862 |
| 0.3 | 0.6 | 0.3 L | 0.1 L | 0.875 |
| 0.4 | 0.5 | 0.4 L | 0.1 L | 0.886 |
| 0.5 | 0.4 | 0.5 L | 0.1 L | 0.898 |
| 0.6 | 0.3 | 0.6 L | 0.1 L | 0.905 |
| 0.7 | 0.2 | 0.7 L | 0.1 L | 0.914 |
Publisher’s Note: MDPI stays neutral with regard to jurisdictional claims in published maps and institutional affiliations. |
© 2022 by the authors. Licensee MDPI, Basel, Switzerland. This article is an open access article distributed under the terms and conditions of the Creative Commons Attribution (CC BY) license (https://creativecommons.org/licenses/by/4.0/).
Share and Cite
MDPI and ACS Style
Shang, Y.; Cheng, K.; Bai, Q.; Chen, S. Drag Reduction Analysis of the Hydrostatic Bearing with Surface Micro Textures. Appl. Sci. 2022, 12, 10831. https://doi.org/10.3390/app122110831
AMA Style
Shang Y, Cheng K, Bai Q, Chen S. Drag Reduction Analysis of the Hydrostatic Bearing with Surface Micro Textures. Applied Sciences. 2022; 12(21):10831. https://doi.org/10.3390/app122110831
Chicago/Turabian StyleShang, Youyun, Kai Cheng, Qingshun Bai, and Shijin Chen. 2022. "Drag Reduction Analysis of the Hydrostatic Bearing with Surface Micro Textures" Applied Sciences 12, no. 21: 10831. https://doi.org/10.3390/app122110831
Note that from the first issue of 2016, this journal uses article numbers instead of page numbers. See further details here.