

A Benchmark for the Evaluation of Corner Detectors

School of Computer Science and Technology, Soochow University, Suzhou 215006, China
*
Author to whom correspondence should be addressed.
Appl. Sci. 2022, 12(23), 11984; https://doi.org/10.3390/app122311984
Submission received: 14 October 2022
/
Revised: 17 November 2022
/
Accepted: 21 November 2022
/
Published: 23 November 2022
(This article belongs to the Collection Computer Vision and Machine Learning: Theory, Methods and Applications)
Abstract
:Corners are an important kind of image feature and play a crucial role in solving various tasks. Over the past few decades, a great number of corner detectors have been proposed. However, there is no benchmark dataset with labeled ground-truth corners and unified metrics to evaluate their corner detection performance. In this paper, we build three benchmark datasets for corner detection. The first two consist of those binary and gray-value images that have been commonly used in previous corner detection studies. The third one contains a set of urban images, called the Urban-Corner dataset. For each test image in these three datasets, the ground-truth corners are manually labeled as objectively as possible with the assistance of a line segment detector. Then, a set of benchmark evaluation metrics is suggested, including five conventional ones: the precision, the recall, the arithmetic mean of precision and recall (APR), the F score, the localization error (Le), and a new one proposed in this work called the repeatability referenced to ground truth (RGT). Finally, a comprehensive evaluation of current state-of-the-art corner detectors is conducted.
1. Introduction
Detecting corners from images has been studied for many years. Existing popular corner detectors can be roughly divided into two categories: intensity-based methods and contour-based methods. The intensity-based corner detectors are derived from the observation that there are obvious intensity differences among image edges, corners, and flat areas. Early developed corner detectors in this category include the Harris [1] and SUSAN methods [2] and scale-invariant image feature detector proposed by Mikolajczyk et al. [3]. Later on, Xia et al. [4] developed the ACJ detector, which is based on the intensity variations in the edge pixels. After that, Xue et al. [5] introduced the anisotropic-scale corner detector (ASJ). DeTone et al. [6] proposed an interest point detector based on self-supervised learning (SuperPoint). Recently, the SOGGDD [7] ware proposed, which uses a second-order generalized Gaussian directional derivative to detect corners. Zhang and Sun [8] used a multi-directional structure tensor to detect corners. A new keypoint method was proposed by Kim et al. [9]. Wang et al. [10] introduced an efficient corner detector using a novel type of filter. By combining the SIFT algorithm [11] and Harris algorithm [1] proposed by Lowe et al. [11], Wang et al. [12] proposed an efficient matching and tracking algorithm based on corner detection. Luo et al. [13] proposed a robust and efficient corner detector (RECD) followed the Harris corner detector [1]. Bansal et al. [14] developed a combination of corner detectors and descriptors for object recognition tasks. Eltanany et al. [15] constructed a corner detector called Synthetic Aperture Radar-Phase Congruency Harris, based on phase congruency and the Harris corner detector. Jun et al. [16] developed a heatmap-based corner detection method for rectification of vehicle plate images. Wang et al. [17] proposed a self-adapting method for detecting corners from low-contrast images and jumbo-sized videos.
When the input image has rich edges, the contour-based corner detectors can achieve better performance than the intensity-based ones. Basically, edge contour curves are extracted from the image edge map first. After that, the curvature of each curve is measured. The corners are then obtained through curvature thresholding. Inspired by the curvature scale space corner detector proposed by Rattarangsi et al. [18], many multi-scale corner detectors have been developed, such as the multi-scale curvature product (MSCP) proposed by Zhang et al. [19]. Zhong et al. [20] proposed the direct curvature scale space (DCSS) representation of planar curves and then developed a DCSS-based corner detector. He et al. [21] proposed a corner detector by using the characteristics of global and local curvatures. Awrangjeb et al. [22] used the chord-to-point distance accumulation (CPDA) to detect corners. Zhang et al. [23] proposed a novel corner detector which is based on the gradient correlation matrix. Teng et al. [24] constructed a new corner detector based on the triangular theory and distance calculation (CTAR). Shui et al. [25] proposed a corner detector which uses anisotropic directional derivative representations (ANDDs). Zhang et al. [26] proposed a corner detector based on the weighted eigenvector-based angle estimator (WEAE). Zhang et al. [27] proposed new discrete curvature representations of single and double corner models and then further developed a corner detector (New-Curvature). Zhang et al. [28] used the multi-scale k-cosine angle to detect corners (MSRJ). Zhang et al. [29] used the relative distance and a multi-scale technique to detect corners. Zhang et al. [30] introduced a corner detector (RPD) based on the ratio of parallelogram diagonals. Song et al. [31] proposed a simple and fast corner detection method based on a two-stage model for vision-based alignment tasks. Dan et al. [32] developed a novel method based on the EDLines algorithm for the automatic detection of chessboard corners. Zhang et al. [33] proposed an efficient contour-based corner detector based on a dynamic measure of cornerity. Wang et al. [34] developed a corner detection algorithm in curvature scale space.
To conduct an objective evaluation of the detection results of a corner detector, existing methods can be grouped into the following two types. The first is evaluation with ground-truth corner points [2,3,4,5,6,7,8,19,21,23,25,26,27,28,33,35]. In this case, the used metrics include the precision, recall, F score and localization error. The rates of undetected and falsely detected corner points are also often used. The second type is evaluation without the ground-truth corner points, in which case the repeatability or consistency [36] as well as the localization accuracy measured under various transformations are used [4,5,7,8,22,25,26,27,30,37].
In this paper, problems existing in previous studies for the evaluation of corner detection performance are revealed and summarized, including the lack of benchmark datasets and the inconsistency in the use of evaluation metrics. To solve these problems, we construct three benchmark image datasets with the ground-truth corners labeled and suggest a set of benchmark metrics, including a newly proposed metric called the repeatability referenced to ground truth (RGT), for being exploited in the objective evaluation of corner detection performance. A comprehensive evaluation of state-of-the-art corner detectors is finally conducted based on the benchmark datasets and evaluation metrics.
2. Benchmark Construction
2.1. Existing Problems
The datasets and evaluation metrics used in previous corner detection studies, as well as their evaluation methods, are not unified. In particular, some of them have obvious problems, which are described as follows:
Problem 1. The repeatability metric is frequently used. However, there is no ground truth for reference. Repeating a false positive under different image transformations is not helpful for image understanding but is taken as a valid detection when the repeatability metric is used.
Problem 2. When the precision, recall and F score are used, it is required that the test images be labeled with ground-truth corners. For this, in previous studies, only a couple of images with ground-truth corners labeled by the algorithm’s authors were used, and there are no ground truths of actual corners from these test images provided online for public access.
Problem 3. Various non-standard evaluation metrics have also been used often, such as undetected and falsely detected corner numbers. In fact, these non-standard evaluation metrics have already been embedded in standard metrics. For example, the numbers of undetected and wrongly detected corners are the numbers of false negatives and false positives, which have already been taken into account in the precision and recall metrics.
2.2. Benchmark Datasets
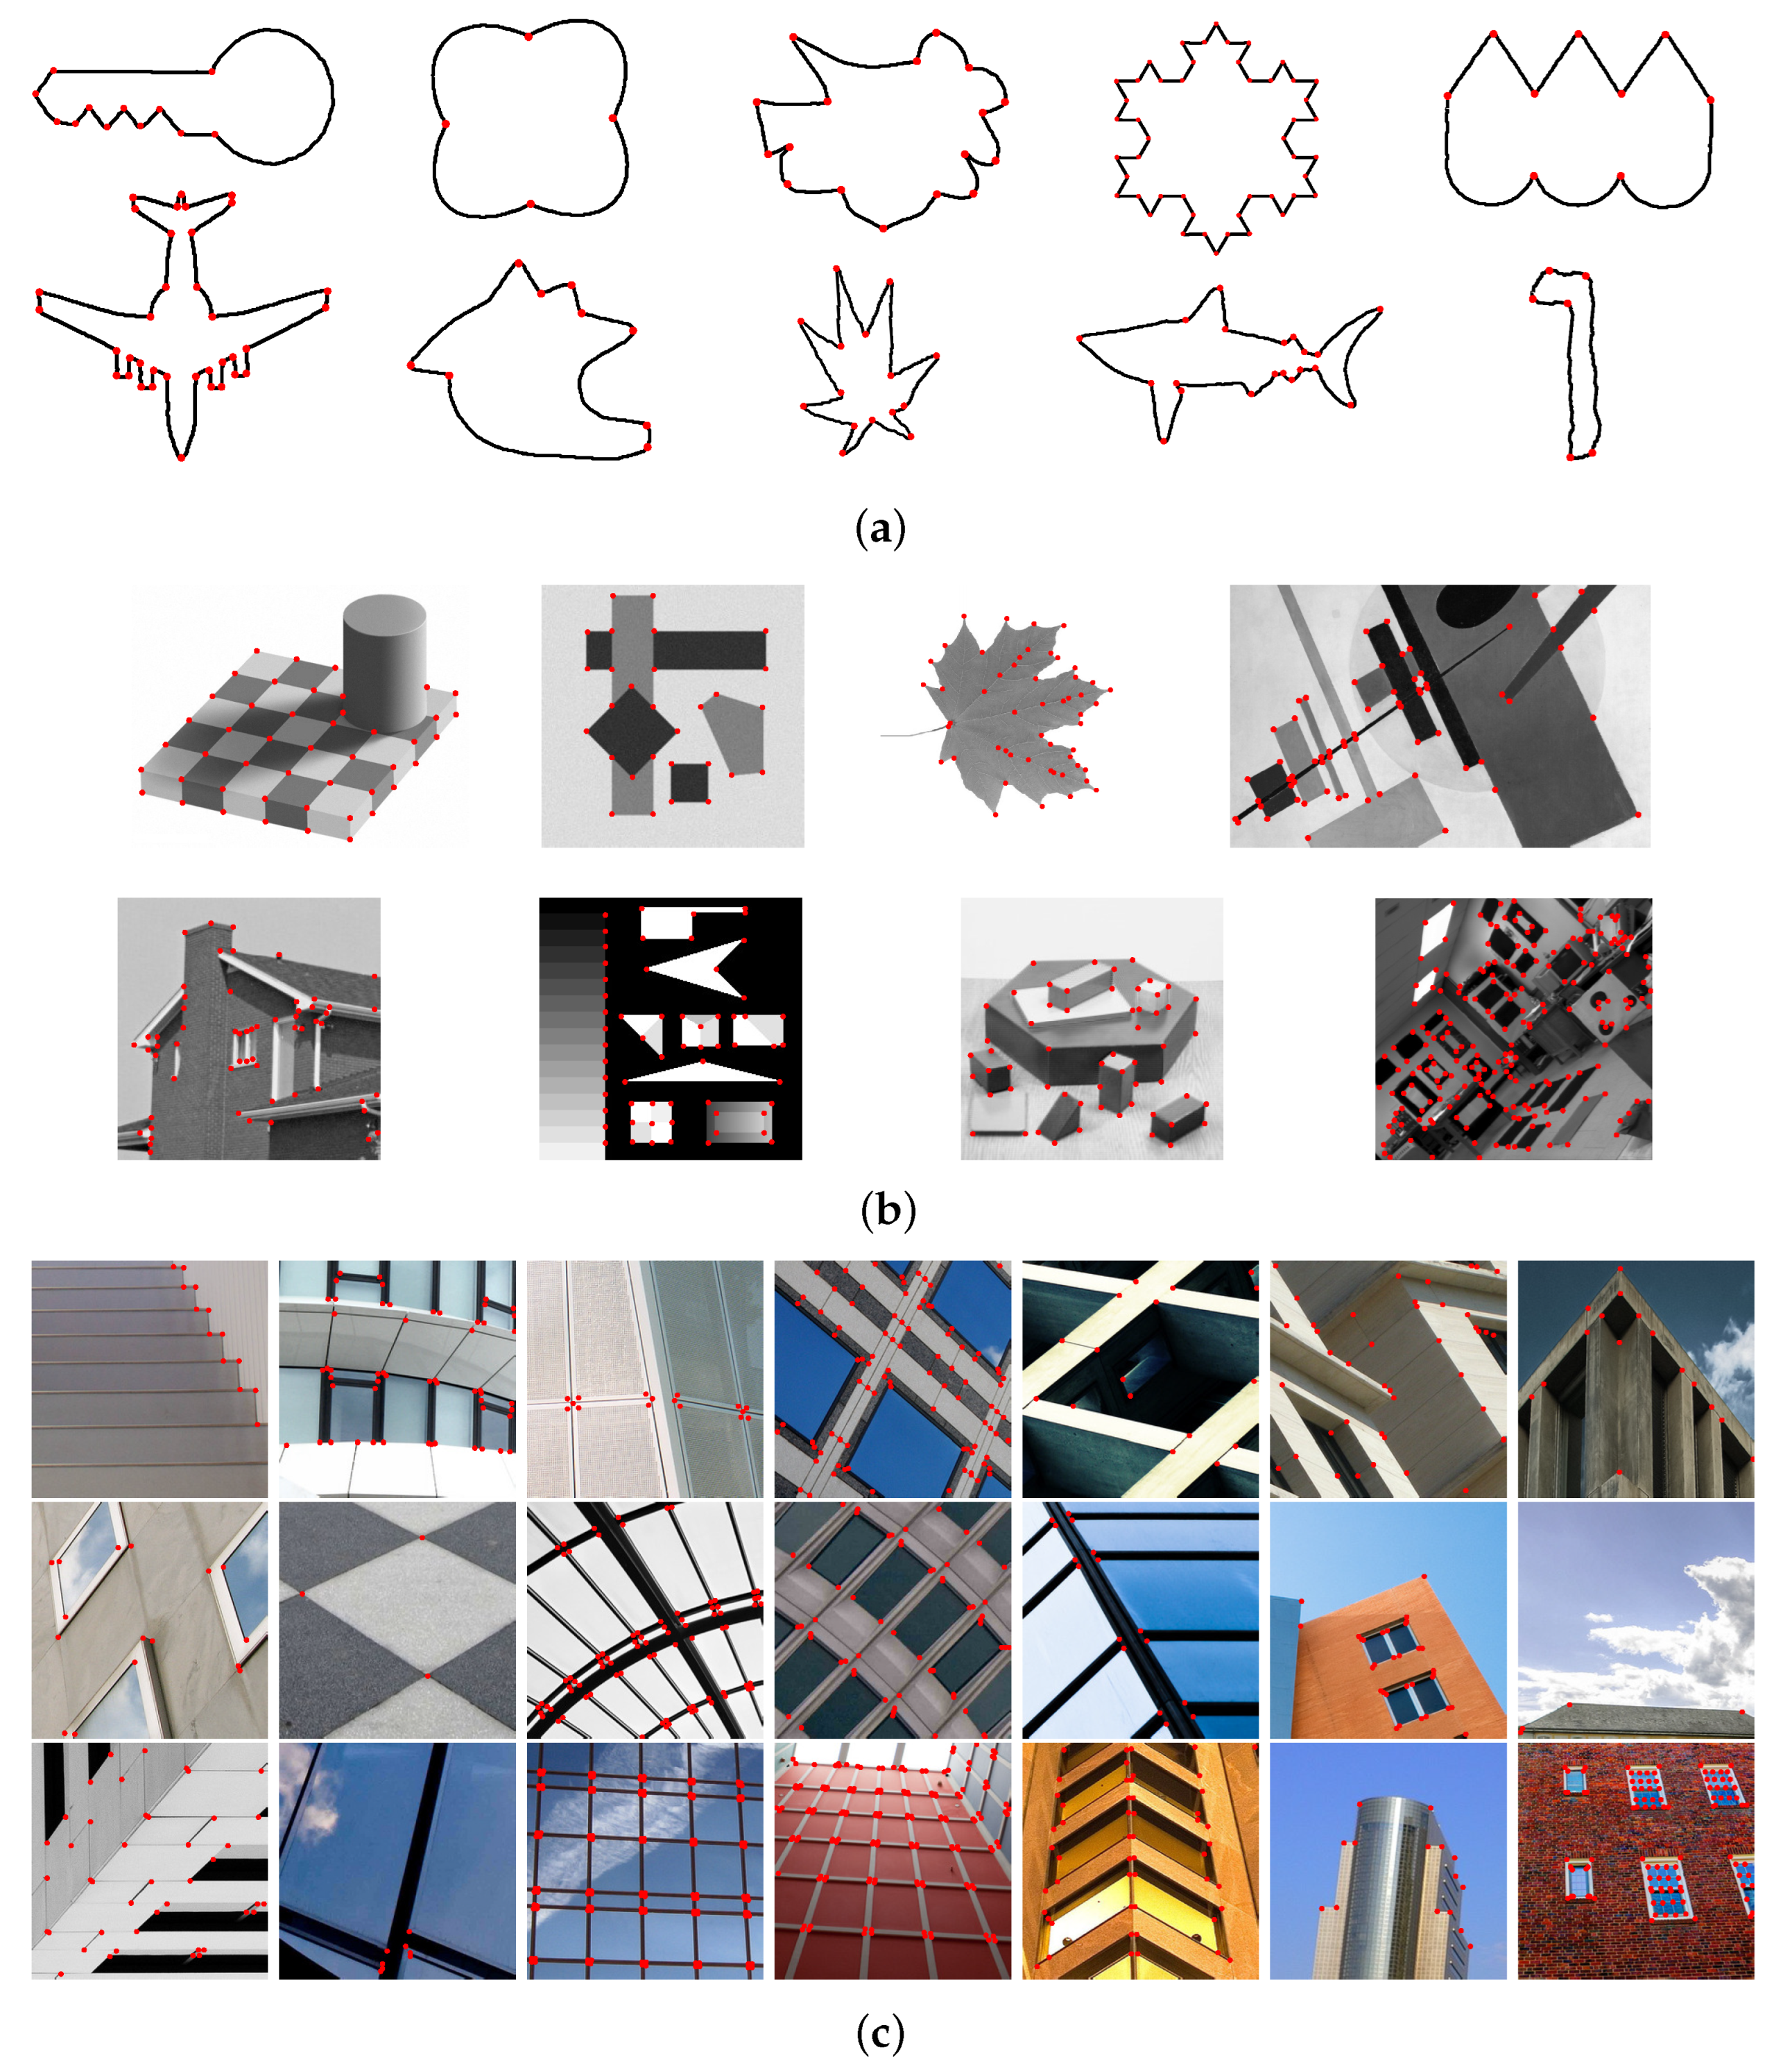
In this work, three benchmark datasets for corner detection are constructed, as shown in Figure 1. The first two consist of those binary and gray-value images that have been commonly used in previous corner detection studies [4,38,39,40]. The third one, which is new, was developed by us and is called Urban-Corner. These datasets will be used to perform an extensive evaluation of 18 state-of-the-art corner detectors. In what follows, it is described in detail how the third dataset (i.e., Urban-Corner) is established. The Urban-Corner dataset contains 21 images, (These datasets with ground-truth corners have been made available online at https://github.com/yangzhangcv (accessed on 3 January 2022), and more images will be added gradually.) and the size of each image is 256 × 256 pixels. These images were selected from the Urban100 dataset [41], which was chosen as the source of our Urban-Corner dataset due to the following two reasons. First, the Urban100 dataset has been widely used in various image processing tasks. Due to the fact that the images in this dataset all have a high resolution, the ground-truth corners can be labeled with high precision. Secondly, each image contains urban street views with clear corners. Because our human visual system is sensitive to the sharp corners of objects, we selected images which had uncontested corners for human visual perception, excluding those with vague corners that were hard to identify. The Urban-Corner dataset can be roughly divided into two categories according to the presented content: the surface structures of buildings and images that only contain outlines of buildings.
When selecting images and labeling the ground truths, the details for the protocol and conditions are as follows:
(1) Our rule was to select the test images from Urban100. In the literature, test images for evaluating corner detection performance frequently contained a lot of ‘ambiguous’ corners, such as ‘corners’ on clothes, hair, and other non-rigid objects. Even for our human visual system, such ‘corners’ are hard to recognize, and different people would have different judgments on whether they are true (i.e., meaningful) corners or not. Therefore, in our work, only an image containing more well-defined corners and less ‘ambiguous’ ones could be selected and included in our Urban-Corner dataset. This is in line with real-world applications, where only those well-defined corners can be exploited to solve the follow-up image processing tasks, such as scene analysis and 3D reconstruction. This ‘rule of thumb’ greatly helped us to reduce the difficulty and risk of errors in the corner labeling process.
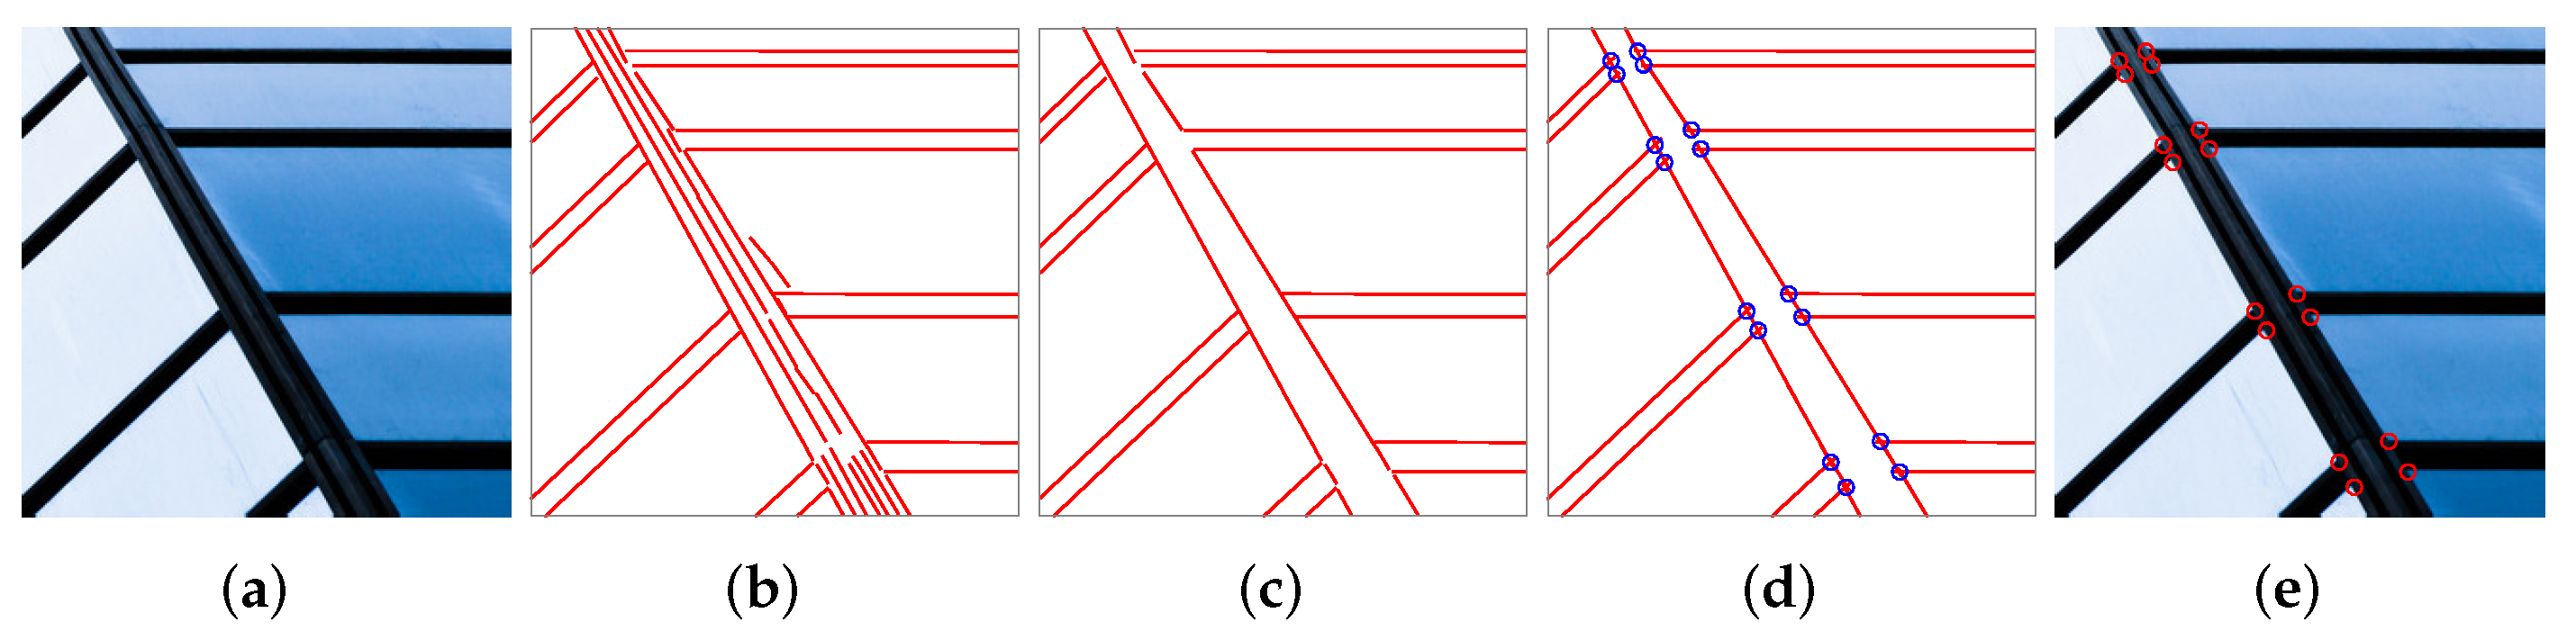
(2) For our method of labeling the ground-truth corners in a test image, it is found that confusing detection could be yielded for geometric attributes at the pixel scale (invisible to the eye and of no interest at the human observation scale), as well as the perceptual detection of such a stimulus (corner). To overcome this difficulty, our corner labeling process was performed with the help of the edge information of the input image by using an edge detector or the detected line segment information by using a line segment detector. First, the line segments were detected by using a line segment detector (LSD) [42]. Then, insignificant or redundant line segments were removed by us. After that, the initial corners were produced from the intersections of those significant line segments. As a result, the accuracy of the corner labeling was greatly improved.
(3) In our method to confirm the corner labeling results, in order to finally confirm them, all the other members (14 persons in total) in our research group were recruited as volunteers to vote on whether a labeled corner could represent a ground-truth corner or not. If more than 70% (i.e., 10) persons agreed with a corner labeling result, then the labeled corner was taken as the ground truth; otherwise, it was discarded.
For easy understanding, we give an example (Figure 2) to show the protocol of labeling the ground truth.
2.3. Benchmark Evaluation Metrics
In previous studies, corner detectors were evaluated by using the precision [21,43], recall [43], localization error (Le) [22,25,28,37], and repeatability metrics [22,25,26,27,28,37]. Among these metrics, the repeatability metric could be the most popular one used in the evaluation of corner detectors, which is based on the number of repeated corners between the original images and transformed images. Unfortunately, its evaluation mechanism has an obvious flaw: if a repeated corner is a false positive, then it will not make sense in the evaluation of corner detection performance.
We denote the corner sets detected from the original and transformed images as and , respectively. Let , which is the set of corners that have been repeatedly detected on the two images. Let , , and be the numbers of corners in the sets , , and , respectively. The existing repeatability metric REP is given by
In this paper, we denote the set of ground-truth corners as and let , which is the set of ground-truth corners that have been repeatedly detected. Let be the number of corners in the set . Our proposed repeatability metric, (i.e., the repeatability referenced to ground truth (RGT)), is then defined as
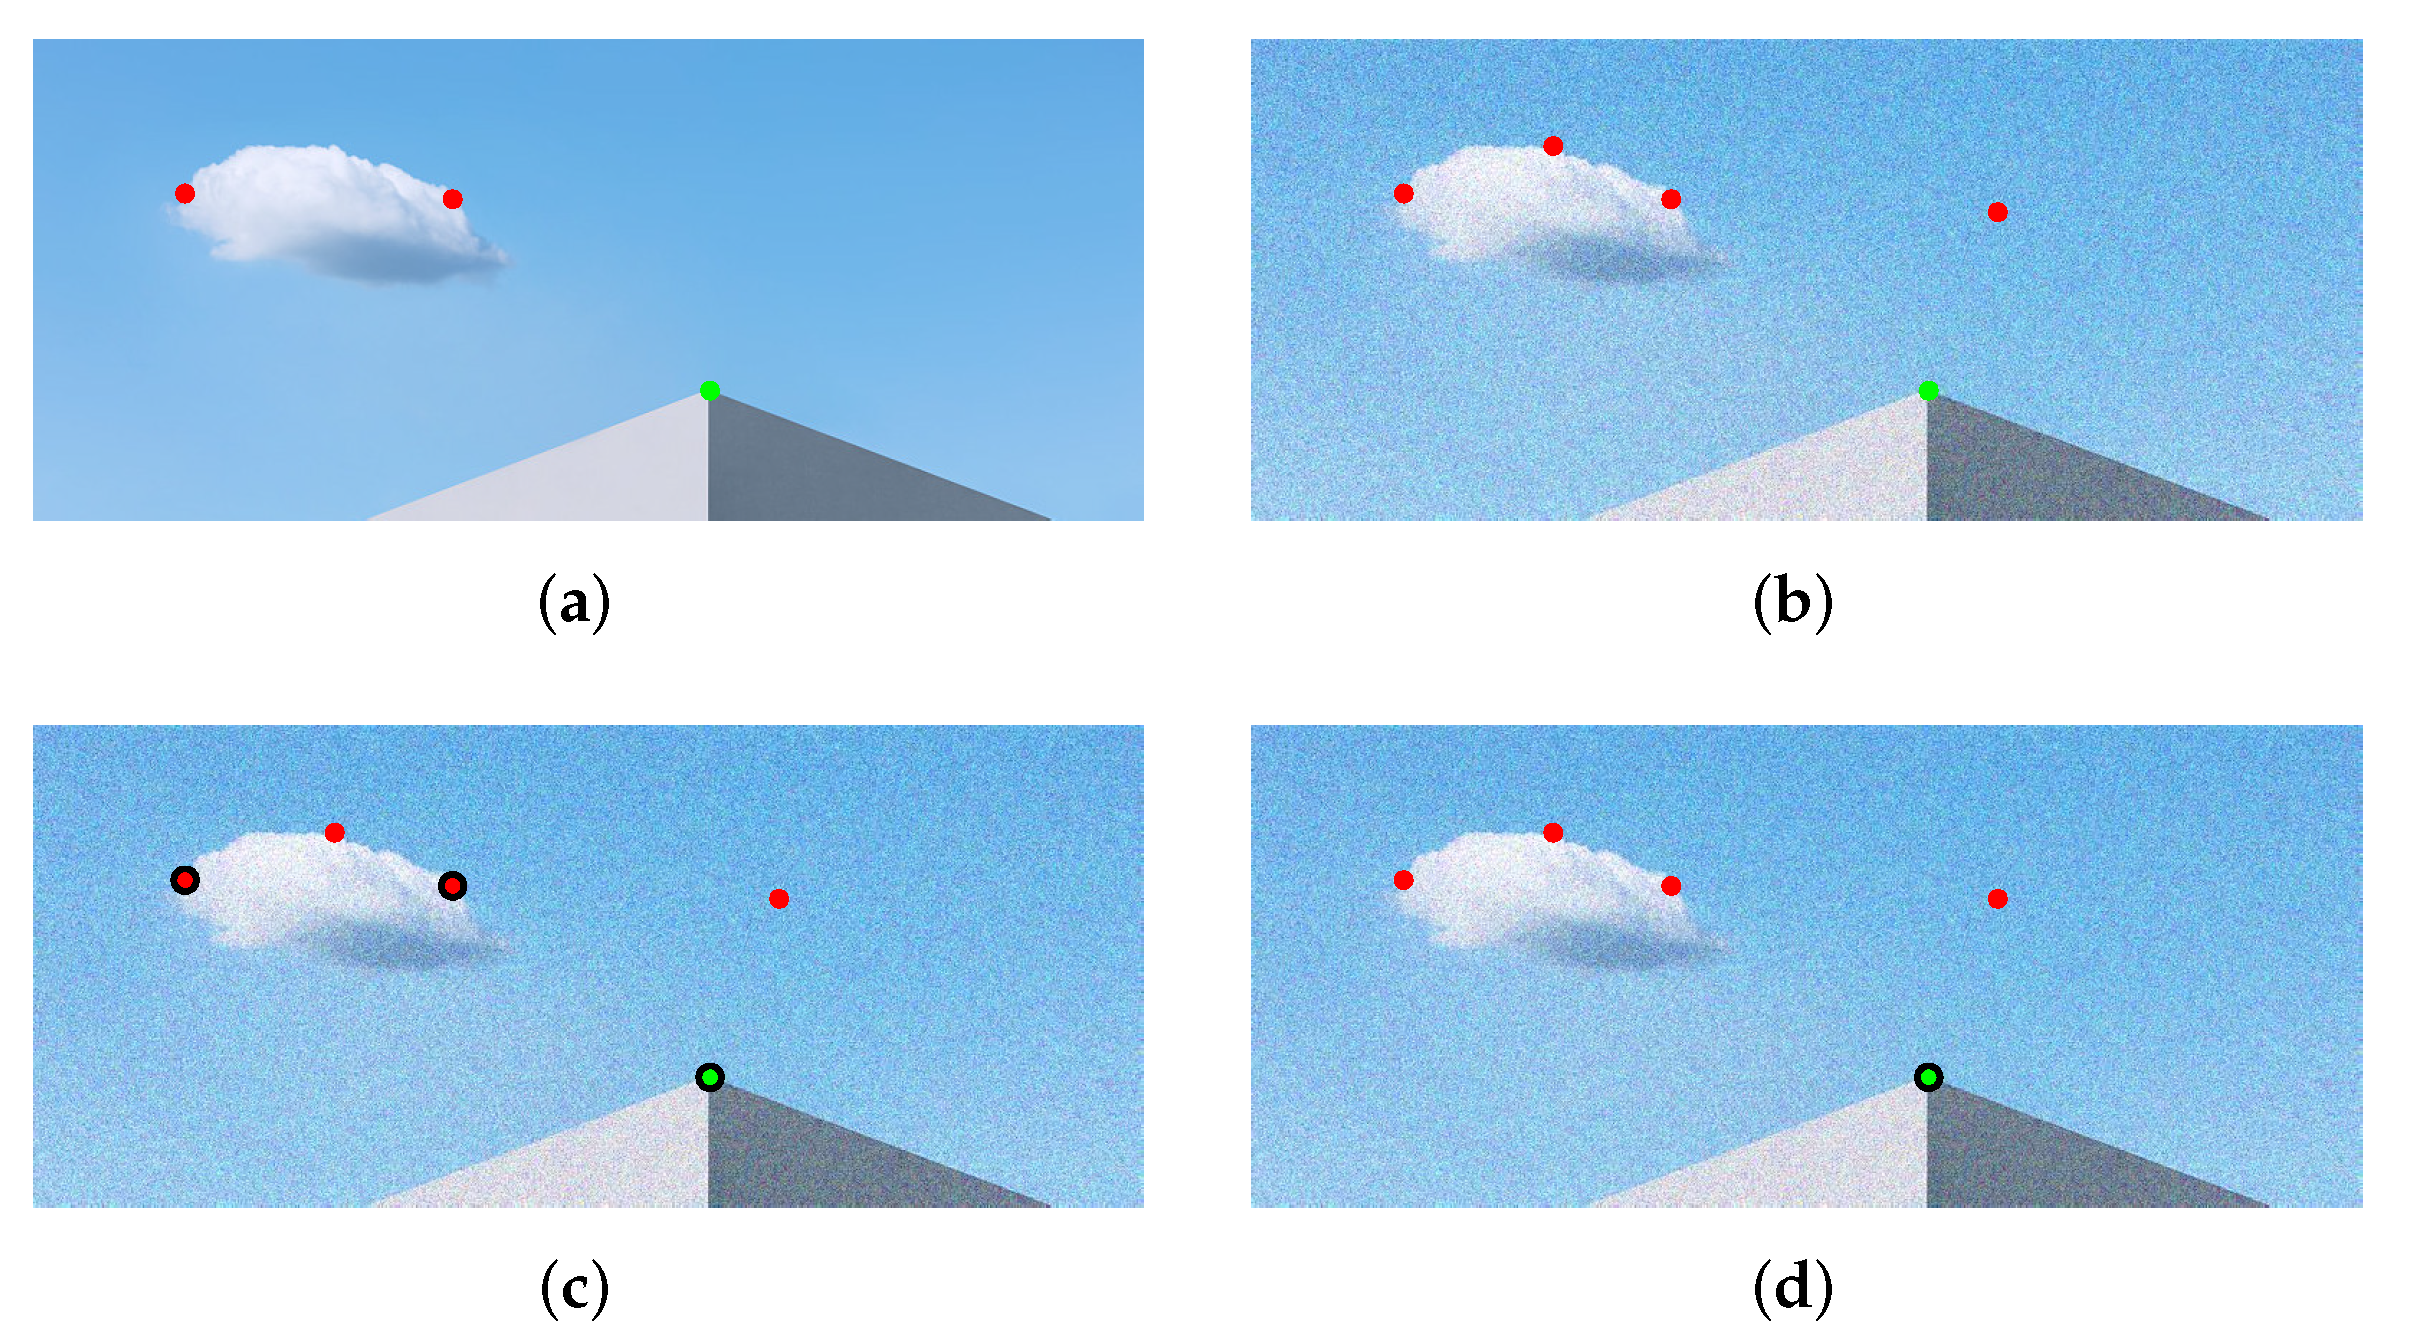
For ease of understanding, Figure 3 demonstrates an example of comparing the flawed repeatability metric (REP) and our proposed repeatability metric (RGT). The corners detected in the original image () are shown in Figure 3a. The corners detected in a noise-corrupted version of the image () are presented in Figure 3b. According to Figure 3a,b, three corners were repeatedly detected in the two images (marked with black circles) in Figure 3c (i.e., , and thus ). Only one ground-truth corner was repeatedly detected in the two images (marked with a black circle) in Figure 3d (i.e., ). As a consequence, we found that .
Due to the lack of corner annotations, the precision, recall and F score are rarely used to evaluate corner detection performance. Most previous studies only use the repeatability and localization error, which are unfortunately not authoritative or unified. In this paper, a set of benchmark evaluation metrics is suggested, including the precision, recall, APR (the arithmetic mean of precision and recall), F score, Le and our newly developed RGT. Note that all our suggested evaluation metrics are referenced to ground truths, where a fundamental consideration is that only the repeated detection of true positives can be taken as a merit of the used algorithm. Our benchmark evaluation metrics are as follows:
(1) Precision is expressed as
where denotes the number of corners in the set and is the number of falsely detected corners (i.e., false positives).
(2) The recall is expressed as
where is the number of undetected corners (i.e., false negatives).
(3) The APR is expressed as
(4) The F score is expressed as
where is assigned to be 1.
(5) The localization error is expressed as
where are the coordinates of a detected corner point () in the corner set and are the coordinates of the nearest ground-truth corner () in the corner set .
(6) The RGT is expressed as
3. Benchmark Evaluation Analysis
In this section, our three developed benchmark datasets are used to evaluate the current state-of-the-art corner detectors (18 in total), including 6 intensity-based methods—SUASAN [2], Harris-Laplace [3], SuperPoint [6], ASJ [5], Zhang & Sun [8], and SOGGDD [7]—and 12 contour-based methods: MSCP [19], CPDA [22], Fast-CPDA [37], He & Yung [21], DOG [35], GCM [23], ANDD [25], WEAE [26], New-Curvature [27], MSRJ [28], RPD [30], and DMC [33]. For a fair comparison, the original codes (if publicly available online) with default parameters released by their respective authors are used. For those corner detectors that had no publicly available resources, they were coded by us, including MSCP [19], MSRJ [28], RPD [30], and DMC [33].
3.1. Objective Evaluation
The results of objective evaluation of different corner detectors obtained for the three benchmark datasets are documented in Table 1, where the precision, recall, APR and F score are used. Note that the evaluation results were averaged over all the test images in each dataset. It can be seen that the DMC detector [33] delivered the highest APR and F score as well as competitive precision and recall. The SODDGG [7], He & Yung [21], and SUSAN [2] methods produced the best performance for recall on Dataset 1, Dataset 2, and Dataset 3, respectively. MSRJ achieved the best performance for precision on Dataset 2.
To evaluate the performance of corner detection under different situations, in total, 16,497 transformed images were obtained by applying 5 different types of attacks on each originally chosen image, which are detailed as follows:
- Noise.
- Zero-mean Gaussian white noise was added to each image. The variance was chosen to be at apart.
- Rotation.
- Each image was rotated to different angles in at apart (excluding , as it corresponds to the original image).
- Scaling.
- Each image was scaled (uniformly and non-uniformly) with the scaling factors and , chosen in at apart, independently and respectively (excluding the case ).
- Combined transformation.
- Combined transformations (by rotation and scaling) were applied to each image with rotation angles sampled in at apart, excluding , and scaling factors sampled in at 0.1 apart, excluding , independently and respectively.
- Lossy compression.
- Each image was compressed by using JPEG lossy compression with the quality factor sampled in at 5 points apart.
The performance of the 18 SOTA corner detectors implemented on the degraded images is summarized in Table 2. From this table, it can be seen that the DMC method delivered superior performance in most cases, indicating that this method has strong robustness. The CPDA [22], New-Curvature [27], and MSRJ [28] methods also performed more stably than the others. SUSAN [2] had extremely high recall in some cases but produced a low APR and F score because of its extremely poor precision.
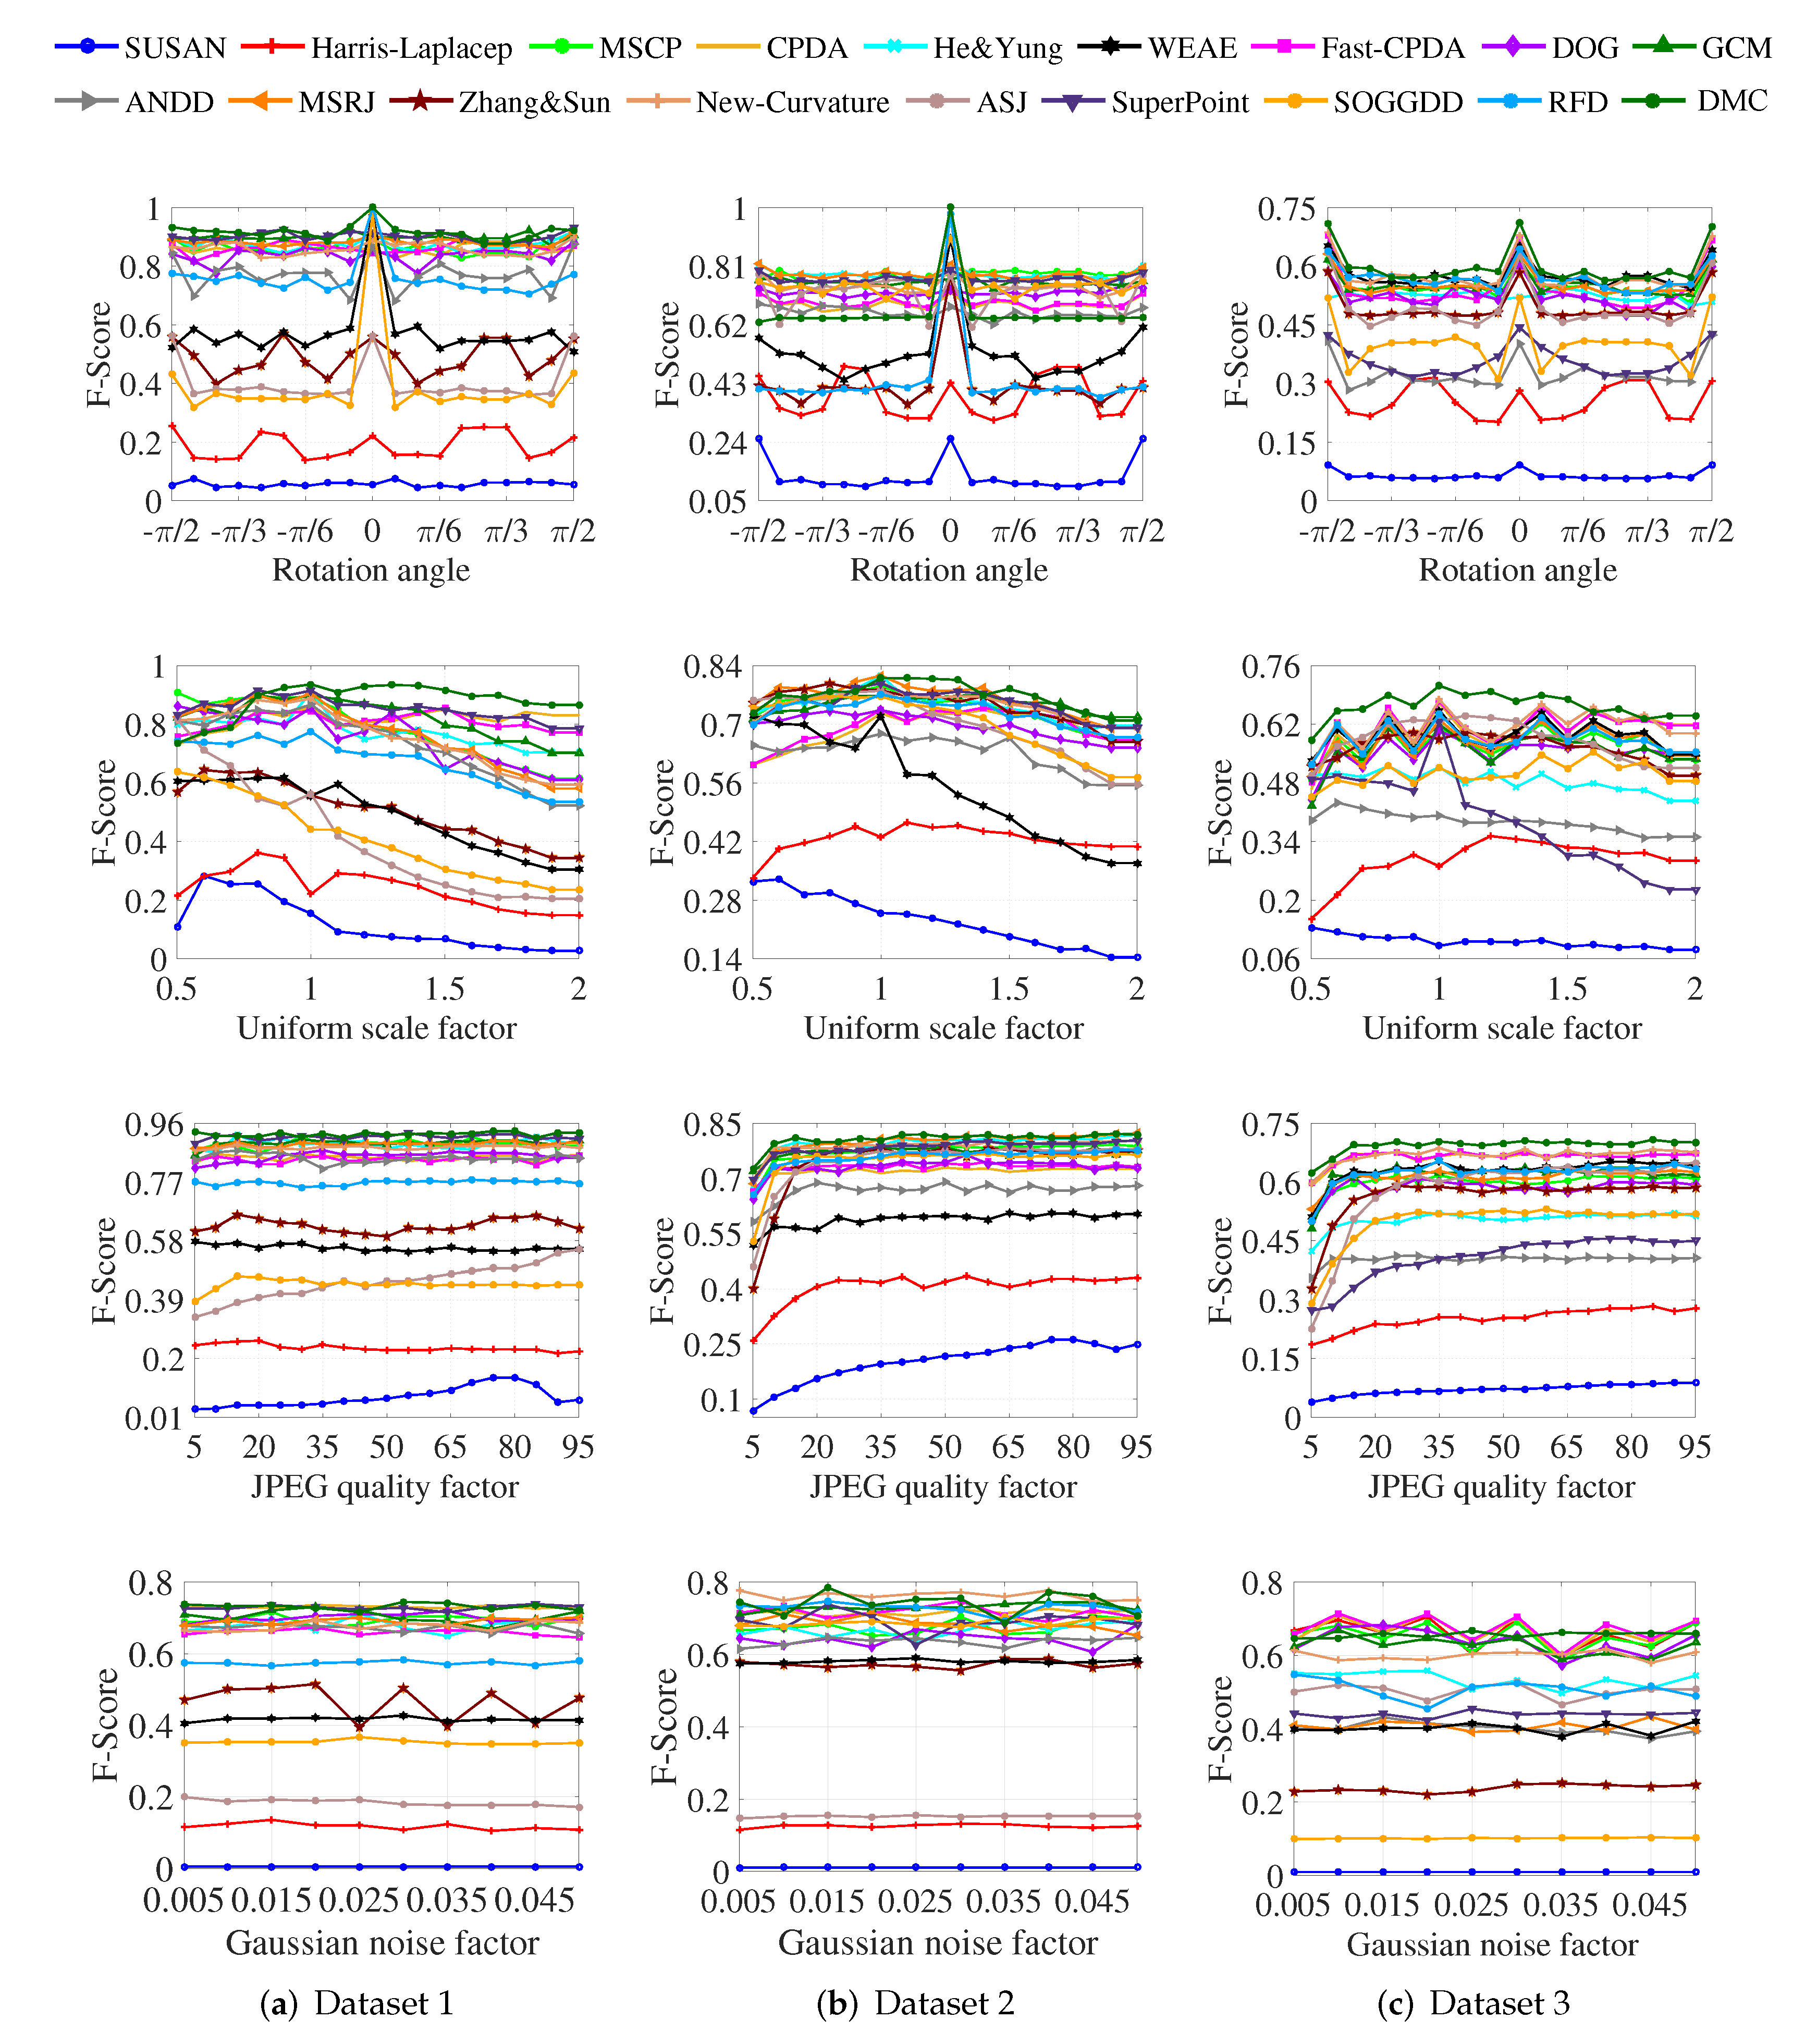
In more detail, the performance of the evaluated corner detectors for the attacked images is depicted in Figure 4. It can be seen from the first row that these 18 detectors were all influenced by the rotated images. Most detectors performed well at rotation angles of and and received a certain degree of volatility at other angles. The second row of Figure 4 shows that the evaluated corner detectors had different fluctuations in the case of uniform scaling. New-Curvature [27] performed better than the other detectors in this case. From the last two sub-figures in the third row, it can be seen that each detector performed stably on Dataset 2 and Dataset 3 when the JPEG quality factor was greater than 20. In the last line, most corner detectors performed rather stably for different levels of Gaussian noise.
Table 3 shows the performance of different methods when measuring the RGT and localization error. From this table, one can see that Fast-CPDA [37] achieved the best performance in terms of the RGT on Dataset 1 and Dataset 2, while DMC [33] obtained the best RGT on Dataset 3. As for the localization error, ANDD [25], Harris-Laplace [3], and RPD [30] achieved superior performance on Dataset 1, Dataset 2, and Dataset 3, respectively. This indicates that the use of a multi-scale curvature measurement [37] or a dynamic measurement [33] can help to achieve satisfactory corner detection performance, since strong corners can become more dominant than weak corners.
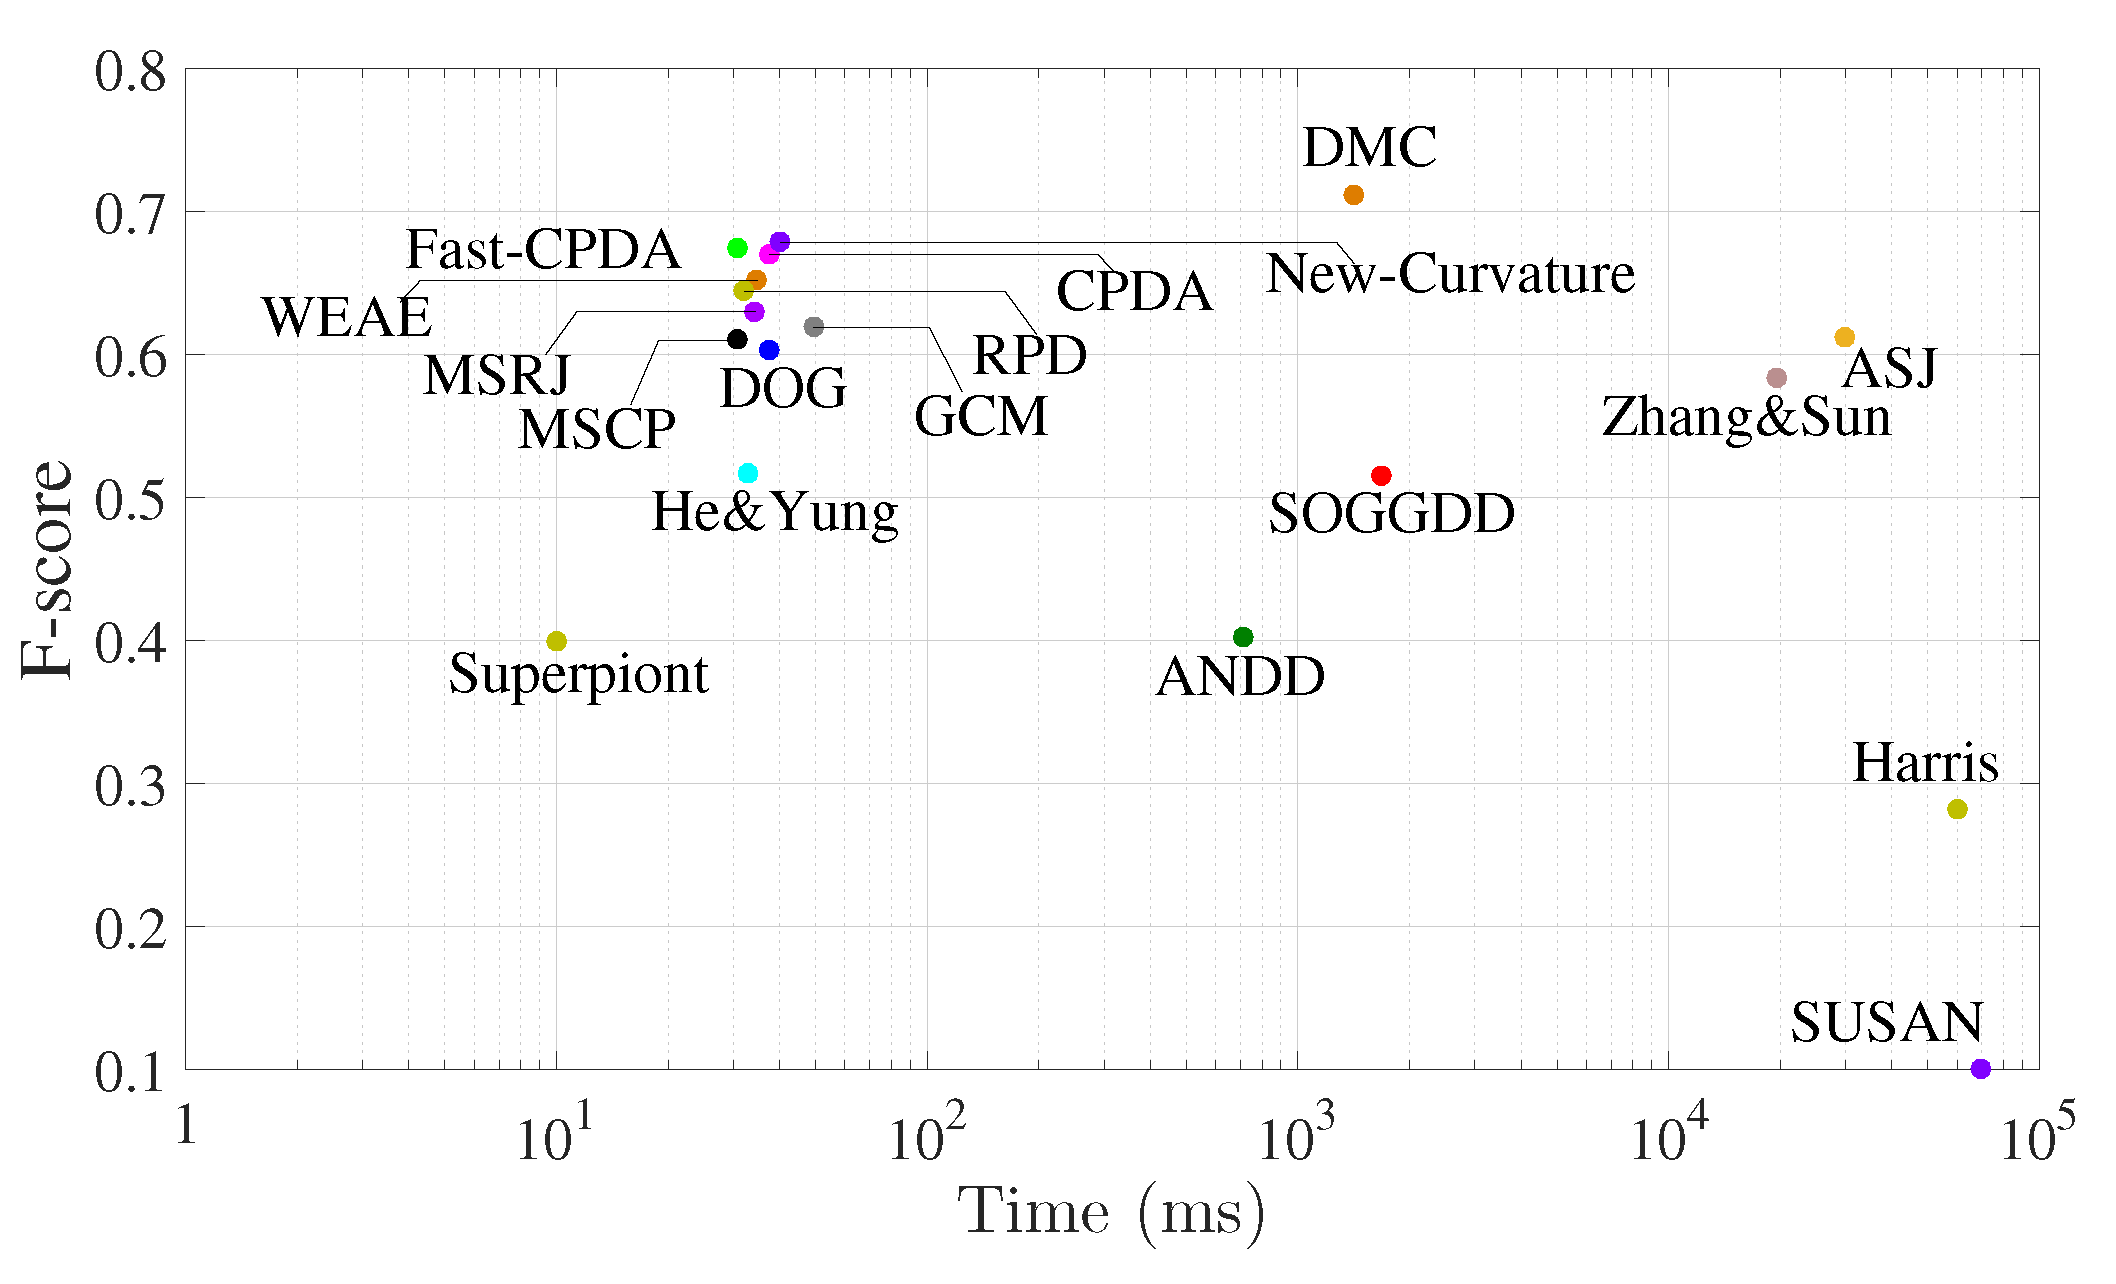
A comparison of all the evaluated corner detectors with respect to the running time is presented in Figure 5. Except for Superpoint, which was coded and tested with an NVIDIA Titan Xp GPU, and ASJ, which was coded and tested in C, our experiments were implemented in MATLAB on a machine equipped with an Intel Core i7 16 GB RAM @ 2.3 GHz. In Figure 5, the CPU time of each method is plotted against its F score, with both averaged over the Urban-Corner dataset. Note that a desirable corner detector should achieve a high F score with a short running time. In comparison, Superpoint [6] consumed the least running time, while DMC achieved the best F score. As a result, it is suggested that Superpoint [6] can be used in real-time applications, such as target tracking and positioning [12,17]. On the other hand, DMC [33] and New-Curvature [27] can be applied in those tasks requiring high detection accuracy, such as image matching and recognition [12,16,31].
3.2. Subjective Evaluation
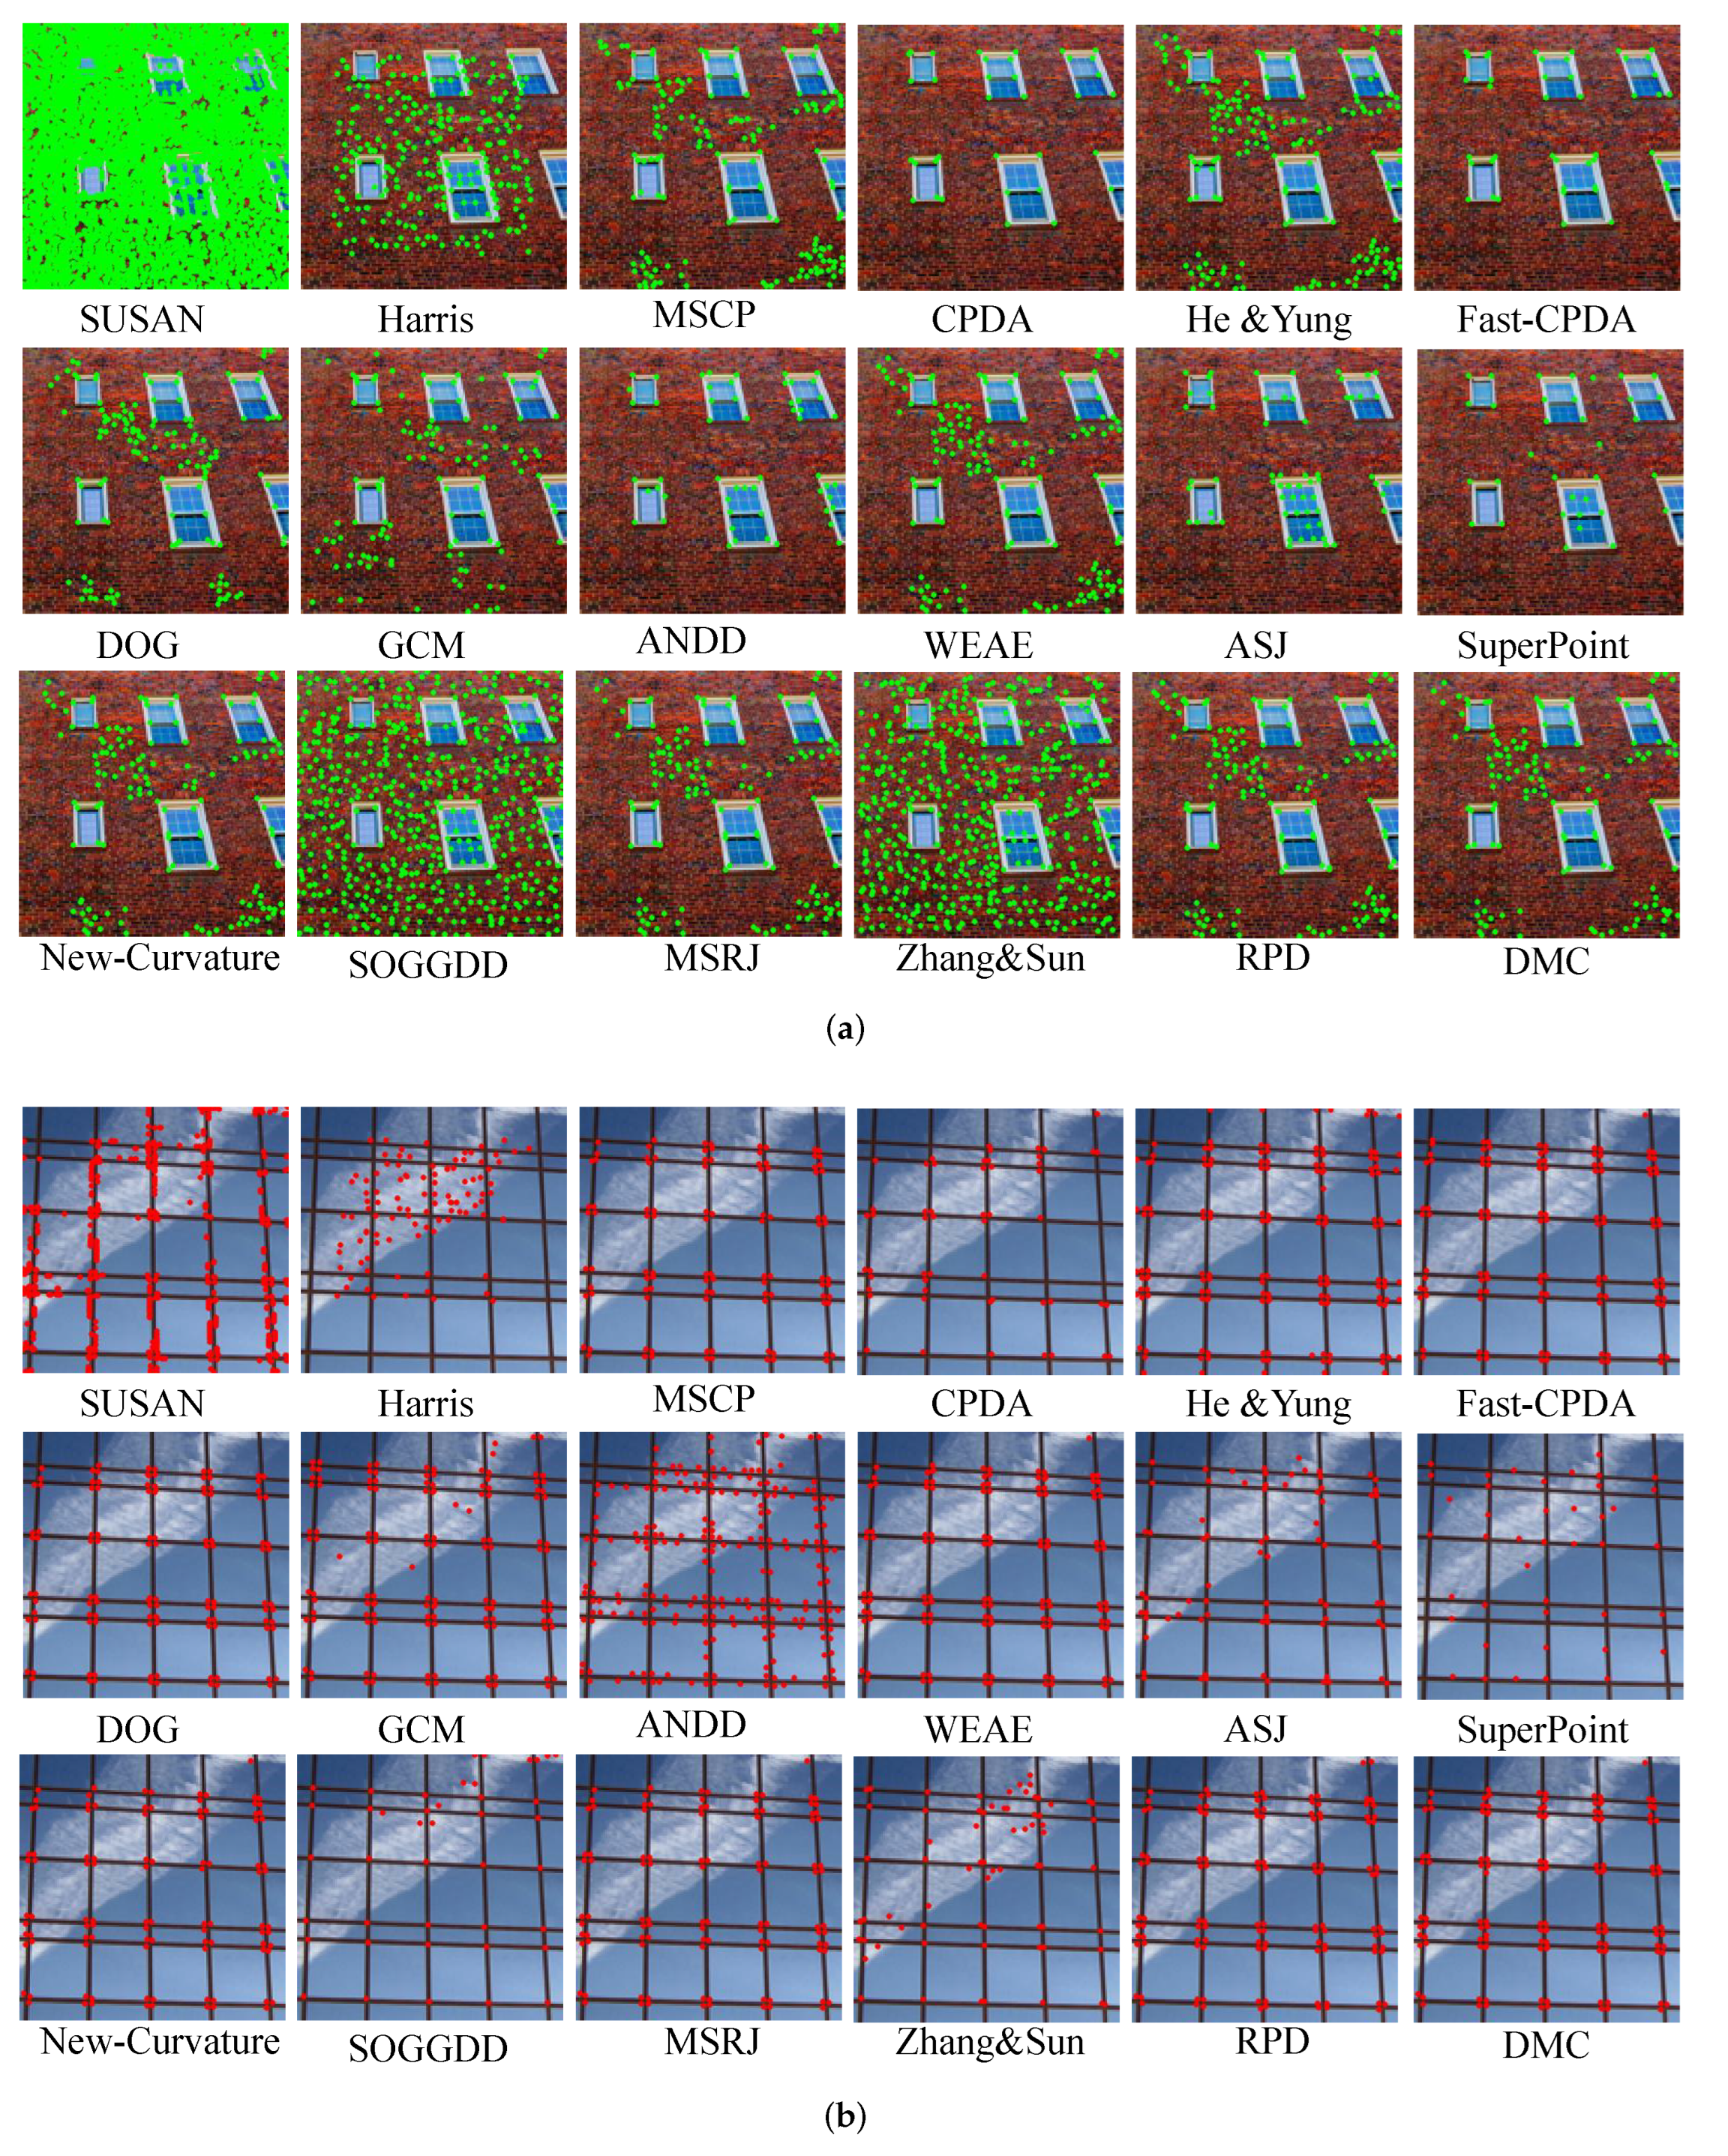
Subjective evaluation plays a considerable role in the assessment of corner detection algorithms. In fact, a corner detector with better subjective performance according to human vision can solve visual tasks better. Figure 6 shows the detected results of the 18 corner detectors when using two test images. Figure 6a indicates that most of the intensity-based corner detectors (e.g., SUSAN [2], Harris-Laplace [3], SOGGDD [7], and Zhang & Sun [8]) performed worse than the contour-based corner detectors (e.g., CPDA [22], Fast-CPDA [37], New-Curvature [27], and ANDD [25]), because the intensity-based corner detectors were sensitive to small changes in the images’ gray values. In Figure 6b, it can be seen that many corner detectors produced false positives due to the interference cloud, while such a nonrigid object is not supposed to be taken into account in corner detection.
According to the objective and subjective experimental results, there are still some challenging problems in corner detection. Intensity-based methods usually use first-order or second-order derivatives to detect corners and can thus identify non-corner edge points as corners incorrectly. Contour-based corner detectors are based on edge extraction and can thus yield large localization errors. Another fundamental problem is that both kinds of methods exploit a small amount of image smoothing to suppress noise at the beginning of corner detection, which is generally performed with the linear Gaussian kernel. However, non-linear kernels, such as those in [44,45], have the merit of edge preservation and can thus be used instead.
4. Conclusions
In this paper, several serious problems existing in the objective evaluation of corner detection performance were pointed out. To solve these problems, benchmark datasets were constructed, followed by suggesting a set of benchmark evaluation metrics. In particular, a new evaluation metric (i.e., the repeatability referenced to ground-truth (RGT)), is proposed for use in corner detection evaluation. A number of state-of-the-art corner detectors are finally selected to perform evaluation analysis.
Author Contributions
Conceptualization, Y.Z.; methodology, Y.Z. and B.Z.; software, Y.Z.; validation, Y.Z., B.Z. and X.S.; formal analysis, B.Z.; investigation, Y.Z.; resources, Y.Z. and X.S.; data curation, Y.Z. and X.S.; writing—original draft preparation, Y.Z.; writing—review and editing, B.Z.; visualization, Y.Z. and X.S.; supervision, B.Z.; project administration, Y.Z.; funding acquisition, B.Z. All authors have read and agreed to the published version of the manuscript.
Funding
This work was supported in part by the Natural Science Foundation of the Jiangsu Higher Education Institutions of China under Grant 21KJA520007, in part by the National Natural Science Foundation of China under Grant 61572341, in part by the Priority Academic Program Development of Jiangsu Higher Education Institutions, and in part by the Collaborative Innovation Center of Novel Software Technology and Industrialization.
Conflicts of Interest
The authors declare no conflict of interest.
References
- Harris, C.; Stephens, M. A combined corner and edge detector. In Proceedings of the Alvey Vision Conference, Manchester, UK, 31 August–2 September 1988; Volume 15, pp. 10–5244. [Google Scholar]
- Smith, S.M.; Brady, J.M. SUSAN—a new approach to low level image processing. Int. J. Comput. Vis. 1997, 23, 45–78. [Google Scholar] [CrossRef]
- Mikolajczyk, K.; Schmid, C. Scale & affine invariant interest point detectors. Int. J. Comput. Vis. 2004, 60, 63–86. [Google Scholar]
- Xia, G.S.; Delon, J.; Gousseau, Y. Accurate junction detection and characterization in natural images. Int. J. Comput. Vis. 2014, 106, 31–56. [Google Scholar] [CrossRef] [Green Version]
- Xue, N.; Xia, G.S.; Bai, X.; Zhang, L.; Shen, W. Anisotropic-scale junction detection and matching for indoor images. IEEE Trans. Image Process. 2017, 27, 78–91. [Google Scholar] [CrossRef] [Green Version]
- DeTone, D.; Malisiewicz, T.; Rabinovich, A. Superpoint: Self-supervised interest point detection and description. In Proceedings of the IEEE Conference on Computer Vision and Pattern Recognition Workshops, Salt Lake City, UT, USA, 18–22 June 2018; pp. 224–236. [Google Scholar]
- Zhang, W.; Sun, C. Corner detection using second-order generalized Gaussian directional derivative representations. IEEE Trans. Pattern Anal. Mach. Intell. 2019, 43, 1213–1224. [Google Scholar] [CrossRef] [PubMed]
- Zhang, W.; Sun, C. Corner detection using multi-directional structure tensor with multiple scales. Int. J. Comput. Vis. 2020, 128, 438–459. [Google Scholar] [CrossRef]
- Kim, S.; Jeong, M.; Ko, B.C. Self-Supervised Keypoint Detection Based on Multi-layer Random Forest Regressor. IEEE Access 2021, 9, 40850–40859. [Google Scholar] [CrossRef]
- Wang, M.; Sun, C.; Sowmya, A. Efficient corner detection based on corner enhancement filters. Digit. Signal Process. 2022, 2022, 103364. [Google Scholar] [CrossRef]
- Lowe, D.G. Distinctive image features from scale-invariant keypoints. Int. J. Comput. Vis. 2004, 60, 91–110. [Google Scholar] [CrossRef]
- Wang, Y.; Li, Y.; Wang, J.; Lv, H.; Yang, Z. A Target Corner Detection Algorithm Based on the Fusion of FAST and Harris. Math. Probl. Eng. 2022, 2022, 4611508. [Google Scholar] [CrossRef]
- Luo, T.; Shi, Z.; Wang, P. Robust and efficient corner detector using non-corners exclusion. Appl. Sci. 2020, 10, 443. [Google Scholar] [CrossRef]
- Bansal, M.; Kumar, M.; Kumar, M.; Kumar, K. An efficient technique for object recognition using Shi-Tomasi corner detection algorithm. Soft Comput. 2021, 25, 4423–4432. [Google Scholar] [CrossRef]
- Eltanany, A.S.; Amein, A.S.; Elwan, M.S. A modified corner detector for SAR images registration. Int. J. Eng. Res. Afr. 2021, 53, 123–156. [Google Scholar] [CrossRef]
- Jun, K. Unsupervised Domain Adaptive Corner Detection in Vehicle Plate Images. Sensors 2022, 22, 6565. [Google Scholar] [CrossRef] [PubMed]
- Wang, Y.; Tang, X.; Xia, M.l.; Sun, L. An Improved Self-adapting Corner Detection Algorithm for Low-contrast Images. In Proceedings of the 2022 5th International Symposium on Autonomous Systems (ISAS), Hangzhou, China, 8–10 April 2022; pp. 1–4. [Google Scholar]
- Rattarangsi, A.; Chin, R.T. Scale-based detection of corners of planar curves. In Proceedings of the 10th International Conference on Pattern Recognition, Atlantic City, NJ, USA, 16–21 June 1990; Volume 1, pp. 923–930. [Google Scholar]
- Zhang, X.; Lei, M.; Yang, D.; Wang, Y.; Ma, L. Multi-scale curvature product for robust image corner detection in curvature scale space. Pattern Recognit. Lett. 2007, 28, 545–554. [Google Scholar] [CrossRef]
- Zhong, B.; Liao, W. Direct curvature scale space: Theory and corner detection. IEEE Trans. Pattern Anal. Mach. Intell. 2007, 29, 508–512. [Google Scholar] [CrossRef]
- He, X.; Yung, N.H.C. Corner detector based on global and local curvature properties. Opt. Eng. 2008, 47, 057008. [Google Scholar]
- Awrangjeb, M.; Lu, G. Robust image corner detection based on the chord-to-point distance accumulation technique. IEEE Trans. Multimed. 2008, 10, 1059–1072. [Google Scholar] [CrossRef] [Green Version]
- Zhang, X.; Wang, H.; Smith, A.W.; Ling, X.; Lovell, B.C.; Yang, D. Corner detection based on gradient correlation matrices of planar curves. Pattern Recognit. 2010, 43, 1207–1223. [Google Scholar] [CrossRef]
- Teng, S.W.; Sadat, R.M.N.; Lu, G. Effective and efficient contour-based corner detectors. Pattern Recognit. 2015, 48, 2185–2197. [Google Scholar] [CrossRef]
- Shui, P.L.; Zhang, W.C. Corner detection and classification using anisotropic directional derivative representations. IEEE Trans. Image Process. 2013, 22, 3204–3218. [Google Scholar] [CrossRef] [PubMed]
- Zhang, S.; Yang, D.; Huang, S.; Zhang, X.; Tu, L.; Ren, Z. Robust corner detection using the eigenvector-based angle estimator. J. Vis. Commun. Image Represent. 2017, 45, 181–193. [Google Scholar] [CrossRef]
- Zhang, W.; Sun, C.; Breckon, T.; Alshammari, N. Discrete curvature representations for noise robust image corner detection. IEEE Trans. Image Process. 2019, 28, 4444–4459. [Google Scholar] [CrossRef] [PubMed] [Green Version]
- Zhang, S.; Li, B.; Zhang, Z.; Ma, J.; Li, P.; Wang, H. Robust Corner Finding Based on Multi-Scale K-Cosine Angle Detection. IEEE Access 2020, 8, 66741–66748. [Google Scholar] [CrossRef]
- Zhang, S.; Li, B.; Chen, M.; Sang, Y.; Huang, M. Feature detection using relative distance and multi-scale technique. Alex. Eng. J. 2022, 61, 8585–8593. [Google Scholar] [CrossRef]
- Zhang, S.; Liu, S.; Wang, Q.; Rong, L.; Li, B.; Zheng, Q. An efficient corner detector based on ratio of parallelogram diagonal. J. Eng. 2021, 2021, 762–775. [Google Scholar] [CrossRef]
- Song, J.; Li, H.; Chen, Y.; Chen, Y.; Wei, Y. A Novel Corner Detection Algorithm Applied to Vision-Based Alignment Systems. In Proceedings of the International Conference on Control, Automation and Robotics, Xiamen, China, 8–10 April 2022; pp. 426–430. [Google Scholar] [CrossRef]
- Dan, X.; Gong, Q.; Zhang, M.; Li, T.; Li, G.; Wang, Y. Chessboard Corner Detection Based on EDLines Algorithm. Sensors 2022, 22, 3398. [Google Scholar] [CrossRef] [PubMed]
- Zhang, Y.; Zhong, B.; Sun, X. Corner Detection Based on a Dynamic Measure of Cornerity. In Pacific Rim International Conference on Artificial Intelligence; Springer: Berlin/Heidelberg, Germany, 2022; pp. 631–644. [Google Scholar]
- Wang, J.; Fu, J. Corner Detection Algorithm Based on Edge Contour in Automatic Loading Positioning. Int. Conf. Artif. Life Robot. 2022, 2022, 323–327. [Google Scholar] [CrossRef]
- Zhang, X.; Wang, H.; Hong, M.; Xu, L.; Yang, D.; Lovell, B.C. Robust image corner detection based on scale evolution difference of planar curves. Pattern Recognit. Lett. 2009, 30, 449–455. [Google Scholar] [CrossRef]
- Mokhtarian, F.; Mohanna, F. Performance evaluation of corner detectors using consistency and accuracy measures. Comput. Vis. Image Underst. 2006, 102, 81–94. [Google Scholar] [CrossRef]
- Awrangjeb, M.; Lu, G.; Fraser, C.S.; Ravanbakhsh, M. A fast corner detector based on the chord-to-point distance accumulation technique. In Proceedings of the Digital Image Computing: Techniques and Applications, Melbourne, Australia, 1–3 December 2009; pp. 519–525. [Google Scholar]
- Mokhtarian, F.; Suomela, R. Robust Image Corner Detection through Curvature Scale Space. IEEE Trans. Pattern Anal. Mach. Intell. 1998, 20, 1376–1381. [Google Scholar] [CrossRef]
- Medioni, G.; Yasumoto, Y. Corner detection and curve representation using cubic B-splines. Comput. Vision Graph. Image Process. 1987, 39, 267–278. [Google Scholar] [CrossRef]
- Beus, H.L.; Tiu, S.S. An improved corner detection algorithm based on chain-coded plane curves. Pattern Recognit. 1987, 20, 291–296. [Google Scholar] [CrossRef]
- Huang, J.B.; Singh, A.; Ahuja, N. Single image super-resolution from transformed self-exemplars. In Proceedings of the IEEE Conference on Computer Vision and Pattern Recognition, Boston, MA, USA, 7–12 June 2015; pp. 5197–5206. [Google Scholar]
- Von Gioi, R.G.; Jakubowicz, J.; Morel, J.M.; Randall, G. LSD: A fast line segment detector with a false detection control. IEEE Trans. Pattern Anal. Mach. Intell. 2008, 32, 722–732. [Google Scholar] [CrossRef] [PubMed]
- Paula, I.C.; Medeiros, F.N.; Bezerra, F.N.; Ushizima, D.M. Multiscale corner detection in planar shapes. J. Math. Imaging Vis. 2013, 45, 251–263. [Google Scholar] [CrossRef] [Green Version]
- Ghosh, S.; Chaudhury, K.N. On fast bilateral filtering using Fourier kernels. IEEE Signal Process. Lett. 2016, 23, 570–573. [Google Scholar] [CrossRef] [Green Version]
- Ghosh, S.; Gavaskar, R.G.; Panda, D.; Chaudhury, K.N. Fast scale-adaptive bilateral texture smoothing. IEEE Trans. Circuits Syst. Video Technol. 2019, 30, 2015–2026. [Google Scholar] [CrossRef]
Figure 1.
Benchmark datasets constructed and used to conduct our evaluation, where the ground-truth corners were manually labeled by us and marked with dots. (a) Dataset 1; (b) Dataset 2; (c) Dataset 3.
Figure 1.
Benchmark datasets constructed and used to conduct our evaluation, where the ground-truth corners were manually labeled by us and marked with dots. (a) Dataset 1; (b) Dataset 2; (c) Dataset 3.

Figure 2.
An example for labeling ground truth. (a) The original image. (b) The result of line segment detection. (c) Manually approved line segments. (d) The intersections of of line segments. (e) Corner annotations.
Figure 2.
An example for labeling ground truth. (a) The original image. (b) The result of line segment detection. (c) Manually approved line segments. (d) The intersections of of line segments. (e) Corner annotations.

Figure 3.
A comparison of the existing repeatability metric (REP) and our proposed repeatability metric (RGT). (a) Detection result on the original image. (b) Detection result on noise-corrupted version of the image. (c) The repeatedly detected corners between (a,b) (marked with black circles). (d) The repeatedly detected corner between (b) and ground-truth (marked with black circles).

Figure 4.
Evaluation results with degraded images.

Figure 5.
Comprehensive performance in terms of average running times and F scores of different algorithms on Urban_corner dataset.
Figure 5.
Comprehensive performance in terms of average running times and F scores of different algorithms on Urban_corner dataset.

Figure 6.
Subjective evaluation results for test images. (a) Test image 1. (b) Test image 2.


Table 1.
Evaluation results in terms of precision/recall (first entry) and APR/F score (second entry). The best performance with respect to each used metric achieved on each image dataset is highlighted in boldface.
Table 1.
Evaluation results in terms of precision/recall (first entry) and APR/F score (second entry). The best performance with respect to each used metric achieved on each image dataset is highlighted in boldface.
| Detector | Dataset 1 [4,38] | Dataset 2 [38,39,40] | Dataset 3 (Urban-Corner) |
|---|---|---|---|
| SUSAN [2] | 0.1683/0.0650 0.1167/0.0540 | 0.2363/0.7387 0.4875/0.2493 | 0.0501/0.8943
0.4720/0.0910 |
| Harris-Laplacep [3] | 0.1530/0.4389 0.2959/0.2203 | 0.3912/0.5229 0.4570/0.4303 | 0.9594/0.3333 0.3553/0.2814 |
| MSCP [19] | 0.8224/0.9517 0.8870/0.8661 | 0.8271/0.7450 0.7860/0.7692 | 0.7256/0.5918 0.6587/0.6098 |
| CPDA [22] | 0.9368/0.8198 0.8783/0.8595 | 0.9355/0.6028 0.7691/0.7203 | 0.8154/0.6143 0.7186/0.7008 |
| He & Yung [21] | 0.9132/0.9170 0.9151/0.9104 | 0.8165/0.8302 0.8234/0.8132 | 0.4408/0.7392 0.5900/0.5173 |
| Fast-CPDA [37] | 0.9350/0.8006 0.8678/0.8440 | 0.9403/0.6095 0.7749/0.7292 | 0.8198/0.6183 0.7187/0.7042 |
| DOG [35] | 0.8493/0.8687 0.8590/0.8557 | 0.8665/0.6462 0.7563/0.7279 | 0.7356/0.5809 0.6583/0.6033 |
| GCM [23] | 0.8744/0.9472 0.9108/0.8974 | 0.8405/0.7246 0.7825/0.7633 | 0.7115/0.6091 0.6603/0.6189 |
| ANDD [25] | 0.8181/0.9436 0.8809/0.8667 | 0.6568/0.7304 0.6936/0.6753 | 0.3963/0.5927 0.4945/0.4020 |
| WEAE [26] | 0.8703/0.9694 0.9199/0.9049 | 0.8566/0.7910 0.8238/0.8114 | 0.7234/0.6921 0.7078/0.6516 |
| ASJ [5] | 0.5849/0.7289 0.6569/0.6206 | 0.4207/0.8132 0.6169/0.5392 | 0.6646/0.6411 0.6528/0.6123 |
| SuperPoint [6] | 0.4622/0.7142 0.5882/0.5282 | 0.6526/0.5191 0.5858/0.5704 | 0.4808/0.4086 0.4447/0.3945 |
| New-Curvature [27] | 0.8409/0.9694 0.9052/0.8872 | 0.8806/0.7451 0.8128/0.7987 | 0.8218/0.6614 0.7416/0.6784 |
| SOGGDD [7] | 0.4267/0.9895 0.7081/0.5625 | 0.8403/0.7416 0.7910/0.7776 | 0.5260/0.6305 0.5782/0.5159 |
| MSRJ [28] | 0.9426/0.9006 0.9216/0.9146 | 0.9372/0.7045 0.8208/0.7922 | 0.7428/0.6051 0.6740/0.6300 |
| Zhang & Sun [8] | 0.3196/0.9725 0.6461/0.4385 | 0.8221/0.7161 0.7691/0.7562 | 0.6941/0.5817 0.6379/0.5833 |
| RPD [30] | 0.6762/0.9778 0.8270/0.7760 | 0.7726/0.7866 0.7796/0.7703 | 0.6978/0.6970 0.6974/0.6442 |
| DMC [33] | 0.9587/0.9381 0.9484/0.9447 | 0.8723/0.7904 0.8313/0.8176 | 0.8195/0.7102 0.7649/0.7119 |
Table 2.
Evaluation results in terms of precision/recall (first entry) and APR/F score (second entry) on transformed images. The highest performance with respect to each used metric achieved on each image dataset is highlighted in boldface.
Table 2.
Evaluation results in terms of precision/recall (first entry) and APR/F score (second entry) on transformed images. The highest performance with respect to each used metric achieved on each image dataset is highlighted in boldface.
| Detector | Dataset 1 [4,38] | Dataset 2 [38,39,40] | Dataset 3 (Urban-Corner) |
|---|---|---|---|
| SUSAN [2] | 0.0737/0.7164 0.3950/0.0758 | 0.0021/0.3807 0.1914/0.0042 | 0.0046/0.9999 0.5022/0.0091 |
| Harris-Laplacep [3] | 0.0642/0.2143 0.1393 /0.0951 | 0.1978/0.3578 0.2778/0.2298 | 0.2136/0.4409 0.3273/0.2318 |
| MSCP [19] | 0.8259/0.8921 0.8590/0.8421 | 0.8182/0.6695 0.7439/0.7221 | 0.5751/0.5853 0.5802/0.5229 |
| CPDA [22] | 0.9107/0.7741 0.8424/0.8200 | 0.9156/0.5621 0.7389/0.6856 | 0.7206/0.5405 0.6305/0.5785 |
| He & Yung [21] | 0.8330/0.8831 0.8580/0.8483 | 0.7414/0.7701 0.7558/0.7413 | 0.4040/0.7007 0.5524/0.4728 |
| Fast-CPDA [37] | 0.9058/0.7757 0.8407/0.8193 | 0.9221/0.5692 0.7457/0.6938 | 0.7132/0.5509 0.6321/0.5834 |
| DOG [35] | 0.8631/0.7869 0.8250/0.8114 | 0.8159/0.6187 0.7173/0.6888 | 0.5877/0.5445 0.5661/0.5097 |
| GCM [23] | 0.8375/0.9187 0.8781/0.8614 | 0.8094/0.7030 0.7562/0.7399 | 0.5943/0.5983 0.5963/0.5423 |
| ANDD [25] | 0.7014/0.9104 0.8059/0.7732 | 0.6072/0.6952 0.6512/0.6338 | 0.3295/0.5260 0.4278/0.3469 |
| WEAE [26] | 0.8028/0.9487 0.8758/0.8522 | 0.6093/0.5634 0.5864/0.5734 | 0.5677/0.6487 0.6082/0.5478 |
| ASJ [5] | 0.5199/0.6865 0.6032/0.5590 | 0.3812/0.3989 0.3901/0.3774 | 0.6272/0.5684 0.5978/0.5302 |
| SuperPoint [6] | 0.4748/0.7561 0.6154/0.5465 | 0.6235/0.4959 0.5597/0.5436 | 0.4644/0.4176 0.4410/0.3893 |
| New-Curvature [27] | 0.7774/0.9487 0.8631/0.8361 | 0.8473/0.6823 0.7650/0.7460 | 0.6992/0.5992 0.6492/0.6002 |
| SOGGDD [7] | 0.2533/0.9602 0.6068/0.3743 | 0.6202/0.7384 0.6793/0.6290 | 0.3465/0.6491 0.4978/0.3774 |
| MSRJ [28] | 0.9085/0.8699 0.8892/0.8805 | 0.8496/0.6677 0.7586/0.7331 | 0.5877/0.5809 0.5843/0.5324 |
| Zhang & Sun [8] | 0.2825/0.9611 0.6218/0.3997 | 0.7315/0.7169 0.7242/0.7135 | 0.4844/0.6001 0.5422/0.4774 |
| RPD [30] | 0.6403/0.9500 0.7952/0.7385 | 0.7364/0.7293 0.7429/0.7327 | 0.3833/0.4516 0.4175/0.3774 |
| DMC [33] | 0.9213/0.8771 0.8992/0.8894 | 0.7882/0.7437 0.7659/0.7467 | 0.7006/0.6365 0.6685/0.6225 |
Table 3.
Performance comparison of different corner detectors on three benchmark datasets.
| Detector | RGT | Le (pixels) | ||||
|---|---|---|---|---|---|---|
| Dataset 1 | Dataset 2 | Dataset 3 | Dataset 1 | Dataset 2 | Dataset 3 | |
| [4,38] | [38,39,40] | (Urban-Corner) | [4,38] | [38,39,40] | (Urban-Corner) | |
| SUSAN [2] | 0.0358 | 0.1073 | 0.0363 | 1.0143 | 1.0068 | 1.5159 |
| Harris-Laplace [3] | 0.1199 | 0.2514 | 0.1895 | 0.9407 | 0.9557 | 0.8489 |
| MSCP [19] | 0.7594 | 0.7320 | 0.5175 | 1.0988 | 1.2074 | 1.0168 |
| CPDA [22] | 0.8099 | 0.7739 | 0.6101 | 1.0162 | 1.2186 | 1.0368 |
| He & Yung [21] | 0.7842 | 0.6831 | 0.3469 | 1.0674 | 1.3225 | 1.2750 |
| Fast-CPDA [37] | 0.8201 | 0.7881 | 0.6056 | 1.0097 | 1.1953 | 1.0506 |
| DOG [35] | 0.7770 | 0.7258 | 0.5239 | 1.0558 | 1.1897 | 1.0274 |
| GCM [23] | 0.7825 | 0.6762 | 0.4923 | 1.0754 | 1.2373 | 1.0942 |
| ANDD [25] | 0.6726 | 0.4990 | 0.2478 | 0.9105 | 1.2834 | 1.2466 |
| WEAE [26] | 0.7882 | 0.7333 | 0.5305 | 1.0227 | 1.2235 | 1.0500 |
| ASJ [5] | 0.2553 | 0.4874 | 0.4439 | 0.9509 | 1.2500 | 1.5081 |
| Superpoint [6] | 0.3215 | 0.2085 | 0.4439 | 1.4401 | 1.7831 | 1.5081 |
| New-Curvature [27] | 0.7494 | 0.7558 | 0.6062 | 1.1526 | 1.3047 | 1.1493 |
| SOGGDD [7] | 0.2859 | 0.6526 | 0.3866 | 1.3778 | 1.0890 | 1.1202 |
| MSRJ [28] | 0.8539 | 0.7686 | 0.5315 | 1.0314 | 1.1853 | 1.0148 |
| Zhang & Sun [8] | 0.2783 | 0.2860 | 0.4877 | 1.2642 | 1.3675 | 1.0825 |
| RPD [30] | 0.6606 | 0.6141 | 0.5244 | 1.2496 | 1.0800 | 0.8257 |
| DMC [33] | 0.7726 | 0.7853 | 0.6309 | 0.9105 | 1.4291 | 1.2468 |
Publisher’s Note: MDPI stays neutral with regard to jurisdictional claims in published maps and institutional affiliations. |
© 2022 by the authors. Licensee MDPI, Basel, Switzerland. This article is an open access article distributed under the terms and conditions of the Creative Commons Attribution (CC BY) license (https://creativecommons.org/licenses/by/4.0/).
Share and Cite
MDPI and ACS Style
Zhang, Y.; Zhong, B.; Sun, X. A Benchmark for the Evaluation of Corner Detectors. Appl. Sci. 2022, 12, 11984. https://doi.org/10.3390/app122311984
AMA Style
Zhang Y, Zhong B, Sun X. A Benchmark for the Evaluation of Corner Detectors. Applied Sciences. 2022; 12(23):11984. https://doi.org/10.3390/app122311984
Chicago/Turabian StyleZhang, Yang, Baojiang Zhong, and Xun Sun. 2022. "A Benchmark for the Evaluation of Corner Detectors" Applied Sciences 12, no. 23: 11984. https://doi.org/10.3390/app122311984
Note that from the first issue of 2016, this journal uses article numbers instead of page numbers. See further details here.