1. Introduction
Compact accelerators for Charged Particle Therapy are being investigated and developed to reduce the costs and the dimensions of new facilities [
1,
2]. In parallel, new beam delivery time structures will allow new therapeutic features as faster treatments, different dose rates, fast energy change for range modulation and FLASH irradiations [
3].
The temporal structure of the future beams will drastically change and will provide instantaneous beam currents three orders of magnitude larger than the present beams, which are supplied continuously by common cyclotrons, and in beam spills by synchrotrons. Meanwhile, the emerging and fascinating FLASH therapy [
4,
5] has to cope with similar issues to treat tumors with an average dose rate greater than 40 Gy/s, while the conventional dose rate is around 0.1 Gy/s.
The expected beam delivery conditions feature short pulses (1–10 µs) at a wide range of repetition rates (0.1–1 kHz), and the resulting high instantaneous flux rate (up to 1014 protons/s) is a challenge for online beam monitors worldwide based on parallel-plate gas ionization chambers (ICs).
Due to the increased charge recombination probability, to compensate for the charge losses, online correction methods are needed such as the one proposed by Pardo Montero et al. [
6] to correct the charge measured by arrays of ionization chambers irradiated with time-varying dose rates. In parallel, the detector efficiency can be maximized, reducing as much as possible the gap width as successfully performed by Zou et al. [
7] and by Gomez et al. [
8] to investigate if thin and ultra-thin parallel plate ionization chambers are suitable for the dosimetric characterization of FLASH therapy beams.
In this work, we present a prototype of multi-gap detector (MGD) composed of three parallel-plate ICs in series along the beam, each one featuring a different gap width. The prototype is designed to measure in real time the beam fluence at flux rates characterized by large charge volume recombination, exploiting a correction method described in the following. The correction method is based on the different rates of charge recombination among the three ICs because of their different gaps when exposed to the same ionization density. Indeed, for a given ionization density, deviation from the proportionality of different ICs mainly depends on the gap width and bias voltage. Thus, from the measurement of the charges collected in each of the three gaps, a procedure is described and experimentally verified to evaluate the amount of deviation and determine the total ionization charge through a calibration curve, which is characteristic of the specific measurement conditions.
In order to explore a wide range of ionization densities, this work presents measurements performed with three different accelerators exploiting different particles (protons and carbon ions). In addition, two beam delivery time structures are considered which can be studied using two different analytical models for charge recombination. If the beam is delivered continuously or in spills (macropulses) of a duration much larger than the charge collection time, and the underlying time intervals between micropulses are much shorter than the same quantity, the charge recombination can be described by the continuous beam model (continuous beam). If the delivery is composed of pulses with duration much shorter than the detector charge collection time and with a time interval large enough for all the charge being collected before the arrival of the next pulse, the charge recombination can be described by the pulsed beam model (pulsed beam). Finally, to fill the lack of high-intensity beams, the MGD was operated at low bias voltage to reproduce the rates of charge recombination expected with instantaneous beam currents orders of magnitude larger than the available ones.
2. Materials and Methods
2.1. Multi-Gap Ionization Detector
2.1.1. Detector Assembly
The MGD is similar to other beam monitors developed by the University and INFN of Torino [
9,
10,
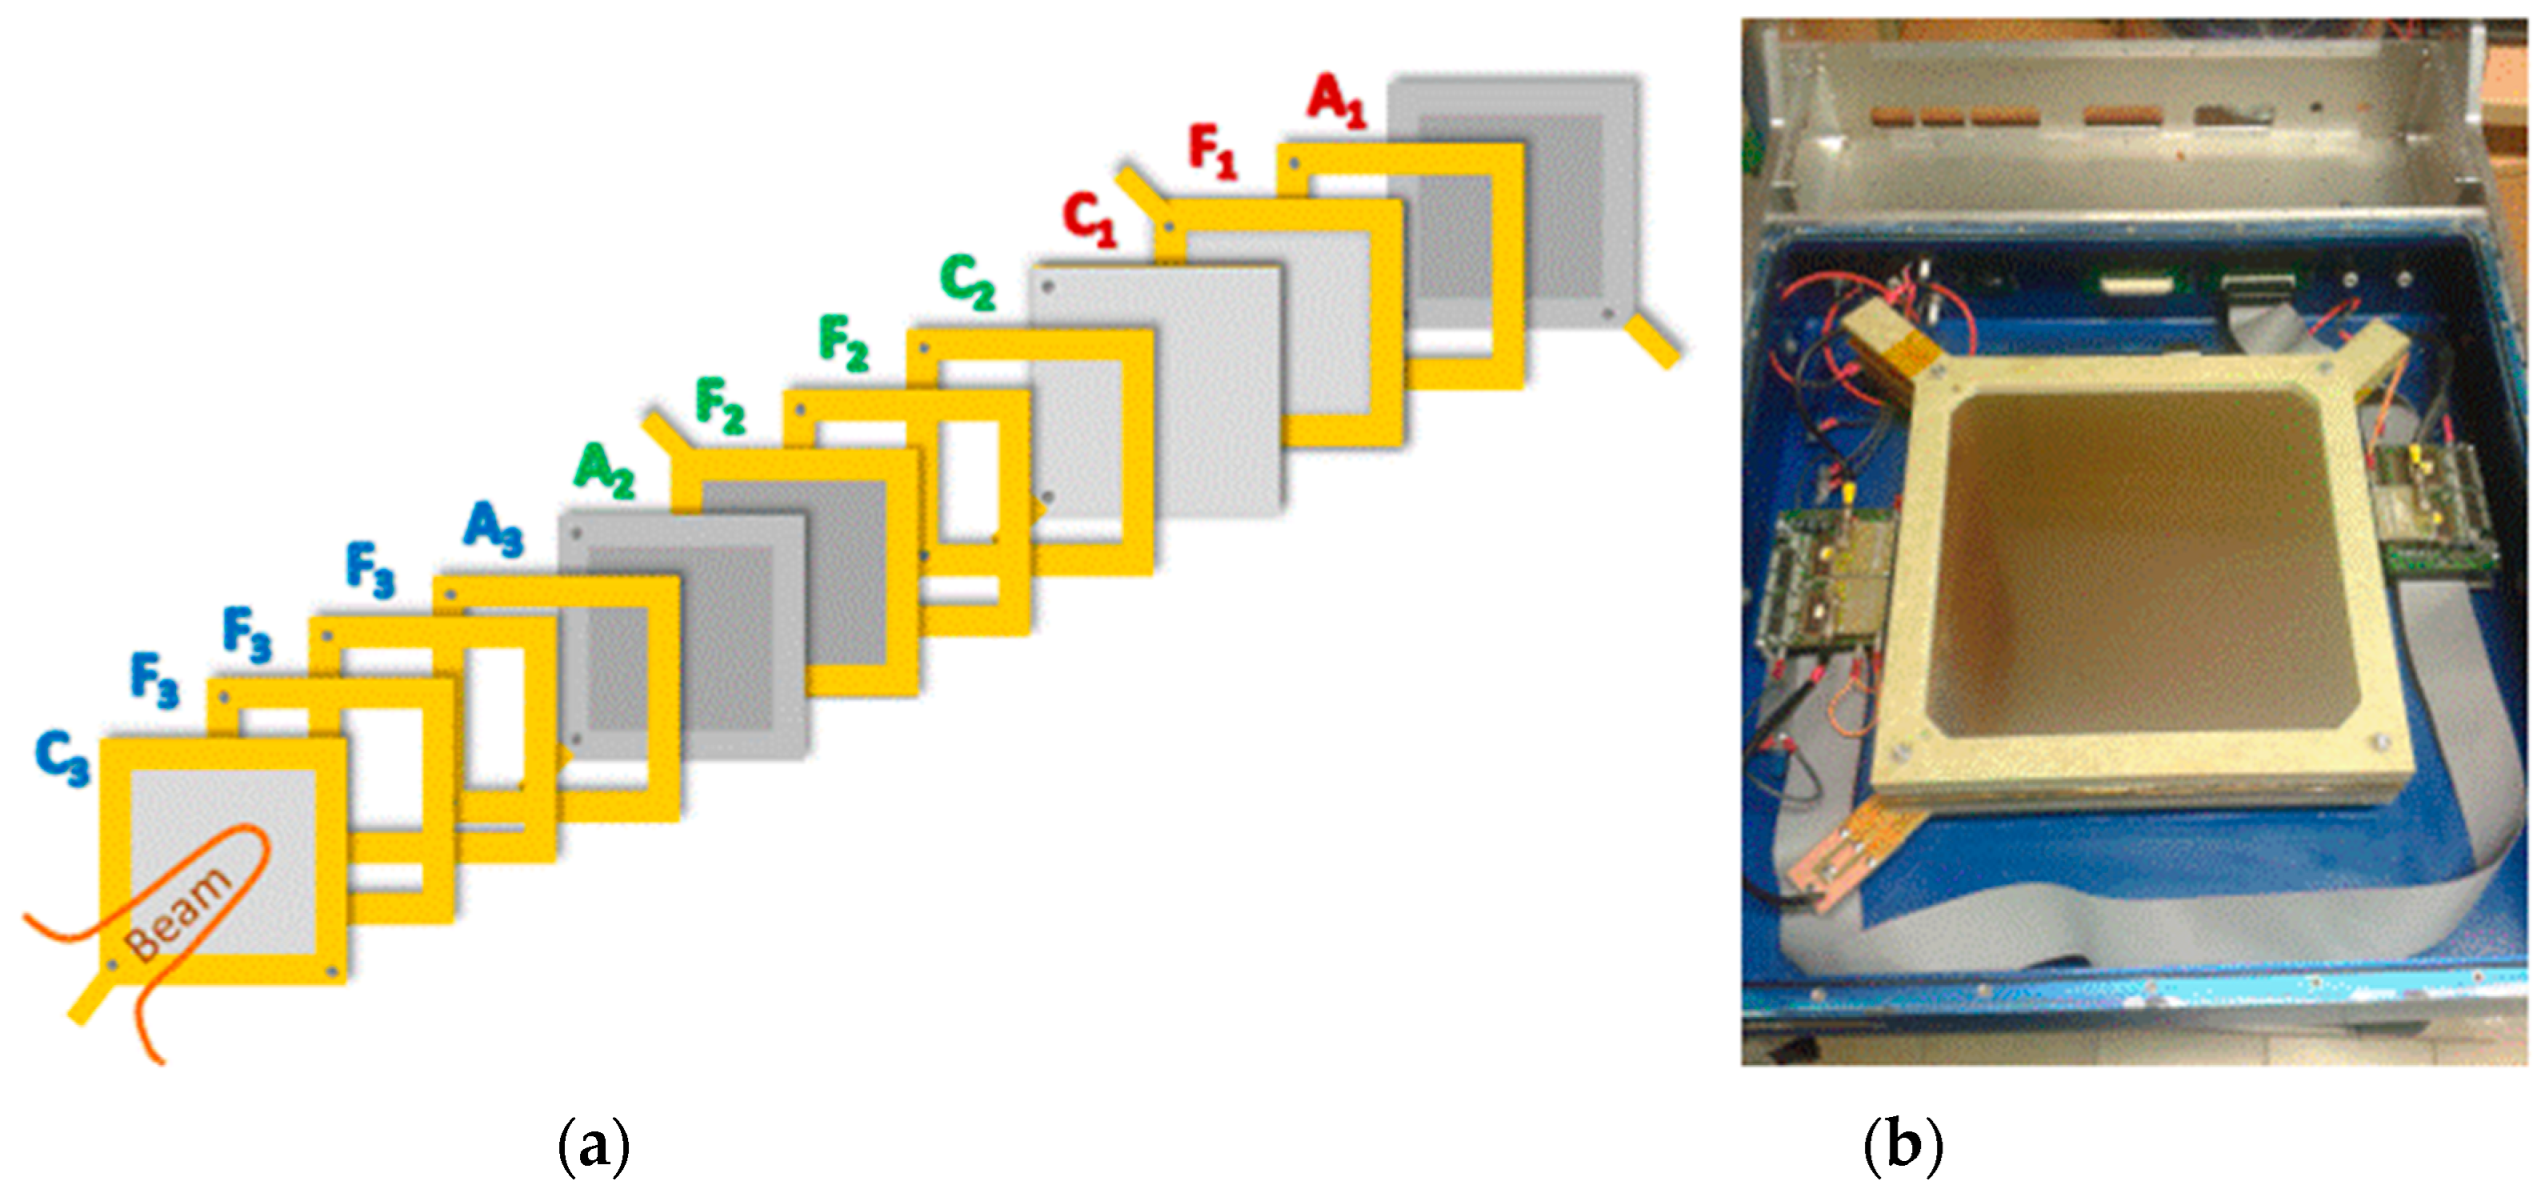
11] and consists of three full area parallel-plate ICs with independent anodes and cathodes separated by gaps of different widths. Cathodes are made by 12 µm thick mylar foils with 1 µm thick aluminum deposition on one side. The anodes consist of a 25 µm kapton foil covered by a 17 µm aluminum layer engraved with standard PCB technique to achieve a full sensitive area of (24 × 24) cm
2 surrounded by a guard ring to collect leakage currents and prevent charge buildup at the edges. Anodes and cathodes were stretched and glued on 5 mm thick fiberglass frames, which are aligned and stacked on top of each other. Additional empty frames are added between the electrodes to provide gas gaps of 5, 10 and 15 mm for chambers IC
1, IC
2 and IC
3, as shown in
Figure 1.
The assembly is housed in a metallic box for EM shielding, as shown in
Figure 1. Two front-end boards, each one including two independent readout channels connected to the anodes of each chamber (one channel is not used), provide three digital output signals which are routed through a flat cable to a connector on the lateral side of the box. The electric field in each chamber is achieved by polarizing the cathodes to a variable and independent negative voltage through an external high voltage unit, while the anodes are kept at the reference voltage of the front-end input (1.65 V). The box is filled with gas, and it is sealed in order to avoid gas leakage. Thus, the overall conditions, temperature and pressure are known during the data taking. For this work, the gas was air at room condition. Beam entrance and exit windows, made of a thin aluminized mylar foil, are added to insulate the chambers with reduced material on the beam path.
2.1.2. Detector Readout and Data Acquisition System
The detector front-end readout is based on the TERA08 chip [
12], which is designed in the CMOS AMS 0.35 μm technology. It integrates 64 identical channels and, in each channel, a conversion from the instantaneous current to a digital pulse frequency is performed where each digital pulse corresponds to a fixed input charge quantum. The converter accepts charges of both polarities and is followed by a 32-bit counter with up/down counting capability to measure both negative and positive currents.
The maximum conversion frequency is 20 MHz, and the charge quantum is set to 200 fC, leading to saturation at the maximum input current of ±4 µA per channel. In order to overcome this limit, the anode current of each chamber is split evenly into the 64 channels of the chip, and all the counts of the channels are added to extend up to ±256 μA the input current range while preserving a linearity within ±1% [
13].
The data acquisition system is based on the National Instruments PXIe platform equipped with a system controller (NI PXIe-8115) and the FlexRIO FPGA board coupled with a high-speed digital I/O module (NI 6581). A LabVIEW program was developed to read out the number of counts of the three ICs through the FPGA board interfaced with three TERA08 chips. Hereafter, the collected charge is referred to as the number of counts, and each count corresponds to a charge quantum of 200 fC.
2.2. Particle Beams and Experimental Setups
In order to explore a wide range of MGD operating conditions, this work presents measurements performed with two particle beams and different beam delivery systems and time structures. The conditions are summarized in
Table 1.
The synchrotron of the Centro Nazionale di Adroterapia Oncologica (CNAO Pavia, Italy) [
14] can deliver both protons and carbon ions at clinical energies. In order to test the effect of different charge recombination due to different particle type, all the measurements were made with carbon ions. The CNAO beam time structure features a spill-based particle delivery, but on average, the fluence within each spill, 1 s long, is assumed to be continuous. To maximize the probability of charge recombination, the lowest energy of 115 MeV/u was selected, and the beam dimension was squeezed to ~5 mm of FWHM [
15], and the MGD was placed close to the nozzle, thus reducing the particle spread due to the multiple scattering in air. Three beam intensities were used, and the MGD bias voltage was changed in the range 13–400 V for each one. A fix number of carbon ions (10
8) was planned for each test, and multiple measurements in identical conditions were performed for the error evaluation.
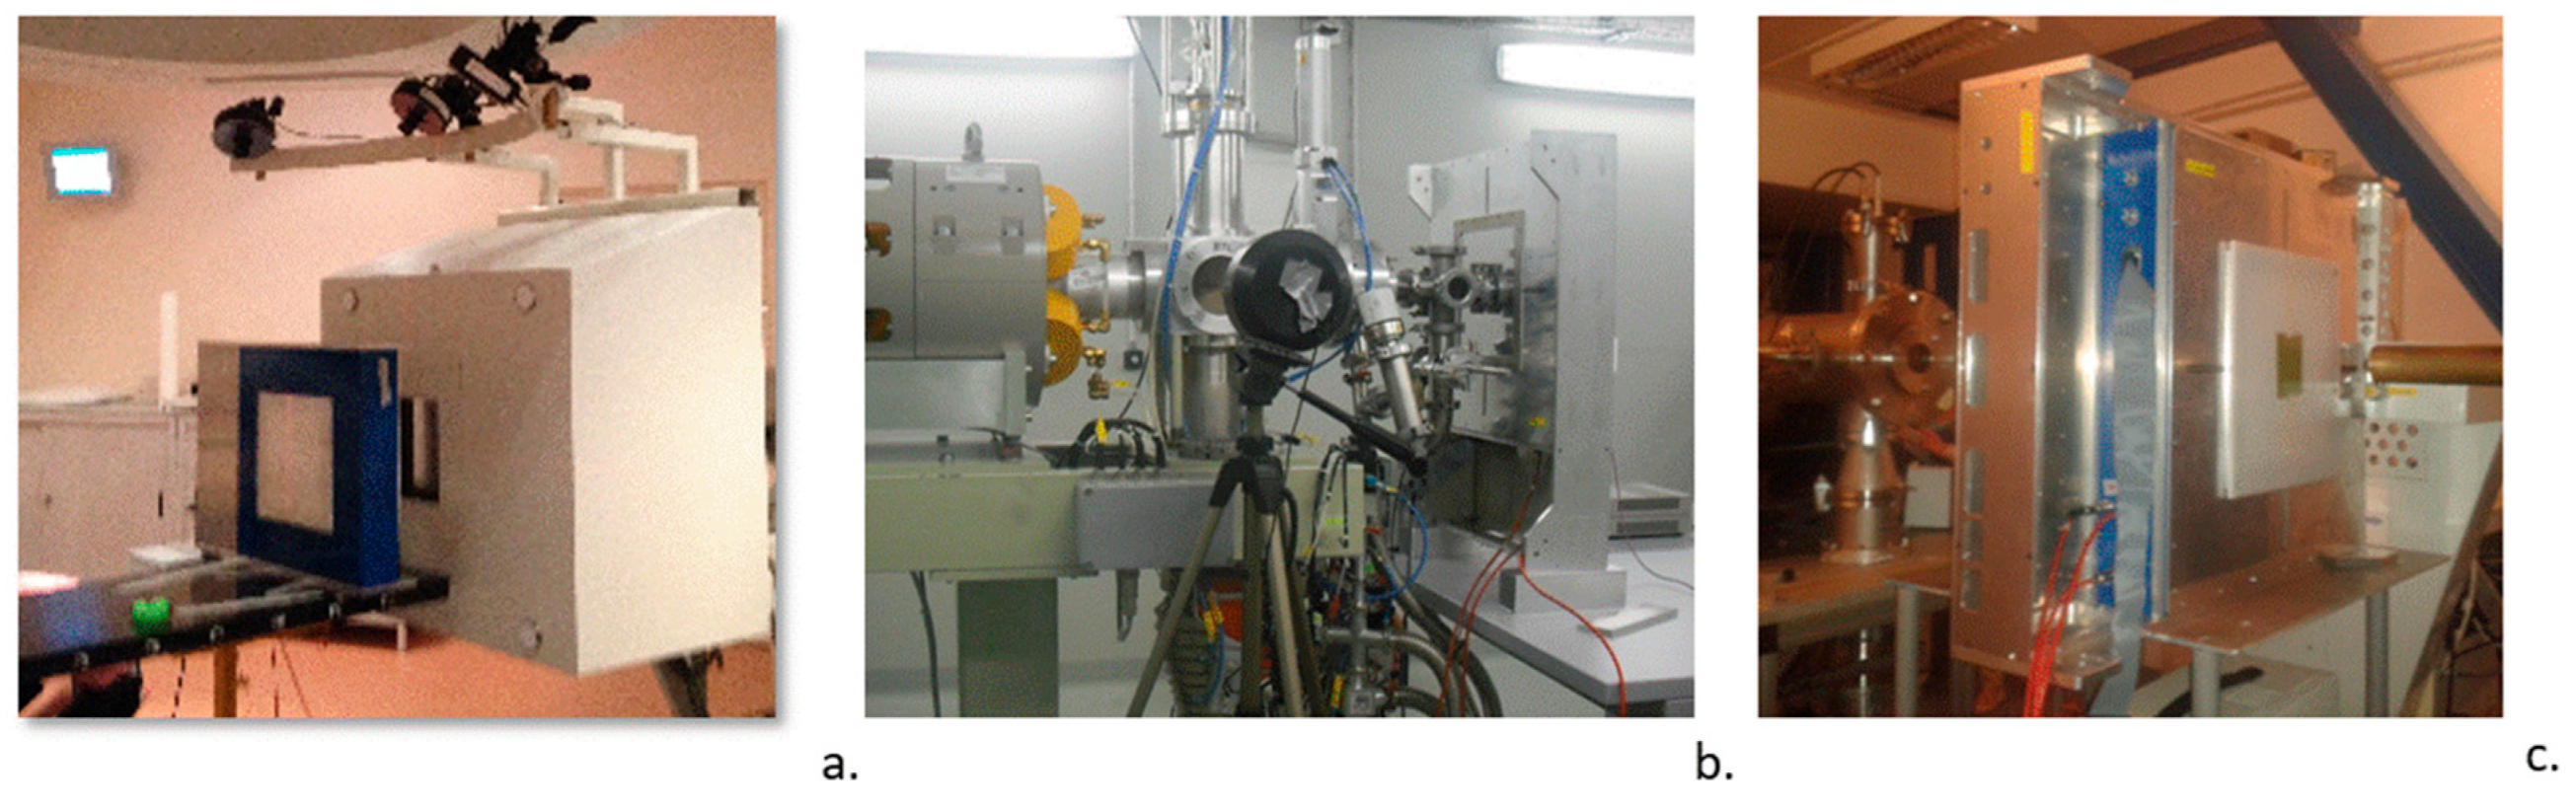
Figure 2a shows the MGD in the CNAO treatment room, which was placed close to the nozzle on the couch.
The commercial IBA Cyclone 18/18 cyclotron in operation at Bern University Hospital (Inselspital) in Switzerland [
16] provides proton beams at the energy of 18 MeV, with a maximum extracted current of 150 µA and with a continuous delivery time structure. Lower beam energies can be obtained by means of passive absorbers. Eight out-ports are available in this facility, two of which are used for research purposes. The former is equipped with a solid target station for non-conventional radioisotope production, and the latter one is connected to a Beam Transfer Line (BTL) ending in a separate bunker for multidisciplinary research activities. Thanks to a specific method to obtain stable beams down to currents in the pA range [
17] together with steering and focusing magnets used to focus the beam spot down to a few mm
2, we tested the detector in the research beam line with three currents (50, 350 and 550 pA) and 20 mm FWHM beam size. For the measurements described in this paper, the beam was extracted into air at 15 MeV through a titanium window, with a set-up similar to the one used for radiation hardness studies [
18]. The position and the beam were measured on-line by means of a UniBEaM detector [
19] and a two-dimensional profiler based on doped silica fibers passed through the beam. For each beam current, the MGD bias voltage was changed in the range 13–400 V, and a beam stopper behind the detector was placed to measure the beam current through a Keithley 616 digital electrometer.
Figure 2b shows the measurement setup at the end of the BTL in the research bunker of the Bern cyclotron laboratory.
The Superconducting Cyclotron K800 at the Laboratori Nazionale del Sud (Catania, Italy) of the Italian National Institute of Nuclear Physics (INFN) accelerates ion beams from protons to uranium at energies of up to 80 MeV/u. The MGD was tested in the CATANA beam line used for ocular protontherapy [
20]. The cyclotron was set to deliver a proton beam of 62 MeV, and starting from an almost continuous beam with a typical pulse structure of an isochronous cyclotron with a frequency rate of 1 Hz, we obtained a pulsed beam through a customized chopper system before the beam injection. With this system, it was possible to obtain macropulses of duration ranging between 10 and 500 µs. In order to obtain the maximum intensity at the isocenter, the modulator wheel and the range shifter were taken out from the beam line, thus obtaining a 4 cm beam size at the entrance of the detector. The pulse width was 500 µs, and the MGD bias voltage was varied in the range of 3–2100 V. Reference measurements for the pulse to pulse beam variation were performed using a Faraday Cup, which was optimized to collect and count the charged particles entering in the detector with high charge collection efficiency and reduced uncertainties due to the secondary electron emission [
21]. The Faraday cup, originally designed for the dosimetry of laser-driven proton beams, also includes an electrode for secondary electron suppression and operates in vacuum [
22].
Figure 2c shows the MGD on the CATANA beam line, which is placed between the collimator and the Faraday cup.
2.3. Charge Recombination
Ion recombination is a complex phenomenon that depends on the detector characteristics and on several properties of the beam: Linear energy transfer (LET), particle type, mode of radiation (continuous, pulsed or pulsed-swept), and fluence rate [
23,
24,
25].
Different theoretical models were used to describe the collection efficiency in parallel-plate ICs for the two main types of recombination: the initial and the volume recombination. The initial one occurs between ions created in the same ionization track; it is independent of the ionization current but depends on the ionization density within the track. The second one is the volume recombination which takes place between ions originating from different ionization tracks and depends on the ionization current; thus, it depends on the beam fluence rate. Several theories were developed to describe the ion collection efficiency as a function of the applied voltage for a constant ionization rate [
26,
27,
28,
29,
30].
For the volume recombination, in the limit of beam pulses of duration much larger than the charge collection time (continuous beams), Boag and Wilson [
29] derived the following relation for the detector collection efficiency (
f), which is defined as the ratio of the charge collected at the electrodes (
Q′) and the ionization charge generated in the gas (
Q) in the same time interval:
with
where the constant
m is characteristic of the gas because
k1 and
k2 are the mobilities of positive and negative ions, α is a gas-specific recombination coefficient, and e is the electric elementary charge. Additionally,
depends on the electrode gap width
d, the detector bias voltage
V and the rate of volumetric ionization charge produced in the gas
q (C·cm
−3·s
−1). The quantity
S =
m2q thus depends linearly on the rate of volumetric ionization.
For beam pulse duration much smaller than the charge collection time and for an interval between pulses larger than the same quantity, Boag [
30] derived the following relation for the detector efficiency (
f):
where
µ is a gas-specific constant for pulsed dose rate, involving the recombination coefficient and the mobilities, and r is the charge ionization density (C·cm
−3) produced by each pulse. Both these models include a dependence of the efficiency on the ratio
V/
d2, which was multiplied by a parameter depending either on the rate of ionization (
S1/2) for continuous beams or on the total ionization per pulse (
µr) for pulsed beams. It should be observed that these theories refer to a uniform irradiation field covering the sensitive area of the detector, leading to a uniform ionization rate in the gas volume. For a beam of a cross-section much smaller than the sensitive area, as in the present studies, the ionization is highly non uniform in the gas volume; the ionization parameters of the two models are thus interpreted as effective parameters of a hypothetical uniform beam leading to the same measured collection efficiency.
In order to test the validity of the two models in the recombination regime, the rate of ionization can be varied by varying the beam fluence rate or, equivalently, the IC bias voltage if the available accelerator does not support the former option.
2.4. Recombination Correction Method for Multi-Gap Detector
This work is based on beams whose characteristics lead to a large rate of recombination so that the efficiency f is unknown and less than 1 for all the chambers. The method proposed allows determining the efficiency of one of the chambers, which is chosen as a reference (we will use IC1 which features, among the three chambers, the smallest gap d and the largest collection efficiency f) from the simultaneous measurement of the charges collected in all three ICs and exploiting a previously determined calibration curve.
The charge collected by each ionization chamber (Q′) is described by Equation (4),
where the expected ionization charge
Q depends on the beam current (
Ibeam =
eNp/Δ
t), on the ion stopping power (
S), on the gas density (
), on the average energy required to create an electron-ion pair (
W) and on the gap width d.
Using Equation (4) for two chambers IC1 and ICi (i = 2, 3) with corresponding gaps and , exposed to the same beam current Ibeam, one can derive the efficiency of ICi relative to IC1 ( by only measuring the collected charges and :
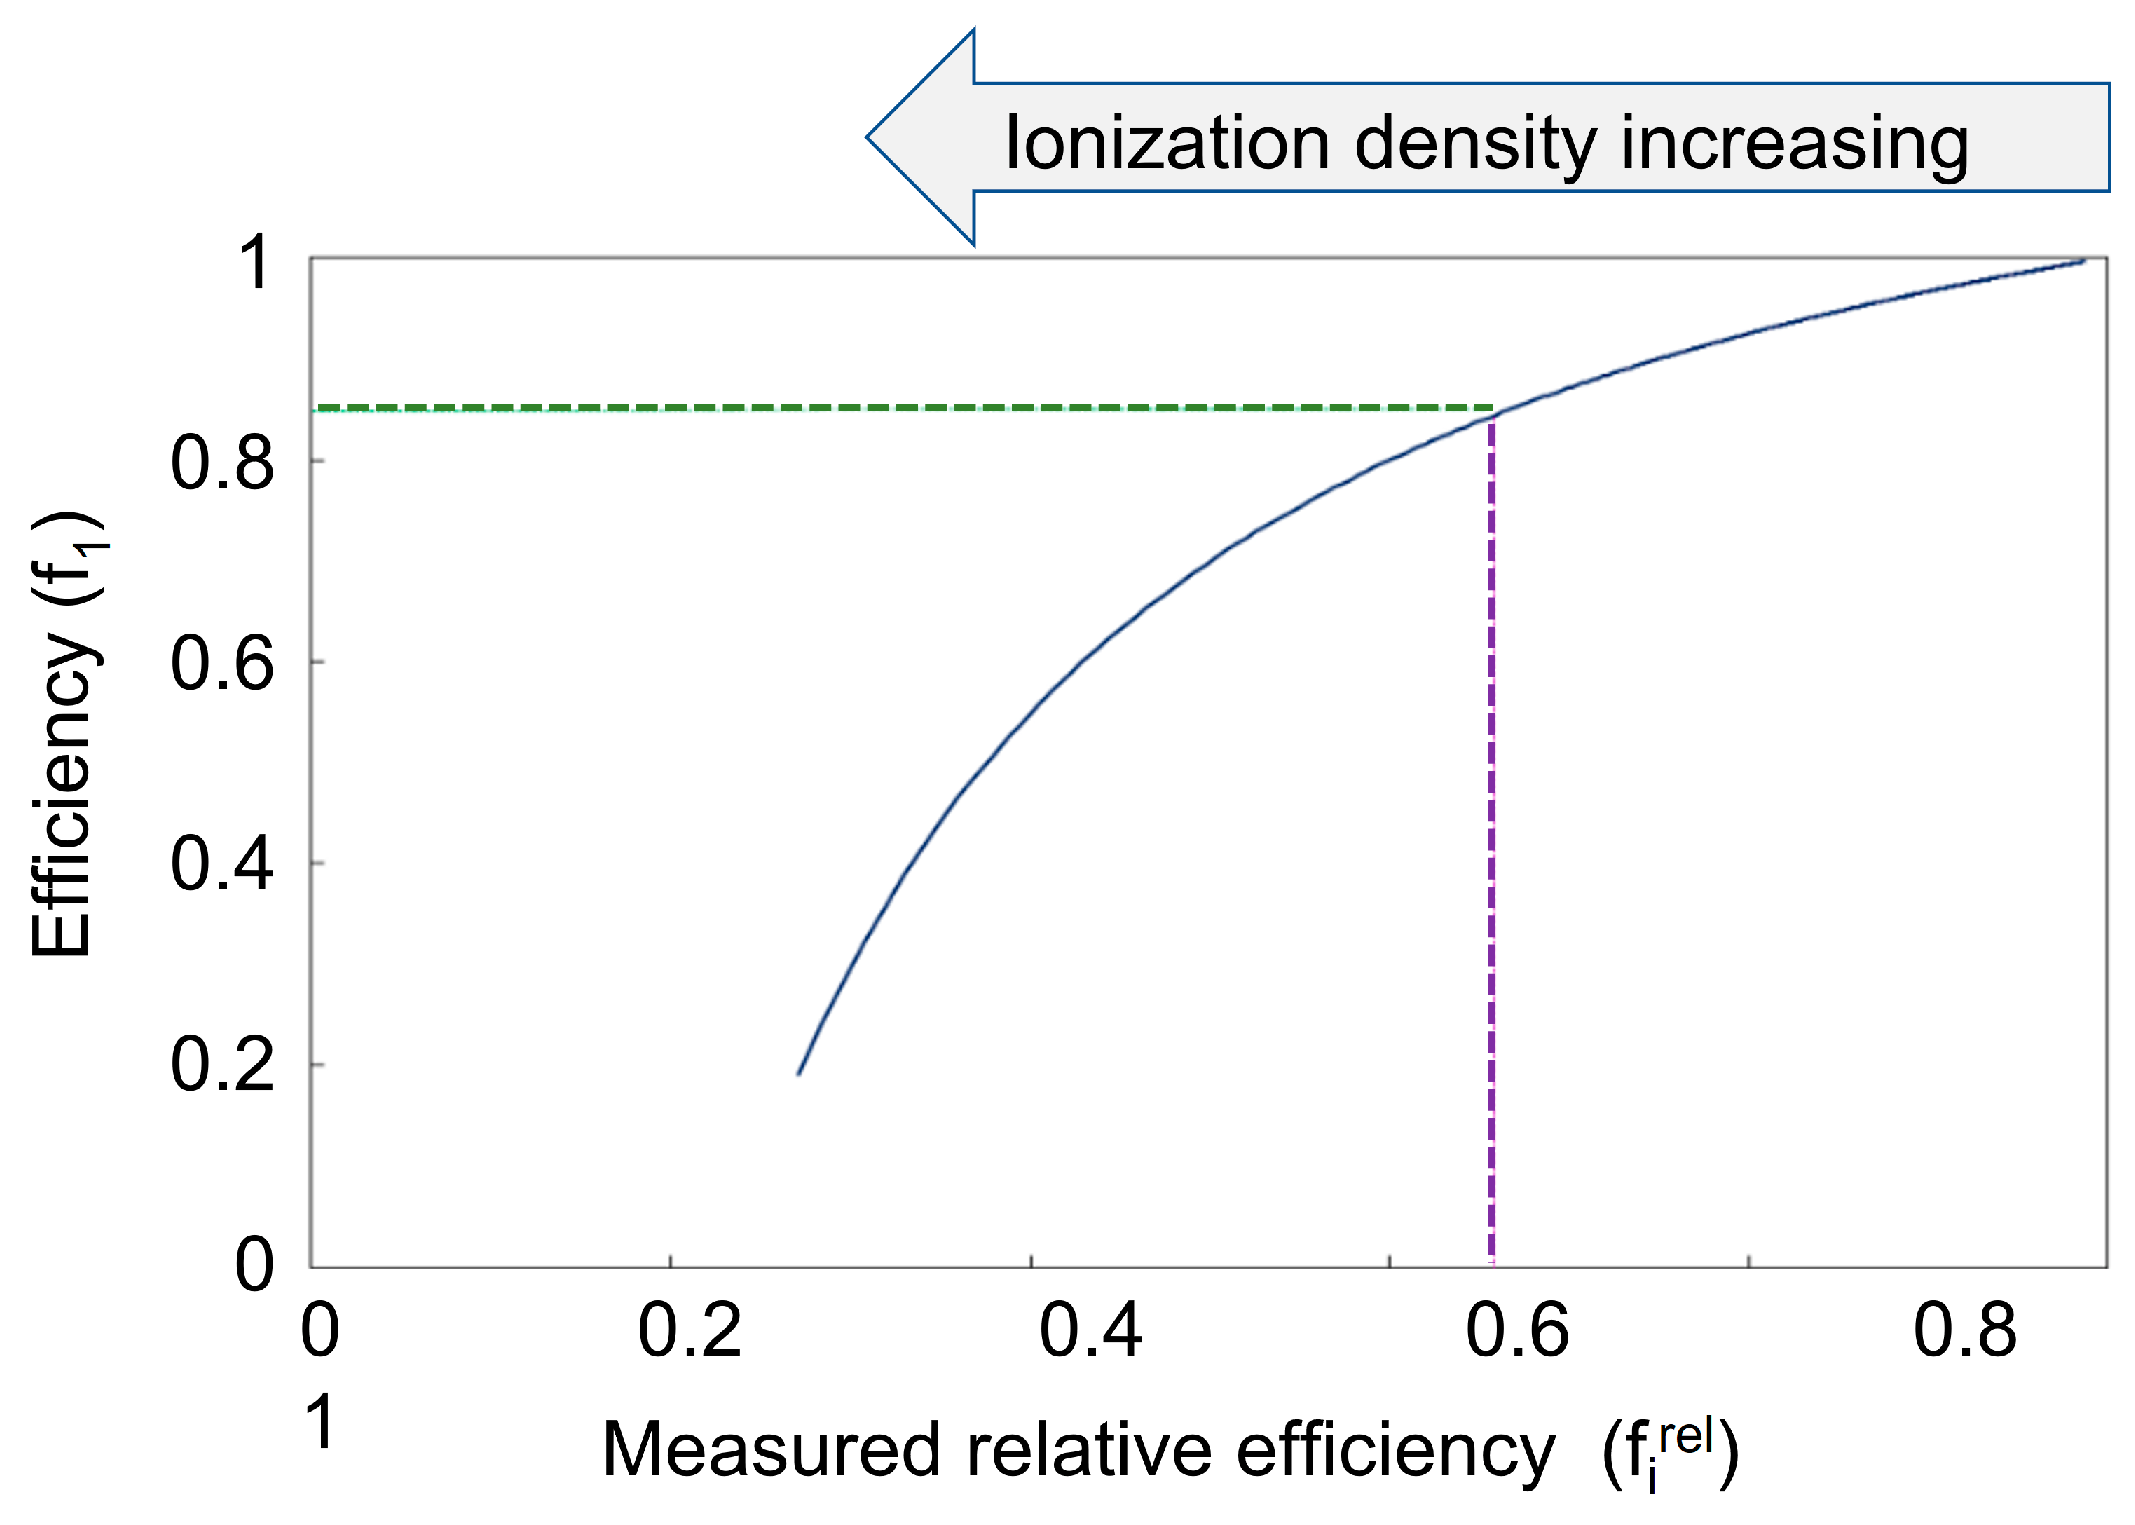
If the assumption is made that the rate of ionization is the same in the two chambers, the measured value of
will be 1 at low beam currents (no recombination) and will decrease monotonically with the increase in the ionization (
S1/2 or
µr) or equivalently with the decrease in the ratio
V/
d2. For a given beam, a unique relation between the efficiency of the reference chamber f
1 and
is therefore expected and needs to be determined experimentally to provide the desired correction (
Figure 3).
In order to determine the calibration curve, measurements with the MGD need to be performed by varying beam intensities and detector bias voltages to change the rate of recombination. The corresponding collection efficiencies can either be determined using a reference detector (e.g., a Faraday cup) or, as in the present study, using the analytical models described in the previous section to fit the data, as explained in the following.
For a given beam current, the counts of the three ICs corresponding to the same number of ions were acquired varying the bias voltage and were plotted as a function of V/d2. To improve the precision, the average over repeated measurements at the same voltage was used, and the uncertainty was evaluated as σ/√N.
A common fit was performed to the counts, normalized by the electrode gap width d, using the following equation
where the Boag-Wilson [
29] and Boag [
30] theories (formulae 1 and 2) were used to model the collection efficiency f for continuous and pulsed beams, respectively. The fit, performed using a χ2 minimization, allows to determine, together with the corresponding uncertainty, the ionization rate parameter (
S1/2 or µr depending on the formula used), the expected counts at saturation (
Csat) normalized to a unit gap width and a constant term (
K0V) to account for the observed counts at
V = 0. Finally, the efficiency
f1 was determined as the ratio between the counts collected by IC1 and those expected at saturation (
Csat·
d1), as determined from the fit, and the standard error propagation was used to determine the uncertainty.
2.5. Experimental Measurements
For each accelerator facility, the beam tests consisted of delivering a constant number of particles at fixed energies with different beam intensities to induce different rates of volumetric ionization. In order to validate the method within a useful range of operation, thus covering a wide range of charge recombination rates, we also took measurements while changing the detector bias voltage. To compare the efficiency among the three chambers, the integrated counts were normalized to the detector gap width.
As described in
Section 2.4, the expected charge in each chamber (counts per unit of thickness at infinite voltage, C
sat) is estimated with a fit to the counts per unit of thickness (counts/d) as a function of V/d
2 using Equation (6). C
sat is then used to compute the efficiency (fi) and the relative efficiencies (f
rel =
d
1/
d
j), as described in
Figure 3, which are needed to calculate the two calibration curves (f
1(
) and f
1(
)) with fit.
The latter can use online computing f1 for each and provided by the MGD readout. The average between the two efficiencies available from the two calibration curves can be used to evaluate Q1.
3. Results
The results of MGD tests performed with the charged particle beams listed in
Table 1 and described in
Section 2.2 are shown in the following subsections.
3.1. MGD Characterization with Carbon Ions at CNAO
For each test, a total number of 10
8 ions were delivered, and during the beam delivery, the total number of counts measured by the three chambers were stored every 100 ms.
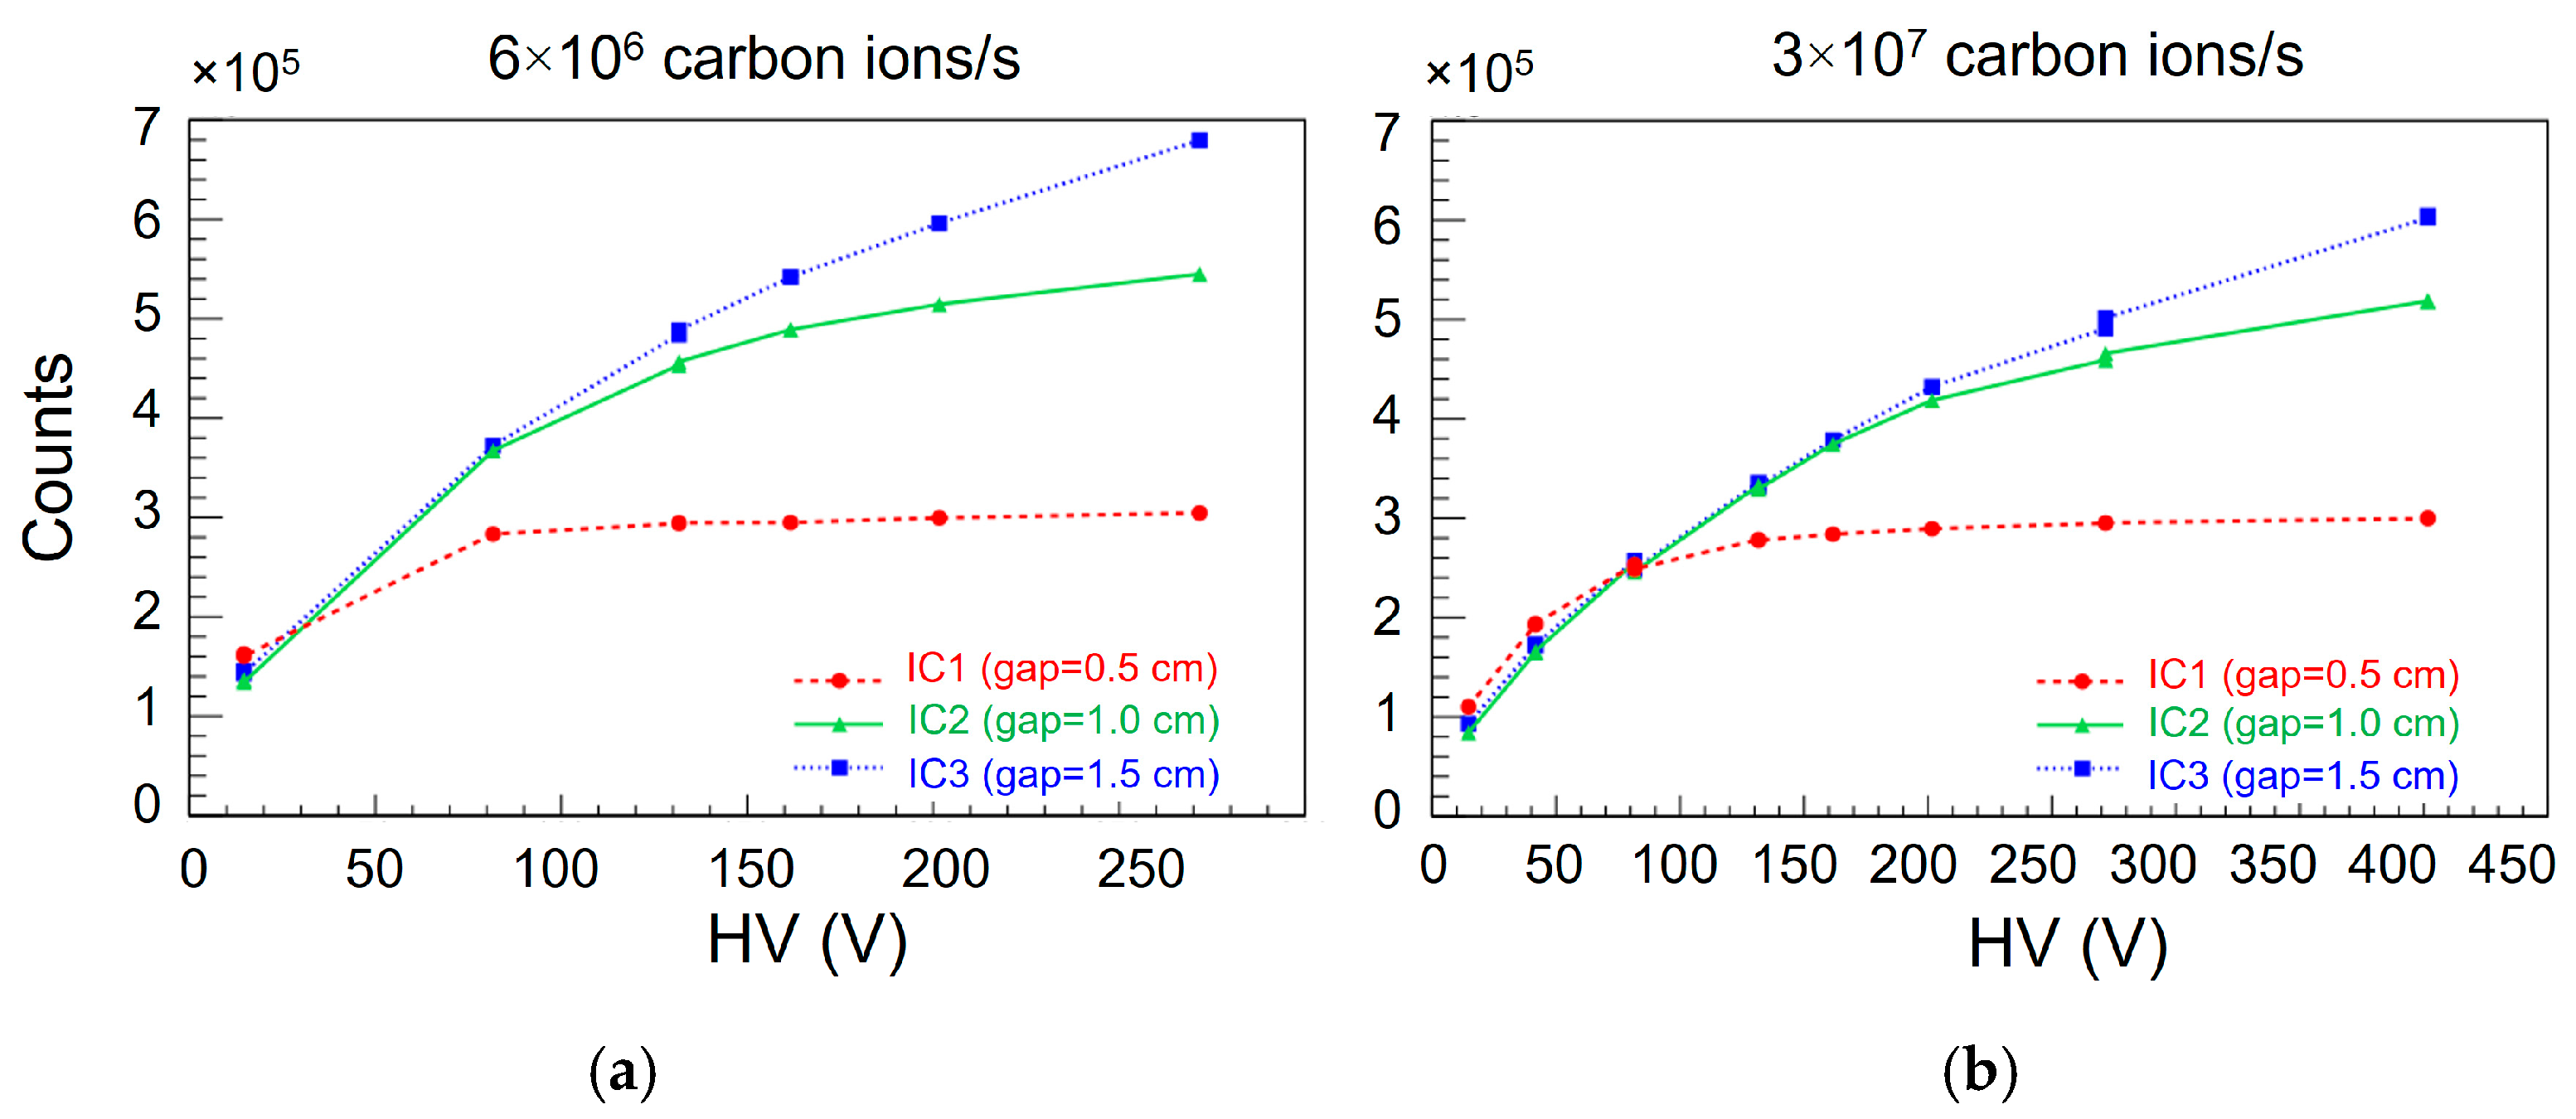
Figure 4 shows the counts measured by the three chambers with the bias voltage ranging from 13 to 400 V and at two different beam intensities 0.6 × 10
7, and 3 × 10
7 carbon ions/s. As expected, at lower bias voltage, the counts of the three chambers are overlapped, while the effect of different gaps appears at larger voltage due to the larger charge collection efficiencies. Indeed, chamber 1 reaches the saturation at 120 V for all the beam intensities, and its measurement could be used as a reference ionization charge to calculate the relative efficiencies.
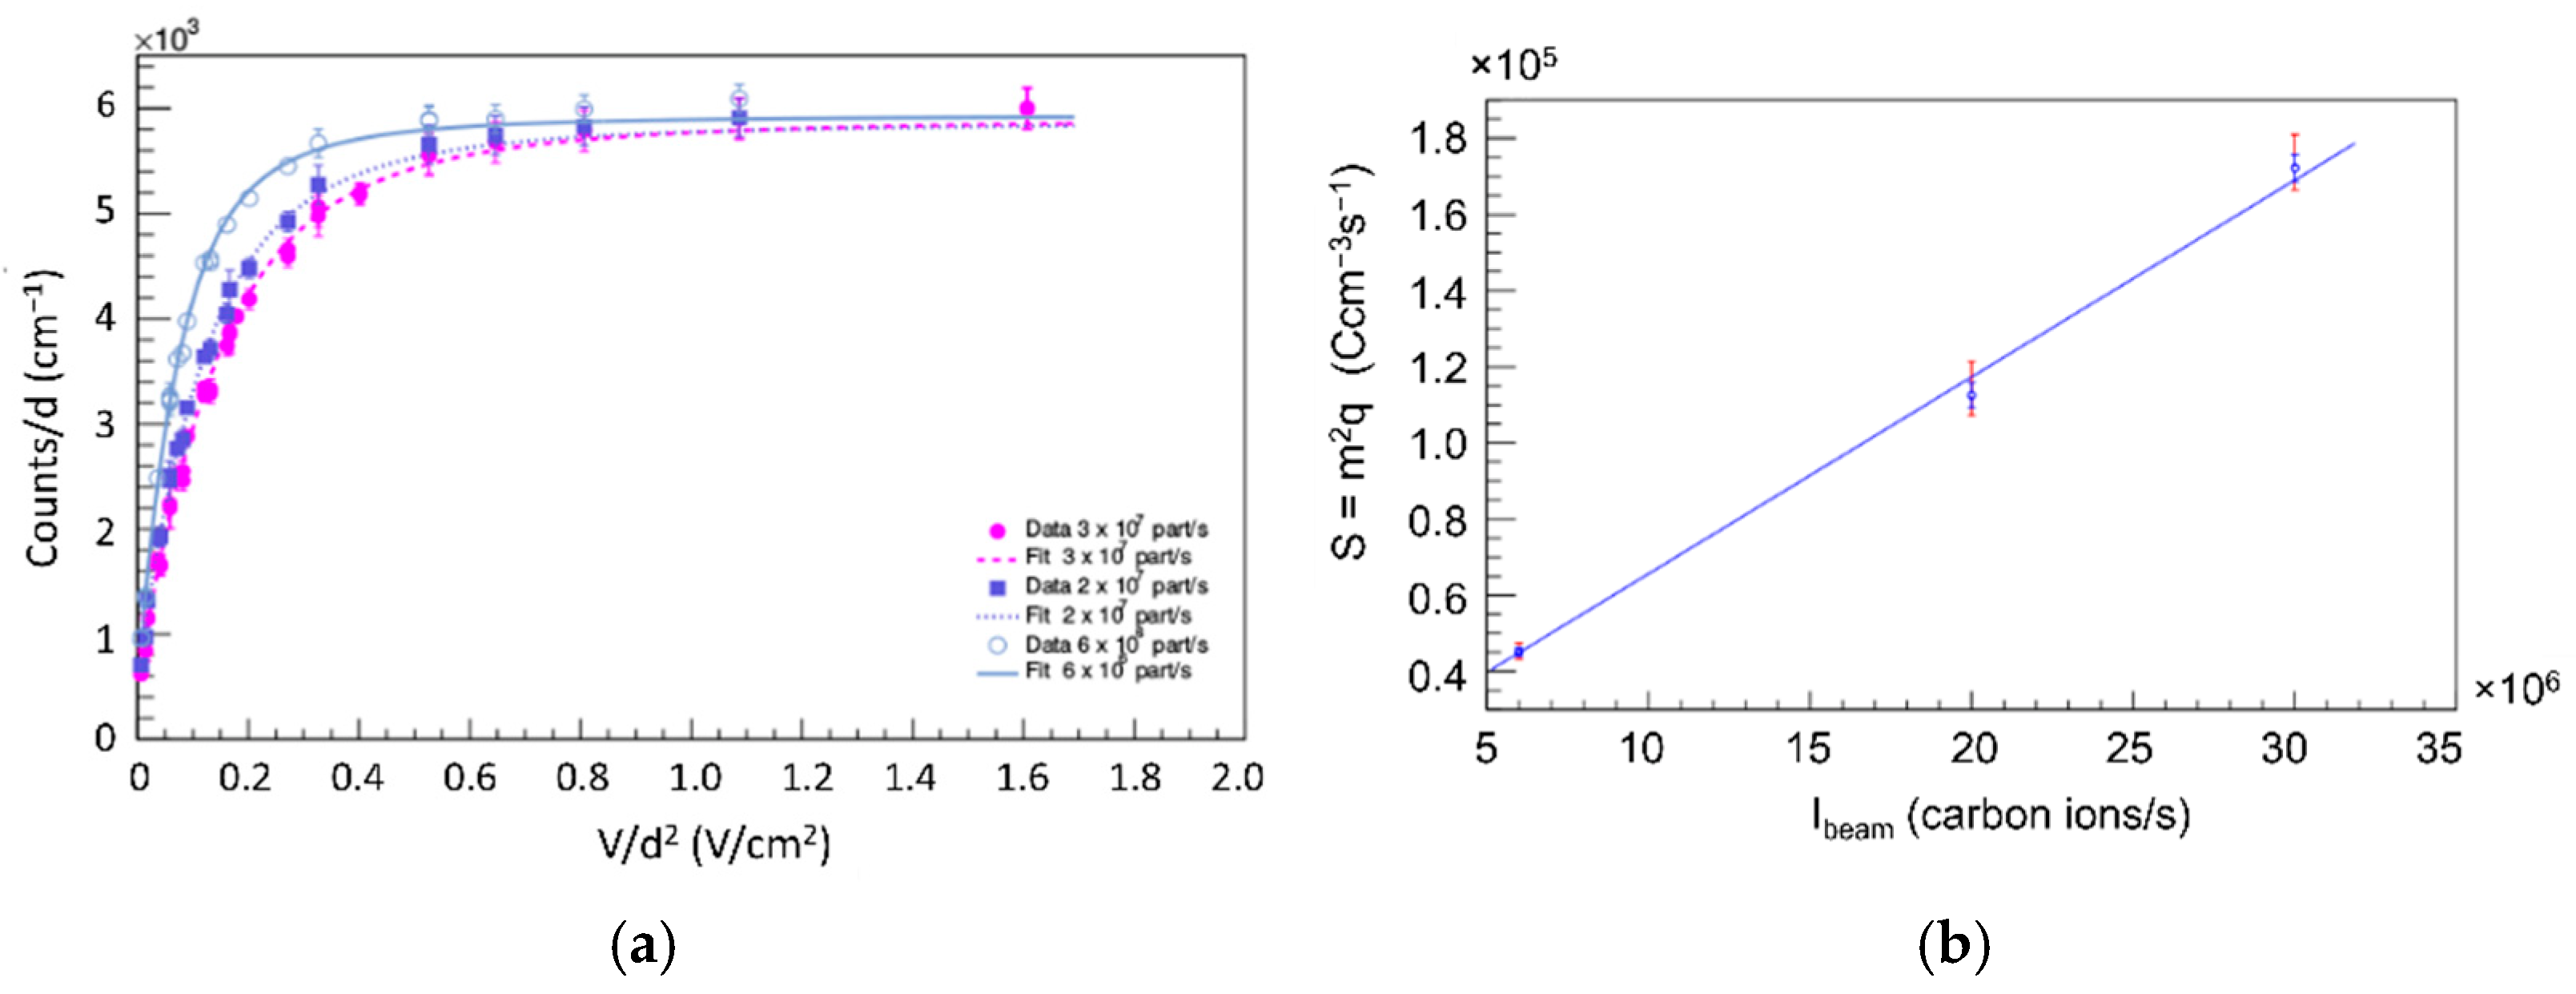
Figure 5a shows the counts normalized to the detector gap as a function of V/d
2. Data from all the chambers and for the three intensities, 0.6 × 10
7, 2 × 10
7 and 3 × 10
7 carbon ions/s, are reported. The error bars were computed from multiple measurements in identical conditions. The measurements from different chambers reach the saturation at around 800 V/cm
2. We observe that the counts per unit of thickness depend on the beam intensity and that, at a given intensity, they follow the same curve for the three chambers. Therefore, the fits with Equation (5), using the Boag–Wilson function for continuous beam (Equation (1)) for
f, were evaluated and are shown in the same figure. The rate
S of volumetric ionization, as resulting from fits, shows a good linearity as a function of the measured beam current as reported in
Figure 5b.
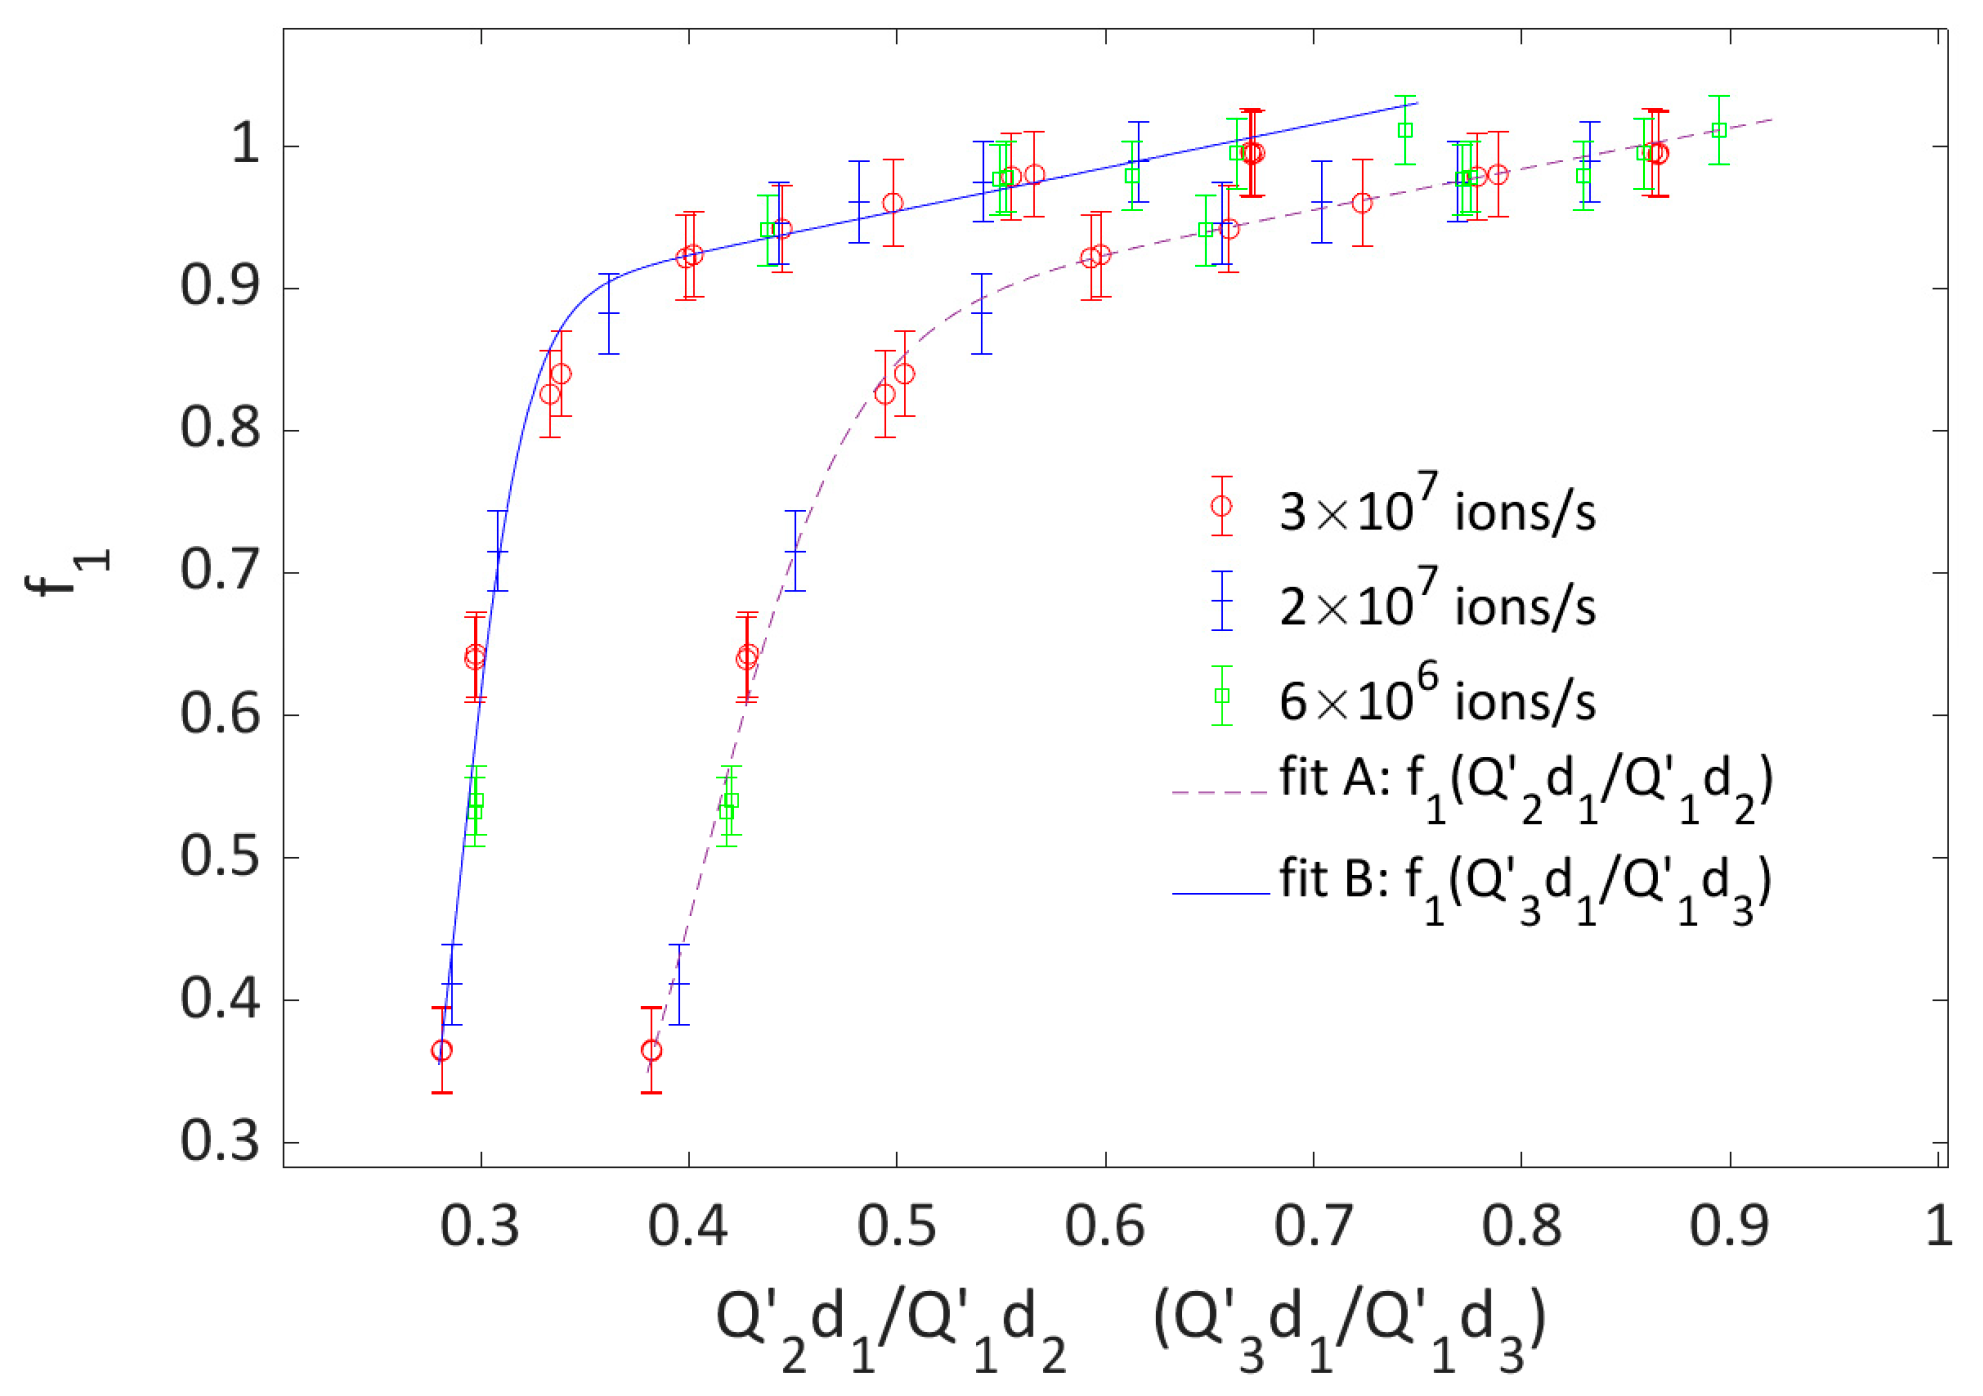
Two calibration curves for chamber 1 are obtained, one from the comparison with chamber 2 (relative efficiency f
1/f
2 =
d
2/
d
1) and the other with chamber 3 (f
1/f
3 =
d
3d
1), as shown in
Figure 6. The efficiencies f
i are computed as the ratio between the measured counts per unit thickness (Counts/d) and C
sat.
The calibration curve is determined with a fit to the
Figure 6 data with a multiple parameters function where x corresponds to the relative measured charge in units of thickness (
d
1/
d
n) and
a,
b,
c, and
d are ad hoc parameters to describe the data points:
Fit parameters are summarized in
Table 2, together with those obtained at the other three accelerator facilities.
We remark that from the two curves, one obtains consistent results. As an example for a bias voltage of 160 V and a beam intensity of 3 × 10⁷ ions/s, we measured d2/d1 = 0.6594 when IC1 is compared to IC2, and Q3d1/Q1d3 = 0.4445 for IC1 compared to IC3.
Inserting these values in Equation (6) and using the parameters as from the fits, we extract f1 = 0.9466 from fit A and f1 = 0.9428 from fit B. The total deviation between the two corrected IC1 readouts is less than 0.5%.
3.2. MGD Characterization with Continuous Proton Beams at Bern Cyclotron Laboratory
At the Bern cyclotron laboratory, the MGD was irradiated with the beam parameters listed in
Table 1. The corresponding charge measured by the beam stopper was used to compensate for small fluctuations in the beam intensity.
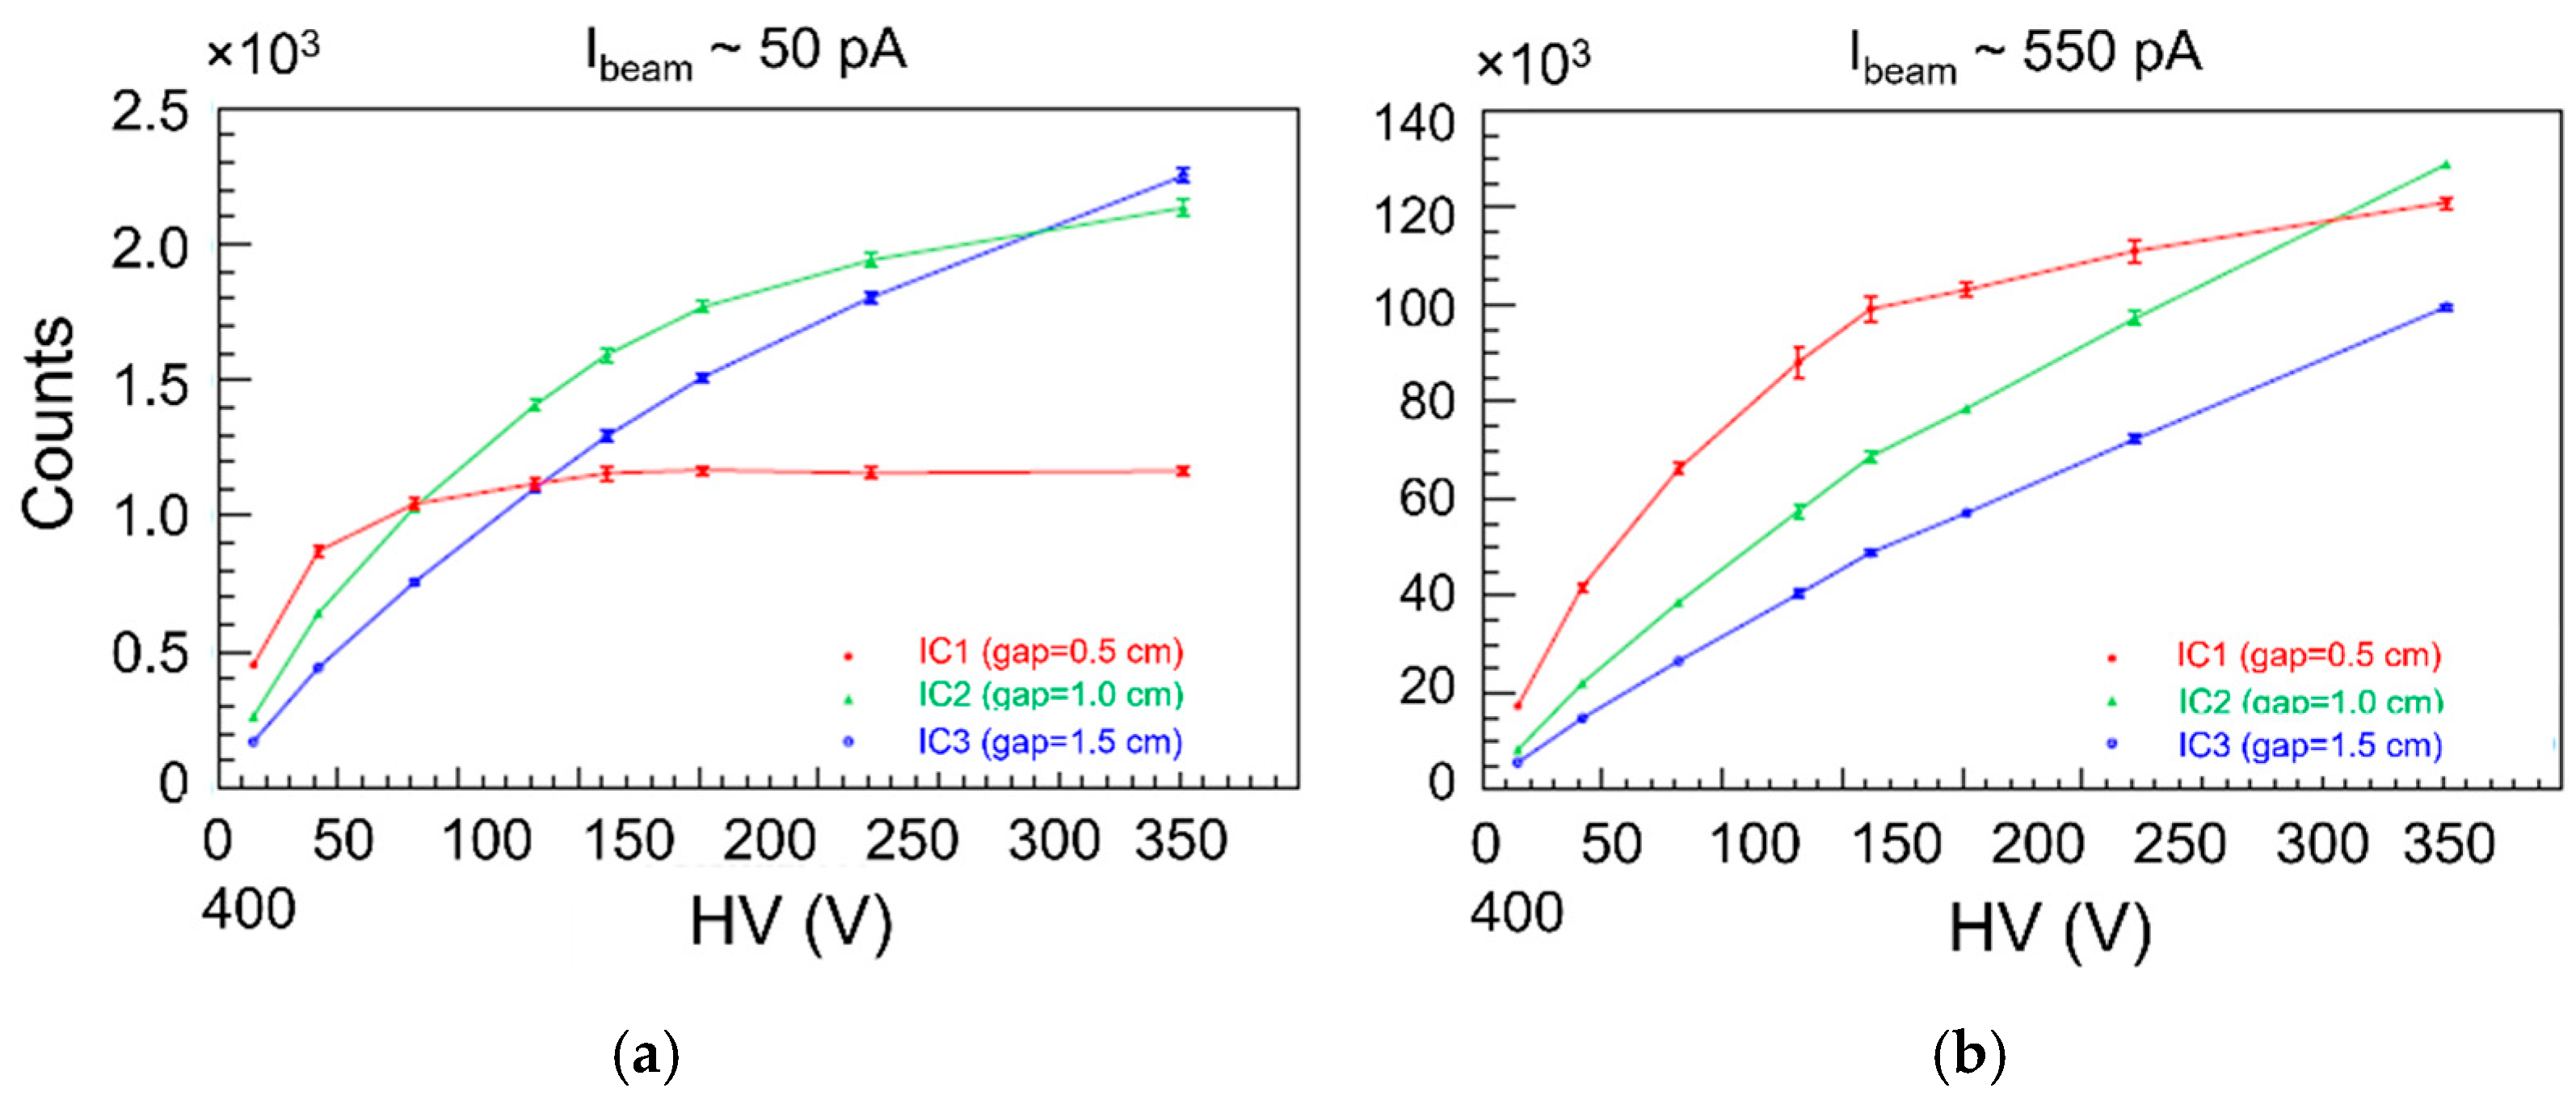
Figure 7 shows the counts measured by the three chambers as a function of the bias voltage for two beam intensities, 50 and 550 pA. It can be noticed that the chamber with the smallest gap is the only one that reaches the saturation at 50 pA with a bias voltage larger than 150 V.
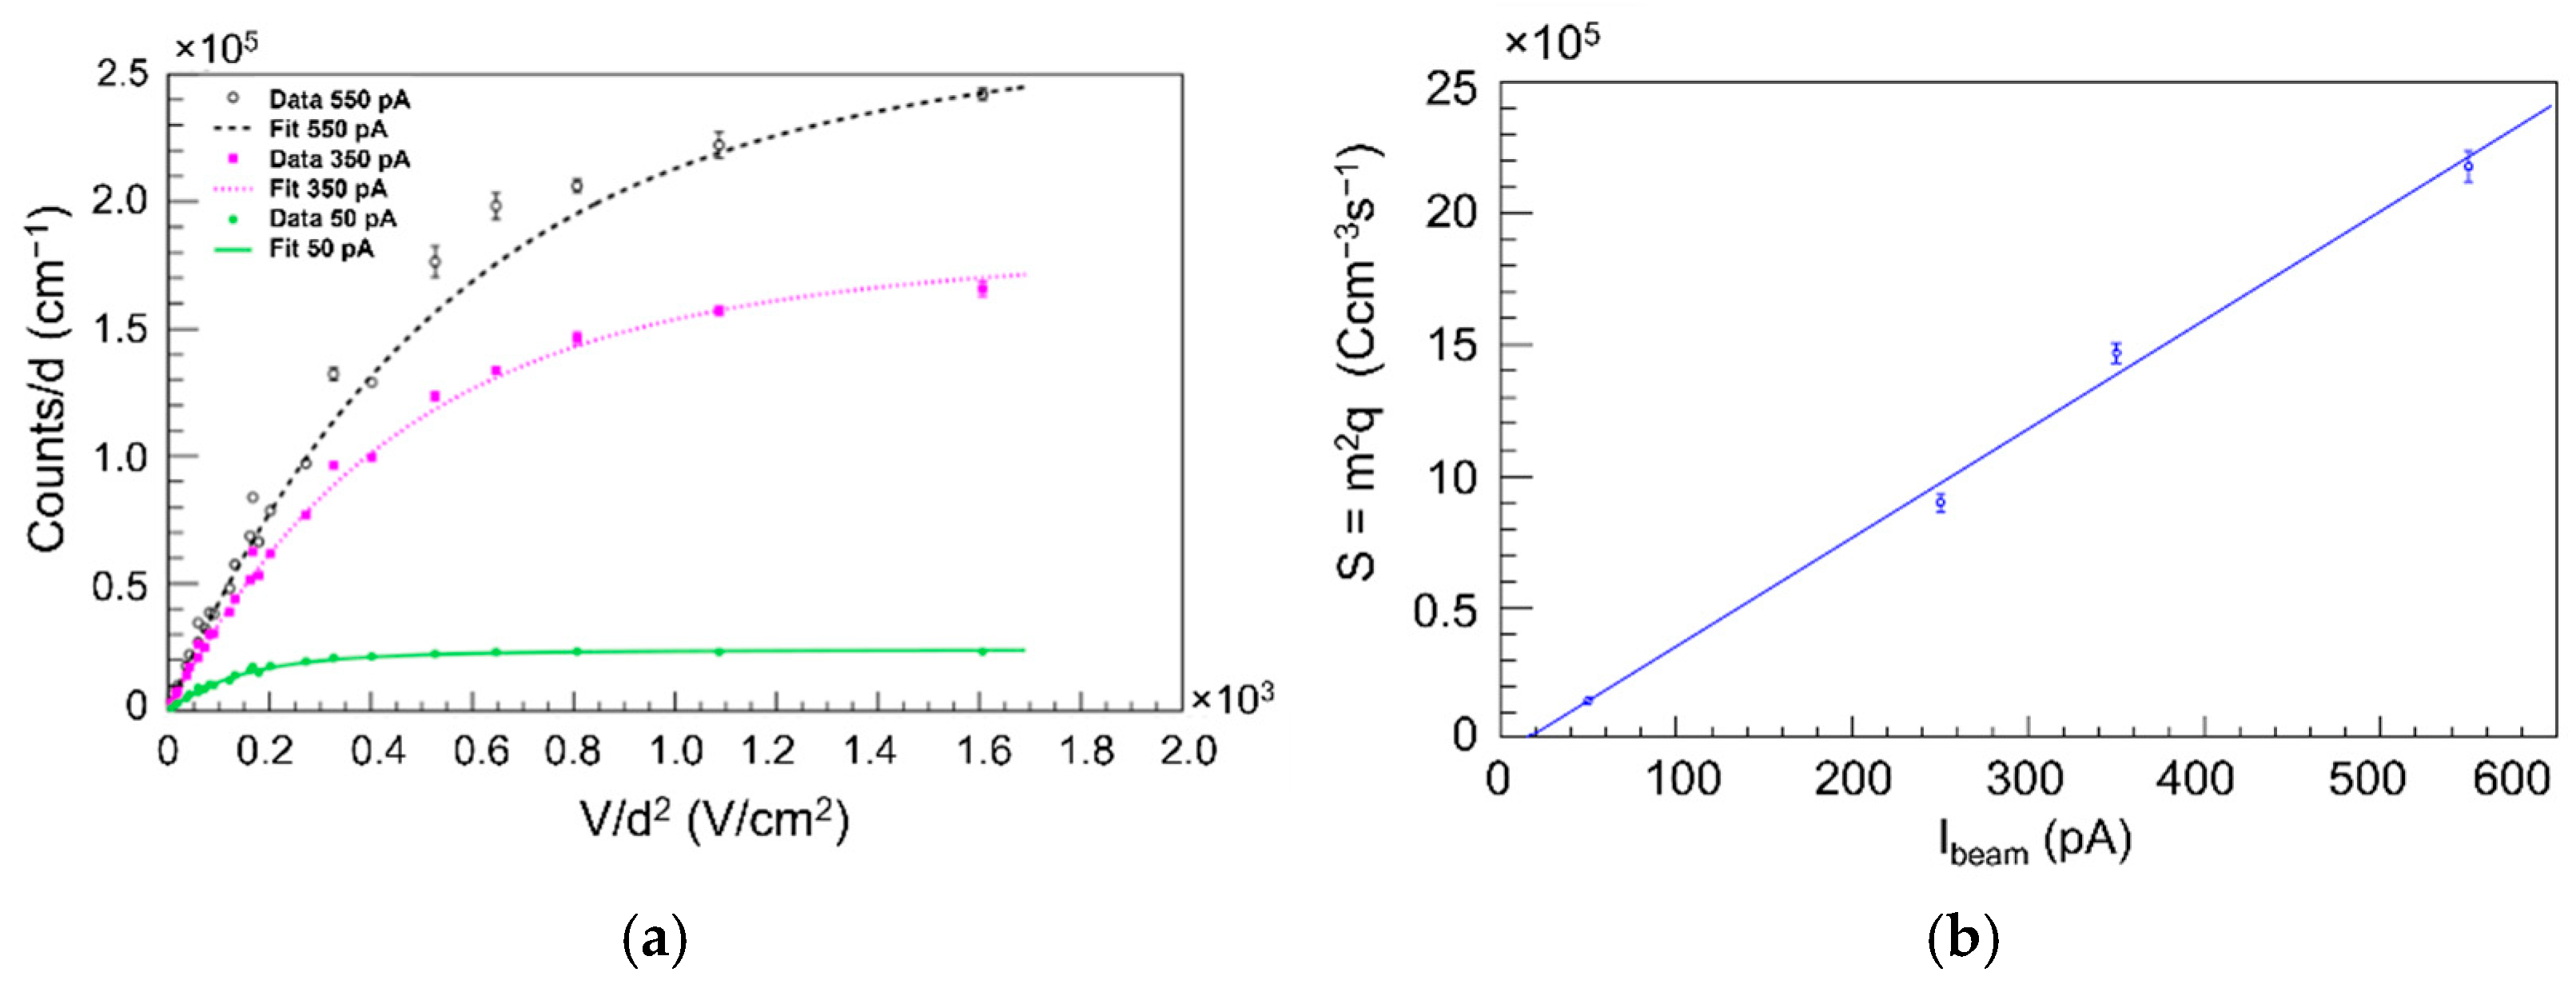
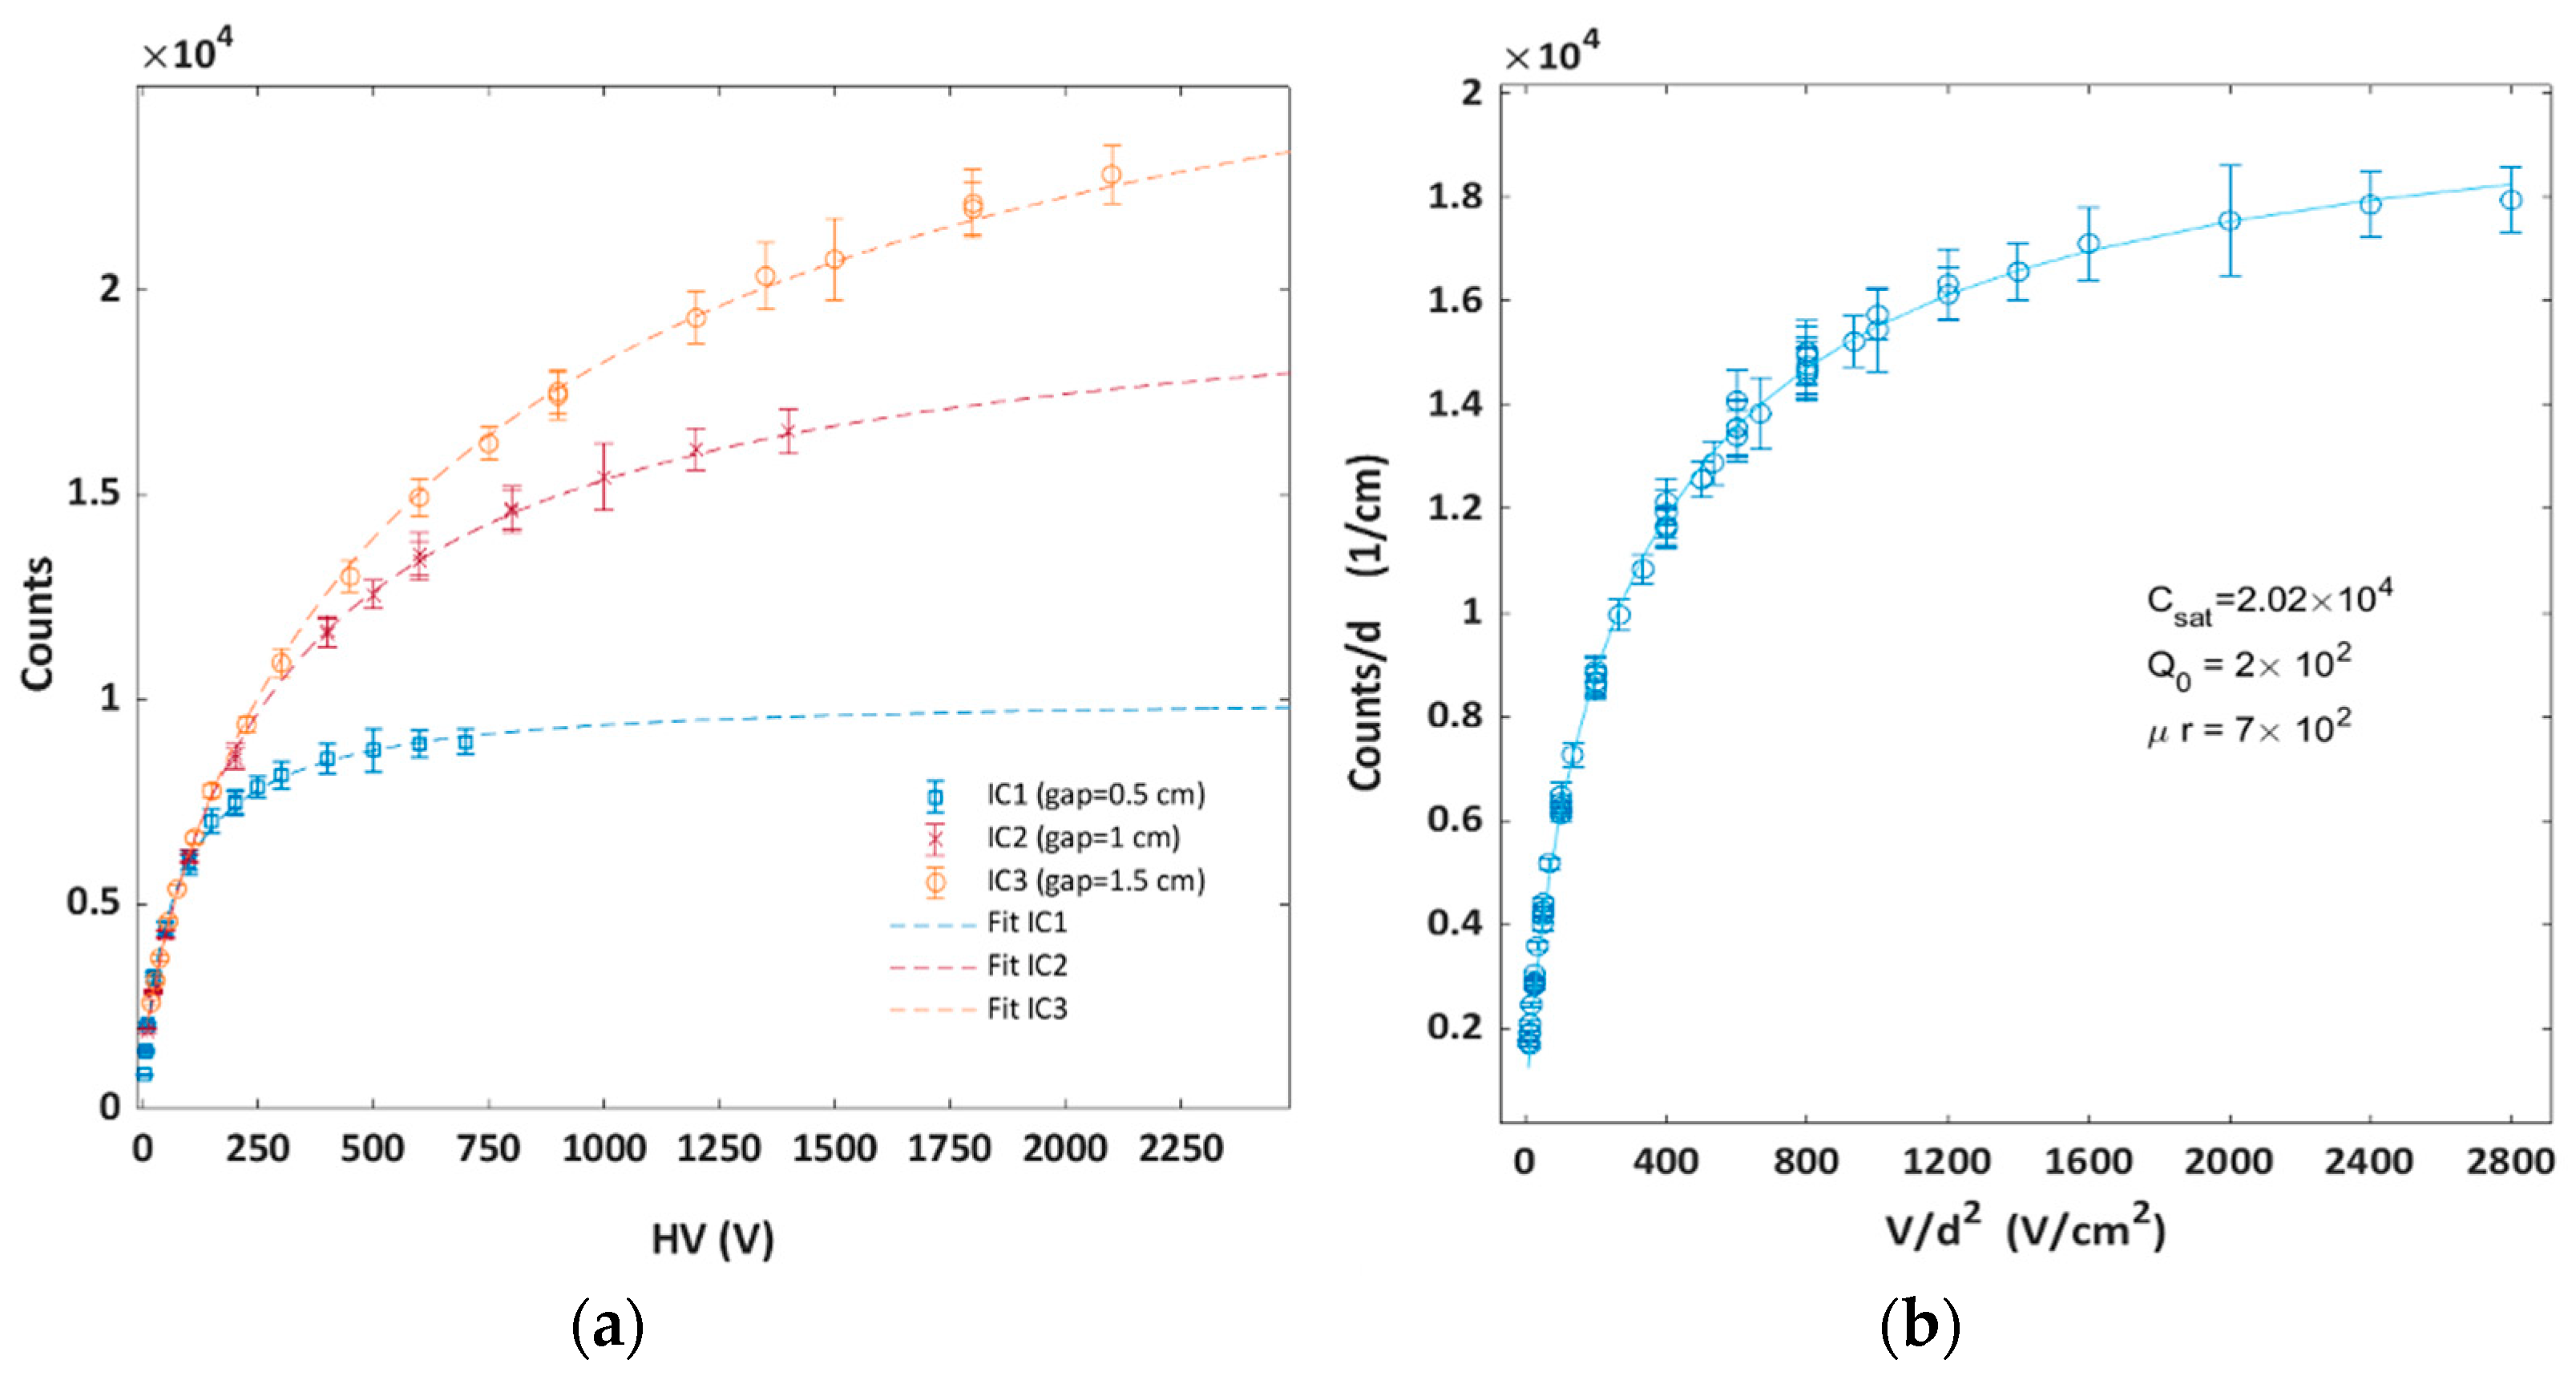
The counts per unit of thickness as a function of V/d
2 are shown in
Figure 8a and depend on the beam intensity. The measurements from different chambers reach the saturation at around 600 V/cm
2 for 50 pA, while more than 1600 V/cm
2 would be needed for 350 pA and 550 pA. The integrated charge for each test increases with the beam intensities because the MGD was irradiated for a fixed time. Using Equation (5) for fit and Equation (1) for f, the fits to the points were calculated and shown in the same figure. The rate of volumetric ionization (
S) as a function of the measured beam current is evaluated from fits, and the good linearity is shown in
Figure 8b.
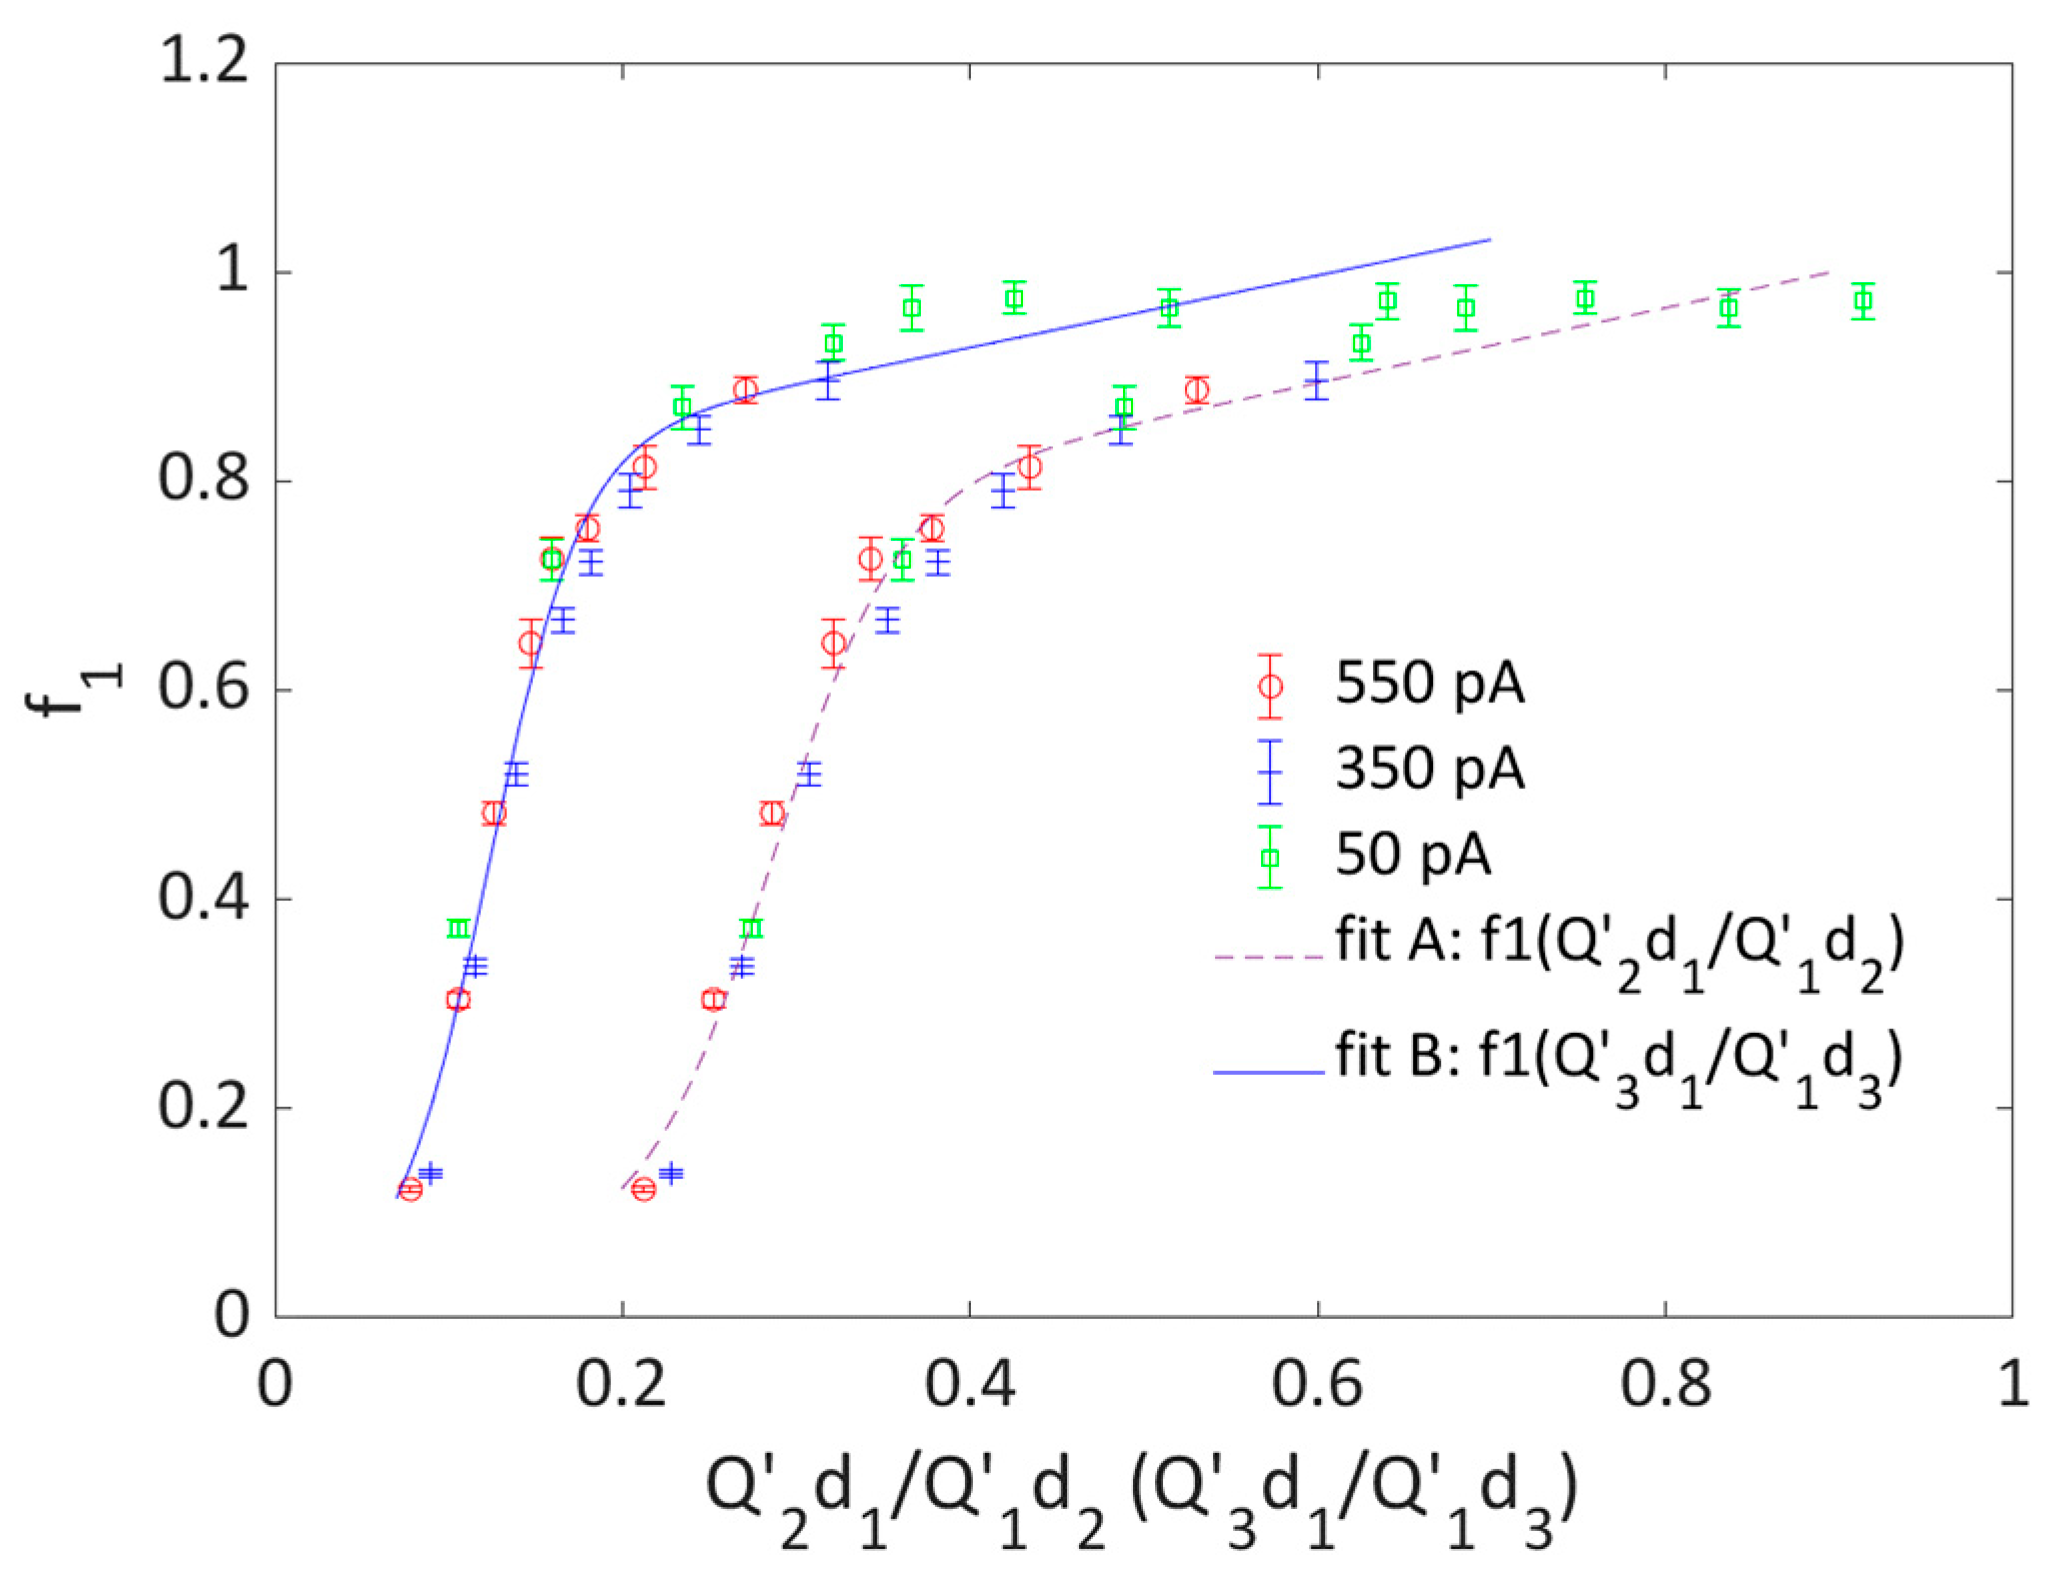
In
Figure 9, we report the relevant curves, which can be used to extract the corrected integral counts of IC1. The IC1 efficiencies (f
1), computed as the ratio between the actual IC1 readouts and the C
sat, are plotted as a function of f
n/f
1 =
d
1/
d
n where n = 2 and n = 3. Data are then fitted with Equation (6), providing two calibration curves (fit A and B in
Figure 9), each one being specific of the beam and detector characteristics used. The fit parameters are summarized in
Table 2.
The measurement performed with a bias voltage of 160 V and beam intensity of 550 pA had provided as relative efficiency
d
2/
d
1 = 0.321 and Q
3d
1/Q
1d
3 = 0.147. As a correction factor for the IC1 counts, one can compute f1 either using either fit A either B with the parameters listed in
Table 2, and the resulting f
1A = 0.61258 and f
1B = 0.61007 deviate by less than 0.3%.
Fit parameters are reported in
Table 2, together with the results obtained at the other accelerator facilities.
3.3. MGD Characterization with the CATANA Pulsed Proton Beams
The MGD was irradiated with a pulsed frequency of 1 Hz, the pulse width was 500 µs, and there was a fixed number of protons per second (corresponding to ~10 nA). The bias voltage was changed between 3 and 2100 V and, for each voltage value, the detector was irradiated with the same number of particles. The integral MUs measured by the three ICs and compared with the integral charge measured by a Faraday cup placed just after the MGD and readout with an acquisition time interval of 200 ms. The fluctuations in the number of counts within each pulse are mainly due to the pulse-to-pulse fluctuations of the delivered protons. The measurements of the Faraday cup were used to correct for these fluctuations by applying to the readout at each pulse a correction factor obtained as:
, where
represents the Faraday cup readout for the actual pulse and <
FC> is the average Faraday cup readout value with the given beam conditions.
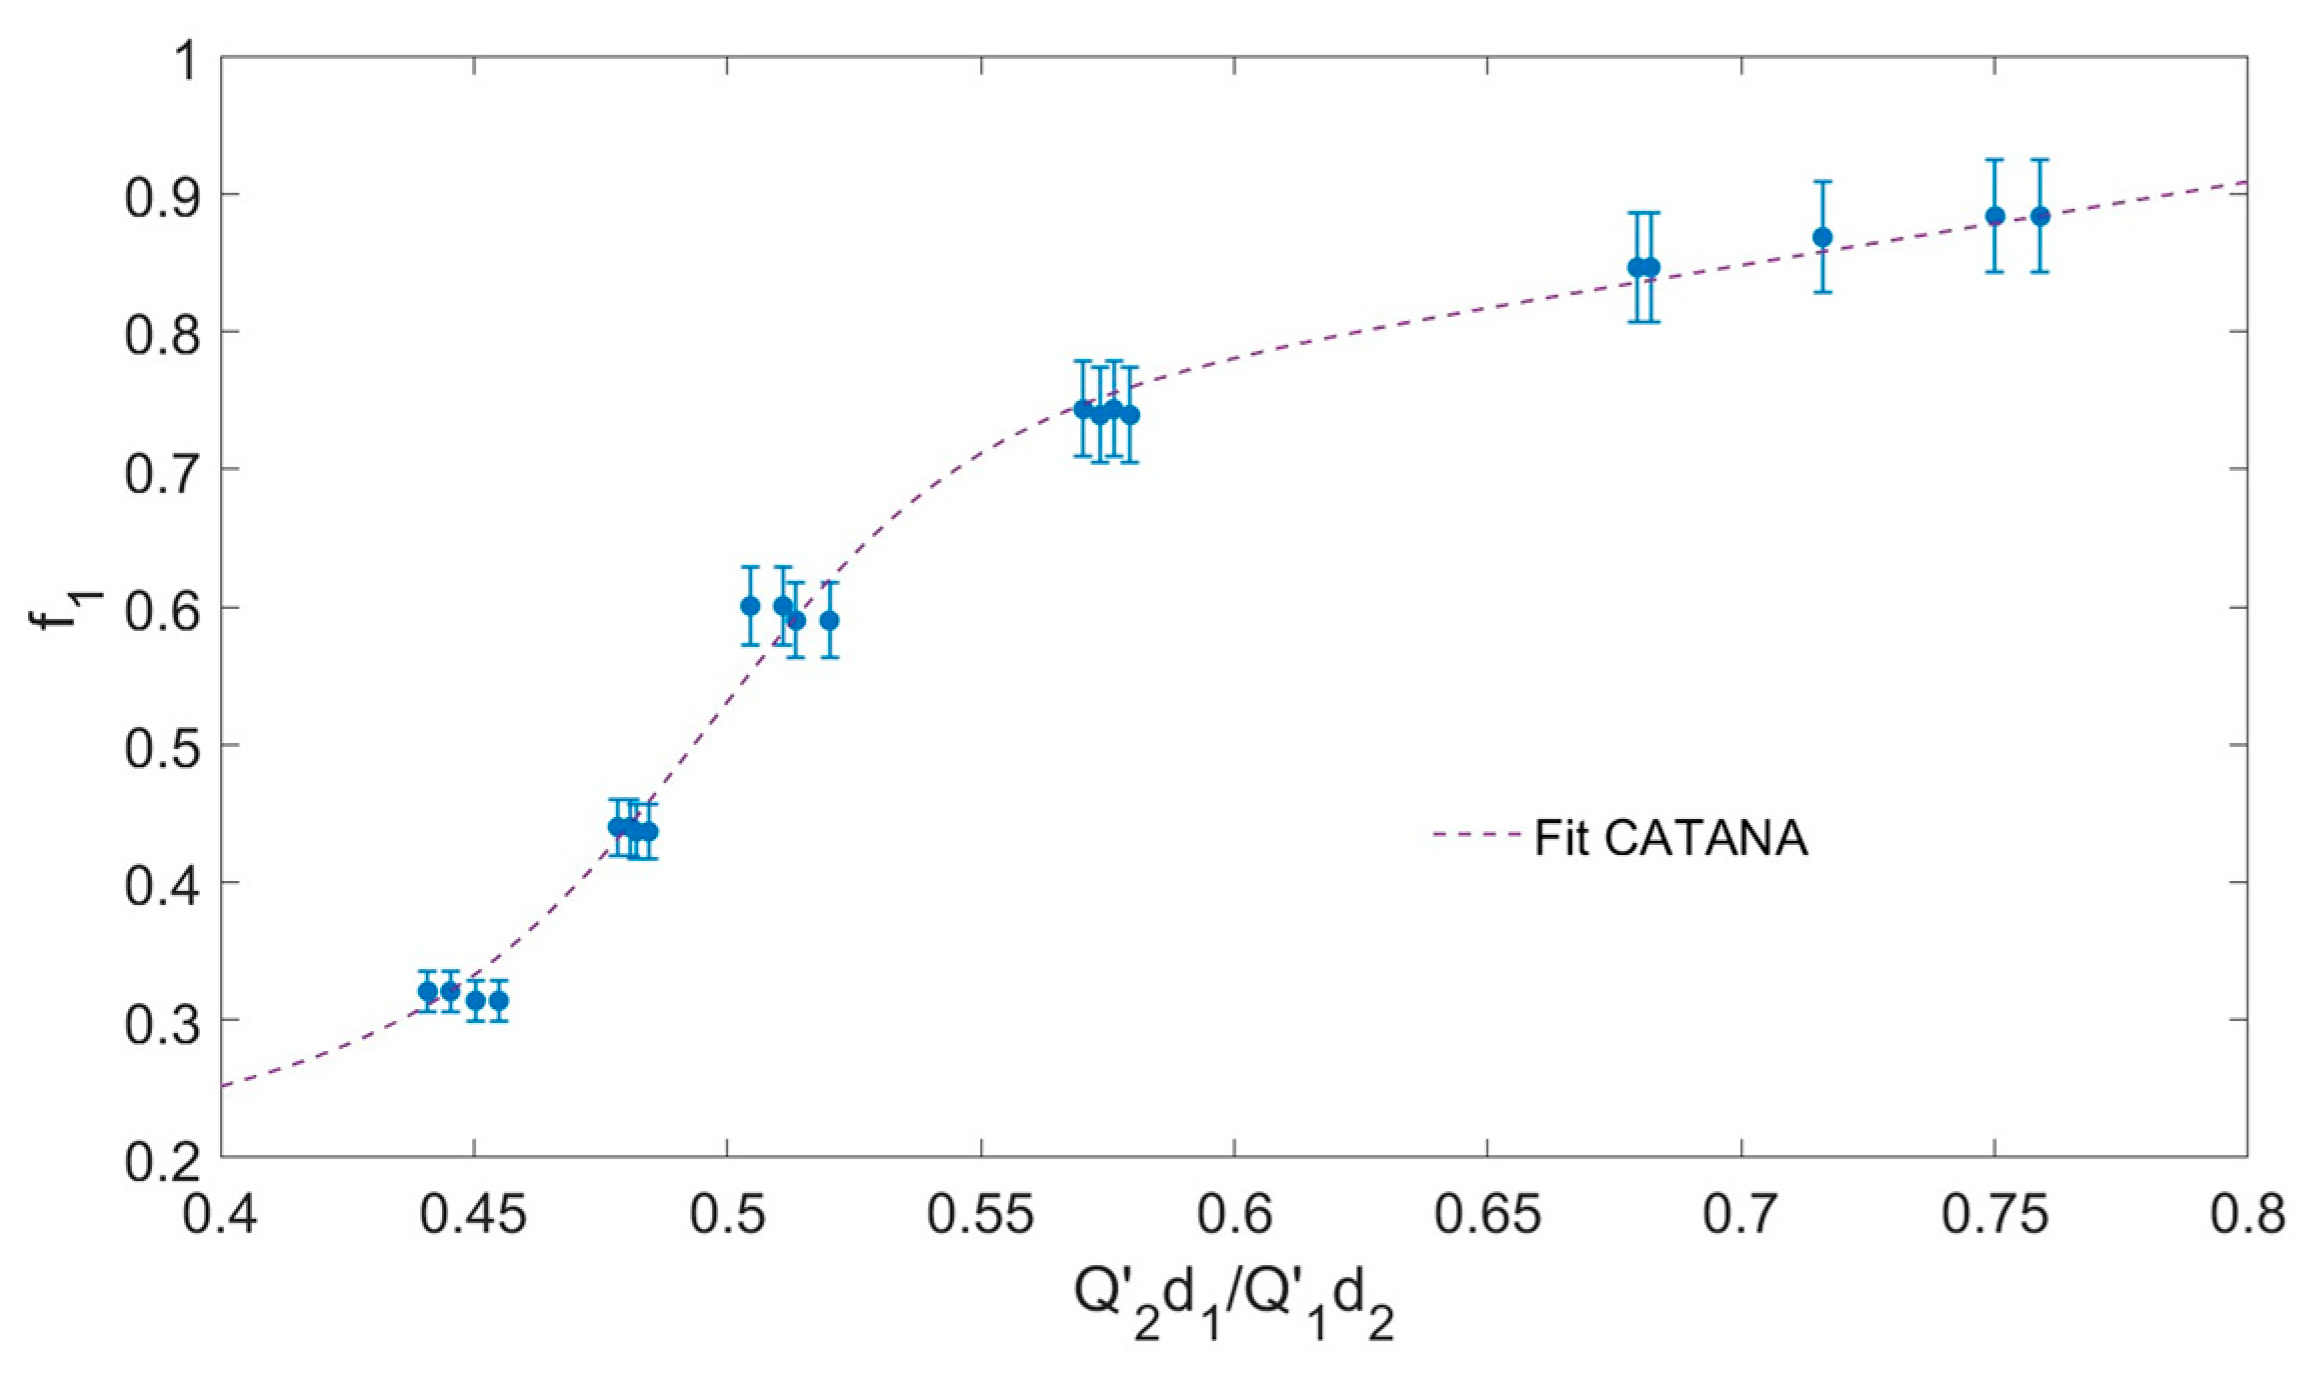
Figure 10 shows the average MUs measured per pulse by the three chambers as a function of the bias voltage.
Figure 10b shows the counts per unit of thickness as a function of V/d
2. The fit shown in the figure was calculated using Equation (5) and the Boag’s function for pulsed beam (Equation (2)) to compute the efficiency
f. The large charge recombination observed in chamber 3 with the CATANA pulsed beam lead to a few good points to reconstruct the calibration curve; therefore, f
1 was evaluated using data from IC1 and IC2 only, as shown in
Figure 11. The fit to the data with Equation (6) is overlapped to the points in
Figure 11, and the parameters are listed in
Table 2.
4. Discussions and Conclusions
The recombination of charge carriers significantly affects the response of gas ionization detectors used for beam monitoring in particle therapy with high-intensity beams. This problem was made even more relevant by the advent of new acceleration technologies, leading to pulsed beams of large instantaneous intensity, and FLASH therapy.
In this work, we present the characterization of a detector composed by three gas ionization chambers with different gap widths (multi-gap ionization chamber) developed to test a method for correcting online the non-linearity of the rate of charge collection with the ionization rate. This condition occurs when the chamber is irradiated with very high-intensity beams, leading to a large volume recombination.
The method relies on the fact that the charge collection efficiency of a planar ionization chamber decreases, at any given ionization rate, with the increase in the gas gap where the ionization occurs. If the beam crosses two consecutive ionization chambers with different gaps, inducing in both the same volumetric ionization rate, the ratio of the charges collected at the two electrodes, normalized to the gap width, is a direct measurement of the relative efficiency, which is a quantity that can be easily determined online. At first order, for a given beam of varying intensity, this quantity is expected to depend only on the volumetric ionization rate and can be used to parametrize the efficiency of one of the two chambers, which was chosen as the reference.
The five different calibration curves measured in this work prove that such a parametrization is not universal as one would expect considering both the different track structure of protons and carbon ions at the microscopic level and the different beam size and transverse distribution of each beam. Indeed, recombination is a complex phenomenon which is expected to depend on the track structures of each particle type, on the beam size and on the time structure of the beam irradiation at a time scale corresponding to the charge collection time in the chamber, typically tens to hundreds of microseconds. Therefore, comprehensive and accurate measurements need to be performed at any given accelerator beam to obtain the specific calibration curve then used online to correct the detector counts.
The multi-gap chamber characterization with different charged particle beams (protons and carbon ions) and beam delivery time structure (continuous and pulsed beams) presented in this paper proves that the assumption of working with the same rate of ionization in all the chambers was always satisfied, the experimental efficiency saturation curves obtained changing the bias voltage corroborate the expected behavior predicted by the known models for volumetric charge recombination in parallel plate ionization chambers, and the rate of volumetric ionization increases linearly with the beam intensity.
As a final conclusion, the multi-gap ionization chamber represents a possible detector for beam monitoring in particle therapy with high fluence rates, keeping in mind that for each accelerator and for several beam characteristics, optimized gap widths and accurate calibration procedure are mandatory. In particular, the developments presented in this paper can be instrumental toward the solution of the challenging problem of real-time beam monitoring in FLASH radiation therapy.
Author Contributions
Conceptualization and methodology, R.S., S.G. and L.F.G.; detector assembly and set up, R.S., S.G., L.F.G. and F.F.; experimental measurements R.S., S.G., L.F.G., S.B., G.A.P.C., M.D., F.F., F.R., A.V. and R.C.; data analysis S.G., L.F.G. and F.M.M.; resources, R.S., S.G. and R.C.; writing—original draft preparation, R.S. and S.G.; writing—review and editing, R.S., S.G., L.F.G., S.B., F.F., F.M.M., V.M., F.R., A.V. and R.C. All authors have read and agreed to the published version of the manuscript.
Funding
This work was financed by the INFN CSN5 and MIUR Dipartimenti di Eccellenza (ex L.232/2016, art.1, cc. 314, 337).
Institutional Review Board Statement
Not applicable.
Informed Consent Statement
Not applicable.
Data Availability Statement
Data supporting the reported results are available from the corresponding authors.
Acknowledgments
The authors are grateful for the fruitful discussions and suggestions received from Flavio Marchetto.
Conflicts of Interest
The authors declare no conflict of interest.
References
- Flanz, J.; Bortfeld, T. Evolution of technology to optimize the delivery of proton therapy: The third generation. Semin. Radiat. Oncol. 2013, 23, 142–148. [Google Scholar] [CrossRef] [PubMed]
- Yap, J.; De Franco, A.; Sheehy, S. Future Developments in Charged Particle Therapy: Improving Beam Delivery for Efficiency and Efficacy. Front. Oncol. 2021, 11, 780025. [Google Scholar] [CrossRef] [PubMed]
- Paganetti, H.; Beltran, C.J.; Both, S.; Dong, L.; Flanz, J.B.; Furutani, K.M.; Grassberger, C.; Grosshans, D.R.; Knopf, A.-C.; Langendijk, J.A. Roadmap: Proton therapy physics and biology. Phys. Med. Biol. 2021, 66, 05RM01. [Google Scholar] [CrossRef] [PubMed]
- Romano, F.; Bailat, C.; Jorge, P.G.; Lerch, M.L.F.; Darafsheh, A. Ultra-high dose rate dosimetry: Challenges and opportunities for FLASH radiation therapy. Med. Phys. 2022, 49, 4912–4932. [Google Scholar] [CrossRef] [PubMed]
- Diffenderfer, E.S.; Sørensen, B.S.; Mazal, A.; Carlson, D.J. The current status of preclinical proton FLASH radiation and future directions. Med. Phys. 2022, 49, 2039–2054. [Google Scholar] [CrossRef] [PubMed]
- Pardo-Montero, J.; Paz-Martín, J.; Brualla-Gónzalez, L.; Gómez, F. Online Recombination Correction in Dosimetry with Arrays of Ionization Chambers: Application to FFF and UHDR Radiotherapy. Appl. Sci. 2021, 11, 10083. [Google Scholar] [CrossRef]
- Zou, W.; Diffenderfer, E.S.; Ota, K.; Boisseau, P.; Kim, M.M.; Cai, Y.; Avery, S.M.; Carlson, D.J.; Wiersma, R.D.; Lin, A.; et al. Characterization of a high-resolution 2D transmission ion chamber for independent validation of proton pencil beam scanning of conventional and FLASH dose delivery. Med. Phys. 2021, 48, 3948–3957. [Google Scholar] [CrossRef]
- Gómez, F.; Gonzalez-Castaño, D.M.; Fernández, N.G.; Pardo-Montero, J.; Schüller, A.; Gasparini, A.; Vanreusel, V.; Verellen, D.; Felici, G.; Kranzer, R.; et al. Development of an ultra-thin parallel plate ionization chamber for dosimetry in FLASH radiotherapy. Med. Phys. 2022, 49, 4705–4714. [Google Scholar] [CrossRef]
- Giordanengo, S.; Donetti, M.; Garella, M.A.; Marchetto, F.; Alampi, G.; Ansarinejad, A.; Monaco, V.; Mucchi, M.; Pecka, I.A.; Peroni, C.; et al. Design and characterization of the beam monitor detectors of the Italian National Center of Oncological Hadron-therapy (CNAO). Nucl. Instrum. Methods Phys. Res. Sect. A Accel. Spectrometers Detect. Assoc. Equip. 2013, 698, 202–207. [Google Scholar] [CrossRef] [Green Version]
- Givehchi, N.; Marchetto, F.; Valastro, L.M.; Ansarinejad, A.; Attili, A.; Garella, M.A.; Giordanengo, S.; Monaco, V.; Montero, J.P.; Sacchi, R.; et al. Online beam monitoring in the treatment of ocular pathologies at the INFN Laboratori Nazionali del Sud-Catania. Phys. Med. 2011, 27, 233–240. [Google Scholar] [CrossRef]
- Braccini, S.; Cirio, R.; Donetti, M.; Marchetto, F.; Pittà, G.; Lavagno, M.; La Rosa, V. Segmented ionization chambers for beam monitoring in hadrontherapy. Mod. Phys. Lett. A 2015, 30, 1540026. [Google Scholar] [CrossRef] [Green Version]
- Fausti, F.; Mazza, G.; Attili, A.; Mazinani, M.F.; Giordanengo, S.; Lavagno, M.; Manganaro, L.; Marchetto, F.; Monaco, V.; Sacchi, R.; et al. Design and characterization of a 64channels ASIC front-end electronics for high-flux particle beam detectors. Nucl. Instrum. Methods Phys. Res. Sect. A Accel. Spectrometers Detect. Assoc. Equip. 2017, 867, 1–6. [Google Scholar] [CrossRef]
- Cirio, R.; Fausti, F.; Guarachi, L.F.; Giordanengo, S.; Marchetto, F.; Mazza, G.; Monaco, V.; Sacchi, R.; Talpacci, E.; Anvar, M.V.; et al. A simple method to increase the current range of the TERA chip in charged particle therapy applications. Nucl. Instrum. Methods Phys. Res. Sect. A Accel. Spectrometers Detect. Assoc. Equip. 2015, 798, 107–110. [Google Scholar] [CrossRef] [Green Version]
- Rossi, S. The National Centre for Oncological Hadrontherapy (CNAO): Status and perspectives. Phys. Med. 2015, 31, 333–351. [Google Scholar] [CrossRef] [PubMed]
- Mirandola, A.; Molinelli, S.; Vilches Freixas, G.; Mairani, A.; Gallio, E.; Panizza, D.; Russo, S.; Ciocca, M.; Donetti, M.; Magro, G.; et al. Dosimetric commissioning and quality assurance of scanned ion beams at the Italian National Center for Oncological Hadrontherapy. Med. Phys. 2015, 42, 5287. [Google Scholar] [CrossRef] [PubMed]
- Braccini, S. The new bern PET cyclotron, its research beam line, and the development of an innovative beam monitor detector. In AIP Conference Proceedings; American Institute of Physics: College Park, MA, USA, 2013; Volume 1525, pp. 144–150. [Google Scholar]
- Auger, M.; Braccini, S.; Ereditato, A.; Nesteruk, K.P.; Scampoli, P. Low current performance of the Bern medical cyclotron down to the pA range. Meas. Sci. Technol. 2015, 26, 094006. [Google Scholar] [CrossRef]
- Anders, J.; Braccini, S.; Carzaniga, T.S.; Casolaro, P.; Chatterjee, M.; Dellepiane, G.; Franconi, L.; Halser, L.; Ilg, A.; Mateu, I.; et al. A facility for radiation hardness studies based on a medical cyclotron. J. Instrum. 2022, 17, P04021. [Google Scholar] [CrossRef]
- Auger, M.; Braccini, S.; Carzaniga, T.S.; Ereditato, A.; Nesteruk, K.P.; Scampoli, P. A detector based on silica fibers for ion beam monitoring in a wide current range. J. Instrum. 2016, 11, P03027. [Google Scholar] [CrossRef]
- Cirrone, G.A.P.; Cuttone, G.; Raffaele, L.; Salamone, V.; Avitabile, T.; Privitera, G.; Spatola, C.; Amico, A.G.; Larosa, G.; Leanza, R.; et al. Clinical and Research Activities at the CATANA Facility of INFN-LNS: From the Conventional Hadrontherapy to the Laser-Driven Approach. Front. Oncol. 2017, 7, 223. [Google Scholar] [CrossRef] [Green Version]
- Romano, F.; Schillaci, F.; Cirrone, G.A.P.; Cuttone, G.; Scuderi, V.; Allegra, L.; Amato, A.; Amico, A.; Candiano, G.; De Luca, G.; et al. The ELIMED transport and dosimetry beamline for laser-driven ion beams. Nucl. Instrum. Methods Phys. Res. A 2016, 829, 153–158. [Google Scholar] [CrossRef]
- Scuderi, V.; Amato, A.; Amico, A.G.; Borghesi, M.; Cirrone, G.A.P.; Cuttone, G.; Fajstavr, A.; Giuffrida, L.; Grepl, F.; Korn, G.; et al. Diagnostics and Dosimetry Solutions for Multidisciplinary Applications at the ELIMAIA Beamline. Appl. Sci. 2018, 8, 1415. [Google Scholar] [CrossRef] [Green Version]
- Andreo, P.; Burns, D.T.; Hohlfeld, K.; Huq, M.S.; Kanai, T.; Laitano, F.; Smyth, V.G.; Vynckier, S. Absorbed Dose Determination in External Beam Radiotherapy: An International Code of Practice for Dosimetry Based on Standards of Absorbed Dose to Water; IAEA Technical Report Series 398; IAEA: Vienna, Austria, 2000. [Google Scholar]
- Greening, J. Saturation Characteristics of Parallel-Plate Ionization Chambers. Phys. Med. Biol. 1964, 9, 143–154. [Google Scholar] [CrossRef]
- Roos, M.; Derikum, K. The Recombination Correction and the Dependence of the Response of Plane Parallel Chambers on the Polarizing Voltage in Pulsed Electron and Photon Beams; Review of Data and Methods Recommended in the International Code of Practice for Dosimetry, IAEA TECDOC 1173; Physikalisch-Technische Bundesanstalt: Braunschweig, Germany, 2000; pp. 53–64. [Google Scholar]
- Onsager, L. Initial recombination of ions. Phys. Rev. 1938, 54, 554–557. [Google Scholar] [CrossRef]
- Kanai, T.; Sudo, M.; Matsufuji, N.; Futami, Y. Initial recombination in a parallel-plate ionization chamber exposed to heavy ions. Phys. Med. Biol. 1998, 43, 3549–3558. [Google Scholar] [CrossRef]
- Almond, P.R.; Biggs, P.J.; Coursey, B.M.; Hanson, W.F.; Huq, M.S.; Nath, R.; Rogers, D.W.O. AAPM’s TG-51 protocol for clinical reference dosimetry of high-energy photon and electron beams. Med Phys. 1999, 26, 1847–1870. [Google Scholar] [CrossRef] [Green Version]
- Boag, J.W.; Wilson, T. The saturation curve at high ionization intensity. Br. J. Appl. Phys. 1952, 3, 222–229. [Google Scholar] [CrossRef]
- Boag, J.W. Ionization Measurements at Very High Intensities—Part I. Br. J. Radiol. 1950, 23, 601–611. [Google Scholar] [CrossRef]
Figure 1.
(a) Exploded view of the detector assembly, where anodes, cathodes and empty frames are labeled as A, C, and F, respectively. (b) Picture of the detector box where the cover was removed.
Figure 1.
(a) Exploded view of the detector assembly, where anodes, cathodes and empty frames are labeled as A, C, and F, respectively. (b) Picture of the detector box where the cover was removed.
Figure 2.
Pictures of the experimental setup for the MGD tests at the end of the Beam Transport Line in the three research rooms, (a) CNAO, (b) Bern University Hospital, (c) CATANA.
Figure 2.
Pictures of the experimental setup for the MGD tests at the end of the Beam Transport Line in the three research rooms, (a) CNAO, (b) Bern University Hospital, (c) CATANA.
Figure 3.
Example of chamber efficiency (f1) as a function of the relative counts per unit of thickness measured by a multi-gap detector ( = d1/dj).
Figure 3.
Example of chamber efficiency (f1) as a function of the relative counts per unit of thickness measured by a multi-gap detector ( = d1/dj).
Figure 4.
Integral counts measured by the three chambers as a function of the bias voltage for two beam intensities: (a) 6 × 10⁶ and (b) 3 × 10⁷ carbon ions/s.
Figure 4.
Integral counts measured by the three chambers as a function of the bias voltage for two beam intensities: (a) 6 × 10⁶ and (b) 3 × 10⁷ carbon ions/s.
Figure 5.
(a) Total counts normalized to the detector gap for three beam intensities (0.6 × 10⁷, 2 × 10⁷ and 3 × 10⁷ carbon ions/s) and fits to measurements from all the chambers. (b) Rate of ionization (S) as a function of the measured beam current.
Figure 5.
(a) Total counts normalized to the detector gap for three beam intensities (0.6 × 10⁷, 2 × 10⁷ and 3 × 10⁷ carbon ions/s) and fits to measurements from all the chambers. (b) Rate of ionization (S) as a function of the measured beam current.
Figure 6.
Calibration curves measured for chamber 1 as a function of d1/dn. The fit A describes the results achieved using data from chamber 1 and chamber 2, while fit B describes the data from chamber 1 and chamber 3. The color indicates the beam intensity.
Figure 6.
Calibration curves measured for chamber 1 as a function of d1/dn. The fit A describes the results achieved using data from chamber 1 and chamber 2, while fit B describes the data from chamber 1 and chamber 3. The color indicates the beam intensity.
Figure 7.
Integral counts measured by the three chambers as a function of the bias voltage for two beam intensities: (a) 50 pA and (b) 550 pA.
Figure 7.
Integral counts measured by the three chambers as a function of the bias voltage for two beam intensities: (a) 50 pA and (b) 550 pA.
Figure 8.
(a) Total counts per unit of thickness as a function of V/d2 for three beam intensities (50, 350, 550 pA) and fits. (b) Rate of volumetric ionization as a function of the measured beam current.
Figure 8.
(a) Total counts per unit of thickness as a function of V/d2 for three beam intensities (50, 350, 550 pA) and fits. (b) Rate of volumetric ionization as a function of the measured beam current.
Figure 9.
Calibration curves measured for chamber 1 as a function of d1/dn. Fit A describes the results achieved using data from chamber 1 and chamber 2, while fit B describes the data from chamber 1 and chamber 3. The color indicates the beam intensity.
Figure 9.
Calibration curves measured for chamber 1 as a function of d1/dn. Fit A describes the results achieved using data from chamber 1 and chamber 2, while fit B describes the data from chamber 1 and chamber 3. The color indicates the beam intensity.
Figure 10.
(a) Average counts per pulse normalized to the Faraday cup measured charge as a function of the bias voltage for 500 µs pulse width and corresponding fits with the Boag formula for pulsed beams; (b) total counts normalized to the detector gap and fit.
Figure 10.
(a) Average counts per pulse normalized to the Faraday cup measured charge as a function of the bias voltage for 500 µs pulse width and corresponding fits with the Boag formula for pulsed beams; (b) total counts normalized to the detector gap and fit.
Figure 11.
Calibration curve measured for chamber 1 as a function of d1/d2.
Figure 11.
Calibration curve measured for chamber 1 as a function of d1/d2.
Table 1.
Main characteristics of the beams used for the tests presented in this work.
Table 1.
Main characteristics of the beams used for the tests presented in this work.
| Particle | Accelerator
(Beam Delivery Time Structure) | Energy | Averaged
Intensities | FWHM | Facility Name |
|---|
| Carbon ions | Synchrotron
(continuous within the spills) | 115 MeV/u | 6 × 10⁶ ions/s
2 × 10⁷ ions/s
3 × 10⁷ ions/s | ~5 mm | Centro Nazionale di Adroterapia Oncologica (CNAO, Pavia, Italy) |
| Protons | Cyclotron
(continuous) | 15 MeV | 50 pA
350 pA
550 pA | 20 mm | Bern University Hospital (Bern, Switzerland) |
| Protons | Cyclotron
(pulsed; 1 Hz, 500 µs pulse duration) | 62 MeV | 1011 protons/s | 40 mm | CATANA at Laboratori
Nazionali del Sud (LNS)
(Catania, Italy) |
Table 2.
Parameters of the calibration curves achieved through the fits to the CNAO, Bern and CATANA data.
Table 2.
Parameters of the calibration curves achieved through the fits to the CNAO, Bern and CATANA data.
| Data | Fit Parameters | |
|---|
| | a | b | c | d | R-Squared |
|---|
| CNAO A:f1(Q2d1/Q1d2) | 0.29 ± 0.07 | 1.33 ± 0.09 | 0.417 ± 0.004 | 0.035 ± 0.004 | 0.996 |
| CNAO B:f1(Q3d1/Q1d3) | 0.30 ± 0.11 | 1.25 ± 0.09 | 0.294 ± 0.002 | 0.015 ± 0.004 | 0.987 |
BERNA
A:f1(Q2d1/Q1)d2) | 0.34 ± 0.13 | 1.44 ± 0.02 | 0.298 ± 0.003 | 0.039 ± 0.011 | 0.99 |
BERNA
B:f1(Q3d1/Q1d3) | 0.34 ± 0.21 | 1.27 ± 0.13 | 0.130 ± 0.006 | 0.026 ± 0.056 | 0.98 |
CATANA
f1(Q2d1/Q1d2) | 0.60 ± 0.22 | 2.35 ± 0.86 | 0.520 ± 0.009 | 0.026 ± 0.013 | 0.992 |
| Publisher’s Note: MDPI stays neutral with regard to jurisdictional claims in published maps and institutional affiliations. |
© 2022 by the authors. Licensee MDPI, Basel, Switzerland. This article is an open access article distributed under the terms and conditions of the Creative Commons Attribution (CC BY) license (https://creativecommons.org/licenses/by/4.0/).


 ,
, 


