
Algorithm for Cycle-To-Cycle Firing TDC Identification Based on Wasted Spark Duration Measurements in Small Engines

Science and Technology Institute for Sustainable Energy and Mobility STEMS—CNR, Via G. Marconi 4, 80125 Napoli, Italy
*
Author to whom correspondence should be addressed.
Appl. Sci. 2023, 13(3), 1362; https://doi.org/10.3390/app13031362
Submission received: 30 December 2022
/
Revised: 17 January 2023
/
Accepted: 17 January 2023
/
Published: 19 January 2023
(This article belongs to the Special Issue Machines for Distributed Microgeneration Systems)
Abstract
:Spark ignition (SI) engines are often used as distributed power generation applications. They ensure quick deployment, cost effective electricity, and are a valid choice for back-up power. An essential aspect for small size engines is to improve control margins without increasing the number of sensors. It is not uncommon to employ fixed ignition timing for such power units, with so called wasted spark systems. These feature two spark events per cycle, one during compression and one during the exhaust stroke. On the other hand, ever more complex control systems are applied for this engine category in the search for better efficiency and lower emissions. Control of actuators that is phased with the working cycle could represent a significant advantage in this context. A method previously developed for identifying top dead center (TDC) phasing offline was applied as an algorithm capable of performing the required task while the engine is running. It is based on current measurements in the secondary ignition circuit of systems that feature wasted spark operation. Validation was performed on a 50 cm3 SI unit connected to a 1 kW power generator. Statistical distribution during sequences of 1000 cycles recorded at five different levels of load was used for testing TDC identification capabilities. Results were also compared to evaluations based on engine speed measurements. The overall TDC identification success rate of the proposed algorithm was found to be over 99.8%.
1. Introduction
Technology is ever more reliant on electricity and distributed power generation is a valid option in this scenario. It can be deployment relatively fast and offers significant advantages for the owner, utility, as well as the end-user [1,2]. Small size spark ignition (SI) engines are straight forward applications in these situations, as the technology is cost effective, proven, and reliable; they are relatively easy to adapt to H2 fueling and this is another advantage that may bring significant benefits in a carbon-free future scenario [3].
One of the main characteristics of these small size units is that they feature a reduced number of sensors and actuators [4,5,6,7], mostly due to cost competitiveness aspects. New components are mainly developed for improved volumetric efficiency [8], better fuel atomization [9], use of alternative fuels [10], implementing direct injection [11,12], and turbocharging [13,14] for higher engine output. Improved efficiency and reduced emissions are facilitated by augmented control margins; for the specific case of small size engines, application of alternative sensors [15] and simplified variable cam actuation systems [16] contribute to cost effectiveness. This, along with other characteristics of this category of power units, requires careful evaluation when considering straight forward transfer of automotive based solutions [17]. Identification of various unwanted phenomena such as knock [18] and misfire [19] are often implemented as alternative detection methods that comply with the main requirements of reduced cost and contained system complexity. One particular aspect of combustion engines is that the crank angle needs to be evaluated as accurately as possible [20,21,22]. For control purposes, it is essential to at least distinguish between the two top dead centers (TDC) during the engine cycle (i.e., the firing TDC at the end of compression and the one between the exhaust and intake strokes). This allows sequential fuel injection to be implemented, with efficiency and emission benefits, as well as compatibility with direct injection [23]. Automotive applications usually employ such TDC identification algorithms through measurement of the instantaneous crankshaft [24] and/or camshaft speed [25], but in the specific case of small engines, this may not be as straight forward (e.g., crankshaft position sensors are not as diffused).
Alternative fuels are another important line of research in the field of combustion engines, and additives need to be carefully evaluated for obtaining optimal results [26,27,28]. Small size SI engines are often powered by bio-derived blends [29,30] or zero CO2 liquid fuels [31]. Natural gas and syngas are also used frequently [32,33], especially when low grade biomass is available [34]; this provides valuable local power with reduced cost end low emissions. Small SI units can ensure good performance even with energy sources that feature quite different properties such as hydrogen [35,36]. Providing improved control margins while containing costs can therefore be an essential aspect of using alternative fuels in small engines.
The goal of the current study is to implement a novel algorithm capable of identifying the firing TDC on a cycle-to-cycle basis through measurements of spark duration. It can be applied on many small size SI units that feature “wasted” spark operation of the ignition system and its main advantage is that there is no need for an additional sensor. Once the method was developed through offline data analysis of the secondary current readings, the algorithm was implemented as a LabVIEW virtual instrument application. It was tested and validated on a 50 cc SI unit that powered a single-phase AC generator; it was also compared to a method based on engine speed measurement. In-cylinder pressure measurements were used as means for verifying the actual TDC sequence. In light of implementing cost effective electronic control of fuel delivery (and thus ensure significant benefits with respect to fuel economy and emissions), the proposed method ensures a solid basis for sequential injection.
2. Materials and Method
Figure 1 shows the overall setup that contains a small size four stroke power unit attached to a 1 kW single phase 230 V AC generator. Table 1 also lists the main characteristics of the engine-generator assembly. Compared to the previous study that entailed developing the actual spark duration measurement method [37], engine load was extended at 0.0, 0.3, 0.5, 0.8, and 1.0 kW, and a module was added for online evaluations. All other conditions (e.g., commercial RON95 gasoline was used) were practically the same.
Secondary current measurements featured an accuracy of ±1% and were performed on a 50 Ohm resistance. The converted voltage signal was acquired using a device that featured an accuracy better than 2 μV at the ±10 V full scale. The data acquisition frequency was 50 kHz, equivalent to 0.48 and 0.62 deg crank angle resolution at the minimum and maximum engine speed of 4000 and 5200 rpm, respectively. In-cylinder pressure data was recorded with the same device as for secondary current traces and featured an accuracy of ±1% (given by the piezo-electric transducer and amplifier chain); the resolution was 0.5 deg. The charge amplifier was operated in cyclic reset mode and no pressure referencing was performed.
Besides the PCIe6361 (National Instruments) data acquisition card (DAQ) used for recording the secondary current and in-cylinder pressure traces, the PCI6143 board (National Instruments) was added for implementing the algorithm. The secondary current signal was routed to both DAQs, and the output of the algorithm was recorded with the PCIe6361 module.
Figure 2 shows the core of the LabVIEW code that was built as a virtual instrument (VI), with specific sub-components highlighted. Its basic operation entails reading an analog input (AI) channel and generating a square signal as a digital output (DO). The two tasks are running in parallel, and their synchronization is implemented through the flat sequence structure that contains the actual read and write components of the AI and DO tasks, respectively. This was necessary as the PCI6143 card can generate digital outputs only on demand (i.e., software timed). The user interface contains the stop button for ending the application, the enable/disable control that starts/ends the generation of the identification (ID) signal, a monitor for confirming synchronized data acquisition, as well as monitors for the odd/even state of the TDC ID, number of samples read each loop iteration, the shift with respect to the period between two spark events, and an XY graph that shows the acquired raw and filtered signals (a median filter with left/right ranks set at 2 was used for reducing noise effects, especially at the initiation of sparks).
The sample rate of the AI task was set at 50 kHz to ensure high enough accuracy of spark duration assessments and to allow engine crankshaft revolution velocity (rpm) measurements (e.g., the chosen frequency ensures an accuracy of around 0.2% at 6000 rpm). As a basic concept, the code starts with a certain number of samples N (shown as 10,000 in Figure 2) to be acquired each loop. The data analysis sub-VI identifies all the rising edges in the recorded waveform (with a threshold set at 0.1 V, equivalent to 2 mA secondary current [37]) and stores their index location in an array. If this array contains less than two locations, the number of samples is increased until meeting this condition; if instead the number is larger or equal to 2, then N is simply set at twice the period between the first two index locations; this new value is to be used for the next loop of data acquisition. This operation occurs within the synchronization sub-VI that also calculates a shift, taken as the difference between the first index and 1/4 the total number of samples. The data acquisition sequence starts with 1/4·N − 1 samples, continues with 1/2·N samples, during which the DO channel stays in the true/false state (depending on the odd/even value stored as the shift register), and ends with 1/4·N samples, during which the DO is switched to the false/true state, respectively. These samples constitute the waveform (built with the Append waveform function) that is analyzed for transferring the synchronization data required for the next loop. Additional samples (a minimum of 1 point) are acquired (but not recorded) for compensating for the shift calculated as previously described.
Besides the synchronization part, the data analysis sub-VI also outputs the duration of the two spark events it identifies each loop. Depending on the method used for TDC ID, these two durations are used directly or accumulated in an array, by replacing two out of the 200 values contained in the array. Three different operating modes were defined for the spark duration method: median, odd/even, and distribution evaluation. The first is basically the same as the previous study [37], but applied as an online evaluation; it simply compares the single spark duration with the median value of 200 events and classifies the first spark (of the two recorded during the loop) as below or above the median. The second mode compares the two spark events and assigns the shorter one as the firing TDC marker (thus the odd/even denomination). The third instead continuously evaluates the array that contains 200 spark durations and divides the odd and even events as below or above the median to impose the sequence of true/false or false/true to be written within the DO task.
Figure 3 illustrates average traces obtained with the third mode of operation that continuously evaluates the odd/even condition but requires 200 spark events to function correctly (and therefore does not feature true cycle-to-cycle capabilities). One immediate observation is that the spark ID trace is not a true square waveform signal. This is due to the fact that the graphs contain traces averaged over 200 consecutive cycles; even if cycle-by-cycle, the DO is a series of sharp rising and falling edges, the average clearly shows a jitter caused by the software. One reason for the jitter is the mode in which synchronization was achieved (i.e., by changing the number of acquired samples rather than true synchronous acquisition by using an external clock), and therefore, a certain shift is to be expected. Another reason is that as previously iterated, the PCI6143 card allows only on demand DO write actions, and therefore, depends directly on the actual CPU runtime. Nonetheless, the signal generated in this way was considered as more than sufficient for the purpose of the current work, i.e., to evaluate online firing TDC ID capabilities. To render the correlation between spark ID and in-cylinder pressure even more reliable, the integration window was limited to the −270..−90 deg aTDC crank angle range during the intake-compression strokes and to 0..180 deg aTDC interval during expansion-exhaust.
The data shown in Figure 3 for the two load points clearly illustrates that when correctly identified, the low side of the TDC ID signal is correlated with low in-cylinder pressure (below 1 bar), while its high side to increased pressure (between 1 and 5 bar for the idling condition and in the range of 2.30 bar at full load). It should be noted that compared to the previous study, no intake pressure data was available (and pressure pegging was simply set by taking the late part of the exhaust stroke, i.e., 270..360 deg aTDC, as 1 bar reference point), and therefore, absolute pressure features lower accuracy, but for the scope of the work it was considered as sufficient.
The 1.0 kW condition also shows a quite evident reduction of the spark duration during compression compared to the exhaust stroke (less evident for the idle point), which is the basis for the spark duration measurement method [37]. The actual duration was taken as the time period between the rising edge of the secondary current signal and the point when it falls below a certain value; this threshold was set at 0.1 V for both markers, equivalent to 2 mA secondary current for the present setup.
A similar principle was applied for measuring engine speed; the rpm method is based on the fact that during compression, the crankshaft velocity decreases, while during expansion, it increases due to the work performed by the expanding gas. It is well established in automotive applications [38] and can be successfully used for identifying several unwanted phenomena such as misfires [39], knocking [18], or even for reconstructing the in-cylinder pressure trace [40,41,42]. As a guiding principle, the same signal employed for spark duration evaluations was used for rpm measurements (i.e., the secondary current trace was used for measuring odd/even turns duration during each cycle) to ensure direct comparison with the developed method. Two modes were implemented: median and odd/even, with the same meaning as that previously described.
As already mentioned, data acquisition with the PCIe6363 DAQ was performed with a 0.5 deg crank angle resolution. In-cylinder pressure, secondary current, and spark ID signals were recorded during 200 consecutive cycles, with each set repeated five times. This totaled 1000 cycles for each load point, i.e., 0.0 kW at 4000 rpm, 0.3 kW at 4000 rpm, 0.5 kW at 4200 rpm, 0.8 kW at 4700 rpm, and 1.0 kW at 5200 rpm. As detailed in [37], the power-unit featured an inverter that allowed variable engine speed, depending on the electric load applied to the generator.
3. Results and Discussion
As an initial step, all four methods (i.e., rpm and spark duration, each in median and odd/even mode) were investigated at the outliers of the engine load range: idle (0.0 kW electric load, with the engine running at 4000 rpm) and full load (1.0 kW, at 5200 rpm). Once the methods that feature true cycle-to-cycle capabilities were identified, they were compared for all five load points that were investigated. Engine load was characterized by 1.35, 3.19, 4.74, 6.06, and 6.64 bar indicating the mean effective pressure (IMEP), with a coefficient of variation (COV) of 27.55, 5.32, 2.07, 1.82, and 1.49%, respectively for 0.0, 0.3, 0.5, 0.8, and 1.0 kW generator output.
The rpm-based method was taken as the benchmark, as it is often employed for indirect diagnostic (reduced hardware requirements). The peculiarity of its application in the current study is that only one point per turn is available for measuring rpm, i.e., each time a spark occurs. The spark duration method was developed by considering the observations found in [37] and improving its applicability by adding cycle-to-cycle capabilities.
One possible issue that was considered is that noise could affect evaluations. Figure 4 shows raw in-cylinder pressure and secondary current traces recorded during two consecutive cycles. There is an evident effect of noise at the point of ignition for the trace acquired during the 5th cycle. Applying linear interpolation for identifying the 2-mA threshold causes a slight overestimation of the spark duration by approximately 16 µs, even if the event is practically the same in terms of duration for both cycles. Nonetheless, the actual difference in the result is within the resolution of the measurement (20 µs at an acquisition frequency of 50 kHz), and therefore, no significant influence was exerted by signal noise. A median filter with a 5-point integration window was applied in the LabVIEW VI for further reduction of this effect.
3.1. Comparison of Different Evaluation Modes
The development phase of the spark duration method revealed that there is a certain distribution of duration that allows identifying the firing TDC by simply acquiring a set of 200 consecutive cycles, finding the median value, and using it as the threshold [37]. More to the point, spark events during compression tend to be shorter (and therefore below the threshold), while ‘wasted’ sparks are longer (and above the median threshold). A similar approach was implemented for the rpm method, meaning that engine speed tends to be lower during intake-compression, while the contrary is true during expansion-exhaust.
Figure 5 and Figure 6 show the results of applying the rpm and spark duration methods in the ‘median’ mode (the points are in-cylinder pressure-ID signal pairs obtained by integrating the two traces during the windows indicated in Figure 3). An evident observation is that in idle conditions, the spark duration method provides much better results. Indeed, the rpm method featured over 24% ‘false IDs’. This was actually found to be correlated with the fact that engine speed was not that stable in this condition; COVrpm was close to 0.3%. At first glance this value seems to be relatively low (values as high as 1% are not uncommon for such smalls size power units [43]), but when comparing it to the COV of around 0.15% recorded at the 1.0 kW load, it becomes evident that there is a significant difference. This practically meant that a large portion of the recorded cycles featured an average rpm below the threshold and the corresponding expansion-exhaust strokes were erroneously identified as intake-compression events, given that their rpm was below the median value.
The contrary was found for the full load condition, for which the count of false IDs was 0.1% when using the rpm-based method and 2.1% for the spark duration procedure. This is the result of improved engine speed stability (due to higher combustion repeatability, as well as the fact that engine speed increased from 4000 to 5200 rpm, thus resulting in better distinction between intake-compression and expansion-exhaust strokes), and on the other hand, in more extensive effects of turbulence on spark duration (thus yielding wider dispersion of the spark parameter).
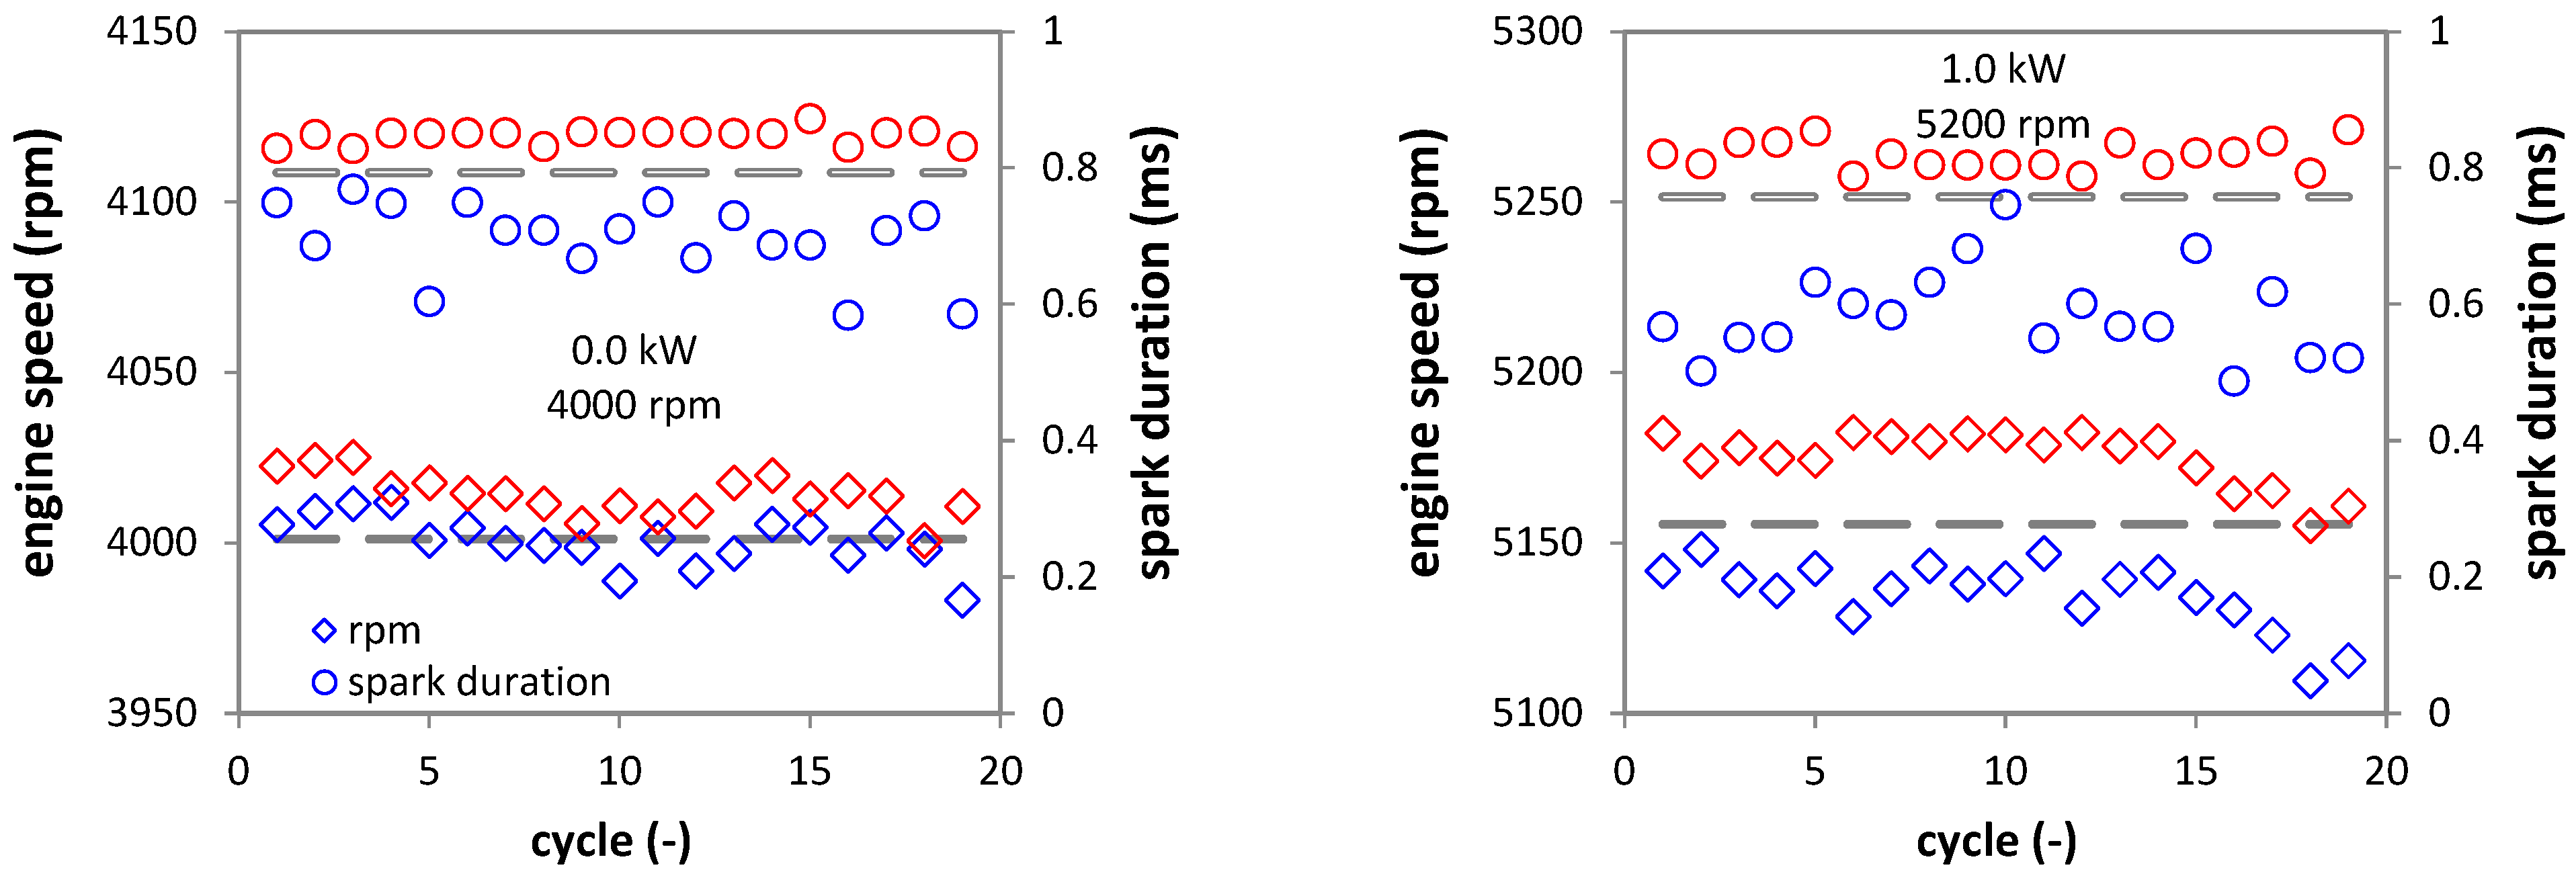
Nonetheless, one of the main conclusions is that neither of the two methods can be used as true cycle-to-cycle evaluation methods. Even if its application is relatively straight-forward (setting a threshold once the median value is identified), it still requires a set of certain number of cycles to be recorded (the larger the number, the more the threshold is statistically robust) and may not give the intended results in certain operating conditions (e.g., high COVrpm or increased turbulence). For this reason, an alternative approach was considered. Figure 7 shows the intake-compression/expansion-exhaust rpm and spark duration recorded during a sequence of 20 consecutive cycles (please note that at the 1.0 kW load, the actual average engine was slightly over 5150 rpm, but for easier identification, the 5200-rpm denomination was preferred). Two values are shown for each cycle (odd/even), and it is quite evident that for both cases, there is a high/low rpm and spark duration. This is true for all 20 cycles, even if the median threshold (shown as dashed lines) does not clearly divide the two categories, especially at 4000 rpm (further highlighting the reason behind the distribution observed in Figure 5). Slightly wider dispersion of compression sparks is also evident (emphasizing the explanation previously iterated for the results illustrated in Figure 6).
Based on these observations, it was inferred that working on an odd/even turn basis could provide the cycle-to-cycle capability with increased reliability. More to the point, a simple condition of rpmi > rpmi−1 and sparkdurationi < sparkdurationi−1 could be implemented to correctly identify the firing TDC as event i, without the need for acquiring a certain sequence of cycles and performing a statistical analysis.
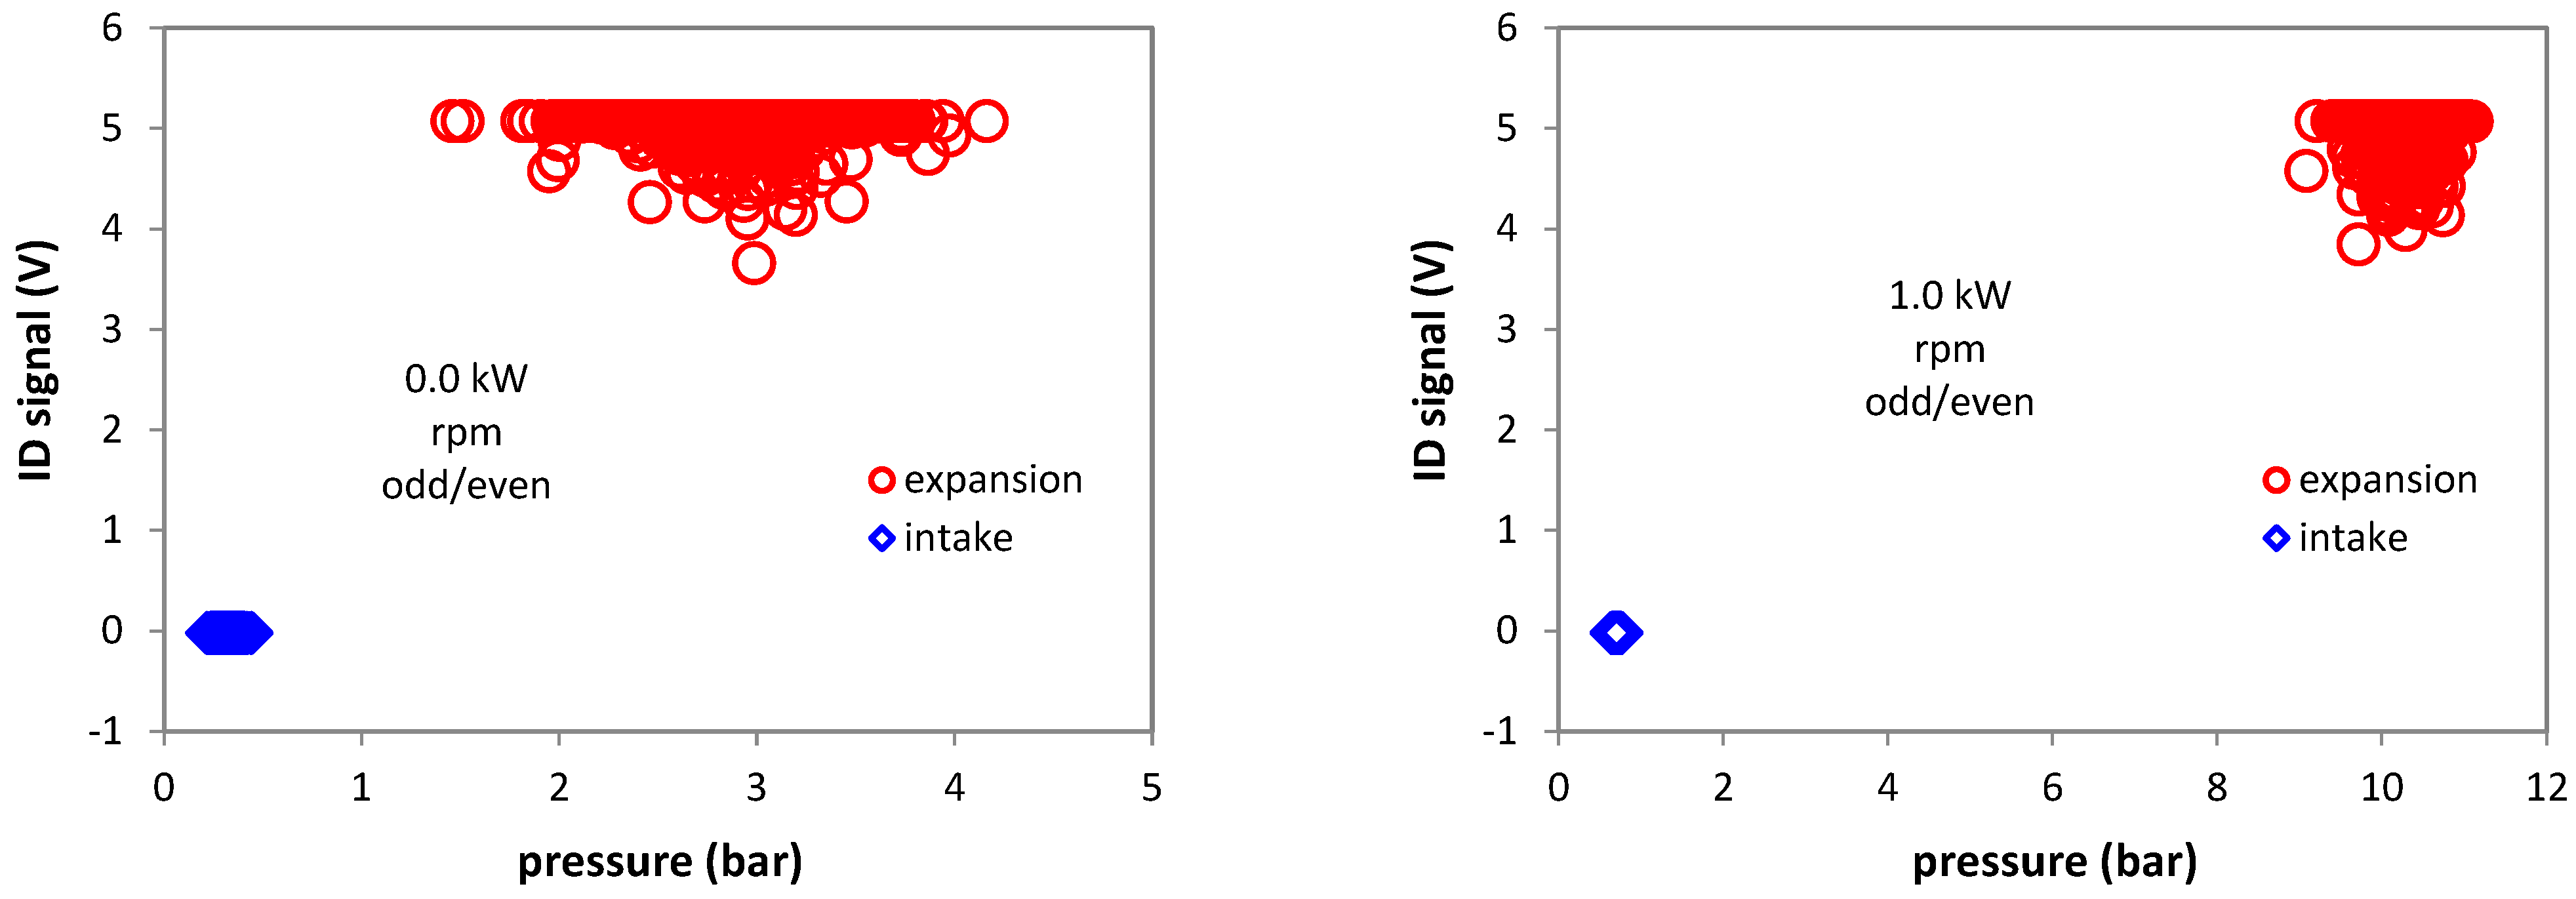
Figure 8 and Figure 9 show the results obtained by applying this odd/even approach for 0.0 kW and 1.0 kW load. It is immediately evident that the distribution is much more favorable, with the rpm method showing 100% reliability for the 1000 cycles recorded for each condition; the spark duration method showed only 0.2% false IDs (two points in total, observed at 1.0 kW).
As an overall conclusion, it can be stated that the odd/even modes of applying both methods have good potential to ensure the correct TDC ID, with cycle-to-cycle capability.
3.2. Overall Performance of Odd/Even Evaluations and Low Sample Rate Effects
Given the results found in the previous sub-section, the two methods (rpm and spark duration) were implemented and scrutinized for all five load points. Only the overall rate of successful firing TDC ID will be discussed, without showing detailed results in terms of distribution. Figure 10 shows the results obtained by applying the rpm and spark duration-based methods. An excellent performance was recorded for the first procedure, with 100% reliability when evaluating firing TDC phasing based on measured rpm. Directly comparable results were also obtained with the spark duration method as well, with the lowest success rate at 99.8%. This translates in only two false IDs in a set of 1000 cycles. When hypothesizing port fuel injection control as in [37], this would mean that the benefits of phased fuel delivery would only be lost for two cycles out of 1000. This does not mean, however, that these two cycles would misfire (injection would still occur, but during the ‘other’ crankshaft turn, total injection time permitting), and therefore, for fuels such as gasoline, it would be of no real influence. For other energy sources, such as hydrogen, it could lead to backfire phenomena [35]. Further development to include fuels with such different properties with respect to gasoline could be an interesting line of research; the fact that H2 features much lower ignition energy may result in lower coil charge (and spark duration), and therefore, certain applicative aspects of the algorithm may have to be adjusted. Nonetheless, actual applicability should not be significantly influenced by fuel properties.
At a first glance, it would seem that the best option is to choose the rpm-based method. In the odd/even mode, it ensured 100% successful detection of the firing TDC for all five load points that were investigated. One possible drawback is that it requires high sampling rate for correct measurements. At 5200 rpm, the 50 kHz rate ensures an accuracy better than 0.17%, translated into a sensitivity of detecting engine speed variations of around 10 rpm; if instead a sample rate of 10 kHz would be used (still relatively high, but comparable to that usually obtained with a 58/60 tooth crank gear sensor at 6000 rpm), the sensitivity would be around 45 rpm. This would be at the very limit when considering the in-cycle rpm variation shown in Figure 7 at the 1.0 kW load; things would be even worse for the idle case, for which an achievable sensitivity of over 26 rpm would completely miss a large part of variations recorded at 4000 rpm.
For this reason, it was decided to test whether the spark duration method could work with lower sampling rate, such as 10 kHz. Figure 11 illustrates the difficulty of actually implementing duration measurements with such a low readout frequency (acquisition points are highlighted with cross symbols; they were randomly distributed to emphasize the effect of time-based data acquisition). Indeed, even with interpolation, the starting point of the spark event would be difficult to be determined; things are even worse as engine speed increases (note the wider crank angle spacing between 10 kHz symbols).
On the other hand, the specific triangle shape of the secondary current during spark discharge can be correlated to the actual duration of the event. More to the point, short sparks will feature a steeper slope of the falling current profile. In this way, the odd/even sparks can be compared by reading the index location and the value of two points and then calculating the correlated slope. As shown in Figure 11, the third point after the instance in which the secondary current exceeds 2 mA was chosen as the first reference for the slope (to make sure it will read the falling side), while the second location was taken after another four acquired samples. Figure 12 shows the overall success rates in identifying the firing TDC. For the three load points up to 0.5 kW, 100% was ensured; over this threshold, the percentage quickly dropped, as the sample rate did not ensure accurate results. Attempts were made to change the combination of the 1st and 2nd reference points, but results did not improve significantly. Nonetheless, given the fact that calculating the slope ensured good results for three out of the five load points with a 5-fold lower sampling rate could be an important advantage compared to the rpm method. Actual optimization of the sample rate with respect to rpm would also be an interesting line of development for the new method.
One other advantage of the spark duration method is that it can provide additional information with respect to rpm. A previous study demonstrated the capability of evaluating in-cylinder flow velocity based on spark duration measurements [44], and even if it can be applied only at a single point in the combustion chamber, it can ensure a valuable background for improving combustion control margins.
4. Conclusions
Spark duration measurements were applied for identifying the firing TDC in small size SI engines that feature ‘wasted’ spark ignition systems. Engine speed-based evaluations were taken as the benchmark for validating the proposed approach.
Implementing the simple condition of above/below a median threshold developed in a previous study, with data analysis of samples acquired at 50 kHz, was found to be compatible only with long term ID, i.e., after acquiring a certain number of cycles. The spark duration method performed better at low load and engine speed, while the rpm-based method ensured slightly better results at high load.
A new procedure was developed and implemented by running the analysis in odd/even mode to render it compatible with online determinations. One of the main conclusions was that the spark duration method can be applied as a cycle-to-cycle evaluation tool with TDC ID success rates of over 99.8%. While not as accurate as physical sensors (e.g., a camshaft position sensor), this value suggests very high reliability and is directly comparable with that obtained by implementing rpm based evaluations.
Furthermore, the spark duration procedure was found to be more reliable when performing measurements with much lower sample rates of 10 kHz. In addition to the main goal of correctly identifying the firing TDC, the new method can also be implemented for evaluating cycle-to-cycle variability of the local in-cylinder fluid velocity and thus further enhancing combustion control margins. Future efforts will focus on the development and implementation of a LabVIEW VI that merges the two benefits derived from spark duration measurements.
Author Contributions
Conceptualization, A.I. and S.S.M.; methodology, A.I.; software, A.I.; validation, A.I. and S.S.M.; formal analysis, A.I.; investigation, A.I.; data curation, A.I.; writing—original draft preparation, A.I.; writing—review and editing, A.I. and S.S.M.; visualization, A.I.; supervision, B.M.V. All authors have read and agreed to the published version of the manuscript.
Funding
This research received no external funding.
Data Availability Statement
Data is available upon request.
Acknowledgments
The help of Carlo Rossi with the engine setup and Antonio Rossi with the electrical setup is gratefully acknowledged.
Conflicts of Interest
The authors declare no conflict of interest.
References
- Gawusu, S.; Mensah, R.A.; Das, O. Exploring distributed energy generation for sustainable development: A data mining approach. J. Energy Storage 2022, 48, 104018. [Google Scholar] [CrossRef]
- Rafał, K.; Biskupski, J.; Bykuć, S.; Chaja, P. Dynamic Voltage Regulation and Unbalance Compensation in a Low-Voltage Distribution Network Using Energy Storage System. Appl. Sci. 2022, 12, 11678. [Google Scholar] [CrossRef]
- Yip, H.L.; Srna, A.; Yuen, A.C.Y.; Kook, S.; Taylor, R.A.; Yeoh, G.H.; Medwell, P.R.; Chan, Q.N. A Review of Hydrogen Direct Injection for Internal Combustion Engines: Towards Carbon-Free Combustion. Appl. Sci. 2019, 9, 4842. [Google Scholar] [CrossRef] [Green Version]
- Beeker, J.; Sacchi, M. Engine Controller Design for Small Engine Mass Production; SAE Technical Paper 2010-32-0118; SAE International: Pittsburgh, PA, USA, 2010. [Google Scholar] [CrossRef]
- Takano, Y.; Utsugi, K.; Sakaguchi, K.; Onishi, K. Development of Intake Air Pressure Sensorless Fuel Injection System for Small Motorcycles; SAE Technical Paper 2011-32-0564; SAE International: Pittsburgh, PA, USA, 2011. [Google Scholar] [CrossRef]
- Steinbrecher, C.; Reineke, B.; Berkemer, J.; Heikes, H.; Fischer, W. Online Engine Speed Based Adaptation of Air Charge for Two-Wheelers. SAE Int. J. Engines 2013, 6, 2085–2091. [Google Scholar] [CrossRef]
- Sugimoto, K. Transient Correction by Manifold Pressure in a TPS-Free FI System; SAE Technical Paper 2014-32-0072; SAE International: Pittsburgh, PA, USA, 2014. [Google Scholar] [CrossRef]
- Razali Hanipah, M.; Adham Rosli, M.H.; Razul Razali, A. Flexible Valve Timing Strategies for Boosting a Small Four-Stroke Spark Ignition Engine Performance; SAE Technical Paper 2019-32-0591; SAE International: Pittsburgh, PA, USA, 2020. [Google Scholar]
- Tito, N.; Keerthi, G.; Balasubramanian, N.; Tnc, A. New Concept PFI-Atomizer Fueling System in a Small Single Cylinder SI Engine; SAE Technical Paper 2020-01-2233; SAE International: Pittsburgh, PA, USA, 2020. [Google Scholar] [CrossRef]
- Gimelli, A.; Muccillo, M. Development of a 1 kW Micro-Polygeneration System Fueled by Natural Gas for Single-Family Users. Energies 2021, 14, 8372. [Google Scholar] [CrossRef]
- Balduzzi, F.; Romani, L.; Bosi, L.; Ferrara, G. Intermittent Injection for a Two-Stroke Direct Injection Engine. SAE Int. J. Adv. Curr. Prac. Mobility 2020, 2, 1013–1021. [Google Scholar]
- Sato, H.; Torigoshi, M.; Takase, H.; Makita, N. Feasibility study of boosted DI technology for sport motorcycle. In Proceedings of the 26th Small Powertrains and Energy Systems Technology Conference, Himeji, Hyogo, Japan, 31 October–3 November 2022. SAE Technical Paper 2022-32-0079. [Google Scholar]
- Zander, L.; Dahlander, P. Analysis of a Turbocharged Single-Cylinder Two-Stroke SI Engine Concept; SAE Technical Paper 2021-01-0642; SAE International: Pittsburgh, PA, USA, 2021. [Google Scholar] [CrossRef]
- Galindo, J.; Climent, H.; de la Morena, J.; González-Domínguez, D.; Guilain, S.; Besançon, T. Compressor Surge Mitigation in Turbocharged Spark-Ignition Engines without an Anti-Surge Control System during Load-Decrease Operation. Appl. Sci. 2022, 12, 1751. [Google Scholar] [CrossRef]
- Gitano, H.; Chim, R.; Loh, J. The Application of a Resistive Type O2 Sensor to a Small Engine EFI System; SAE Technical Paper 2014-32-0073; SAE International: Pittsburgh, PA, USA, 2014. [Google Scholar] [CrossRef]
- Satyanarayana, P.; Loganathan, B.; Lakshminarasimhan, V.; Ramesh, A. Sujatha, S. Development of a Cam Phaser System to Improve the Performance of a Small Engine. SAE Int. J. Engines 2015, 8, 250–257. [Google Scholar] [CrossRef]
- Basso, R.; Gruber, G.; Piecha, P.; Schacht, H.; Schmidt, S.; Arenz, M. Ion Current Comparison in Small, Fast Running Gasoline Engines for Non-Automotive Applications; SAE Technical Paper 2018-32-0077; SAE International: Pittsburgh, PA, USA, 2018. [Google Scholar] [CrossRef]
- Bhaskar, K.; Jose, J.; Mittal, M.; Ramesh, A. Detection of Engine Knock Using Speed Oscillations in a Single-Cylinder Spark-Ignition Engine; SAE Technical Paper 2019-01-2206; SAE International: Pittsburgh, PA, USA, 2019. [Google Scholar] [CrossRef]
- Bagade, M.; Das, H.; Raveendranath Sr, A.; Jabez Dhinagar, S. A Novel Design of Engine Misfire Detection System Suitable for Small Capacity S.I. Engine for Two Wheeled Vehicle; SAE Technical Paper 2020-01-0267; SAE International: Pittsburgh, PA, USA, 2020. [Google Scholar] [CrossRef]
- Nilsson, Y.; Eriksson, L. Determining TDC Position Using Symmetry and Other Methods; SAE Technical Paper 2004-01-1458; SAE International: Pittsburgh, PA, USA, 2004. [Google Scholar] [CrossRef]
- Eriksson, L.; Thomasson, A. Cylinder state estimation from measured cylinder pressure traces–A Survey. IFAC-PapersOnLine 2017, 50, 11029–11039. [Google Scholar] [CrossRef]
- Lodi, F.; Jafari, M.; Brown, R.; Bodisco, T. Statistical Analysis of the Results Obtained by Thermodynamic Methods for the Determination of TDC Offset in an Internal Combustion Engine; SAE Technical Paper 2020-01-1350; SAE International: Pittsburgh, PA, USA, 2020. [Google Scholar] [CrossRef]
- Beik, Y.; Dziewiątkowski, M.; Szpica, D. Exhaust Emissions of an Engine Fuelled by Petrol and Liquefied Petroleum Gas with Control Algorithm Adjustment. SAE Int. J. Engines 2020, 13, 739–759. [Google Scholar] [CrossRef]
- Norppa, E.M.; Tkaczyk, R.J. Engine Cycle Identification from Engine Speed. US Patent US5562082A, 1995. [Google Scholar]
- Gonzales, F., Jr.; Mingo, P.; Zhang, X. System and Method for Starting Sequential Injection Internal Combustion Engine. Ford Global Technologies LLC. US Patent US 2006/0086341 A1, 2006. [Google Scholar]
- Soudagar, M.E.M.; Nik-Ghazali, N.N.; Kalam, M.A.; Badruddin, I.A.; Banapurmath, N.R.; Yunus Khan, T.M.; Bashir, N.M.; Akram, N.; Farade, R.; Afzal, A. The effects of graphene oxide nanoparticle additive stably dispersed in dairy scum oil biodiesel-diesel fuel blend on CI engine: Performance, emission and combustion characteristics. Fuel 2019, 257, 116015. [Google Scholar] [CrossRef]
- Soudagar, M.E.M.; Banapurmath, N.R.; Afzal, A.; Hossain, N.; Abbas, M.M.; Mhd Haniffa, M.A.C.; Ahmed, W.; Nizamuddin, S.; Mubarak, N.M. Study of diesel engine characteristics by adding nanosized zinc oxide and diethyl ether additives in Mahua biodiesel–diesel fuel blend. Sci. Rep. 2020, 10, 15326. [Google Scholar] [CrossRef]
- Soudagar, M.E.M.; Afzal, A.; Safaei, M.R.; Manokar, A.M.; El-Seesy, A.I.; Mujtaba, M.A.; Samuel, O.D.; Badruddin, I.A.; Ahmed, W.; Shahapurkar, K.; et al. Investigation on the effect of cottonseed oil blended with different percentages of octanol and suspended MWCNT nanoparticles on diesel engine characteristics. J. Therm Anal. Calorim. 2022, 147, 525–542. [Google Scholar] [CrossRef]
- Batalha, G.P.; Schmidt, S.; Kirchberger, R. Impacts of methanol blended fuels on emissions and operating performance of two-wheelers. In Proceedings of the 26th Small Powertrains and Energy Systems Technology Conference, Himeji, Hyogo, Japan, 31 October–3 November 2022. SAE Technical Paper 2022-32-0021. [Google Scholar]
- Koshikawa, S.; Matsumura, E.; Senda, J. Effect of Blended Fuel of Hydrotreated Vegetable Oil and Fatty Acid Methyl Ester on Spray and Combustion Characteristics. In Proceedings of the 26th Small Powertrains and Energy Systems Technology Conference, Himeji, Hyogo, Japan, 31 October–3 November 2022. SAE Technical Paper 2022-32-0073. [Google Scholar]
- Gschanes, D.; Schmidt, S.; Kirchberger, R. Impact of Zero CO2 Fuels on Engine Behaviour of Two-Stroke Engines in Hand-Held Powertools. In Proceedings of the 26th Small Powertrains and Energy Systems Technology Conference, Himeji, Hyogo, Japan, 31 October–3 November 2022. SAE Technical Paper 2022-32-0061. [Google Scholar]
- Warguła, Ł.; Kukla, M.; Lijewski, P.; Dobrzyński, M.; Markiewicz, F. Impact of Compressed Natural Gas (CNG) Fuel Systems in Small Engine Wood Chippers on Exhaust Emissions and Fuel Consumption. Energies 2020, 13, 6709. [Google Scholar] [CrossRef]
- Caligiuri, C.; Žvar Baškovič, U.; Renzi, M.; Seljak, T.; Oprešnik, S.R.; Baratieri, M.; Katrašnik, T. Complementing Syngas with Natural Gas in Spark Ignition Engines for Power Production: Effects on Emissions and Combustion. Energies 2021, 14, 3688. [Google Scholar] [CrossRef]
- Indrawan, N.; Thapa, S.; Bhoi, P.R.; Huhnke, R.L.; Kumar, A. Engine power generation and emission performance of syngas generated from low-density biomass. Energ. Convers. Manage. 2017, 148, 593–603. [Google Scholar] [CrossRef]
- Irimescu, A.; Vaglieco, B.; Merola, S.S.; Zollo, V.; De Marinis, R. Conversion of a Small Size Passenger Car to Hydrogen Fueling: Focus on Rated Power and Injection Phasing Effects; SAE Technical Paper 2022-24-0031; SAE International: Pittsburgh, PA, USA, 2022. [Google Scholar] [CrossRef]
- Koshikawa, S.; Matsuy, Y.; Sekine, T.; Matsumura, E.; Senda, J.; Morita, G.; Nakazono, T. Effect of Different Fuel Supply System on Combustion Characteristics in Hydrogen SI Engine. In Proceedings of the 26th Small Powertrains and Energy Systems Technology Conference, Himeji, Hyogo, Japan, 31 October–3 November 2022. SAE Technical Paper 2022-32-0092. [Google Scholar]
- Irimescu, A.; Cecere, G.; Merola, S.S. Wasted spark duration measurement as a method for firing TDC identification in small engines. In Proceedings of the 26th Small Powertrains and Energy Systems Technology Conference, Himeji, Hyogo, Japan, 31 October–3 November 2022. SAE Technical Paper 2022-32-0009. [Google Scholar]
- Cavina, N.; Ponti, F. Engine torque nonuniformity evaluation using instantaneous crankshaft speed signal. J. Eng. Gas Turbines Power 2003, 125, 1050–1058. [Google Scholar] [CrossRef]
- Han, P. Tooth Time-Based Engine Misfire Detection Index for Multicylinder Engines of Vehicles Not Affected by Various Deviations between Cylinders. SAE Int. J. Engines 2022, 15, 413–426. [Google Scholar] [CrossRef]
- Wang, Q.; Sun, T.; Lyu, Z.; Gao, D. A Virtual In-Cylinder Pressure Sensor Based on EKF and Frequency-Amplitude-Modulation Fourier-Series Method. Sensors 2019, 19, 3122. [Google Scholar] [CrossRef]
- Bosi, L.; Catalani, I.; Baroni, A.; Romani, L.; Vichi, G.; Bellissima, A.; Asai, G.; Minamino, R.; Ferrara, G. Real Time Estimation of Combustion Indicators on a 4-Cylinder CI Turbocharged Engine Based on Instantaneous Engine Speed Measurement with Rapid Prototyping Implementation. J. Phys. Conf. Ser. 2022, 2385, 012083. [Google Scholar] [CrossRef]
- Dunne, J.F.; Bennett, C. A crank-kinematics-based engine cylinder pressure reconstruction model. Int. J. Engine Res. 2020, 21, 1147–1161. [Google Scholar] [CrossRef]
- Irimescu, A.; Vasiu, G.; Trif Tordai, G. Performance and emissions of a small scale generator powered by a spark ignition engine with adaptive fuel injection control. Appl. Energ. 2014, 121, 196–206. [Google Scholar] [CrossRef]
- Irimescu, A.; Merola, S.S.; Vaglieco, B.M. Spark anemometry applied through secondary current measurements in an optical spark ignition engine. Energ. Convers. Manag. 2022, 269, 116088. [Google Scholar] [CrossRef]
Figure 1.
Schematic illustration of the experimental setup and acquired/control signals.

Figure 2.
Schematic representation of the LabVIEW code.

Figure 3.
In–cylinder pressure, spark ID signal, and secondary current averaged over 200 consecutive cycles for idle (top) and full load (bottom) conditions.
Figure 3.
In–cylinder pressure, spark ID signal, and secondary current averaged over 200 consecutive cycles for idle (top) and full load (bottom) conditions.

Figure 4.
Raw signals acquired during two consecutive cycles at the 1.0 kW load.

Figure 5.
Distribution of the intake/expansion TDC ID signal and in–cylinder pressure for idle and full load conditions when employing the rpm method in median mode.
Figure 5.
Distribution of the intake/expansion TDC ID signal and in–cylinder pressure for idle and full load conditions when employing the rpm method in median mode.

Figure 6.
Distribution of the intake/expansion TDC ID signal and in–cylinder pressure for idle and full load conditions when employing the spark duration method in median mode.
Figure 6.
Distribution of the intake/expansion TDC ID signal and in–cylinder pressure for idle and full load conditions when employing the spark duration method in median mode.

Figure 7.
Series of odd/even turn-based rpm (diamond symbols) and spark duration (round symbols) values recorded during 20 consecutive cycles; median values (calculated based on the entire set of 200 cycles) are also shown with dashed lines.
Figure 7.
Series of odd/even turn-based rpm (diamond symbols) and spark duration (round symbols) values recorded during 20 consecutive cycles; median values (calculated based on the entire set of 200 cycles) are also shown with dashed lines.

Figure 8.
Distribution of the intake/expansion TDC ID signal and in–cylinder pressure for idle and full load conditions when employing the rpm method in odd/even mode.
Figure 8.
Distribution of the intake/expansion TDC ID signal and in–cylinder pressure for idle and full load conditions when employing the rpm method in odd/even mode.

Figure 9.
Distribution of the intake/expansion TDC ID signal and in–cylinder pressure for idle and full load conditions when employing the spark duration method in odd/even mode.
Figure 9.
Distribution of the intake/expansion TDC ID signal and in–cylinder pressure for idle and full load conditions when employing the spark duration method in odd/even mode.

Figure 10.
Success rate of firing TDC identification for the rpm and spark duration methods in odd/even mode.
Figure 10.
Success rate of firing TDC identification for the rpm and spark duration methods in odd/even mode.

Figure 11.
Illustration of sample rate effects on the points read during spark events.

Figure 12.
Success rate of firing TDC identification for the spark duration method in odd/even mode with two different sample rates.
Figure 12.
Success rate of firing TDC identification for the spark duration method in odd/even mode with two different sample rates.


Table 1.
Engine and generator specifications.
| Parameter | Description |
|---|---|
| Engine displacement | 50 cm3 |
| Bore × Stroke | 41.8 × 36 mm |
| Net power | 1.6 kW @ 7000 rpm |
| Compression ratio | 8 |
| Number of valves | 2 |
| Ignition | fixed 30 deg bTDC |
| Fuel system | carburetor |
| Generator rated voltage | 230 V at 50 Hz |
| Rated electric power | 0.9 kVA (1.0 kVA peak) |
| Voltage regulator | Inverter—throttle connection |
Disclaimer/Publisher’s Note: The statements, opinions and data contained in all publications are solely those of the individual author(s) and contributor(s) and not of MDPI and/or the editor(s). MDPI and/or the editor(s) disclaim responsibility for any injury to people or property resulting from any ideas, methods, instructions or products referred to in the content. |
© 2023 by the authors. Licensee MDPI, Basel, Switzerland. This article is an open access article distributed under the terms and conditions of the Creative Commons Attribution (CC BY) license (https://creativecommons.org/licenses/by/4.0/).
Share and Cite
MDPI and ACS Style
Irimescu, A.; Merola, S.S.; Vaglieco, B.M. Algorithm for Cycle-To-Cycle Firing TDC Identification Based on Wasted Spark Duration Measurements in Small Engines. Appl. Sci. 2023, 13, 1362. https://doi.org/10.3390/app13031362
AMA Style
Irimescu A, Merola SS, Vaglieco BM. Algorithm for Cycle-To-Cycle Firing TDC Identification Based on Wasted Spark Duration Measurements in Small Engines. Applied Sciences. 2023; 13(3):1362. https://doi.org/10.3390/app13031362
Chicago/Turabian StyleIrimescu, Adrian, Simona Silvia Merola, and Bianca Maria Vaglieco. 2023. "Algorithm for Cycle-To-Cycle Firing TDC Identification Based on Wasted Spark Duration Measurements in Small Engines" Applied Sciences 13, no. 3: 1362. https://doi.org/10.3390/app13031362
Note that from the first issue of 2016, this journal uses article numbers instead of page numbers. See further details here.