Article

Altered Mechano-Electrochemical Behavior of Articular Cartilage in Populations with Obesity

by
Sara Manzano
1,2,3,
Manuel Doblaré
1,2,3 and
Mohamed Hamdy Doweidar
1,2,3,*
1
Mechanical Engineering Department, School of Engineering and Architecture (EINA), University of Zaragoza, María de Luna s/n, Betancourt Building, 50018 Zaragoza, Spain
2
Aragón Institute of Engineering Research (I3A), University of Zaragoza, Zaragoza 50018, Spain
3
Biomedical Research Networking Center in Bioengineering, Biomaterials and Nanomedicine (CIBER-BBN), Zaragoza 50018, Spain
*
Author to whom correspondence should be addressed.
Appl. Sci. 2016, 6(7), 186; https://doi.org/10.3390/app6070186
Submission received: 11 May 2016 / Revised: 17 June 2016 / Accepted: 21 June 2016 / Published: 24 June 2016
(This article belongs to the Special Issue Dynamical Models of Biology and Medicine)

Abstract

:
Obesity, one of the major problems in modern society, adversely affects people’s health and increases the risk of suffering degeneration in supportive tissues such as cartilage, which loses its ability to support and distribute loads. However, no specific research regarding obesity-associated alterations in the mechano-electrochemical cartilage environment has been developed. Such studies could help us to understand the first signs of cartilage degeneration when body weight increases and to establish preventive treatments to avoid cartilage deterioration. In this work, a previous mechano-electrochemical computational model has been further developed and employed to analyze and quantify the effects of obesity on the articular cartilage of the femoral hip. A comparison between the obtained results of the healthy and osteoarthritic cartilage has been made. It shows that behavioral patterns of cartilage, such as ion fluxes and cation distribution, have considerable similarities with those obtained for the early stages of osteoarthritis. Thus, an increment in the outgoing ion fluxes is produced, resulting in lower cation concentrations in all the cartilage layers. These results suggest that people with obesity, i.e. a body mass index greater than 30 kg/m2, should undergo preventive treatments for osteoarthritis to avoid homeostatic alterations and, subsequent, tissue deterioration.

1. Introduction

In the last decade, obesity has become one of the most serious socioeconomic concerns in developed countries [1,2]. This medical problem is produced by a combination of several factors such as excessive food energy intake, lack of physical activity and/or genetic susceptibility [3,4,5]. As a result, an increase in the probability of suffering diseases such as osteoarthritis and bone degeneration has been reported [6,7,8]. In particular, overload on joints generates imbalance in tissue homeostasis [9,10]. This is mainly due to the increment of the force applied on articulations. In the case of normal weight, the applied force is three times the body weight. This force can reach six to ten times the body weight when performing activities such as climbing or running [11]. However, the transmitted force to joints in the case of people with obesity is doubled, generating excessive wear and leading to osteoarthritis [12].
Since articular cartilage is an avascular tissue, the transport of nutrients from synovial fluid to chondrocytes occurs by diffusion and convection when loading or when chemical conditions are changing [13,14,15]. In this sense, cartilage counts on biomolecules also called proteoglycans. They are responsible for the turgid nature of the tissue and provide the osmotic properties needed to resist compressive loads [16,17]. This occurs mainly as a consequence of the negative charges attached to them, fixed charge density. These negative charges provide a repulsive force that enhances the compressive stiffness of the cartilage [18].
Compression cycle due to body weight generates incoming and outgoing fluxes that helps in nutrients and wastes products exchange [11]. In the case of people with obesity, significant alterations are produced in water and ion fluxes as well as in tissue deformation. These fluxes are considered as essential biomarkers that indicate the degree of cartilage degeneration [19,20]. Therefore, the study of ion fluxes and tissue deformation may reveal alterations in the cartilage tissue.
Despite the great incidence of obesity, there are no exhaustive studies analyzing the correlation between alterations in the biological processes of cartilage and an increase in body weight. Only Travascio et al. [11] have addressed this issue. In their recent work, they describe several changes in protein synthesis and the subsequent reduction in extracellular matrix (ECM) production in hip articular cartilage. They studied these phenomena by means of a self-developed 1D model. However, important questions remain. How does obesity affect water and ion fluxes? Are these alterations a catalyst for osteoarthritis? Is the ion concentration in the tissue similar to that observed in people of normal weight? All these questions need to be addressed.
To analyze and elucidate tissue behavior under these conditions, a previously described 3D computational model of cartilage behavior [19,20,21] is here extended and employed to study the effects of overweight on the articular joints (Figure 1). The present model considers the influence of ions on electrochemical events as well as proteoglycan repulsion in a loaded 3D environment. The main goals of this study are: (i) to analyze the role of proteoglycan repulsion in the cartilage loading problem; (ii) to study the effect of metabolic alterations (fluxes of water and ions) due to obesity on the homeostasis of femoral hip cartilage; and (iii) to quantify and compare cation and water flux in cartilage of both healthy people and those suffering from obesity when a maximal load is applied on the joint.

2. Material and Methods

The main mathematical formulation of the present model is based on the triphasic theory for charged and hydrated soft tissues. This theory has been applied to simulate the behavior of articular cartilage [22,23]). As in our previous works and other related studies in the literature [19,20,24,25], the tissue is considered as a mixture in which four phases are distinguished: A negatively charged poroelastic solid phase including proteoglycans (s), an interstitial fluid phase which includes water (w), cations (+) and anions (−). The tissue behavior depends on the mechano-electrochemical interaction of these phases for cartilage maintenance (for more details see [10,20,26]. The four basic unknowns in this physico-mathematical model correspond to the displacement of the solid matrix, us, the chemical potential of the water, ε w , and the electrochemical potential of the cations and anions, ε + and ε respectively. The main model equations are summarized below.

2.1. Flow Equations

Outgoing and/or incoming water and ion fluxes are considered in the mathematical formulation through the mass balance equation for the total mixture and the charge balance for each ion. The main fluxes present in the model are water flux ( J w ), cation flux ( J + ) and anion flux ( J ). The flux equations are detailed below.
Mass balance of the mixture:
· v s + · J w = 0
Charge balance of ions:
( Φ w c + ) t + · J + diffusion   + · ( Φ w c + v s ) convection   = 0 ,
( Φ w c ) t + · J diffusion   + · ( Φ w c v s ) convection   = 0 ,
where v s = u s t is the velocity of each point of the solid matrix; c + and c are cation and anion concentrations, respectively; and Φ w is the porosity of the tissue [26]. Hereafter, the fluxes can be mathematically expressed as a function of the electrochemical potentials:
J w = R   T Φ w α ( ε w + c + ε + ε + + c ε ε )
J + = R   T Φ w c + α ε w [ Φ w c + D + ε + + R   T Φ w ( c + ) 2 α ε + ] ε + R   T Φ w c + c α ε + ε ,
J = R   T Φ w c α ε w [ Φ w c D ε + R   T Φ w ( c ) 2 α ε ] ε R   T Φ w c + c α ε + ε + ,
where α is the drag coefficient between the solid and the water phases; R is the universal gas constant; T is the absolute temperature; and D + and D are the cation and anion diffusivities, respectively [27]. The electrochemical potentials are defined as follows:
ε w = P R   T Φ ( c + + c ) + B w R   T θ ,
ε + = γ + c + e x p ( F c ψ R   T ) ,
ε = γ c e x p ( F c ψ R   T )
where Φ represents the osmotic coefficient, B w is the fluid-solid coupling coefficient, P is the fluid pressure, θ = d i v   u s is the expansion of the solid matrix related to the infinitesimal strain tensor of the solid matrix, F c is the Faraday constant and ψ the electrical potential. γ + and γ refer to the cation and anion activity coefficients, respectively.

2.2. Momentum Balance Equation of the Mixture

In contrast to our previous studies [19,20], the external force applied to the cartilage sample, f ext , is incorporated into the momentum balance equation to analyze the effect of maximal load on the joint as follows:
· σ σ f + σ c + σ s = f ext   ,
where σ f corresponds to the stress exerted by the fluid, σ c is the stress due to chemical factors such as proteoglycan repulsion and σ s is the stress of the solid matrix.
In cartilage tissue, the total stress, σ, can be mathematically formulated as a combination of the osmotic pressure and the elastic stress of the matrix:
σ = P I σ f osmotic pressure λ s θ I + 2 µ s ϵ σ s elastic stress T c I σ c c h e m i c a l   e x p a n s i o n ,
where I is the identity tensor. T c is the chemical expansion due to the proteoglycan repulsion phenomenon [20]. λ s   and µ s are the Lame constants and ϵ is the solid matrix deformation. Note that to accurately simulate obesity-associated alterations in cartilage behavior, the volumetric expansion due to proteoglycan-attached negative charges were introduced into the model formulation. Thus, T c can be expressed as a combination of: the proteoglycan repulsion coefficients, a 0 and k ; the ion activity coefficients during the process and at the reference estate, γ and γ * , respectively; and the neutral salt concentration, c .
T C = a 0 c F e x p ( k γ γ * ) c ( c + c F )
For more details, see [20,21].
This phenomenon is demonstrated to be essential for the swelling process when ion concentration variations are generated within the tissue [20,21].

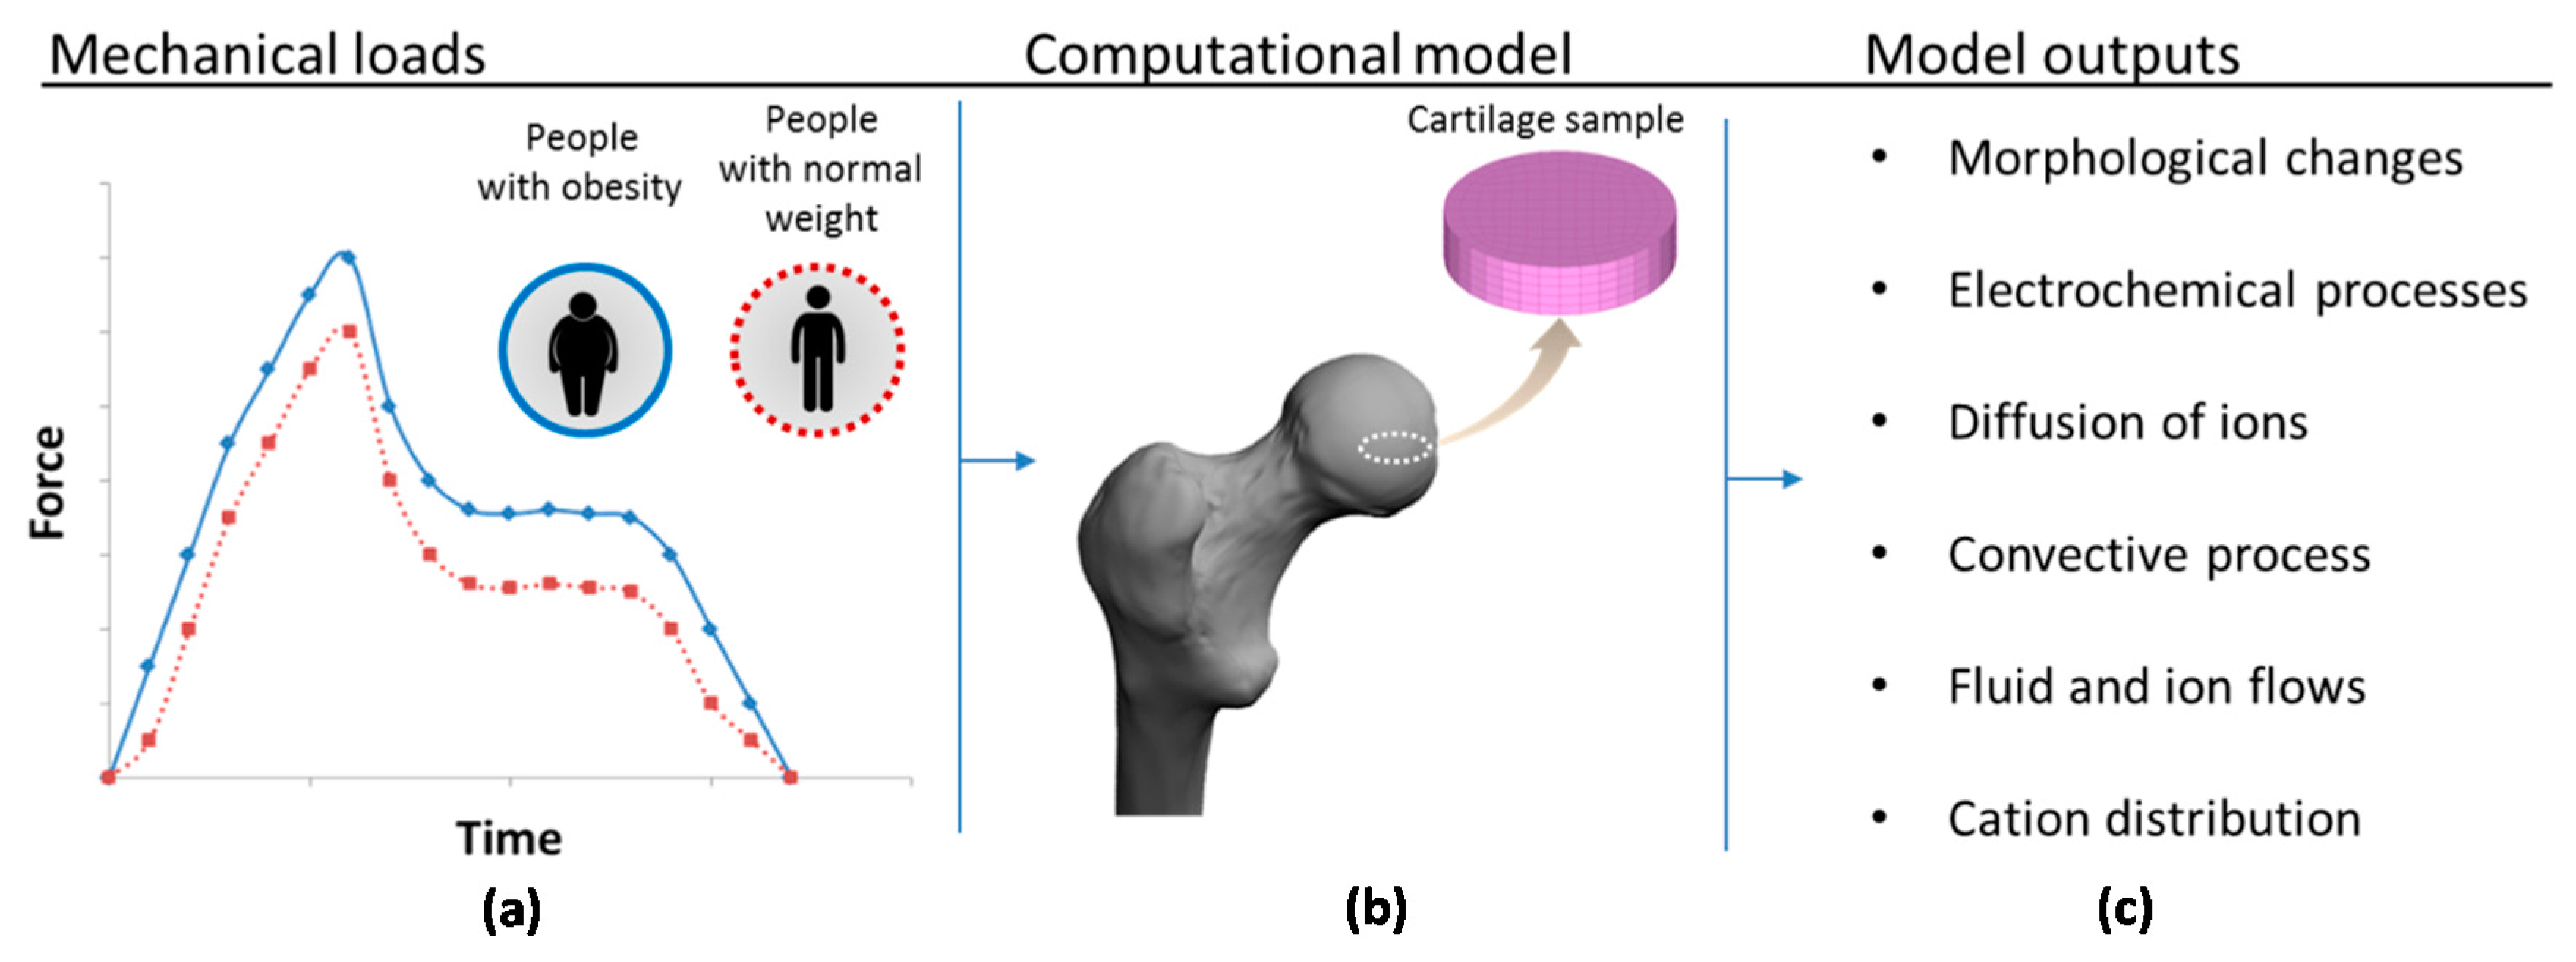
2.3. Simulation of the Articular Cartilage Behavior for People with Obesity

To study the effect of the variation of mechano-electrochemical parameters on cartilage behavior, the experimental design described by Lai et al. [21] is computationally reproduced. Thus, a cartilage specimen of 1.5 mm diameter and 0.5 mm depth is placed inside a circular impermeable confining ring and a loading permeable pattern is located at the top of the sample. Tissue samples are hydrated in NaCl solution of 0.15 M similar to the physiological state. Under these conditions, maximal compression loads relating to healthy people and people with obesity are applied on top of the sample. The applied pressure is that corresponding to the maximal pressure observed after 0.44 seconds of the human gait cycle. For the sake of simplicity, it is considered that, in later cycles, the tissue will exhibit similar behavior to that taken as a reference. The experimental data are extracted from [11]. Note that, for this study, they developed specific measurements in a total of 20 male subjects (10 normal and 10 obese) aged between eighteen and thirty-five volunteered for this study. Prior to experiments, anthropometric and body measurements were collected and recorded.
Clinical guidelines are established to evaluate the grade of obesity in adults by considering the Body Mass Index (BMI). This measure correlates the weight with the height of an adult to assess obesity. Thus, values of BMI between 18.5 and 24.9 kg/m2 represent a suitable weight for adults, whereas a BMI higher than 30 kg/m2 indicates obesity. In the model calculations, the applied force and subsequent pressure are extracted from [11] who consider two groups of study: people of normal weight, BMI = 22.262 1.172 kg/m2, and people with obesity, BMI = 33.978 3.629 kg/m2. The other cartilage properties introduced into the computational model are listed in Table 1.
Accurate quantifications of cation fluxes and distributions within the samples have been performed. Besides, monitoring of tissue changes during the loading processes was also carried out. Note that this model can be employed to study the cartilage behavior in function of the degree of obesity, how long an individual has been obese, co-morbidities, and sex of subjects. Besides, it can be a good tool to study specific cases such as normal and obese rats or rabbits. For all of these studies, experimental data are required to be carried out.
Three linear 8-node hexahedral elements with 2 × 2 × 2 Gaussian integration points are used. The selected average mesh has a total number of 1680 elements. Small-deformation finite element formulation, similar to previous articular cartilage models [11,22,28], has been implemented in a user defined element subroutine (UEL subroutine following Abaqus standard names) of the commercial software package Abaqus 6.11 (Dassault Systemes, Paris, France, 2016). The implementation scheme of the 3D mechano-electrochemical model used for the loading problem is shown in Figure 2.

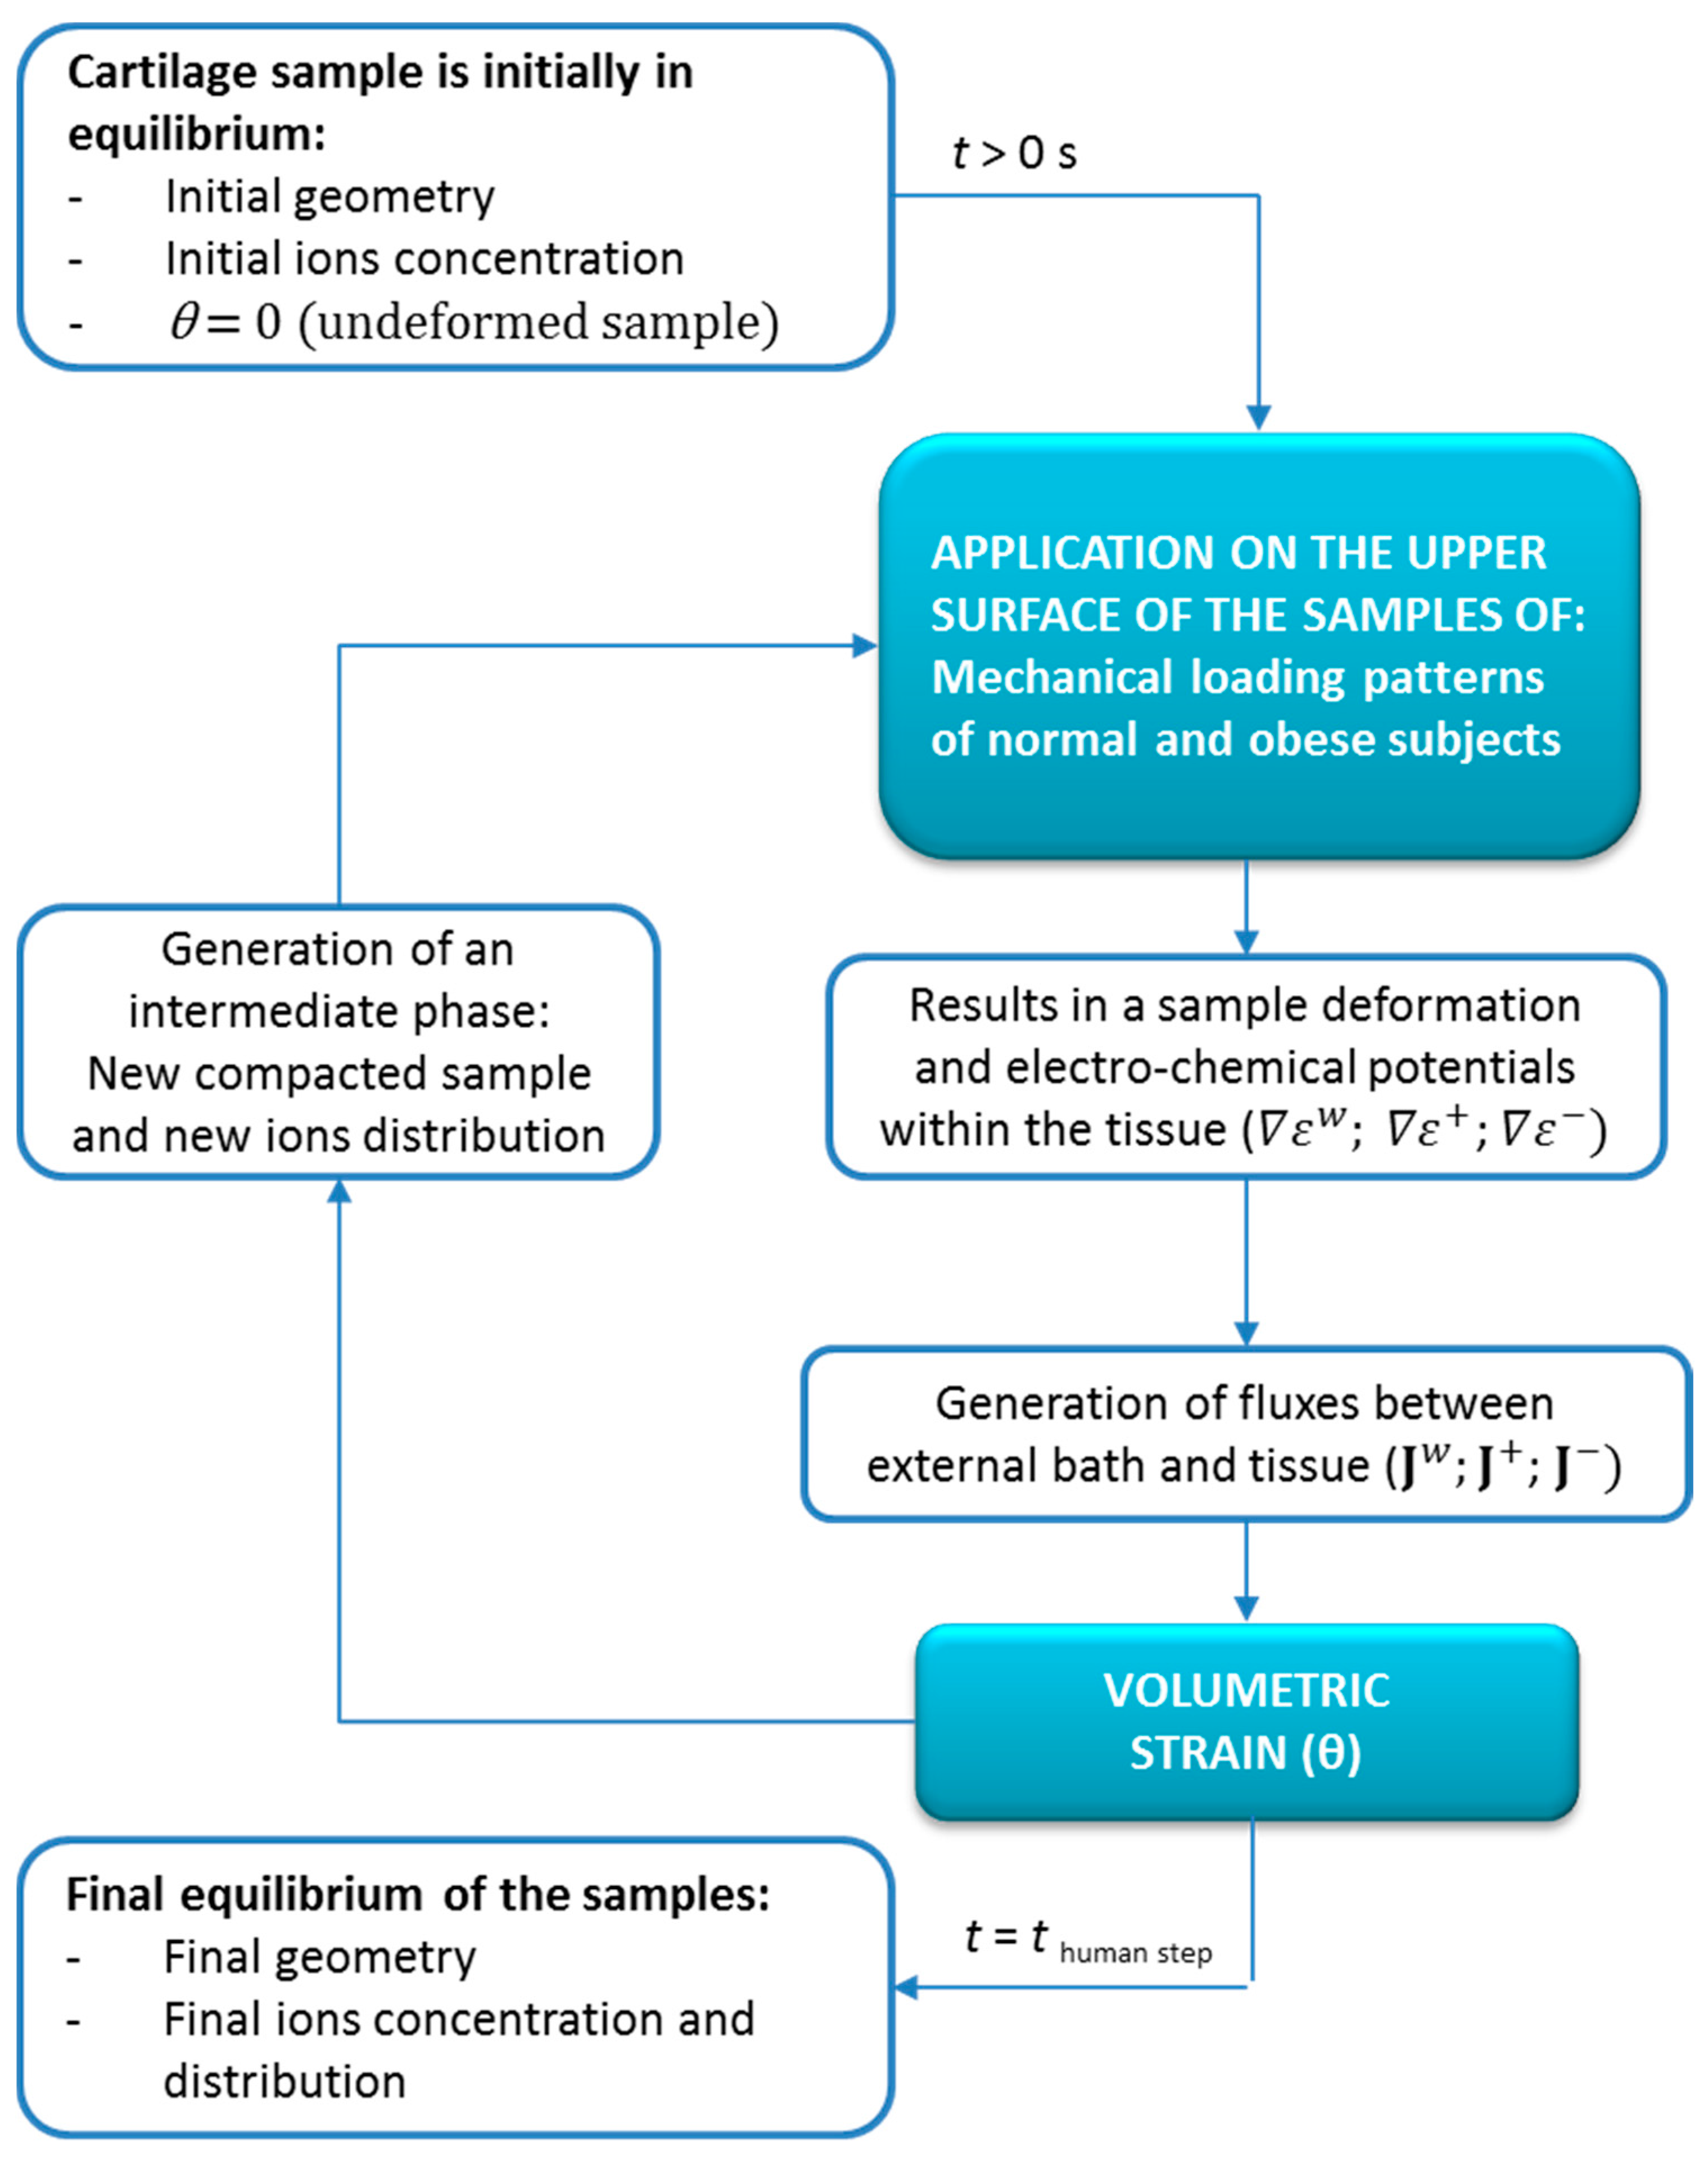
2.3.1. Initial Conditions

Initially, the cartilage sample is equilibrated within a single salt (NaCl) solution with a concentration c * . The initial conditions for the computational model are,
t = 0 :   u = 0 ;   ε w = ε w * ;   ε + = ε + * ;   ε = ε * .
The initial equilibrium state of the tissue corresponds to the unloaded undeformed tissue. This has been selected as a reference configuration for strain (time zero seconds, undeformed configuration).

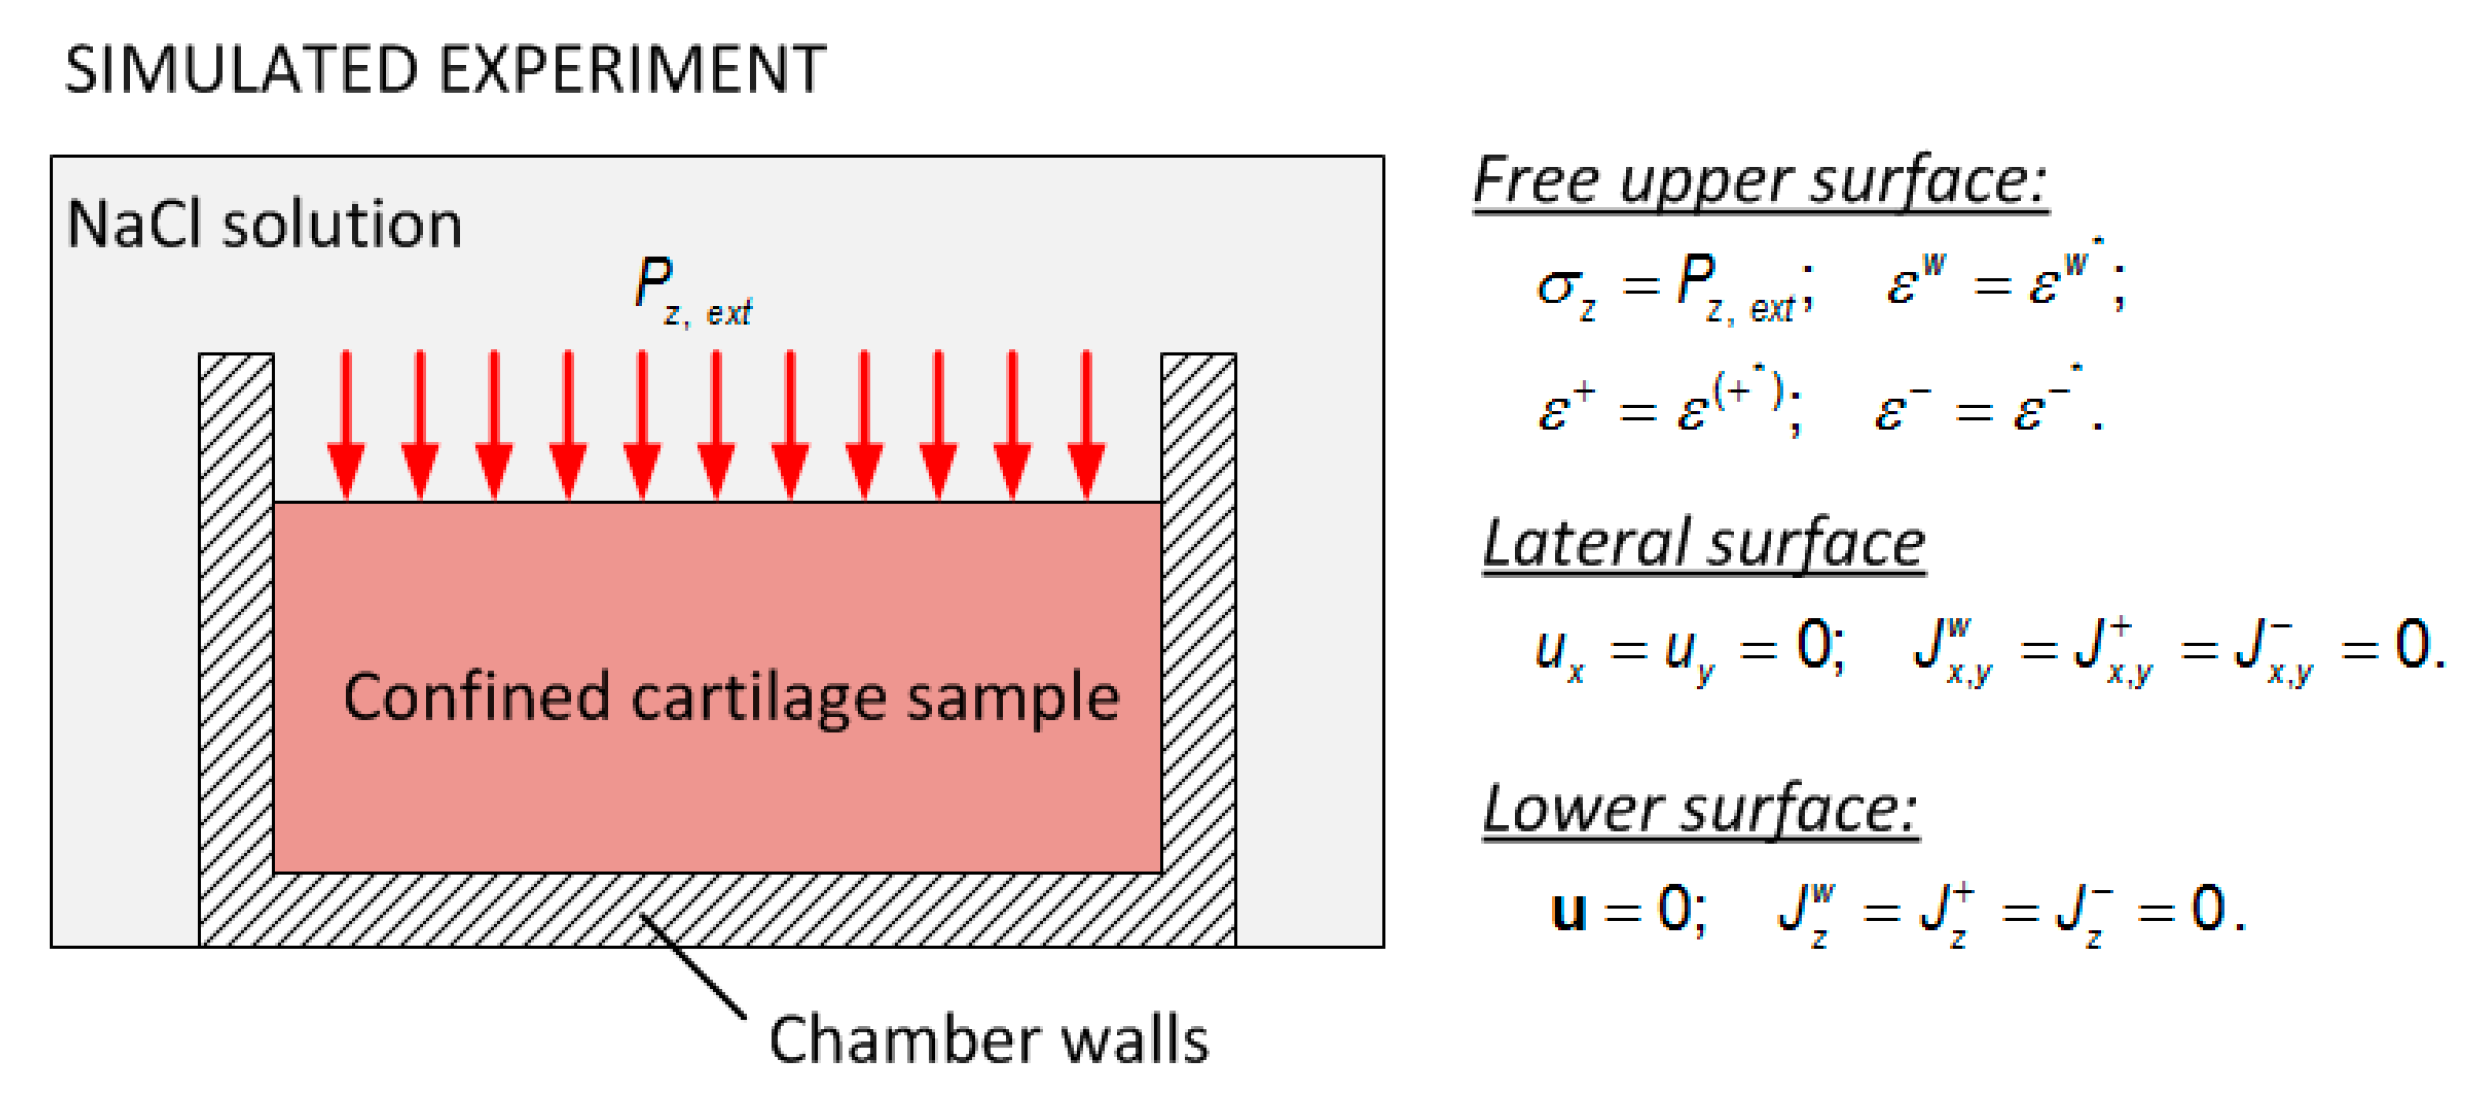
2.3.2. Boundary Conditions

The boundary conditions of the sample in confined configuration (Figure 3) are the following.
Free upper surface:
σ z = P z ,   e x t ;   ε w = ε w * ;   ε + = ε + * ;   ε = ε * .
Lateral surface:
u x = u y = 0 ;   J x , y w = J x , y + = J x , y = 0.
Lower surface:
u = 0 ;   J z w = J z + = J z = 0.
Note that, at t = 0 seconds, the sample is unloaded and the concentration of the external solution, c * , is equal to 0.15 M. When external pressure ( P z , ext ) is applied, the transient response of the solid displacement is solved using the extended 3D model. A comparison between simulations of cartilage of people with obesity and cartilage affected by osteoarthritic has been made. For simplicity, and due to the lack of experimental data, the cartilage is considered as an isotropic material.

3. Results and Discussion

First, the repulsion of negative charges attached to proteoglycans has been studied. This phenomenon, which was neglected in previous models, has been demonstrated to be essential in cartilage free-swelling [20].
Second, water and ion fluxes together with morphological changes in the tissue have been simulated for a critical situation of the human gait (when higher values of forces are experienced by the tissue) in healthy and obesity conditions. The corresponding simulation results of each component (water, cation and ions) are presented after 0.44 s of simulated time, corresponding to the above-mentioned critical phase where maximal cartilage deformation, outgoing water and ion fluxes are observed.
Finally, z-displacement, water and ion flux patterns obtained for people with obesity are compared not only to those relating to people of normal weight but also to degenerated tissue [20].

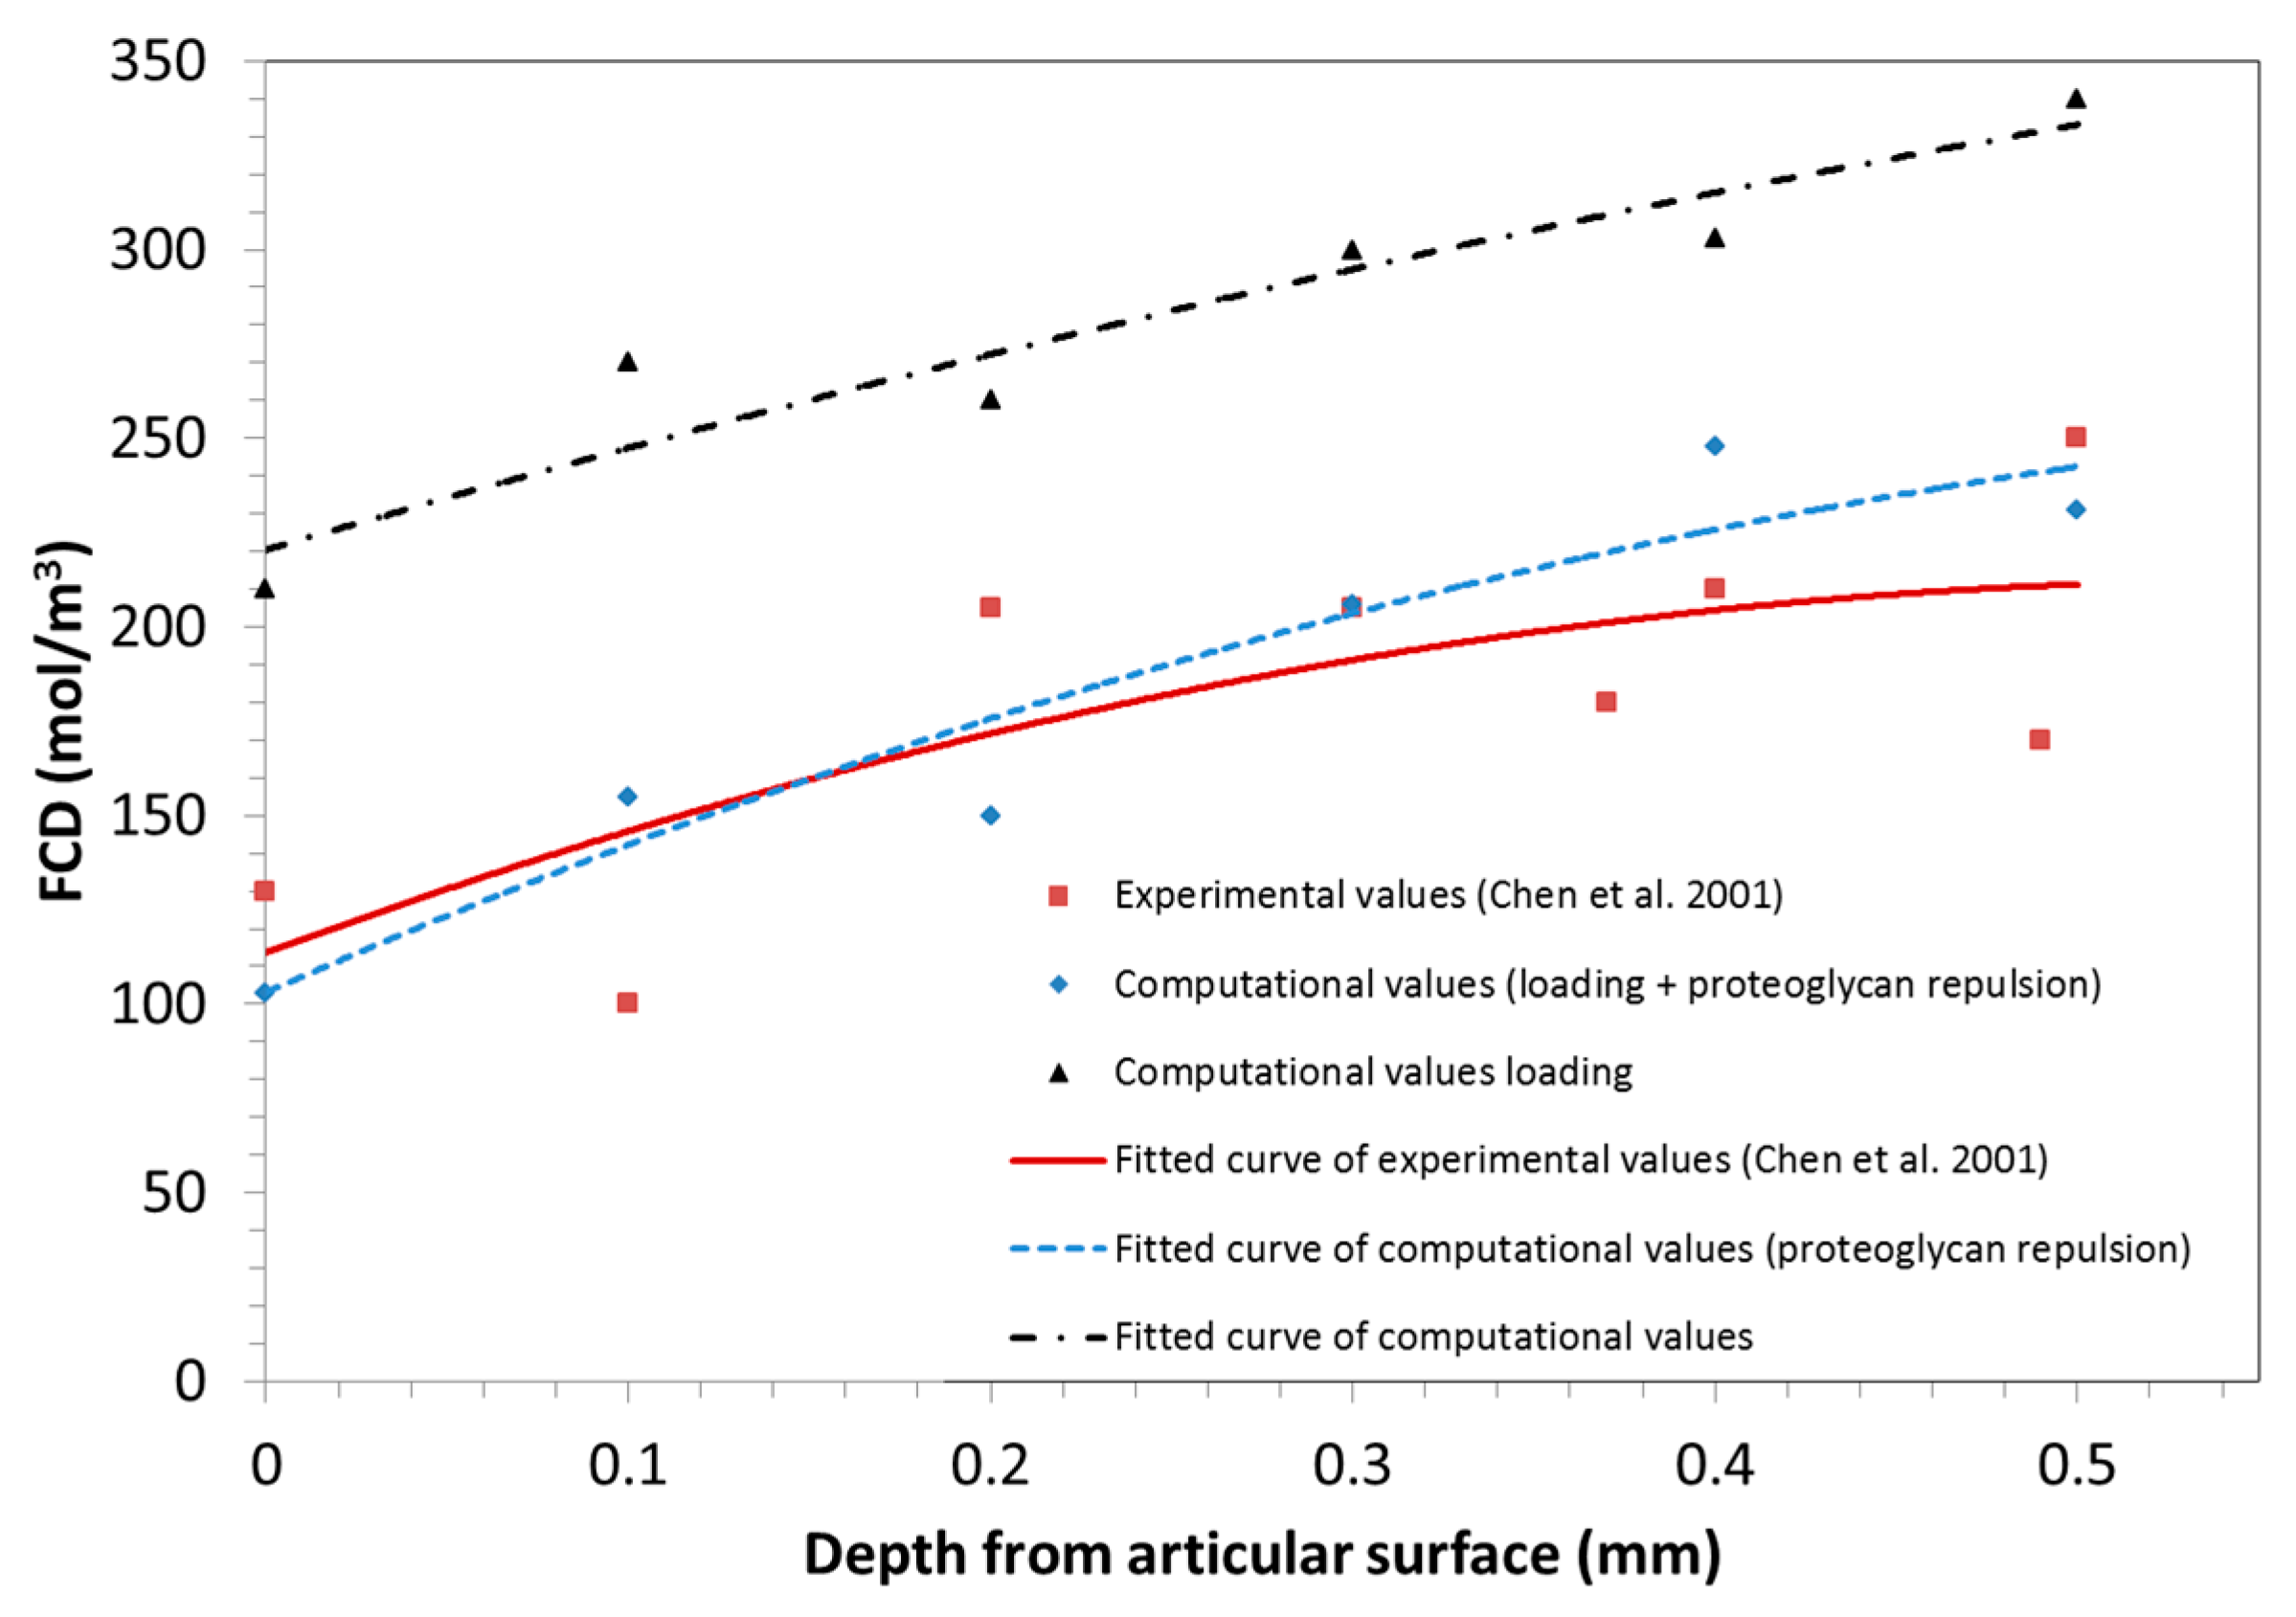
3.1. Proteoglycan Repulsion

To verify the role of the repulsion phenomenon of the negative charges attached to proteoglycans, the experimental test developed by Chen et al. [29] is here reproduced. They applied 8% of deformation to study the distribution of the Fixed Charge Density (FCD) within the sample. Note that the same confined conditions detailed in the previous section are here considered and the 8% of deformation is applied in the computational model.
Under these conditions, it is observed that when taking into account the proteoglycan repulsion phenomenon, the model gives values closer to those obtained experimentally for the FCD distribution (Figure 4). In contrast, when this phenomenon is neglected, the results are higher than those obtained experimentally.
Biologically, this can be explained by the balance of forces that takes place in the sample. When the repulsion phenomenon is not taken into account, the compressive force exerted by loads is balanced with the water contained in the sample. Thus, a higher amount of FCD is observed in all cartilage layers and, subsequently, a higher water content in the sample. However, when the repulsion of proteoglycans is considered, both the water in the sample and the repulsive forces of the attached proteoglycans resist the applied compression load.

3.2. Alterations of Cartilage Tissue in People with Obesity

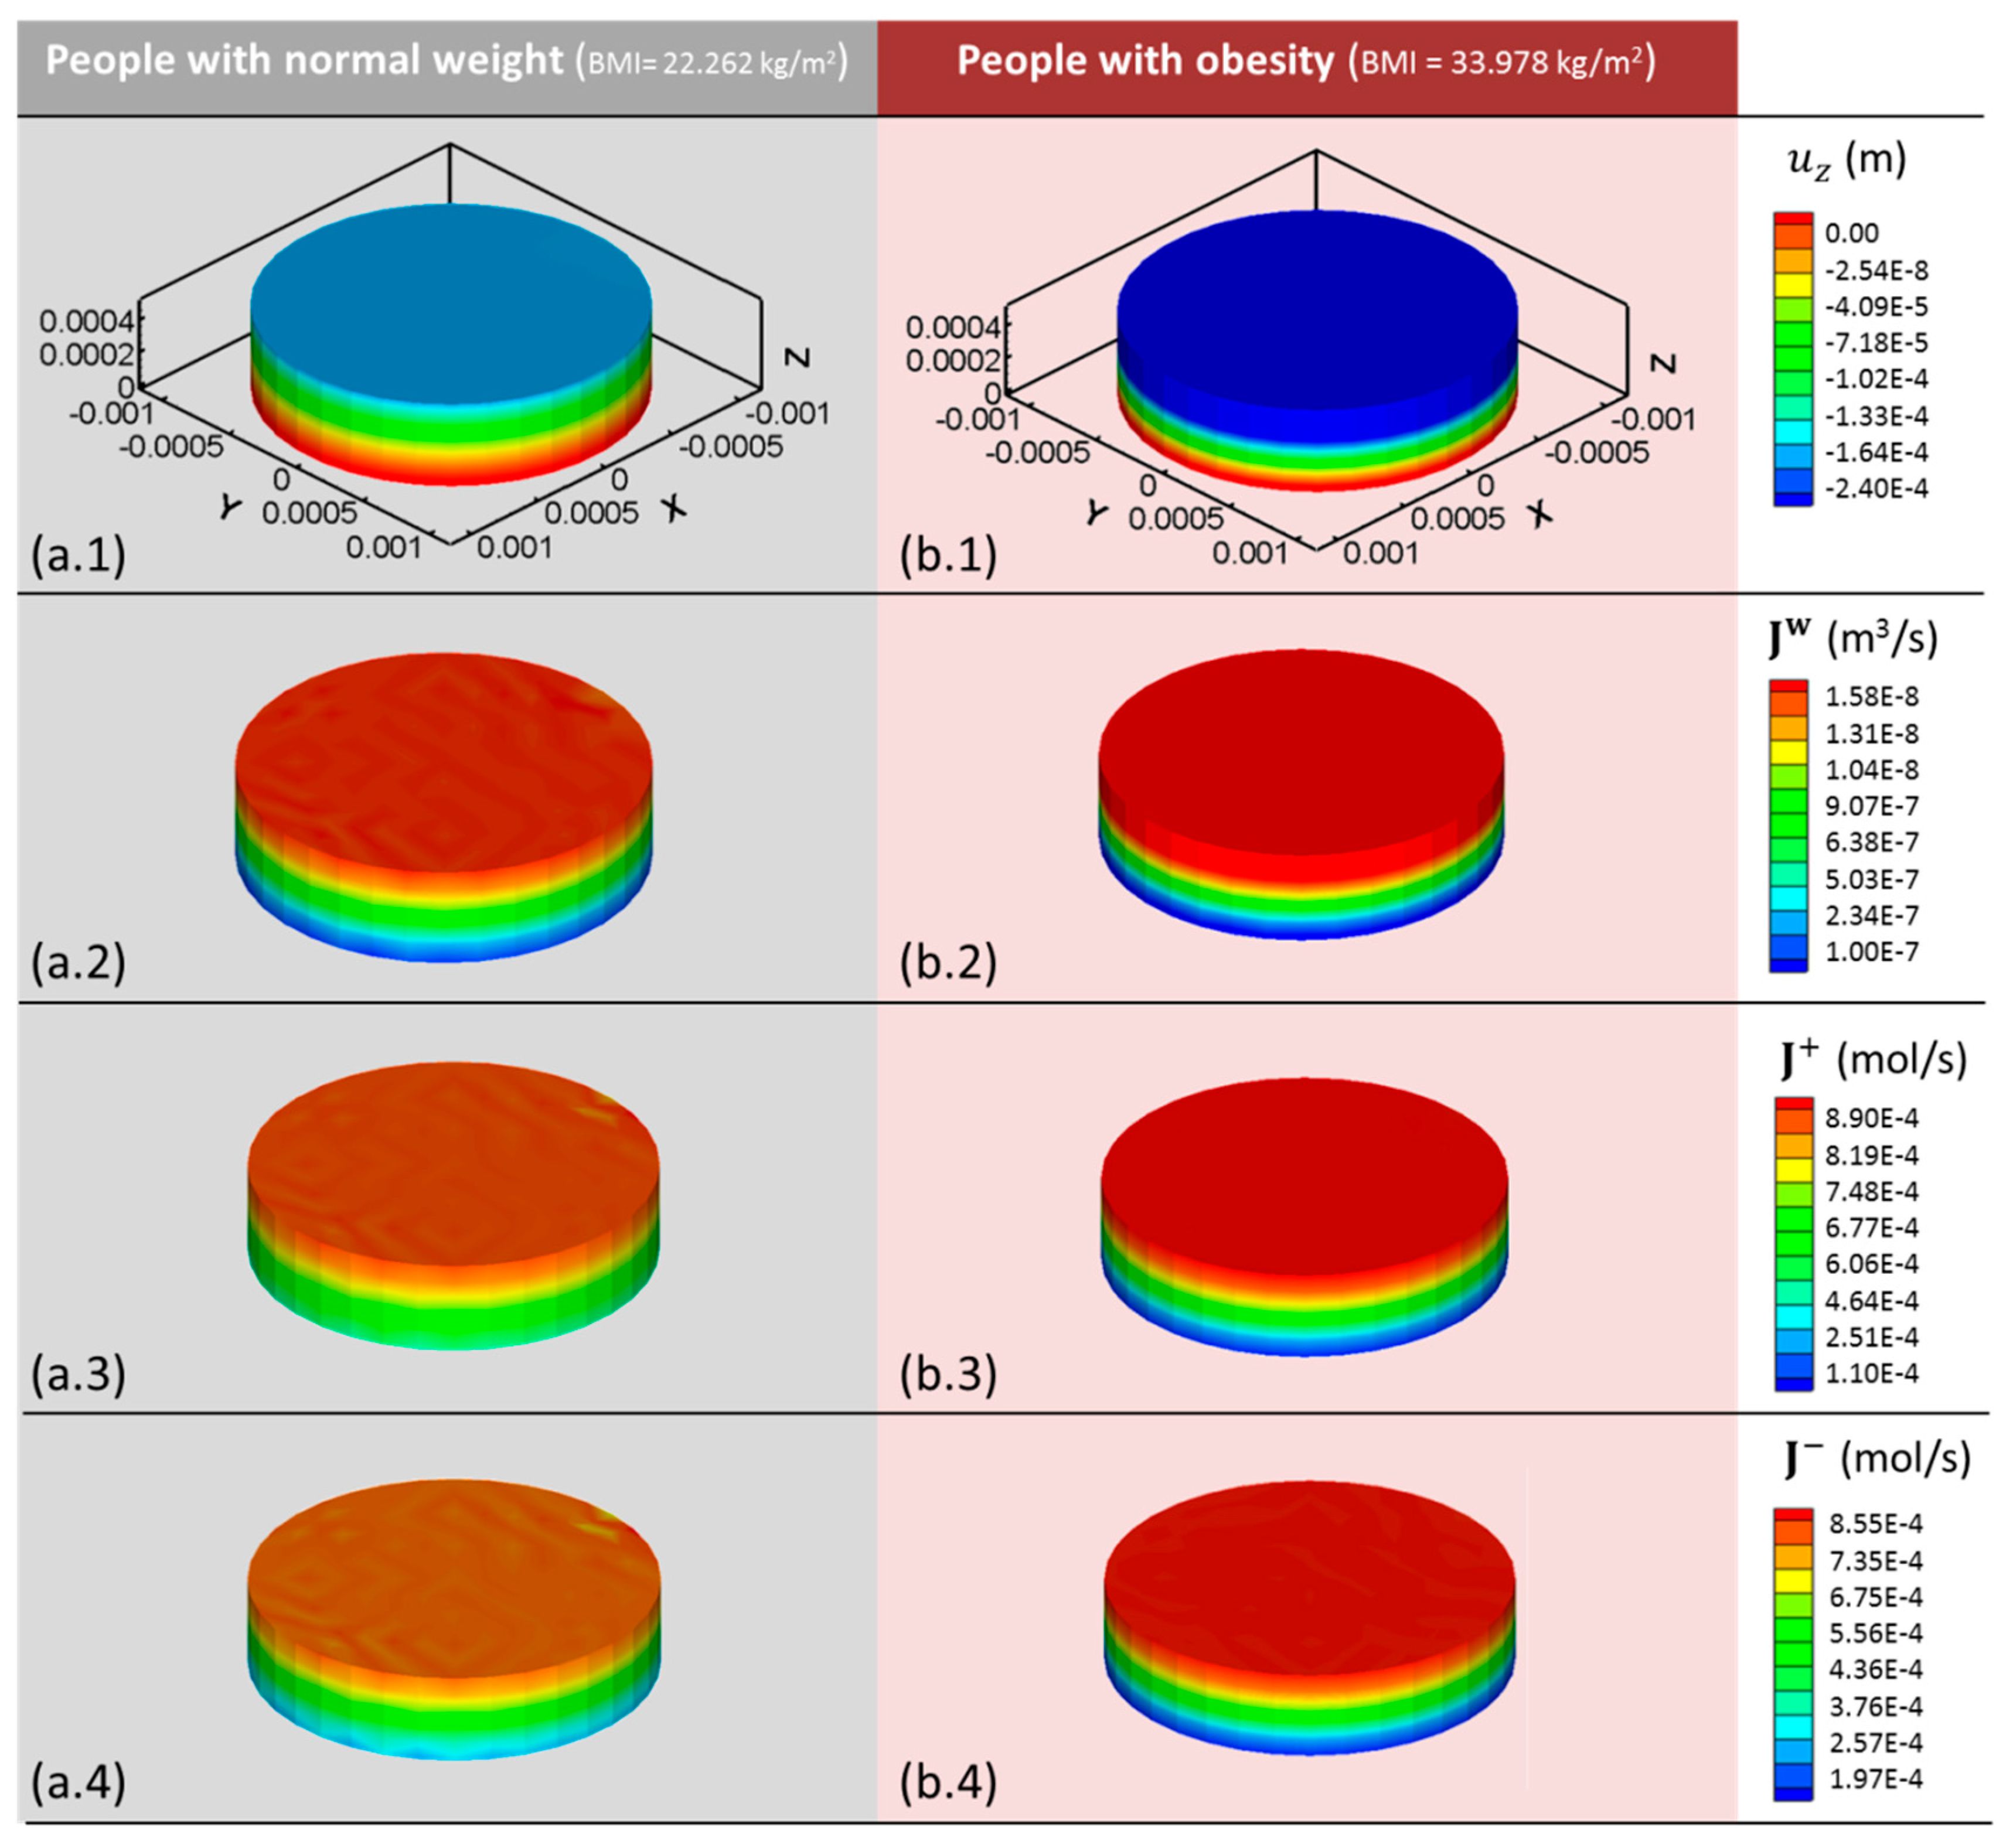
3.2.1. Displacement and Water Flux

Under normal weight (BMI = 22.262 kg/m2), the model displays a maximum surface displacement of −1.38 × 10⁻⁴ m (Figure 5a.1) after 0.44 s of simulated time, significantly lower than that observed in cases of obesity (BMI = 33.978 kg/m2), u z = −2.4 × 10⁻⁴ m (Figure 5b.1). This reduction in tissue deformation results in a lower outgoing water flux from the cartilage sample. Thus, simulated cartilage of people with a normal BMI generates a maximum value of J w = 1.31 × 10⁻⁸ m3/s (Figure 5a.2,) whereas in people with obesity, the water flux is increased to 1.58 × 10⁻⁸ m3/s (Figure 5b.2).
Biologically, this increase in the outgoing water flux produces pathological dehydration, commonly associated with the joints of obese people and with the majority of cartilage pathologies such as osteoarthritis. These results are consistent with the study of Travascio et al. [11] who found a reduction in cartilage water content in people with obesity. Similarly, they suggested this aspect as an essential promoting agent of cartilage osteoarthritis.

3.2.2. Cation Fluxes

To fully understand the alteration in the mechano-electrochemical events occurring in overloaded cartilage, ion fluxes have also been studied. A similar trend to that of water outflow is observed for cation fluxes. Cartilage samples with a weight corresponding to BMI = 22.262 kg/m2 show a maximum cation flux of 8.19 × 10⁻⁴ mol/s in the upper surface. This flux is reduced to 6.06 × 10⁻⁴ mol/s in the bottom surface (Figure 5a.3). In obese cartilage simulations, these values are increased reaching a maximum value of 8.9 × 10⁻⁴ mol/s (Figure 5b.3).
Cartilage degeneration due to osteoarthritis has been widely studied [6,7,8]. A maximum outgoing cation flux of J + = 2 × 10⁻⁴ mol/s was obtained for the early stage of osteoarthritis [20]. Interestingly, the cartilage of the population with obesity exhibits similar values to those obtained for early stages of osteoarthritis.
These findings suggest that people with obesity have an increased risk of suffering cartilage degenerative diseases such as osteoarthritis. The use of preventive treatments to avoid cartilage degradation is thus recommended.

3.2.3. Anion Fluxes

The results obtained for anion fluxes show high similarities with cation fluxes. Anions show the maximum value at the upper surface, J = 7.35 × 10⁻⁴ mol/s, while the minimum is located at the bottom surface, J = 2.57 × 10⁻⁴ mol/s after 0.44 s of simulated time for normal weight (BMI = 22.262 kg/m2) (Figure 5a.4). Under obesity conditions, the maximum outgoing anion flux increases significantly to J = 8.55 × 10⁻⁴ mol/s (Figure 5b.4). Both cation and anion fluxes directly depend on the applied pressure, thus their increase is directly related to excess in body weight.

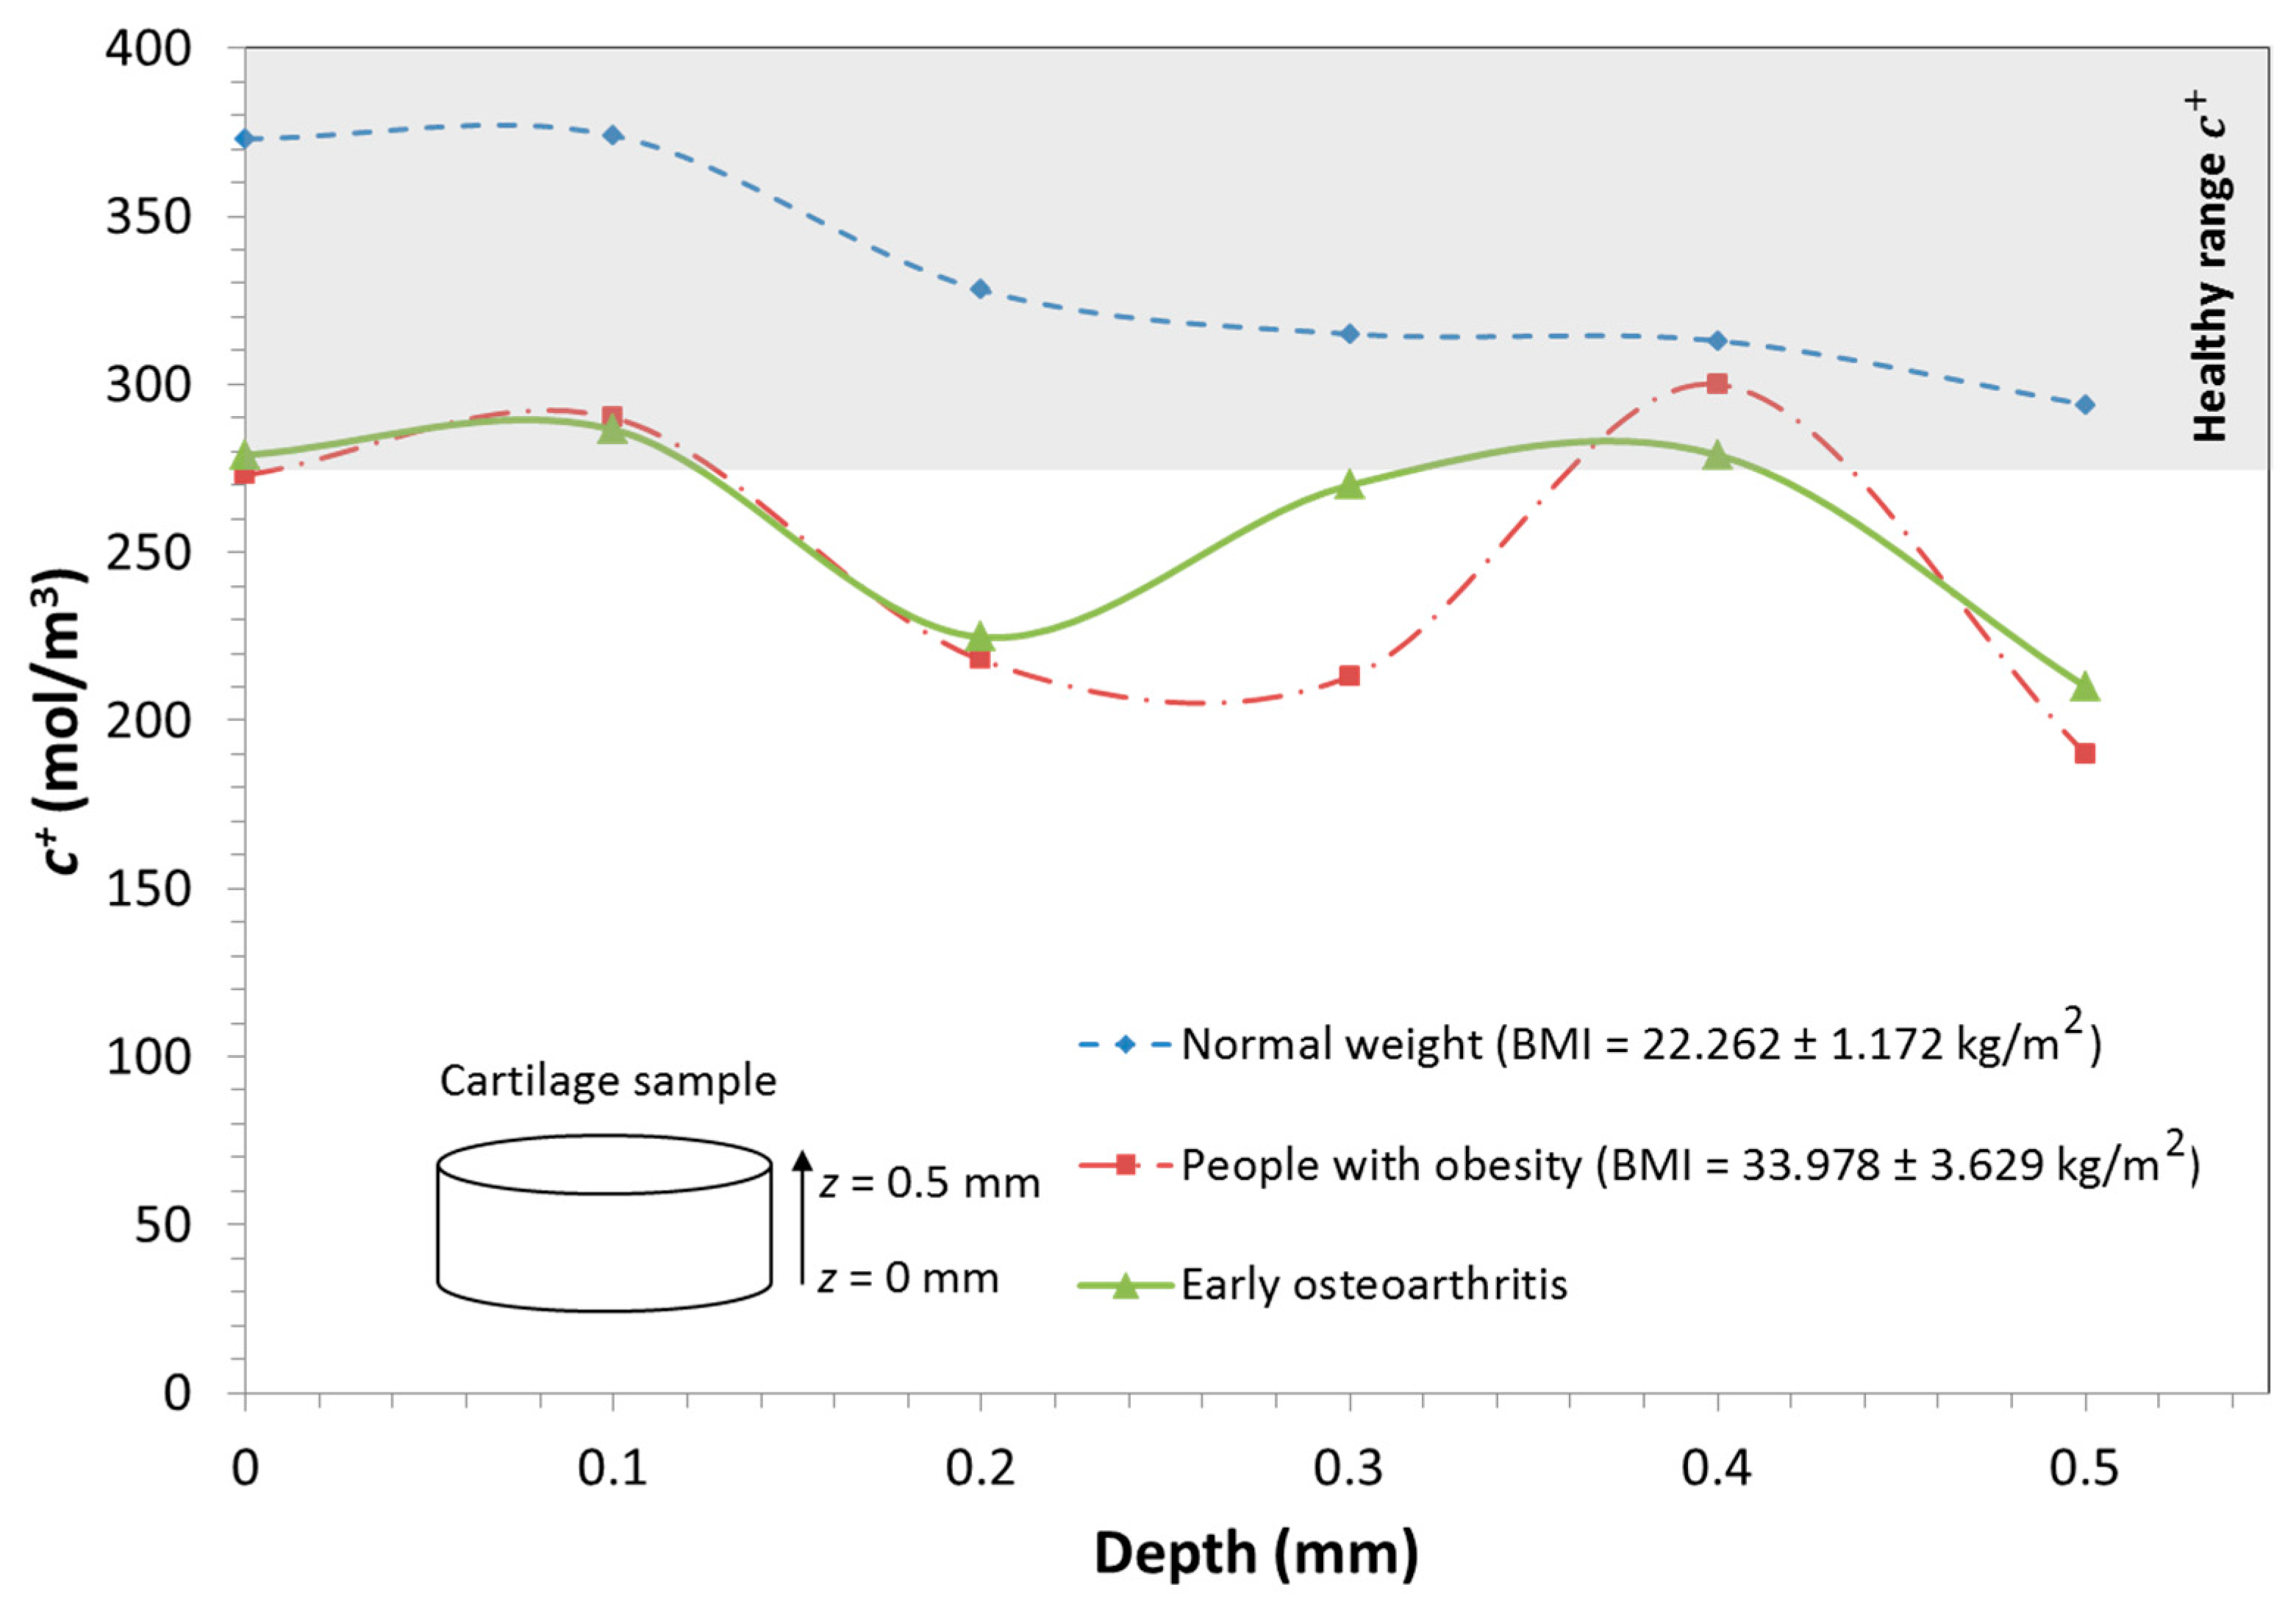
3.2.4. Cation Distribution

The gradient of cations was also monitored after 0.44 s of obese loading and compared with results obtained for normal weight and those previously obtained for osteoarthritic conditions [20].
At this phase, the model showed a significant reduction in cation concentration from the lower to the upper surface within the cartilage sample for both obesity and normal weight conditions. In the normal weight case, it ranged from 372 mol/m3 at z = 0 mm to 302 mol/m3 at 0 mm depth to 372 mol/m3 at z = 0.5 mm. However, in the obesity case, an important reduction in the cation concentration is observed. The cation concentration at the lower surface ( z = 0 mm) had a value of 273 mol/m3 while a value of 190 mol/m3 was reached at the upper surface ( z = 0.5 mm).
Figure 6 shows how the concentration of cations within the cartilage under obese-loading conditions undergoes alterations, being significantly reduced within the sample.
In addition, the obesity results were compared to those obtained for osteoarthritic cartilage in its primary stages of degeneration. Similar alterations were observed in both obese and osteoarthritic tissue. In both cases, there was an increase in the cation concentration in the medium layer and an irregular cation distribution within the sample. These observations open the door to future research to establish and quantify a specific relationship between obesity and an increase in the risk of suffering cartilage diseases such as osteoarthritis. This suggests the necessity of adopting preventive treatments to avoid the progression of cartilage degeneration.

4. Conclusions

In this work, a previously presented three-dimensional mechano-electrochemical model [19,20] has been extended and employed to analyze and quantify the effect of obesity on cartilage behavior. This model can be considered the first 3D computational model for use in the study of the effects of obesity on articular cartilage. This study shows, for the first time, the relation between obesity and cartilage degeneration. It presents the first step when performing a more accurate and sophisticated model to provide patterns that indicate clinician when obesity is starting to affect tissues of the joints. This will let them prevent and treat, at a very early stage, tissue degradation.
The model incorporates important biological and physical aspects of articular cartilage such as proteoglycan repulsion due to attached negative charges, diffusive-convective phenomena and the combined mechano-electrochemical events that occur in healthy as well as pathological tissue. Despite the promising use of the model, it does have some several limitations. First, anisotropic properties should be included in the model in order to analyze the influence of heterogeneity in tissue behavior under loading. Second, in the case of obesity, there is a lack of experimental parameters in the literature. Thus, for future advances, accurate experiments to measure specific cartilage properties are required.
Several interesting insights into cartilage behavior in people with obesity have been evidenced. The results demonstrate that water and ion fluxes within the considered samples present significant alterations, showing a general increase in their values. The simulations also show how the cation concentration is reduced within the sample. Interestingly, these results closely resemble those previously obtained for the early stages of osteoarthritis.
In light of these simulations, it is suggested that people with obesity, i.e. with a BMI greater than 30 kg/m2, should undergo preventive osteoarthritis treatments to avoid homeostatic cartilage alteration and subsequent tissue deterioration. Besides, as expected, the deformation of the cartilage sample from obese patients is higher than that obtained from people of normal weight. These findings support the hypothesis of Travascio et al. [11] that there is a strong correlation between obesity and an increase in the risk of suffering osteoarthritis.
The present model can be considered as a pioneer 3D computational model for simulating cartilage behavior in people with obesity. It could be a valuable tool for analyzing the effects of several cartilage pathologies taking into consideration mechano-electrochemical tissue behavior. Due to the complexity of in vivo experimental measurements of cartilage behavior in specific loading conditions, such as obesity, this model is presented as a predictive instrument to study the subsequent physiological and pathological processes. This, together with the capacity of the model to display the results in clinically interpretable three-dimensional images, make it an interesting novel tool for the diagnosis, monitoring and efficacy evaluation of potential cartilage therapies.

Acknowledgments

The authors gratefully acknowledge financial support from the Spanish Ministry of Economy and Competitiveness (MINECO MAT2013-46467-C4-3-R and FPU graduate research program AP2010/2557), the Government of Aragon (DGA) and the Biomedical Research Networking Center in Bioengineering, Biomaterials and Nanomedicine (CIBER-BBN). CIBER-BBN is financed by the Instituto de Salud Carlos III with assistance from the European Regional Development Fund.

Author Contributions

The conception and design of the study, or acquisition of data, or analysis and interpretation of data: Sara Manzano and Mohamed Hamdy Doweidar. Drafting the article or revising it critically for important intellectual content: Sara Manzano, Manuel Doblaré and Mohamed Hamdy Doweidar. Final approval of the version to be submitted: Sara Manzano, Manuel Doblaré and Mohamed Hamdy Doweidar.

Conflicts of interest

The authors declare no conflict of interest.

References

  1. Finkelstein, E.A.; Fiebelkorn, I.C.; Wang, G. Nationalmedical spending attributable to overweight and obesity: How much, and who’s paying? Health Aff. 2003, 22, 219–226. [Google Scholar]
  2. Ogden, C.L.; Yanovski, S.Z.; Carroll, M.D.; Flegal, K.M. The epidemiology of obesity. Gastroenterology 2007, 132, 2087–2102. [Google Scholar] [CrossRef] [PubMed]
  3. Pi-Sunyer, F.X. The practical guide identification, evaluation, and treatment of overweight and obesity in adults. Available online: http://www.nhlbi.nih.gov/files/docs/guidelines/prctgd_c.pdf (accessed on 23 June 2016).
  4. Kopelman, P.G. Obesity as a medical problem. Nature 2000, 404, 635–643. [Google Scholar] [PubMed]
  5. Puhl, R.M.; Heuer, C.A. The stigma of obesity: A review and update. Obesity 2009, 17, 941–964. [Google Scholar] [CrossRef] [PubMed]
  6. Felson, D.T.; Anderson, J.J.; Naimark, A.; Walker, A.M.; Meenan, R.F. Obesity and knee osteoarthritis. Ann. Intern. Med. 1988, 109, 18–24. [Google Scholar] [CrossRef] [PubMed]
  7. Felson, D.T.; Chaisson, C.E. Understanding the relationship between body weight and osteoarthritis. Bailliere Clin. Rheum. 1997, 11, 671–681. [Google Scholar] [CrossRef]
  8. Oliveria, S.A.; Felson, D.T.; Cirillo, P.A.; Reed, J.I.; Walker, A.M. Body weight, body mass index, and incident symptomatic osteoarthritis of the hand, hip, and knee. Epidemiology 1999, 10, 161–166. [Google Scholar] [CrossRef] [PubMed]
  9. Karvonen, R.L.; Negendank, W.G.; Teitge, R.A.; Reed, A.H.; Miller, P.R.; Fernandez-Madrid, F. Factors affecting articular cartilage thickness in osteoarthritis and aging. J. Rheum. 1994, 21, 1310–1318. [Google Scholar] [PubMed]
  10. Pottie, P.; Presle, N.; Terlain, B.; Netter, P.; Mainard, D.; Berenbaum, F. Obesity and osteoarthritis: More complex than predicted! Ann. Rheum. Dis. 2006, 65, 1403–1405. [Google Scholar] [CrossRef] [PubMed]
  11. Travascio, F.; Eltoukhy, M.; Cami, S.; Asfour, S. Altered mechano-chemical environment in hip articular cartilage: Effect of obesity. Biomech. Mod. Mechanobio. 2014, 13, 945–959. [Google Scholar] [CrossRef] [PubMed]
  12. Felson, D.T. Weight and osteoarthritis. Am. J. Clin. Nutr. 1996, 63, 430S–432S. [Google Scholar] [PubMed]
  13. O’Hara, B.P.; Urban, J.P.; Maroudas, A. Influence of cyclic loading on the nutrition of articular cartilage. Ann. Rheum. Dis. 1990, 49, 536–539. [Google Scholar] [CrossRef] [PubMed]
  14. Garcia, A.M.; Frank, E.H.; Grimshaw, P.E.; Grodzinsky, A.J. Contributions of fluid convection and electrical migration to transport in cartilage: Relevance to loading. Arch. Biochem. Biophys. 1996, 333, 317–325. [Google Scholar] [CrossRef] [PubMed]
  15. Ulrich-Vinther, M.; Maloney, M.D.; Schwarz, E.M.; Rosier, R.; O’Keefe, R.J. Articular cartilage biology. J. Am. Acad. Orthop. Surg. 2003, 11, 421–430. [Google Scholar] [CrossRef] [PubMed]
  16. Ateshian, G.A.; Maa, S.; Weiss, J.A. Multiphasic Finite Element Framework for Modeling Hydrated Mixtures With Multiple Neutral and Charged Solutes. J. Biomech. Eng. 2013, 135. [Google Scholar] [CrossRef] [PubMed]
  17. Arbabi, V.; Pouran, B.; Weinans, H.; Zadpoor, A.A. Multiphasic modeling of charged solute transport across articular cartilage: Application of multi-zone finite-bath model. J. Biomech. 2016, 49, 1510–1517. [Google Scholar] [CrossRef] [PubMed]
  18. Huttunen, J.M.J.; Kokkonen, H.T.; Jurvelin, J.S.; Töyräs, J.; Kaipio, J.P. Estimation of fixed charge density and diffusivity profiles in cartilage using contrast enhanced computer tomography. Int. J. Numer. Methods Eng. 2014, 98, 371–390. [Google Scholar] [CrossRef]
  19. Manzano, S.; Gaffney, E.A.; Doblare, M.; Doweidar, M.H. Cartilage dysfunction in ALS patients as side effect of motion loss: 3D mechano-electrochemical computational model. Biomed. Res. Int. 2014, 2014. [Google Scholar] [CrossRef] [PubMed]
  20. Manzano, S.; Manzano, R.; Doblaré, M.; Doweidar, M.H. Altered swelling and ion fluxes in articular cartilage as a biomarker in osteoarthritis and joint immobilization: A computational analysis. J. Roy. Soc. Int. 2014, 12. [Google Scholar] [CrossRef] [PubMed]
  21. Lai, W.M.; Hou, J.S.; Mow, V.C. A triphasic theory for the swelling and deformation behaviors of articular-cartilage. J. Biomech. Eng. 1991, 113, 245–258. [Google Scholar] [CrossRef] [PubMed]
  22. Sun, D.N.; Gu, W.Y.; Guo, X.E.; Lai, W.M.; Mow, V.C. A mixed finite element formulation of triphasic mechano-electrochemical theory for charged, hydrated biological soft tissues. Int. J. Num. Meth. Eng. 1999, 45, 1375–1402. [Google Scholar] [CrossRef]
  23. Mow, V.C.; Guo, X.E. Mechano-electrochemical properties of articular cartilage: Their inhomogeneities and anisotropies. Ann. Rev. Biomed. Eng. 2002, 4, 175–209. [Google Scholar] [CrossRef] [PubMed]
  24. Huyghe, J.M.; Janssen, J.D. Quadriphasic mechanics of swelling incompressible porous media. Intern. J. Eng. Sci. 1997, 35, 793–802. [Google Scholar] [CrossRef]
  25. Gu, W.Y.; Lai, W.M.; Mow, V. A mixture theory for charged-hydrated soft tissues containing multi-electrolytes: Passive transport and swelling behaviors. J. biomechan. eng. 1998, 120, 169–180. [Google Scholar] [CrossRef]
  26. Sun, D.D.; Guo, X.E.; Likhitpanichkul, M.; Lai, W.M.; Mow, V.C. The influence of the fixed negative charges on mechanical and electrical behaviors of articular cartilage under unconfined compression. J. Biomech. Eng. 2004, 126, 6–16. [Google Scholar] [CrossRef] [PubMed]
  27. Garcia, J.J.; Cortes, D.H. A nonlinear biphasic viscohyperelastic model for articular cartilage. J. Biomech. 2006, 39, 2991–2998. [Google Scholar] [CrossRef] [PubMed]
  28. Kaasschieter, E.F.; Frijns, A.J.H.; Huyghe, J.M. Mixed finite element modelling of cartilaginous tissues. Math. Comput. Simul. 2003, 61, 549–560. [Google Scholar] [CrossRef]
  29. Chen, S.S.; Falcovitz, Y.H.; Schneiderman, R.; Maroudas, A.; Sah, R.L. Depth-dependent compressive properties of normal aged human femoral head articular cartilage: Relationship to fixed charge density. Osteoarthr. Cartil. 2011, 9, 561–569. [Google Scholar] [CrossRef] [PubMed]
Figure 1. Schematic representation of the simulation process: (a) the mechanical load during human gait for people with obesity and with normal weight based on the work of Travascio et al. [11]; (b) incorporation of a hip cartilage sample into the computational model; and (c) list of the main model outputs.
Applsci 06 00186 g001
Figure 2. Schematic diagram describing the process of the numerical simulation and the steps of its implementation.
Applsci 06 00186 g002
Figure 3. Schematic representation of the experiment simulated by the computational model and the boundary conditions.
Applsci 06 00186 g003
Figure 4. Fixed Charge Density (FCD) distribution along the thickness of a cartilage sample with 8% sample deformation due to compressive loads.
Applsci 06 00186 g004
Figure 5. (1) z-displacement ( u z ); (2) water ( J w ); (3) cation ( J + ); and (4) anion ( J ) fluxes obtained with the 3D computational model after 0.44 s of simulated human gait cycle for (a) healthy and (b) people with obesity. Note that BMI = 22.262 kg/m2 corresponds to normal weight and BMI = 33.978 kg/m2 to obesity. Positive fluxes refer to the emergence of the component from the cartilage sample to the external solution.
Applsci 06 00186 g005
Figure 6. Distribution of cation concentration for people with obesity and of normal weight during human gait. The shaded area represents the range of cation distribution in cartilage of a person of normal weight.
Applsci 06 00186 g006
Table 1. Model parameters used in the computational model.
DescriptionSymbolRange or Studied ValueReference
Young’s modulus E0.6 MPa[19]
Poisson coefficientν0.28[19]
Drag coefficient between the solid and the water phaseα7 × 10¹⁴ N·s·m−4[22]
Diffusivity of the cationsD+5 × 10⁻¹ m·s−1[22]
Diffusivity of the anionsD8 × 10−1 m·s−1[22]
Initial FCD0.2 mEq·mL−1[22]
Activity coefficient of cations γ + 0.86[21]
Activity coefficient of anions γ 0.85[21]
Gas constantR8.314 J·mol−1·K−1[22]
Absolute temperatureT298 K[22]
Osmotic coefficientΦ0.8[21]
Initial amount of water in the tissue Φ 0 w 0.75[22]

