The Impact of Temperature on the Removal of Inorganic Contaminants Typical of Urban Stormwater


1
Faculty of Civil and Environmental Engineering, Warsaw University of Life Sciences—SGGW, Nowoursynowska 166, 02-787 Warsaw, Poland
2
Department of Chemical Engineering, The University of Melbourne, Parkville, VIC 3010, Australia
*
Author to whom correspondence should be addressed.
Appl. Sci. 2019, 9(7), 1273; https://doi.org/10.3390/app9071273
Submission received: 25 February 2019
/
Revised: 18 March 2019
/
Accepted: 21 March 2019
/
Published: 27 March 2019
(This article belongs to the Section Environmental Sciences)
Abstract
:Featured Application
(1) reactive material selection for implementation in stormwater infiltration devices; (2) design of the dimensions and maintenance frequency for treatment zones operated in cold regions.
Abstract
Appropriate management of urban stormwater requires consideration of both water quantity, resulting from flood control requirements, and water quality, being a consequence of contaminant distribution via runoff water. This article focuses on the impact of temperature on the efficiency of stormwater treatment processes in permeable infiltration systems. Studies of the removal capacity of activated carbon, diatomite, halloysite, limestone sand and zeolite for select heavy metals (Cu and Zn) and biogenes (NH4-N and PO4-P) were performed in batch conditions at 3, 6, 10, 15, 22, 30 and 40 °C at low initial concentrations, and maximum sorption capacities determined at 3, 10, 22 and 40 °C. A decrease in temperature to 3 °C reduced the maximum sorption capacities (Qmax) of the applied materials in the range of 10% for diatomite uptake of PO4-P, to 46% for halloysite uptake of Cu. Only the value of Qmax for halloysite, limestone sand and diatomite for NH4-N uptake decreased slightly with temperature increase. A positive correlation was also observed for the equilibrium sorption (Qe) of Cu and Zn for analyses performed at low concentrations (with the exception of Zn sorption on limestone sand). In turn, for biogenes a rising trend was observed only in the range of 3 °C to 22 °C, whereas further temperature increase caused a decrease of Qe. Temperature had the largest influence on the removal of copper and the smallest on the removal of phosphates. It was also observed that the impact of temperature on the process of phosphate removal on all materials and ammonium ions on all materials, with the exception of zeolite, was negligible.
1. Introduction
Controlling urban stormwater, particularly in areas with impermeable covers such as road pavements, parking lots, airports and roofs, is an important issue if local flooding or larger floods after rainfall is to be prevented. Many methods have been proposed to mitigate this issue [1,2,3,4]. The amount of runoff from urbanized areas may be reduced by increasing the retention of runoff water close to its source by centralized and non-centralized sustainable urban drainage systems [2,3]. One of the solutions recommended as best management practice is the use of systems that increase stormwater infiltration. The advantages of this solution are the attenuation of peak runoff, reduction of direct removal of runoff water to the reservoir, and groundwater supply [1,5]. In the last decade, aside from infiltration systems (filter strips, soakaways, infiltration trenches, infiltration basins) and retention devices (e.g., retention ponds, lagoons, constructed wetlands), new solutions that have been proposed are focused on reducing the volume of surface runoff; these include alternative road structures, e.g., porous paving and asphalt surfaces [6]. However, O’Reilly et al. [7] emphasized the need to maintain the balance between the volume of retained water and groundwater quality protection, particularly taking into account the restricted efficiency of the subsurface surface layer of soil and construction materials to remove contaminants. Based on literature data from the last decade [8,9,10], urban stormwater transports large amounts of contaminants, including suspensions, biogenes, oil-derived substances, heavy metals, dissolved salts, polycyclic aromatic hydrocarbons, phenols and pesticides. In many countries, stormwater is considered as one of the chief contaminant carriers to the soil-water environment [8,10,11,12]. Its treatment during infiltration through a soil layer to groundwater may be insufficient to fulfil the requirements raised by the Water Framework Directive [13]. Oil separators and settling tanks are commonly used in engineering practice as elements of preliminary treatment before introduction of runoff water to the receiver. The main functions of such devices include elimination of organic contaminants (coalescence and lamella separators) and suspensions (settlers/grit chambers) transported by stormwater from impermeable areas [1]. Due to the difficulties in the implementation of these devices, their application is recommended by producers and research institutes mostly in cases of specific hazard posed on the natural environment, e.g., on petrol stations, parking lots, road junctions, overpasses and bridges.
Therefore, it is important to find and implement more effective solutions, which would ensure not only a lower quantity, but also maintain the acceptable quality, of stormwater runoff. They include permeable treatment zones, where the processes taking place within them may be classified as engineered natural attenuation. Many studies related to engineered natural attenuation of runoff water in infiltration systems exist, mainly from the USA [6,14,15,16], Austria [4,17], Germany [18] and Australia [19,20]. Moreover, guidelines have been elaborated to control the degree of contamination removal in sustainable systems of stormwater runoff, particularly total suspended solids, Zn, Cu, organic contaminants, total phosphorus and total nitrogen e.g., in Netherlands, Germany and Australia [2]. These investigations may be subdivided into the following groups: (1) application of treatment chambers for small-surface catchments [14,15,16,18,21], (2) application of point permeable treatment zones for larger catchments [6,7,19,20,22,23], and (3) application of linear permeable treatment zones [6,24]. To date, in field pilot scale, the effectiveness of urban stormwater treatment was tested using the following reactive materials and their specialized mixtures: peat [14], lignite coke [15], vermiculite [17,20], granulated Al2O3 and Fe2O3 and aerated concrete [18], activated concrete [23], activated carbon [17,18], zeolite [17,19,21], sandy loam, perlite, compost and hardwood mulch [20], tire crumb [7], zero valent iron [6,21], silica spongolite [21], limestone sand [21,24] and gravel [22]. These investigations explicitly point out that the application of reactive materials in infiltration systems of stormwater runoff is effective and should be introduced in practice in urbanized areas.
Systems of engineered natural attenuation (permeable treatment zones and sealing systems) located in the soil subsurface layer are vulnerable to the impact of external factors such as temperature. As indicated by Kim and Singh [25], soil temperature determines both the type and efficiency of physical and chemical processes in soil. It is assumed that the zone of daily temperature oscillations in Polish soils varies from 0.8 to 1.0 m below surface level, with the maximum throughout the year being between 5 and 8 m below surface level [26]; however, databases with soil temperatures at various depths are not commonly accessible for many regions and the measurement of this parameter is time-consuming and expensive [27]. The temperature of the medium below surface level depends on numerous factors, such as incident solar radiation, rainfall, and ambient temperature fluctuations, but also local vegetation cover, type of soil, water presence and its movement [28,29]. Due to this, the flow of contaminated stormwater through treatment zones may take place in a wide range of temperatures, from around 0 °C to summer temperatures. Therefore, temperature may significantly influence the daily, monthly and annual variability of the removal efficiency of transported contaminants. Most reports are focused on the analysis of the intensity of contaminant removal at ambient temperatures [30,31,32,33] or on assessing the impact of temperature increases above room temperature on the intensification of the process [34,35,36,37]; fewer studies indicate how temperature decrease, even to 0 °C, influences the ability of reactive materials to remove contaminants [38,39].
The main aim of the studies here was to determine the qualitative and quantitative impact of temperature on the sorption of selected heavy metals (Cu and Zn) and dissolved forms of biogenic substances (NH4-N and PO4-P) on five different reactive materials. Contaminant removal was determined both at low concentrations and at concentrations sufficient to attain a maximum loading capacity, significantly exceeding those that are characteristic of stormwater.
2. Materials and Methods
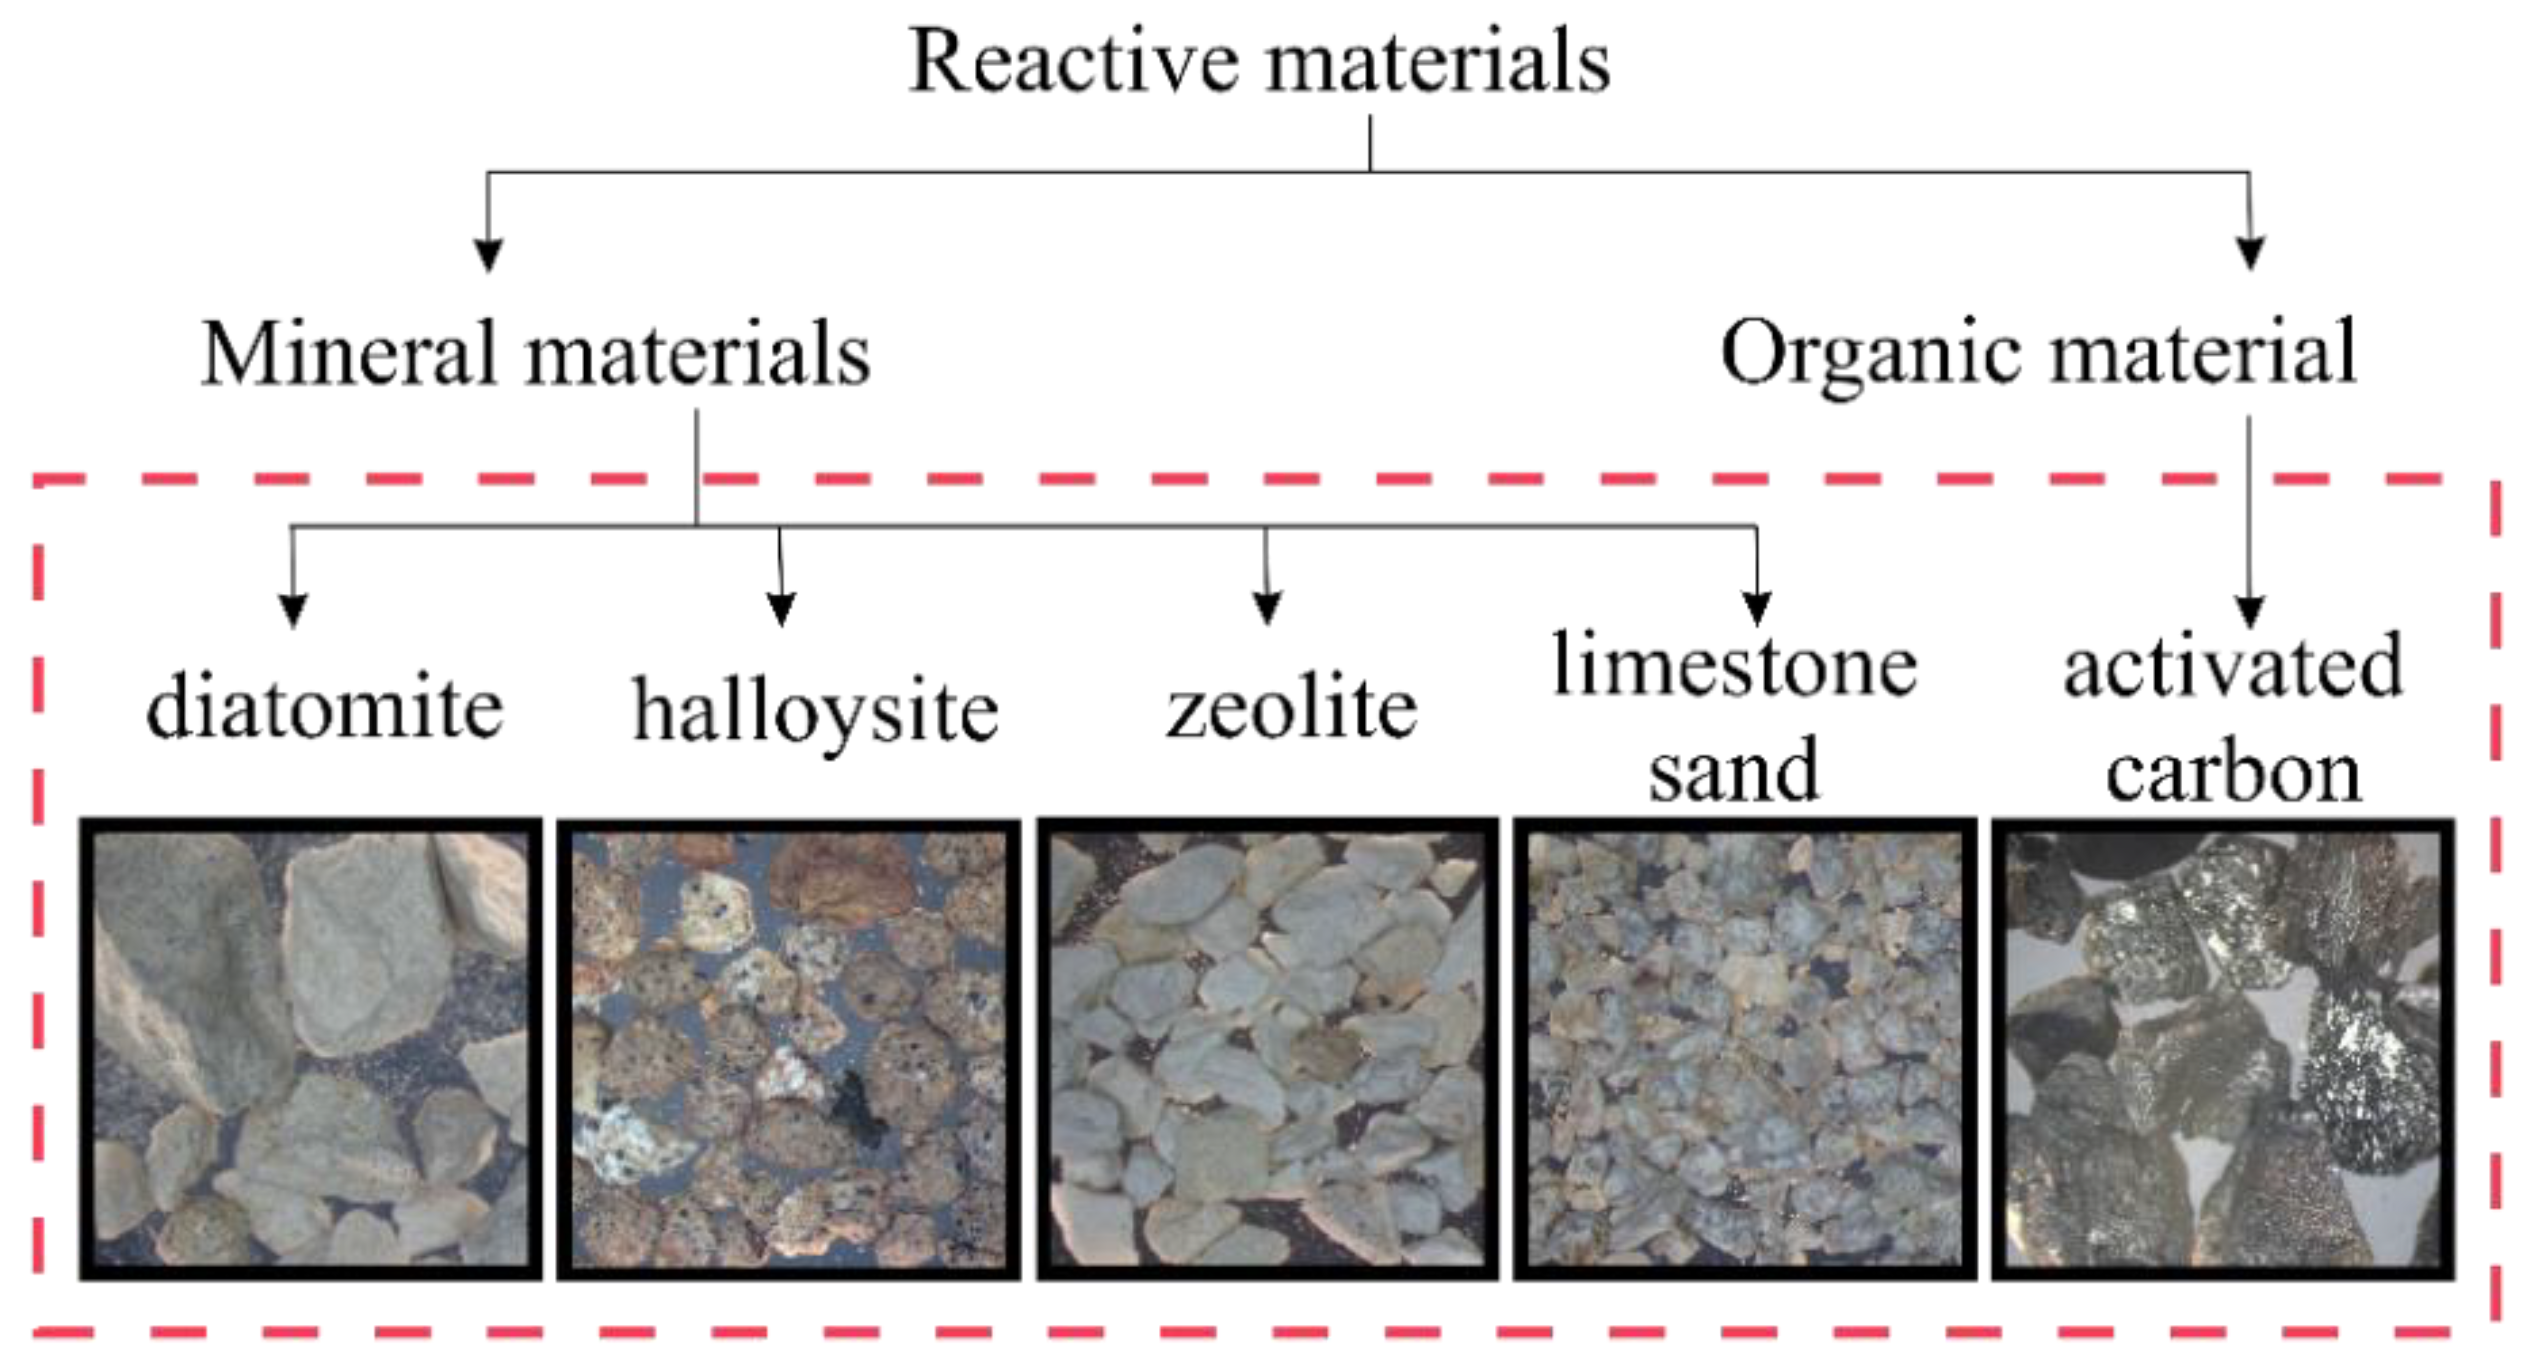
Activated carbon and unamended mineral materials, e.g., zeolite, limestone sand, diatomite and halloysite, were used in the analyses (Figure 1). The mineral materials were not subject to pre-treatment to ensure use of the most economically favorable material, as these relatively cheap materials are widely used for water treatment processes [40,41,42,43], and also in the phytostabilisation of soils contaminated by heavy metals [44,45]. The only exception is activated carbon, which was selected as a reference material due to its wide application in the treatment of contaminants in the soil-water environment using permeable reactive barrier technology [46,47,48,49].
Surface morphology and oxide composition of the applied materials were determined using scanning electron microscopy (FEG Quanta 250, USA) and X-ray spectroscopy with energy dispersion X-ray microscopy—EDS by EDAX (USA). The specific surface area (SBET) of the reactive materials was calculated using the Brunauer–Emmett–Teller (BET) method based on the nitrogen adsorption-desorption isotherm at 77 K using ASAP 2020M by Micromeritics (Norcross, GA, USA).
Electrical conductivity (EC) and pH of the reactive materials were measured in an aqueous suspension of 1:2.5 (w/v) and 1:5 (w/v) using a conductivity and pH multimeter pH/LF 12 (Schott, Munich, Germany). The cation exchangeable capacity (CEC) of Na+, K+, Mg2+, and Ca2+ was determined at pH 7 with ammonium acetate [50] and their concentrations measured by an Atomic Absorption Spectrophotometer iCE-3000 (Thermo Scientific, Waltham, MA, USA).
Analysis of the effect of temperature on the intensity of contaminant removal was performed in two series: (1) for low initial concentrations of contaminants (Zn—7.5 mg/L, Cu—30 mg/L, PO4-P—10 mg/L, NH4-N—10 mg/L), insufficient for the exhaustion of the maximum adsorption capacity of the materials, at 3 °C, 6 °C, 10 °C, 15 °C, 22 °C, 30 °C and 40 °C; and (2) for high initial concentrations of the contaminants, in the range from 0.5 to 100 mg/L for heavy metals, phosphates from 0.25 to 50 mg/L, and ammonium ions from 0.5 to 100 mg/L at 3 °C, 10 °C, 22 °C and 40 °C. The concentration of heavy metals and biogenic components in stormwater is varied and can range from 0.007 to 0.963 mg Cu/L, 0.015 to 5.070 mg Zn/L, 0.73 to 17.00 mg NH4-N/L and from 0.02 to 14.30 mgP/L (from 0.10 to 0.40 mg PO4-P/L) [8,9,10,15,17]. The concentrations of tested components, assumed here, exceeded the concentrations observed in-situ, but they ensured the unification of the test scheme and, in most cases, the exhaustion of materials capacity.
In both series, 0.500 ± 0.001 g of reactive material was shaken with 50 ± 0.5 mL of the solution for 24 h on a DOS orbital shaker (Elmi, Bergstrasse, Germany) at 160 rpm within a thermostatic cabinet ST 1 (Pol-Eko, Wodzisław Śląski, Poland) to ensure a stable temperature (±0.1 °C) for the duration of the experiment. All analyses were performed in triplicate, for which arithmetic means and standard deviations were calculated and presented on charts as error bars.
Chemical reagents (CuCl2·2H2O, ZnCl2, NH4Cl, K2HPO4) and demineralized water were used in all analyses. Following the experiment, samples were collected and filtered through a 0.45 μm filter for quantitative analyses (Whatman, Maidstone, UK). Samples containing heavy metals were acidified by adding 0.5 mL concentrated nitric acid and stored at 3 °C for later analysis. The concentrations of dissolved Cu and Zn ions were determined using atomic adsorption spectroscopy iCE-3000 (Thermo Scientific, Waltham, MA, USA) in an air-acetylene flame using wavelengths of 324.8 nm and 213.9 nm respectively. Solutions containing ammonium and phosphate ions were immediately analysed using a DR-6000 UV-vis spectrophotometer (Hach Lange, Loveland, CO, USA). Ammonium ions were determined using the silver nitrate titration with a chromate indicator (Mohr’s method) [51], whereas phosphates were determined using the application of ammonium molybdate [52].
The results are presented in form of relationship between the equilibrium sorption capacity Qe (mg/g) (Qe = (C0 − Ce) V/m) and temperature (series I) and in form of the relationship between the equilibrium concentration in the solution (Ce) and the equilibrium sorption capacity Qe (mg/g) (series II). In the calculations, V (L) is the solution volume, m (g) is the sample mass, and C0 (mg/L) is the initial concentration of the contaminant. The maximum adsorption capacity of reactive materials Qmax and the Langmuir equilibrium constant KL (L/g) were determined by matching the Hanes-Woolf’s linear form of Langmuir isotherm [53] to the obtained results with application of Solver in Microsoft Excel:
Additionally, the results were used to determine parameters describing the thermodynamics of the processes. Enthalpy change ΔH0 (J/mol) and entropy change ΔS0 (J/mol·K) were calculated in accordance with van’t Hoff equation:
the dimensionless equilibrium constant KC was based on parameters of the Langmuir isotherm [53]:
and the Gibbs energy change ΔG0 (J/mol) was calculated from the relationship:
where R (J/(mol·K) is the universal gas constant (equal to 8.3144), T (K) the absolute temperature, Mw (g/mol) is the molecular weight of the adsorbate, and factor 55.5 is the number of moles of pure water per liter.
Pearson’s correlation was used to identify the statistical significance of the relationship between the parameters of contaminant sorption capacity (Qe) and temperature. Statistical significance was at the level of p < 0.05. Moreover, equations describing the relationship between the equilibrium sorption capacity and temperature were estimated by using the multinomial regression model and statistical significance was tested using Statistica (StatSoft, Tulsa, OK, USA).
3. Results and Discussion
3.1. Characteristics of the Materials
The surface characteristics determined on the basis of nitrogen adsorption/desorption isotherms are presented in Table 1. Activated carbon is a microporous material, as evidenced by the micropore surface and volume values (respectively 366.41 m2/g and 0.162 cm3/g) and relatively low value of mesopore surface (177.10 m2/g) in relation to the total specific surface of the material (782.67 m2/g). Diatomite, zeolite and halloysite are mesoporous materials and therefore are characterized by average specific surface areas with mesopores in the shape of narrow fissures with irregular dimensions and shapes. The largest specific surface and volume of mesopores among these minerals were observed in halloysite (respectively 48.33 m2/g and 0.193 cm3/g), and the smallest in diatomite (respectively 29.32 m2/g and 0.05 cm3/g). Limestone sand can be classified as a non-porous material.
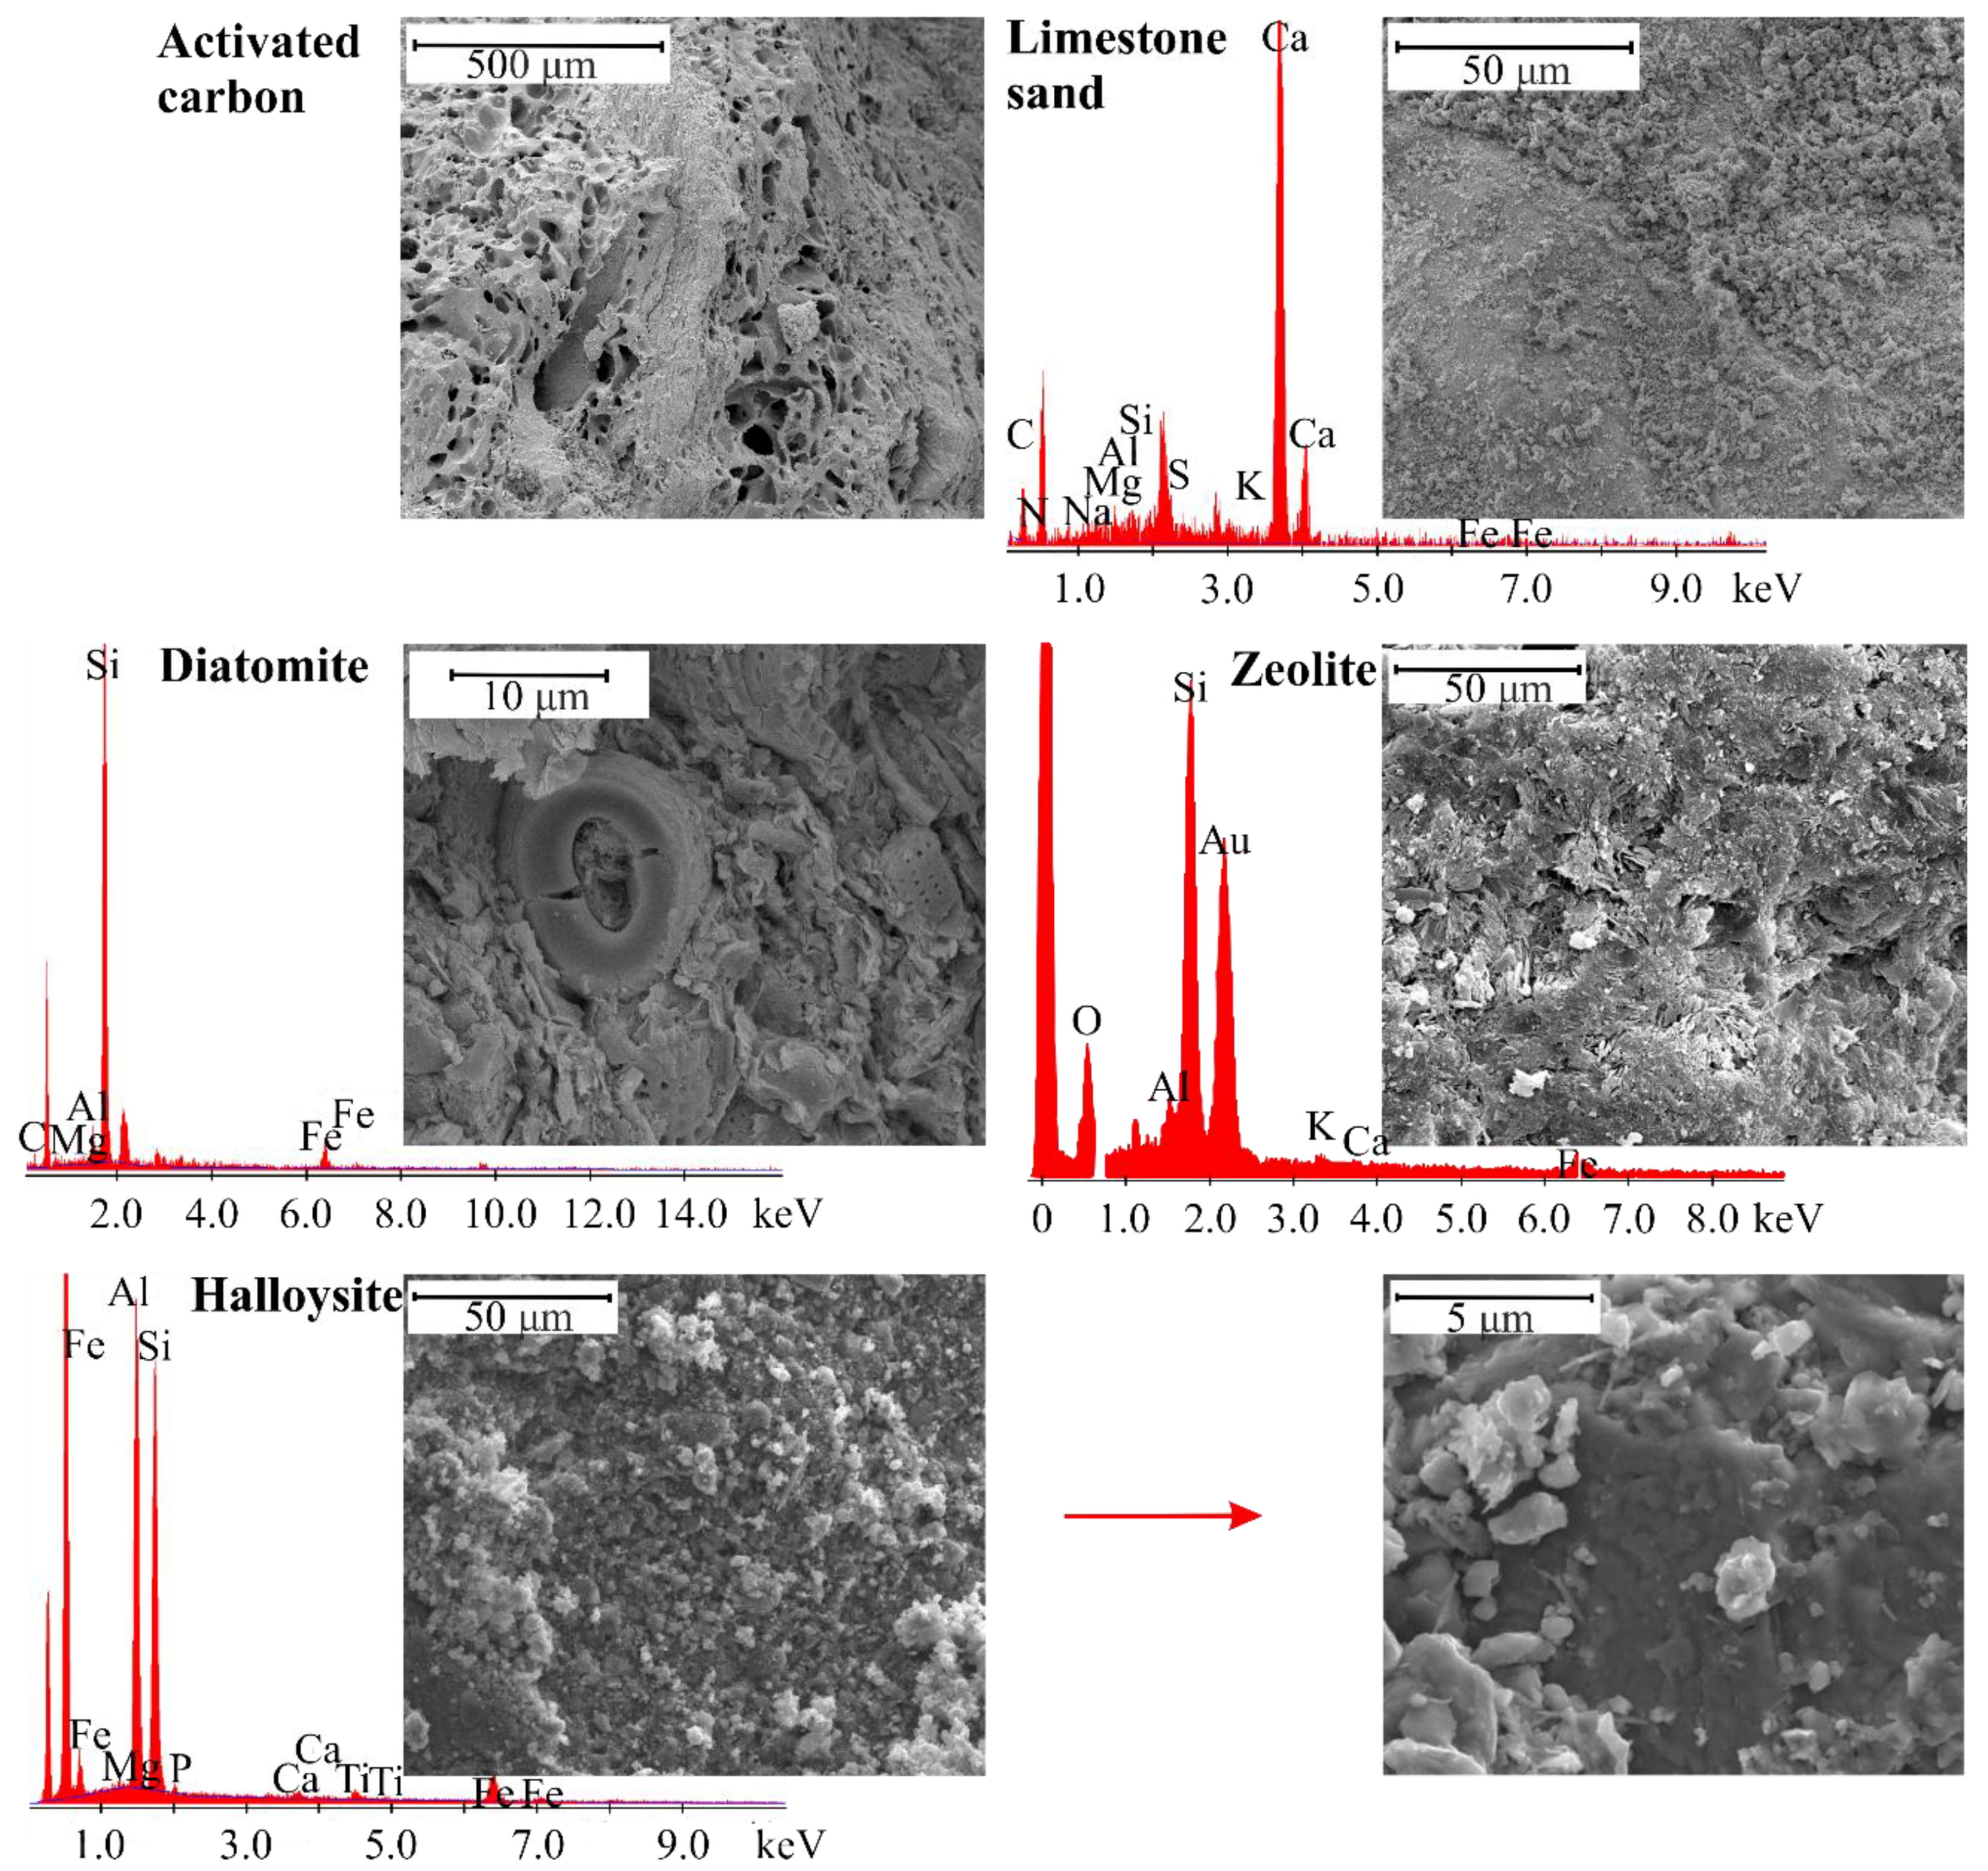
Scanning Electron Microscope (SEM) images and chemical micro-range analyses (EDS) of reactive materials are presented in Figure 2. The observations are in accordance with the results presented in Table 1. It is worth noting that the activated carbon sample has the most expanded porous surface, with spherical pores attaining dimensions from over ten to several hundreds of micrometers. SEM analysis of limestone sand confirmed the carbonate character of this material, whereas micro area chemical analysis of calcium and oxygen pointed to calcite (CaCO3). SEM-EDS analyses indicated the presence of minerals from the silica group in the diatomite sample and allowed for the petrographic classification of this material as diatomaceous earth. SEM micro images confirmed the moderately developed surface of zeolite and halloysite, and in the case of the latter material, the presence of characteristic nano tubes, which, however, were not very distinct at this magnification. Additionally, EDS spectra pointed to the presence of: silicon (Si), oxygen (O), aluminum (Al), potassium (K), calcium (Ca) and iron (Fe) in the zeolite sample, and of: iron (Fe), aluminum (Al), silicon (Si), magnesium (Mg), phosphorus (P), calcium (Ca) and titanium (Ti) in the halloysite sample.
The pH, electrical conductivity (EC) and cation exchange capacity (CEC) of the applied reactive materials are shown in Table 2. Studies of EC have allowed to arrange the analyzed materials as follows in increasing order: limestone sand ≈ diatomite < zeolite < halloysite << activated carbon. The analyzed materials can be subdivided with regard to pH values into 3 groups: (1) reaction below neutral (pH < 7)—diatomite and halloysite, (2) reaction between 7 and 8—zeolite, and (3) reaction > 8—limestone sand and activated carbon. The pH of the materials plays a large role in contamination removal, particularly of heavy metals, but also of ammonium ions [57]. In the case of water pH exceeding 7, beside ammonium ions (NH4-N), water contains gaseous ammonia (NH3), and at pH = 11.1 free ammonia amounts to 99%. In solutions with larger values of pH heavy metals precipitate as hydroxides. In turn, at pH < 7 for Pb, pH < 7.5 for Cu, pH < 8.7 for Zn and pH < 9.8 for Ni, the dominant form of metals in solution is their ionic form, which may be removed via adsorption processes. Therefore, it may be assumed that in the case of water containing Zn and Cu with activated carbon and limestone sand, precipitation will play a significant role in the removal of these contaminants due to their high pH values.
Cation exchange capacity (CEC) indicates the number of negatively charged sites on the material surface able to exchange cations (Na+, K+, Ca2+ and Mg2+). Zeolite was found to have the largest CEC, followed by diatomite, halloysite, activated carbon and limestone sand (Table 2). Khorshidi and Lu [58] demonstrate that this characteristic not only presents an evaluation of the ion exchange processes responsible for contaminant removal, but also indirectly properties such as water adsorption, ability of water transfer and contaminant migration.
3.2. Heavy Metals
3.2.1. Effect of Temperature at Low Initial Concentrations
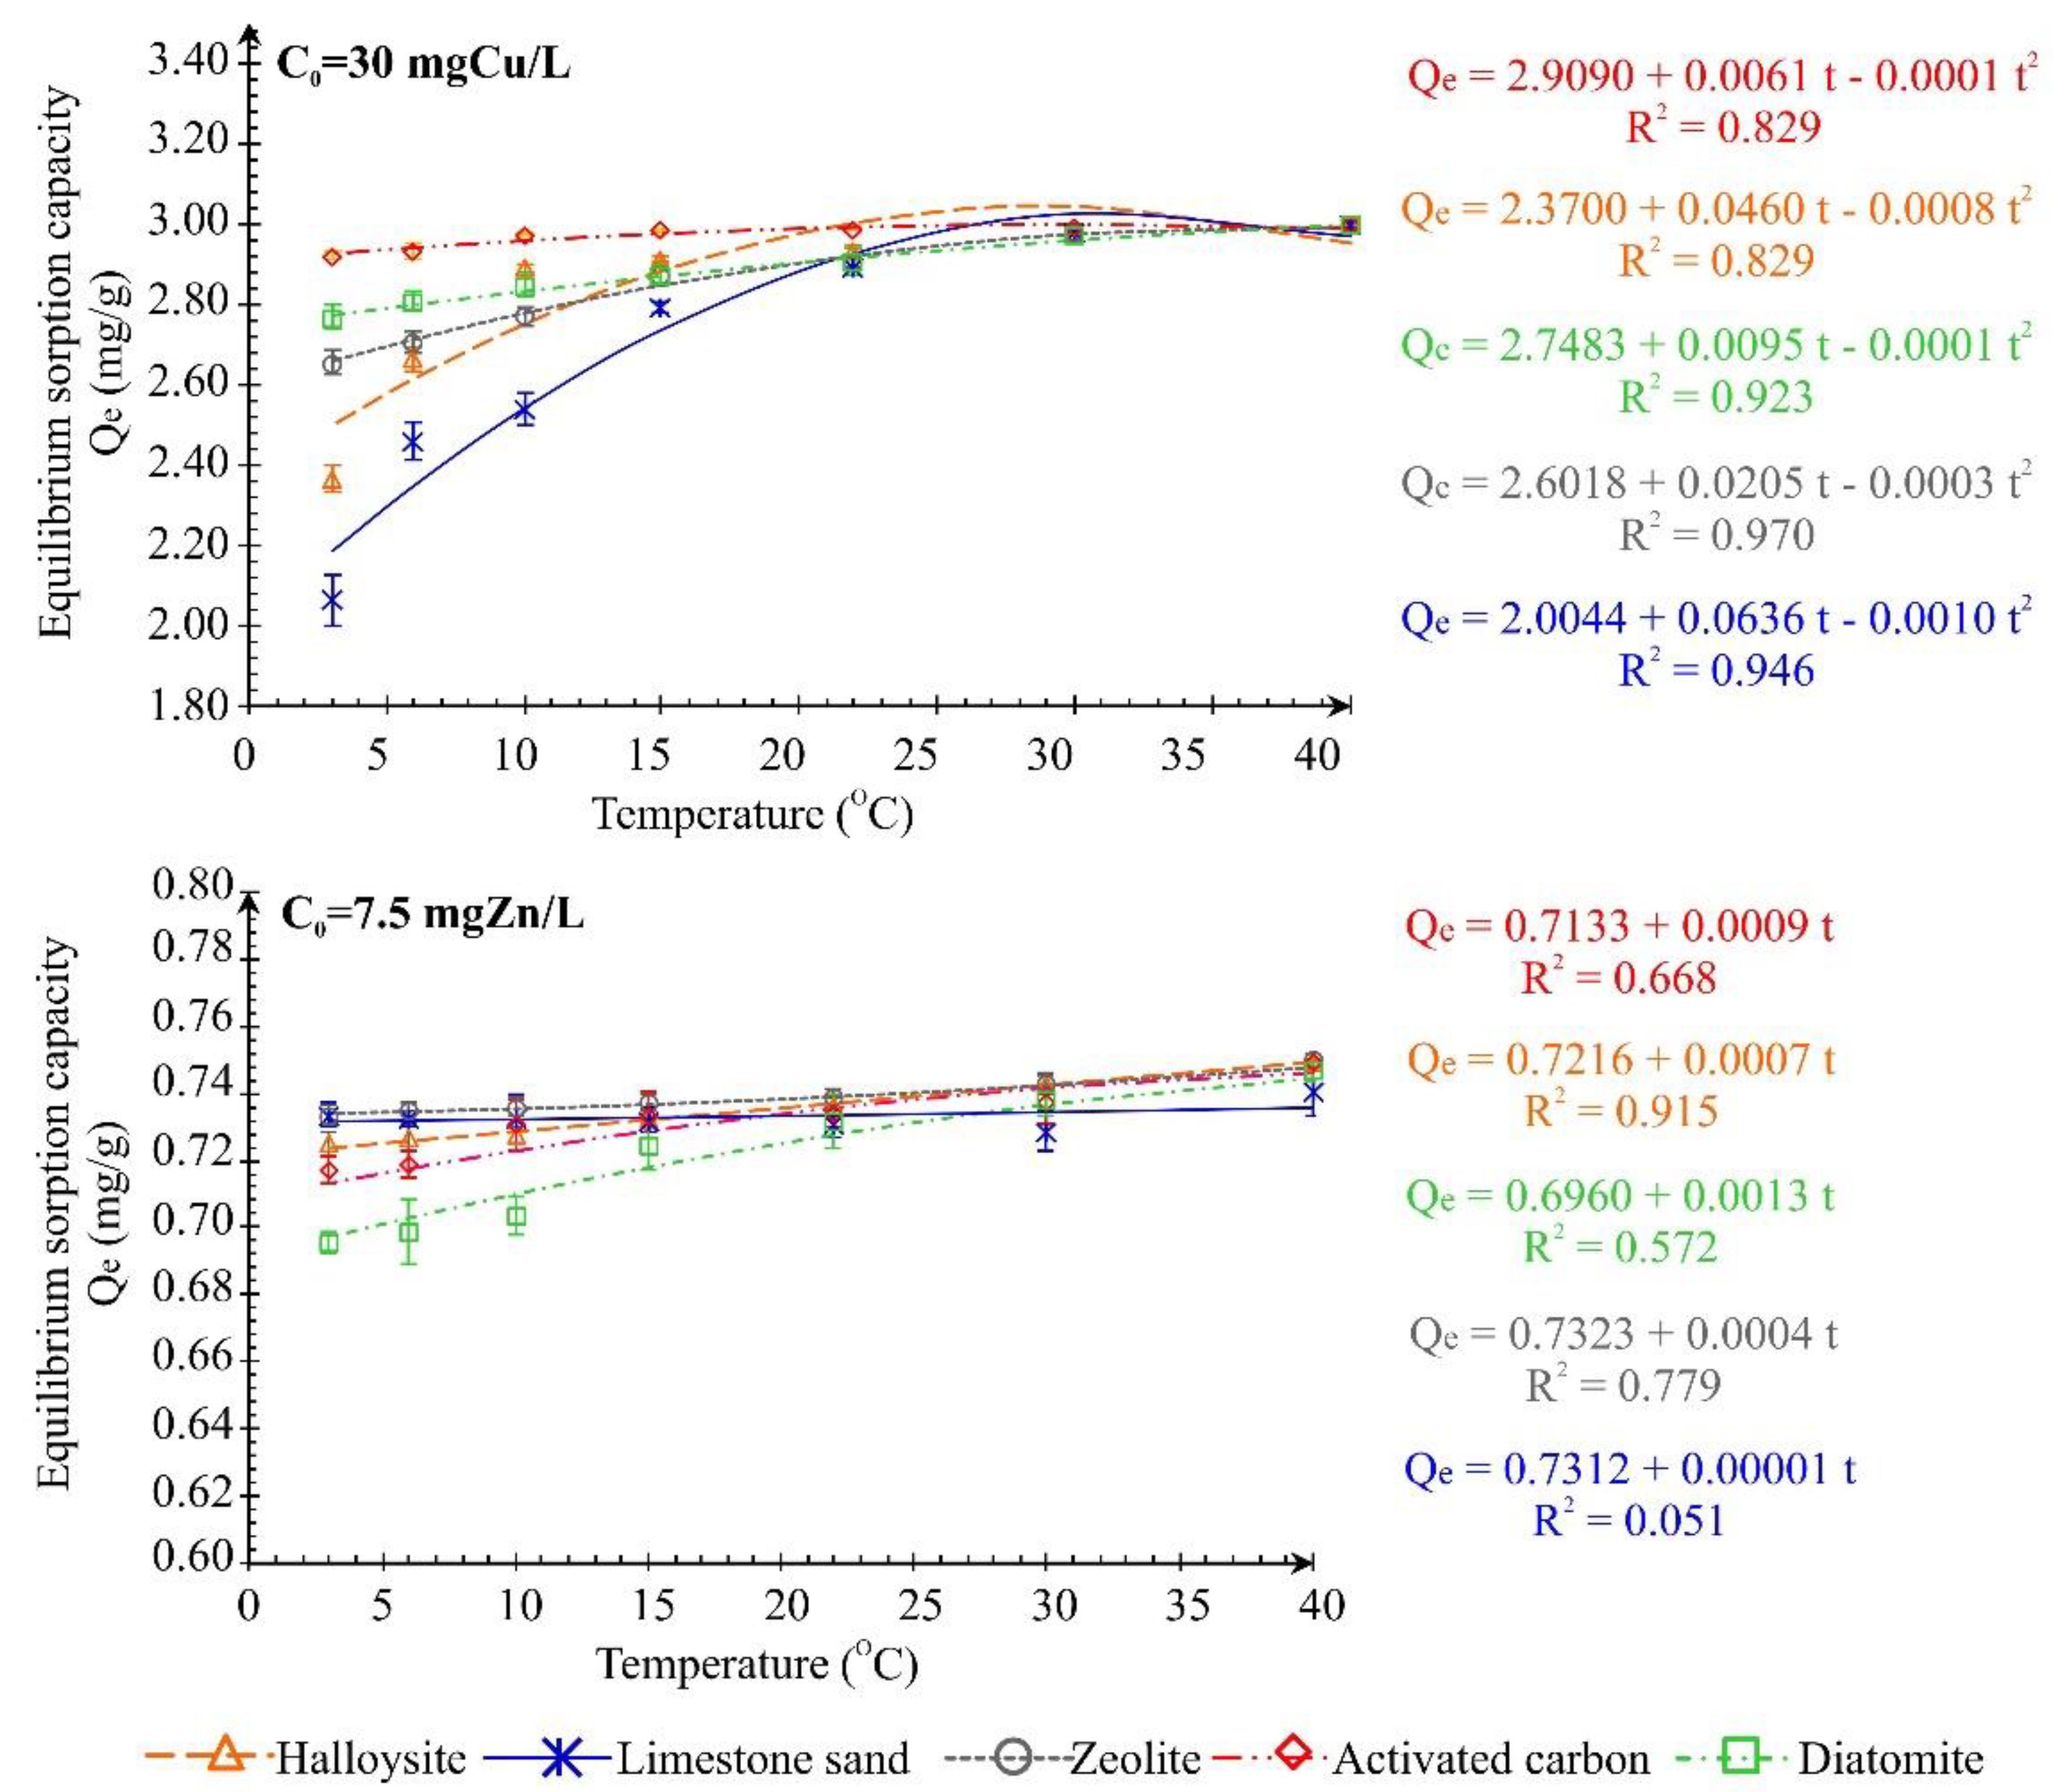
The influence of temperature on the removal of heavy metals at initial concentrations of 30 mg Cu/L and 7.5 mg Zn/L in addition to empirically fitted relationships linking these two parameters, are presented in Figure 3, whilst the Pearson’s correlation coefficients are presented in Table 3. The relationships have been presented as polynomials only in the case of statistical significance of all function terms, otherwise a linear relationship is assumed. The intensity of removal of copper and zinc ions changed with temperature and was dependent on the reactive material and metal; however, correlation analysis showed a positive relationship between these variables. Only in the case of Zn removal using limestone sand were the values of Pearson’s correlation coefficient (R = 0.224) and statistical significance (p = 0.3288) such that the relationship was statistically not significant.
Removal of Cu was least influenced by the changes of temperature for activated carbon (ΔQe = 0.075 mg/g) and most influenced for limestone sand (ΔQe = 0.933 mg/g). The reactive materials used in the investigations can be arranged with regard to the change of the equilibrium sorption capacity (ΔQe for Cu ions) as follows: activated carbon < diatomite (ΔQe = 0.230 mg/g) < zeolite (ΔQe = 0.341 mg/g) < halloysite (ΔQe = 0.631 mg/g) < limestone sand. An analogous series obtained for zinc ions is as follows: zeolite < halloysite < activated carbon < diatomite, and for this contaminant, the changes of the equilibrium sorption capacity did not exceed 0.051 mg/g. The series does not include limestone sand, because a continuous increase of Qe with temperature increase was not noted.
The probable reason for the shape of the curves describing the obtained results (Figure 3) was the restricted mass of Cu and Zn (below the maximum sorption capacity), which was insufficient to fill the available negatively charges sites. At initial Zn concentrations equal to 7.5 mg/L (lower than for Cu), temperature change in the range of 3 °C to 40 °C had no practical significance, whereas at initial Cu concentrations equal to 30 mg/L, decrease of temperature to 3 °C resulted in restricting the degree of ion removal particularly on limestone sand and halloysite.
3.2.2. Equilibrium Tests
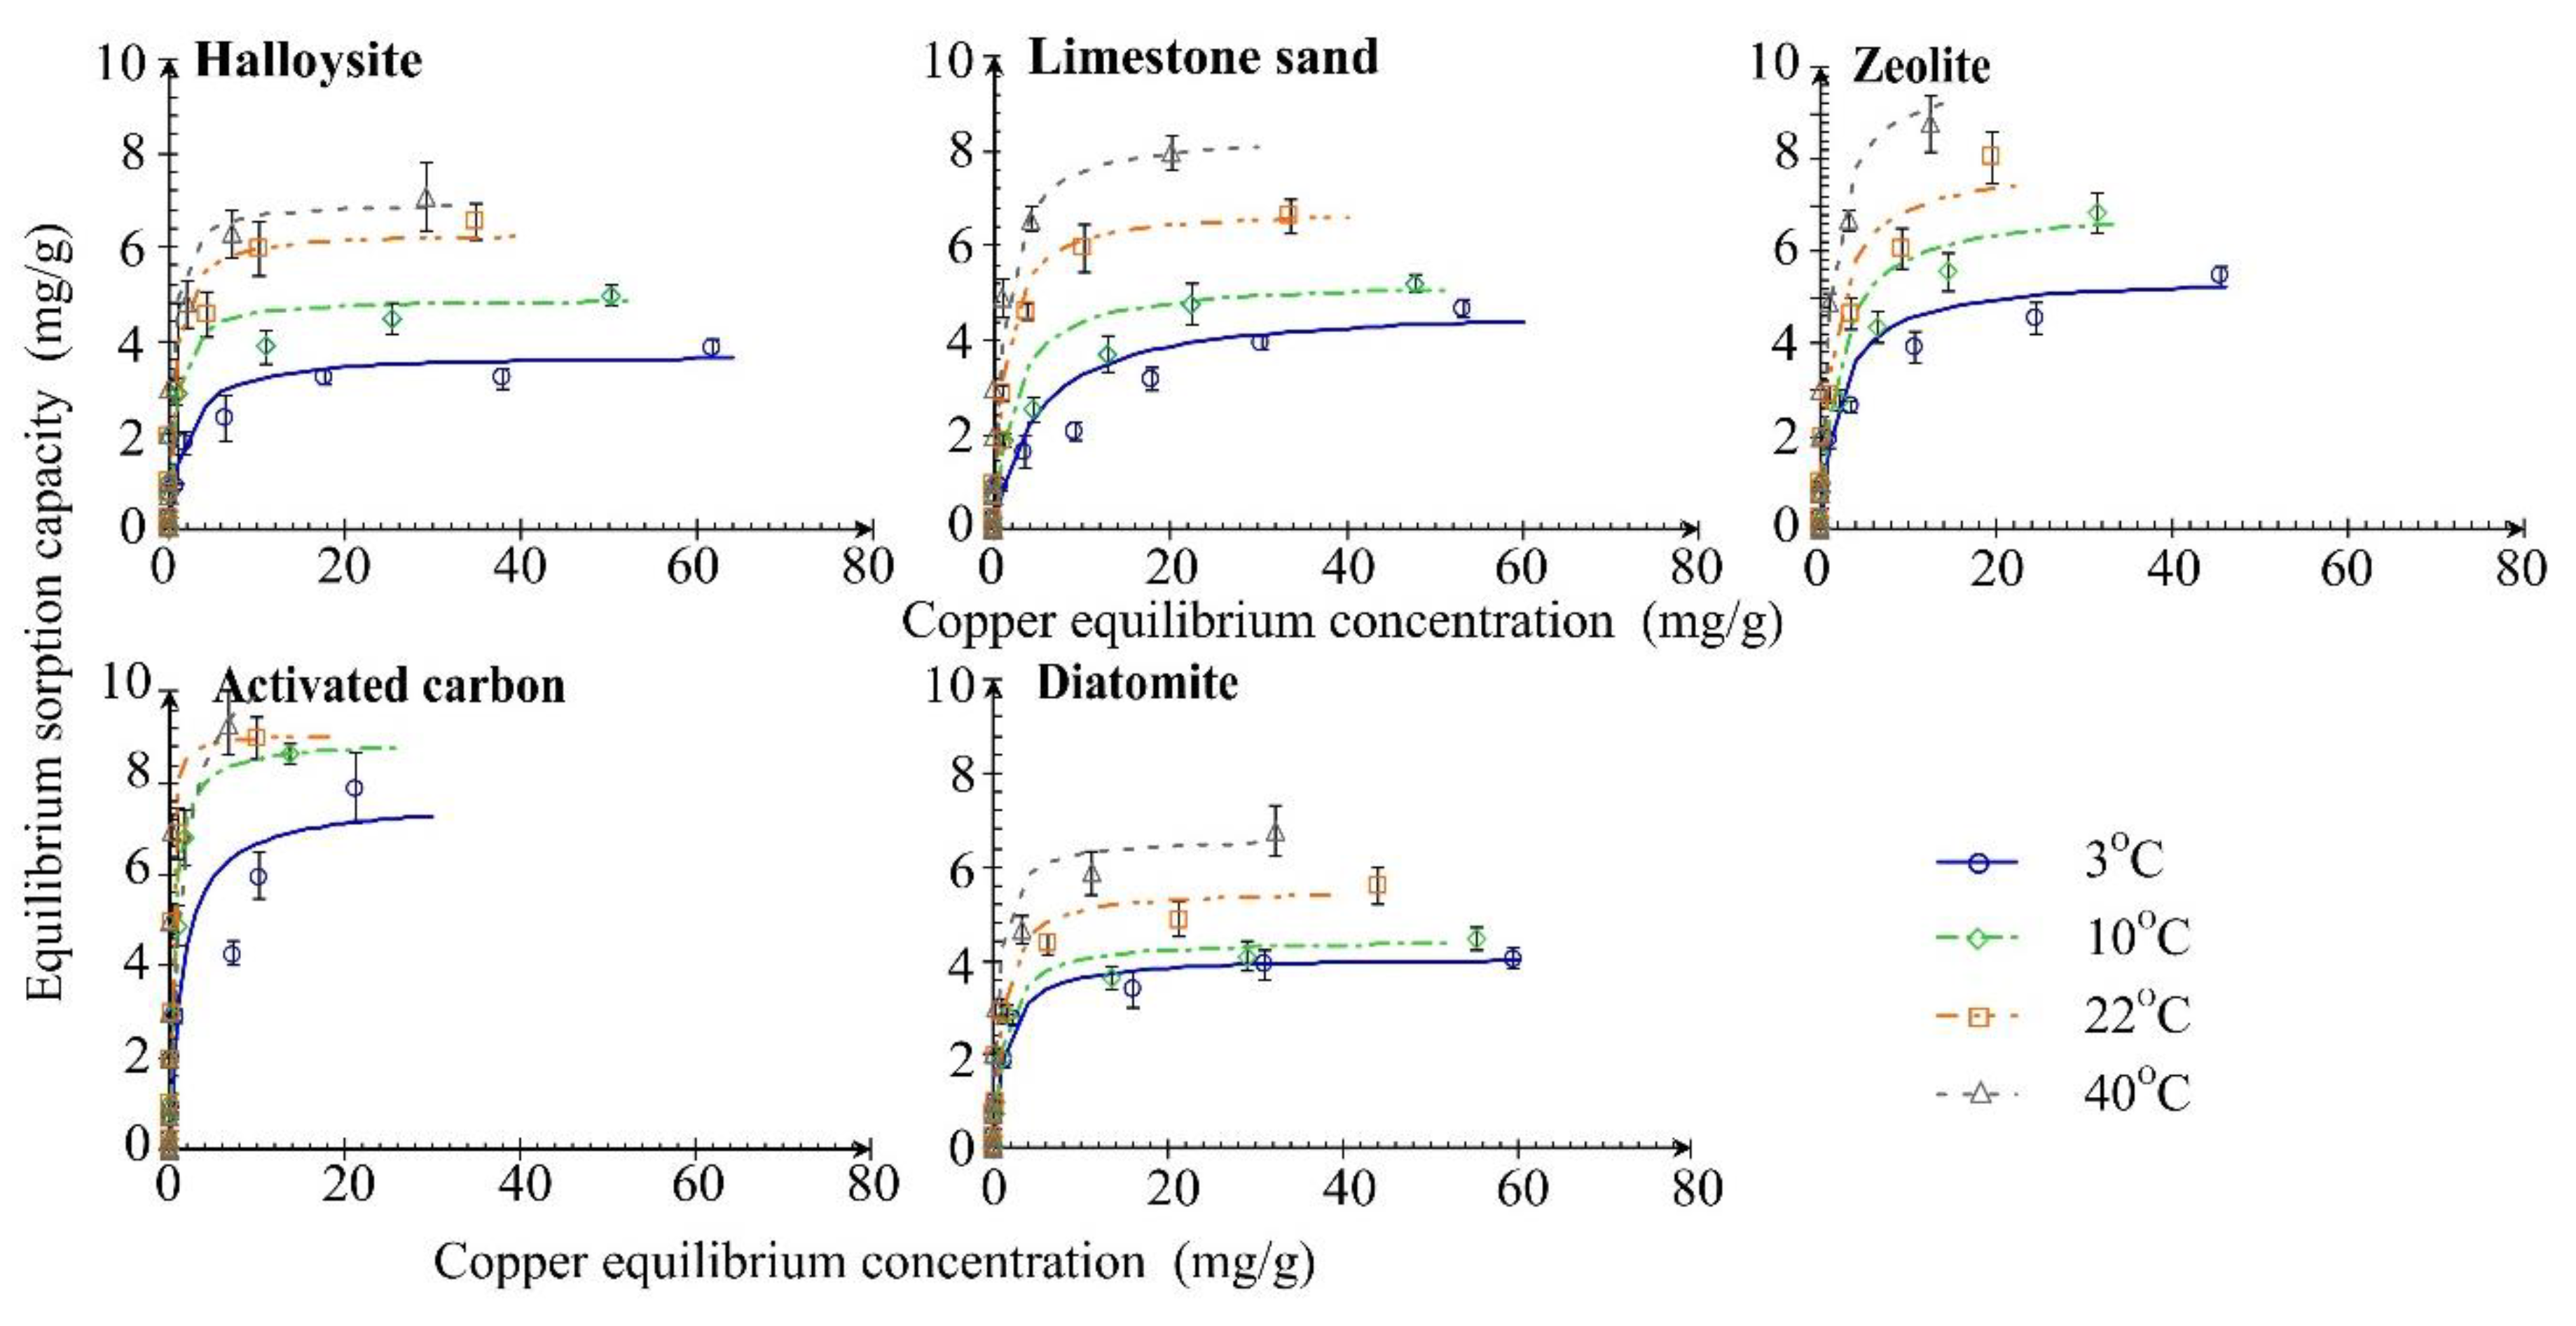
Equilibrium tests demonstrated that for both metals temperature influences contaminant removal Figure 4 and Figure 5. However, the shape of curves showing the dependence for Zn and limestone sand at 22 °C and 40 °C (Figure 5), potentially pointing to a precipitation process, did not allow for the determination of the maximum adsorption capacity of this material with regard to Zn ions. The concentration of heavy metals may be regulated by processes depending both on the metal type, but also geochemical conditions influencing metal speciation. Dissolution of Ca2+ and release of HCO3- linked with temperature increase may lead to precipitation of Zn in form of ZnCO3. As shown by previous studies, the formation of smithsonite is the main mechanism of Zn2+ ion removal by limestone materials [41]. Additionally, the intensity of heavy metal removal on limestone materials may be linked with chemisorption of metal ions resulting from the rough surfaces of the material, precipitation of metals in the form of metal hydroxides and carbonate, and ion exchange with calcium [59]. In the studies performed herein, precipitation of heavy metals could take place at low initial concentrations, because the pH of equilibrium solutions was below 8.74 for Zn and 8.04 for Cu, whereas in a higher range of initial concentrations, the pH of equilibrium solutions was below 6.88 for Zn and 5.91 for Cu. In the case of the remaining materials, precipitation of Zn and Cu was less significant, because pH was within 5.26 to 7.55 for activated carbon, 5.07 to 7.52 for halloysite, 5.08 to 6.56 for zeolite, and 5.05 to 6.95 for diatomite. Removal of heavy metals on zeolite is generally via ion exchange [36], but also takes place through electrostatic adsorption to negatively charged sites on the zeolite surface [31]. Moreover, heavy metals are removed on halloysite and diatomite via ion exchange and surface complexation respectively on permanently charged sites and variably charged sites [40,60].
An analysis of heavy metal (Cu and Zn) removal equilibrium studies showed a greater influence of temperature on the removal of copper ions compared to zinc ions. Comparison of maximum adsorption capacities of the analyzed reactive materials Qmax for Cu and Zn and the constants of adsorption equilibrium KL determined by describing the obtained results with the Langmuir isotherm equation (Equation (1)) is presented in Figure 6 and Table 4, respectively. Removal of heavy metals (Cu and Zn) on all reactive materials was well described by the Langmuir isotherm with the determination coefficient of R2 ≥ 0.932 (Table 4). The only exception was removal of Cu on activated carbon and on zeolite at 40 °C, described by the Langmuir isotherm with determination coefficient at 0.415 and 0.799, respectively. The material with the best ability to remove Cu ions was activated carbon, followed by limestone sand, halloysite and diatomite, whereas Zn ions were best removed by limestone sand, zeolite, halloysite, diatomite and activated carbon. It cannot be stated unequivocally that the copper ions were removed with larger intensity than zinc ions for all materials. Such a relationship was observed only for activated carbon. Halloysite and limestone sand were more useful for zinc removal. However, it should be emphasized that the maximum adsorption capacity of limestone sand with regard to zinc at 22 °C and 40 °C was not determined in the range of the analyzed concentrations A decrease of temperature from 22 °C (standard temperature for batch analyses) to 3 °C, reduced the maximum adsorption capacity of Cu by approximately 41% for halloysite (by 2.585 mg/g). The next reactive material in the series was zeolite (by 2.407 mg/g), next—limestone sand (by 2.062 mg/g), activated carbon (by 1.462 mg/g) and diatomite (by 1.431 mg/g). For Zn ions the efficiency of the reactive materials attained the following order: zeolite (decrease by 2.148 mg/g), halloysite (by 1.669 mg/g), activated carbon (by 1.198 mg/g) and diatomite (by 0.749 mg/g). During their studies on the application of sodium zeolite in groundwater treatment in the Antarctic using the method of permeable reactive barriers, Woinarski (Parkville, VIC, Australia) in [38] observed a decrease of Qmax by about 32% in consequence of temperature fall from 22 °C to 2 °C. In the analysis presented herein, for raw zeolite this value was 31% at temperature change from 22 °C to 3 °C and 44% at change from 40 °C to 3 °C.
Based on parameter RL (Figure 6) calculated from the Langmuir equilibrium constant KL (RL = 1/(1 + KL·C0)), the processes of heavy metal removal on the analyzed materials may be characterized as favorable, because the RL value was within 0 to 1. Moreover, at higher concentrations of metals in the solution, RL attained values close zero (RL < 0.05), therefore sorption was close to irreversible. It was also observed that with temperature rise, the RL value decreased for all materials except Cu removal on activated carbon and Zn removal on limestone sand. In the first case, the most probable cause is the excess capacity of activated carbon at 40 °C, whereas in the second, it is the large contribution of precipitation processes in the removal of zinc on limestone sand.
Statistical analysis of the relationships between maximum adsorption capacities with regard to Cu determined at temperatures from 3 °C to 40 °C and the measured properties of reactive materials showed the lack of statistical significance for the specific surface area, average pore size and volume, pH of the materials and content of the fraction below 0.5 mm on the value of Qmax. A positive correlation was observed only with the content of Na2O in the composition of the materials (Pearson’s coefficient R larger than 0.936), which was 1.23% for activated carbon, 0.96% for zeolite and 0.37% for limestone sand, whereas Na2O was not observed among the oxides in diatomite and halloysite. Additionally, a distinct positive correlation was observed between the difference of Qmax determined for the most extreme temperatures (ΔQmax) and the content of K2O (R = 0.879), and a negative correlation with the content of Fe2O3 (R = −0.926). The studied zeolite is characterized by the presence of K2O at the level of 3.51% and Fe2O3 at the level of 1.58, diatomite at the level of 0% and 37.04% respectively, limestone sand at the level of 1.18% and 4.30% respectively, and halloysite at the level of 0.42% and 3.95% respectively. In equilibrium tests for zinc, there was a positive correlation between Qmax and the average pore size (R > 0.886), and also between ΔQmax and the CaO content (R = 0.965). The percentage contribution of CaO was 86.93% for limestone sand, 3.17% for zeolite, 1.37% for activated carbon, and 0.67% for halloysite, whereas CaO was not noted in the diatomite sample. It should be emphasized that in this case correlation with the reaction of equilibrium solutions and the pH of the reactive materials was also not observed. The possible explanation was that in batch studies, the ratio between the solution volume to the mass of the reactive material was large (0.500 g material per 50 mL solution), which influenced smaller changes of the reactions of equilibrium solutions (pHe in the range from 5.05 to 8.04 for Cu and from 5.87 to 8.74 for Zn) in relation to the initial solutions (pH0 in the range from 5.83 for Cu and 6.51 for Zn to 7.00 for distilled water).
3.3. Biogenic Components
3.3.1. Effect of Temperature at Low Initial Concentrations
Change of the equilibrium sorption capacity of reactive materials with regard to ammonium ions and phosphates in the temperature range from 3 °C to 30 °C with empirical fits are presented in Figure 7. Results of tests conducted at 40 °C were not presented for biogenic components because the differences in the measured equilibrium concentrations for the three replicates exceeded 10%. At initial concentrations of contaminants at 10 mg/L NH4-N and PO4-P, no significant influence of temperature on the intensity of biogenic components removal was observed.
The sorption capacity of the analyzed materials in relation to ammonium ions increased with temperature change from 3 °C to 22 °C. However, the difference between total amounts of ammonium ions removed by the materials at 3 °C and 22 °C was not large, and varied from 0.038 mg/g for halloysite to 0.174 mg/g for diatomite in the studied temperature range. Further temperature increase caused higher intensity of contaminant removal on limestone sand, whereas a decrease of NH4-N removal was observed in the case of the remaining materials. However, taking into account practical significance, such variability will not have substantial impact on the degree of stormwater treatment. All terms of the polynomial functions turned out to be statistically significant for all materials with the exception of functions describing removal of ammonium ions on limestone sand. For this material, a description of the observations by a polynomial equation did not cause an increase of the determination coefficient value; therefore, Figure 7 shows a linear relationship. Additionally, the efficiencies of diatomite, halloysite, limestone sand and activated carbon to remove NH4-N ions were similar; only zeolite was characterized by a higher sorption capacity in comparison to the remaining materials.
In the case of phosphate ion removal on all analyzed materials, there was a statistically significant (at p < 0.05) positive correlation between temperature and the dependent variable, i.e., sorption capacity (Table 3). However, similar to the case of ammonium ions, the changes of the equilibrium sorption capacity were insignificant, in the range from 0.019 mg/g for limestone sand to 0.299 mg/g for halloysite. It should be emphasized that for these materials temperature increase above room levels was linked with a decrease of Qe. These relationships were described with a polynomial function and the analysis of polynomial regression showed statistical significance of all three terms of the equation for all materials. The material that best removed phosphates from water solutions was activated carbon, followed by halloysite and diatomite, whereas phosphates were least removed by limestone sand and zeolite.
However, negative correlations between the sorption capacity of the applied materials and temperature increase have been documented in the literature, e.g., for some natural zeolites [61,62] and halloysite [63]. A relationship similar to that presented herein was observed by Jing et al. [64] for halloysite from a Chinese reservoir; in those studies, the sorption capacity increased with rising temperature. In turn, Zheng et al. [34] observed that the removal efficiency of the ammonium ion increased with rising temperature at temperatures below 25 °C, and further temperature increase caused decrease in the efficiency of contamination removal. These authors have explained this phenomenon by the low rate of chemical adsorption, which increased with temperature rise to room temperature. However, in the case of exothermic processes, further temperature increase causes larger desorption of contaminants. A similar trend of temperature impact on the removal processes was also observed for biogenic components at initial concentrations of 10 mg/L, but the thermodynamic parameters of the process in the temperature range of 3 °C to 22 °C (ΔH0 > 0) pointed to the endothermic character of the process (Table 4).
3.3.2. Equilibrium Tests
The dependence of the ammonium ion concentration in the solution and the sorption capacity in equilibrium conditions is presented in Figure 8. The assumed initial concentration range was too small to exhaust the maximum sorption capacity of the zeolite. Therefore, the parameters of the Langmuir equation were determined at R2 < 0.833 and fitted Langmuir isotherms where not presented. Ammonium ions represent only part of the nitrogen compounds present in stormwater and their content increases in agricultural areas [8,9,12]. According to Toor et al. [65], the contribution of nitrates in total nitrogen in stormwater is about 58%, whereas all other forms, including ammonium ions, contribute to 42%. The maximum permissible concentration of ammonium ions according to the World Health Organization (WHO, Geneva, Switzerland) is 10 mg/L. Emission control of this compound is particularly crucial with regard to the oxidation of ammonium ions, resulting in the production of nitrites and nitrates harmful for human health and at the same time extremely difficult to remove in in-situ conditions [7,20]. The usefulness of zeolites in the removal of ammonium ions during ion exchange processes has been widely documented [65,66]. An important property influencing the intensity of these processes is the cation exchangeable capacity (CEC) [66,67,68,69], which was at 118.02 meq/100 g for the zeolite studied. CEC of the remaining material was in the range from 1.12 meq/100 g for limestone sand to 13.88 meq/100 g for diatomite (Table 2), and the intensity of NH4-N removal on these materials was lower than for zeolite. Statistical analysis showed a positive correlation of CEC both with the maximum adsorption capacity Qmax (R = 0.996), as well as the difference of the Qmax values calculated for extreme temperatures ΔQmax (R = 0.971). A similar degree of reduction of the ammonium ion concentration due to contact with halloysite, limestone sand, activated carbon and diatomite was not the result of gaseous ammonia release caused by solution pH increase. The average value of the pH of equilibrium solutions was from 6.8 for diatomite to 7.9 for activated carbon, and in such conditions the percentage content of ammonium was below 1.5%. There was a positive relationship between K2O and MnO, and the maximum adsorption capacity and ΔQmax (R respectively larger than 0.938 and 0.984), and the CEC value was positively correlated with K2O (R = 0.938) and MnO (R = 0.984) contents.
The curves showing the relationship of equilibrium concentration and sorption capacity for diatomite attained a specific shape (Figure 8). A significant influence of temperature on the equilibrium concentration of ammonium ions was observed for this material at low initial concentrations of this contaminant, whereas at initial concentrations exceeding 20 mg NH4-N/L the influence of temperature was insignificant. Tan and Hameed [70] indicated difficulties in the interpretation of the results resulting from the influence of temperature and pH on the shapes of equilibrium isotherms. As shown by Jing et al. [71], ammonium ions are removed on diatomite due to physical adsorption. They also showed that diatomite is negatively charged in an environment with pH exceeding 3.0, whereas according to Li et al. [72] this takes place at pH above 6. It was observed herein that the pH of equilibrium solutions increased with increase of contamination load, attaining a maximum of 7.53. Therefore, it may be concluded that at lower pH values (corresponding to lower initial concentrations of NH4-N), the surface of diatomite was less negatively charged, and temperature increase could influence the slight increase of the removal processes intensity. Moreover, Jing et al. [64] have observed that removal of NH4-N on halloysite is not the result of electrostatic interaction. They have evidenced that halloysite had a higher negatively charged surface, but the maximum sorption capacity was relatively small, similarly as in the analyses presented herein.
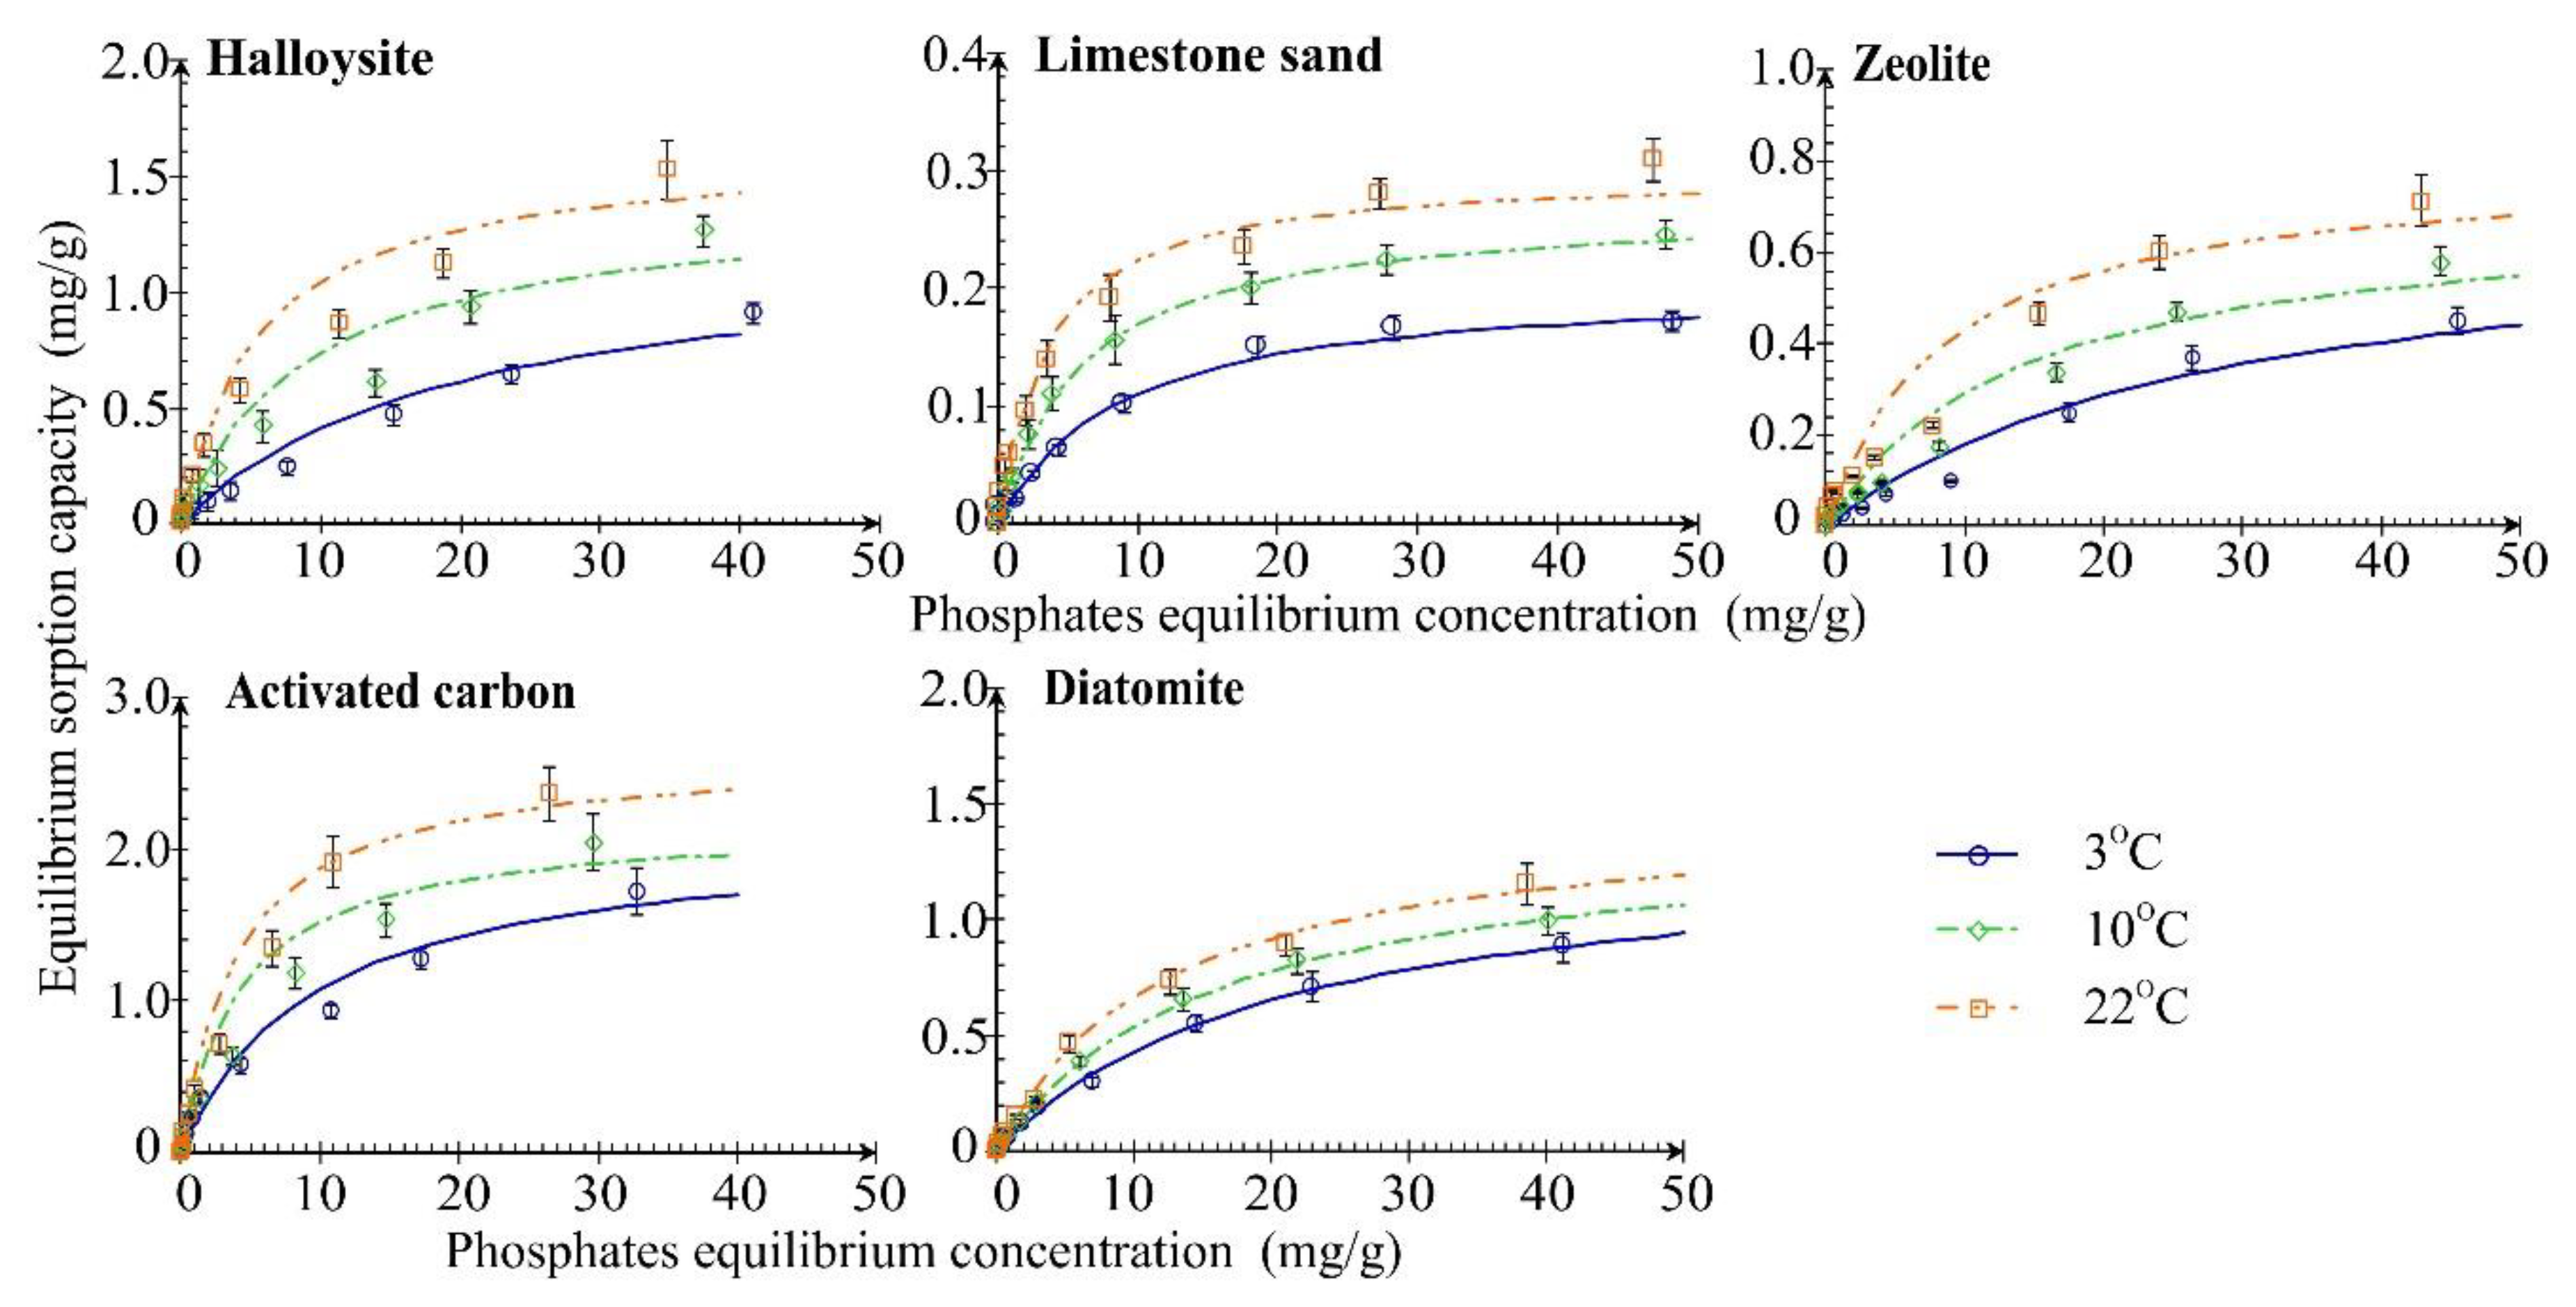
The intensity of phosphate removal from aqueous solutions and the influence of temperature on these processes were more variable than in the case of ammonium ions (Figure 9 and Figure 10). In samples with a zero value of the phosphate initial concentration, the phosphate concentration in solutions being in contact with zeolite and halloysite attained values above zero after reaching equilibrium. These observations were concordant with the results of studies on the oxide content in selected reactive materials. The presence of P2O5 was observed only in these two materials: 0.39% in zeolite and 0.54% in halloysite. Average removal of phosphates was calculated at 0.14 mg/g of zeolite and 0.19 mg/g for halloysite, respectively.
The mechanisms of binding or removal of phosphorus compounds may be very variable and depend on pH, temperature, presence of competing compounds, salinity, occurrence of organic matter or grain-size distribution [73]. For example, high values of environmental pH may stimulate phosphorus adsorption through ligand exchange of HPO42− or H2PO4− ions present in the solution with OH- ions present on the surfaces of solid particles [74]. Reddy and DeLaune [75] stated that temperature increase causes increase of the energy at which phosphorus sorption is bound in soils and sediments and shortening of the time needed for the formation of crystalline forms. Moreover, as pointed out by Reddy and DeLaune [75], in the presence of limestone rocks, orthophosphates are adsorbed on the surface of the material forming CaHPO4 or replacing CO32− by HPO42−. However, taking into account the measured maximum sorption capacities of limestone sand (from 0.205 to 0.300 mg/g), it can be concluded that such processes did not take place. This is most probably related with the pH of equilibrium solutions below 7.5, because most mentioned processes take place in an alkaline environment. Moreover, according to Yang et al. [76], the zeta-potential of halloysite is at pH range of 6 to 7, whereas Veerabadran et al. [77] suggested that the external surface of halloysite exhibits a negative zeta-potential over a pH range of 2.5–8.5. The pH of equilibrium solutions for this material is in the range of 6.07 to 6.93 and for zeolites, i.e., in the range of 6.74 to 7.74. In the case of the second material, phosphorus removal may be caused by electrostatic adsorption, because the point of zero charge of this material can range from 8.5 to 9.0 [30].
Equilibrium tests for ammonium and phosphate ions were performed only in the temperature range from 3 °C to 22 °C; therefore, the relationship of the maximum adsorption capacity and temperature has not been described by a polynomial function (Figure 10). Similarly, as in analyses of series I, ammonium ions were removed most intensely by zeolite (Qmax in the range from 8.450 to 9.723 mg/g); the maximum sorption capacities of the remaining materials attained similar values from 0.960 (activated carbon) to 1.233 mg/g (diatomite). In the case of phosphates, the material with the highest removal capacity was activated carbon (Qmax in the range from 2.114 to 2.634 mg/g), followed by halloysite (from 1.224 to 1.617 mg/g), diatomite (from 1.329 to 1.477 mg/g), zeolite (from 0.668 to 0.797 mg/g) and limestone sand (from 0.204 to 0.300 mg/g). It should be emphasized that a slight decrease of Qmax with regard to NH4-N was noted for diatomite, limestone sand and halloysite, but these changes were below 0.146 mg/g.
Langmuir parameters for the removal of ammonium ions were determined at R2 from 0.982 to 0.999 (Table 4). The only exception are results obtained for zeolite (R2 from 0.771 to 0.833). Lower values of R2 could be caused by the non-exhaustion of the maximum sorption capacity of the materials in the established range of contaminants. The results of phosphate removal (R2 from 0.548 to 0.986) were described least precisely, despite the fact that numerous authors have shown the usefulness of the Langmuir isotherm for the description of phosphate sorption on minerals and organic materials [78,79]. This could be caused by the low abilities of the applied materials for the removal of such contaminants. According to Reddy and DeLaune [75], the increase of removal capacity with increasing temperature may be related to the increase of the bonding energy of phosphorus sorption and precipitation rates.
Evaluations of parameter RL calculated on the basis of the Langmuir adsorption constant indicated that the sorption of ammonium and phosphate ions in the analyzed range of concentrations and temperatures is favorable (0 < RL < 1), and removal of phosphates at low concentrations of these contaminants in the solution is similar to linear and less favorable. This is confirmed by values of RL close to one. Moreover, the most favorable adsorption process was determined for the highest temperatures for all materials and contaminants, as evidenced by lower RL values. However, these differences were insignificant in the case of NH4-N removal on zeolite and phosphates on all materials. Jing et al. [64] also observed an increase of the maximum sorption capacities of halloysite with regard to ammonium ions with temperature increase (from 0.514 mgNH4-N/g at 15 °C to 0.737 mgNH4-N/g at 40 °C), but in these investigations the values of Langmuir equilibrium constant KL decreased (therefore RL increased) with temperature change from 15 °C to 40 °C as opposed to the analysis in this paper.
3.4. Thermodynamic Parameters
Table 4 shows thermodynamic parameters calculated at various temperatures. ΔH0 and ΔS0 were calculated from the slope and intercept of van’t Hoff plots of lnKC against 1/T and the ΔG0 from Equation (4). The results showed that the process of removal of all heavy metals and biogenic substances on zeolite, halloysite, diatomite, limestone sand and activated carbon was endothermic, as evidenced by the increase of contaminant removal degree with temperature and positive values of ΔH0 [80]. Further, negative values of ΔG0 indicated that the removal processes of the analyzed contaminants on 5 reactive materials had a spontaneous nature and was thermodynamically favorable in the given experiment conditions [81]. In turn, positive values of ΔS0 indicated that contaminant removal was spontaneous at high temperatures, reflected the affinity of reactive materials to the analyzed contaminants, and confirmed the increased randomness at the solid-liquid interface during adsorption [82]. Based on the obtained calculation results, it may be assumed that the processes of Cu removal on diatomite and zeolite, NH4-N removal on activated carbon, and PO4-P removal on diatomite represented physisorption. Removal of zinc on all five materials, copper on limestone sand and halloysite, ammonium ions on zeolite, limestone sand and halloysite and phosphates on all tested materials except diatomite resulted from electrostatic interaction. The mechanism of chemical sorption played a role only in copper and ammonium ion removal with the application of activated carbon and diatomite. These conclusions were drawn based on an overview by Anastopoulos et al. [83], according to which the value of ΔH0 < 20 kJ/mol is characteristic for physisorption, ΔH0 in the range of 20 to 80 kJ/mol is typical for electrostatic interaction, a ΔH0 in the range of 80 to 450 kJ/mol is characteristic for chemical adsorption.
4. Potential Application of the Study Results
The studies conducted have demonstrated that ambient temperatures may influence the removal of contaminants transported with stormwater from urban areas through permeable treatment zones. Analyzing the results of conducted tests, the contaminants load CL (milligrams of added contaminants per grams of reactive material) treated to a certain level of contaminants concentration was determined (Table 5). The permissible concentrations of contaminants transported with sewage to water or to soil were assumed, 0.5 mg Cu/L, 2 mg Zn/L, 10 mg NH4-N/L and 5 mg PO4-P/L, respectively. Values of the CL may have a practical significance. Although at higher loads the maximum sorption capacity of the materials was not exceeded, the equilibrium concentration exceeded the permissible level. The conclusions drawn from the analysis of CL values are consistent with conclusions based on changes of Qmax values. The highest impact of the temperature decrease was observed for Cu removal on activated carbon and Zn removal on limestone sand and the lowest for NH4-N removal on diatomite, limestone sand, halloysite and activated carbon. The values of CL and Qmax determined at low and high temperatures may be helpful during design stage of the dimensions and maintenance frequency of treatment zone operated in cold region.
Moreover, the studies confirmed that contaminants present in stormwater from urbanized areas cannot be removed with one universal reactive material. Only the use of a mixture of several reactive materials can ensure the removal of a larger spectrum of contaminants. The conclusion is consistent with those presented by other researchers [17,18,20,29,30]. The obtained test results indicate that the highest removal efficiency of Cu and PO4-P has activated carbon, of Zn—limestone sand, and of NH4-N—zeolite.
5. Conclusions
This study highlights the impact of temperature on the removal efficiency of selected inorganic contaminants typical for stormwater on activated carbon and low-cost mineral adsorbents (diatomite, halloysite, limestone sand and zeolite). The investigation revealed that ambient temperature determining the conditions in the sub-surface soil layer, and therefore, in the sub-surface permeable treatment zone, may influence the removal of contaminants transported with stormwater from urban areas. The sorption efficiency of the studied materials (activated carbon, diatomite, halloysite, limestone sand and zeolite) became weaker with decreasing temperature, particularly for heavy metals (from 28% to 46%) compared to biogenic substances (from −7% to 32%). However, the basic restriction of practical application of the obtained results is the use of mono-component model solutions instead of real stormwater samples. The presence of other dissolved components, competing for active locations on the surfaces of reactive materials, as well as organic matter and suspensions may influence the actual sorption abilities of the materials. In turn, the achievement of this research was to gain a better understanding of how the changes of temperature may affect the removal of heavy metals (Cu and Zn) and nutrients (NH4-N and PO4-P) from solutions being in contact with selected reactive materials.
It has been revealed that the intensity of contaminant removal variably changed with temperature depending on the reactive material and the contaminant; however, analysis of the correlation has shown a positive dependence between these two variables. The test results demonstrated that in conditions of low initial concentrations this correlation is true for heavy metals in the tested range of temperatures (from 3 °C to 40 °C) and for biogenes in the range of 3 °C to 22 °C. Further increase of temperature caused the decrease of equilibrium sorption capacity of all materials tested. The only exception was the removal of ammonium ions on limestone sand. The investigations provided a conclusion that the decrease of temperature had the greatest impact on the maximum adsorption capacities for copper, followed by zinc and ammonium (on zeolite). Moreover, the values of the analyzed parameter (Qmax) were slightly influenced by temperature changes for phosphate removal on all analyzed reactive materials, as well as ammonium ion removal on halloysite, limestone sand, activated carbon and diatomite. Furthermore, it is worth noting that temperature decrease more significantly reduced the sorption capacities of reactive materials in high concentration solutions. Unfortunately, analysis of the results of the performed investigations precludes defining a universal concentration range for all reactive materials, for which the impact of the analyzed factor may be avoided.
The performed studies indicate that the material showing the highest efficiency of Cu and PO4-P removal is activated carbon, of Zn is limestone sand, and of NH4-N is zeolite. The remaining materials were characterized by a medium efficiency of heavy metal removal and a low efficiency of biogene removal from mono-component solutions. Based on the values of maximum sorption capacity, treatment processes were most restricted by temperature fall in the case of Cu removal on activated carbon and Zn removal on limestone sand. The performed calculations indicate that the removal processes were favorable in nature, being close to irreversible for higher concentrations of heavy metals, and less favorable for lower concentrations of phosphates. Moreover, all observed processes can be characterized as endothermic and spontaneous at high temperatures.
Author Contributions
Conceptualization, J.F.; methodology, J.F.; investigation, J.F.; analysis of test results, J.F. and K.A.M.; writing—original draft preparation, J.F.; writing—review and editing, K.A.M.; visualization, J.F.
Funding
This research received no external funding.
Conflicts of Interest
The authors declare no conflict of interest.
References
- Pazwash, H. Urban Storm Water Management, 2nd ed.; CRC Press. Taylor & Francis Group: Boca Raton, FL, USA, 2016. [Google Scholar]
- Dierkes, C.; Lucke, T.; Helmreich, B. General technical approvals for decentralised sustainable urban drainage systems (SUDS)—The current situation in Germany. Sustainability 2015, 7, 3031–3051. [Google Scholar] [CrossRef]
- Tedoldi, D.; Chebbo, G.; Pierlot, D.; Kovacs, Y.; Gromaire, M.-C. Impact of runoff infiltration on contaminant accumulation and transport in the soil/filter media of Sustainable Urban Drainage Systems: A literature review. Sci. Total Environ. 2016, 569–570, 904–926. [Google Scholar] [CrossRef]
- Haile, T.M.; Fuerhacker, M. Simultaneous adsorption of heavy metals from roadway stormwater runoff using different filter media in column studies. Water 2018, 10, 1160. [Google Scholar] [CrossRef]
- Burszta-Adamiak, E. Operation of rainwater infiltration facilities. Gaz Woda i Technika Sanitarna 2008, 3, 24–28. (In Polish) [Google Scholar]
- Erickson, A.J.; Gulliver, J.S.; Weiss, P.T. Capturing phosphates with iron enhanced sand filtration. Water Res. 2012, 46, 3032–3042. [Google Scholar] [CrossRef]
- O’Reilly, A.M.; Wanielista, M.P.; Chang, N.-B.; Xuan, Z.; Harris, W.G. Nutrient removal using biosorption activated media: Preliminary biogeochemical assessment of an innovative stormwater infiltration basin. Sci. Total Environ. 2012, 432, 227–242. [Google Scholar] [CrossRef]
- Kayhanian, M.; Fruchtman, B.D.; Gulliver, J.S.; Montanaro, C.; Ranieri, E.; Wuertz, S. Review of highway runoff characteristics: Comparative analysis and universal implications. Water Res. 2012, 46, 6609–6624. [Google Scholar] [CrossRef]
- LeFevre, G.H.; Paus, K.H.; Natarajan, P.; Gulliver, J.S.; Novak, P.J.; Hozalski, R.M. Review of dissolved pollutants in urban storm water and their removal and fate in bioretention cells. J. Environ. Eng. 2015, 141, 04014050. [Google Scholar] [CrossRef]
- Lundy, L.; Ellis, J.B.; Revitt, D.M. Risk prioritisation of stormwater pollutant sources. Water Res. 2012, 46, 6589–6600. [Google Scholar] [CrossRef] [Green Version]
- Brown, J.N.; Peak, B.M. Sources of heavy metals and polycyclic aromatic hydrocarbons in urban storm water runoff. Sci. Total Environ. 2006, 359, 145–155. [Google Scholar] [CrossRef]
- Gasperi, J.; Sebastian, C.; Ruban, V.; Delamain, M.; Percot, S.; Wiest, L.; Mirande, C.; Caupos, E.; Demare, D.; Kessoo, M.D.K.; et al. Micropollutants in urban stormwater: Occurrence. concentrations. and atmospheric contributions for a wide range of contaminants in three French catchments. Environ. Sci. Pollut. Res. Int. 2014, 21, 5267–5281. [Google Scholar] [CrossRef] [PubMed]
- European Parliament. Directive 2000/60/EC of the European Parliament and of the council of 23 October 2000 establishing a framework for Community action in the field of water policy. Off. J. Eur. Communities L. 2000, 327, 1–72. [Google Scholar]
- Zhou, W.; Beck, B.F.; Green, E.T. Evaluation of a peat filtration system for treating highway runoff in a karst setting. Environ. Geol. 2003, 44, 187–202. [Google Scholar] [CrossRef]
- Hilliges, R.; Schriewer, A.; Helmreich, B. A three-stage treatment system for highly polluted urban road runoff. J. Environ. Manag. 2013, 128, 306–312. [Google Scholar] [CrossRef]
- Reddy, K.R.; Kumar, G. Permeable reactive filter systems for the treatment of urban stormwater runoff with mixed pollutants. Geotechn. Front. 2017, 508–517. [Google Scholar] [CrossRef]
- Fuerhacker, M.; Haile, T.M.; Monai, B.; Mentler, A. Performance of a filtration system equipped with filter media for parking lot runoff treatment. Desalination 2011, 275, 118–125. [Google Scholar] [CrossRef]
- Vesting, A. Entwicklung und Evaluation eines dezentralen Behandlungssystems zum Rückhalt von organischen Spurenstoffen und Schwermetallen aus Verkehrsflächenabflüssen. Ph.D. Thesis, Ruhr-Universität, Bochum, Germany, 2018. [Google Scholar]
- Birch, G.F.; Fayeli, F.S.; Matthai, C. Efficiency of an infiltration basin in removing contaminants from urban storm water. Environ. Monit. Assess. 2005, 101, 145–155. [Google Scholar]
- Hatt, B.E.; Fletcher, T.D.; Deletic, A. Treatment performance of gravel filter media: Implications for design and application of stormwater infiltration systems. Water Res. 2007, 41, 2513–2524. [Google Scholar] [CrossRef]
- Fronczyk, J. Artificial road runoff water treatment by a pilot-scale horizontal permeable treatment zone. Ecol. Eng. 2017, 107, 198–207. [Google Scholar] [CrossRef]
- Cederkvist, K.; Jensen, M.B.; Holm, P.E. Method for assessment of stormwater treatment facilities—Synthetic road runoff addition including micro-pollutants and tracer. J. Environ. Manag. 2017, 198, 107–117. [Google Scholar] [CrossRef] [PubMed]
- Karczmarczyk, A.; Bus, A. Removal of phosphorus using suspended reactive filters (SRFs)–efficiency and potential applications. Water Sci. Technol. 2017, 76, 1104–1111. [Google Scholar] [CrossRef]
- Flanagan, K.; Branchu, P.; Boudahmane, L.; Caupos, E.; Demare, D.; Deshayes, S.; Dubois, P.; Meffray, L.; Partibane, C.; Saad, M.; et al. Field performance of two biofiltration systems treating micropollutants from road runoff. Water Res. 2018, 145, 562–578. [Google Scholar] [CrossRef] [PubMed]
- Kim, S.; Singh, V.P. Modeling daily soil temperature using data-driven models and spatial distribution. Theor. Appl. Climatol. 2014, 118, 465–479. [Google Scholar] [CrossRef]
- Janosz-Rajczyk, M. Elementary Processes in Environmental Engineering, 1st ed.; Politechnika Częstochowska Publisher: Częstochowa, Poland, 2002; pp. 154–196. [Google Scholar]
- Hu, G.; Lin, Z.; Wu, X.; Ren, L.; Wu, T.; Xie, C.; Qiao, Y.; Shi, J.; Cheng, G. An analytical model for estimating soil temperature profiles on the Qinghai-Tibet plateau of China. J. Arid. Land 2016, 8, 232–240. [Google Scholar] [CrossRef]
- Xing, L.; Li, L.; Gong, J.; Ren, C.; Liu, J.; Chen, H. Daily soil temperatures predictions for various climates in United States using data-driven model. Energy 2018, 160, 430–440. [Google Scholar] [CrossRef]
- Feng, Y.; Cui, N.; Hao, W.; Gao, L.; Gong, D. Estimation of soil temperature from meteorological data using different machine learning models. Geoderma 2019, 338, 67–77. [Google Scholar] [CrossRef]
- Reddy, K.R.; Xie, T.; Dastgheibi, S. Nutrients removal from urban stormwater by different filter materials. Water Air Soil Pollut. 2014, 225, 1778. [Google Scholar] [CrossRef]
- Reddy, K.R.; Xie, T.; Dastgheibi, S. Removal of heavy metals from urban stormwater runoff using different filter materials. J. Environ. Chem. Eng. 2014, 2, 282–292. [Google Scholar] [CrossRef]
- He, Y.; Lin, H.; Dong, Y.; Liu, Q.; Wang, L. Simultaneous removal of ammonium and phosphate by alkaline-activated and lanthanum-impregnated zeolite. Chemosphere 2016, 164, 387–395. [Google Scholar] [CrossRef]
- Tian, J.; Miller, V.; Chiu, P.C.; Maresca, J.A.; Guo, M.; Imhoff, P.T. Nutrient release and ammonium sorption by poultry litter and wood biochars in stormwater treatment. Sci. Total Environ. 2016, 553, 596–606. [Google Scholar] [CrossRef]
- Zheng, H.; Han, L.; Ma, H.; Zheng, Y.; Zhang, H.; Liu, D.; Liang, S. Adsorption characteristics of ammonium ion by zeolite 13X. J. Hazard. Mater. 2008, 158, 577–584. [Google Scholar] [CrossRef]
- Krishnamoorthy, R.; Govindan, B.; Banat, F.; Sagadevan, V.; Purushothaman, M.; Show, P.L. Date pits activated carbon for divalent lead ions removal. J. Biosci. Bioeng. 2019, in press. [Google Scholar] [CrossRef] [PubMed]
- Okochi, N.C.; McMartin, D.W. A Laboratory Study of the Treatability of synthetic stormwater under varying conditions using electric arc furnace steel slag. Water 2012, 4, 321–344. [Google Scholar] [CrossRef]
- Lin, L.; Lei, Z.; Wang, L.; Liu, X.; Zhang, Y.; Wan, C.; Lee, D.J.; Tay, J.H. Adsorption mechanisms of high-levels of ammonium onto natural and NaCl-modified zeolites. Sep. Purif. Technol. 2013, 103, 15–20. [Google Scholar] [CrossRef] [Green Version]
- Woinarski, A.Z.; Snape, I.; Stevens, G.W.; Stark, S.C. The effects of cold temperature on copper ion exchange by natural zeolite for use in a permeable reactive barrier in Antarctica. Cold Reg. Sci. Technol. 2003, 37, 159–168. [Google Scholar] [CrossRef]
- Wasielewski, S.; Rott, E.; Minke, R.; Steinmetz, H. Evaluation of different clinoptilolite zeolites as adsorbent for ammonium removal from highly concentrated synthetic wastewater. Water 2018, 10, 584. [Google Scholar] [CrossRef]
- De Namor, A.F.D.; El Gamouz, A.; Frangie, S.; Martinez, V.; Valiente, L.; Webb, O.A. Turning the volume down on heavy metals using tuned diatomite. A review of diatomite and modified diatomite for the extraction of heavy metals from water. J. Hazard. Mater. 2012, 241, 14–31. [Google Scholar] [CrossRef]
- Sdiri, A.; Higashi, T.; Jamoussi, F.; Bouaziz, S. Effects of impurities on the removal of heavy metals by natural limestones in aqueous systems. J. Environ. Manag. 2012, 93, 245–253. [Google Scholar] [CrossRef] [PubMed]
- Kyzioł-Komosińska, J.; Rosik-Dulewska, C.; Franus, M.; Antoszczyszyn-Szpicka, P.; Czupiol, J.; Krzyzewska, I. Sorption capacities of natural and synthetic zeolites for Cu (II) ions. Pol. J. Environ. Stud. 2015, 24, 1111–1123. [Google Scholar] [CrossRef]
- Singh, N.B.; Nagpal, G.; Agrawal, S. Water purification by using adsorbents: A review. Environ. Technol. Innov. 2018, 11, 187–240. [Google Scholar] [CrossRef]
- Radziemska, M.; Mazur, Z.; Fronczyk, J.; Matusik, J. Co-remediation of Ni-contaminated soil by halloysite and Indian mustard (Brassica juncea L.). Clay Miner. 2016, 51, 489–497. [Google Scholar] [CrossRef]
- Radziemska, M.; Koda, E.; Vaverkovà, M.D.; Gusiatin, Z.M.; Cerdà, A.; Brtnický, M.; Mazur, Z. Soils from an iron and steel scrap storage yard remediated with aided phytostabilization. Land Degrad. Dev. 2019, 30, 202–211. [Google Scholar] [CrossRef]
- Thiruvenkatachari, R.; Vigneswaran, S.; Naidu, R. Permeable reactive barrier for groundwater remediation. J. Ind. Eng. Chem. 2008, 14, 145–156. [Google Scholar] [CrossRef]
- Arora, M.; Snape, I.; Stevens, G.W. The effect of temperature on toluene sorption by granular activated carbon and its use in permeable reactive barriers in cold regions. Cold Reg. Sci. Technol. 2011, 66, 12–16. [Google Scholar] [CrossRef]
- Yang, J.; Cao, L.; Guo, R.; Jia, J. Permeable reactive barrier of surface hydrophobic granular activated carbon coupled with elemental iron for the removal of 2, 4-dichlorophenol in water. J. Hazard. Mater. 2010, 184, 782–787. [Google Scholar] [CrossRef] [PubMed]
- Mumford, K.A.; Rayner, J.L.; Snape, I.; Stark, S.C.; Stevens, G.W.; Gore, D.B. Design. installation and preliminary testing of a permeable reactive barrier for diesel fuel remediation at Casey Station. Antarctica. Cold Reg. Sci. Technol. 2013, 96, 96–107. [Google Scholar] [CrossRef]
- Klute, A. Methods of Soil Analysis; American Society of Agronomy, Agronomy Monograph: Madison, WI, USA, 1996; p. 9. [Google Scholar]
- Skoog, D.A.; West, D.M.; Holler, F.J. Fundamentals of Analytical Chemistry, 7th ed.; Thomson Learning, Inc.: Philadelphia, PA, USA, 1996; p. 413. [Google Scholar]
- PN-EN ISO-6878 Water Quality—Determination of Phosphorus—Spectrometric Method with Ammonium Molybdate; Polish Committee for Standardization: Warszawa, Poland, 2006.
- Tran, H.N.; You, S.-J.; Hosseini-Bandegharaei, A.; Chao, H.-P. Mistakes and inconsistencies regarding adsorption of contaminants from aqueous solutions: A critical review. Water Res. 2017, 120, 88–116. [Google Scholar] [CrossRef]
- Fronczyk, J.; Radziemska, M.; Jeznach, J. Evaluation of diatomite and chalcedonite as reactive materials protecting groundwater in traffic infrastructure. Fresen. Environ. Bull. 2014, 23, 3331–3339. [Google Scholar]
- Fronczyk, J.; Garbulewski, K. Evaluation of zeolite-sand mixtures as reactive materials protecting groundwater at waste disposal sites. J. Environ. Sci. 2013, 25, 1764–1772. [Google Scholar]
- Fronczyk, J.; Radziemska, M.; Mazur, Z. Copper removal from contaminated groundwater using natural and engineered limestone sand in permeable reactive barriers. Fresen. Environ. Bull. 2015, 24, 228–234. [Google Scholar]
- Alshameri, A.; Ibrahim, A.; Assabri, A.M.; Lei, X.; Wang, H.; Yan, C. The investigation into the ammonium removal performance of Yemeni natural zeolite: Modification, ion exchange mechanism, and thermodynamics. Powder Technol. 2014, 258, 20–31. [Google Scholar] [CrossRef]
- Khorshidi, M.; Lu, N. Quantification of exchangeable cations using soil water retention curve. J. Geotech. Geoenviron. 2017, 7, 04017057. [Google Scholar] [CrossRef]
- Aziz, H.A.; Othman, N.; Yusuff, M.S.; Basri, D.R.H.; Ashaari, F.A.H.; Adlan, M.N.; Othman, F.; Johari, M.; Perwira, M. Removal of copper from water using limestone filtration technique: Determination of mechanism of removal. Environ. Int. 2001, 26, 395–399. [Google Scholar] [CrossRef]
- Matusik, J.; Wścisło, A. Enhanced heavy metal adsorption on functionalized nanotubular halloysite interlayer grafted with aminoalcohols. Appl. Clay Sci. 2014, 100, 50–59. [Google Scholar] [CrossRef]
- Wibowo, E.; Rokhmat, M.; Abdullah, M. Reduction of seawater salinity by natural zeolite (Clinoptilolite): Adsorption isotherms, thermodynamics and kinetics. Desalination 2017, 409, 146–156. [Google Scholar] [CrossRef]
- Mazloomi, F.; Jalali, M. Ammonium removal from aqueous solutions by natural Iranian zeolite in the presence of organic acids, cations and anions. J. Environ. Chem. Eng. 2016, 4, 240–249. [Google Scholar] [CrossRef]
- Bekiari, V.; Panagopoulos, G.; Papoulis, D.; Panagiotaras, D. Use of halloysite nanotubes to reduce ammonium concentration in water and wastewaters. Mater. Res. Innov. 2017, 21, 313–319. [Google Scholar] [CrossRef]
- Jing, Q.-X.; Chai, L.-Y.; Huang, X.-D.; Tang, C.-J.; Guo, H.; Wang, W. Behavior of ammonium adsorption by clay mineral halloysite. Trans. Nonferrous Met. Soc. China 2017, 27, 1627–1635. [Google Scholar] [CrossRef]
- Toor, G.S.; Occhipinti, M.L.; Yang, Y.-Y.; Majcherek, T.; Haver, D.; Oki, L. Managing urban runoff in residential neighborhoods: Nitrogen and phosphorus in lawn irrigation driven runoff. PLoS ONE 2017, 12, 0179151. [Google Scholar] [CrossRef]
- Karapınar, N. Application of natural zeolite for phosphorus and ammonium removal from aqueous solutions. J. Hazard. Mater. 2009, 170, 1186–1191. [Google Scholar] [CrossRef]
- Millar, G.J.; Winnett, A.; Thompson, T.; Couperthwaite, S.J. Equilibrium studies of ammonium exchange with Australian natural zeolites. J. Water Process Eng. 2016, 9, 47–57. [Google Scholar] [CrossRef]
- Jorgensen, T.C.; Weatherley, L.R. Ammonia removal from wastewater by ion exchange in the presence of organic contaminants. Water Res. 2003, 37, 1723–1728. [Google Scholar] [CrossRef]
- Jiang, C.; Jia, L.; He, Y.; Zhang, B.; Kirumba, G.; Xie, J. Adsorptive removal of phosphorus from aqueous solution using sponge iron and zeolite. J. Colloid Interface Sci. 2013, 402, 246–252. [Google Scholar] [CrossRef]
- Tan, K.L.; Hameed, B.H. Insight into the adsorption kinetics models for the removal of contaminants from aqueous solutions. J. Taiwan Inst. Chem. Eng. 2017, 74, 25–48. [Google Scholar] [CrossRef]
- Jing, L.; Xuejiang, W.; Jian, W.; Yuan, L.; Siqing, X.; Jianfu, Z. Simultaneous recovery of microalgae, ammonium and phosphate from simulated wastewater by MgO modified diatomite. Chem. Eng. J. 2019, 362, 802–811. [Google Scholar]
- Li, G.; Feng, Y.; Zhu, W.; Zhang, X. Enhanced adsorptive performance of tetracycline antibiotics on lanthanum modified diatomite. Korean J. Chem. Eng. 2015, 32, 2109–2115. [Google Scholar] [CrossRef]
- Bai, J.; Ye, X.; Jia, J.; Zhang, G.; Zhao, Q.; Cui, B.; Liu, X. Phosphorus sorption-desorption and effects of temperature, pH and salinity on phosphorus sorption in marsh soils from coastal wetlands with different flooding conditions. Chemosphere 2017, 188, 677–688. [Google Scholar] [CrossRef] [PubMed]
- Du, C.; Ren, X.Y.; Zhang, L.; Xu, M.; Wang, X.J.; Zhuang, Y.H.; Du, Y. Adsorption characteristics of phosphorus onto soils from water level fluctuation zones of the Danjiangkou Reservoir. CLEAN-Soil Air Water 2016, 44, 975–983. [Google Scholar] [CrossRef]
- Reddy, K.R.; DeLaune, R.D. Biogeochemistry of Wetlands: Science and Applications, 1st ed.; CRC Press LLC Taylor & Francis Group: Boca Raton, FL, USA, 2008. [Google Scholar]
- Yang, Y.; Chen, Y.; Leng, F.; Huang, L.; Wang, Z.; Tian, W. Recent advances on surface modification of halloysite nanotubes for multifunctional applications. Appl. Sci. 2017, 7, 1215. [Google Scholar] [CrossRef]
- Veerabadran, N.G.; Price, R.R.; Lvov, Y.M. Clay nanotubes for encapsulation and sustained release of drugs. Nano 2007, 2, 115–120. [Google Scholar] [CrossRef]
- Horta, C.; Monteiro, F.; Madeira, M.; Torrent, J. Phosphorus sorption and desorption properties of soils developed on basic rocks under a subhumid Mediterranean climate. Soil Use Manag. 2013, 29, 15–23. [Google Scholar] [CrossRef]
- Hua, G.; Salo, M.W.; Schmit, C.G.; Hay, C.H. Nitrate and phosphate removal from agricultural subsurface drainage using laboratory woodchip bioreactors and recycled steel byproduct filters. Water Res. 2016, 102, 180–189. [Google Scholar] [CrossRef]
- Karunanithi, R.; Ok, Y.S.; Dharmarajan, R.; Ahmad, M.; Seshadri, B.; Bolan, N.; Naidu, R. Sorption, kinetics and thermodynamics of phosphate sorption onto soybean stover derived biochar. Environ. Technol. Innov. 2017, 8, 113–125. [Google Scholar] [CrossRef]
- Chen, Z.; Chen, B.; Zhou, D.; Chen, W. Bisolute sorption and thermodynamic behavior of organic pollutants to biomass-derived biochars at two pyrolytic temperatures. Environ. Sci. Technol. 2012, 46, 12476–12483. [Google Scholar] [CrossRef]
- Sevim, A.M.; Hojiyev, R.; Gül, A.; Çelik, M.S. An investigation of the kinetics and thermodynamics of the adsorption of a cationic cobalt porphyrazine onto sepiolite. Dyes Pigm. 2011, 88, 25–38. [Google Scholar]
- Anastopoulos, I.; Mittal, A.; Usman, M.; Mittal, J.; Yu, G.; Núñez-Delgado, A.; Kornaros, M. A review on halloysite-based adsorbents to remove pollutants in water and wastewater. J. Mol. Liq. 2018, 269, 855–868. [Google Scholar] [CrossRef]
Figure 1.
Reactive materials used in the studies.

Figure 2.
SEM images along with EDS analysis.

Figure 3.
Impact of temperature on the efficiency of Cu and Zn removal with equations describing the relationship at initial concentrations of 30 mg Cu/L and 7.5 mg Zn/L (error bars mark the standard deviation, dashed line is the theoretical curve.
Figure 3.
Impact of temperature on the efficiency of Cu and Zn removal with equations describing the relationship at initial concentrations of 30 mg Cu/L and 7.5 mg Zn/L (error bars mark the standard deviation, dashed line is the theoretical curve.

Figure 4.
Adsorption isotherm of copper ions at 3 °C, 10 °C, 22 °C and 40 °C (error bars mark the standard deviation for n = 3; line—fitting of Langmuir isotherm).
Figure 4.
Adsorption isotherm of copper ions at 3 °C, 10 °C, 22 °C and 40 °C (error bars mark the standard deviation for n = 3; line—fitting of Langmuir isotherm).

Figure 5.
Adsorption isotherm of zinc ions (error bars mark the standard deviation for n = 3; line—fitting of Langmuir isotherm).
Figure 5.
Adsorption isotherm of zinc ions (error bars mark the standard deviation for n = 3; line—fitting of Langmuir isotherm).

Figure 6.
Maximum adsorption capacities of reactive materials with regard to Cu and Zn at 3 °C, 10 °C, 22 °C and 40 °C with linking equations (RL value ranges are presented in parentheses; y is the maximum adsorption capacity (mg/g) and x is the temperature (°C)).
Figure 6.
Maximum adsorption capacities of reactive materials with regard to Cu and Zn at 3 °C, 10 °C, 22 °C and 40 °C with linking equations (RL value ranges are presented in parentheses; y is the maximum adsorption capacity (mg/g) and x is the temperature (°C)).

Figure 7.
Impact of temperature on the efficiency of NH4-N and PO4-P removal with equations describing the relationship at initial concentrations of 10 mg/L (error bars mark the standard deviation, dashed line is the theoretical curve).
Figure 7.
Impact of temperature on the efficiency of NH4-N and PO4-P removal with equations describing the relationship at initial concentrations of 10 mg/L (error bars mark the standard deviation, dashed line is the theoretical curve).

Figure 8.
Adsorption isotherm of ammonium ions at 3 °C, 10 °C and 22 °C (error bars mark the standard deviation for n = 3; line—fitting of Langmuir isotherm).
Figure 8.
Adsorption isotherm of ammonium ions at 3 °C, 10 °C and 22 °C (error bars mark the standard deviation for n = 3; line—fitting of Langmuir isotherm).

Figure 9.
Adsorption isotherm of phosphates at 3 °C, 10 °C and 22 °C (error bars mark the standard deviation for n = 3; line—fitting of Langmuir isotherm).
Figure 9.
Adsorption isotherm of phosphates at 3 °C, 10 °C and 22 °C (error bars mark the standard deviation for n = 3; line—fitting of Langmuir isotherm).

Figure 10.
Maximum adsorption capacities of reactive materials with regard to NH4-N and PO4-P at 3 °C, 10 °C and 22 °C (RL value ranges are presented in parentheses).
Figure 10.
Maximum adsorption capacities of reactive materials with regard to NH4-N and PO4-P at 3 °C, 10 °C and 22 °C (RL value ranges are presented in parentheses).


Table 1.
Surface characteristics of the reactive materials.
| Parameter/Material | Specific Surface (m2/g) | Mesopores Volume (Micropore Volume) (cm3/g) | Mesopores Surface (Micropore Surface) (m2/g) | Average Pore Size (nm) |
|---|---|---|---|---|
| Activated carbon | 782.67 | 0.510 (0.162) | 177.10 (366.41) | 3.65 |
| Diatomite | 29.32 1 | 0.055 | 20.05 | 7.56 |
| Zeolite | 33.34 2 | 0.09 | 14.01 | 17.54 |
| Limestone sand | 0.91 3 | 0.003 | 0.33 | 13.34 |
| Halloysite | 51.41 | 0.193 | 51.18 | 13.64 |
Table 2.
Physico-chemical properties of the reactive materials.
| Material/Parameter | Activated Carbon | Diatomite | Zeolite | Limestone Sand | Halloysite |
|---|---|---|---|---|---|
| pH (1:5) | 8.68 | 6.48 | 7.20 | 8.27 | 6.58 |
| EC (1:2.5) (µS/m) | 0.620 | 0.103 | 0.187 | 0.095 | 0.270 |
| CEC (meq/100 g) | 5.97 | 13.88 | 118.02 | 1.12 | 10.76 |
Table 3.
Values of Pearson’s coefficients (R) for the relationship between the equilibrium sorption capacity (Qe) of the reactive materials and temperature (n = 21; initial concentrations: 10 mg NH4-N/L; 10 mg PO4-P/L; 30 mg Cu/L; 7.5 mg Zn/L).
Table 3.
Values of Pearson’s coefficients (R) for the relationship between the equilibrium sorption capacity (Qe) of the reactive materials and temperature (n = 21; initial concentrations: 10 mg NH4-N/L; 10 mg PO4-P/L; 30 mg Cu/L; 7.5 mg Zn/L).
| Parameter | Halloysite | Limestone Sand | Zeolite | Activated Carbon | Diatomite |
|---|---|---|---|---|---|
| Copper | 0.763 (p < 0.00006) | 0.878 (p < 0.000001) | 0.942 (p < 0.00001) | 0.794 (p < 0.00002) | 0.952 (p < 0.00001) |
| Zinc | 0.957 (p < 0.00001) | 0.224 (p = 0.3288) | 0.883 (p < 0.000001) | 0.817 (p < 0.00001) | 0.756 (p < 0.00007) |
| Ammonium ions | 0.645 (p < 0.0039) | 0.919 (p < 0.00001) | 0.926 (p < 0.00001) | 0.446 (p < 0,0639) | 0.6907 (p < 0.0015) |
| Phosphates | 0.878 (p < 0.00001) | 0.470 (p < 0.0489) | 0.938 (p < 0.00001) | 0.854 (p < 0.00001) | 0.897 (p < 0.00001) |
 | |||||
Table 4.
Constants of the Langmuir equilibrium constant KL and thermodynamic parameters.
| Parameter/Material | KL (R2) | ΔG0 (kJ/mol) | ΔS0 (J/mol·K) | ΔH0 (kJ/mol) | R2 | ||||||
|---|---|---|---|---|---|---|---|---|---|---|---|
| 3 °C | 10 °C | 22 °C | 40 °C | 3 °C | 10 °C | 22 °C | 40 °C | ||||
| Cu | |||||||||||
| Diatomite | 0.796 (0.999) | 0.925 (0.997) | 1.119 (0.995) | 1.837 (0.989) | −34.02 | −35.29 | −37.47 | −40.73 | 181.25 | 16.03 | 0.978 |
| Zeolite | 0.491 (0.989) | 0.591 (0.968) | 0.719 (0.963) | 0.943 (0.799) | −33.04 | −34.19 | −36.17 | −39.13 | 164.56 | 12.40 | 0.994 |
| Activated carbon | 0.701 (0.942) | 2.112 (0.997) | 8.197 (0.999) | 0.701 (0.415) | −33.94 | −37.01 | - | −42.25 | 437.43 | 86.85 | 0.995 |
| Limestone sand | 0.224 (0.952) | 0.493 (0.985) | 0.910 (0.995) | 0.929 (0.949) | −31.90 | −33.37 | −35.89 | −39.67 | 210.01 | 26.09 | 0.763 |
| Halloysite | 0.588 (0.988) | 1.495 (0.995) | 1.648 (0.987) | 2.370 (0.991) | −34.13 | −35.58 | −38.06 | −41.79 | 207.10 | 23.06 | 0.761 |
| Zn | |||||||||||
| Diatomite | 0.190 (0.970) | 0.361 (0.987) | 0.763 (0.994) | 1.153 (0.996) | −31.28 | −32.95 | −35.80 | −40.09 | 238.06 | 34.46 | 0.936 |
| Zeolite | 0.221 (0.955) | 0.441 (0.985) | 0.609 (0.954) | 2.238 (0.975) | −31.32 | −33.19 | −36.40 | −41.21 | 267.17 | 42.46 | 0.967 |
| Activated carbon | 0.611 (0.998) | 0.739 (0.996) | 0.878 (0.996) | 2.375 (0.997) | −33.31 | −34.81 | −37.38 | −41.22 | 213.85 | 25.74 | 0.913 |
| Halloysite | 0.219 (0.932) | 0.312 (0.974) | 0.578 (0.977) | 1.613 (0.992) | −31.08 | −32.86 | −35.90 | −40.46 | 253.36 | 38.88 | 0.996 |
| NH4-N | |||||||||||
| Diatomite | 0.414 (0.982) | 1.698 (0.995) | 4.725 (0.998) | - | −30.14 | −33.04 | −38.01 | - | 414.28 | 84.27 | 0.950 |
| Zeolite | 0.128 (0.771) | 0.239 (0.833) | 0.240 (0.781) | - | −27.36 | −28.57 | −30.64 | - | 172.76 | 20.35 | 0.640 |
| Activated carbon | 1.526 (0.994) | 1.931 (0.996) | 2.315 (0.996) | - | −32.76 | −33.96 | −36.01 | - | 170.97 | 14.45 | 0.958 |
| Limestone sand | 0.468 (0.996) | 0.7262 (0.994) | 1.262 (0.997) | - | −30.03 | −31.68 | −34.51 | - | 235.86 | 35.10 | 0.995 |
| Halloysite | 0.522 (0.992) | 0.952 (0.997) | 1.270 (0.999) | - | −30.47 | −32.01 | −34.65 | - | 220.06 | 30.30 | 0.893 |
| PO4-P | |||||||||||
| Diatomite | 0.048 (0.983) | 0.062 (0.976) | 0.082 (0.983) | - | −28.61 | −29.82 | −31.88 | - | 172.00 | 18.88 | 0.990 |
| Zeolite | 0.037 (0.548) | 0.071 (0.735) | 0.119 (0.838) | - | −28.15 | −29.89 | −32.88 | - | 249.15 | 40.65 | 0.958 |
| Activated carbon | 0.103 (0.830) | 0.231 (0.928) | 0.246 (0.953) | - | −30.76 | −32.26 | −34.83 | - | 213.97 | 28.32 | 0.688 |
| Limestone sand | 0.107 (0.961) | 0.168 (0.951) | 0.294 (0.986) | - | −30.47 | −32.15 | −35.02 | - | 239.29 | 35.61 | 0.996 |
| Halloysite | 0.051 (0.783) | 0.113 (0.872) | 0.182 (0.951) | - | −28.98 | −30.82 | −33.99 | - | 263.72 | 43.85 | 0.924 |
Table 5.
Values of contaminants load treated.
| Material | Treated Contaminants Load (mg/g) | |||||||
|---|---|---|---|---|---|---|---|---|
| Cu | Zn | NH4-N | PO4-P | |||||
| 3 °C | 40 °C | 3 °C | 40 °C | 3°C | 22 °C | 3 °C | 22 °C | |
| Halloysite | 0.90 | 3.32 | 1.55 | 3.36 | 2.20 | 0.68 | 1.10 | |
| Limestone sand | 0.90 | 4.28 | 3.80 | - | 2.00 | 0.60 | ||
| Zeolite | 1.35 | 4.05 | 1.58 | 4.18 | >3.00 | 0.60 | ||
| Activated carbon | 2.45 | 7.12 | 3.30 | 3.65 | 1.80 | 1.97 | 1.12 | 1.60 |
| Diatomite | 1.22 | 3.13 | 1.50 | 3.83 | 2.00 | 0.74 | 0.93 | |
© 2019 by the authors. Licensee MDPI, Basel, Switzerland. This article is an open access article distributed under the terms and conditions of the Creative Commons Attribution (CC BY) license (http://creativecommons.org/licenses/by/4.0/).
Share and Cite
MDPI and ACS Style
Fronczyk, J.; Mumford, K.A. The Impact of Temperature on the Removal of Inorganic Contaminants Typical of Urban Stormwater. Appl. Sci. 2019, 9, 1273. https://doi.org/10.3390/app9071273
AMA Style
Fronczyk J, Mumford KA. The Impact of Temperature on the Removal of Inorganic Contaminants Typical of Urban Stormwater. Applied Sciences. 2019; 9(7):1273. https://doi.org/10.3390/app9071273
Chicago/Turabian StyleFronczyk, Joanna, and Kathryn A. Mumford. 2019. "The Impact of Temperature on the Removal of Inorganic Contaminants Typical of Urban Stormwater" Applied Sciences 9, no. 7: 1273. https://doi.org/10.3390/app9071273
Note that from the first issue of 2016, this journal uses article numbers instead of page numbers. See further details here.