The Use of a Special Stereoscopic Microscope Attachment for the Sieve Analysis of Aggregate in Concrete


Faculty of Civil Engineering and Architecture, Kielce University of Technology, Al. Tysiąclecia Państwa Polskiego 7, 25-314 Kielce, Poland
*
Author to whom correspondence should be addressed.
Appl. Sci. 2019, 9(9), 1853; https://doi.org/10.3390/app9091853
Submission received: 21 March 2019
/
Revised: 24 April 2019
/
Accepted: 25 April 2019
/
Published: 6 May 2019
(This article belongs to the Section Civil Engineering)
Abstract
:Featured Application
The use of a stereoscopic microscope with an additional attachment mounted on the objective lens significantly extended the research capability of an ordinary stereoscopic microscope. The attachment was fitted with a focused light source. The incident, nearly vertical light rays were reflected from the surface of the specimen and produced an image visible in the right-hand side of the field of view in the lens. The light rays were much better reflected from the particles of sand and aggregate than from the porous cement paste. The image obtained after morphological operations allowed for determining many characteristics of the identified aggregate particles. A professional microscope set with the proposed attachment enabled recording and analysing much larger areas of a concrete specimen as compared to other methods. The results obtained from the analyses were very promising and provide a method with the potential to be applied in practice to analyse the composition of hardened concrete extracted from the structure, determine the paste volume as the basic parameter necessary to calculate the air void spacing factor L to EN 480-11, establish the sand particle size necessary for the design of renovation mortar compositions (restoration of historic buildings) and, in the case of concrete mix segregation, to determine the volume concentration of sand and coarse aggregate in different layers of hardened concrete.
Abstract
The article proposes an innovative technique that allows relatively easy distinction of sand and aggregate particles on the surface image of a concrete specimen. The concept of the proposed approach involves the use of a new method of illuminating carefully polished surfaces of specimens. This is possible owing to a special attachment mounted on the lens of a stereoscopic microscope. The obtained digital image of the specimen, after being converted into a binary image, was subjected to a standard numerical analysis to determine the parameters characterizing the aggregate, i.e., particle size distribution (grading curve), maximum dimension, and shape. Two application examples are presented for analysing sand particle size and for determining the cement paste content in the concrete. The results obtained with the proposed technique were very promising and offer great potential for its practical implementation.
1. Introduction
Concrete is one of the most heterogeneous construction materials. It is often considered as a three-phase composite with inclusions in the form of aggregate particles and air voids embedded in the cement paste (matrix). Aggregates strongly influence the properties of the concrete mix and hardened concrete. Depending on the content of coarse aggregates, sand and paste, different portions of the concrete will have notably different compressive strengths, modulus of elasticity, shrinkage, etc. The important characteristics of the aggregates for use in concrete are particle size distribution (grading curve), maximum size, particle shape and surface texture, strength, absorption, resistance to freezing and thawing, specific gravity and bulk density (compact weight and loose weight). Granular structure is characterized by the packing density—the denser the material is, the larger is the volume of the aggregate skeleton, hence, the greater strength of the composite.
Various measuring techniques are used, such as passing visible light reflected from a specimen (polished specimens) or transmitted through the specimen (thin sections), scanning electron microscopy [1,2], computed tomography (CT) [3,4,5,6,7,8,9] and other advanced methods of cement paste examination. Scanning microscopes can cooperate with an energy-dispersive X-ray energy spectrometer (EDS) [10]. Thin-section tests, SEM and (more recently) computed tomography allow for the precise determination of individual phases in concrete, but only across small areas. A great amount of work is required to prepare test specimens and a large number of specimens need to be prepared. Computed tomography allows for the analysis of the distribution of various elements (phases) in space, but it is an expensive and not always available method. Traditional methods are most often used, where the analysis of the concrete composition is carried out on the surface. Because of the heterogeneity of concrete and the size of aggregate particles, analysis of concrete composition must be performed on the surface of a large specimen, which presents a basic challenge.
Microscopes used in the field of mineral and concrete research are typically optical microscopes using the bright field, polarized light and dissecting/stereo techniques. Optical microscopy as the main or only tool has an advantage over other research techniques (SEM, X-ray diffraction analysis, differential scanning calorimetry, etc.) as it offers a large field of view and allows relatively simple quantitative measurements.
Thin-section optical microscopy is a well-known method of investigating the microstructure of hardened concrete [11,12,13]. Typically, microscopic observations are carried out using polarized light with Nicol prisms in the parallel or crossed positions. The use of UV light provides an opportunity to obtain additional information necessary to assess the quality of concrete. A thin-section image under UV light provides information about the features that may indicate the quality of paste and aggregate, the air void system, structural defects such as cracks, their size and distribution, thereby helping to determine the cause of concrete distress. The optical microscopy with thin sections impregnated with a fluorescent resin is also a precise, indirect technique for determining the w/c ratio of hardened concrete [11,13]. Developed in Denmark, the method is now in common use in other Scandinavian countries [14]. This method helps identify and analyse secondary ettringite formation, alkali–silica reaction (ASR) and the paste–aggregate interfacial zone [15].
Marinoni et al. [12] used thin sections for the automated image analysis of particle size distributions of sand in mortars. Four photographs of each section under crossed and plane-polarized light were used to distinguish the particles. The grading curve plotted on the basis of these images showed that the population of the smallest particles in the aggregate was underestimated (±6% deviation from the actual value), thus confirming that image processing can be an effective alternative to traditional mechanical sieving.
Mertens and Elsen [16] proposed a method for automated image analysis in which one composite image was prepared by aligning a number of individual images of the mortar specimen surface. In this way, edge effects were reduced, the resolution was maintained, and more aggregate particles were measured yielding statistically reliable results. They developed a quantification procedure for constructing the sieving curves of the sands used in mortars. For that purpose, the researchers used two-dimensional data obtained by applying image analysis of thin sections made from ten fluorescent epoxy-impregnated mortars containing five different sands of known sieve size distribution. Edge correction was performed to account for the particles near the edge of the image and avoid size underestimation. The edge effects were reduced by choosing a large measuring frame relative to the size of the largest particles present, but still using a reasonable resolution.
The specimens for reflected light microscopy have to be properly prepared (e.g., EN 480-11 [17]). Various methods of introducing contrast are employed as a tool for identifying aggregate phases. These are chemical dyes, etching and colouring the paste with ink or phenolphthalein. Chinchon et al. [18] described the methods of colouring through selective reactions of a chemical reagent with certain minerals present in the paste. In hydrated concrete, a reaction with potassium ferrocyanate dyes the cement paste blue. The tannic acid dyes the paste dark brown. Załocha and Kasperkiewicz [19] proposed a preparation procedure for plane sections, which involved a short immersion of the specimens in blue ink. As a result, the paste was blue, whereas aggregates remained virtually unchanged. Then the voids were infilled with a white zinc paste.
Murotani et al. [20] covered polished surfaces with phenolphthalein and scanned them immediately. The contrast enhancement was sufficient to distinguish limestone aggregate particles and determine the particle size distribution. Peterson [21] also applied phenolphthalein for aggregate particle identification and filled the voids with a white powder.
Gudmundsson, Chatterji et al. [22,23] described the technique they used for the measurement of paste contents in mortars and concretes. They etched the polished surfaces with a saturated solution of salicylic acid in 80:20 methyl alcohol, a water mixture that is safe for limestone aggregates. Then they enhanced the contrast between the exposed aggregates and the etched areas by blackening the aggregates and infilling the etched areas with a white powder. Brzezicki [24] applied a similar technique for enhancing the contrast between the aggregate particles, sand particles and the paste. He etched polished specimens in the solution of citric acid for about 10 min. In the case of lime aggregate, a sufficient protective agent against the reaction with acid is to paint the surface of the aggregate with a marker. The whole surface of the specimen was covered with a marker pen and bleached with zinc oxide allowing the black particles of aggregate to show up against a white background. In this way, the threshold for segmentation was precisely specified and numerical image processing operations, which often change the proportions of input and processed image elements, were avoided.
To determine the air void structure (spacing factor, L), the paste/air (P/A) ratio must be known. In practice, the paste volume (P), as used in calculations, is often based on the mix composition obtained from initial testing. This can lead to erroneous calculations if the composition is not corrected relative to the air content variation. The true paste content in concrete can be estimated using the point counting technique [25]. However, the results of such calculations must be treated with caution, as according to Pleau et al., the calculated volume of the paste is about 12% higher than that measured microscopically to ASTM C457 [26].
The present article proposes an innovative method for the relatively easy extraction of sand and aggregate particles from images of the fairly large surface areas of concrete specimens. The essence of the proposed approach is the use of a special illumination mode of the carefully polished surface of the specimen. The special illumination is provided by the addition of the customised attachment mounted on the objective lens of a stereoscopic microscope. Two application examples are considered in terms of the suitability of the method for determining the particle size distribution and cement paste content in concrete.
2. Experimental
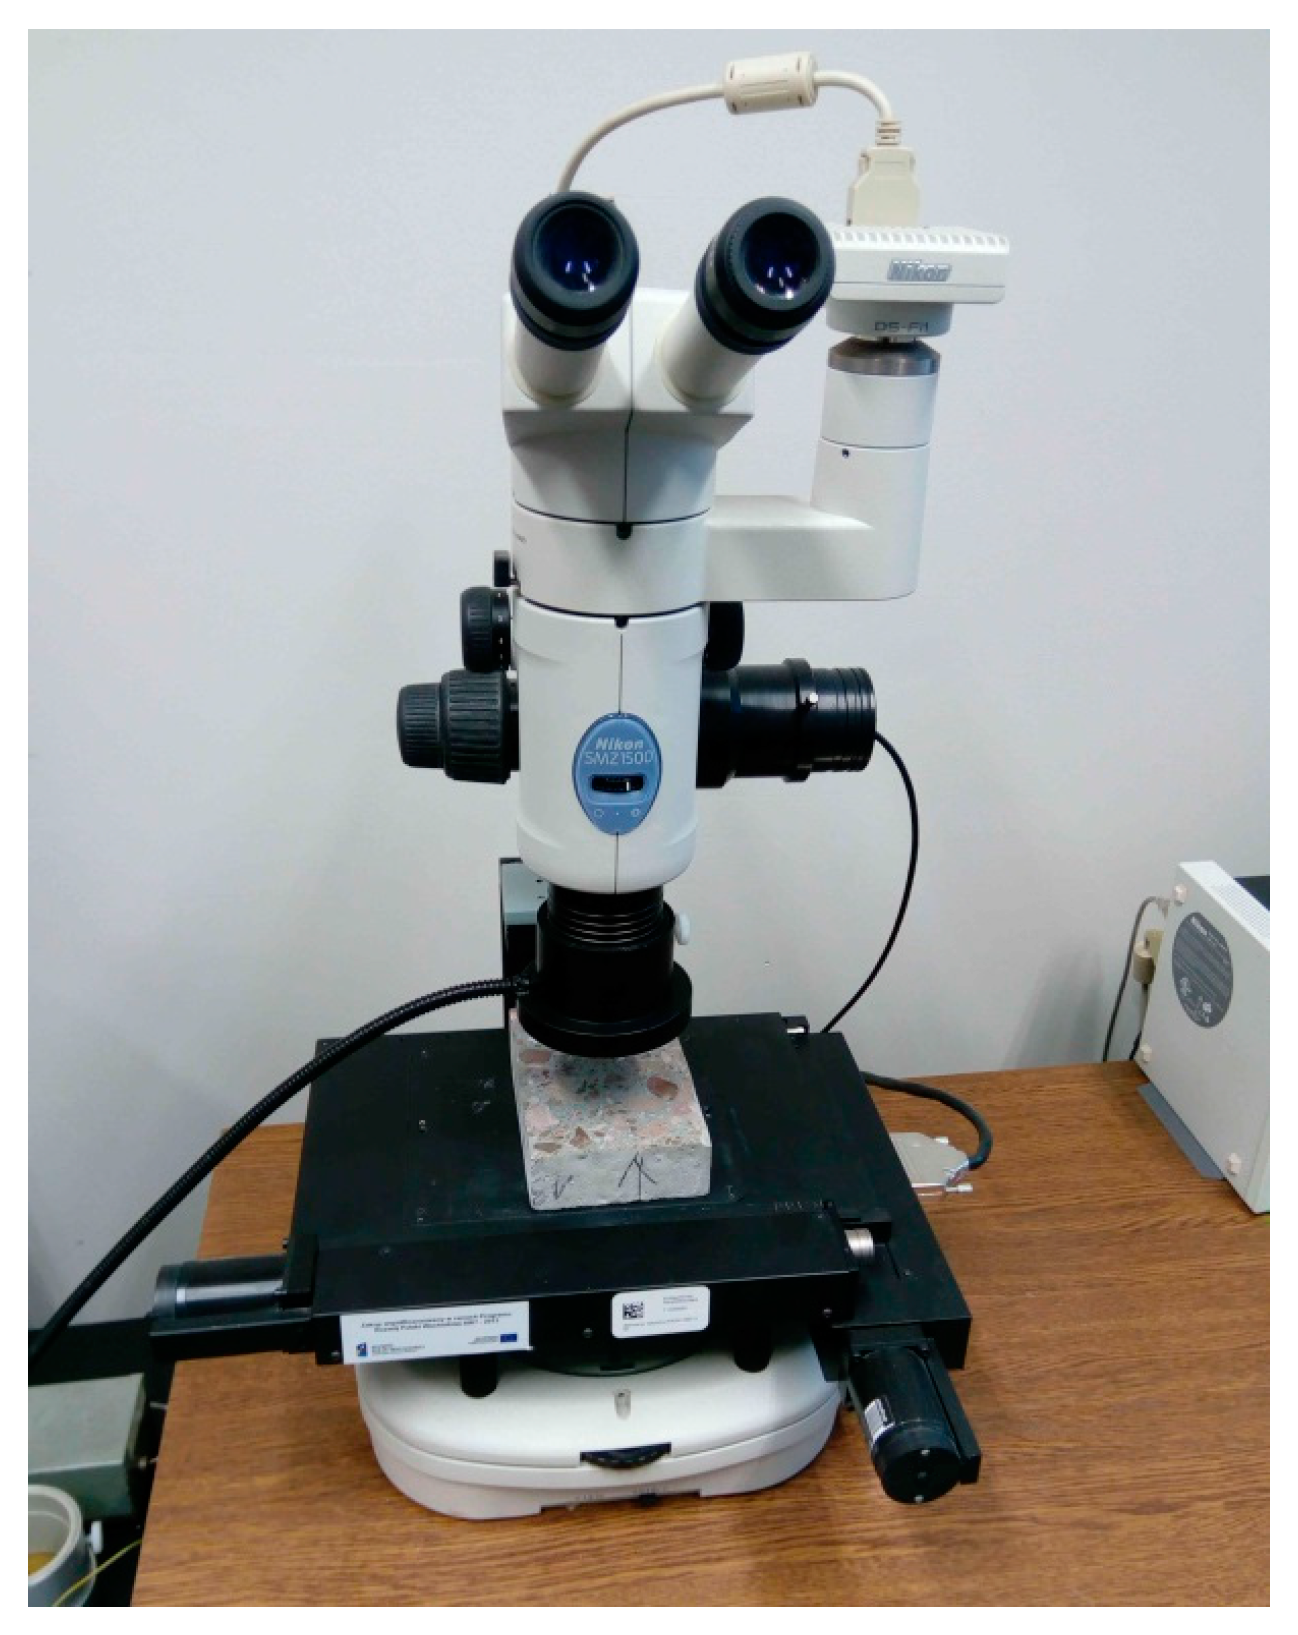
The photographs of concrete specimen surfaces were taken using a professional system consisting of a stereoscopic microscope, a CCD camera, a cross table, and a PC with customized software to perform the specimen scanning and setup, image acquisition and numerical analysis (NIS-Elements). A special attachment mounted on the objective lens of the microscope (Figure 1) was an additional accessory. The attachment was fitted with a focused light source placed in the vicinity of the optical axis of the lens (part of the vision field in the left eyepiece was obscured). The light rays were reflected off the specimen’s surface and were visible in the right-hand part of the visual field in the objective lens. The image from this part was sent through the camera to the computer.
The sand and coarse aggregate particles on the image were much brighter than the cement paste that surrounded them. The particles, particularly those of sand, had a dense structure and low porosity, and reflected light rays better than the porous cement pastes producing scattered light. Making the paste darker with the use of phenolphthalein increased the contrast between the aggregate and the cement paste.
Coarse aggregate particles (even those of basalt, typically regarded as homogeneous) have poorer reflectivity, appear less bright, have irregular edge shapes and require additional time for shape correction and particle filling.
Figure 2a shows an example of a specimen illuminated with ordinary light, and Figure 2b shows a sample illuminated with the light enhanced by the proposed attachment. Figure 2c presents a binary image after correction in NIS-Elements, with visible particles of sand and aggregate. The correction procedure involved filling in the voids and cracks; in the case of porous aggregate particles, their contour had to be corrected manually.
A series of colour photographs were combined into a large, single image covering a considerable area of the sample (up to 50 cm2).
Photographs with the sizes of 1280 × 980 and 640 × 490 pixels were taken using the calibration of 3.37 µm/px or 6.74 µm/px. The file size of the combined image was about 135 MB with 6.74 µm/px calibration. Analysis of larger images was difficult, as with a calibration of 3.37 µm/px, the size of a file is about 260 MB.
3. Results and Discussion
3.1. Analysis of Sand Particle Size Distribution
The tests were carried out on the samples of self-compacting concrete (SCC) made with Portland cement (C), natural sand 0/2 mm (S) and gravel 2/8 mm (G) at W/C = 0.30 and (S+G)/C = 2.88. The specimens measuring 150 × 100 × 40 mm were sawn from 150 mm cubes. One surface of each specimen was ground according to the procedure described in EN 480-11 [17]. The specimen was carefully polished, and the clean test surface was treated with phenolphthalein. After drying, it was gently polished by hand with a felt disc. Since the scanning was carried out a few hours after polishing, the surface was damped with a citric acid solution and after about 1 min, it was wiped with a dry cloth and cleaned with a soft brush before taking the photographs. The treatment aimed at moistening the paste and improving the aggregate–paste contrast.
The tests were carried out on three concrete specimens. One region of each specimen surface—74.1 × 67.9 mm = 50.3 cm2—was photographed.
After proper preparation of the binary image of the aggregate using the automated threshold setting, the elements of the aggregate phase were marked, distinguishing the particles smaller than 2 mm in size (Figure 3). The following parameters were calculated for each particle using the automated measurement method: area, equivalent diameter (EqD), Ferete’s diameter (Max_Feret). The measurement results were then exported to Excel.
The sand gradation in 3D space was constructed using the Saltykov method [27,28]. The particles were assumed to have a spherical shape. An appropriate program was prepared—a VBA macro in the Excel spreadsheet.
First, the distribution of the measured particle sizes per 1 cm2 of concrete surface was determined. The EqD and the maximum value of Max_Feret were the basis for the calculations.
The distributions were determined with the EqD:Dmax or Max_Feret:Dmax ratios, where Dmax = 1995 μm. Following the principles of the Saltykov method, the logarithmic scale was adopted in such a way that the ratio of diameters of two neighbouring classes was 10−0.1 = 0.7943. Eighteen size classes were established. The number of particles Na(i) per 1 mm2 was calculated by dividing the number of particles in a given class by the measured area of the specimen.
To determine the size distribution of sand particles related to a 3D volume unit, it was necessary to create a table of factors. The algorithm developed by Xu and Pitot [29] was used for that purpose.
The traditional sieve analysis of sand is based on the determination of the sum of the mass of particles passing through a given sieve. In order to determine the sand sieving curve based on the results of the calculations, the sand particle volume (uniform sand density) should be determined in individual classes. The sand particles were assumed to be spherical. The calculations made on the basis of the EqD provided better compliance with the traditional sieve analysis than the calculation based on Max_Feret [16].
The particle volume in individual classes was calculated by taking the arithmetic average of the recorded diameters EqD. The particle volume in a given class V(i) was calculated as the product of the average particle volume V1 and the number of particles Nv(i) [28]. The results of the Nv(i) calculations are given in Table 1.
Figure 4 compares the results of the calculations above with the results from the sand sieve analysis. Good agreement was found between these results.
3.2. Determination of the Cement Paste Volume in the Air Entrained Concrete
The tests were carried out for concrete made with Portland cement (C), silica fume (SF), natural sand 0/2 mm (S) and basalt aggregate fractions 4/8 and 8/16 mm (B). The information about the concrete composition is compiled in Table 2.
A single 150 × 100 × 40 mm specimen was sawn, ground and polished in the same way as described in Section 3.1. Air voids in the specimen were filled with a fluorescent powder.
The large image was made by gluing together 18 × 9 frames with dimensions of 1280 × 960 px and a resolution of 3.37 μm/px, which produced a measurement area of 78 × 28 mm = 22 cm2. Calculations were made for three areas of measurements (AOM) on the surface of the concrete specimens.
The volume of aggregate BS2D (basalt + sand) is a ratio of the determined aggregate surface area to the area of measurement (AOM). The volume of air voids A2D is a ratio of the air void surface area to the AOM. The volume of paste (P) in the concrete was determined using the basic assumption in stereology according to which the volume equals the ratio of the paste surface area to the surface measured.
The procedure involved taking three photographs of the same area under the ordinary light, under the light provided by the new attachment, and under the UV light. Examples of the photographs are shown in Figure 5. The volume of cement paste P2D was determined by subtracting the surface area of the aggregate particles BS2D and that of the air voids A2D from the measured area. Results for the individual phases in concrete are shown in Table 3. The paste volume as an average of the three results was 26.7%. Good agreement was obtained with the paste volume indicated by the concrete mix composition (26.9%).
4. Conclusions
The article presents the problems of distinguishing individual phases, mainly aggregates, in concrete. The following conclusions were formulated:
- The attachment mounted on the lens of a stereoscopic microscope significantly extended the potential of a regular stereoscopic microscope in the analysis of hardened concrete composition. The attachment was equipped with a focused light source. Light rays falling almost vertically reflected off the surface of the specimen, which resulted in the image visible in the right part of the field of view in the lens. This image was transmitted to a computer by means of a camera. The rays reflected much better on the particles of sand and aggregate than on the porous cement paste. Many characteristics of the extracted aggregate particles can be evaluated on the basis of the obtained large image subjected to morphological operations. The contents of the paste and concrete components will be determined using known air content tests.
- The professional microscopic set with the attachment allowed for recording and analysing much larger areas of concrete samples (e.g., 50 cm2) compared with other methods which are capable of examining an area of only several square centimetres.
- The proposed method is not universal, because it is not always possible to automate it. In the case of coarse aggregate, which is porous or cracked, the luminous flux was significantly dispersed without giving a clear reflection. This required additional work in order to manually correct the imperfections in the binary image. Manual correction consists of manually drawing particle outlines in the graphic editor, filling them and then separating the connected objects (the automatic separation function available in the computer program was unsatisfactory).
- The results obtained from the analyses were very promising and provided a method with the potential to be applied in practice to analyse the composition of hardened concrete extracted from the structure, determine the paste volume as the basic parameter necessary to calculate the air void spacing factor L to EN 480-11, establish the sand particle size, necessary for the design of renovation mortar compositions (restoration of historic buildings) and, in the case of concrete mix segregation, to determine the volume concentration of sand and coarse aggregate in different layers of hardened concrete.
- The proposed method was simple and inexpensive.
Author Contributions
Conceptualization, J.W. and A.M.; Data curation, J.W. and A.M.; Formal analysis, J.W. and A.M.; Investigation, J.W. and A.M.; Methodology, J.W. and A.M.; Supervision, J.W. and A.M.; Validation, J.W. and A.M.; Visualization, J.W. and A.M.; Writing—Original draft, A.M.; Writing—Review and editing, J.W. and A.M.
Funding
This research received no external funding.
Conflicts of Interest
The authors declare no conflict of interest.
References
- Sahu, S.; Badger, S.; Thaulow, N.; Lee, R.J. Determination of water–cement ratio of hardened concrete by scanning electron microscopy. Cem. Concr. Compos. 2004, 26, 987–992. [Google Scholar] [CrossRef]
- Edwin, R.S.; Mushthofa, M.; Gruyaert, E.; De Belie, N. Quantitative analysis on porosity of reactive powder concrete based on automated analysis of back-scattered-electron images. Cem. Concr. Compos. 2019, 96, 1–10. [Google Scholar] [CrossRef]
- Lu, H.; Alymov, E.; Shah, S.; Peterson, K. Measurement of air void system in lightweight concrete by X-ray computed tomography. Constr. Build. Mater. 2017, 152, 467–483. [Google Scholar] [CrossRef]
- Yuan, J.; Wu, Y.; Zhang, J. Characterization of air voids and frost resistance of concrete based on industrial computerized tomographical technology. Constr. Build. Mater. 2018, 168, 975–983. [Google Scholar] [CrossRef]
- Deboodt, T.; Wildenschild, D.; Ideker, J.H.; Isgor, O.B. Use of iodine for improving phase quantification using X-ray tomography. Cem. Concr. Res. 2019, 116, 102–112. [Google Scholar] [CrossRef]
- Wong, R.C.K.; Chau, K.T. Estimation of air void and aggregate spatial distributions in concrete under uniaxial compression using computer tomography scanning. Cem. Concr. Res. 2005, 35, 1566–1576. [Google Scholar] [CrossRef]
- Wan, K.; Chen, L.; Xu, Q. Calibration of grayscale values of cement constituents using industrial X-ray tomography. Sci. China Technol. Sci. 2015, 58, 485–492. [Google Scholar] [CrossRef]
- Garboczi, E.J. Three-dimensional mathematical analysis of particle shape using X-ray tomography and spherical harmonics: Application to aggregates used in concrete. Cem. Concr. Res. 2002, 32, 1621–1638. [Google Scholar] [CrossRef]
- Balázs, G.L.; Lublóy, E.; Földes, T. Evaluation of concrete elements with X-ray computed tomography. J. Mater. Civ. Eng. 2018, 30, 1–9. [Google Scholar] [CrossRef]
- Diamond, S. The microstructure of cement paste and concrete—A visual primer. Cem. Concr. Compos. 2004, 26, 919–933. [Google Scholar] [CrossRef]
- Elsen, J.; Lens, N.; Aarre, T.; Quenard, D.; Smolej, V. Determination of the w/c ratio of hardened cement paste and concrete samples on thin sections using automated image analysis techniques. Cem. Concr. Res. 1995, 25, 827–834. [Google Scholar] [CrossRef]
- Marinoni, N.; Pavese, A.; Foi, M.; Trombino, L. Characterisation of mortar morphology in thin sections by digital image processing. Cem. Concr. Res. 2005, 35, 1613–1619. [Google Scholar] [CrossRef]
- Jakobsen, U.H.; Brown, D.R. Reproducibility of w/c ratio determination from fluorescent impregnated thin sections. Cem. Concr. Res. 2006, 36, 1567–1573. [Google Scholar] [CrossRef]
- NT BUILD 361. Concrete, Hardened: Water-Cement Ratio, 2nd ed.; Nordtest: Espoo, Finland, 1999. [Google Scholar]
- Head, M.K.; Wong, H.S.; Buenfeld, N.R. Characterizing aggregate surface geometry in thin-sections of mortar and concrete. Cem. Concr. Res. 2008, 38, 1227–1231. [Google Scholar] [CrossRef]
- Mertens, G.; Elsen, J. Use of computer assisted image analysis for the determination of the particle-size distribution of sands used in mortars. Cem. Concr. Res. 2006, 36, 1453–1459. [Google Scholar] [CrossRef]
- European Standard EN 480-11. Admixtures for Concrete, Mortar and Grout—Test Methods—Part 11: Determination of Air Void Characteristics in Hardened Concrete; CEN: Brussels, Belgium, 2005. [Google Scholar]
- Chinchón, S.; García, J.; López-Atalaya, M.; Linares, A.; Vera, R. Cement paste colouring in concretes. Cem. Concr. Res. 2004, 34, 1987–1991. [Google Scholar] [CrossRef]
- Załocha, D.; Kasperkiewicz, J. Estimation of the structure of air entrained concrete using a flatbed scanner. Cem. Concr. Res. 2005, 35, 2041–2046. [Google Scholar] [CrossRef]
- Murotani, T.; Igarashi, S.; Koto, H. Distribution analysis and modeling of air voids in concrete as spatial point processes. Cem. Concr. Res. 2019, 115, 124–132. [Google Scholar] [CrossRef]
- Peterson, K. Air Void Analysis of Hardened Concrete via Flatbed Scanner. Master’s Thesis, Michigan Technological University, Houghton, MI, USA, 2001. [Google Scholar]
- Chatterji, S.; Gudmundsson, H. Characterization of entrained air bubble systems in concretes by means on an image analyzing microscope. Cem. Concr. Res. 1977, 7, 423–428. [Google Scholar] [CrossRef]
- Gudmundsson, H.; Chatterji, S.; Jensen, A.D.; Thaulow, N.; Christensen, P. The measurement of paste content in hardened concrete using automatic image analyzing technique. Cem. Concr. Res. 1979, 9, 607–612. [Google Scholar] [CrossRef]
- Brzezicki, J. Use of computer assisted image analysis for the analysing the structure of concrete. In Proceedings of the 39th Scientific Conference KILiW i KN PZITB, Warszawa-Krynica-Rzeszów, Poland, 1993; pp. 21–28. [Google Scholar]
- Pleau, R.; Plante, P.; Gagne, R.; Pigeon, M. Practical considerations pertaining to the microscopical determination of air void characteristics of hardened concrete (ASTM standard). Cem. Concr. Aggreg. 1990, 12, 3–11. [Google Scholar] [CrossRef]
- ASTM C457. Standard Test Method for Microscopical Determination of Parameters of the Air-Void System in Hardened Concrete; ASTM: West Conshohocken, PA, USA, 2016. [Google Scholar]
- Saltykov, S.A. Stereometric Metallography, 2nd ed.; Metallurgizdat: Moscow, Russia, 1976. [Google Scholar]
- Underwood, E.E. Quantitative Stereology; Addison-Wiley Publishing Company: Boston, MA, USA, 1970. [Google Scholar]
- Xu, Y.-H.; Pitot, H.C. An improved stereologic method for three-dimensional estimation of particle size distribution from observations in two dimensions and its application. Comput. Methods Programs Biomed. 2003, 72, 1–20. [Google Scholar] [CrossRef]
Figure 1.
View of the microscope with the attachment mounted on the objective lens for additional illumination of concrete specimens.
Figure 1.
View of the microscope with the attachment mounted on the objective lens for additional illumination of concrete specimens.

Figure 2.
Image of the sample: (a) ordinary light illumination, (b) illumination enhanced with the attachment and (c) binary image of the aggregate after correction.
Figure 2.
Image of the sample: (a) ordinary light illumination, (b) illumination enhanced with the attachment and (c) binary image of the aggregate after correction.

Figure 3.
NIS Elements window with marked threshold (left); sand particle equivalent diameter histogram (right).
Figure 3.
NIS Elements window with marked threshold (left); sand particle equivalent diameter histogram (right).

Figure 4.
Comparison of the results from calculations and sieve analysis of sand.

Figure 5.
Image of the test surface: (a) ordinary light, voids filled with fluorescent powder, (b) binary image of aggregate particles, (c) binary image of voids and (d) binary image of cement paste, marked in blue
Figure 5.
Image of the test surface: (a) ordinary light, voids filled with fluorescent powder, (b) binary image of aggregate particles, (c) binary image of voids and (d) binary image of cement paste, marked in blue


Table 1.
Number of particles Na(i) per 1 mm2 of the specimen area and the corresponding calculated number of particles Nv(i) per 1 mm3.
Table 1.
Number of particles Na(i) per 1 mm2 of the specimen area and the corresponding calculated number of particles Nv(i) per 1 mm3.
| Class | Diameter µm | Na(i), 1/mm2 | Nv(i) | |||
|---|---|---|---|---|---|---|
| 1 | 2 | 3 | Average | 1/mm3 | ||
| 1 | 0–39 | 0.007 | 0.002 | 0.040 | 0.0212 | 1.3895 |
| 2 | 40–49 | 0.003 | 0.003 | 0.087 | 0.0452 | 2.3745 |
| 3 | 50–62 | 0.044 | 0.010 | 0.175 | 0.0925 | 3.8560 |
| 4 | 63–79 | 0.185 | 0.142 | 0.253 | 0.1976 | 6.4840 |
| 5 | 80–99 | 0.312 | 0.291 | 0.321 | 0.3058 | 8.0286 |
| 6 | 100–124 | 0.395 | 0.363 | 0.376 | 0.3695 | 7.7585 |
| 7 | 125–157 | 0.459 | 0.406 | 0.436 | 0.4212 | 6.9931 |
| 8 | 158–199 | 0.514 | 0.446 | 0.509 | 0.4780 | 6.2614 |
| 9 | 200–250 | 0.571 | 0.478 | 0.578 | 0.5281 | 5.5014 |
| 10 | 251–315 | 0.537 | 0.472 | 0.585 | 0.5285 | 4.3598 |
| 11 | 316–397 | 0.423 | 0.417 | 0.470 | 0.4436 | 2.8914 |
| 12 | 398–500 | 0.276 | 0.283 | 0.329 | 0.3059 | 1.5718 |
| 13 | 501–630 | 0.140 | 0.165 | 0.164 | 0.1645 | 0.6626 |
| 14 | 631–793 | 0.060 | 0.075 | 0.077 | 0.0759 | 0.2381 |
| 15 | 794–999 | 0.022 | 0.026 | 0.027 | 0.0266 | 0.0640 |
| 16 | 1000–1259 | 0.009 | 0.009 | 0.011 | 0.0098 | 0.0177 |
| 17 | 1260–1584 | 0.005 | 0.002 | 0.004 | 0.0030 | 0.0038 |
| 18 | 1585–1995 | 0.000 | 0.000 | 0.000 | 0.0002 | 0.0002 |
Table 2.
Concrete composition data.
| Constituent | kg/m3 | Constituent Density kg/dm3 | Volume Fraction % | |
|---|---|---|---|---|
| W | 151 | 1.0 | 15.1 | P = 26.9 |
| C | 338 | 3.1 | 10.9 | |
| SF | 18 | 2.2 | 0.8 | |
| S | 615 | 2.63 | 23.4 | BS = 67.3 |
| B2-8 | 588 | 2.97 | 19.7 | |
| B8-16 | 718 | 2.97 | 24.1 | |
| Air content | - | - | 5.8 | A = 5.8 |
| Concrete density | 2437 | - | - | - |
Table 3.
Microscopic measurement results.
| Area of Measurement AOM | Aggregate BS2D % | Air Content A2D % | Cement Paste P2D % |
|---|---|---|---|
| 1 | 69.30 | 4.71 | 26.0 |
| 2 | 65.96 | 6.03 | 28.0 |
| 3 | 70.09 | 3.76 | 26.2 |
| Mean | 68.45 | 4.83 | 26.7 |
© 2019 by the authors. Licensee MDPI, Basel, Switzerland. This article is an open access article distributed under the terms and conditions of the Creative Commons Attribution (CC BY) license (http://creativecommons.org/licenses/by/4.0/).
Share and Cite
MDPI and ACS Style
Wawrzeńczyk, J.; Molendowska, A. The Use of a Special Stereoscopic Microscope Attachment for the Sieve Analysis of Aggregate in Concrete. Appl. Sci. 2019, 9, 1853. https://doi.org/10.3390/app9091853
AMA Style
Wawrzeńczyk J, Molendowska A. The Use of a Special Stereoscopic Microscope Attachment for the Sieve Analysis of Aggregate in Concrete. Applied Sciences. 2019; 9(9):1853. https://doi.org/10.3390/app9091853
Chicago/Turabian StyleWawrzeńczyk, Jerzy, and Agnieszka Molendowska. 2019. "The Use of a Special Stereoscopic Microscope Attachment for the Sieve Analysis of Aggregate in Concrete" Applied Sciences 9, no. 9: 1853. https://doi.org/10.3390/app9091853
Note that from the first issue of 2016, this journal uses article numbers instead of page numbers. See further details here.