Data-Driven Calibration Estimation for Robust Remote Pulse-Oximetry


1
Philips Research, High Tech Campus 34, 5656AE Eindhoven, The Netherlands
2
Department of Electrical Engineering, Eindhoven University of Technology, 5612AP Eindhoven, The Netherlands
*
Author to whom correspondence should be addressed.
Appl. Sci. 2019, 9(18), 3857; https://doi.org/10.3390/app9183857
Submission received: 9 August 2019
/
Revised: 4 September 2019
/
Accepted: 9 September 2019
/
Published: 13 September 2019
(This article belongs to the Special Issue Contactless Vital Signs Monitoring)
Abstract
:Pulse-oximetry has become a core monitoring modality in most fields of medicine. Typical dual-wavelength pulse-oximeters estimate blood oxygen saturation (SpO2) levels from a relationship between the amplitudes of red and infrared photoplethysmographic (PPG) waveforms. When captured with a camera, the PPG waveforms are much weaker and consequently the measurement is more sensitive to distortions and noises. Therefore, an indirect method has recently been proposed where, instead of extracting the relative amplitudes from the individual waveforms, the waveforms are linearly combined to construct a collection of pulse signals with different pulse signatures, each corresponding to a specific oxygen saturation level. This method has been shown to outperform the conventional ratio-of-ratios based methods, especially when adding a third wavelength. Adding wavelengths, however, complicates the calibration. Inaccuracies in the calibration model threaten the performance of the method. Opto-physiological models have been shown earlier to provide useful calibration parameter estimates. In this paper, we show that the accuracy can be improved using a data-driven approach. We performed 5-fold cross validation on recordings with variations in oxygen saturation and optimized for pulse quality. All evaluated wavelength combinations, also without visible red, meet the required ISO standard accuracy with the calibration from the proposed method. This scalable approach is not only helpful to fine-tune the calibration model, but even allows computation of the calibration model parameters from scratch without prior knowledge of the data acquisition details, i.e., the properties of camera and illumination.
1. Introduction
Ensuring adequate oxygen delivery to tissues is a prime objective of acute/critical medical care. Pulse-oximetry allows rapid and convenient measurement of the arterial oxygen saturation with low-cost hardware. It is regarded as the fifth vital sign and enables early detection of hypoxia and screening for critical congenital heart disease (CCHD) [1] and sleep apnea [2]. After the discovery of the basic principle by Aoyagi in the mid-1970s, the first pulse-oximeters were successfully marketed in the 1980s. Nowadays, pulse-oximeters are ubiquitously used in operating theatres, hospital wards, outpatient clinics and general practice surgeries for the monitoring of the critically ill. Before the invention of the pulse-oximeter, invasive arterial blood sampling with subsequent analysis was required. Pulse-oximetry relies on the optical absorption properties of oxygenated and deoxygenated blood measured by a non-invasive optical source-detector geometry, allowing a continuous estimation of blood oxygen saturation. However, pulse-oximeters are prone to motion artifacts and require skin contact.
Over the last few decades, methods have been presented which allow contactless monitoring of human vital signs with regular cameras in both visible and near-infrared conditions based on the detection of visually imperceptible skin color variations caused by blood volume variations. These vital signs include heart rate and derived features [3], respiration [4,5], and, more recently, oxygen saturation [4,6,7,8,9,10]. Contactless monitoring is especially relevant for: (1) scenarios where direct skin contact should be prevented (e.g., premature infants [11,12] or patients with extensive burns [13]), (2) spot-check scenarios where a reading should be available within seconds, or (3) scenarios where the current diagnostic procedure could affect the clinical outcome (e.g., with polysomnography for sleep monitoring [14,15,16]). The main challenge of contactless measurements is that the signal is generally much weaker compared to its contact-based counterpart and hence more easily distorted. This is particularly detrimental for measurements where amplitudes have to be extracted from individual PPG waveforms, e.g., for the measurement of peripheral blood oxygen saturation (SpO2). This motivated the development of an indirect method for the estimation of SpO2 using SpO2-dependent pulse signatures [8], which does not require the individual extraction of amplitudes. This method, denoted “APBV” (Adaptive-PBV), showed the feasibility of estimating SpO2 from distorted PPG signals, e.g., during movement, where the conventional ratio-of-ratios based method renders inaccurate. In order to apply this method, proper calibration is essential. Opto-physiological modelling provides a treasonable estimate but is not sufficiently accurate. Hence, commercially available pulse-oximeters are calibrated based on empirical data.
In this paper, we present an empirical, data-driven approach to estimate a calibration model for the indirect APBV method which can be applied to an arbitrary number and selection of wavelengths. This is relevant, as in our earlier paper [8], we showed that adding a third wavelength improves the robustness of the measurement. We demonstrate that, based on a dataset with only small variations in SpO2, an accurate calibration model can be determined which outperforms a calibration model based on modelling of the PPG spectrum. Furthermore, we show that the error only slightly increases using solely near-infrared (NIR) wavelengths when compared to the typical combination of visible red and NIR wavelengths, which confirms our earlier observations [8] and widens the scope for camera-based pulse-oximetry, e.g., for sleep or continuous 24/7 monitoring where patients are monitored in full darkness.
2. Materials and Methods
2.1. Background
Contactless, camera-based measurement of SpO2 is a relatively new field of research. After pioneering work by Wieringa [6] and Kong [7] and Tarassenko [4], Verkruysse et al. [9] was the first to demonstrate the feasibility of calibratable SpO2 estimation with a camera under normoxic and hypoxic conditions, which is non-trivial because of the fundamental differences in source-detector geometry. The conventional contact source-detector geometry collects light that has travelled through relatively deep vasculature (both in transmissive and reflective mode), whereas the contactless, wide-field illumination-detection geometry predominantly collects light that has travelled through much shallower tissue depths over much smaller distances. Verkruysse et al. used the commonly used “ratio-of-ratios” based approach and mentioned that low signal strength and subject motion present critical challenges that will have to be addressed to make camera-based pulse-oximetry practically feasible. As the name implies, with ratio-of-ratios, the ratio of two DC-normalized PPG waveforms is calculated and linked to an SpO2 value via a calibration curve or look-up table, based on the assumption that the pulsatile, AC, component originates from variations in arterial blood only. This principle works fine for clean signals, but is rendered inaccurate when the signals are noisy or corrupted by motion artifacts. This motivated the development of the APBV method [8], inspired by the PBV method for camera-based pulse extraction by De Haan et al. [17] using the unique spectral signature of the blood volume pulse signal. A short description of the APBV method is provided in the next paragraph.
2.2. APBV
Instead of extracting amplitudes from the PPG waveforms and computing SpO2 with ratio-of-ratios, APBV determines SpO2 indirectly based on the signal quality of the pulse signals extracted with individual signature vectors for each possible SpO2 value [8]. This is attractive, as the optimum, indicating the SpO2-value, remains stable, even when the signal-to-noise ratio (SNR) worsens. The APBV-method can be mathematically summarized as:
where P is the pulse signal, contains the DC-normalized color variations and scalar k is chosen such that has unit length. The calculation of the weights for extraction of the pulse signal, , is formulated as a least squares problem using pulse signatures for different SpO2 values. The relation between the direct ratio-of-ratios approach and indirect APBV method can be described as:
where R is the ratio of normalized pulse amplitudes and are calibration constants. The two most important implications of these formulations are that: (1) the use of ratio-of-ratios is limited to two wavelengths, whereas APBV can be executed with an arbitrary number of wavelengths, and (2) the calibration model of APBV, i.e., , should be determined a priori. The first implication is important as it has been shown that adding a third wavelength improves the robustness of the measurement during motion [8]. In this paper, we focus on the implication of the APBV calibration model, and more specifically on the accuracy of the calibration estimation.
The SpO2 signatures compiled in for N wavelengths can be expressed as:
Here, denotes the (static) pulse signature vector for an oxygen saturation level of 100%, and denotes the update vector consisting of N parameters which describe the change of the signature for decreasing SpO2-values. In order to apply this model for SpO2 estimation, parameters have to be determined. The values for one wavelength can be set to a fixed value for both (e.g., 1) and (0), as the values in both vectors describe the ratio in pulse amplitude between the wavelengths. We will now discuss how the parameters can be determined based on opto-physiological modelling. Hereafter, we will present our proposed empirical approach.
2.2.1. Opto-Physiological Modelling
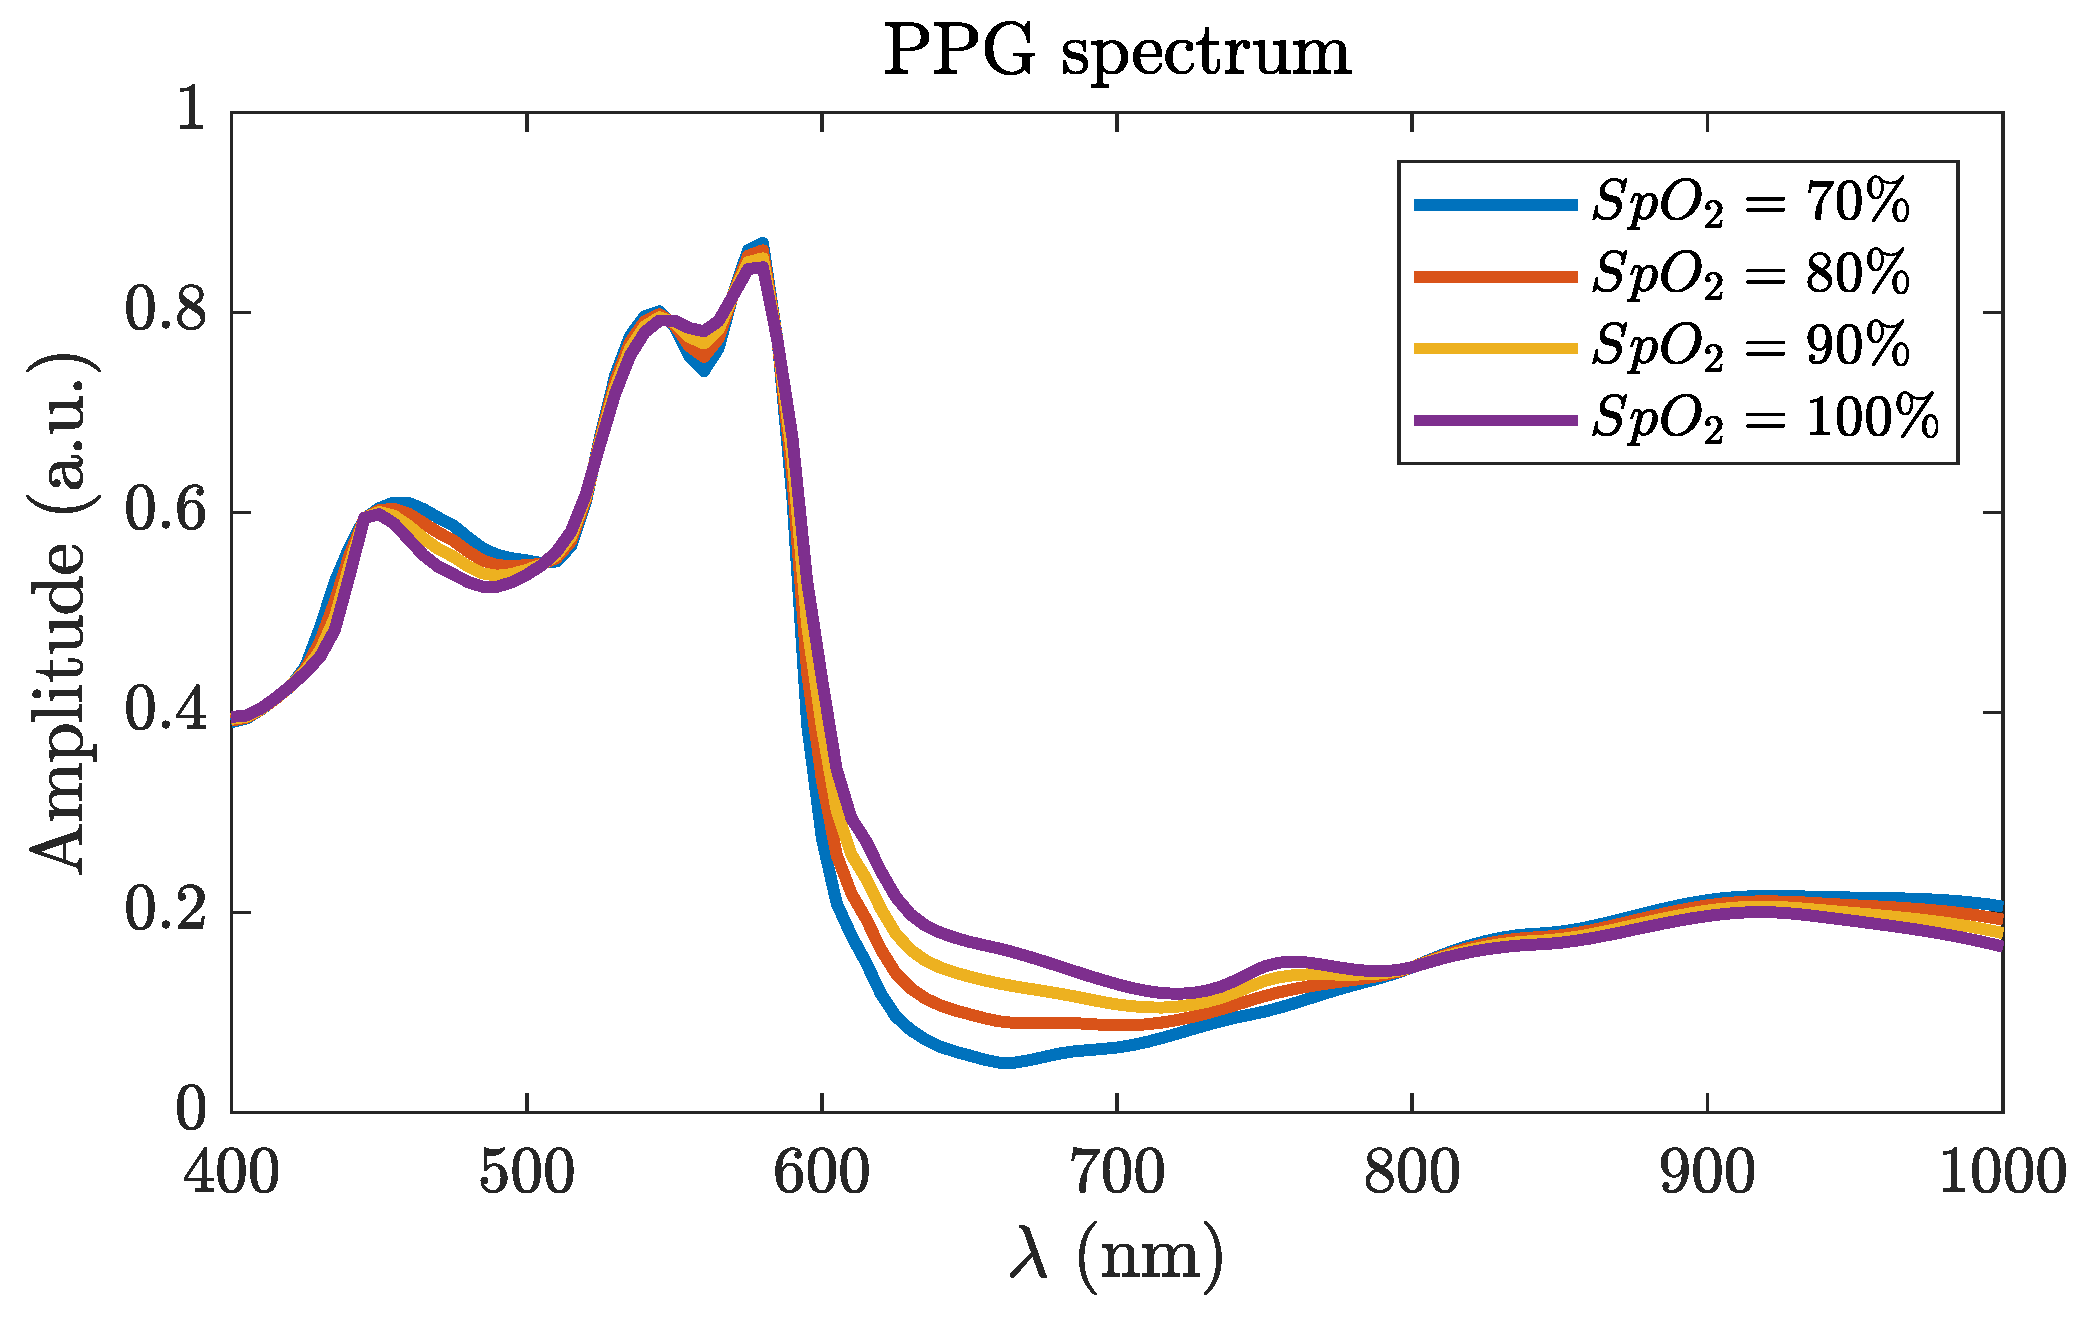
In order to be able to determine the parameters for the calibration model, the PPG amplitude spectrum can be modelled, as we did in our earlier work [8]. A first order approach to estimate the relative PPG amplitudes and their dependence on wavelength is to simply weigh the absorptivity spectra for (deoxy)hemoglobin (Hb) and oxyhemoglobin (HbO2). However, this would disregard the complex light interaction with the various skin layers. Since pulsatile arterioles are not distributed homogeneously throughout the skin, different wavelengths will experience different degrees of PPG intensity modulation not only due to the wavelength-dependent blood absorption coefficient, but also due to their different skin penetration depths. Various skin properties such as dermal scattering, venous blood concentration and blood vessel diameter [18] impact these skin penetration depths differently for different wavelengths. Therefore, we modeled diffuse reflectance for a layered skin model using the analytic approach by Svaasand et al. [19]. We also adopted their best guesses for the skin geometrical and optical properties for normal skin (e.g., epidermal and dermal scattering = ). Three layers were modeled: epidermis, upper dermis and deep dermis, with thicknesses of 0.05, 0.5 and 4 mm, respectively, with skin blood volume fractions of 0%, 1% and 2%, respectively, both for venous and arterial blood. Saturation for venous blood was 70% while four different values for arterial blood were modeled: 70%, 80%, 90% and 100%, representing four SpO2 values. At each arterial saturation level, we computed a PPG modulation as the normalized diffuse reflectance difference between a systolic and diastolic phase (slightly more/less arterial blood was modeled). One important departure from the modeling by Svaasand, however, is that we used the original absorptivities for Hb and HbO2 measured by Zijlstra and Buursma [20]. Using their tabulated values (their Table 3) along with the plots (their Figure 2), we interpolated absorptivities for Hb and HbO2 at 5 nm increments from 400–1000 nm. The modeled relative PPG spectrum is visualized in Figure 1. Finally, the SpO2-dependent parameters of the pulse signature vector can be determined by:
where , and are the illumination spectrum, the camera sensitivity and the transmission spectrum of the filter, respectively. This model is very generic, but clearly practical values for all parameters had to be chosen. The values we used, and which determined the experimental setup we used to create our dataset (Section 2.2.3), led to the following APBV calibration model:
2.2.2. Empirical
In the current research, we aim at providing an empirical, data-driven alternative for the modeling approach, which shall be compared with the earlier modeling-based approach to show it is more accurate and more generic.
Framework
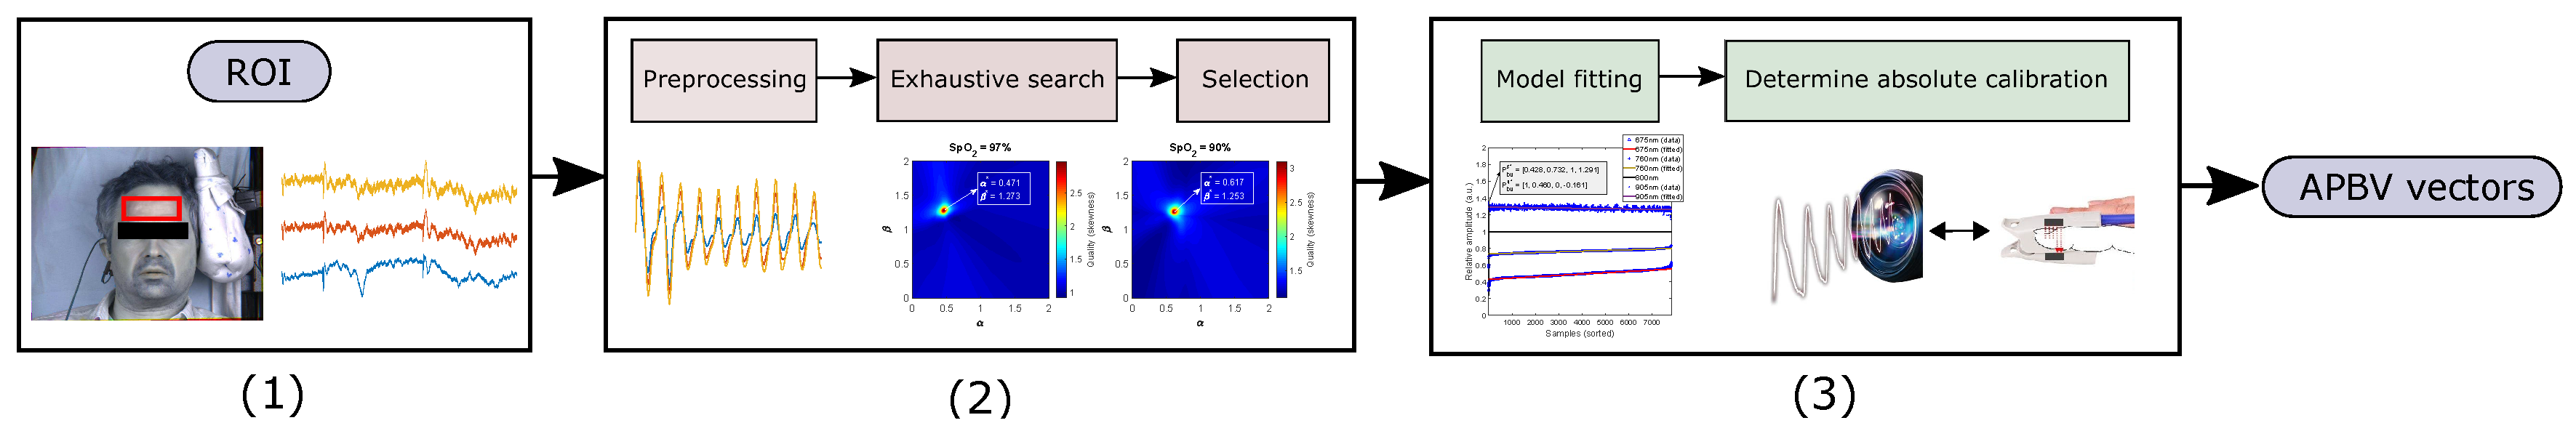
The general framework of our calibration approach is visualized in Figure 2 and consists of three steps. The first step is to extract the raw PPG signals from the videos. Hereafter, in the second step, an exhaustive search is executed over a range of possible pulse signatures of normalized amplitudes, , where the signature corresponding with the best pulse-signal quality is selected as optimum. Finally, based on the collection of estimated signature vectors, a relative calibration model is fitted where the reference data are used to arrive at the APBV calibration model with vectors and which can be used for SpO2 estimation. The three main differences between this approach and the previous calibration method for camera SpO2 [9] are that: (1) the method can be applied for the indirect APBV method for an arbitrary number of wavelengths, (2) it can be applied on short time windows which allows the capturing of dynamics in SpO2, and (3) the camera measurements are not directly linked to SpO2 values from the reference. In the next paragraphs, we discuss the steps of our proposed calibration approach in more detail.
Pre-Processing
We extracted the PPG signals from the forehead region-of-interest (ROI) using triangulation of facial landmark points. We spatially averaged the intensities of the pixels within the ROI for all wavelengths and concatenated the values for each video frame. For each time-window of 10 s, we divided the raw PPG signals for each wavelength () by its quasi-DC signal obtained by low-pass filtering (LPF), and bandpass filtered (BPF) the resulting signal to obtain the DC-normalized PPG waveforms:
where the is a first-order Butterworth filter with a cut-off frequency of 0.7 Hz, and the is a fourth-order Butterworth filter with a passband in the range 0.7–4 Hz, the typical range of pulse rates for healthy adults. The DC-normalized PPG waveforms are calculated for each step-size of 1 s and are used as the input for the exhaustive search.
Exhaustive Search
As mentioned in Section 2.2, the signature vector comprises the relative pulse amplitudes for each wavelength. Therefore, for N wavelengths, the search has to be performed over dimensions, arbitrarily setting one of the wavelength pulse-amplitude to unity (1). For a three-wavelength system, this can be formulated as:
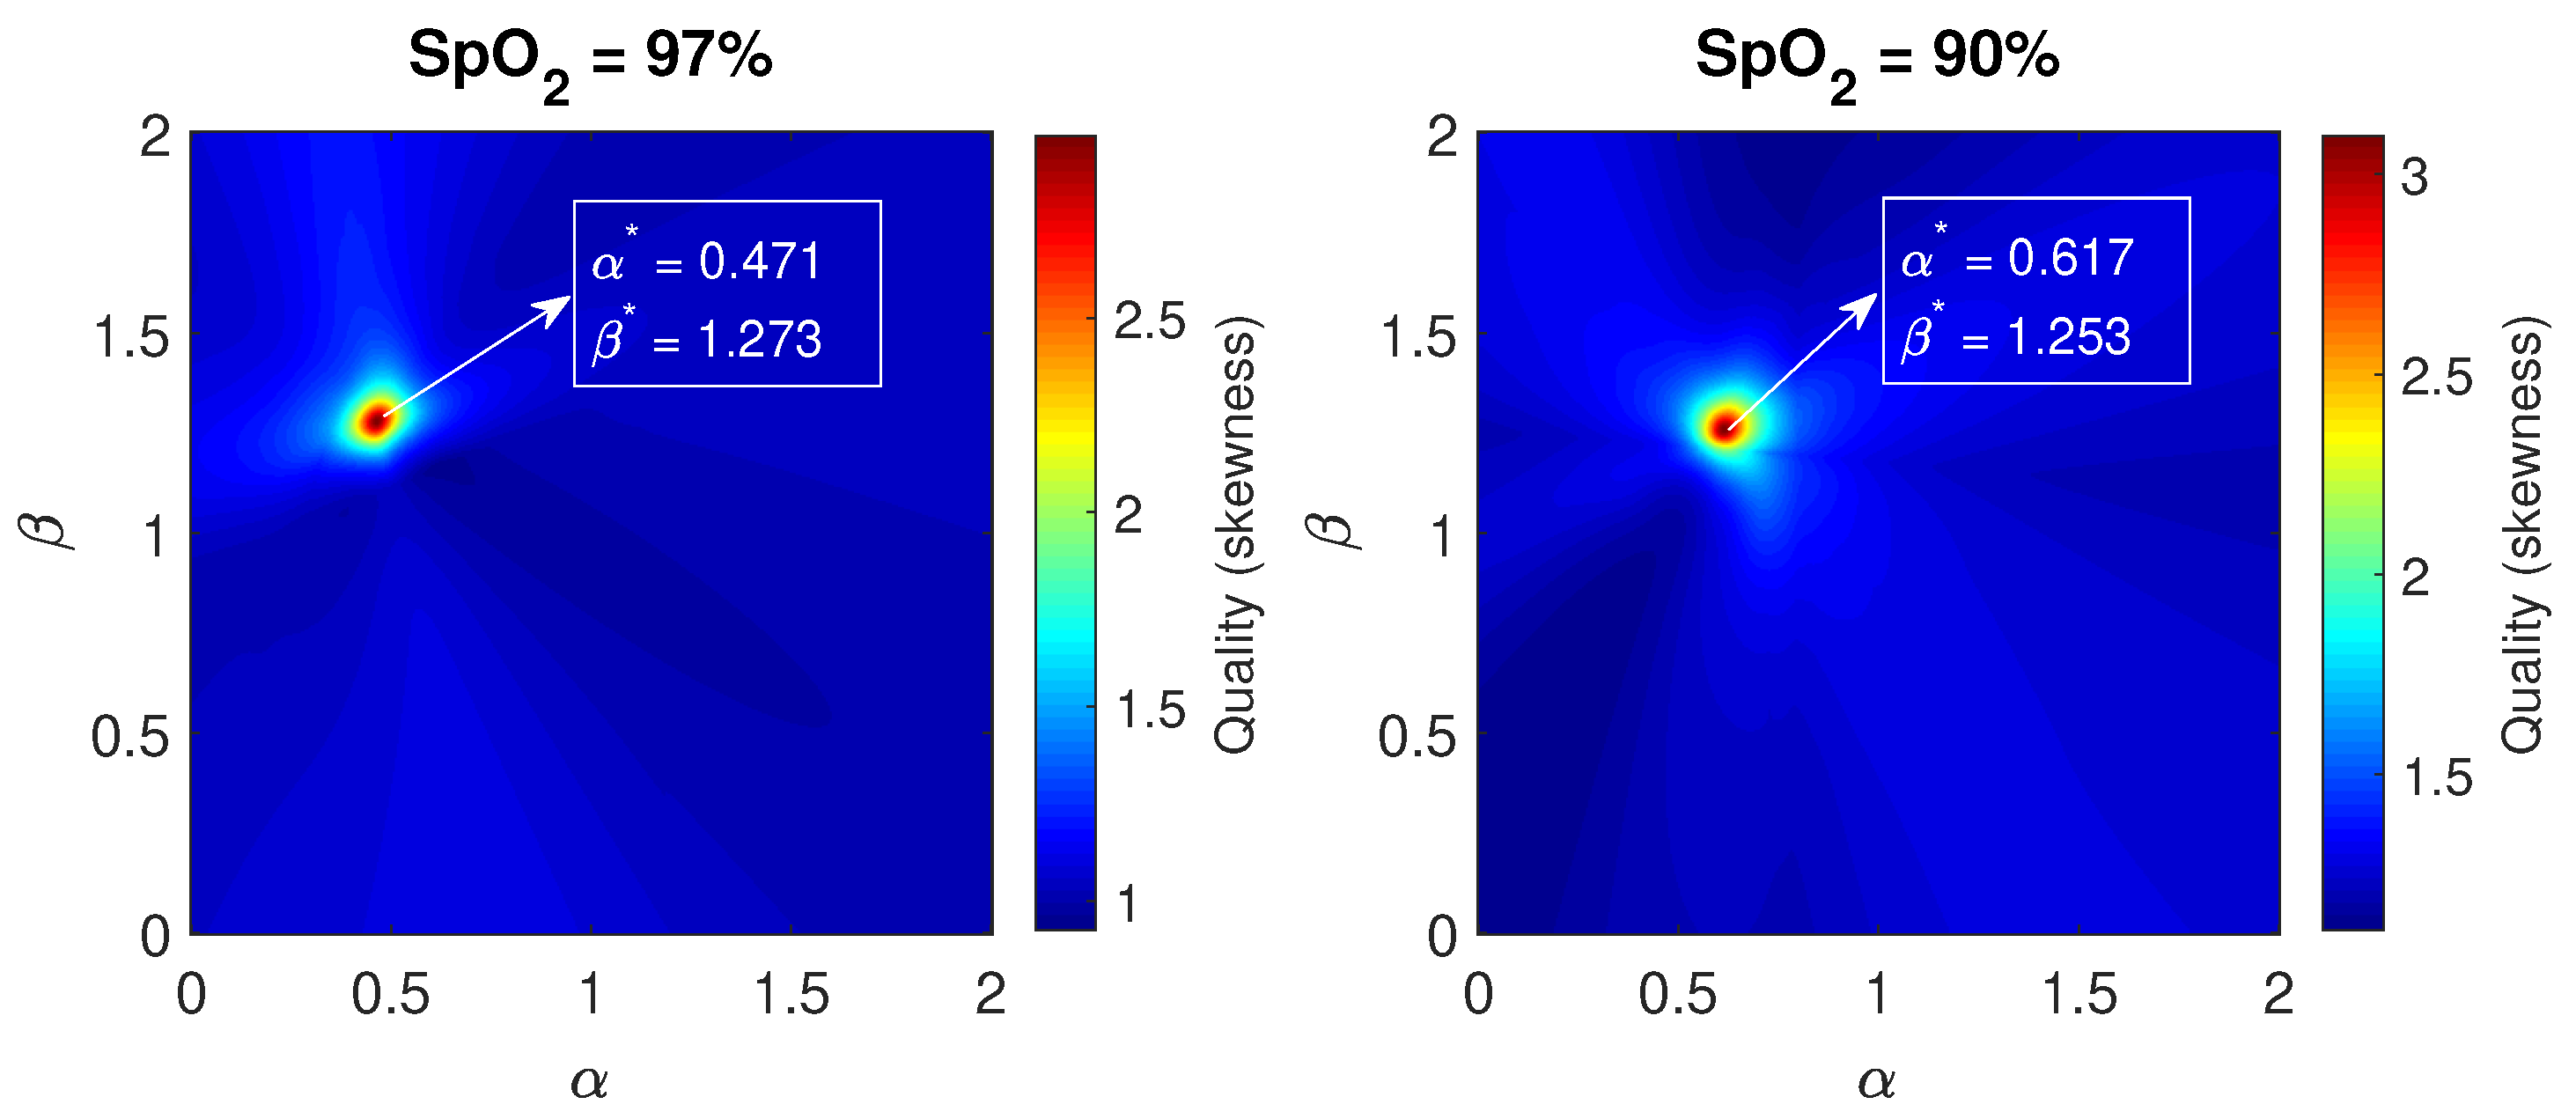
where the exhaustive search is performed over a range of and relative to the unit amplitude of . For our wavelengths present in the dataset, we set the evaluation range for and to 0–2 with a sampling resolution of 0.001. An example of the optimization for the wavelengths nm is visualized in Figure 3. We are aware that exhaustive search is computationally expense and that more efficient approaches exist, e.g., stochastic gradient descent or other simulated annealing approaches. We, however, do not worry too much that computational efficiency of what we describe could be further improved, as long as the accuracy is guaranteed.
Selection Criterion
The SpO2-value corresponds to the signature vector that yields the best pulse signal quality (Equation (1)). To assess the pulse quality, we used the skewness of the pulse spectrum. The rationale behind the skewness metric is that the spectrum of a clean pulse is highly peaked (i.e., a high skewness), whereas a noisy signal has a clearly lower skewness. The quality metric, Q, can be described as:
where denotes the frequency spectrum of pulse signal P (Equation (1)) and is the average of all spectral components of . The example for two different oxygen saturation levels visualized in Figure 3 shows clear, distinct optima (,) using skewness as quality metric, which shift as function of SpO2. For each processing window, we stored the estimated pulse signature vector together with the corresponding value of the quality metric.
Model Fitting
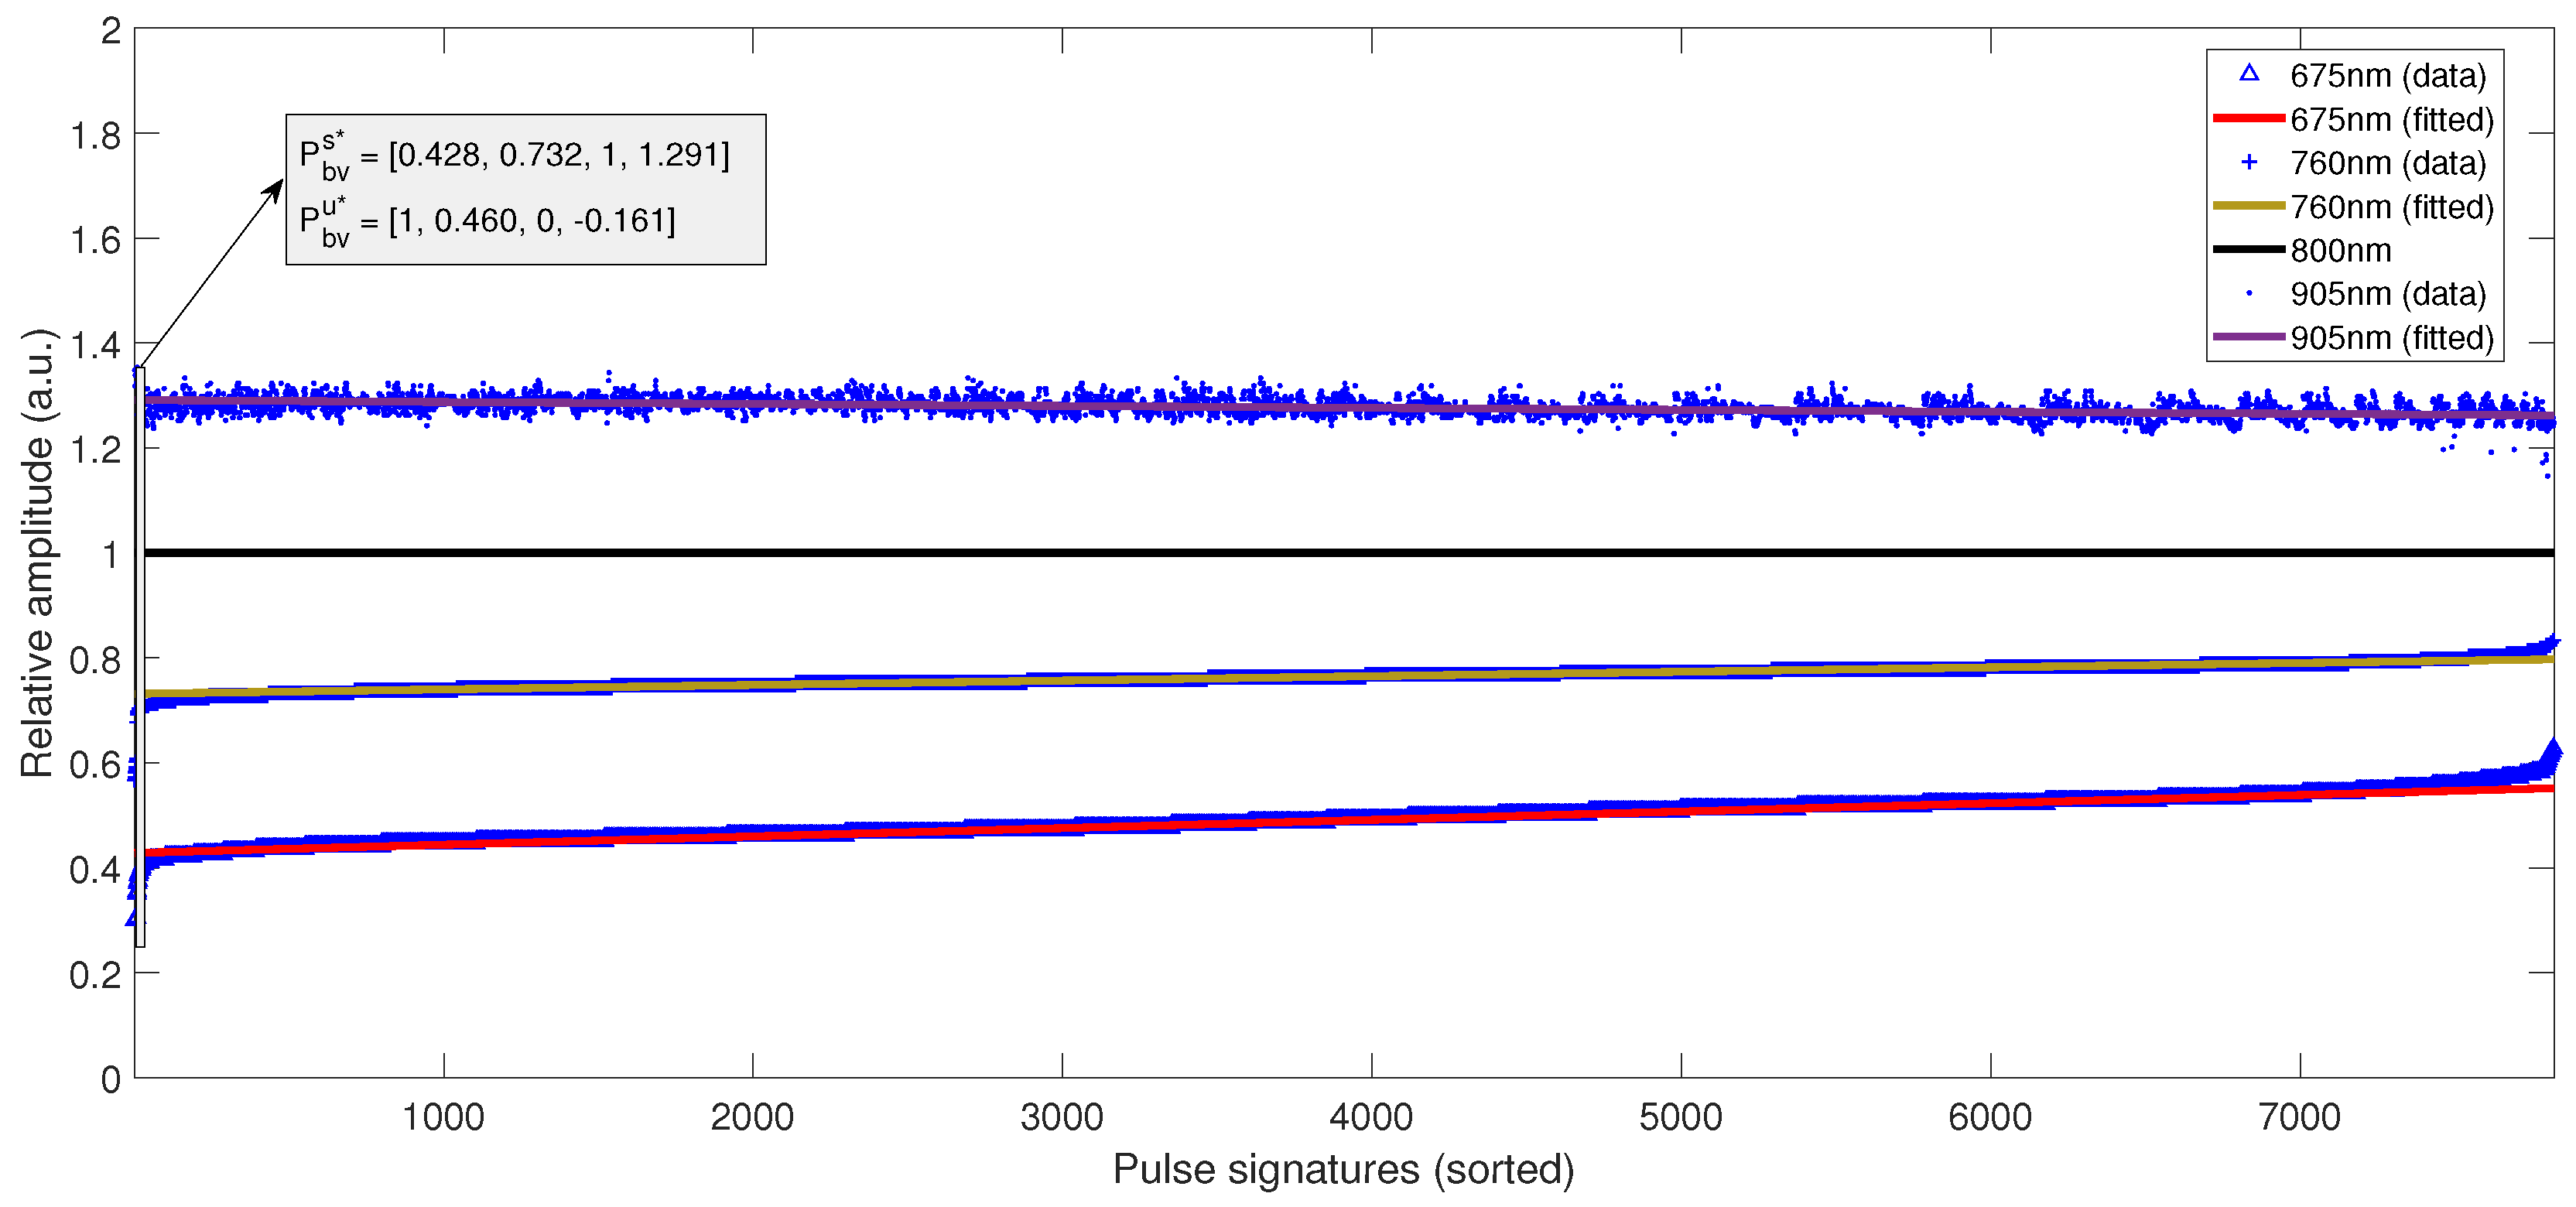
After obtaining the collection of estimated signature vectors, the relative SpO2 contrast, i.e., the change in pulse amplitude as a function of the SpO2 value, between the wavelengths has to be determined for the update vector . We accomplished this by sorting the estimated relative amplitudes from the wavelength with the largest SpO2 contrast in ascending order, as visualized in Figure 4, where the corresponding values from the other wavelengths are displayed at the same location on the horizontal axis. In order to prevent overfitting on the few samples corresponding to the lowest and highest SpO2 values, first-order polynomials were fitted on the sorted samples to estimate the relative SpO2 sensitivity using iteratively re-weighted least squares with a bisquare weighting function. Here, the weights are the values of the quality metric of each estimated signature vector. The slopes of the fits are a scaled version of the update vector , indicated with in Figure 4. In the next paragraph, we explain how the vector set for the APBV calibration model can be derived from the vectors and .
Determining the APBV Calibration Model
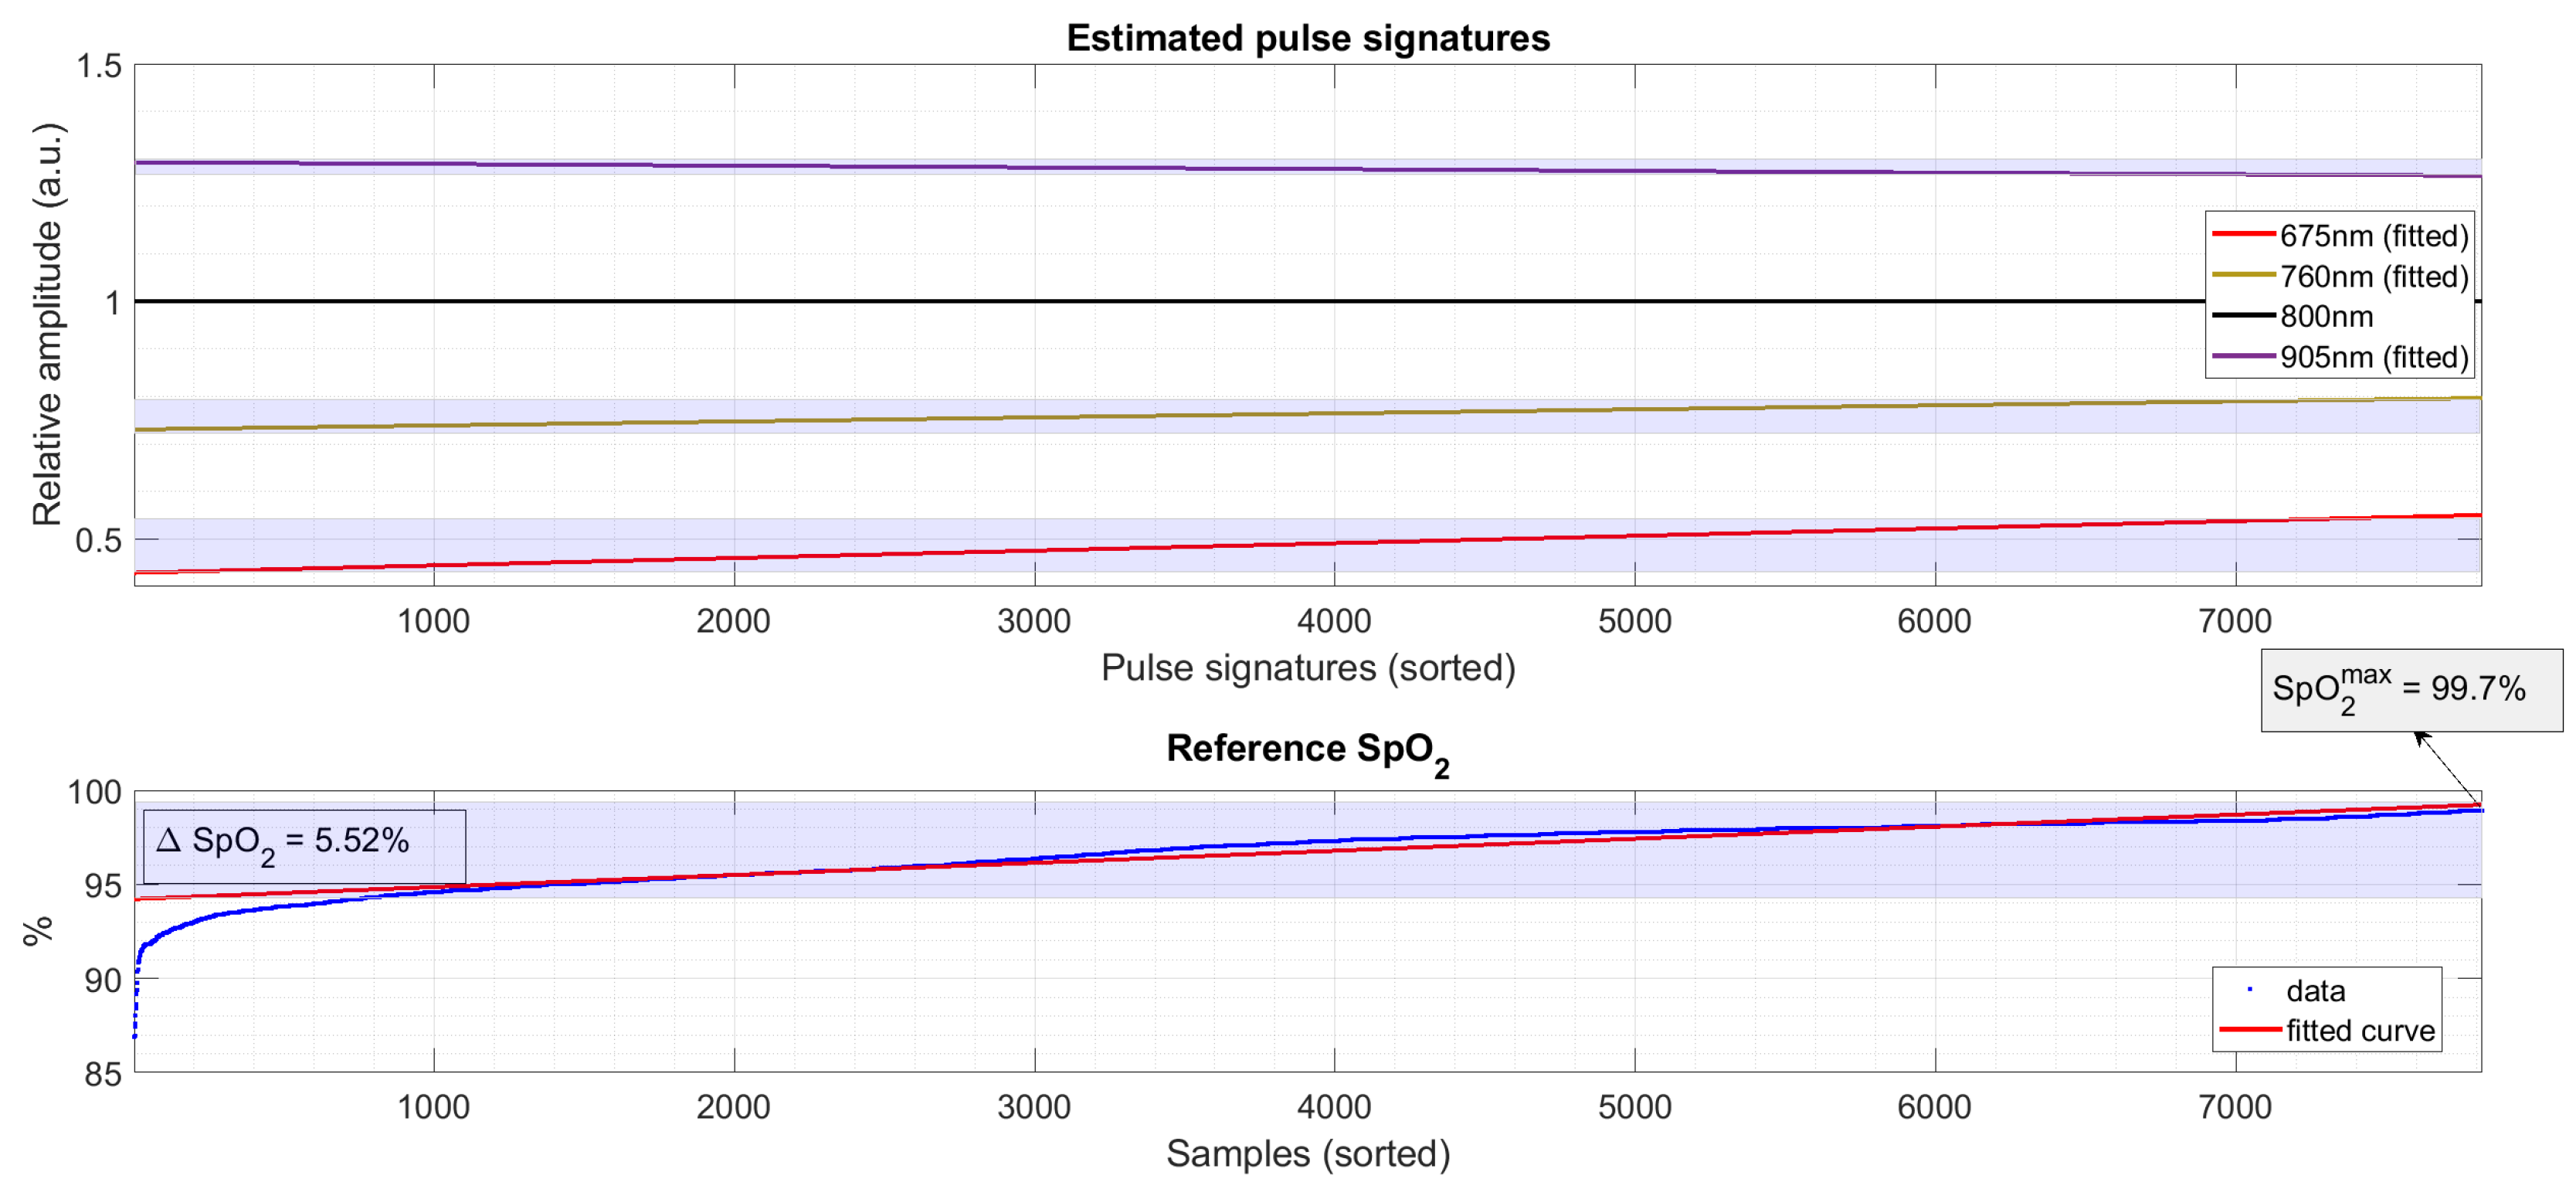
In order to determine the APBV calibration model, the range of SpO2 values present in the dataset has to be incorporated. Contrary to most calibration methodologies, we did not link each data-point (pulse signature vector) to an SpO2 value from the reference. Rather, we looked at the range and distribution of SpO2 values to reduce the effects of outliers and to prevent overfitting on short-term desaturations with unknown physiological delays between the SpO2 traces from the face (camera) and fingers (reference). The procedure is illustrated in Figure 5. Similar to the collection of estimated pulse signatures, we fitted a first-order polynomial to the sorted SpO2 of the reference data. The SpO2 of this fit is used to determine , by scaling . The signature vector for 100% SpO2, , is calculated by linear regression using the maximum value of the fit, , and the update vector .
2.2.3. Dataset
Experimental Setup
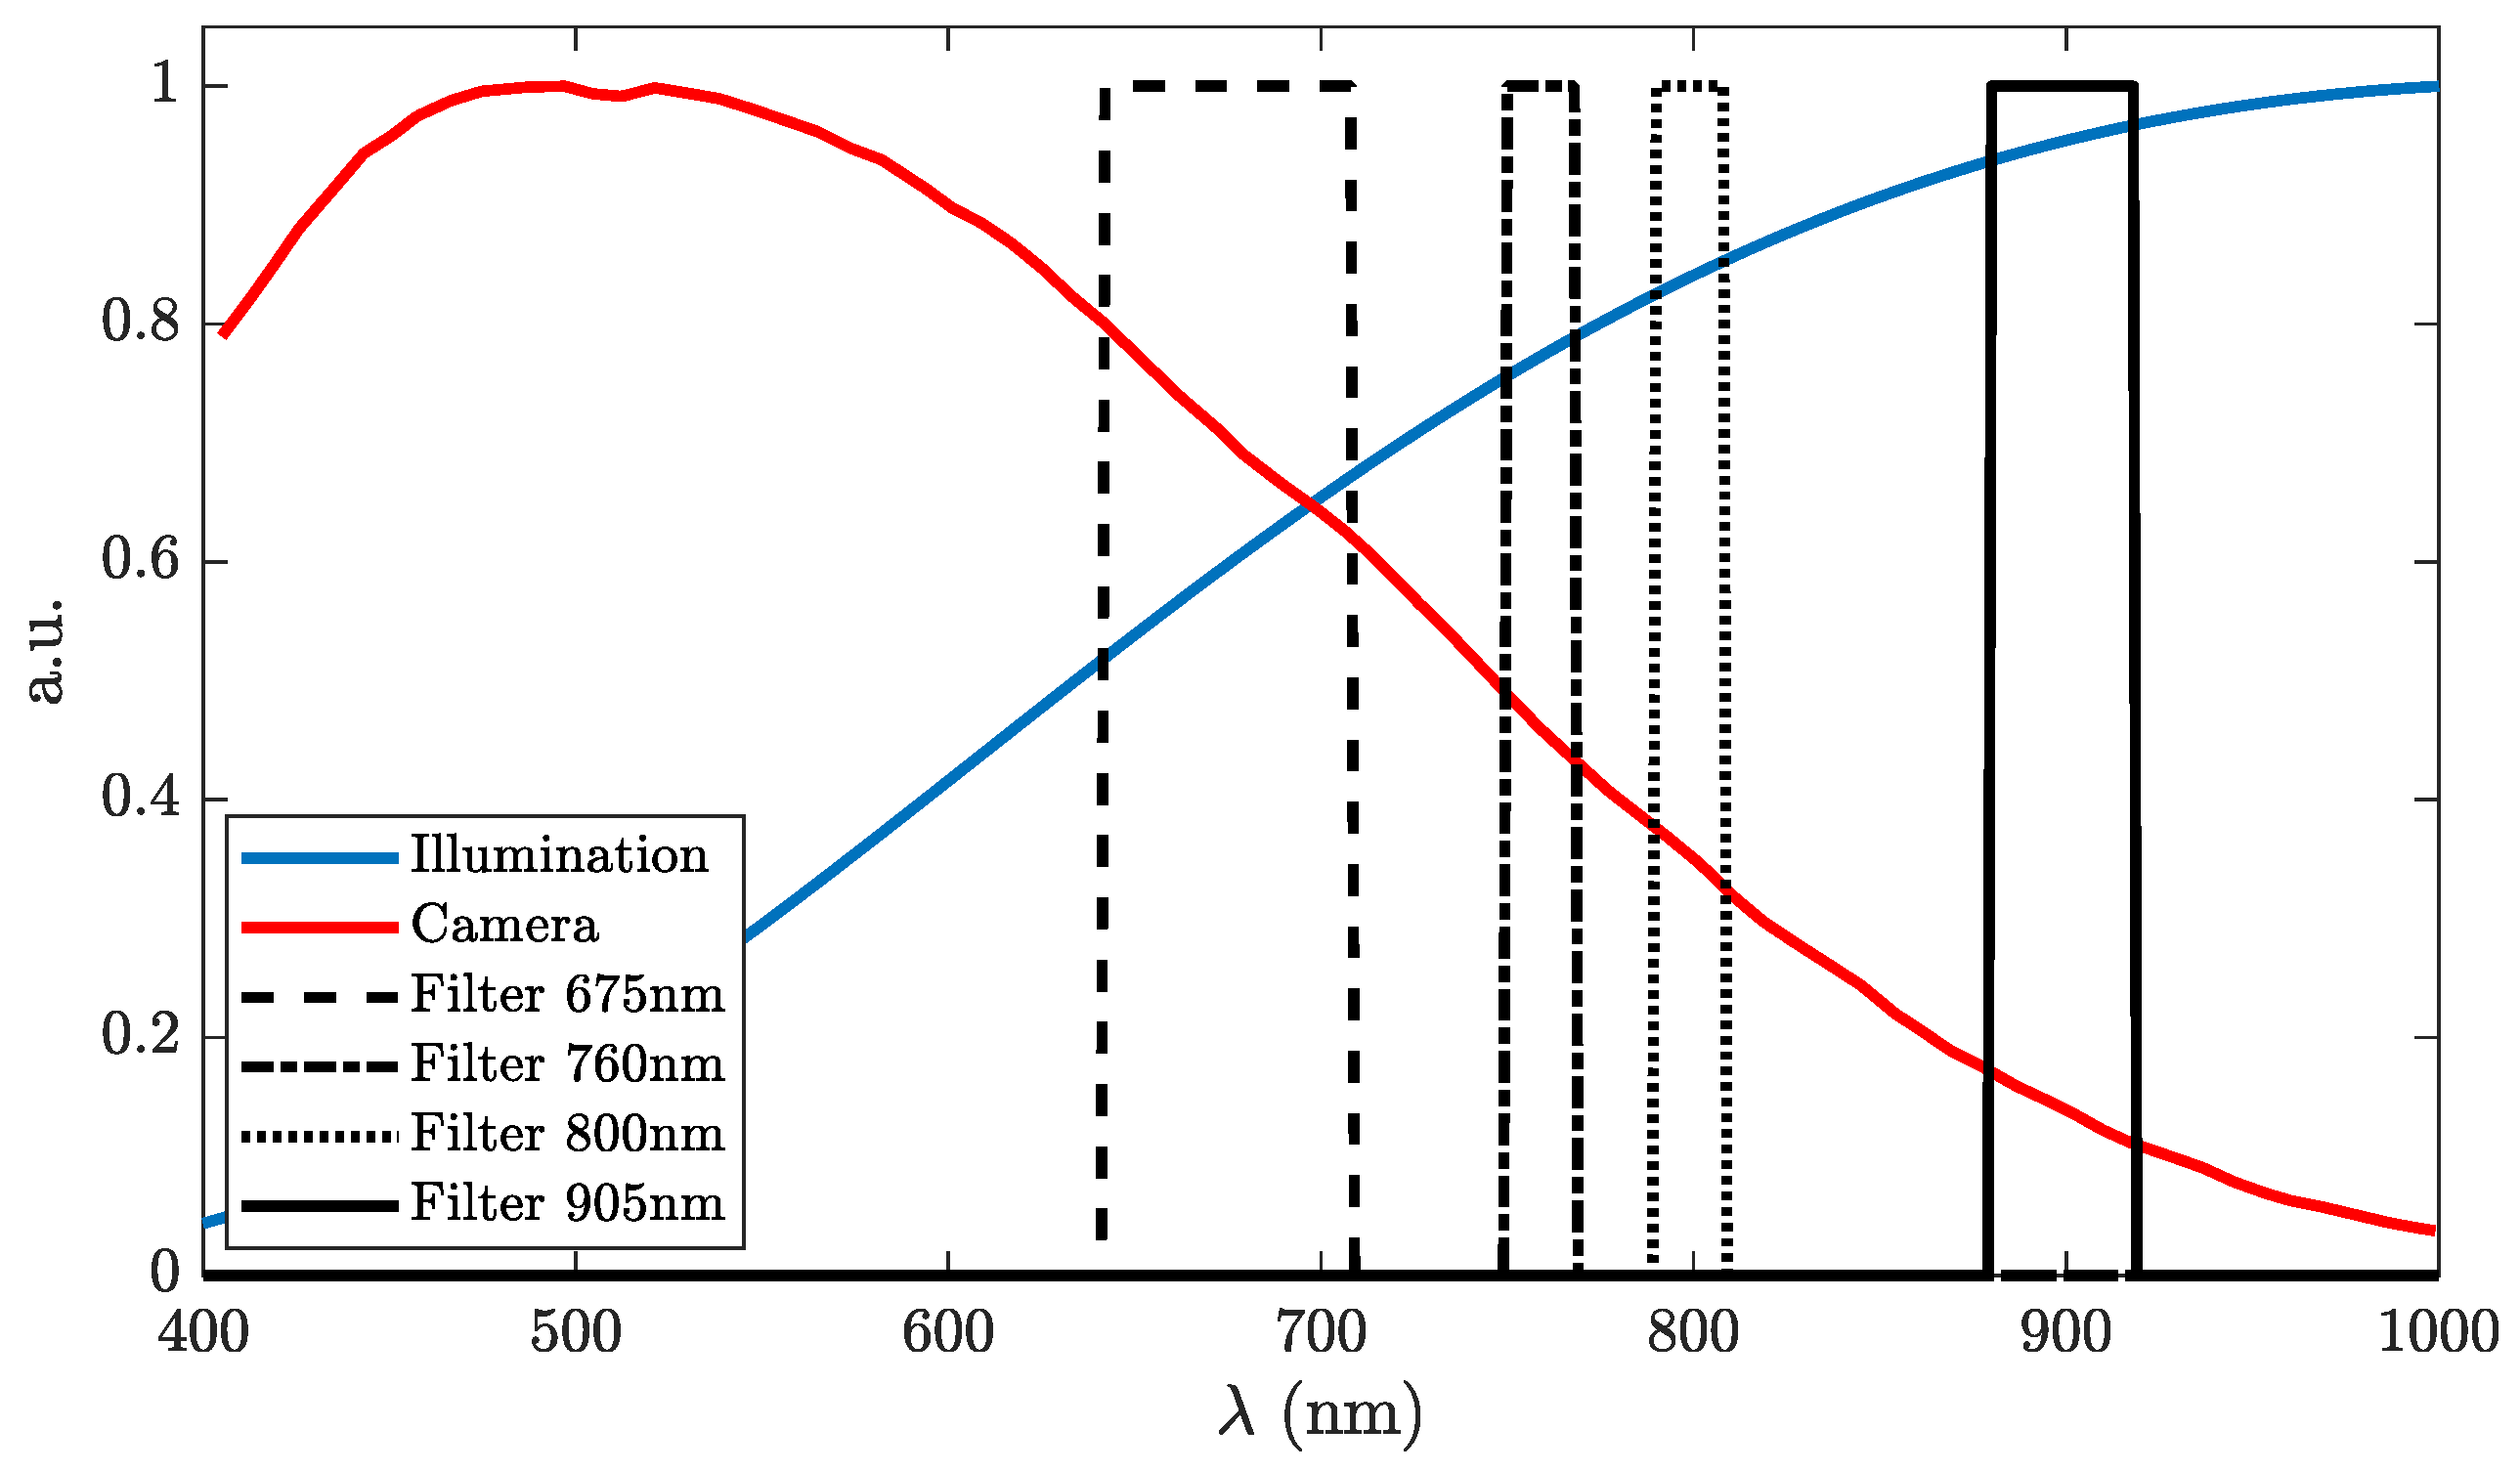
The experimental setup consists of four monochrome CCD cameras (AVT Manta G-283B, Allied Vision GmbH, Stadtroda, Germany) equipped with four identical 150 mm lenses (Schneider-Kreuznach 7805791, Bad Kreuznach, Germany). To obtain spectral selectivity, optical bandpass filters with center wavelengths (CWLs) of 675, 760, 800 and 905 nm were used, whose transmission spectra are visualized in Figure 6. The cameras were externally triggered at a stable frame rate of 15 Hz and were horizontally spaced by 9 cm. The frames from the four cameras were registered using an affine transformation. Illumination was provided by two armatures (Falcon Eyes, Hong Kong, China), each equipped with 9 incandescent lamps (60 W, Philips, Amsterdam, the Netherlands) at a distance of about 1.5 m from the subject. A current-limited DC power supply set to 210 V, 3.95 A (SM330-AR-22, Delta Elektronica, Zierikzee, the Netherlands) powered the lamps. For SpO2 reference, we used 4 conventional SpO2 probes coupled to Philips MP2 patient monitors: a Philips finger sensor, a Philips ear sensor (M1191B and M1194A, Philips Medizin-Systeme, Böblingen, Germany), a Masimo finger sensor (LNCS DC-I, Masimo Corporation, Irvine, CA, USA), and a Nellcor finger sensor (DS-100A Medtronic, Dublin, Ireland). A sample-wise (1 Hz) median of all 4 probes was defined as the reference signal.
Protocol
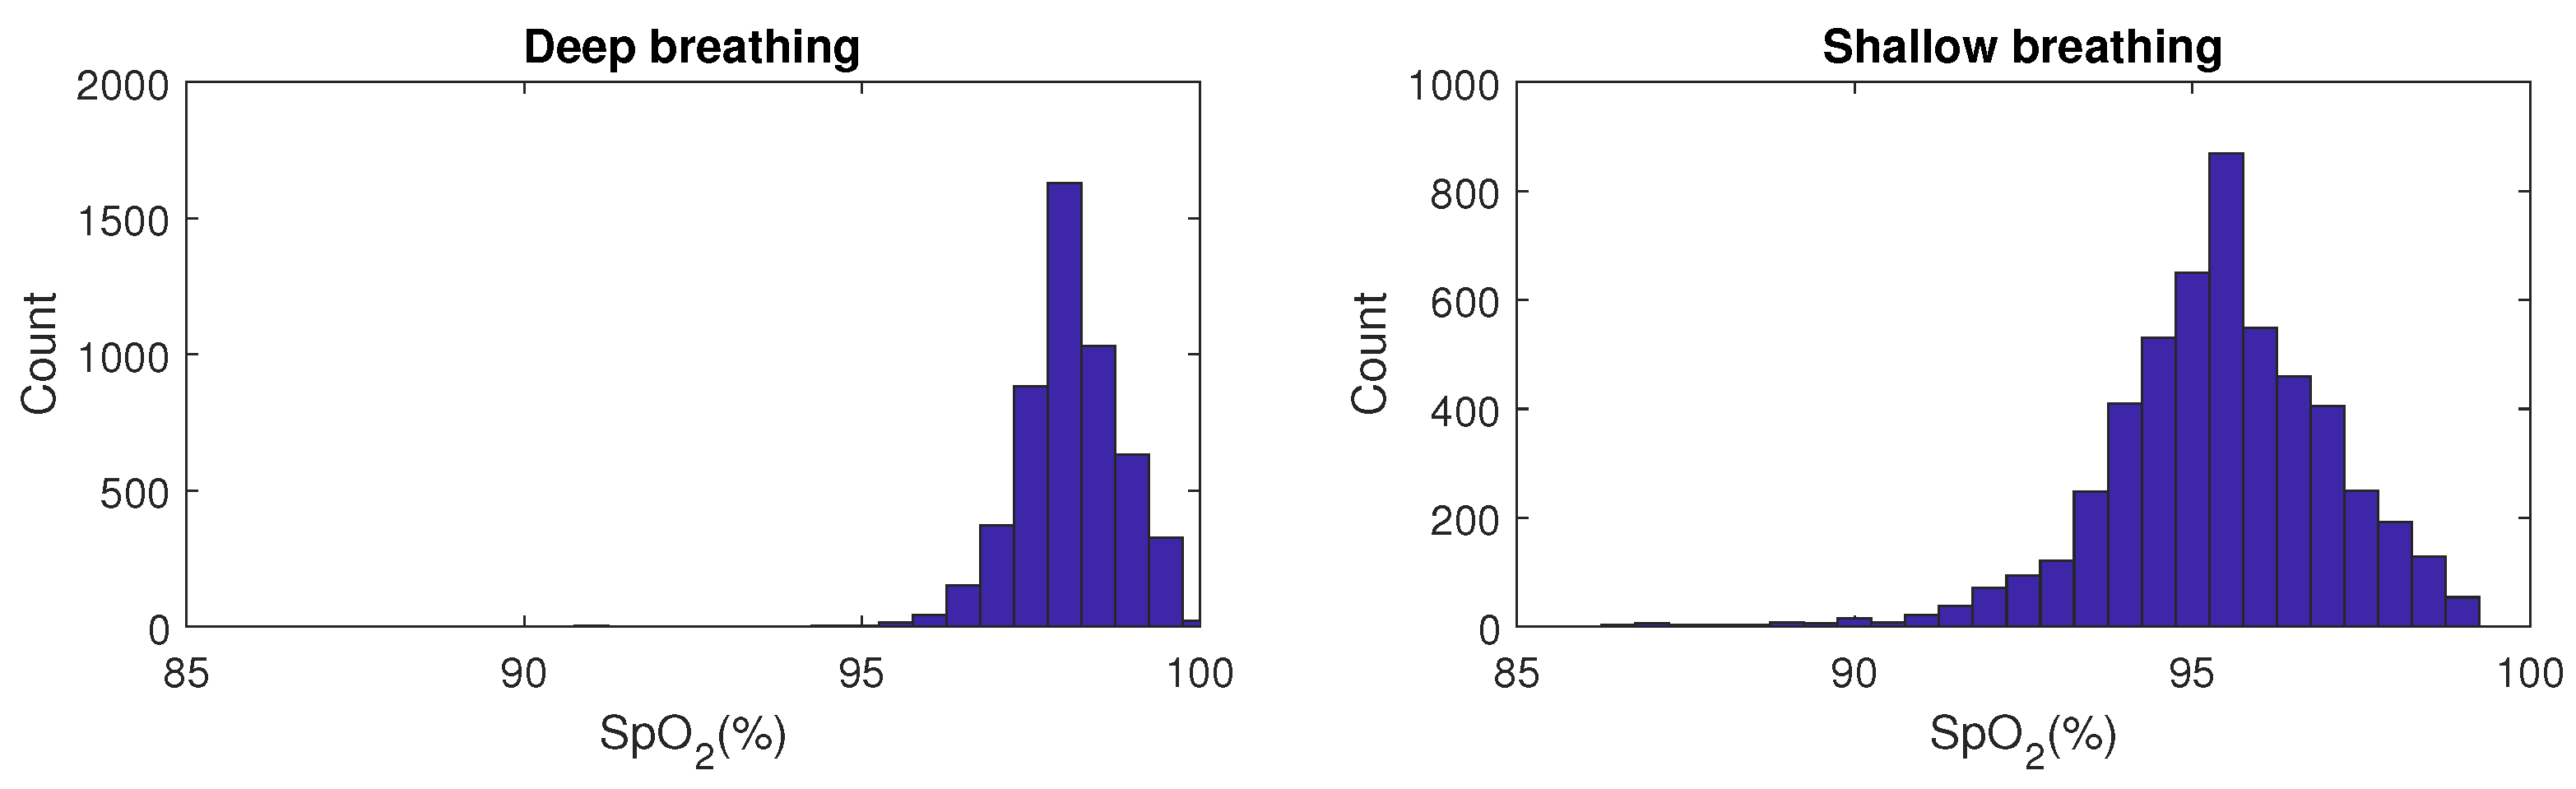
The dataset consists of 25 recordings of 7 min each on one subject. The subject was asked to sit on a chair in upright position at a distance of approximately 8 m from the cameras. The head was supported by a soft support on the left side of face to prevent involuntary ballistocardiographic movements, which could affect the calibration process. The recording of the reference data was started 20 s prior to, and was stopped 20 s after the video recordings to allow synchronization of the camera and contact data because of the processing and physiological delays. During the first 3.5 min of the recording, the subject was asked to breath deeply but calmly and non-guided, resulting in a close to maximum SpO2 value. In the following 3.5 min, the subject was asked to breathe more shallowly, which led to an average SpO2 reduction of 3% with short-term desaturations as low as 86%. The rationale to use this protocol is that it is easily repeatable and leads to quasi-stable SpO2 plateaus, in contrast to our earlier protocol with breath-hold events [8], leading to short dips in SpO2 which cannot be used for calibration. The histograms of the SpO2 values during both stages of the protocol are visualized in Figure 7.
Alignment Camera—Reference
In order to compute evaluation metrics, the SpO2 values from the camera and reference finger-probes needed to be aligned in time. The delay between both is a combination of nonlinear processing (reference values from black box algorithms with unknown (post-)processing and heuristics) and physiological delays (face versus finger). Therefore, we performed an individual synchronization of both data streams. First, the data from the finger-probes were resampled at the sampling rate of the camera. Hereafter, we subtracted the mean from both the camera and reference traces to be less susceptible to a possible bias, and determined the delay using cross-correlation resulting in s (mean ± SD) for the dataset.
2.2.4. Evaluation Metrics
To evaluate the performance of the camera-based SpO2 estimates, we computed the root-mean-square error (RMSE) and the bias (mean difference) metrics, which are calculated as:
where is the median of all four contact-probes to improve the reliability of the reference. The RMSE is used as metric in the ISO standard (80601-2-61, 2019) [21] for pulse-oximeters when compared to a reference obtained by arterial blood gas analysis (SaO2). The ISO standard requires an accuracy with an RMSE <4% in the range 70% to 100% SaO2.
3. Results
We computed the results for both the model-based calibration model of Section 2.2.1 and the calibration determined by the proposed data-driven, empirical approach. To estimate the APBV signature vector sets for the two and three wavelength combinations, we used 5-fold cross validation, resulting in the calibration models:
Two wavelengths
Three wavelengths
The APBV vector for all four wavelengths was derived from the two 3-wavelength models of Equation (10), where the values for the 905 nm wavelength were calculated as the mean of the [675,800,905] nm and [760,800,905] nm calibration models.
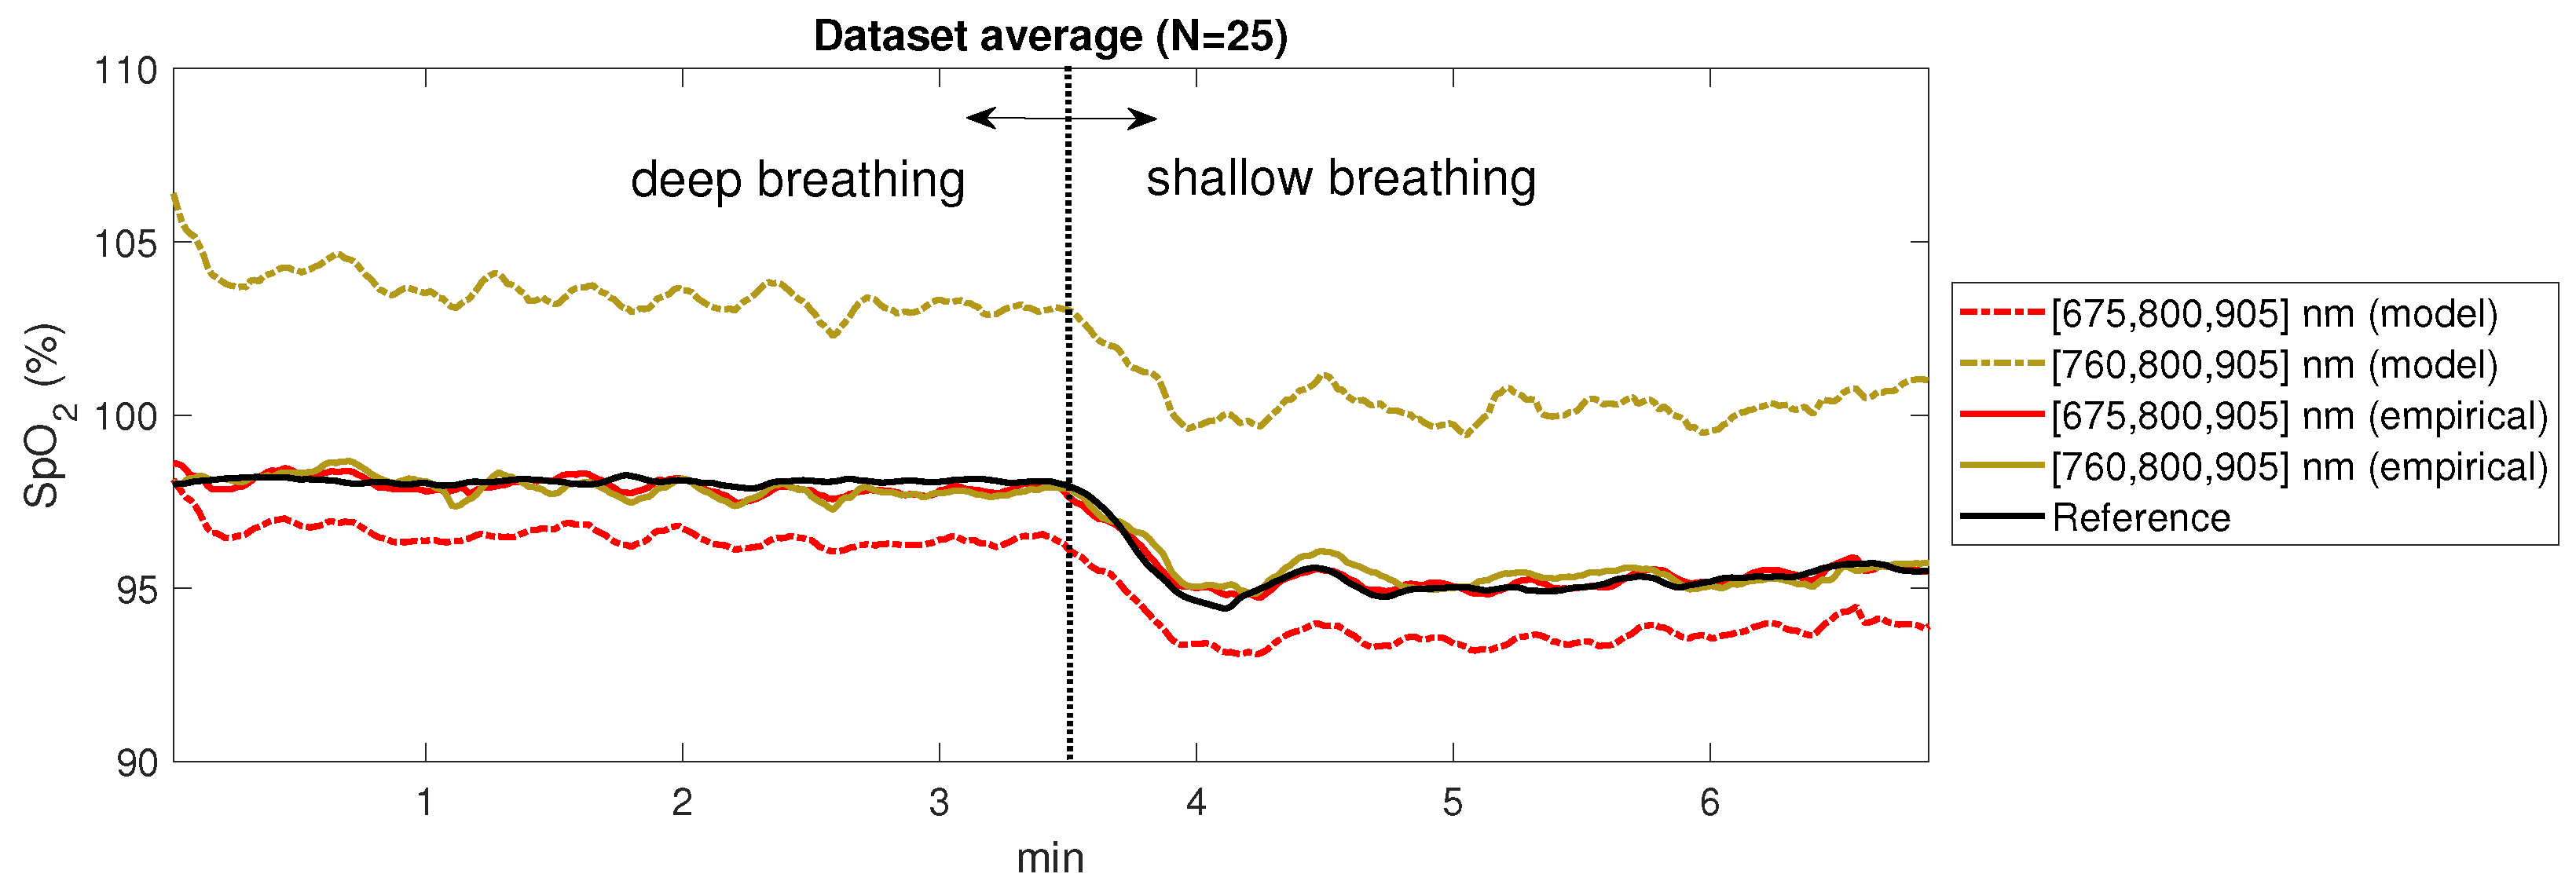
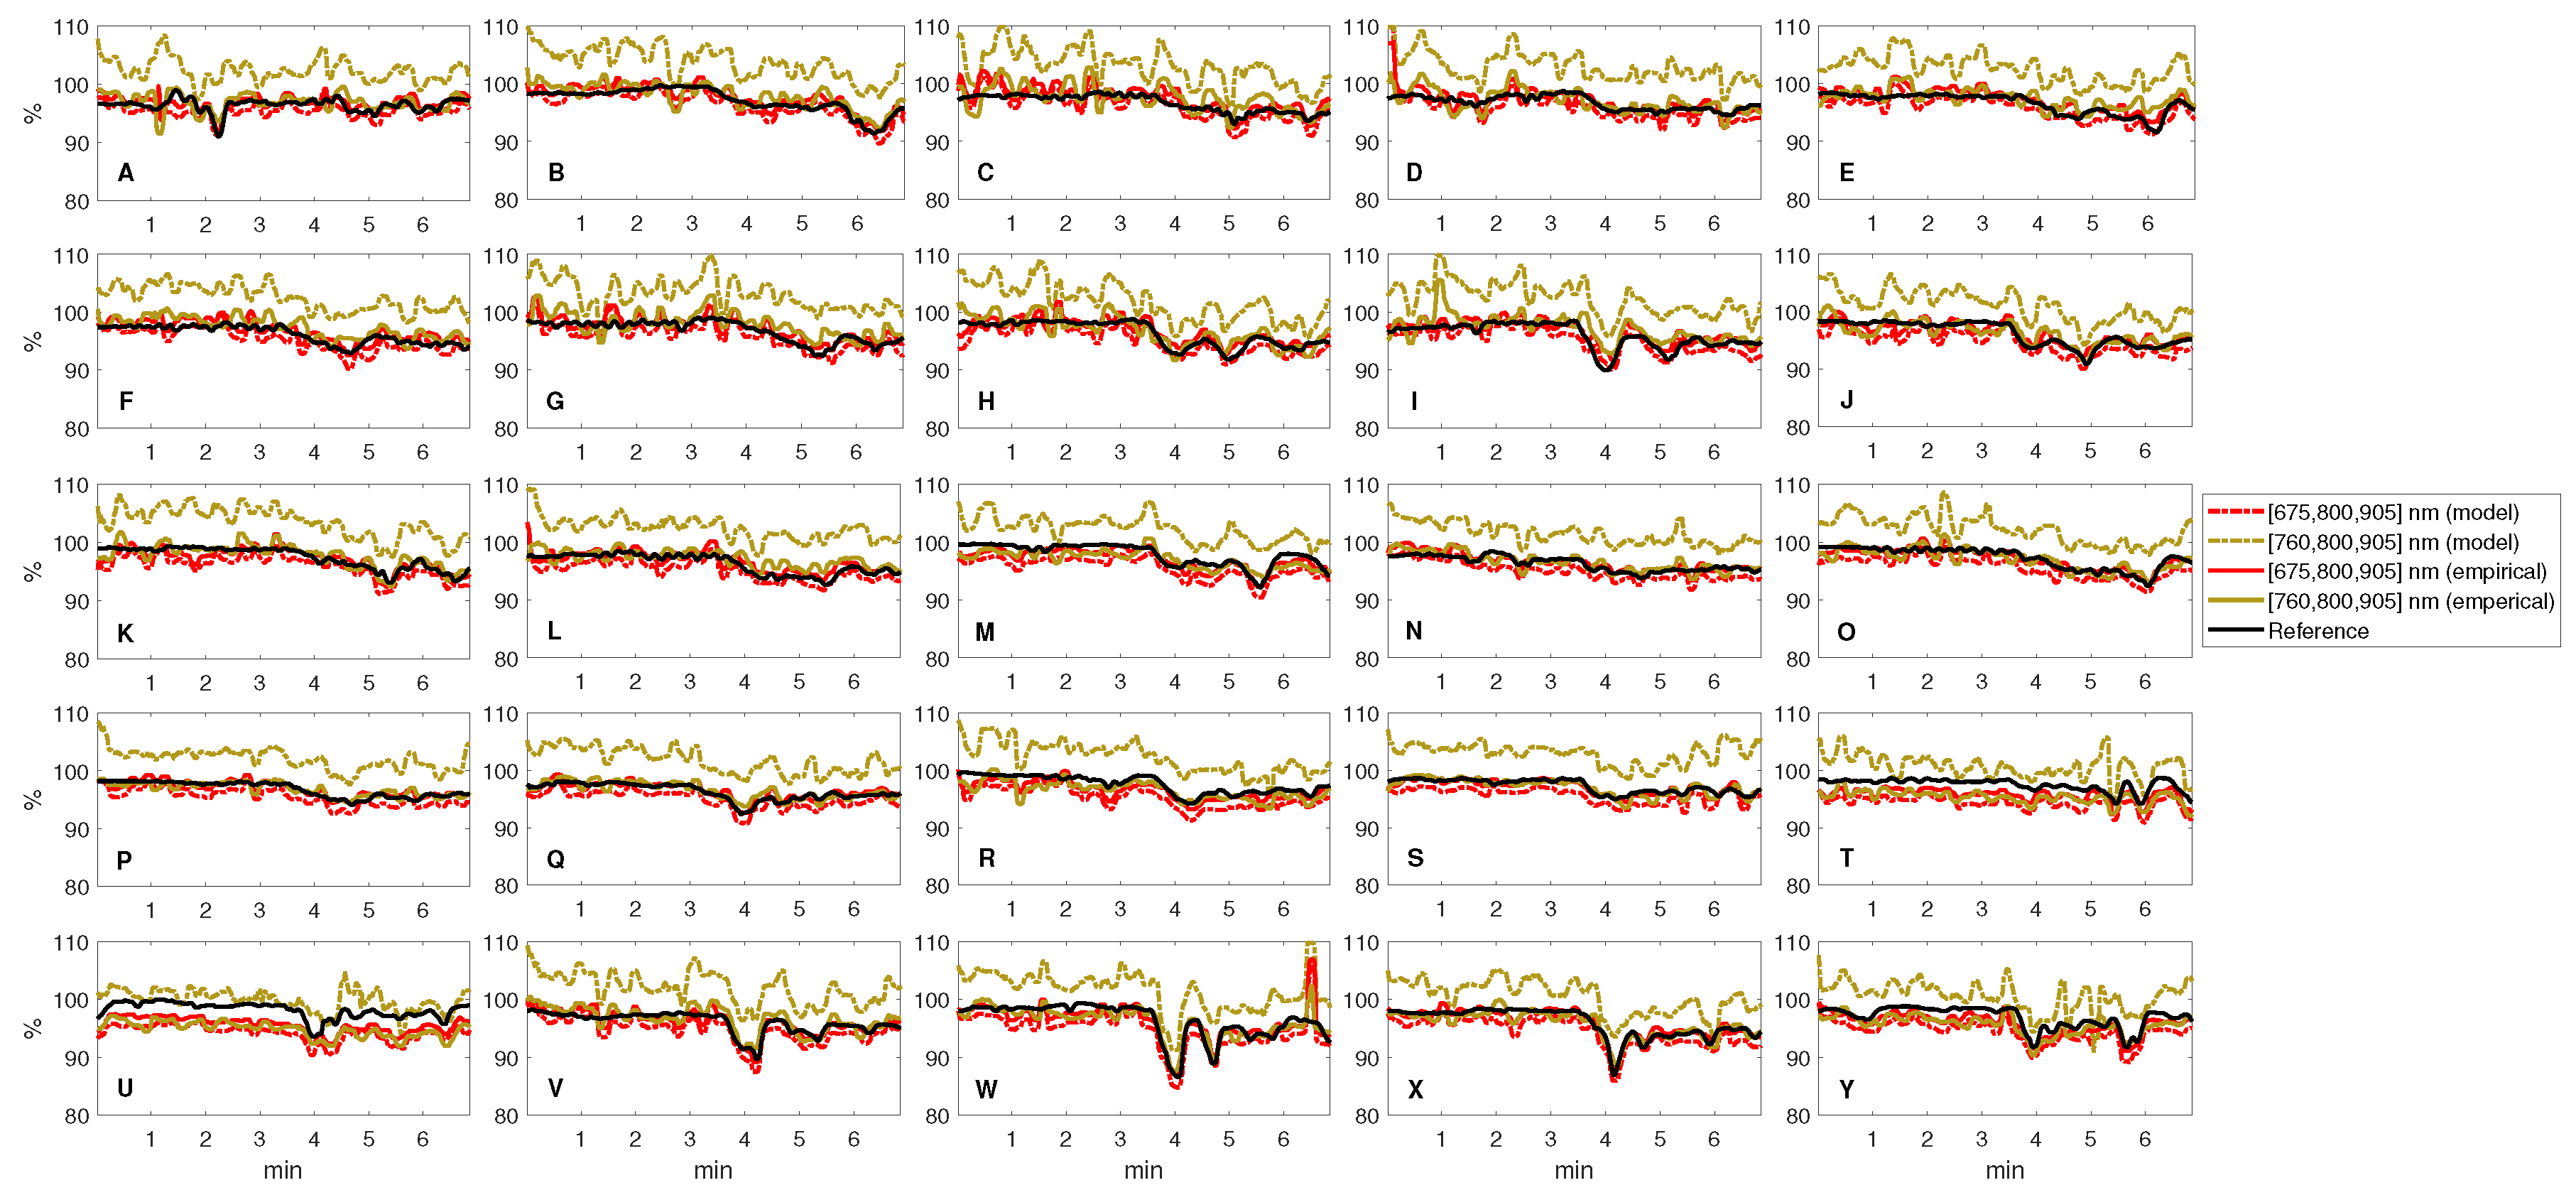
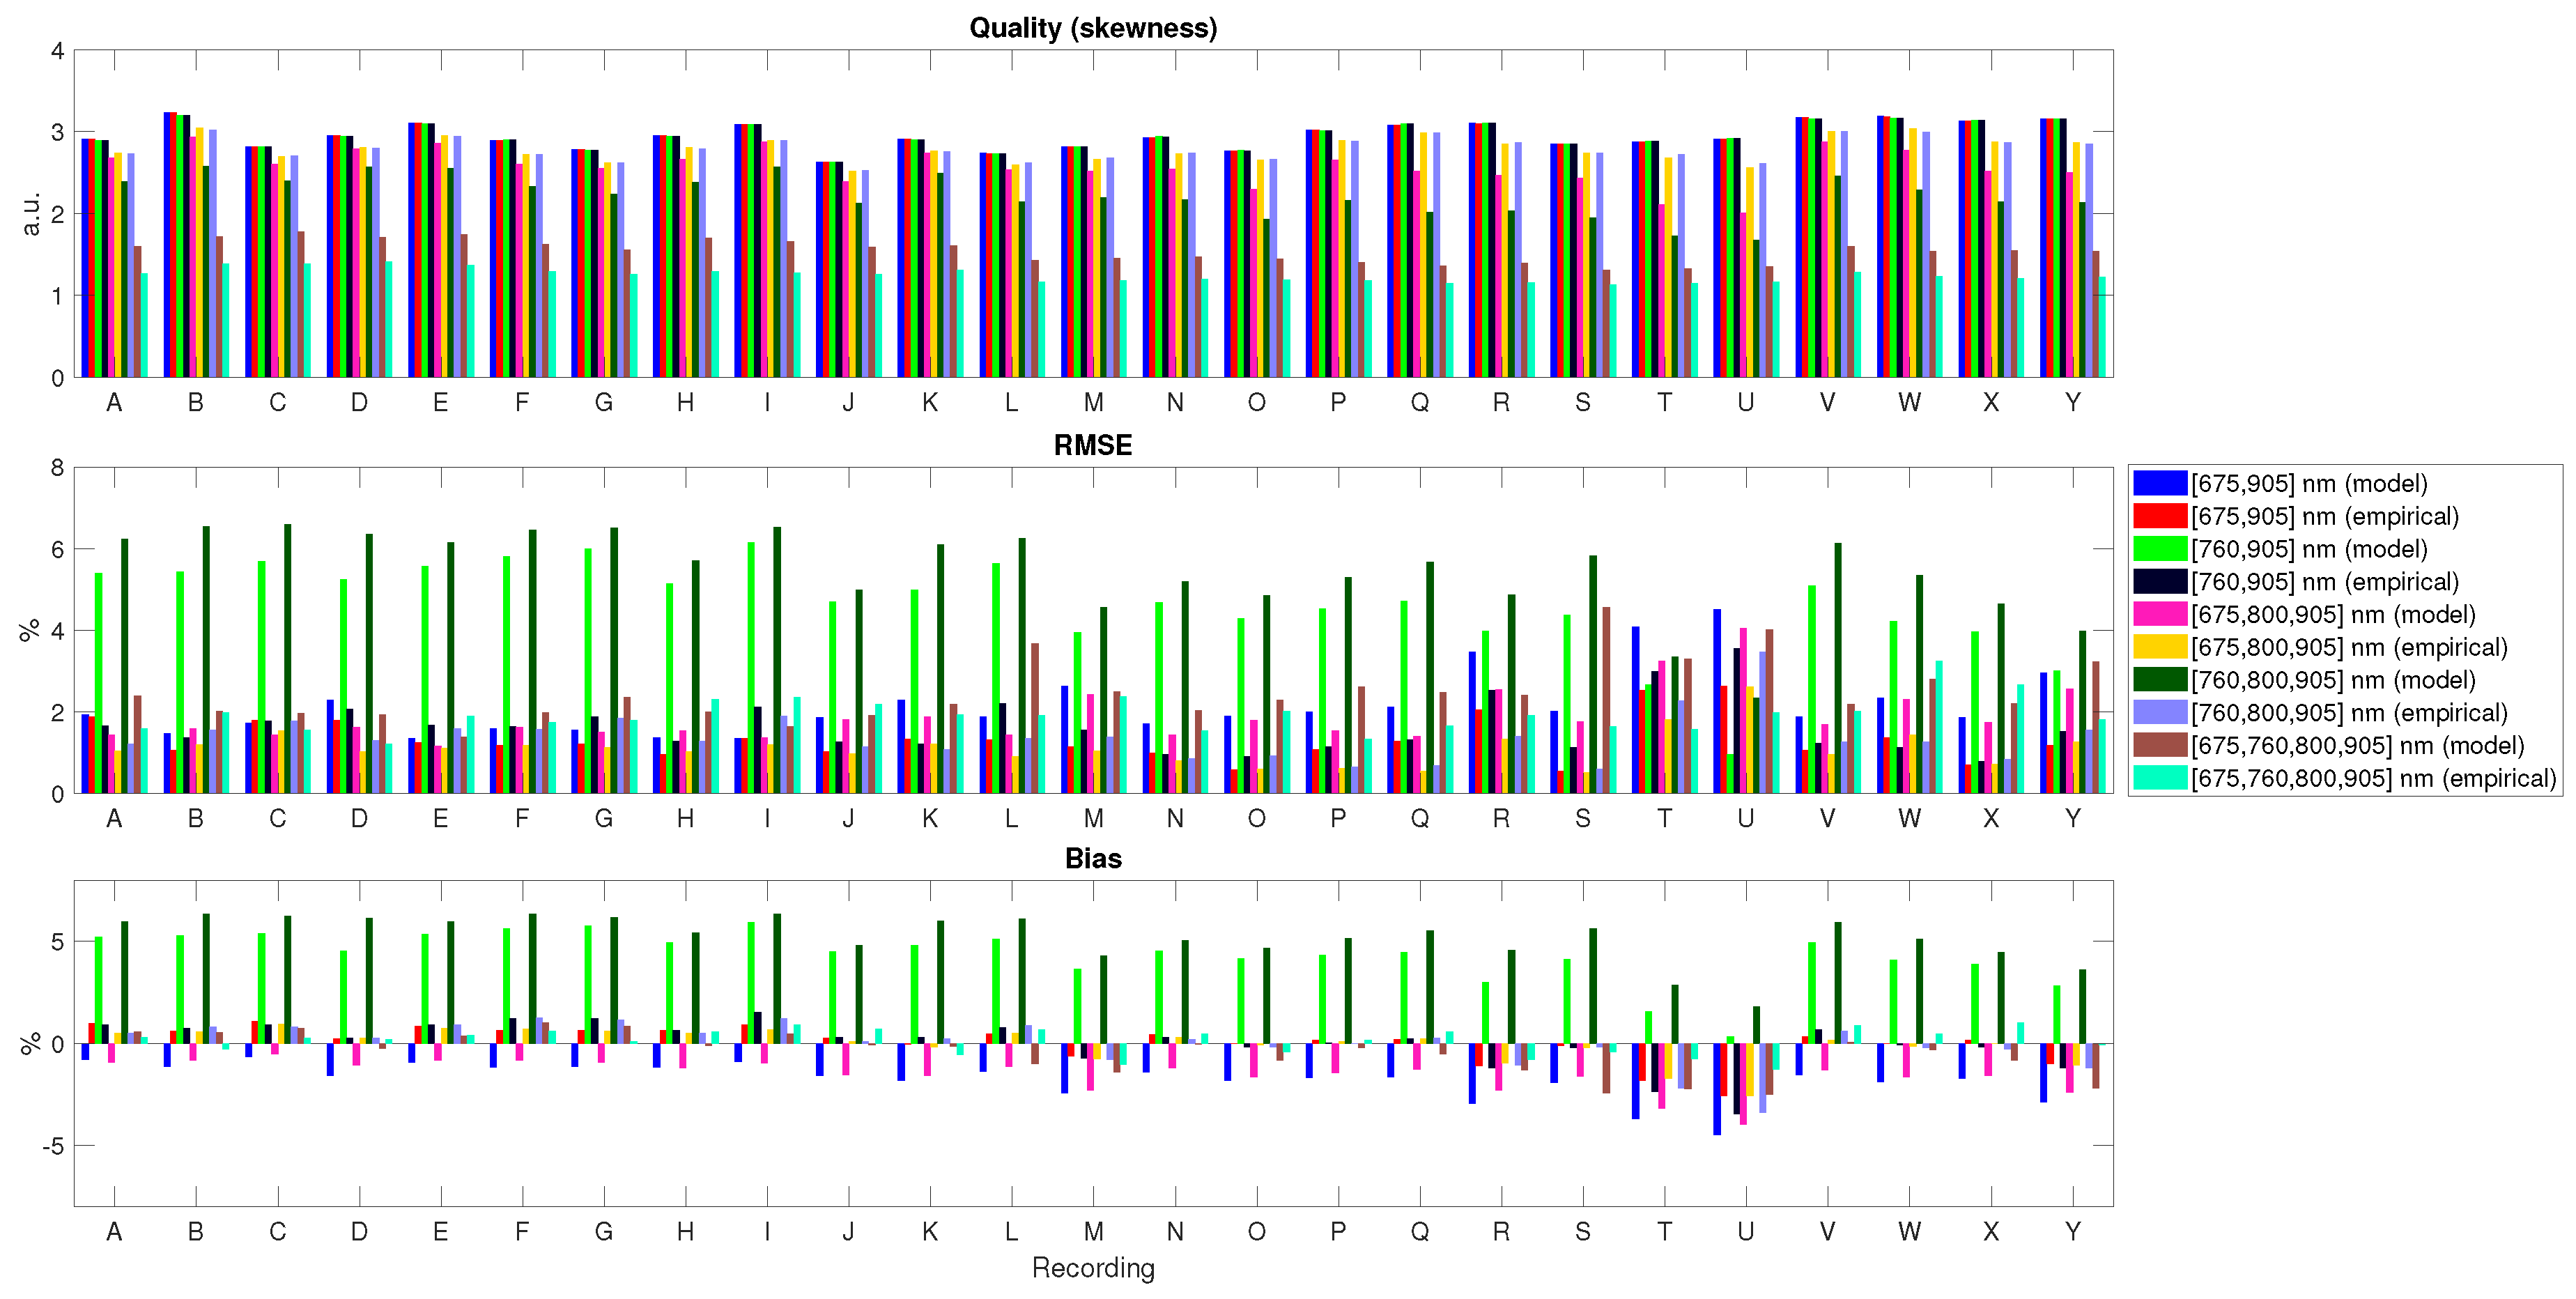
We computed the SpO2 values with processing windows of 10 s, a step size of 1 s and used a 10 s moving average filter as post-processing. To prevent clipping which biases the results, we sampled pulse signature vectors within the SpO2 range 75–110%, with a sampling resolution of 0.1%. The overall results are displayed in Table 1. The average SpO2 traces of the dataset (n = 25) calculated with two three-wavelength combinations for both the model-based and the empirical calibration model are visualized in Figure 8. A visualization of the SpO2 traces for all recordings is displayed in Figure 9. It can be observed that, although the same breathing protocol was used for all recordings, the dynamics are not identical. An overview of the evaluation metrics (pulse) quality, RMSE and bias for all recordings in the dataset using the model-based and empirically-derived calibration models is provided by Figure 10.
4. Discussion
We evaluated the performance for different calibration models and for different (number of) wavelengths. In the next paragraphs, we discuss these results, together with our suggestions for future work.
4.1. Model-Based versus Empirical Calibration
The results presented in the previous section indicate that a calibration determined by opto-physiological modeling provides a reasonable estimate for a subset of the evaluated wavelength combinations. Especially for the evaluated wavelength combinations with 760 nm, the miscalibration leads to an RMSE of >4%. The calibration model determined by the proposed data-driven approach yields a much smaller RMSE of <2%, well within the required accuracy of the ISO standard [21]. The results indicate that the calibration model determined by modeling could be used as a starting point for the empirical approach. This would allow narrowing of the search range for the various wavelengths, which could greatly reduce the number of computations.
4.2. Red-NIR versus Full NIR
Most dual-wavelength pulse-oximeters are equipped with a red, typically 660 nm, and a NIR LED in the range 900–940 nm. These wavelengths are selected based on the SpO2 contrast, i.e., the absorption difference between Hb and HbO2, and the low absorbance of water and other species in blood and tissue. The illumination is shielded from the environment in transmissive and reflective pulse-oximeters. For camera-based pulse-oximetry this is not the case, which has consequences for applications where visible light is not tolerated, e.g., for sleep monitoring. Using solely wavelengths in near-infrared (NIR) which are (almost) invisible to the human eye, the SpO2 contrast reduces by a factor of 2 as can be observed from the estimated update vectors . A decreased SpO2 contrast will increase the noise of the measurement. However, the strength of the PPG signal is also larger in full NIR, which could positively impact the performance because of the very small signals of the camera which are up to 100 times smaller than those of conventional contact probes [9]. In order to investigate how both factors should be balanced, we evaluated the performance for both red-NIR and full NIR wavelengths.
The comparative results show that red-NIR yields a slightly better performance than the full-NIR wavelength combinations. Both, however, satisfy the ISO standard of an RMSE <4%, which is very important as it greatly widens the scope of possible applications for camera-based pulse-oximetry, e.g., for the detection of sleep apnea. It should, however, be noted that the genericity of this observation should be verified on a population, rather than one subject. These results confirm our earlier observations [8], although with slightly different wavelengths in NIR.
4.3. Two versus Three Wavelengths
As explained earlier, the rationale to use three instead of the common two wavelengths is that a higher-dimensional (pseudo)-color space allows projections that are orthogonal to more independent distortions, e.g., caused by subject-motions or illumination changes [8]. The number of calibration parameters, however, increases which could affect the performance when not set correctly. The results show that performance with three wavelengths is slightly better, even when the subject is static. Figure 10 shows that a miscalibration does not affect pulse quality, but only the SpO2 error when using two wavelengths. For three wavelengths, both the pulse quality and the SpO2 error are affected. This can be explained by the ‘flat’ optimum when using >2 wavelengths. With two wavelengths, there always exists an optimum because of the one-dimensional space. With >2 wavelengths, a miscalibration leads to ‘squeezing’ of the signature vectors, which could result in a combination of a bias and an increased RMSE.
4.4. Future Work
This study showed the importance and ease of empirical, data-driven calibration. We recognize that our study also has limitations. Firstly, the current implementation guarantees accuracy, i.e., finding the global optimum, but is computationally expensive. As the number of calculations scales exponentially with the number of wavelengths, optimization of the processing time may become relevant if one would like to explore the use of APBV with more than three wavelengths. This can be achieved by narrowing the search range for each wavelength, using dedicated processing hardware and/or using computationally efficient search strategies.
We demonstrated the importance of empirical calibration for one subject with an average SpO2 of about 3%, and with SpO2 values in the range 86–100%. We regard the results as proof-of-concept and do not claim that the estimated calibration models for our setup yield the best results for a population. This requires a calibration dataset with subjects with different skin-types and SpO2 values over a larger range, which is difficult to realize with the current breathing protocol. Re-use of our previous calibration dataset was not possible as data was recorded with only two wavelengths [9]. Based on our earlier findings [9], RMSE <1.65% (n = 26), we have no reason to assume that the calibration is highly subject-dependent.
5. Conclusions
An empirical, data-driven approach for the determination of a calibration model with an arbitrary number and selection of wavelengths for camera-based SpO2 estimation was proposed and tested. An exhaustive search yields the SpO2-dependent signature vectors corresponding to the relative amplitudes in the different wavelengths. Based on this collection of signature vectors, a calibration model is estimated for the indirect APBV method. We performed 5-fold cross validation on recordings with relatively small variations in oxygen saturation and optimized for pulse signal quality. Results show that, with this approach, the performance improves when compared to a calibration model based on opto-physiological modeling, with an average RMSE reduction of 1.84%. Furthermore, we showed that the error only slightly increases, 0.29%, using solely near-infrared (NIR) wavelengths when compared to a combination of visible red and NIR wavelengths, typically used in pulse-oximeters. This observation has important implications for the number of possible applications of camera pulse-oximetry, e.g., for sleep or continuous 24/7 monitoring. This scalable approach is not only helpful to fine-tune the calibration model, but even allows computation of the calibration model parameters from scratch without prior knowledge of the data acquisition details, i.e., the properties of camera and illumination.
Author Contributions
Conceptualization, M.v.G. and G.d.H.; software, M.v.G.; validation, M.v.G.; formal analysis, M.v.G.; investigation, M.v.G. and G.d.H.; resources, M.v.G. and W.V.; data curation, M.v.G.; writing, original draft preparation, M.v.G.; writing, review and editing, M.v.G., W.V., and G.d.H.; visualization, M.v.G.
Funding
This research received no external funding.
Acknowledgments
The authors would like to thank their colleagues from Philips Research and the anonymous reviewers for their valuable feedback on the manuscript.
Conflicts of Interest
The authors declare no conflict of interest.
Abbreviations
The following abbreviations are used in this manuscript:
| APBV | Adaptive PBV (blood volume pulse vector) |
| BPF | Bandpass filter |
| CWL | Center wavelength |
| LPF | Low pass filter |
| NIR | Near-infrared |
| RMSE | Root mean squared error |
| ROI | Region-of-interest |
| SNR | Signal-to-noise ratio |
References
- Ruangritnamchai, C.; Bunjapamai, W.; Pongpanich, B. Pulse oximetry screening for clinically unrecognized critical congenital heart disease in the newborns. Images Paediatr. Cardiol. 2007, 9, 10. [Google Scholar] [PubMed]
- Dumitrache-Rujinski, S.; Calcaianu, G.; Zaharia, D.; Toma, C.L.; Bogdan, M. The role of overnight pulse-oximetry in recognition of obstructive sleep apnea syndrome in morbidly obese and non obese patients. Maedica 2013, 8, 237. [Google Scholar] [PubMed]
- McDuff, D.; Gontarek, S.; Picard, R. Remote measurement of cognitive stress via heart rate variability. In Proceedings of the 2014 36th Annual International Conference of the IEEE Engineering in Medicine and Biology Society, Chicago, IL, USA, 26–30 August 2014; pp. 2957–2960. [Google Scholar]
- Tarassenko, L.; Villarroel, M.; Guazzi, A.; Jorge, J.; Clifton, D.; Pugh, C. Non-contact video-based vital sign monitoring using ambient light and auto-regressive models. Physiol. Meas. 2014, 35, 807. [Google Scholar] [CrossRef] [PubMed]
- Van Gastel, M.; Stuijk, S.; de Haan, G. Robust respiration detection from remote photoplethysmography. Biomed. Opt. Express 2016, 7, 4941–4957. [Google Scholar] [CrossRef] [PubMed] [Green Version]
- Wieringa, F.P.; Mastik, F.; van der Steen, A.F. Contactless multiple wavelength photoplethysmographic imaging: A first step toward “SpO 2 camera” technology. Ann. Biomed. Eng. 2005, 33, 1034–1041. [Google Scholar] [CrossRef] [PubMed]
- Kong, L.; Zhao, Y.; Dong, L.; Jian, Y.; Jin, X.; Li, B.; Feng, Y.; Liu, M.; Liu, X.; Wu, H. Non-contact detection of oxygen saturation based on visible light imaging device using ambient light. Opt. Express 2013, 21, 17464–17471. [Google Scholar] [CrossRef] [PubMed]
- Van Gastel, M.; Stuijk, S.; de Haan, G. New principle for measuring arterial blood oxygenation, enabling motion-robust remote monitoring. Sci. Rep. 2016, 6, 38609. [Google Scholar] [CrossRef] [PubMed] [Green Version]
- Verkruysse, W.; Bartula, M.; Bresch, E.; Rocque, M.; Meftah, M.; Kirenko, I. Calibration of contactless pulse oximetry. Anesth. Analg. 2017, 124, 136. [Google Scholar] [CrossRef] [PubMed]
- Van Gastel, M.; Stuijk, S.; de Haan, G. Camera-based pulse-oximetry-validated risks and opportunities from theoretical analysis. Biomed. Opt. Express 2018, 9, 102–119. [Google Scholar] [CrossRef] [PubMed]
- Aarts, L.A.; Jeanne, V.; Cleary, J.P.; Lieber, C.; Nelson, J.S.; Oetomo, S.B.; Verkruysse, W. Non-contact heart rate monitoring utilizing camera photoplethysmography in the neonatal intensive care unit—A pilot study. Early Hum. Dev. 2013, 89, 943–948. [Google Scholar] [CrossRef] [PubMed]
- Van Gastel, M.; Balmaekers, B.; Oetomo, S.B.; Verkruysse, W. Near-Continuous Non-Contact Cardiac Pulse Monitoring in a Neonatal Intensive Care Unit in Near Darkness. In Optical Diagnostics and Sensing XVIII: Toward Point-of-Care Diagnostics; International Society for Optics and Photonics: Bellingham, WA, USA, 2018; Volume 10501, p. 1050114. [Google Scholar]
- Mo, W.; Mohan, R.; Li, W.; Zhang, X.; Sellke, E.W.; Fan, W.; DiMaio, J.M.; Thatcher, J.E. The Importance of Illumination in a Non-Contact Photoplethysmography Imaging System for Burn Wound Assessment. In Photonic Therapeutics and Diagnostics XI; International Society for Optics and Photonics: Bellingham, WA, USA, 2015; Volume 9303, p. 93030M. [Google Scholar]
- Yu, M.C.; Wu, H.; Liou, J.L.; Lee, M.S.; Hung, Y.P. Multiparameter sleep monitoring using a depth camera. In Proceedings of the International Joint Conference on Biomedical Engineering Systems and Technologies, Vilamoura, Portugal, 1–4 February 2012; Springer: Berlin/Heidelberg, Germany, 2012; pp. 311–325. [Google Scholar]
- Vogels, T.; van Gastel, M.; Wang, W.; de Haan, G. Fully-automatic camera-based pulse-oximetry during sleep. In Proceedings of the IEEE Conference on Computer Vision and Pattern Recognition Workshops, Salt Lake City, UT, USA, 18–22 June 2018; pp. 1349–1357. [Google Scholar]
- Van Gastel, M. Remote Photoplethysmography in Infrared—Towards Contactless Sleep Monitoring. Ph.D. Thesis, Eindhoven University of Technology, Eindhoven, The Netherlands, 2018. [Google Scholar]
- De Haan, G.; van Leest, A. Improved motion robustness of remote-PPG by using the blood volume pulse signature. Physiol. Meas. 2014, 35, 1913. [Google Scholar] [CrossRef] [PubMed]
- Verkruysse, W.; Lucassen, G.W.; de Boer, J.F.; Smithies, D.J.; Nelson, J.S.; van Gemert, M.J. Modelling light distributions of homogeneous versus discrete absorbers in light irradiated turbid media. Phys. Med. Biol. 1997, 42, 51. [Google Scholar] [CrossRef] [PubMed]
- Svaasand, L.O.; Norvang, L.; Fiskerstrand, E.; Stopps, E.; Berns, M.; Nelson, J. Tissue parameters determining the visual appearance of normal skin and port-wine stains. Lasers Med. Sci. 1995, 10, 55–65. [Google Scholar] [CrossRef] [Green Version]
- Zijlstra, W.; Buursma, A. Spectrophotometry of hemoglobin: Absorption spectra of bovine oxyhemoglobin, deoxyhemoglobin, carboxyhemoglobin, and methemoglobin. Comp. Biochem. Physiol. Part Biochem. Mol. Biol. 1997, 118, 743–749. [Google Scholar] [CrossRef]
- International Organization for Standardization. Medical Electrical Equipment—Part 2-61: Particular Requirements for Basic Safety and Essential Performance of Pulse Oximeter Equipment; International Organization for Standardization: Geneva, Switzerland, 2018. [Google Scholar]
Figure 1.
The modeled relative PPG spectrum using the analytic approach by Svaasand et al. [19] for four SpO2 values.
Figure 1.
The modeled relative PPG spectrum using the analytic approach by Svaasand et al. [19] for four SpO2 values.

Figure 2.
The general framework of our empirical calibration approach can be described by three steps: (1) extracting the raw PPG signals from the videos, (2) executing an exhaustive search over a range of pulse signatures using pulse quality as optimization criterion, and (3) fitting of a calibration model to the data.

Figure 3.
A visualization of the exhaustive search for the wavelengths [675,800,905] nm shows that the optimum, pulse quality, shifts as function of SpO2 level. Here, and are the relative pulse amplitudes for 675 and 905 nm, respectively, and the amplitude for 800 nm is set to 1.
Figure 3.
A visualization of the exhaustive search for the wavelengths [675,800,905] nm shows that the optimum, pulse quality, shifts as function of SpO2 level. Here, and are the relative pulse amplitudes for 675 and 905 nm, respectively, and the amplitude for 800 nm is set to 1.

Figure 4.
First-order polynomials are fitted on the sorted pulse signatures (by the amplitude of the wavelength with the largest SpO2 contrast, from high to low SpO2) to estimate the relative SpO2 sensitivity using iteratively re-weighted least squares with a bisquare weighting function.
Figure 4.
First-order polynomials are fitted on the sorted pulse signatures (by the amplitude of the wavelength with the largest SpO2 contrast, from high to low SpO2) to estimate the relative SpO2 sensitivity using iteratively re-weighted least squares with a bisquare weighting function.

Figure 5.
The APBV calibration model is derived from and by incorporating reference values. The update vector is determined by scaling with the SpO2 of the reference. Hereafter, is calculated by linear regression using and .
Figure 5.
The APBV calibration model is derived from and by incorporating reference values. The update vector is determined by scaling with the SpO2 of the reference. Hereafter, is calculated by linear regression using and .

Figure 6.
The experimental setup comprises two armatures with incandescent light bulbs (blue) and four identical monochrome cameras (red) equipped with different optical filters (black) to obtain spectral selectivity. This information is used to calculate the values for the pulse signature vector (Equation (4)).

Figure 7.
The breathing protocol used for the creation of our dataset, 3.5 min deep breathing followed by 3.5 min shallow breathing, leads to an average SpO2 reduction of 3% with short-term desaturations as low as 86%.
Figure 7.
The breathing protocol used for the creation of our dataset, 3.5 min deep breathing followed by 3.5 min shallow breathing, leads to an average SpO2 reduction of 3% with short-term desaturations as low as 86%.

Figure 8.
The average SpO2 traces for the dataset (n = 25) using the two evaluated three-wavelengths combinations, where the SpO2 induced by the breathing protocol can be clearly observed.
Figure 8.
The average SpO2 traces for the dataset (n = 25) using the two evaluated three-wavelengths combinations, where the SpO2 induced by the breathing protocol can be clearly observed.

Figure 9.
An overview of the SpO2 traces from all the recordings in the dataset (n = 25) shows the necessity of the proposed empirical calibration approach.
Figure 9.
An overview of the SpO2 traces from all the recordings in the dataset (n = 25) shows the necessity of the proposed empirical calibration approach.

Figure 10.
An overview of the evaluation metrics (pulse) quality, root-mean-square error (RMSE) and bias for all recordings in dataset using the model-based and empirically-derived calibration models. The results are calculated for two dual-wavelength and three-wavelengths combinations, and the derived four-wavelengths model.


Table 1.
The overall results for the model-based and empirical, data-driven APBV calibration model.
| Evaluated Wavelengths | RMSE (%) | Bias (%) | ||
|---|---|---|---|---|
| Model | Empirical | Model | Empirical | |
| [675,905] nm | 2.16 | 1.33 | −1.77 | 0.06 |
| [760,905] nm | 4.64 | 1.63 | 4.34 | 0.06 |
| [675,800,905] nm | 1.87 | 1.11 | −1.53 | −0.03 |
| [760,800,905] nm | 5.46 | 1.39 | 5.22 | 0.01 |
| [675,760,800,905] nm | 2.48 | 1.93 | −0.47 | 0.11 |
© 2019 by the authors. Licensee MDPI, Basel, Switzerland. This article is an open access article distributed under the terms and conditions of the Creative Commons Attribution (CC BY) license (http://creativecommons.org/licenses/by/4.0/).
Share and Cite
MDPI and ACS Style
van Gastel, M.; Verkruysse, W.; de Haan, G. Data-Driven Calibration Estimation for Robust Remote Pulse-Oximetry. Appl. Sci. 2019, 9, 3857. https://doi.org/10.3390/app9183857
AMA Style
van Gastel M, Verkruysse W, de Haan G. Data-Driven Calibration Estimation for Robust Remote Pulse-Oximetry. Applied Sciences. 2019; 9(18):3857. https://doi.org/10.3390/app9183857
Chicago/Turabian Stylevan Gastel, Mark, Wim Verkruysse, and Gerard de Haan. 2019. "Data-Driven Calibration Estimation for Robust Remote Pulse-Oximetry" Applied Sciences 9, no. 18: 3857. https://doi.org/10.3390/app9183857
Note that from the first issue of 2016, this journal uses article numbers instead of page numbers. See further details here.