Evidence of a Diurnal Cycle in Precipitation over the Southern Ocean as Observed at Macquarie Island


1
School of Earth, Atmosphere and Environment, Monash University, Melbourne 3800, Australia
2
School of Earth Sciences, The University of Melbourne, Melbourne 3053, Australia
3
Australian Research Council Centre of Excellence for Climate Extremes, Australia
*
Author to whom correspondence should be addressed.
Atmosphere 2020, 11(2), 181; https://doi.org/10.3390/atmos11020181
Submission received: 19 January 2020
/
Revised: 4 February 2020
/
Accepted: 5 February 2020
/
Published: 9 February 2020
(This article belongs to the Special Issue Observations and Simulations of Clouds, Aerosols, Precipitation, and Radiation over the Southern Ocean)
Abstract
:Due to a lack of observations, relatively large discrepancies exist between precipitation products over the Southern Ocean. In this manuscript, surface hourly precipitation observations from Macquarie Island (54.62 S, 158.85 E) are analysed (1998–2016) to reveal a diurnal cycle. The precipitation rate is at a maximum during night/early morning and a minimum in the afternoon at Macquarie Island station. Seasonally, the diurnal cycle is strongest in summer and negligible over winter. Such a cycle is consistent with precipitation arising from marine boundary layer clouds, suggesting that such clouds are making a substantial contribution to total precipitation over Macquarie Island and the Southern Ocean. Using twice daily upper air soundings (1995–2011), lower troposphere stability parameters show a stronger inversion at night, again consistent with precipitation arising from marine boundary layer clouds. The ERA-Interim precipitation is dominated by a 12 hourly cycle, year around, which is likely to be a consequence of the twice-daily initialisation. The implication of a diurnal cycle in boundary layer clouds over the Southern Ocean to derived A-Train satellite precipitation products is also discussed.
1. Introduction
Zonally averaged, the Southern Ocean (SO) has the greatest fractional cloud cover, e.g., [1], and frequency of precipitation on Earth [2,3]. These clouds are a fundamental component of the regional energy budget, which is known to have large biases in reanalysis products and climate simulations, e.g., [4]. The precipitation, correspondingly, is a major component of the water budget over the SO and has large uncertainties [2,3]. The precipitation uncertainty over the SO can be broken into frequency, intensity, e.g., [5,6], and location relative to synoptic conditions, e.g., [7]. The work in [8] coupled the daily Global Precipitation Climatology Project (GPCP) [9] precipitation product with a climatology of fronts [10] to conclude that 70-90% of the precipitation across the SO was associated with frontal passages. The work in [6] employed precipitation records from Macquarie Island to estimate that only ∼60% of the precipitation was associated with frontal passages. Presumably, the remaining precipitation comes from the shallow boundary layer clouds commonly found between fronts [11].
Shallow maritime atmospheric boundary layer (MABL) clouds have been studied extensively across the globe, e.g., [12], given their fundamental importance in the Earth’s energy and water budgets. Some of the earliest studies identified a strong diurnal cycle, e.g., [13,14] whereby the clouds were commonly thin throughout the daytime when incoming solar radiation warms the cloud deck, and the MABL may even decouple. At night, in the absence of solar forcing, the boundary layer can once again become well mixed, and the cloud deck commonly thickens with the renewed access to moisture from the ocean surface. While a diurnal cycle in marine boundary layer clouds has commonly been observed across the globe, e.g., [15,16], it has not been clearly identified over the SO, only above 51S, e.g., [17]. This is hardly surprising given the few suitable long-term observations across the region. A diurnal cycle in the precipitation over the SO would suggest that the entire MABL, including the clouds, may experience a diurnal cycle. Observations of the diurnal cycle would provide insight into the nature of precipitation (frequency, intensity, and distribution) and, potentially, the clouds that generate this precipitation (e.g., marine stratiform vs. frontal).
The presence of a diurnal cycle in precipitation would also confirm that products that employ the A-Train observations may be diurnally biased. Fundamental research over the past decade has identified that the fractional cloud cover, e.g., [1], cloud-top thermodynamic phase, e.g., [18,19,20], and cloud droplet number concentration [21] over the SO may be subject to some unappreciated diurnal cycle. Similarly, modelling studies that have used A-Train products for evaluation purposes, e.g., [22,23,24], may also have implicit biases. Many of these authors, e.g., [21], readily recognized this potential limitation.
Macquarie Island (54.62S, 158.85E; MAC) is an isolated island in the midst of the SO and provides one of a few long-term observation records of precipitation in this region. In recent years, these records have become quite valuable in our improving understanding of the atmospheric conditions and trends over the SO. The work in [25] examined the trends in the surface precipitation, highlighting a 35% increase in the annual MAC precipitation over the period from 1971 to 2008. The work in [6] found that relatively weak precipitation (<0.5 mm h) was dominant at Macquarie Island, occurring ∼30% of the time. Precipitation arrives predominantly from the west, southwest, and northwest with precipitation from the southwest commonly being drizzle. Heavy precipitation, which is more likely associated with cold fronts, contributes to more than 50% of the precipitation above 1.5 mm h. The work in [7] found that the precipitation intensity unrelated to cold fronts was underestimated in ERA-Interim reanalysis by 11%.
We employ long-term MAC precipitation observations to provide evidence of a diurnal cycle of the surface precipitation. Surface precipitation from the the Modern-Era Retrospective Analysis for Research and Applications and European Centre for Medium-Range Weather Forecasts (ECMWF) ERA-Interim reanalysis dataset is then compared with the observations to evaluate their representation of this diurnal cycle. Further, twice daily high-resolution upper air soundings are employed to examine the thermodynamic structure of the MABL and assess the potential relationships with the diurnal cycle of precipitation.
2. Macquarie Island Observations and ERA-Interim Dataset
2.1. MAC Precipitation
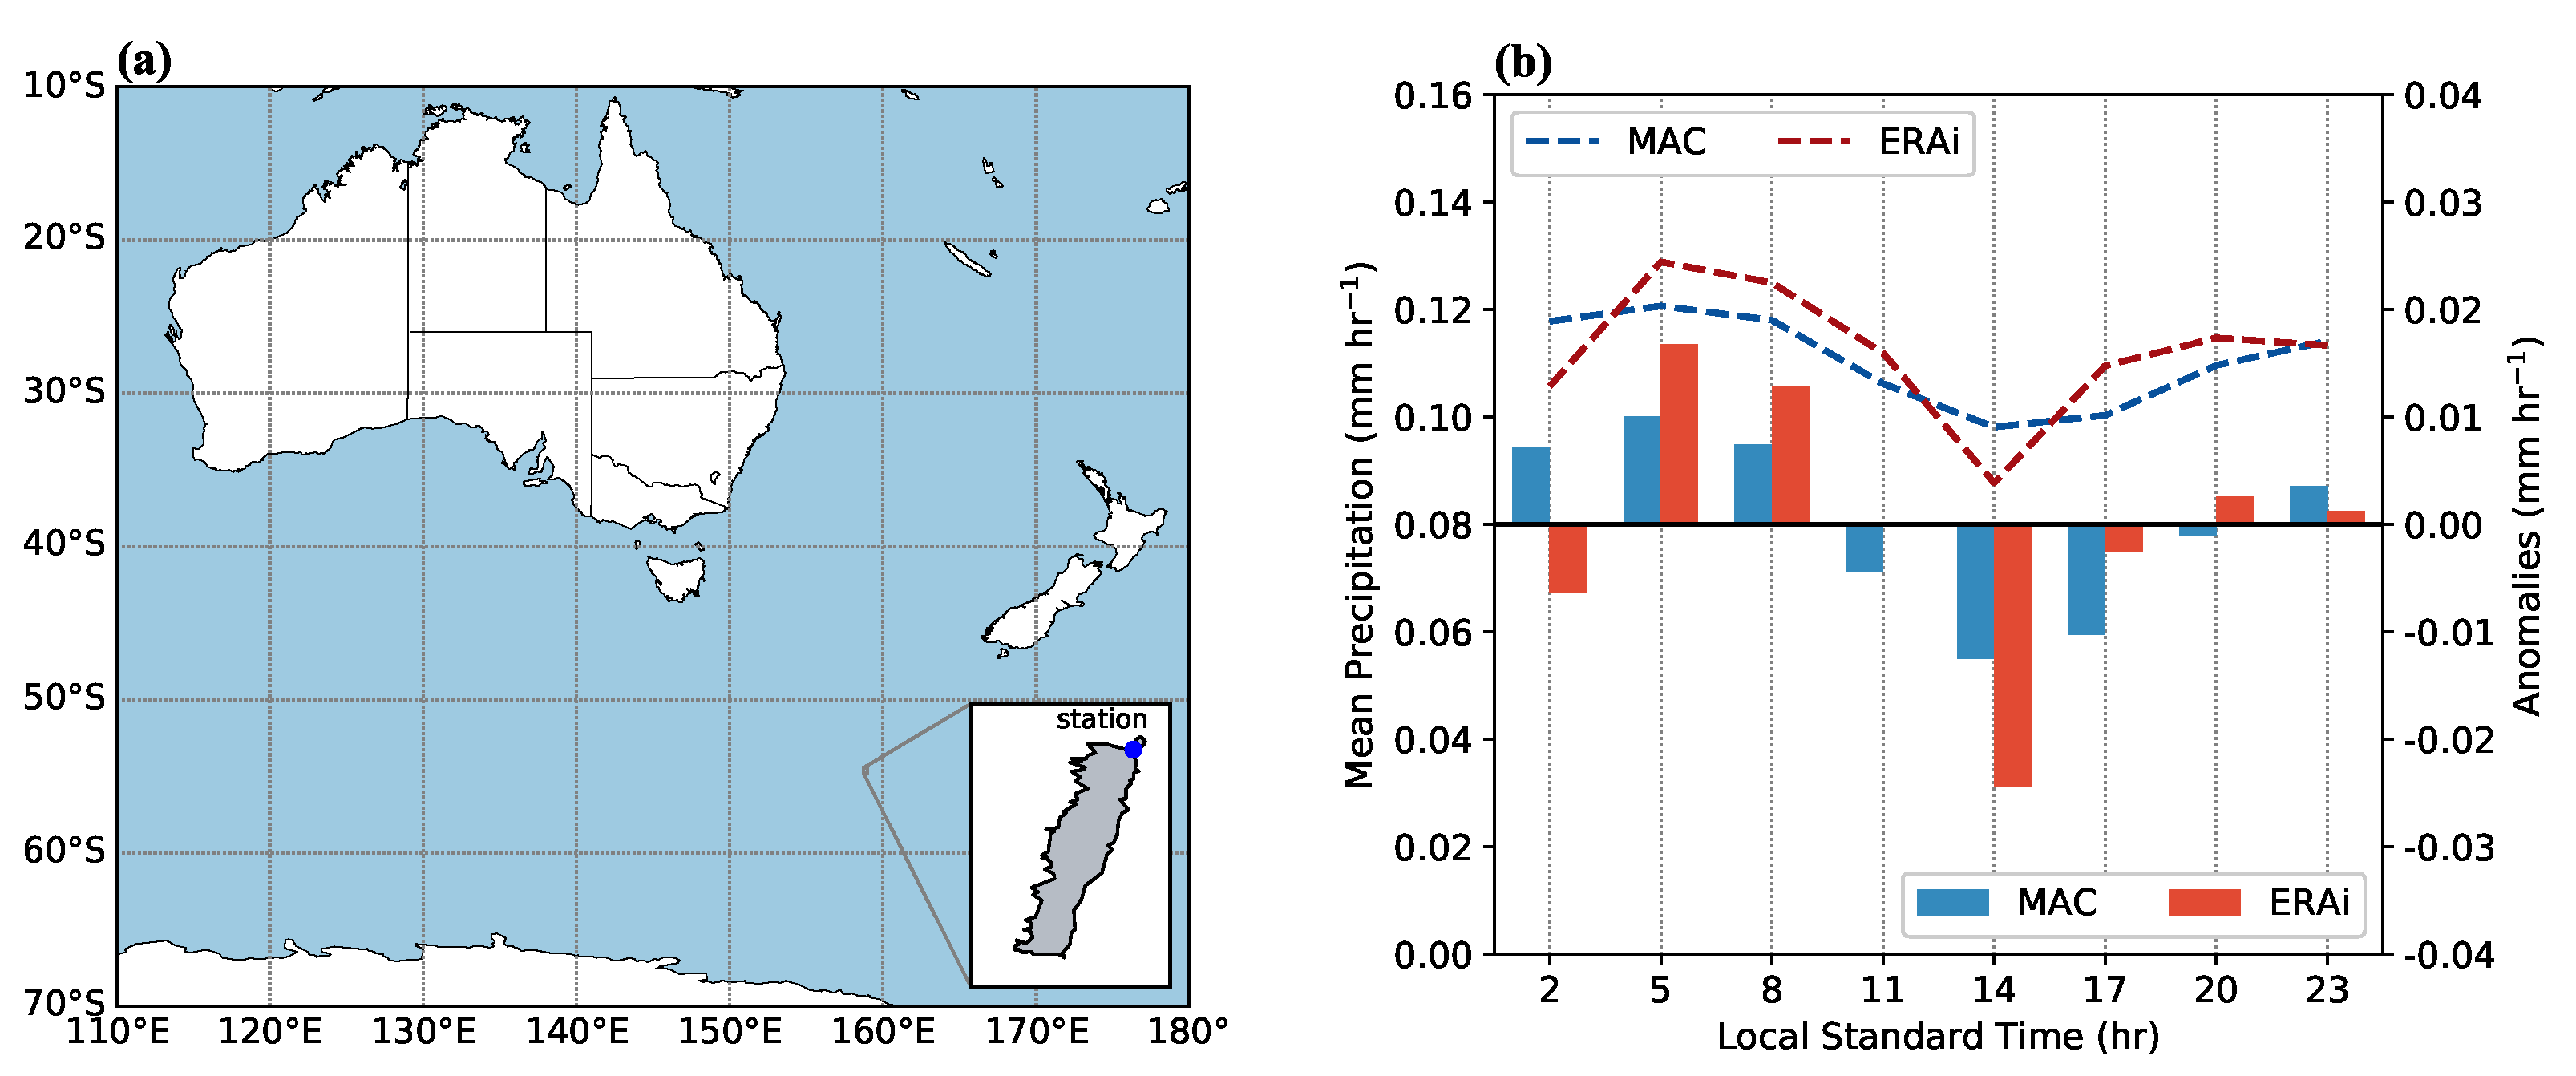
Macquarie Island is uniquely situated in the midst of the SO (54.62 S, 158.85 E), approximately half way between Australia and Antarctica. The island is about 34 km long and 5 km wide, primarily north-south-oriented with a peak elevation of 410 m located at the southern part of the island [26]. A meteorological station, located at the northern end of the island (Figure 1a), has been maintained by the Australian Antarctic Division and the Bureau of Meteorology since 1948. Standard surface hourly precipitation observations are available from 1998. The minimum detected precipitation is 0.2 mm for the hourly records, and values below this threshold are not measured. Our analysis period was from 1998–2016.
2.2. Upper Air Soundings
The upper air dataset utilized in this analysis covered the period from 1995 through to 2011. During this period, the upper air soundings were launched twice per day for 95% of all days, comprising 11,610 soundings in total. Consistent with [27], the high-resolution soundings were initially smoothed using a five-point running average to remove small scale variability. The smoothed profiles were then interpolated onto standard pressure levels (37 pressure levels) for a comparison with ERA-Interim. The five-point smoothing was found to have a minor impact relative to the interpolation on to the 37 pressure levels [7]. No smoothing or interpolation was required for the ERA-Interim profiles. Note that the MAC surface pressure may occasionally be below 1000 hPa; as such, the 1000 hPa standard pressure level within ERA-Interim was used only as a reference and where appropriate.
To analyze diurnal variations of the MABL, both the lower troposphere stability (LTS) [28] and the estimated inversion strength (EIS) [29] were examined. Following [28], the LTS is defined as the difference in potential temperature between 700 hPa and the surface (LTS ). The EIS is defined as:
where is the moist-adiabatic potential temperature gradient at 850 hPa; is the altitude of the 700 hPa level; and is the lifting condensation level, which was computed following [30]. For , we used the equation given in [29], which depended on surface and 700 hPa air temperatures and the saturation specific humidity at 850 hPa. The work in [29] introduced the EIS as a refined measure of boundary later stability, improving LTS by taking into account . Previous studies found a strong correlation between low-level cloud fraction and the LTS and EIS in various regions across the world, e.g., [31,32]. Even though both parameters were examined, only the EIS is presented because it was a more physically based quantity as it accounted for the influence of the accumulated static stability between the capping inversion and the 700 hPa level [29].
2.3. ERA-Interim Reanalysis
We also used the ERA-Interim forecast product for surface precipitation and the ERA-Interim analysis pressure levels for the profiles [33]. The ERA-Interim precipitation forecast is available at a 3 h temporal resolution, while variables at the pressure levels are available every 6 h. The spatial resolution was ∼0.75× 0.75 and represented a mean precipitation amount and/or a mean profile over a grid box. Forecasts were initialized twice a day at 0000 UTC and 1200 UTC, and the precipitation was accumulated from the beginning of each forecast. In the ERA-Interim forecast, precipitation was the sum of two components: “convective” and “large scale”, which were computed separately in the model. Convective precipitation originated solely from the parametrization of convection [34,35], while large scale precipitation originated from the prognostic parametrization of cloud [34,36]. These two parametrizations were linked by the detrainment of convective cloud, which was one source of condensate in the prognostic cloud scheme.
For comparison purposes with ERA-Interim, MAC observations were accumulated into 3 h intervals. Using typical surface wind speeds of 12-16 m s, a 3 h window of the observed surface precipitation spanned ∼140 km, which was on the same order of magnitude as ERA-Interim 0.75 [6,7]. Consistent with [6], we defined three categories for the precipitation records: “light” precipitation as 0.2 ≤ P < 0.5 mm h, “moderate” precipitation as 0.5 ≤ P < 1.5 mm h, and “heavy” precipitation as P ≥ 1.5 mm h. From 2003 to 2011, MAC light, moderate, and heavy precipitation were encountered 29.7, 7.7, and 1.1% of the time, respectively [6]. The magnitude of the diurnal cycle, or diurnal range, was simply defined as the maximum minus the minimum of the mean precipitation rate. The presence of a diurnal cycle was only considered to be robust when the magnitude was tested to be statistically significant at the 95% confidence level, via a Monte Carlo methodology with 10,000 random simulations.
3. Precipitation Analysis
3.1. Climatology
For the time period of 1998–2016, the average annual precipitation was 1140 mm year at MAC, and the overall probability of occurrence of 3 h surface precipitation was 34.6%. Using CloudSat observations, the work in [6] reported a similar overall probability of occurrence of 36.4% from 2003 to 2011. We note that the positive trend in precipitation [25] continued through this period with 2015 and 2016 being the wettest years on record (1278 and 1284 mm year, respectively).
3.2. Diurnal Cycle
Looking at the annual average, the diurnal cycle of surface precipitation over Macquarie Island (Figure 1b) exhibited a maximum during night and/or early morning with a peak of 0.121 mm h before sunrise at 0500 local standard time (LST) and a minimum at 1400 LST (0.098 mm h). The range of the diurnal cycle was 0.023 mm h, which was statistically significant at the 95% level. Figure 1b also shows the anomalies for both MAC observations and ERA-Interim. After sunset, the mean observed precipitation anomalies became positive and increased through the night until approximately sunrise. During the early morning, the situation changed, and the value decreased below the daily mean.
The ERA-Interim reanalysis also produced a peak at 0500 LST (0.130 mm h) and a minimum at 1400 LST (0.090 mm h), making a diurnal range of 0.040 mm h. Despite a reasonable agreement on the timings for the minimum and maximum, ERA-Interim precipitation featured higher positive and negative peaks than MAC. More notable, ERA-Interim produced two local maxima and minima, demonstrating a 12 hourly cycle. We speculated that these biases in ERA-Interim might be influenced by the twice-daily initialization of the precipitation forecasts at 0000 and 1200 UTC (1100 and 2300 h LST).
3.3. Precipitation Categories
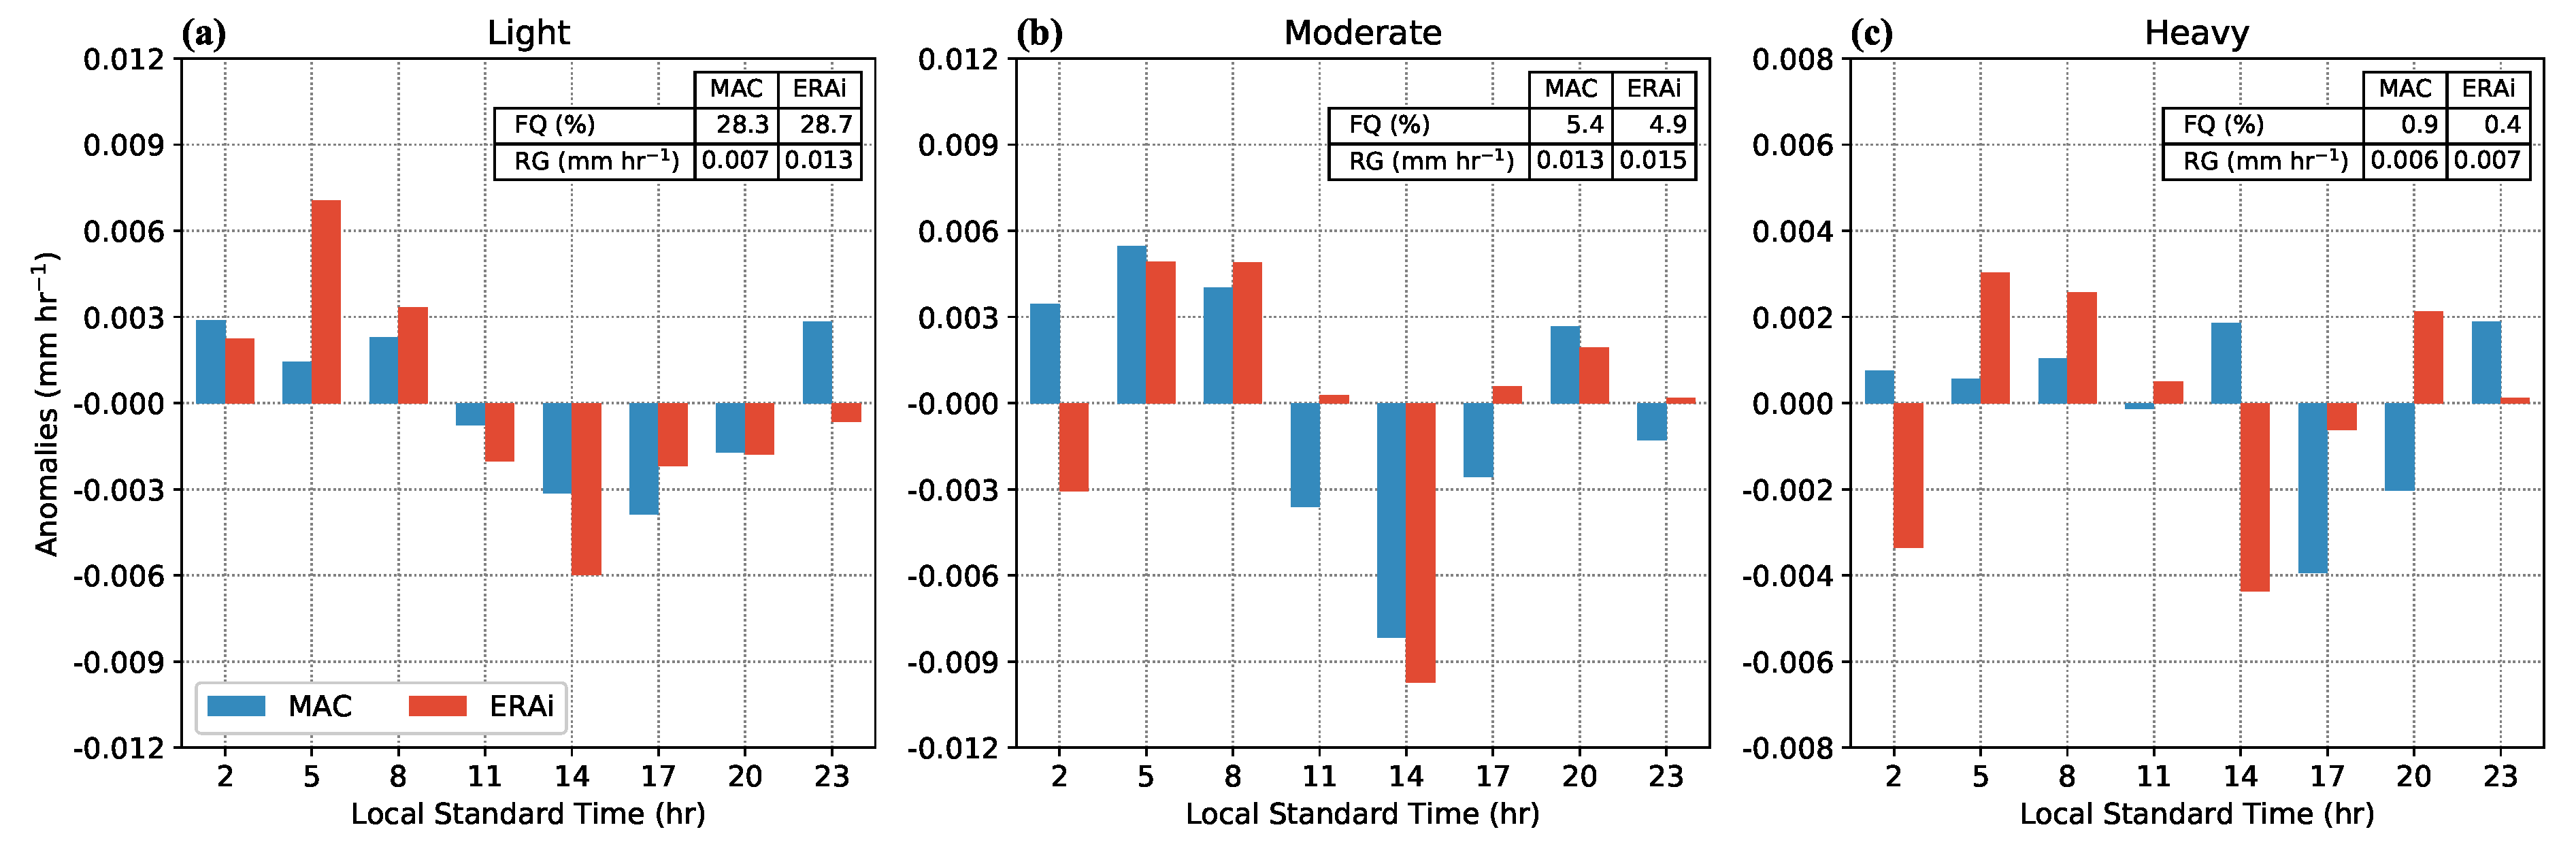
As noted in [6], light precipitation is commonly present over the SO. Our results showed that, from 1998 to 2016, light precipitation was recorded 28.3% and 28.8% of the time in MAC observations and ERA-Interim, respectively. These values were consistent with the frequency of 29.7% found in [6] from 2003 to 2011 for MAC. The magnitude of the diurnal range for MAC light precipitation was 0.007 mm h (Figure 2a). For moderate precipitation, the observed magnitude was 0.013 mm h, and its probability of occurrence was 5.4% for MAC. The moderate precipitation diurnal cycle exhibited similarities with the light category; however, the anomalies showed a more pronounced cycle. Both categories presented the minimum anomalies at 1400 LST and the maximum at 0500 LST (Figure 2a,b), consistent with the pattern of the total precipitation (Figure 1b). The frequency of the observed heavy precipitation was also 0.9%, consistent with [6]. The anomalies (Figure 2c) of heavy precipitation for MAC did not show a clear cycle throughout the day. The lack of a diurnal cycle in heavy precipitation was not surprising, as heavy precipitation events are most likely associated with large scale convections (e.g., fronts, extratropical cyclones), which are not directly driven by diurnal forcing.
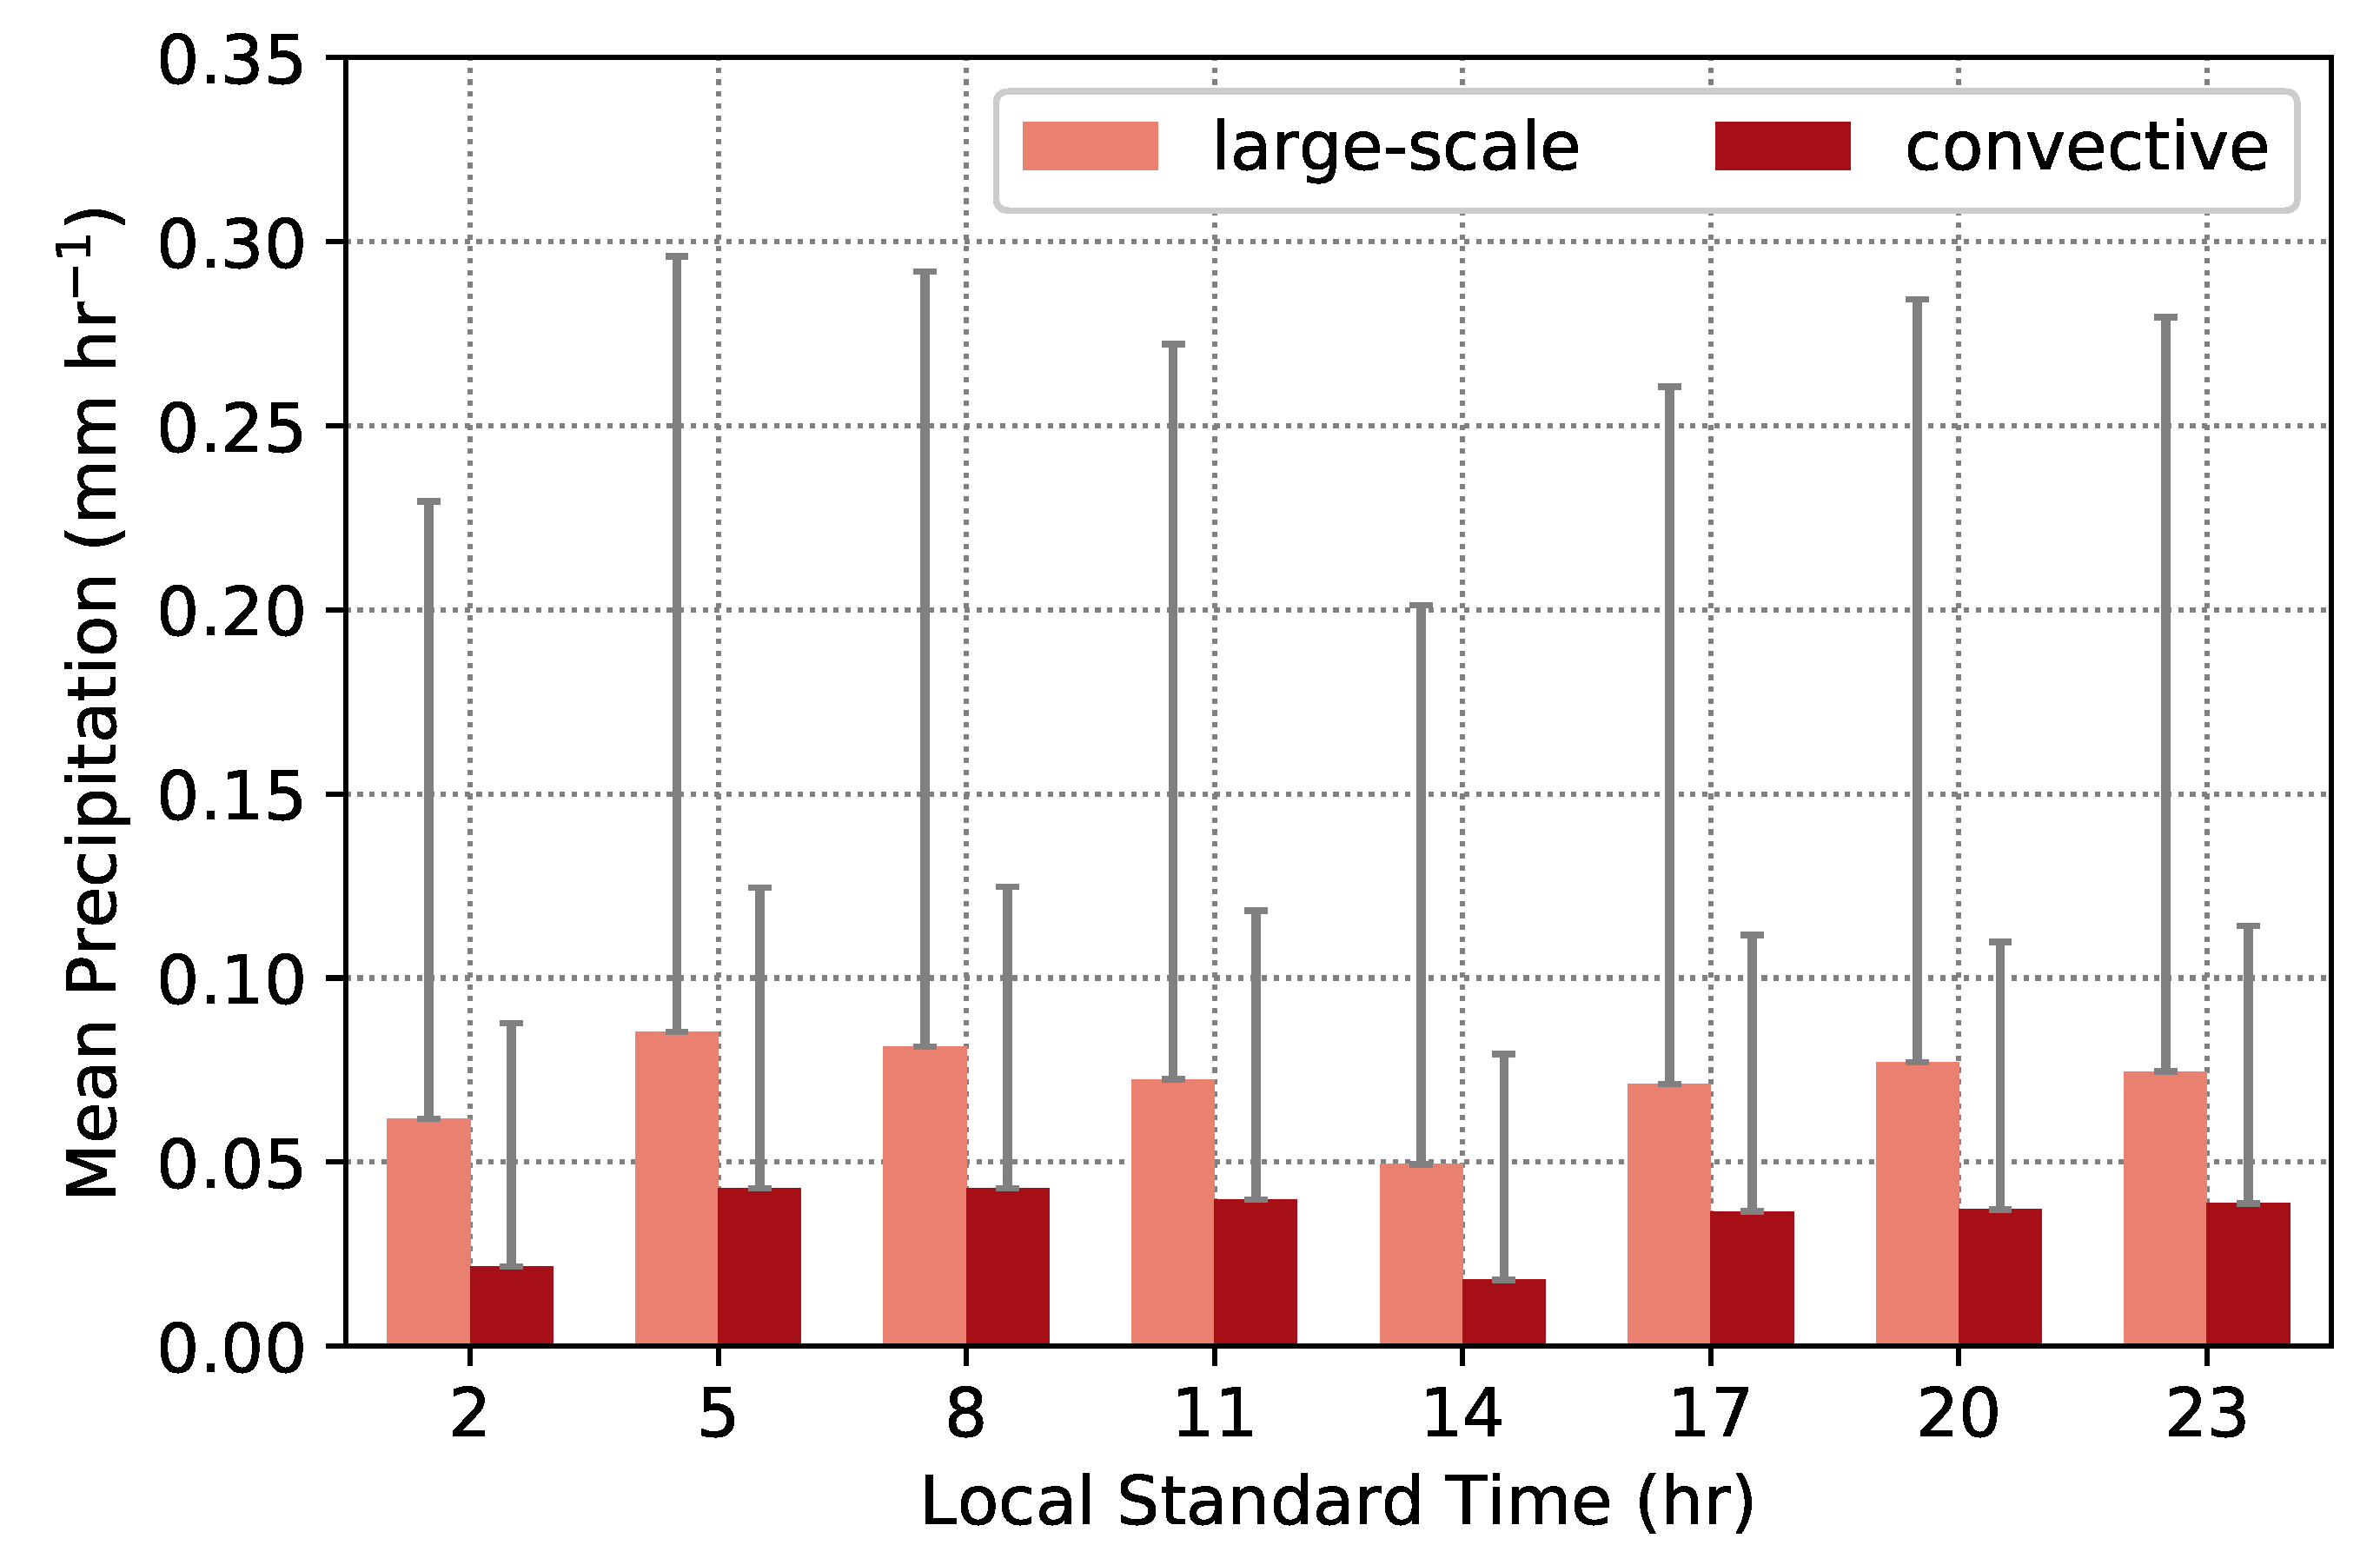
As discussed, the ERA-Interim total precipitation was marked by a 12 h cycle (Figure 1b), presumably due to the forecast initialization. The decomposition of the ERA-Interim precipitation into the three categories also showed a strong influence of the twice-daily initialization, especially for heavy precipitation, with the largest differences at 0200 and 1400 LST (Figure 2c), where the negative ERA-Interim anomalies were greater. The ERA-Interim precipitation could also be decomposed into precipitation arising from the convective parameterization and that produced by the microphysical parameterization. For both components, a 12 h cycle was observed (Figure 3). The contribution from the large scale scheme (68%) was considerably larger than the convective scheme (32%). This dominant contribution of the large scale scheme was consistent with the prevalence of marine stratocumulus clouds over the Southern Hemisphere mid-latitude oceans [20,37]. This behaviour was quite different from what was observed over the tropics, where the precipitation in models and reanalysis products was primarily produced by the convective parameterization scheme, e.g., [38,39].
3.4. Seasonality
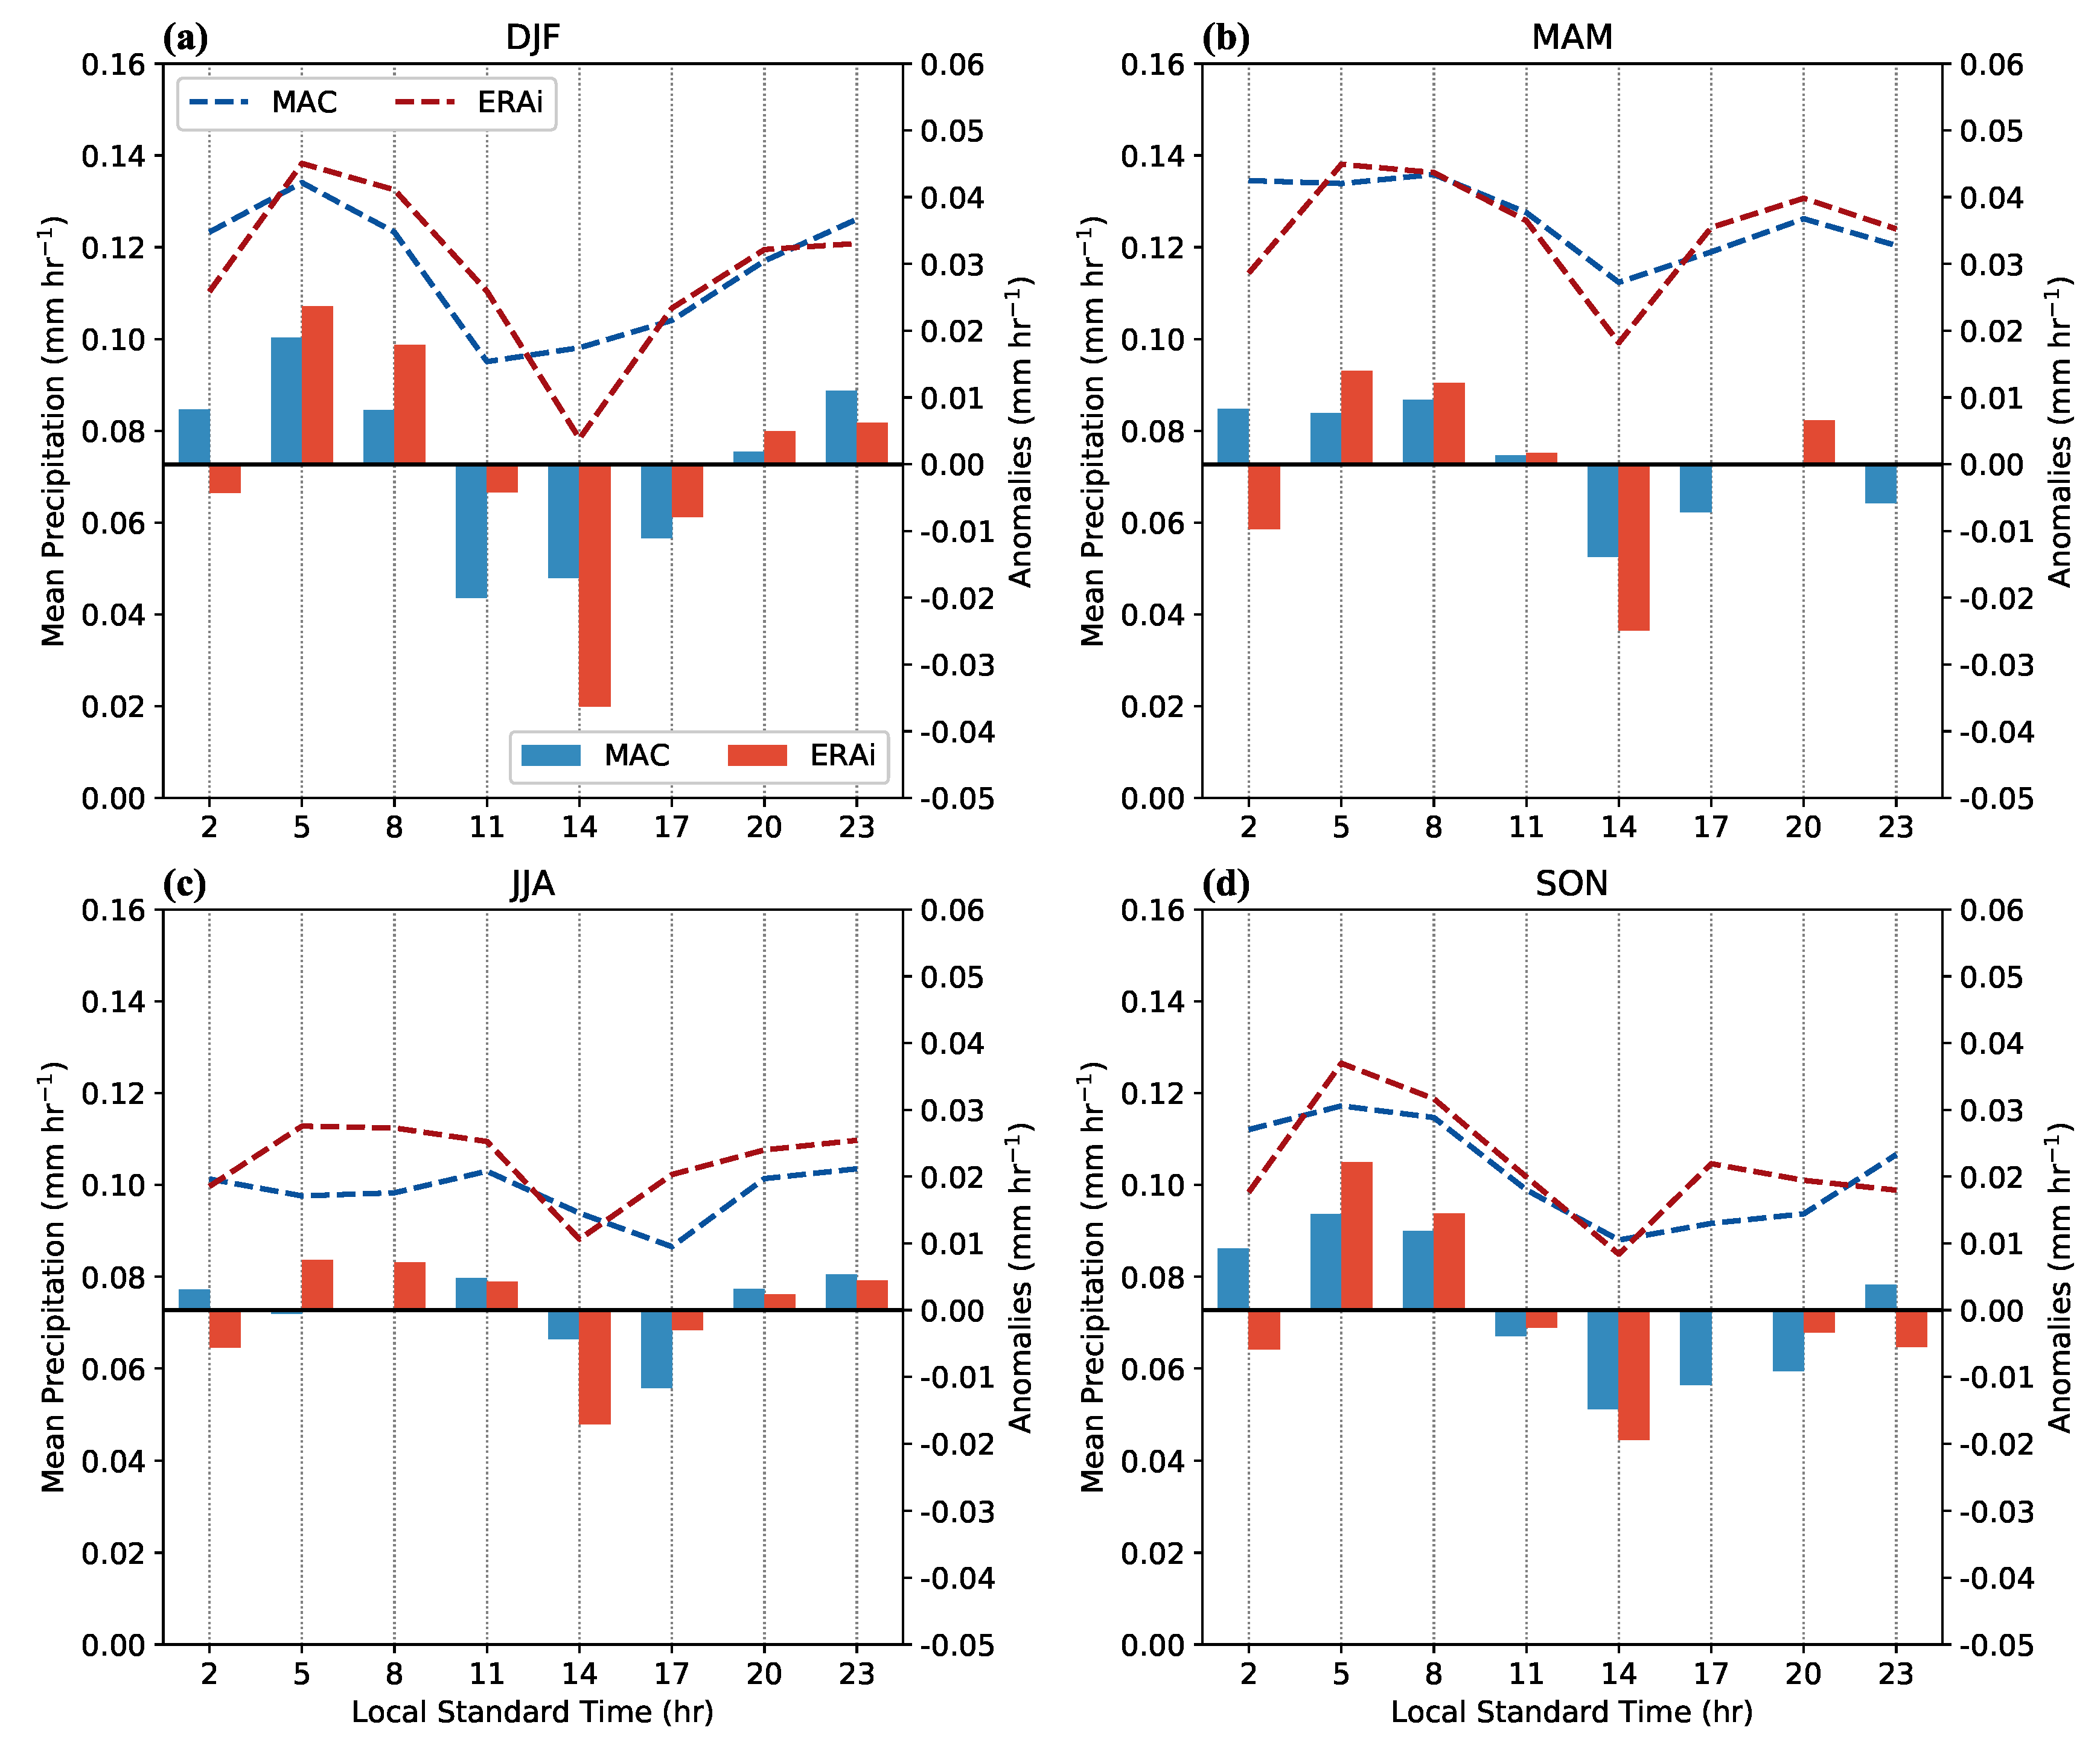
The diurnal cycle may be sorted by season (Figure 4). While a diurnal cycle was identifiable in all seasons, it was most intense and longest in duration over the Austral summer (DJF), as would be expected. Compared with the other seasons, the wintertime (JJA) diurnal cycle was relatively flat through much of the day, and its magnitude was not statistically different at the 95% significance level (Figure 4c). The work in [6] found that the climatological monthly precipitation at MAC peaked in early autumn (March and April, ∼100 mm month) and had a minimum in winter and spring of approximately 78 mm month. Once again, the ERA-Interim precipitation displayed a 12 hourly cycle for all seasons. The range of the cycle was greatest during summer, consistent with the observations. This suggested that the ERA-Interim precipitation was sensitive to both the twice daily initialization and the seasonality. Different from our findings, a study by [40] using a merged global precipitation dataset derived from multi-satellite observations showed that the range of the diurnal cycle was greater during winter over the SO; however, the winter diurnal range was underestimated by ∼8 to 15%.
When the frequency of precipitation was decomposed by season (Table 1), MAC light precipitation was slightly more frequent in winter (28.2%) than summer (26.0%). In contrast, ERA-Interim light precipitation was more frequent in winter (31.3%) than summer (24.5%). For both observations and ERA-Interim, the frequencies showed that heavy precipitation was more frequent in summer (1.3% and 0.8%) than winter (0.6% and 0.2%).
4. MABL Stability and Inversion Strength
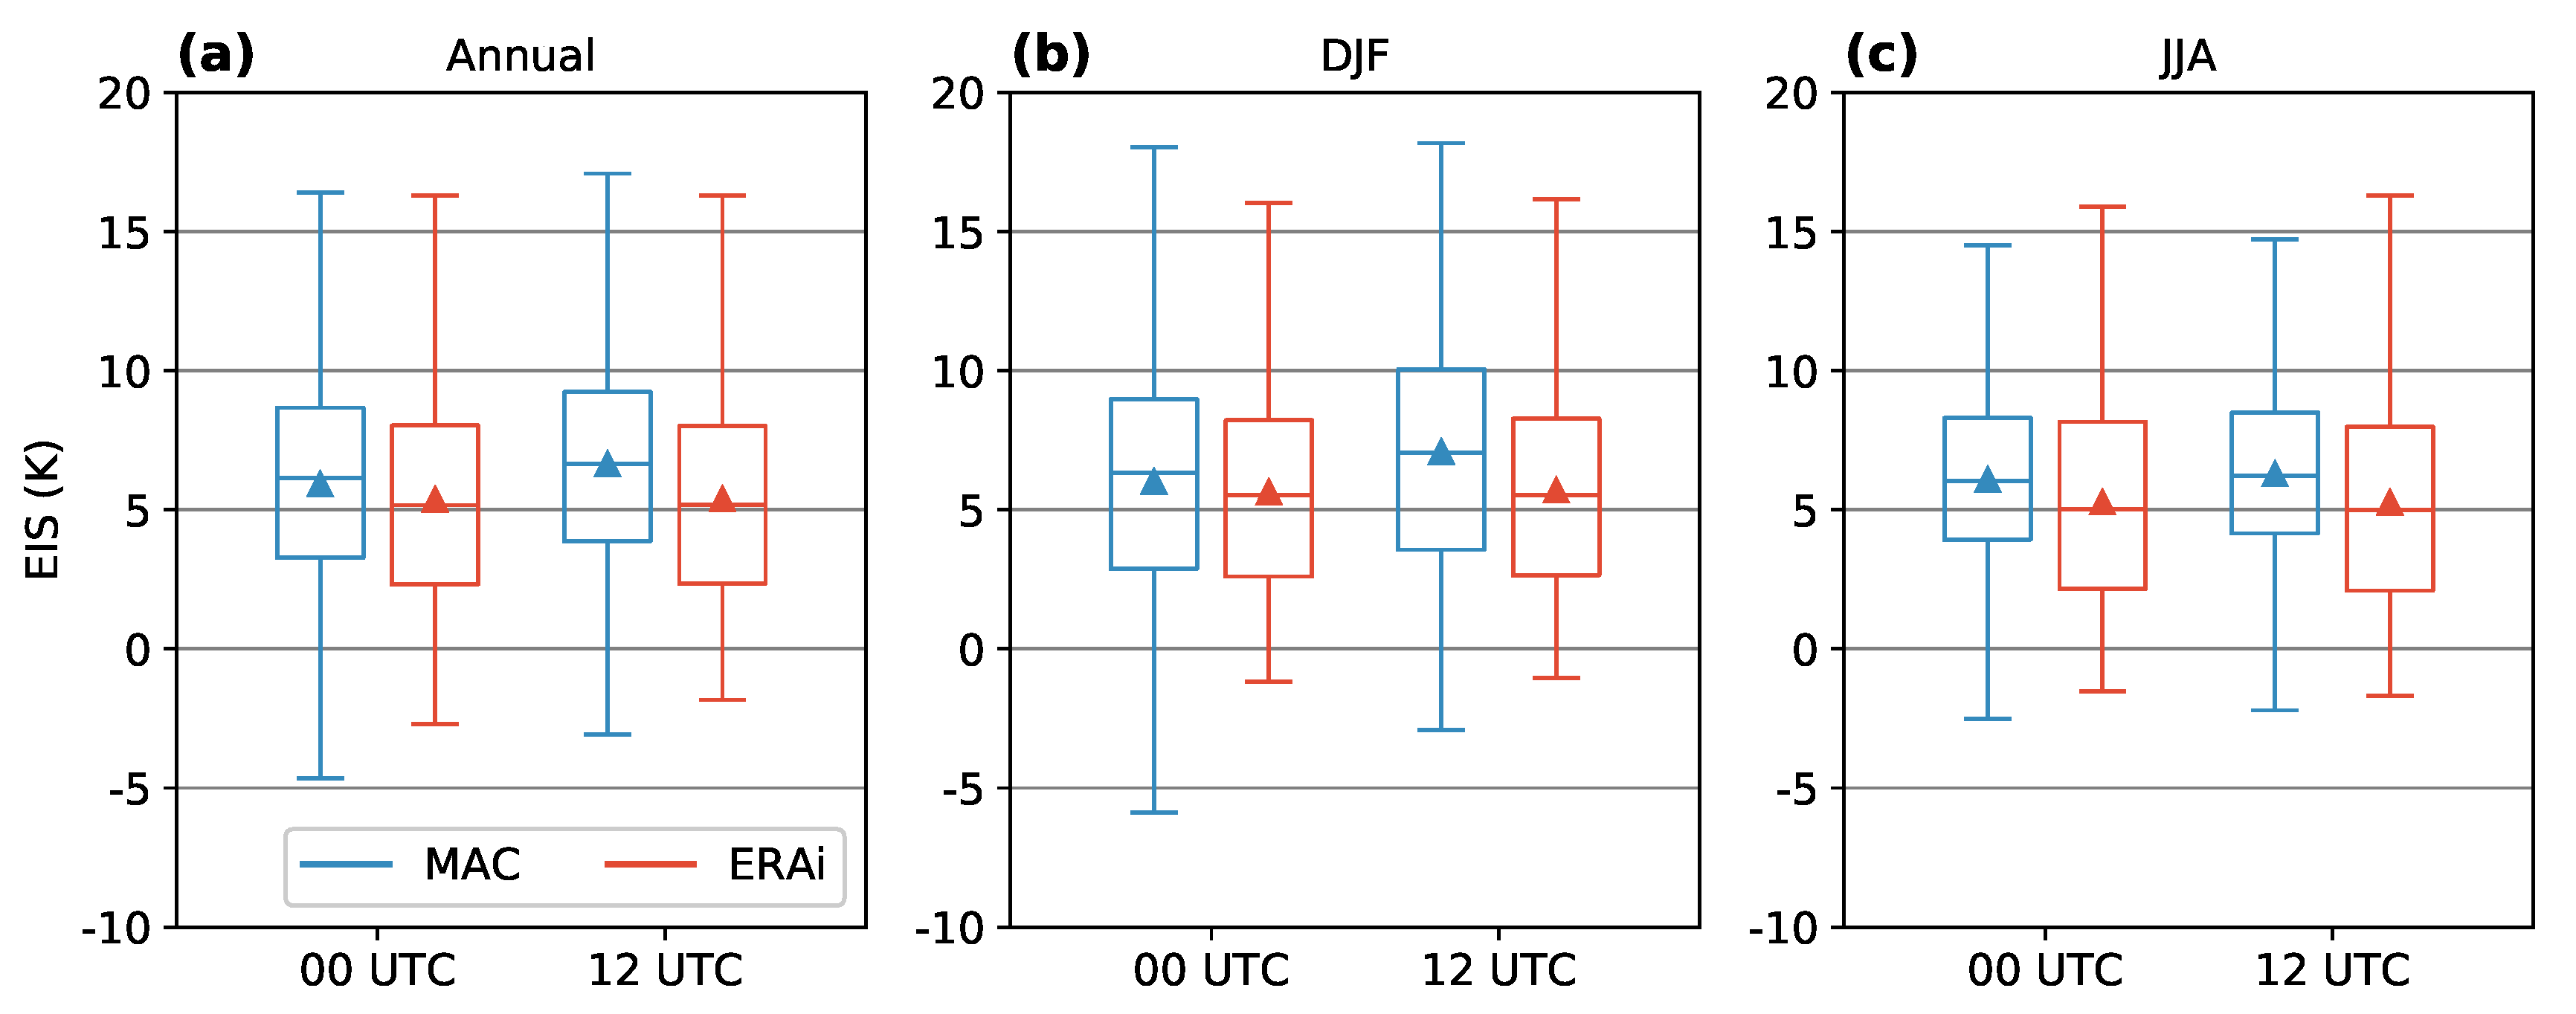
To examine the relationship of the MABL and the precipitation over Macquarie Island, the EIS was calculated using the upper air sounding. Note that these MAC soundings are only available twice-daily at approximately 0000 and 1200 UTC (1100 and 2300 h LST), and as such, they may not be ideal for revealing the full range of a diurnal cycle. Figure 5 compares the day- and night-time EIS statistics derived from the observations and ERA-Interim. Using the Monte Carlo methodology to compare the annual MAC EIS statistics (Figure 5a), statistically significant differences between day (0000 UTC, 1100 LST) and night (1200 UTC, 2300 LST) were found at the 95% confidence level. The EIS median increased from 6.14 K (day) to 6.64 K (night), with the peak associated with the positive precipitation anomalies. This relationship was consistent with the classic characterization of marine stratocumulus, e.g., [12,41], where longwave radiative cooling near the cloud top at night produces negative buoyancy and thickens the clouds, leading to the increasing production of light and moderate precipitation throughout the night. The daytime incoming solar radiation could also lead to cloud thinning/breaking, allowing for the transition of the cloud regime from stratocumulus at night to broken cumulus during the day. The EIS day-night difference during summer was statistically significant, consistent with the annual statistics. On the contrary, no significant day-night difference was observed for the EIS during winter. Figure 5 also reveals a statistically significant night-time contrast between summer and winter observations, with lower EIS in winter at night.
The ERA-Interim EIS statistics, on the other hand, did not pick up any significant day-night or summer-winter differences as found in the observations, which was consistent with the lack of a clear diurnal cycle in precipitation.
5. Discussion and Conclusions
A climatology of the diurnal cycle of precipitation was produced from Macquarie Island surface precipitation observations and the ERA-Interim reanalysis dataset. Our results revealed that the annual magnitude of the diurnal range was 0.023 mm h, with a maximum during night and/or early morning before sunrise at 0500 LST and a minimum at 1400 LST (Figure 1b). Such a diurnal cycle was consistent with in situ observations over the oceans between 35 S and 50 S, where precipitation is significantly more frequent at night [40,42]. Comparatively, over most of the tropical oceans, precipitation peaks were found from around midnight to 0400 LST. In contrast, where land influences were higher, such as over the North Pacific and the North Atlantic oceans, peaks were about 2-4 h earlier [42]. The seasonal diurnal cycle of precipitation at Macquarie Island showed a strong diurnal signal in summer (0.039 mm h). In contrast, such a diurnal cycle was not evident during winter. The categorization of precipitation rates showed that light precipitation was slightly more frequent in winter compared to other seasons, presenting 28.2% of the time, compared to summer with 26.0% of the time. Anomalies of light and moderate precipitation showed a similar behaviour compared to the total precipitation. In contrast, heavy precipitation did not show a systematic cycle throughout the day.
The EIS parameter was calculated twice daily at 0000 UTC and 1200 UTC (1100 and 2300 h LST, respectively). Overall, a stronger inversion was observed at night over Macquarie Island, which was more favourable for the generation of shallow convection, greater cloud cover, and thicker clouds [41]. This was consistent with the expected diurnal cycle of marine stratocumulus clouds, for which the daily maximum tended to occur during the early morning hours before sunrise [43,44,45,46]. Our results showed that there was a clear connection between the stronger inversion at night and the maximum of precipitation in the diurnal cycle. The seasonal variations showed greater values of EIS during summer for both day and night. These results suggested that the light and moderate precipitation and associated diurnal cycle generated by MABL clouds (shallow convection) were likely to make a significant contribution to the precipitation amount over the SO. This supported the conclusion that a significant portion of the precipitation over the SO came from non-frontal clouds [6,7], perhaps more so than suggested by [8] using the GPCP precipitation product.
A diurnal cycle may not be taken into account in precipitation climatologies based on satellite products over the SO. For instance, CloudSat CPR has widely been used to study oceanic precipitation, e.g., [3,47,48]; however, since CloudSat is in a Sun-synchronous orbit, the data from this satellite only contain precipitation that occurs at the same two times every day. Further, night-time observations are not available from April 2011 onward. This may result in a diurnal sampling bias in the CloudSat CPR data. Using MAC as a reference point, given that the A-Train overpassing times are approximately 0300-0400 UTC (1400-1500 LST in summer) and 1400-1500 UTC (0100-0200 LST in summer), the observations would have picked up the (sub-)minimum and missed the peak of the precipitation throughout the day (Figure 1b), leading to an underestimate of the daily precipitation amount. Assuming that missing the diurnal cycle is the only source of errors, the annual daily precipitation would be underestimated by less than 1% before 2011 and by ∼9% after 2011 in the CloudSat precipitation product. Summertime underestimation would be slightly larger, 3% and 10% respectively before and after 2011.
The ERA-Interim reanalysis precipitation product showed a marked 12 h cycle. Overall, the mean precipitation and anomalies for all the precipitation categories suggested that ERA-Interim was influenced by the twice-daily initialization of forecasts. As for the total precipitation, the decomposition into large scale and convective components also showed an influence of the twice-daily initialization, with a 12 h cycle observed in both components, although the large scale precipitation dominated the climatology.
Our findings showed that a diurnal cycle of precipitation over Macquarie Island was discernible. As the cycle peaked in the early morning, many A-Train products that depended on daytime observations only (e.g., effective radius, cloud droplet number concentration, cloud phase optical property, etc.) were not able to capture the cloud properties associated with the precipitation peak, limiting any climatology derived from these products. Further, a marked seasonality was noticed in the diurnal cycle, with summer showing a much larger variation through the day compared to wintertime. In future work, we will extend our current analysis to a more extensive area over the SO, including recent dedicated field campaigns and model simulations.
Author Contributions
Conceptualization, S.T.S.; methodology, F.L., Y.H., and S.T.S.; formal analysis, F.L., Y.H., S.T.S., and M.J.M.; writing, original draft preparation, F.L.; writing, review and editing, F.L., Y.H., S.T.S., and M.J.M. All authors read and agreed to the published version of the manuscript.
Acknowledgments
This study was supported by the National Commission for Scientific and Technological Research (CONICYT) Chile Doctoral Fellowship program. All the data used are listed in the references; we thank ECMWF for providing the ERA-Interim reanalysis data and Blair Trewin from the Australian Bureau of Meteorology for providing Macquarie Island observations.
Conflicts of Interest
The authors declare no conflict of interest.
Abbreviations
The following abbreviations are used in this manuscript:
| SO | Southern Ocean |
| MABL | Maritime atmospheric boundary layer |
| MAC | Macquarie Island |
| ECMWF | European Centre for Medium-Range Weather Forecasts |
| LTS | Lower troposphere stability |
| EIS | Estimated inversion strength |
| LST | Local standard time |
References
- Mace, G.G.; Zhang, Q.; Vaughan, M.; Marchand, R.; Stephens, G.; Trepte, C.; Winker, D. A description of hydrometeor layer occurrence statistics derived from the first year of merged Cloudsat and CALIPSO data. J. Geophys. Res. Atmos. 2009, 114. [Google Scholar] [CrossRef] [Green Version]
- Behrangi, A.; Lebsock, M.; Wong, S.; Lambrigtsen, B. On the quantification of oceanic rainfall using spaceborne sensors. J. Geophys. Res. Atmos. 2012, 117. [Google Scholar] [CrossRef]
- Behrangi, A.; Stephens, G.; Adler, R.F.; Huffman, G.J.; Lambrigtsen, B.; Lebsock, M. An update on the oceanic precipitation rate and its zonal distribution in light of advanced observations from space. J. Clim. 2014, 27, 3957–3965. [Google Scholar] [CrossRef] [Green Version]
- Trenberth, K.E.; Fasullo, J.T. Simulation of present-day and twenty-first-century energy budgets of the southern oceans. J. Clim. 2010, 23, 440–454. [Google Scholar] [CrossRef]
- Stephens, G.L.; Vane, D.G.; Boain, R.J.; Mace, G.G.; Sassen, K.; Wang, Z.; Illingworth, A.J.; O’connor, E.J.; Rossow, W.B.; Durden, S.L.; et al. The CloudSat mission and the A-Train: A new dimension of space-based observations of clouds and precipitation. Bull. Am. Meteorol. Soc. 2002, 83, 1771–1790. [Google Scholar] [CrossRef] [Green Version]
- Wang, Z.; Siems, S.T.; Belusic, D.; Manton, M.J.; Huang, Y. A climatology of the precipitation over the Southern Ocean as observed at Macquarie Island. J. Appl. Meteorol. Climatol. 2015, 54, 2321–2337. [Google Scholar] [CrossRef]
- Lang, F.; Huang, Y.; Siems, S.T.; Manton, M.J. Characteristics of the marine atmospheric boundary layer over the Southern Ocean in response to the synoptic forcing. J. Geophys. Res. Atmos. 2018, 123, 7799–7820. [Google Scholar] [CrossRef]
- Catto, J.L.; Jakob, C.; Berry, G.; Nicholls, N. Relating global precipitation to atmospheric fronts. Geophys. Res. Lett. 2012, 39. [Google Scholar] [CrossRef]
- Huffman, G.J.; Adler, R.F.; Morrissey, M.M.; Bolvin, D.T.; Curtis, S.; Joyce, R.; McGavock, B.; Susskind, J. Global precipitation at one-degree daily resolution from multisatellite observations. J. Hydrometeorol. 2001, 2, 36–50. [Google Scholar] [CrossRef] [Green Version]
- Berry, G.; Reeder, M.J.; Jakob, C. A global climatology of atmospheric fronts. Geophys. Res. Lett. 2011, 38. [Google Scholar] [CrossRef] [Green Version]
- Ahn, E.; Huang, Y.; Chubb, T.H.; Baumgardner, D.; Isaac, P.; de Hoog, M.; Siems, S.T.; Manton, M.J. In situ observations of wintertime low-altitude clouds over the Southern Ocean. Q. J. R. Meteorol. Soc. 2017, 143, 1381–1394. [Google Scholar] [CrossRef]
- Wood, R. Stratocumulus clouds. Mon. Weather. Rev. 2012, 140, 2373–2423. [Google Scholar] [CrossRef]
- Minnis, P.; Harrison, E.F. Diurnal variability of regional cloud and clear-sky radiative parameters derived from GOES data. Part I: Analysis method. J. Appl. Meteorol. 1984, 23. [Google Scholar] [CrossRef] [Green Version]
- Nicholls, S. The dynamics of stratocumulus: Aircraft observations and comparisons with a mixed layer model. Q. J. R. Meteorol. Soc. 1984, 110, 783–820. [Google Scholar] [CrossRef]
- Hignett, P. Observations of diurnal variation in a cloud-capped marine boundary layer. J. Atmos. Sci. 1991, 48, 1474–1482. [Google Scholar] [CrossRef]
- Rémillard, J.; Kollias, P.; Luke, E.; Wood, R. Marine boundary layer cloud observations in the Azores. J. Clim. 2012, 25, 7381–7398. [Google Scholar] [CrossRef] [Green Version]
- Noel, V.; Chepfer, H.; Chiriaco, M.; Yorks, J. The diurnal cycle of cloud profiles over land and ocean between 51∘ S and 51∘ N, seen by the CATS spaceborne lidar from the International Space Station. Atmos. Chem. Phys. 2018, 18, 9457–9473. [Google Scholar] [CrossRef] [Green Version]
- Hu, Y.; Winker, D.; Vaughan, M.; Lin, B.; Omar, A.; Trepte, C.; Flittner, D.; Yang, P.; Nasiri, S.L.; Baum, B.; et al. CALIPSO/CALIOP cloud phase discrimination algorithm. J. Atmos. Ocean. Technol. 2009, 26, 2293–2309. [Google Scholar] [CrossRef] [Green Version]
- Morrison, A.E.; Siems, S.T.; Manton, M.J.; Nazarov, A. A modeling case study of mixed-phase clouds over the Southern Ocean and Tasmania. Mon. Weather. Rev. 2010, 138, 839–862. [Google Scholar] [CrossRef]
- Huang, Y.; Siems, S.T.; Manton, M.J.; Hande, L.B.; Haynes, J.M. The structure of low-altitude clouds over the Southern Ocean as seen by CloudSat. J. Clim. 2012, 25, 2535–2546. [Google Scholar] [CrossRef]
- Bennartz, R. Global assessment of marine boundary layer cloud droplet number concentration from satellite. J. Geophys. Res. Atmos. 2007, 112. [Google Scholar] [CrossRef]
- Bodas-Salcedo, A.; Williams, K.D.; Field, P.R.; Lock, A.P. The surface downwelling solar radiation surplus over the Southern Ocean in the Met Office model: The role of midlatitude cyclone clouds. J. Clim. 2012, 25, 7467–7486. [Google Scholar] [CrossRef]
- Huang, Y.; Siems, S.T.; Manton, M.J.; Thompson, G. An evaluation of WRF simulations of clouds over the Southern Ocean with A-Train observations. Mon. Weather. Rev. 2014, 142, 647–667. [Google Scholar] [CrossRef]
- Huang, Y.; Protat, A.; Siems, S.T.; Manton, M.J. A-train observations of maritime midlatitude storm-track cloud systems: Comparing the Southern Ocean against the North Atlantic. J. Clim. 2015, 28, 1920–1939. [Google Scholar] [CrossRef]
- Adams, N. Climate trends at Macquarie Island and expectations of future climate change in the sub-Antarctic. In Proceedings of the Royal Society of Tasmania; Royal Society of Tasmania: Hobart, Australia, 2009; Volume 143, pp. 1–8. [Google Scholar]
- Jovanovic, B.; Braganza, K.; Collins, D.; Jones, D. Climate variations and change evident in high-quality climate data for Australia’s Antarctic and remote island weather stations. Aust. Meteorol. Oceanogr. J. 2012, 62, 247–261. [Google Scholar] [CrossRef]
- Hande, L.B.; Siems, S.T.; Manton, M.J.; Belusic, D. Observations of wind shear over the Southern Ocean. J. Geophys. Res. Atmos. 2012, 117. [Google Scholar] [CrossRef] [Green Version]
- Klein, S.A.; Hartmann, D.L. The seasonal cycle of low stratiform clouds. J. Clim. 1993, 6, 1587–1606. [Google Scholar] [CrossRef] [Green Version]
- Wood, R.; Bretherton, C.S. On the relationship between stratiform low cloud cover and lower-tropospheric stability. J. Clim. 2006, 19, 6425–6432. [Google Scholar] [CrossRef]
- Bolton, D. The computation of equivalent potential temperature. Mon. Weather. Rev. 1980, 108, 1046–1053. [Google Scholar] [CrossRef] [Green Version]
- Muhlbauer, A.; McCoy, I.L.; Wood, R. Climatology of stratocumulus cloud morphologies: Microphysical properties and radiative effects. Atmos. Chem. Phys. 2014, 14, 6695–6716. [Google Scholar] [CrossRef] [Green Version]
- Naud, C.M.; Booth, J.F.; Del Genio, A.D. The relationship between boundary layer stability and cloud cover in the post-cold-frontal region. J. Clim. 2016, 29, 8129–8149. [Google Scholar] [CrossRef]
- Dee, D.P.; Uppala, S.M.; Simmons, A.J.; Berrisford, P.; Poli, P.; Kobayashi, S.; Andrae, U.; Balmaseda, M.A.; Balsamo, G.; Bauer, P.; et al. The ERA-Interim reanalysis: Configuration and performance of the data assimilation system. Q. J. R. Meteorol. Soc. 2011, 137, 553–597. [Google Scholar] [CrossRef]
- Tiedtke, M. Representation of clouds in large-scale models. Mon. Weather. Rev. 1993, 121, 3040–3061. [Google Scholar] [CrossRef] [Green Version]
- Bechtold, P.; Chaboureau, J.P.; Beljaars, A.; Betts, A.K.; Köhler, M.; Miller, M.; Redelsperger, J.L. The simulation of the diurnal cycle of convective precipitation over land in a global model. Q. J. R. Meteorol. Soc. 2004, 130, 3119–3137. [Google Scholar] [CrossRef] [Green Version]
- Tompkins, A.M.; Gierens, K.; Rädel, G. Ice supersaturation in the ECMWF integrated forecast system. Q. J. R. Meteorol. Soc. 2007, 133, 53–63. [Google Scholar] [CrossRef] [Green Version]
- Haynes, J.M.; Jakob, C.; Rossow, W.B.; Tselioudis, G.; Brown, J. Major characteristics of Southern Ocean cloud regimes and their effects on the energy budget. J. Clim. 2011, 24, 5061–5080. [Google Scholar] [CrossRef] [Green Version]
- Dai, A.; Trenberth, K.E. The diurnal cycle and its depiction in the Community Climate System Model. J. Clim. 2004, 17, 930–951. [Google Scholar] [CrossRef]
- Sato, T.; Miura, H.; Satoh, M.; Takayabu, Y.N.; Wang, Y. Diurnal cycle of precipitation in the tropics simulated in a global cloud-resolving model. J. Clim. 2009, 22, 4809–4826. [Google Scholar] [CrossRef]
- Dai, A.; Lin, X.; Hsu, K.L. The frequency, intensity, and diurnal cycle of precipitation in surface and satellite observations over low-and mid-latitudes. Clim. Dyn. 2007, 29, 727–744. [Google Scholar] [CrossRef]
- Comstock, K.K.; Wood, R.; Yuter, S.E.; Bretherton, C.S. Reflectivity and rain rate in and below drizzling stratocumulus. Q. J. R. Meteorol. Soc. 2004, 130, 2891–2918. [Google Scholar] [CrossRef] [Green Version]
- Dai, A. Global precipitation and thunderstorm frequencies. Part II: Diurnal variations. J. Clim. 2001, 14, 1112–1128. [Google Scholar] [CrossRef]
- Minnis, P.; Heck, P.W.; Young, D.F.; Fairall, C.W.; Snider, J.B. Stratocumulus cloud properties derived from simultaneous satellite and island-based instrumentation during FIRE. J. Appl. Meteorol. 1992, 31, 317–339. [Google Scholar] [CrossRef]
- Bretherton, C.S.; Austin, P.; Siems, S.T. Cloudiness and marine boundary layer dynamics in the ASTEX Lagrangian experiments. Part II: Cloudiness, drizzle, surface fluxes, and entrainment. J. Atmos. Sci. 1995, 52, 2724–2735. [Google Scholar] [CrossRef] [Green Version]
- Wood, R.; Bretherton, C.S.; Hartmann, D.L. Diurnal cycle of liquid water path over the subtropical and tropical oceans. Geophys. Res. Lett. 2002, 29. [Google Scholar] [CrossRef] [Green Version]
- Rozendaal, M.A.; Leovy, C.B.; Klein, S.A. An observational study of diurnal variations of marine stratiform cloud. J. Clim. 1995, 8, 1795–1809. [Google Scholar] [CrossRef] [Green Version]
- Leon, D.C.; Wang, Z.; Liu, D. Climatology of drizzle in marine boundary layer clouds based on 1 year of data from CloudSat and Cloud-Aerosol Lidar and Infrared Pathfinder Satellite Observations (CALIPSO). J. Geophys. Res. Atmos. 2008, 113. [Google Scholar] [CrossRef] [Green Version]
- Hayden, L.; Liu, C. A multiyear analysis of global precipitation combining CloudSat and GPM precipitation retrievals. J. Hydrometeorol. 2018, 19, 1935–1952. [Google Scholar] [CrossRef]
Figure 1.
(a) Regional map showing the location of Macquarie Island in the Southern Ocean. The inset shows Macquarie Island (MAC) together with the approximate location of the station at the northern part. (b) Mean diurnal cycle of precipitation (left axis, dashed lines) and anomalies (right axis, bars) for both MAC observations and the ERA-Interim dataset, for the total precipitation.

Figure 2.
Diurnal anomalies of precipitation for both MAC observations and the ERA-Interim dataset, separated by categories: (a) light (0.2 ≤ P < 0.5 mm h), (b) moderate (0.5 ≤ P < 1.5 mm h), and (c) heavy precipitation (P ≥ 1.5 mm h). Tables show the frequencies of occurrence (FQ) and the diurnal range (RG).

Figure 3.
Diurnal cycle of ERA-Interim components’ large scale and convective precipitation. Error bars show one standard deviation.
Figure 3.
Diurnal cycle of ERA-Interim components’ large scale and convective precipitation. Error bars show one standard deviation.

Figure 4.
Mean diurnal cycle of precipitation (left axes, dashed lines) and anomalies (right axes, bars) for both MAC observations and ERA-Interim dataset, for total precipitation during (a) summer (DJF), (b) autumn (MAM), (c) winter (JJA), and (d) spring (SON).
Figure 4.
Mean diurnal cycle of precipitation (left axes, dashed lines) and anomalies (right axes, bars) for both MAC observations and ERA-Interim dataset, for total precipitation during (a) summer (DJF), (b) autumn (MAM), (c) winter (JJA), and (d) spring (SON).

Figure 5.
Estimated inversion strength (EIS) parameter for MAC observations and ERA-Interim profiles. (a) Annual, (b) summer (DJF), and (c) winter (JJA). The median values are shown as horizontal lines and the mean values as triangles. Boxes indicate the interquartile range (25th to 75th percentiles) and the whiskers extend to of the standard normal distribution.


Table 1.
Statistics of the 3 h surface precipitation decomposed into the categories defined for MAC and ERA-Interim, period 1998-2016. The magnitude of the diurnal range is defined as the maximum minus the minimum of the 3 h precipitation rate, and the probability of occurrence is estimated considering all measurements.
| MAC | ERA-Interim | ||||||
|---|---|---|---|---|---|---|---|
| Temporality | Category | Prob.Oc. | Amount | Range | Prob. Oc. | Amount | Range |
| (%) | (mm h) | (mm h) | (%) | (mm h) | (mm h) | ||
| Summer | Light | 26.0 | 0.16 | 0.013 | 24.5 | 0.18 | 0.014 |
| Moderate | 5.1 | 0.85 | 0.021 | 4.8 | 0.83 | 0.020 | |
| Heavy | 1.3 | 2.22 | 0.011 | 0.8 | 2.09 | 0.020 | |
| Autumn | Light | 31.2 | 0.16 | 0.008 | 30.2 | 0.18 | 0.009 |
| Moderate | 6.2 | 0.84 | 0.016 | 5.6 | 0.81 | 0.020 | |
| Heavy | 1.1 | 2.09 | 0.012 | 0.5 | 1.88 | 0.010 | |
| Winter | Light | 28.2 | 0.16 | 0.004 | 31.3 | 0.18 | 0.013 |
| Moderate | 4.9 | 0.81 | 0.015 | 4.3 | 0.76 | 0.009 | |
| Heavy | 0.6 | 2.04 | 0.006 | 0.2 | 1.71 | 0.006 | |
| Spring | Light | 27.7 | 0.16 | 0.012 | 28.9 | 0.17 | 0.015 |
| Moderate | 5.2 | 0.82 | 0.020 | 4.8 | 0.78 | 0.017 | |
| Heavy | 0.7 | 2.03 | 0.012 | 0.2 | 1.89 | 0.009 | |
| Annual | Light | 28.3 | 0.16 | 0.007 | 28.7 | 0.18 | 0.013 |
| Moderate | 5.4 | 0.83 | 0.013 | 4.9 | 0.80 | 0.015 | |
| Heavy | 0.9 | 2.11 | 0.006 | 0.4 | 1.96 | 0.007 | |
| Total | 34.6 | 0.11 | 0.023 | 34.0 | 0.11 | 0.040 |
© 2020 by the authors. Licensee MDPI, Basel, Switzerland. This article is an open access article distributed under the terms and conditions of the Creative Commons Attribution (CC BY) license (http://creativecommons.org/licenses/by/4.0/).
Share and Cite
MDPI and ACS Style
Lang, F.; Huang, Y.; Siems, S.T.; Manton, M.J. Evidence of a Diurnal Cycle in Precipitation over the Southern Ocean as Observed at Macquarie Island. Atmosphere 2020, 11, 181. https://doi.org/10.3390/atmos11020181
AMA Style
Lang F, Huang Y, Siems ST, Manton MJ. Evidence of a Diurnal Cycle in Precipitation over the Southern Ocean as Observed at Macquarie Island. Atmosphere. 2020; 11(2):181. https://doi.org/10.3390/atmos11020181
Chicago/Turabian StyleLang, Francisco, Yi Huang, Steven T. Siems, and Michael J. Manton. 2020. "Evidence of a Diurnal Cycle in Precipitation over the Southern Ocean as Observed at Macquarie Island" Atmosphere 11, no. 2: 181. https://doi.org/10.3390/atmos11020181
Note that from the first issue of 2016, this journal uses article numbers instead of page numbers. See further details here.