Article

ELF/VLF Wave Radiation Experiment by Modulated Ionospheric Heating Based on Multi-Source Observations at EISCAT

1
National Key Laboratory of Electromagnetic Environment, China Research Institute of Radiowave Propagation, Qingdao 266107, China
2
Qian Xuesen Laboratory of Space Technology, China Academy of Space Technology, Beijing 100094, China
*
Authors to whom correspondence should be addressed.
Atmosphere 2022, 13(2), 228; https://doi.org/10.3390/atmos13020228
Submission received: 6 January 2022 / Revised: 25 January 2022 / Accepted: 28 January 2022 / Published: 29 January 2022
(This article belongs to the Special Issue Radar Sensing Atmosphere: Modelling, Imaging and Prediction)

Abstract

:
Ground-based high-frequency modulated waves can periodically heat the ionosphere and create “virtual antennas”, which can radiate extremely low frequency (ELF, 0.3–3 kHz) or very low frequency (VLF, 3–30 kHz) waves for long-distance communication. Ionospheric X-mode and O-mode heating experiments using amplitude and beat-wave (BW) modulations were conducted on 21 November 2019. Experimental results were analyzed from multiple perspectives based on data from Dynasonde, a magnetometer, stimulated electromagnetic emissions, an ELF/VLF signal receiver, and ultra-high-frequency radar. The strongest excited ELF/VLF signals in previous BW modulation heating experiments were around 8–12 kHz; however, in this experiment, no signal excited in this frequency range was observed, and the signal with the highest signal/noise ratio was at the frequency of 3517 Hz, which will aid in understanding the best communication frequency under different ionospheric backgrounds. It is well-accepted that the electron temperature changes periodically with the modulation frequency. However, we noted that the electron temperature had insufficient cooling during the O-mode modulated heating process and then increased again, resulting in a continuous electron temperature increase. We found that this was related to the change in ion composition after analyzing ion-line spectra, which will be helpful in studying the effect of modulation heating on the ionosphere background.

1. Introduction

Ground-based facilities using high-power high-frequency (HF) radio waves inject energy into the ionosphere through wave–particle and wave–wave interactions; this can artificially and temporarily change the local state of the ionosphere and cause various perturbation phenomena, such as electron-temperature enhancements, electron density fluctuations, stimulated electromagnetic emissions (SEEs), optical emissions, and extremely low frequency (ELF)/very low frequency (VLF) “virtual antennas” [1,2,3,4,5]. Among these phenomena, the generation of virtual antennas, which can radiate ELF/VLF waves over long ranges with minimal attenuation in the Earth–ionosphere waveguide, is important for communication with submarines and ground stations [6,7].
The generation of ELF/VLF virtual antennas depends on the HF modulation heating method. Currently, there are two primary methods that excite ELF/VLF wave radiation, amplitude modulation (AM) and beat-wave (BW) modulation. The conversion principle of AM HF heating relies on modulating natural currents such as the auroral electrojet in the lower ionosphere (e.g., D/E layer) [8,9]. The signal quality and radiation intensity depend on the strength and stability of the electrojet. However, the electrojet changes with time and does not appear constantly [10]. Unlike in the AM method, which has a generally accepted physical mechanism, the altitude of the ELF/VLF source region remains controversial during BW HF heating experiments [11,12]. The BW modulation method uses two continuous waves with a frequency difference in the ELF/VLF band to simultaneously inject the ionosphere. Kuo et al. experimentally determined that beat-wave-generated ELF/VLF signals could be strong even when AM-generated ELF/VLF signals were weak, and proposed a possible mechanism that included an ELF/VLF source induced by the ponderomotive nonlinearity of the BW transmission in the F region [13,14]. Subsequently, Kuo and Lee found that the intensity of VLF signals could be dramatically enhanced in the presence of irregularities in the ionosphere [15]. Meanwhile, Cohen et al. predicted that BW generated in the D-region could be much stronger than that of AM, depending on the location of the receiver [16]. This analysis suggested that simply measuring larger BW signals than AM signals does not imply that the electrojet current is weak. Moore et al. experimentally determined that the BW-induced source under these conditions was located in the collision-dominated D region [17]. No matter what altitude the ELF/VLF source region sits at, the BW heating waves could reach the D- and F-regions of the ionosphere, and the heating-induced thermal nonlinearity in the D layer and the ponderomotive force in the F layer both contributed to the BW generation of ELF/VLF waves [18,19,20]. In modulation heating, the received signal is affected by both the modulation frequency and the ionospheric background conditions. Thus, it is necessary to explore the frequency dependencies and ionospheric background conditions in VLF waves generated by the AM and BW approaches.
The ionospheric conditions can affect the quality of the received ELF/VLF signals, and the modulation heating can affect the ionospheric background (e.g., ionosphere temperature). Currently, there is little research on the temperature enhancement caused by modulation heating. An incoherent scattering radar (ISR) can be used to determine the electron temperature and density variations in the ionosphere [21,22]. However, the radar cannot be used to monitor the fast variations in electron temperature during AM or BW heating due to the limitation of ISR temporal resolution. For instance, an ELF wave signal at the excitation frequency of 2 kHz can cause the electron temperature change period of 0.5 ms. The ISR temporal resolution (which is two orders of magnitude larger) is insufficient to measure this cycle. Meanwhile, the radar is not sensitive in the D-region.
In this work, experimental results excited by the AM and BW approaches are analyzed from multi-perspectives based on data from Dynasonde, a magnetometer, SEEs, an ELF/VLF signal receiver, and UHF radar. By analyzing the experimental phenomena, the dependencies on the frequency and ionospheric conditions in ELF/VLF wave generation and the temperature enhancement under modulated heating were investigated.

2. Description of the Experiment

2.1. Experimental Setup

Experiments were performed at 10:28:00–12:28:00 UT on 21 November 2019 using the EISCAT heating facility at Ramfjordmoen near Tromsø, Norway (69.6° N, 19.2° E). Array 2 was selected as the antenna array and was fed by twelve transmitters. The power per transmitter was 80 kW, and the effective radiant power of the heating system reached a total of 160 MW.
Experiments were performed for four cycles by alternately using ordinary polarization (O-mode) and extraordinary polarization (X-mode) heating. Each cycle lasted for 30 min and had three periods, as follows. In the first period, an AM square wave was adopted with a 5 min HF-on and 5 min HF-off pattern. The heating frequency was f0 = 4.04 MHz, and the modulated frequency was 2017 Hz. In the second and third periods for the BW HF heating mode, Array 2 was split into two subarrays consisting of Transmitters 1–6 and 7–12 in the east and west subarrays, respectively. In the second period, with an 8 min HF-on and 2 min HF-off pattern, the east and west subarrays transmitted at frequencies of f1 = f0 and f2 = f0 + ∆f, respectively, where ∆f represents the BW frequency of 2017, 3517, 6517, 8017, 11,017, 15,017, 19,017, or 29,017 Hz. Each BW frequency sweep was performed for 1 min (54 s heater-on and 6 s heater-off). The only difference in the settings between the second and third periods was that the east subarrays transmitted at f1 = f0 + ∆f and the west subarrays transmitted at f2 = f0. The other experimental parameters are presented in Table 1.
Ultra-high frequency (UHF) ISR, Dynasonde, fluxgate magnetometer, ground ELF/VLF signal receiver, and an SEE receiver were used to monitor the ionospheric variations during the experiments. The EISCAT 931 MHz UHF radar was set up in beata mode, which can measure from 79.5 to 694.5 km with a time resolution of 5 s. The Dynasonde located in Tromsø was used to acquire the ionogram at 2 min intervals. A fluxgate magnetometer from the University of Tromsø was used to measure the geomagnetic field changes (http://flux.phys.uit.no/geomag.html accessed on 28 December 2021). The ground ELF/VLF signal receiver (69.7° N, 19.6° E) was placed approximately 15 km east of the heater in Breivikeidet [23]. The ELF/VLF data were collected at a sample frequency of 65,536 Hz. The broadband SEE receiver was located approximately 13 km east–northeast of the heater. This SEE receiver operated at a center frequency of 4.04 MHz and a recording sample rate of 500 kHz. The SEE data collection times were 11:04:18–11:06:57 and 11:10:02–12:28:56.

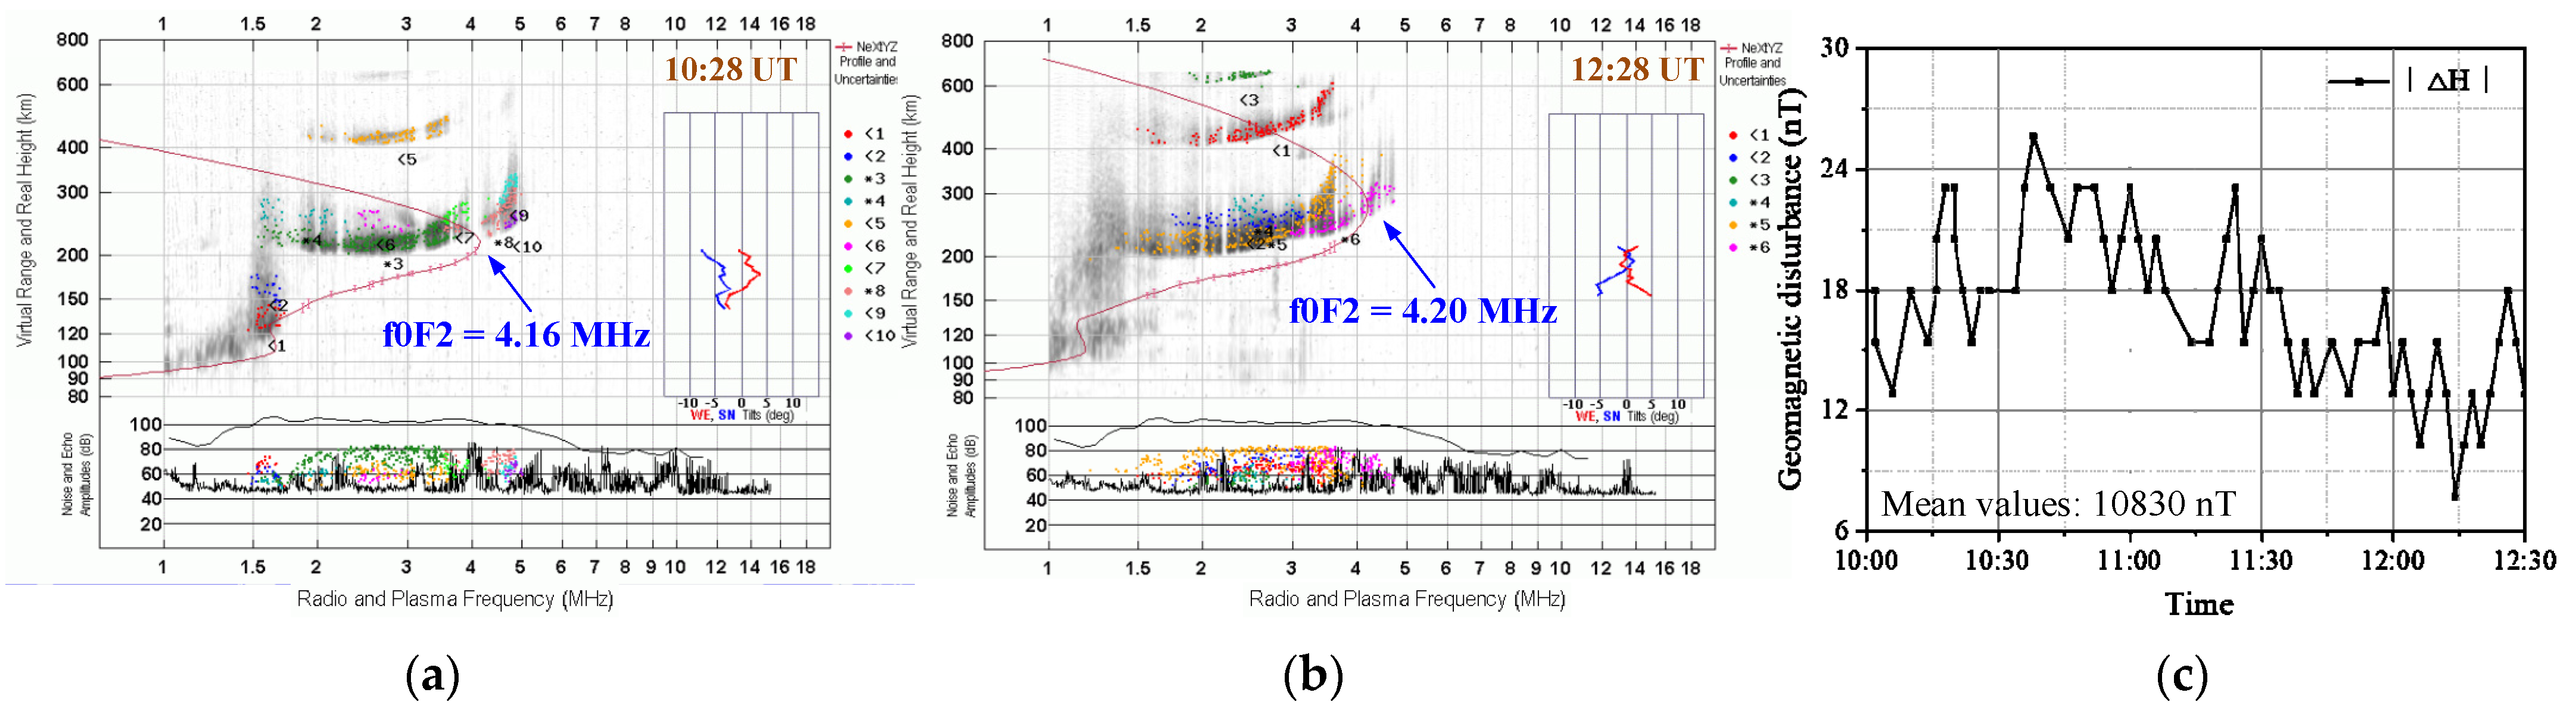
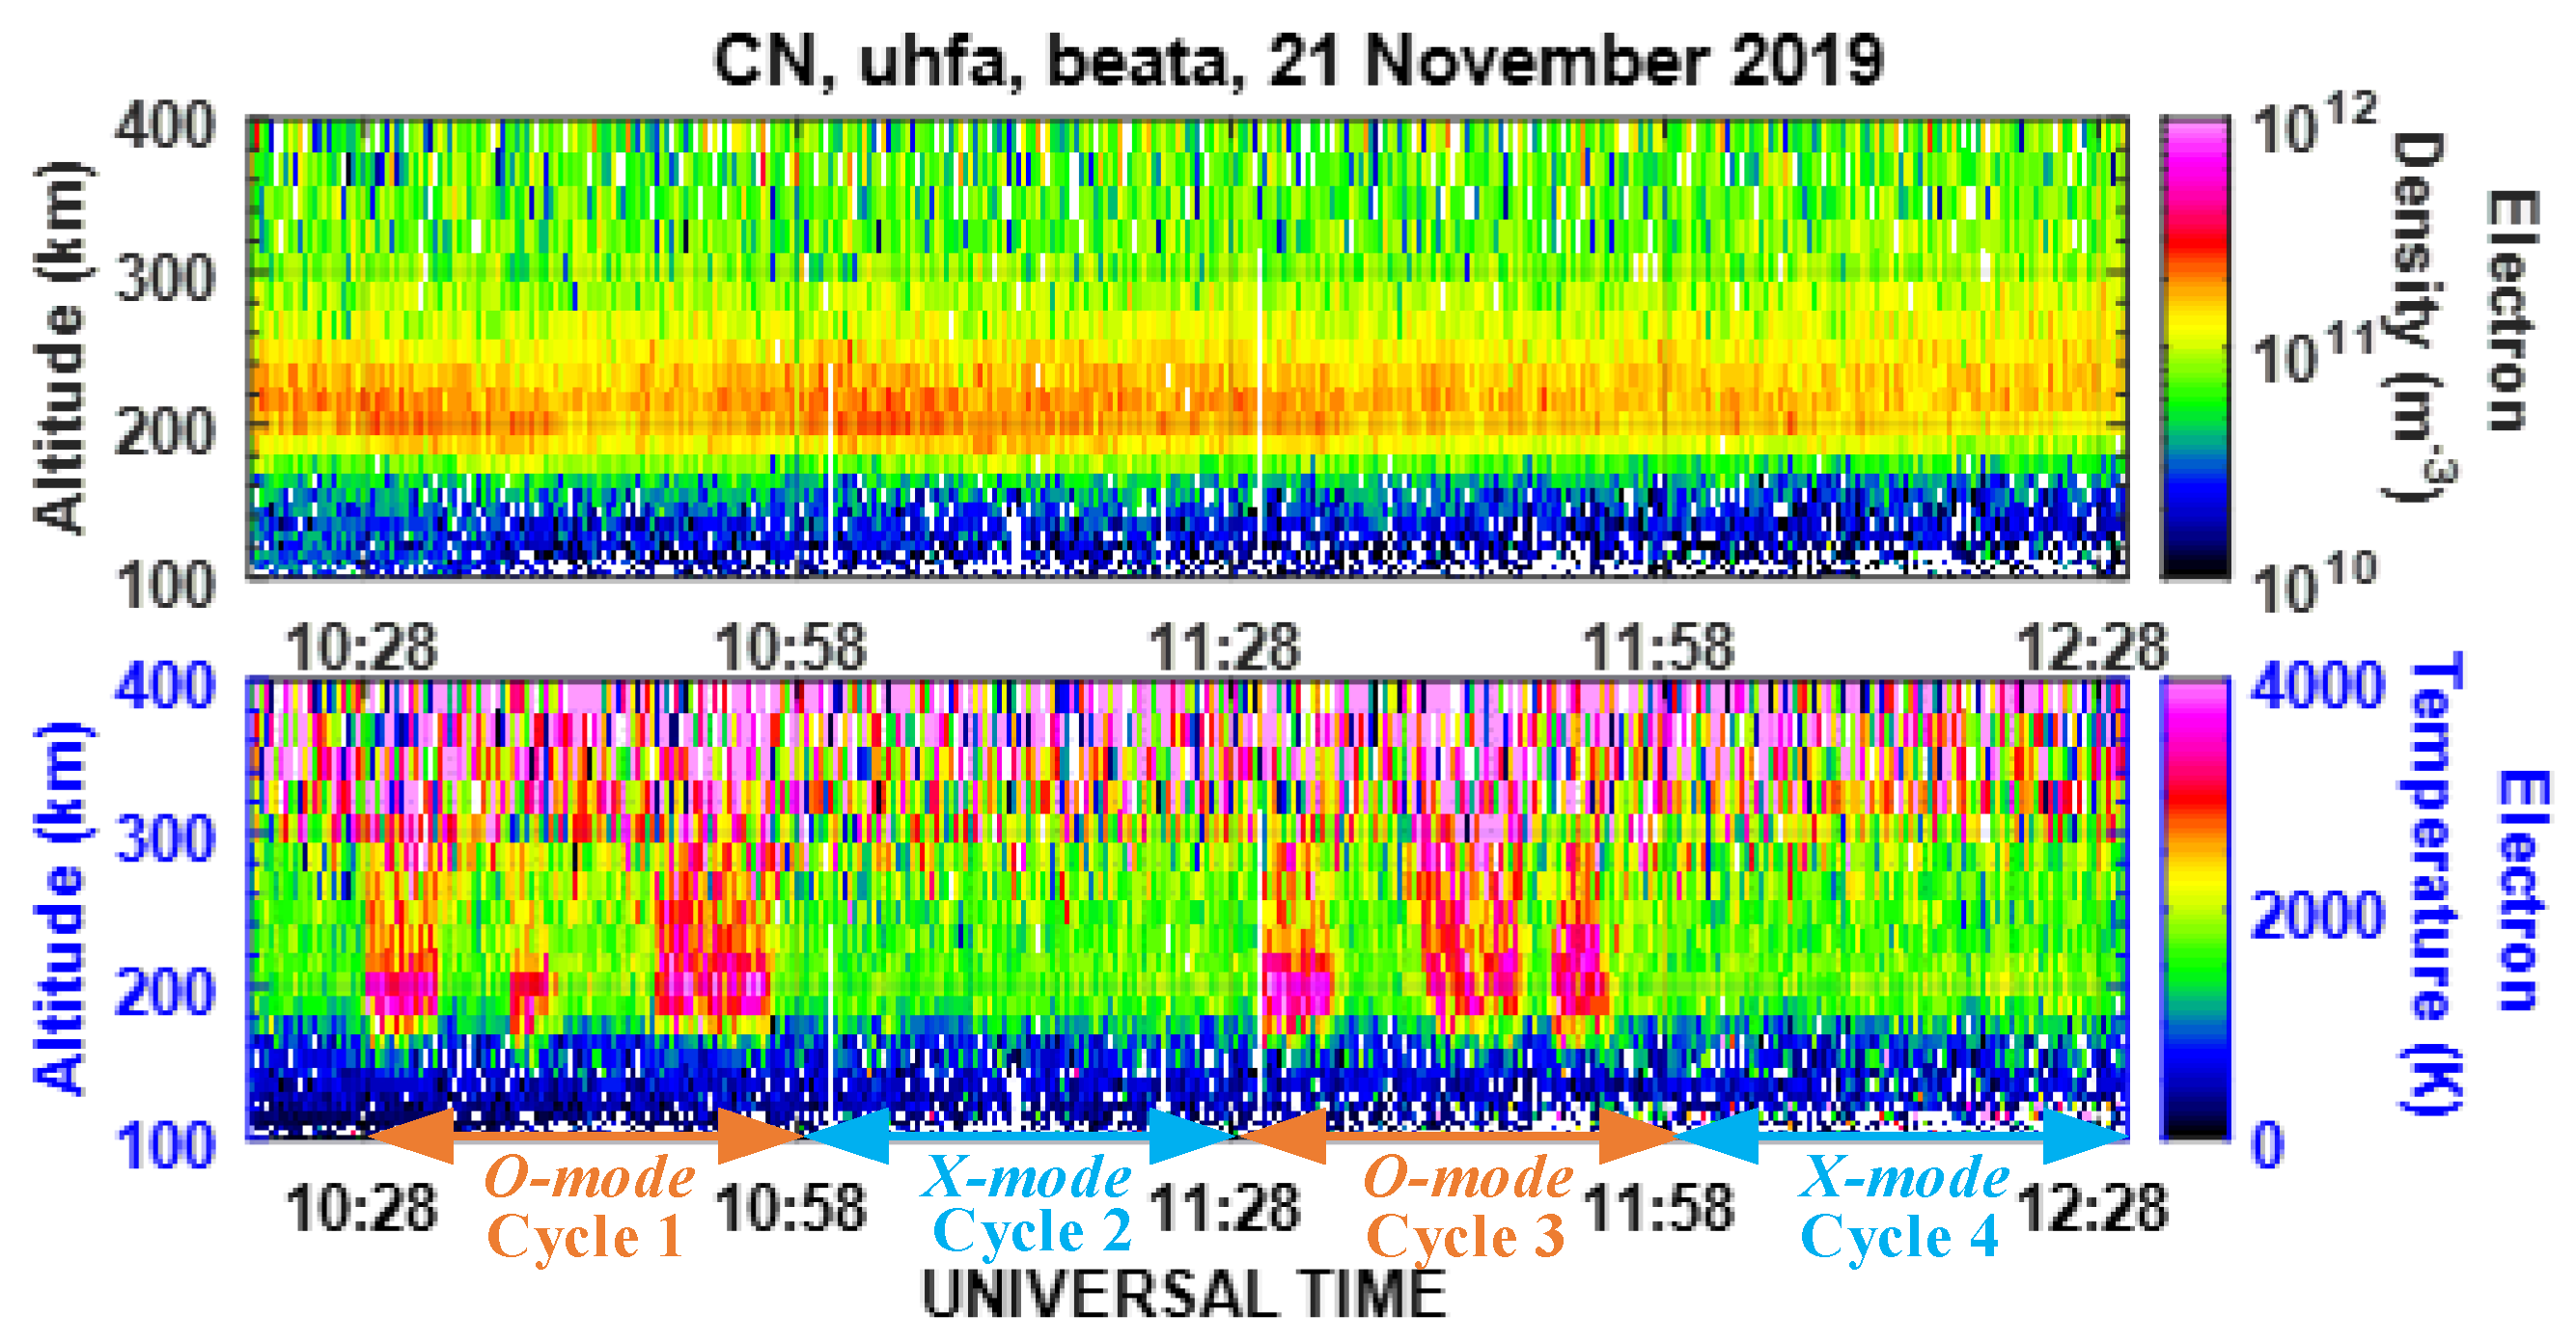
2.2. Ionospheric Background

The ionograms recorded by a Dynasonde located at the EISCAT station are shown in Figure 1. The ionograms at 10:28 and 12:28 are shown in Figure 1a,b, respectively. The critical frequencies (f0F2) of 4.16 MHz and 4.20 MHz at the beginning and end of the experiments are greater than the incident wave frequency of 4.04 MHz, which indicates that the heating experiment was overdense. The O-mode and X-mode reflection heights of 204.44 km and 181.04 km, respectively, at the beginning of the experiment were calculated by the formula given in References [24,25]. The O-mode and X-mode reflection points at the end of the experiments were 231.32 km and 199.31 km, respectively.
The relative variations with time in the horizontal component of the background geomagnetic field (|∆H|) during the experiment are illustrated in Figure 1c. The mean value of the geomagnetic field is 10,830 nT, while the horizontal geomagnetic disturbance is relatively gentle, with a value of approximately 7.69–25.64 nT during the experiments. Hence, the background ionospheric parameters remained relatively stable during the experiments.

3. Results

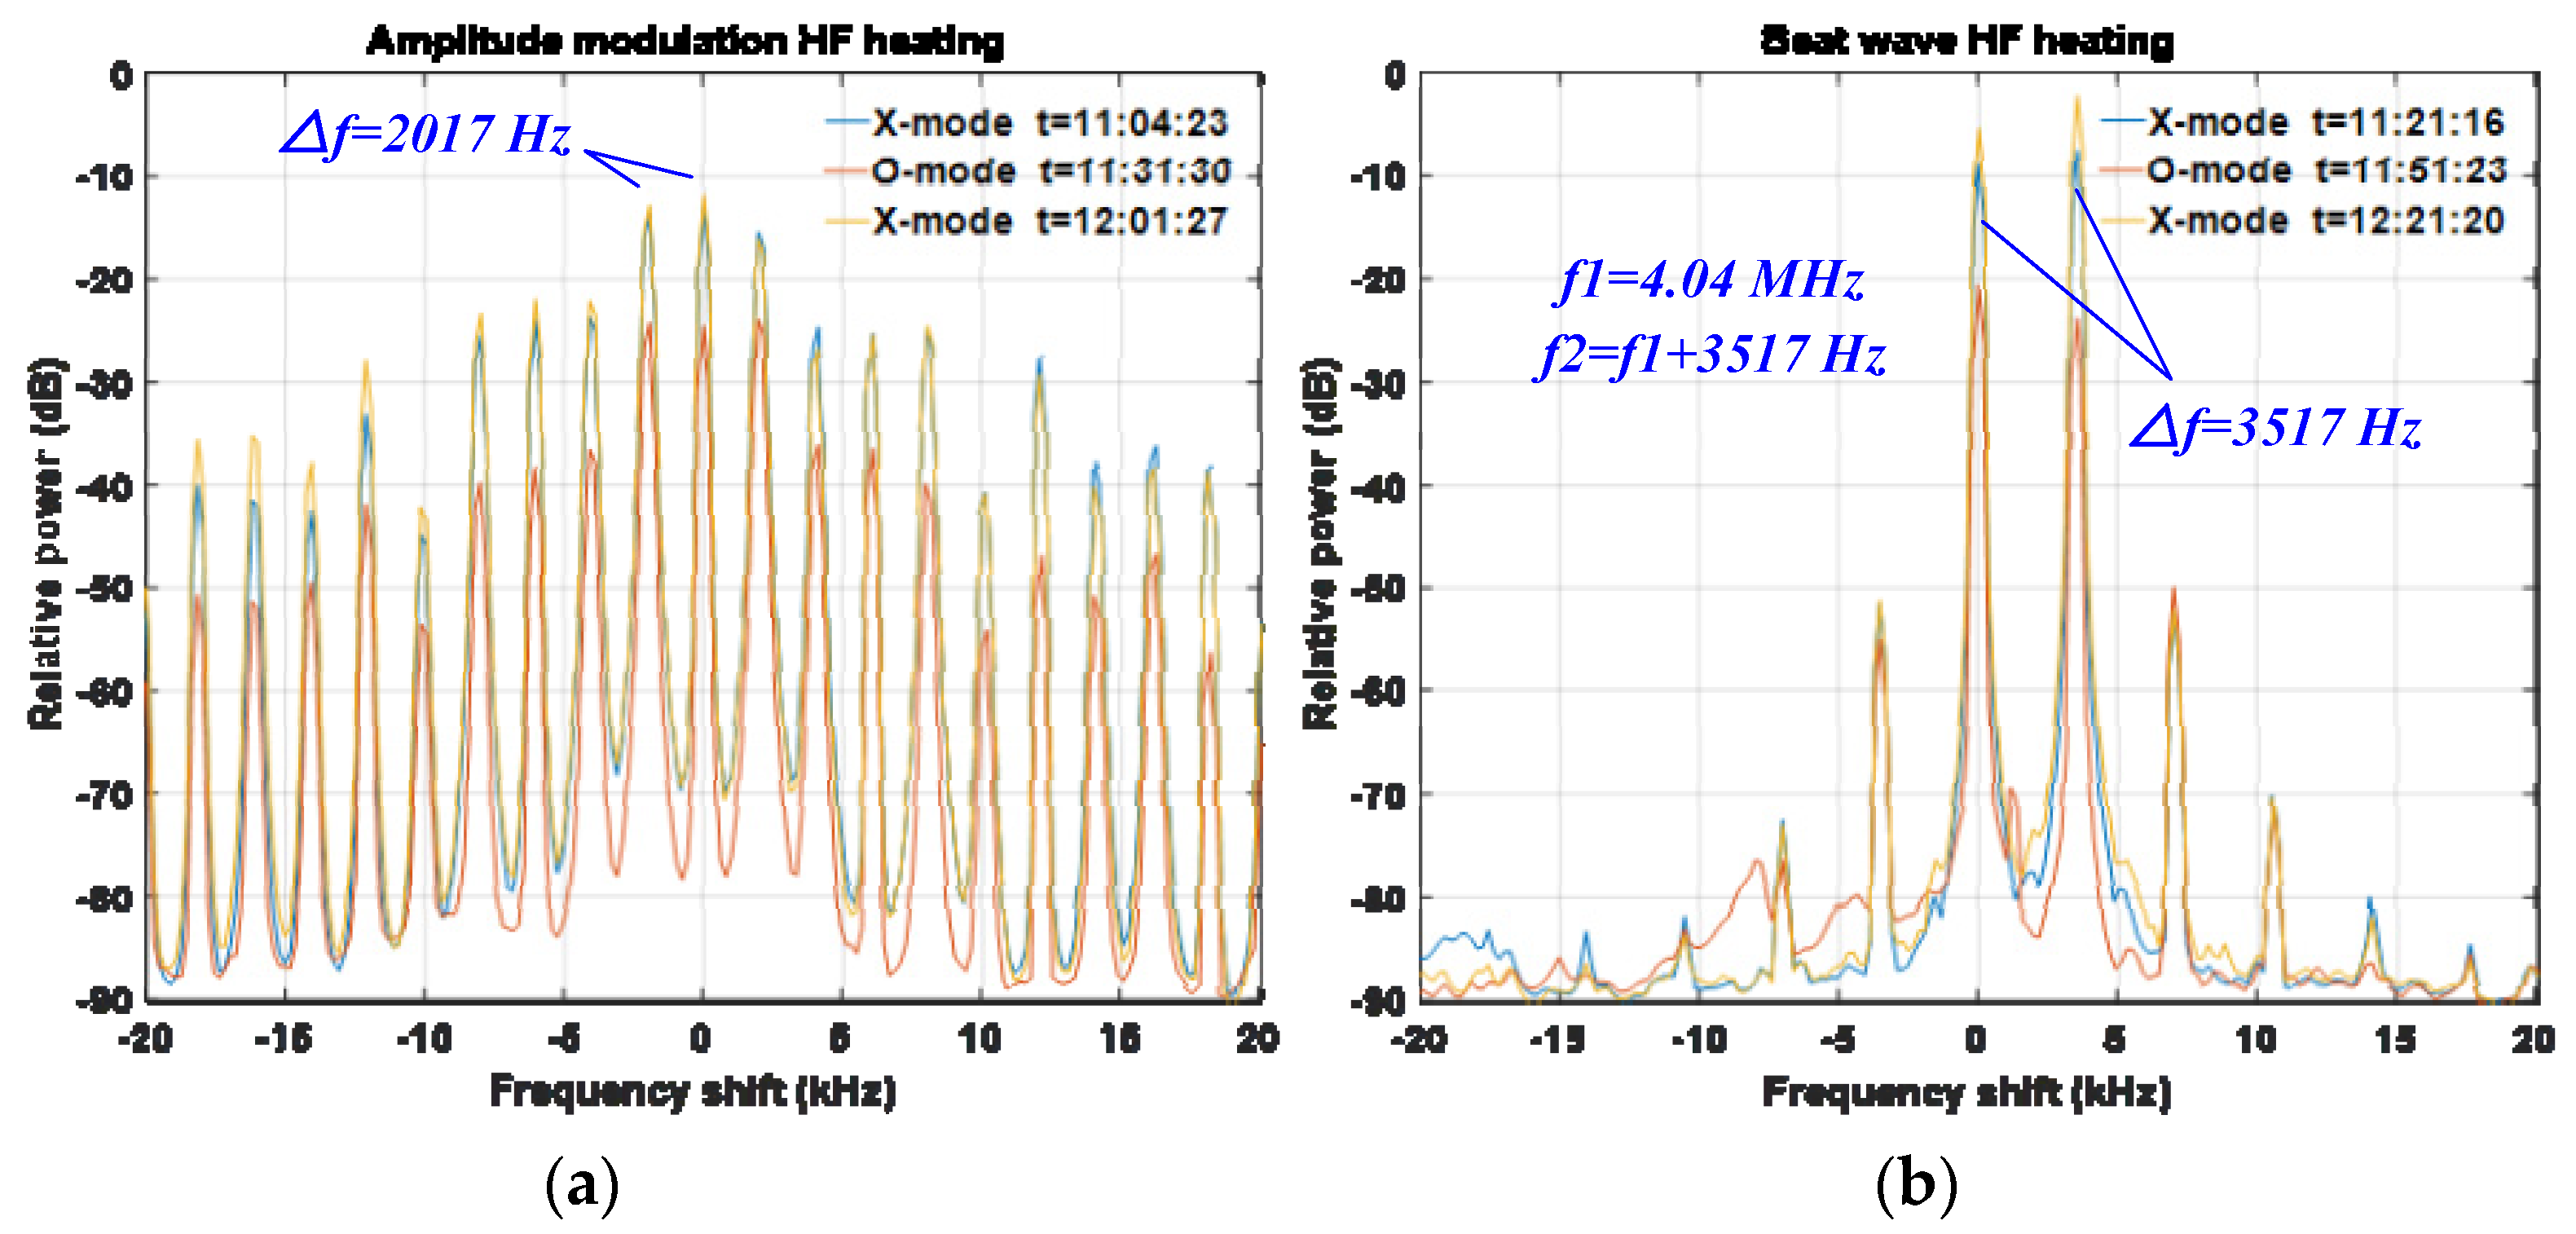
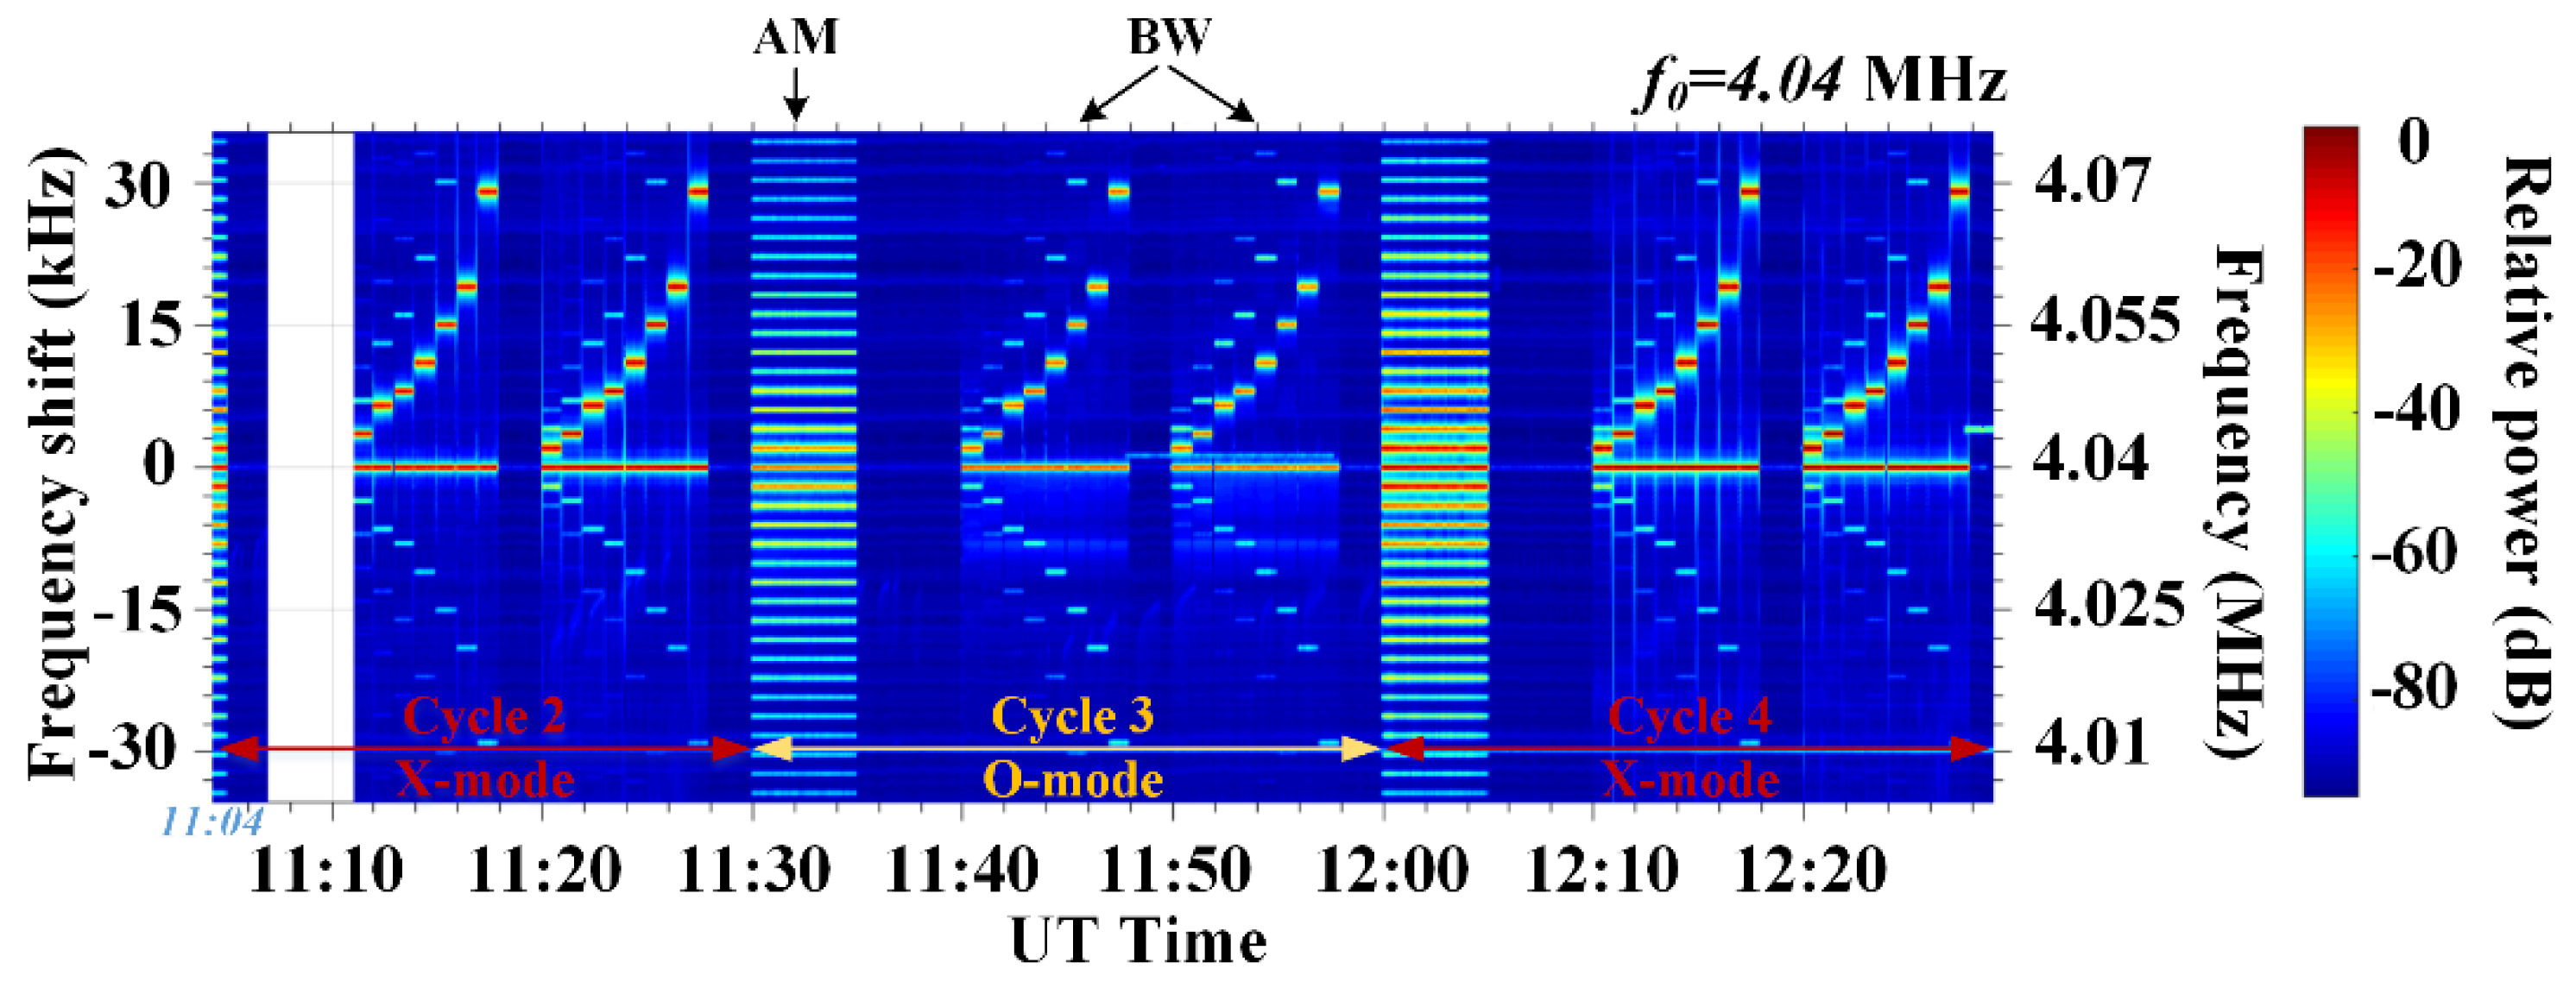
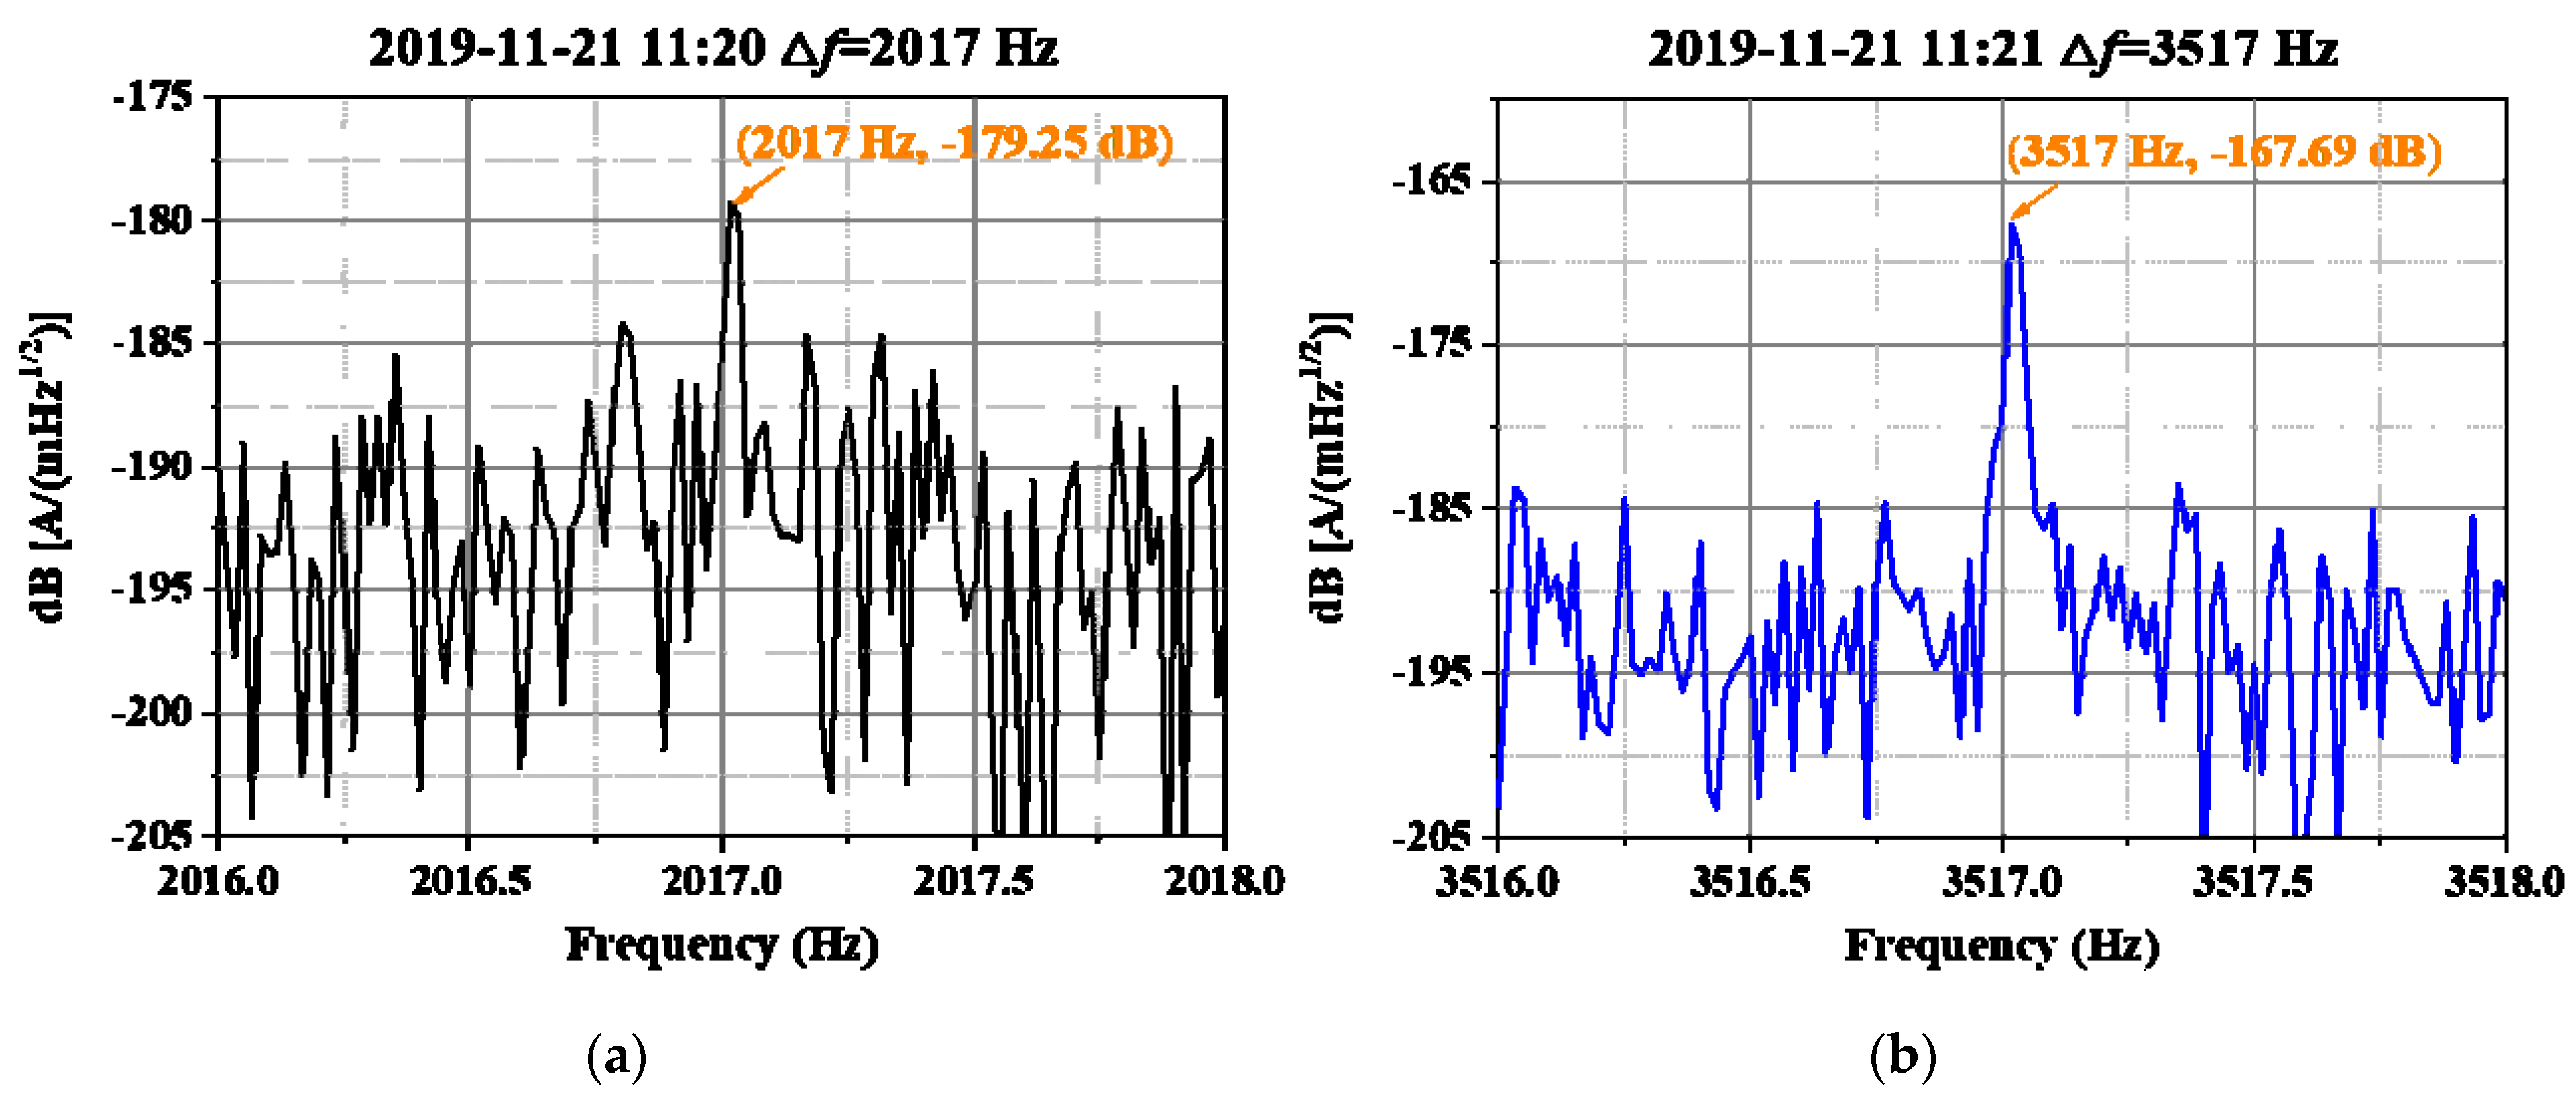
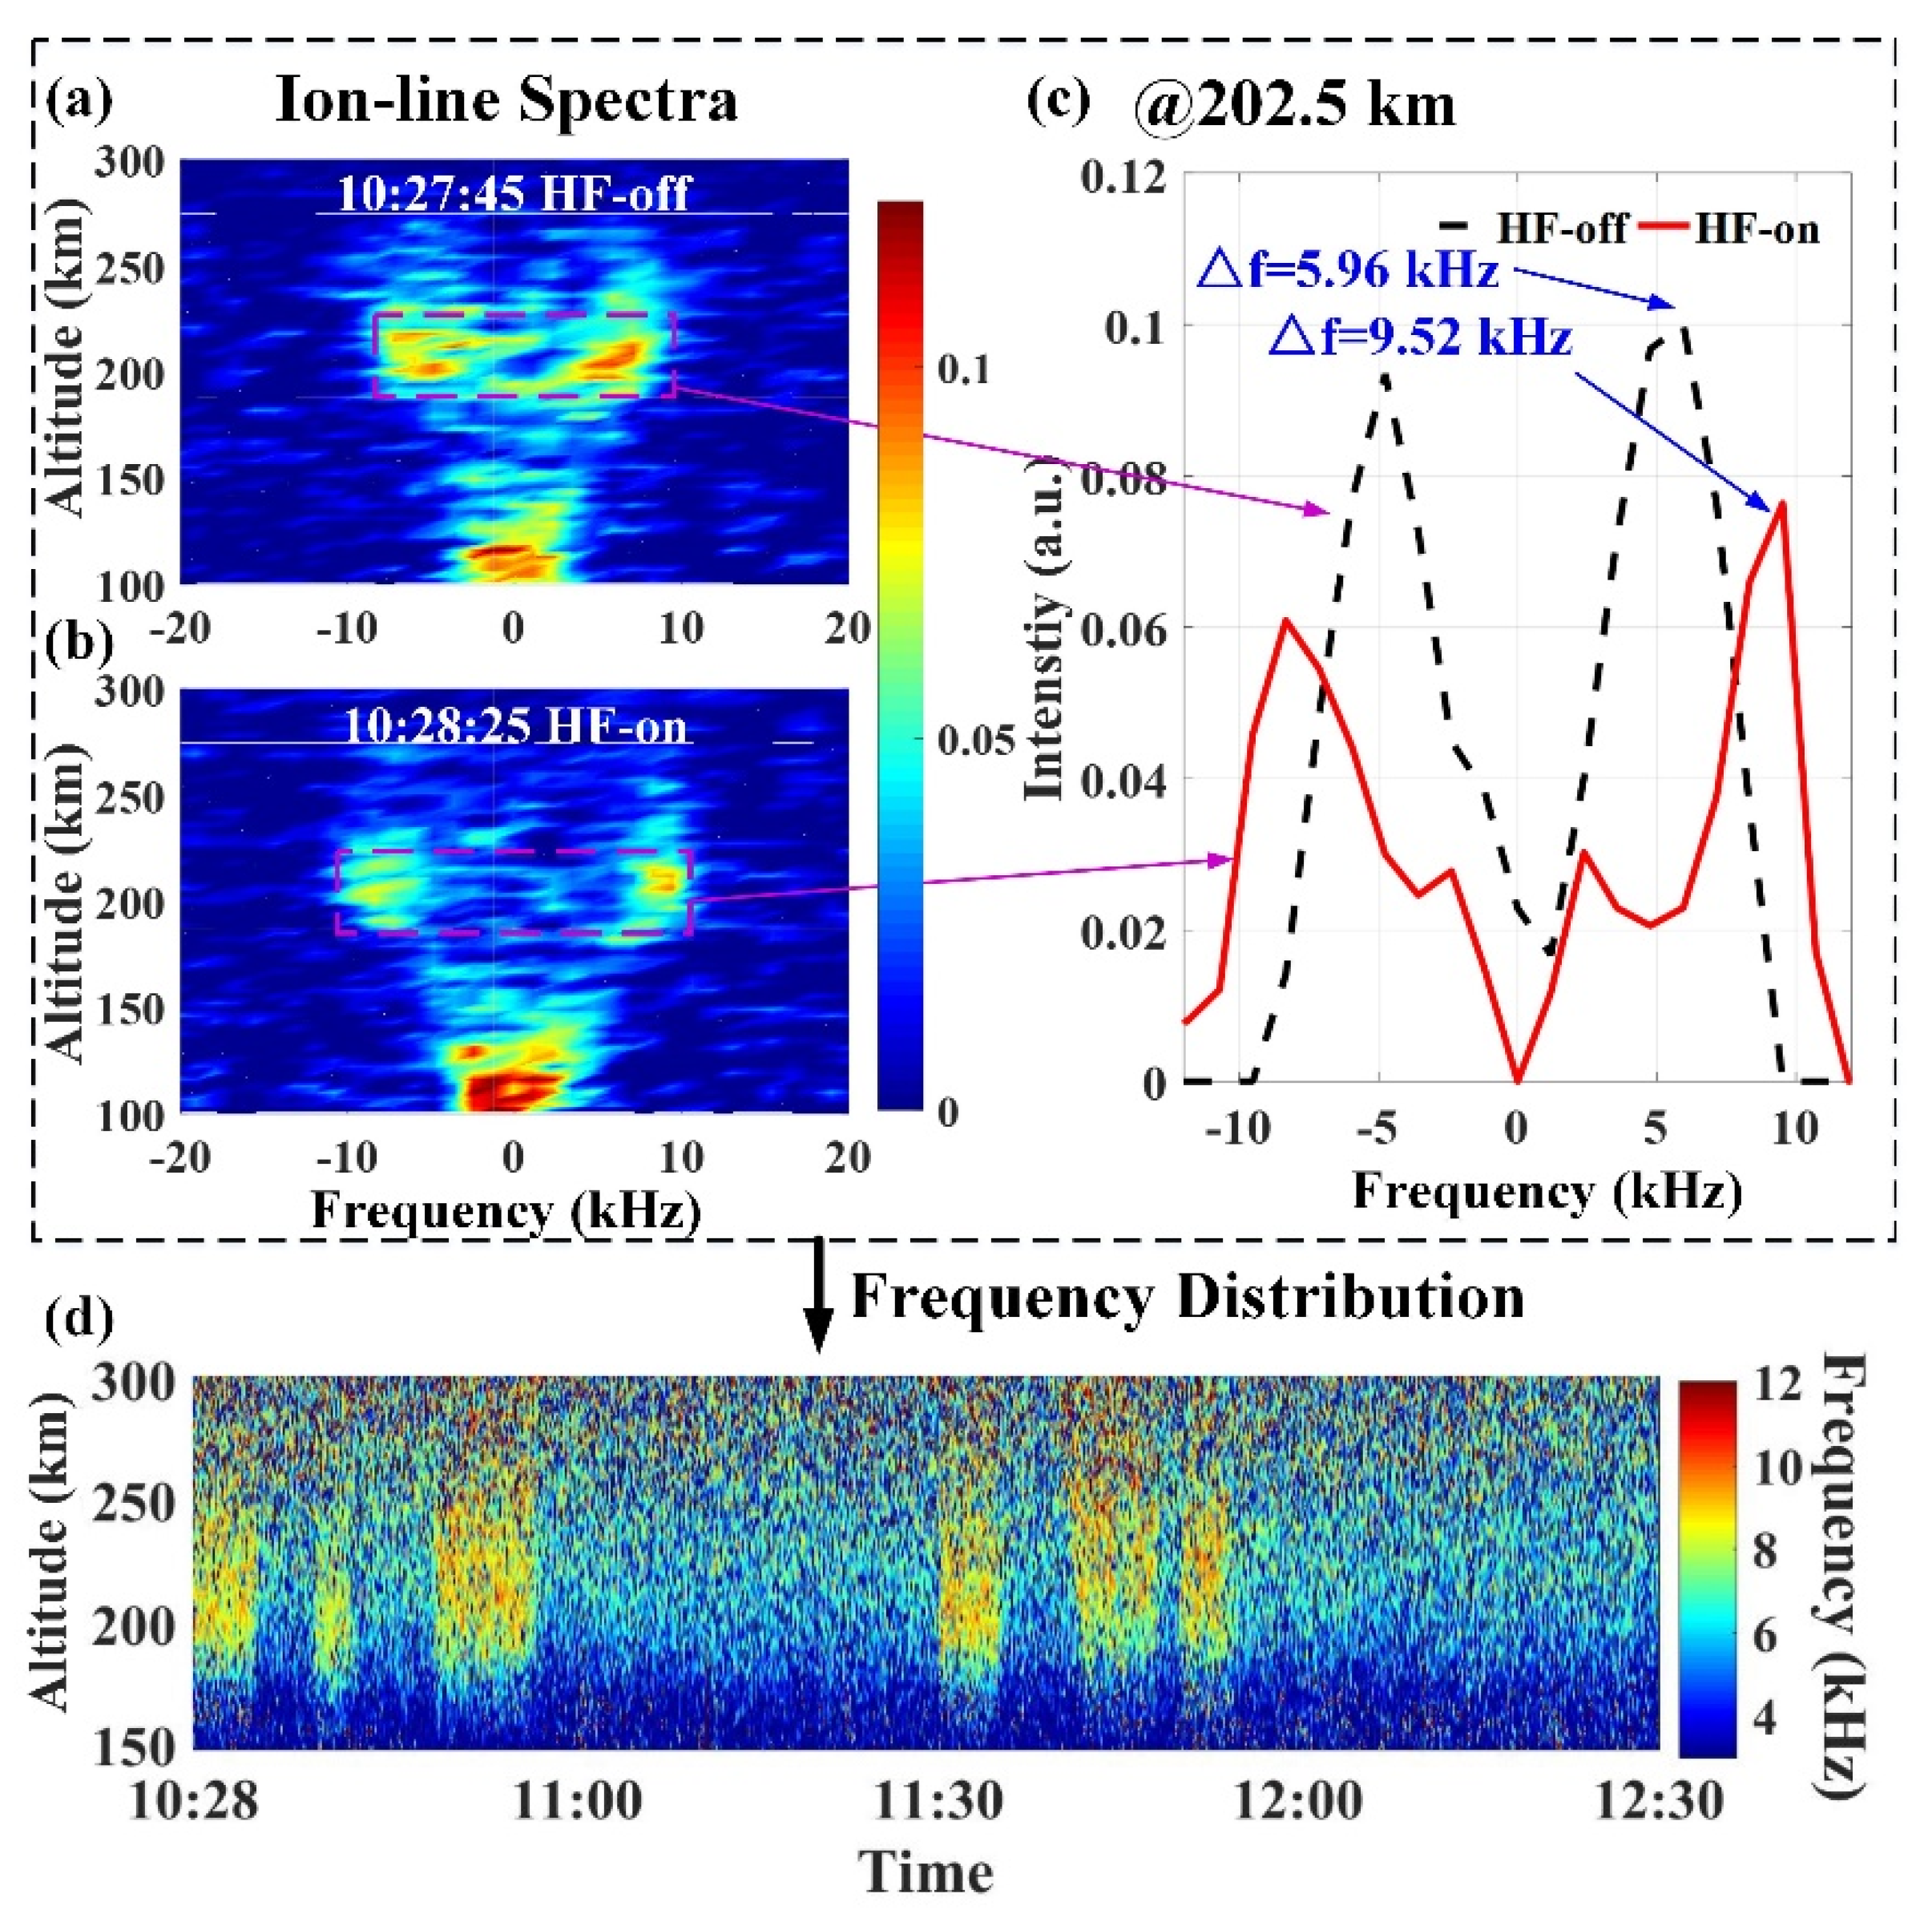
3.1. Verification of Modulation ELF/VLF Frequency

Generally, diagnostic SEE spectra are used to study nonlinear processes in heating experiments. In this experiment, the SEE spectra were used to verify whether the heating wave agreed with the modulation ELF/VLF frequency settings. The diagnostic SEE spectra were collected for the high frequency signals. The waveband with a frequency shift of 0 kHz represents the pump frequency.
The SEE spectra of two characteristic frequency shifts are shown in Figure 2. The relative power was set to 0 dB when the SEE spectra intensity during the experiment was maximum. The frequency shifts from pump wave frequency f0 = 4.04 MHz. For the AM HF heating modulated at 2017 Hz, the frequency differences between bands matched the modulation frequency. For BW heating, the frequency difference was the ELF/VLF difference between the two continuously transmitted HF signals. Regardless of the HF heating polarization mode, these diagnostic SEE spectra were consistent with both the AM and BW modulation.
Owing to technical issues, there were some missing data. Only the SEEs during Cycles 2, 3, and 4 are presented in Figure 3. In conjunction with Figure 2, it is evident that there is a difference between the AM and BW modes. The observed AM modes are shown as stripes, with a frequency step of 2017 Hz corresponding to the AM modulation frequency. The observed BW mode shows a single bright line with a 4.04 MHz center frequency representing the heating frequency of f0 = 4.04 MHz and three harmonic frequency variations with the BW modulation frequency ∆f. Hence, the experimental operation parameters during the AM and BW modulation heating were correct, conforming with the preset modulation frequency.

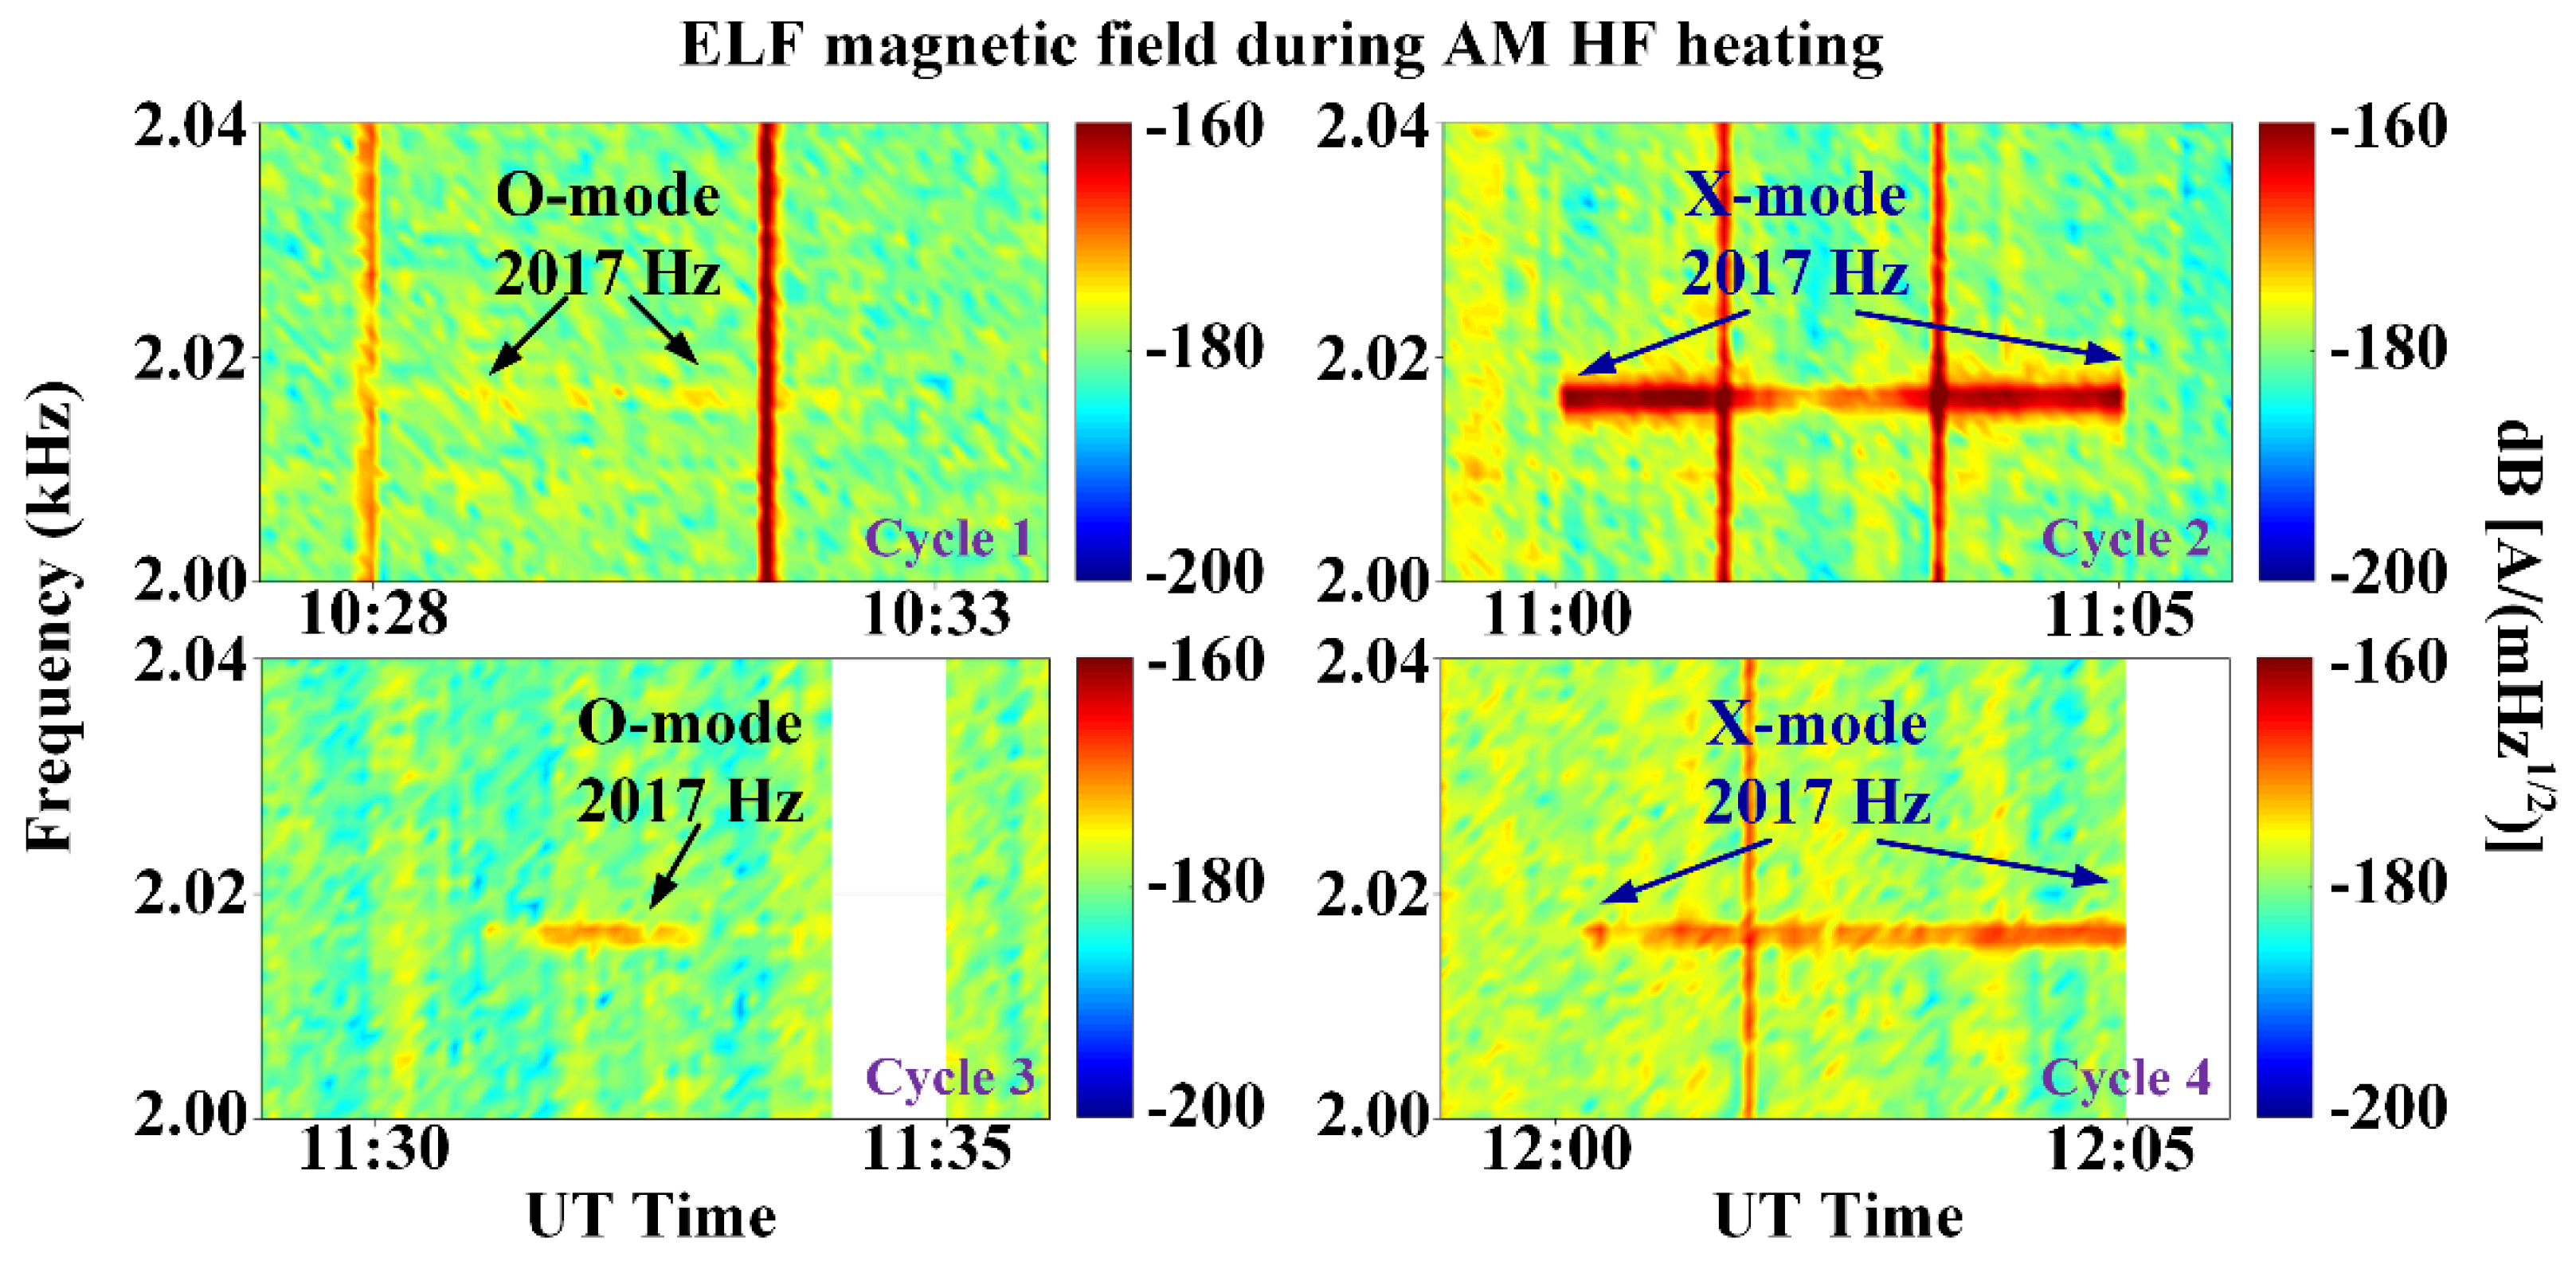
3.2. ELF/VLF Signals Recorded by the Ground-Based Receiver

A ground-based receiver was employed to detect whether these signals were received. Figure 4 illustrates the ELF magnetic field variations in AM HF heating at 2017 Hz. To remove noise, data were averaged over intervals of about 6 s. The unit of the received signal is A/mHz1/2. To distinguish the signal and noise more clearly, the signal intensity is expressed in terms of the logarithmic decibel scale.
Figure 4 shows evidence that the ELF/VLF signals were received during heating by the AM method in each cycle. The maximum values for 2017 Hz in Cycles 1, 2, 3, and 4 are −173.416, −156.25, −167.28, and −164.77 dB, respectively. The ELF magnetic field amplitudes generated by the X-mode are larger than those generated by the O-mode, as shown in Figure 4, which agrees with previous results [10,26].
In the BW modulation mode, the excited ELF/VLF signals were received only under the X-mode wave heating because X mode heaters are more effective for generating the ELF/VLF beat-wave current than O mode heaters [14]. Other experimental observations support the presented observation [27,28,29]. In addition, the signals received during the second period were weaker than those of third period. The excited ELF/VLF electromagnetic wave signals were received at 2017 Hz and 3517 Hz only during the third period under the X-mode wave heating, as shown in Figure 5. The intensity of signals received at 2017 Hz and 3017 Hz were −179.25 dB and −167.69 dB, respectively. In the previous BW modulation heating experiments, the strongest signals of the excited ELF/VLF waves were observed around 8–12 kHz; however, in this experiment, no signal excited in this frequency range was observed through the frequency sweep pattern. The signal with the highest signal/noise ratio was at the 3517 Hz frequency. This trend where the ELF/VLF signal intensity varies with the preset modulation frequency was inconsistent with the results of previous BW modulation heating experiments by Yang and Kuo [14,19,30]. In BW modulation, the received ELF/VLF signals are affected by both the modulation frequency and the ionospheric background conditions. Variations in the ionospheric background may have contributed to this inconsistency. The ionograms show that the critical frequencies were 4.32, 4.256, 4.759, 3.924 and 4.256 MHz at 11:20, 11:22, 11:24, 11:26 and 11:28, respectively. The changes of critical frequencies during the 8 min are obvious. Especially at 11:26, the heating experiment with BW frequency of 19,017 Hz was underdense.

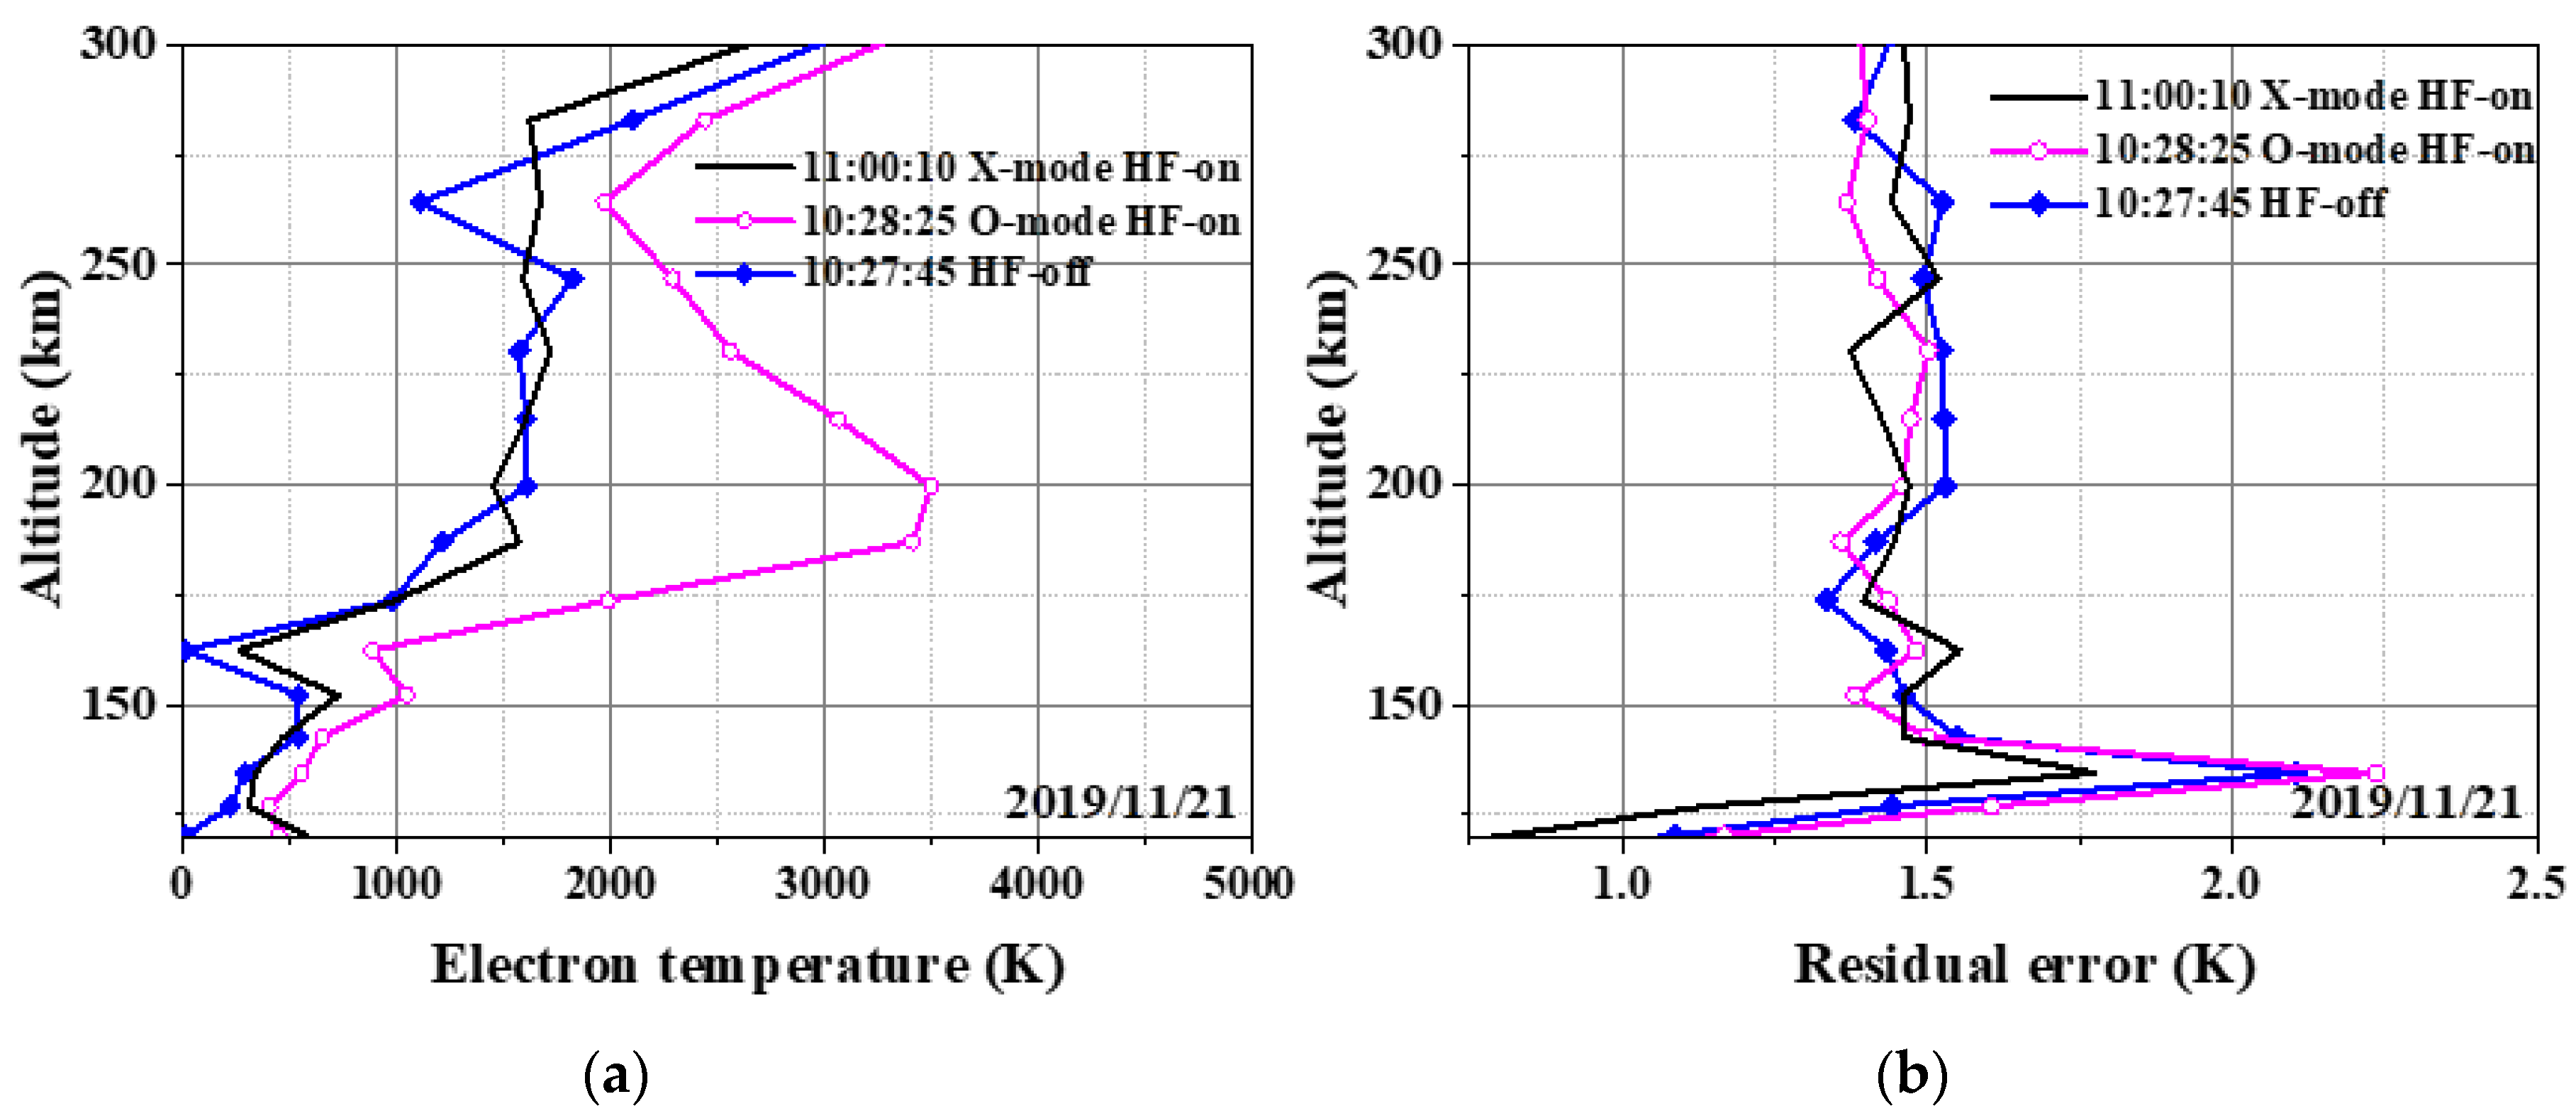
3.3. Electron-Temperature Enhancement

Figure 6 shows the measured results of the ionospheric electron parameters obtained using the UHF radar for AM and BW HF pump-wave heating. The top panel shows that the electron density scarcely changes after heating. The bottom panel shows that while the electron temperature increases in the O mode cycles, it does not react similarly in the X mode cycles.
In the case of the O-mode heating, the electron temperature increases from 1500 to 3000 K in the range of 180 to 260 km for both AM and BW modulation, which is the same as the unmodulated O-wave heating phenomenon. The electron temperature produces oscillatory changes with the generated ELF/VLF waves on the microstructural temporal scales (on the order of millisecond) after the modulated O-wave reaches the F region under the ponderomotive force, resulting in long-term electron temperature enhancement. The diagnosis of the ISR is this large temporal scale electron temperature enhancement. However, the long-term electron temperature enhancement in modulated heating is not easy to observe because it is generally accepted that the electron temperature changes with the generated ELF/VLF waves.
No changes in electron temperature during the X-mode cycles were observed using the UHF ISR; it does not illuminate that modulation heating under X-mode did not produce any effect in the electron temperature in the D/F region. As shown in Figure 4 and Figure 5, the excited ELF/VLF signals were received under the X-mode wave heating for both AM and BW modulation. Thus, it can be deduced that the ELF/VLF source radiating the signals has formed in the ionosphere. The ELF/VLF source can cause electron temperature oscillations. These electron temperature variations are at a small temporal scale and are not observed by the ISR. Based on our experiment, we only can judge the ELF/VLF signal as generated by the BW modulation method with the X-mode, and are unable to judge whether it comes from a source in the D or F region.

4. Discussion

To clearly show the electron-temperature variations, the values with HF-off at 10:27:45, with O-mode HF-on at 10:28:25, and with X-mode HF-on at 11:00:25 were extracted, as shown in Figure 7a. The electron temperature increases to 3502 K from 1654 K at 199.64 km when the O-mode HF pump wave was incident on the ionosphere at 10:28:25, implying that the maximum enhancement was approximately 1.117 times. The maximum electron heating occurs at the upper hybrid resonance region, several kilometers below the O-mode reflection height.
To validate the reliability of the abovementioned data, Figure 7b shows the residual error, indicating the theoretical spectra fitting quality of the data. The residual values of ~1 and ~10 indicate good and unreliable fitting quality, respectively. The results show that the residual errors from 180 km to 250 km at 10:28:25 and 11:00:25 are less than 1.6; this means that the theoretical model of incoherent scattering is suitable for electron-temperature inversion. The electron-temperature enhancements are thus objective and not data processing errors.
After verifying the relative stability of the background ionosphere and effectiveness of ELF/VLF transmission and reception, we wanted to understand why the radar received results from electron-temperature enhancements. Therefore, the ion-line data were extracted from the UHF radar. The ion-line spectral shape is directly related to the ionospheric parameters [31]. For instance, the area of the ion-line spectra is proportional to the electron density.
Figure 8a,b shows the ion-line spectra with the HF pump off and on, respectively. Before the HF transmitter was switched on, there was a typical double-humped spectrum above 150 km, which is attributed to Landau damped ion acoustic fluctuations. There was a double-peak structure with O-mode HF-on as well. The major difference between the heater-off and at heater-on cases is the variation in the resonance frequency from 5.96 kHz to 9.52 kHz, and that the spectra broaden after on the heater is switched on, as seen in Figure 8c. These variations in ion-line spectra are completely different from the enhancement of incoherent scatter spectra caused by parametric instabilities with the heater-on. Because the enhanced ion-line spectra peak caused by the parametric instabilities is a hundred times larger than the normal intensity when the heater is off, the peak position (−5 kHz to 5 kHz) is the ion acoustic wave frequency [32]. In this experiment, the amplitude of ion-line spectra did not change significantly between the heater-on and heater-off cases. Therefore, the variation in the resonance frequency of ion-line spectra can reflect the change of ionospheric parameters.
To acquire the electron-temperature information of the ion-line spectra, the spectral data were processed. This processing included the following stages: extraction between 150 km and 300 km, normalization at the same height, and finding the frequency of the maximum peak position. These frequencies represent the ion resonance frequency. Figure 8d shows the change of resonance ion frequency of the ion-line spectra, which is consistent with the electron temperature variation in Figure 2.
Regardless of whether the modulation mode is AM or BW, when the O-wave heating method is selected the electron temperature will continue to increase in a large range. The electron temperature had insufficient cooling during the modulated heating process and then increased again, resulting in a continuous electron temperature increase. The UHF data time resolution is greater than the electron temperature oscillation change period (corresponding to the ELF/VLF wave radiation period) during the modulation heating process; thus, modulated heating increased the average electron temperature significantly. The diagnostic results show that the amplitude of the electron temperature oscillation change is relatively small using the temporal resolution of the ISR. The results from the ground-based signal receiver (as shown in Figure 4 and Figure 5) show that the excited ELF/VLF signals are weak under the O-mode wave heating; thus, the electrons during modulated O-mode heating do not have enough time to cool down, resulting small-amplitude of electron temperature oscillation, which leads to the weak received ELF/VLF signals. Hence, the amplitude of the electron temperature oscillation change is relatively small, which can explain why the ELF/VLF signal under O-mode heating is relatively weak in the experiment.
The reason the observed electron temperature variation was consistent with the resonance ion frequency of the ion-line spectra may be that the long-lasting temperature enhancement changed the ion composition. The dispersion relationship of the ion acoustic wave is shown in the following formula [33]:
ω 2   = k 2 3 k b T i m i + k 2 k b T e m i   ( 1 + k 2 λ D e 2 )  
With the decrease of ion mass m i , the increase of electron temperature T e , or both, the ion resonance frequency ω will increase. The change in ion composition will have a significant impact on the ion-line spectra. Usually, the enhanced ion line is generated in a region below the O-mode reflection point in the F layer of the ionosphere. The primary ion component at this altitude is O+, followed by NO+ and O2+. If T e increases this could increase the dissociative recombination of molecular NO+ and O2+, which would make the mean ion mass slightly less. With the increase in number density of lower mass ions, the amplitude of the spectra decreases, the width increases, and the corresponding ionic resonance frequency could increase.
Nevertheless, an alternative explanation must be considered as well. Under the influence of the parametric instabilities, the nonlinear absorption in the F-region produced by the O-mode wave is stronger than that of the X-mode wave. It is possible that the X-mode signal does not propagate to F-region altitudes with significant amplitude to produce temperature modulation because it is strongly absorbed at lower altitudes. In this case, the O-mode signal produces strong heating in the F-region, while the X-mode signal does not. More experiments are required to determine whether or not this is the case.

5. Conclusions

In this experiment, multi-source data were used to observe the process of AM and BW modulated heating to generate ELF/VLF waves. First, through the analysis of the ionograms and horizontal component of the background geomagnetic field, it was determined that the ionosphere background was relatively stable during the experiments. Generally, diagnostic SEE spectra are used to study nonlinear processes in heating experiments. In this experiment, they were used to verify whether the modulation parameters were correct. The results showed that the frequency of each modulation was consistent with the experimental setting.
The results of the ground-based ELF/VLF signal receiver show that regardless of the AM or BW modulation approach the ELF/VLF amplitude generated by the X-mode is greater than that of the O-mode, which is consistent with previous results [10,26]. However, in the BW modulation experiment the observed varying of the intensity of the ELF/VLF radiation signal with the modulation frequency is not consistent with previous heating result observations. In the previous BW modulation heating experiments, the strongest excited ELF/VLF waves were observed around 8–12 kHz [14,19,30], while in this experiment no excited signal was observed in this frequency range and the signal with the highest signal/noise ratio was at a frequency of 3517 Hz. In BW modulation, the received ELF/VLF signals are affected by both the modulation frequency and by the ionospheric background conditions. Therefore, factors in the ionospheric conditions that have not yet been considered may have affected the signals of this modulation heating experiment.
By observing the temperature obtained by UHF ISR, it is found that regardless of whether the modulation mode is in AM or BW, when the O-wave is used as the heating wave the electron temperature will continue to increase over a large range, which is observed in unmodulated O-wave heating as well. However, this effect does not often appear in modulation heating, because the UHF data time resolution is greater than the electron temperature oscillation change cycle in the modulated heating process. These phenomena indicate that the electron temperature had insufficient cooling time during the modulated heating process before being heated again, resulting in a small amplitude of electron temperature oscillation; this can explain why the ELF/VLF signal was relatively weak under modulated O-mode heating in this experiment.
The ion-line spectral shape is directly related to the ionospheric parameters. Through the ion-line spectral analysis, it was determined that the variation in the electron temperature was consistent with the resonance ion frequency of the ion-line spectra. The electron temperature T e enhancement was large, and lasted long enough to probably increase the dissociative recombination rates of molecular ions and thus change the ion composition. This might affect the T e estimate which assumes a mean ion mass obtained from the IRI model.
Currently, the altitude of the ELF/VLF source region remains controversial during BW HF heating experiments. This study is limited by the experimental data, and it is not possible to determine whether the ELF/VLF source location is in the F-region or not because the ISR is not sensitive to the D-region and the ISR temporal resolution is insufficient to measure small-scale temporal changes in electron temperature. No matter which altitude the ELF/VLF source region is in, both the heater-induced thermal nonlinearity in the D layer and the modulation ponderomotive force in the F layer contributed to the BW generation of ELF/VLF waves under X-mode heating. However, the change in electron temperature and ion lines in the ionospheric F layer under X-mode heating were not observed on UHF ISR. The specific reasons leading to the above phenomenon require further theoretical and experimental research.

Author Contributions

Conceptualization, J.Y. and J.C.; data processing, J.C. and L.H.; writing—original draft preparation, J.C., S.H. and C.W.; writing—review and editing, J.C., J.Y., B.X., T.X. and H.C.; supervision, Q.L. and Y.Y.; project administration, J.W. All authors have read and agreed to the published version of the manuscript.

Funding

This work was supported by the China Postdoctoral Science Foundation (Grant No. 2020M672307), the Foundation of the National Key Laboratory of the Electromagnetic Environment of China Electronics Technology Group Corporation (Grant No. 202003010) and the National Natural Science Foundation of China (Grant No. 42074225).

Institutional Review Board Statement

Not applicable.

Informed Consent Statement

Not applicable.

Data Availability Statement

Data set available on request to corresponding authors.

Acknowledgments

We are deeply grateful to Michael Rietveld from EISCAT Scientific Association for his selfless help and to the anonymous reviewers for their constructive comments. I would like to thank all who have contributed to this experiment.

Conflicts of Interest

The authors declare no conflict of interest.

References

  1. Streltsov, A.V.; Berthelier, J.J.; Chernyshov, A.A.; Frolov, V.L.; Honary, F.; Kosch, M.J.; McCoy, R.P.; Mishin, E.V.; Rietveld, M.T. Past, present and future of active radio frequency experiments in space. Space Sci. Rev. 2018, 214, 118. [Google Scholar] [CrossRef] [Green Version]
  2. Fu, H.Y.; Jiang, M.L.; Wang, K.N.; Wu, J.; Li, Q.L.; Rietveld, M.T.; Varberg, E.; Häggström, I.; Jin, Y.Q. Electron Temperature Inversion by Stimulated Brillouin Scattering During Electron Gyroharmonic Heating at EISCAT. Geophys. Res. Lett. 2020, 47, e2020GL089747. [Google Scholar] [CrossRef]
  3. Bakhmetieva, N.V.; Kulikov, Y.Y.; Zhemyakov, I.N. Mesosphere Ozone and the Lower Ionosphere under Plasma Disturbance by Powerful High-Frequency Radio Emission. Atmosphere 2020, 11, 1154. [Google Scholar] [CrossRef]
  4. Leyser, T.B. Stimulated electromagnetic emissions by high-frequency electromagnetic pumping of the ionospheric plasma. Space Sci. Rev. 2001, 98, 223–328. [Google Scholar] [CrossRef]
  5. Kosch, M.J.; Pedersen, T.; Rietveld, M.T.; Gustavsson, B.; Grach, S.M.; Hagfors, T. Artificial optical emissions in the high-latitude thermosphere induced by powerful radio waves: An observational review. Adv. Space Res. 2007, 40, 365–376. [Google Scholar] [CrossRef]
  6. Moore, R.C.; Inan, U.S.; Bell, T.F.; Kennedy, E.J. ELF waves generated by modulated HF heating of the auroral electrojet and observed at a ground distance of ∼ 4400 km. J. Geophys. Res. Space Phys. 2007, 112, A05309. [Google Scholar] [CrossRef] [Green Version]
  7. Lu, H.; Yang, J.T.; Li, Q.L.; Hao, S.J.; Guo, F.; Wu, J.; Chen, J.; Ma, G.L.; Xu, T. ELF/VLF Communication Experiment by Modulated Heating of Ionospheric Auroral Electrojet at EISCAT. IEEE Trans. Antennas Propag. 2020, 69, 2267–2273. [Google Scholar] [CrossRef]
  8. Barr, R.; Stubbe, P. ELF and VLF wave generation by HF heating: A comparison of AM and CW techniques. J. Atmos. Sol.-Terr. Phys. 1997, 59, 2265–2279. [Google Scholar] [CrossRef]
  9. Papadopoulos, K.; Wallace, T.; McCarrick, M.; Milikh, G.M.; Yang, X. On the efficiency of ELF / VLF generation using HF heating of the auroral electrojet. Plasma Phys. Rep. 2003, 29, 561–565. [Google Scholar] [CrossRef]
  10. Kuo, S.P.; Lee, S.H.; Bivolaru, D.; Kossey, P.; Lee, M.C.; Riddolls, R.J.; Jastrzebski, P.; Sentman, D. Experimental and numerical studies on ELF / VLF wave generation by amplitude-modulated HF heating waves. Phys. Scr. 2003, 67, 448. [Google Scholar] [CrossRef]
  11. Tereshchenko, E.D.; Shumilov, O.I.; Kasatkina, E.A.; Gomonov, A.D. Features of amplitude and Doppler frequency variation of ELF/VLF waves generated by “beat-wave” HF heating at high latitudes. Geophys. Res. Lett. 2014, 41, 4442–4448. [Google Scholar] [CrossRef]
  12. Ma, G.L.; Guo, L.X.; Yang, J.T.; Lv, L.L.; Chen, J.; Xu, T.; Hao, S.J.; Wu, J. Effects of variations of geomagnetic field on VLF waves induced by beating of two HF waves. Adv. Space Res. 2019, 63, 2126–2131. [Google Scholar] [CrossRef]
  13. Kuo, S.; Snyder, A.; Kossey, P.; Chang, C.L.; Labenski, J. VLF wave generation by beating of two HF waves in the ionosphere. Geophys. Res. Lett. 2011, 38. [Google Scholar] [CrossRef]
  14. Kuo, S.; Snyder, A.; Kossey, P.; Chang, C.L.; Labenski, J. Beating HF waves to generate VLF waves in the ionosphere. J. Geophys. Res. Space Phys. 2012, 117, L10608. [Google Scholar] [CrossRef]
  15. Kuo, S.P.; Lee, M.C. On the VLF wave generation by beating of two HF heaters. Phys. Plasmas 2017, 24, 022902. [Google Scholar] [CrossRef]
  16. Cohen, M.B.; Moore, R.C.; Golkowski, M.; Lehtinen, N.G. ELF/VLF wave generation from the beating of two HF ionospheric heating sources. J. Geophys. Res. Space Phys. 2012, 117, A12310. [Google Scholar] [CrossRef]
  17. Moore, R.C.; Fujimaru, S.; Cohen, M.; Gołkowski, M.; McCarrick, M.J. On the altitude of the ELF / VLF source region generated during “beat-wave” HF heating experiments. Geophys. Res. Lett. 2012, 39, L18101. [Google Scholar] [CrossRef]
  18. Guo, Z.; Fang, H.; Honary, F. The Generation of ULF/ELF/VLF Waves in the Ionosphere by Modulated Heating. Universe 2021, 7, 29. [Google Scholar] [CrossRef]
  19. Yang, J.T.; Li, Q.L.; Wang, J.G.; Hao, S.J.; Ma, G.L. The polarization characteristics of ELF / VLF waves generated via HF heating experiments of the ionosphere by EISCAT. Phys. Plasmas 2018, 25, 092902. [Google Scholar] [CrossRef]
  20. Yang, J.T.; Wang, J.G.; Li, Q.L.; Wu, J.; Che, H.Q.; Ma, G.L.; Hao, S.J. Experimental comparisons between AM and BW modulation heating excitation of ELF / VLF waves at EISCAT. Phys. Plasmas 2019, 26, 082901. [Google Scholar] [CrossRef]
  21. Rietveld, M.T.; Kohl, H.; Kopka, H.; Stubbe, P. Introduction to ionospheric heating at Tromsø—I. Experimental overview. J. Atmos. Terr. Phys. 1993, 55, 577–599. [Google Scholar] [CrossRef]
  22. Akbari, H.; Bhatt, A.; La Hoz, C.; Semeter, J.L. Incoherent scatter plasma lines: Observations and applications. Space Sci. Rev. 2017, 212, 249–294. [Google Scholar] [CrossRef]
  23. Yang, J.T.; Li, Q.L.; Lu, H.; Che, H.Q.; Hao, S.J.; Guo, F.; Wu, J.; Lyu, L.B.; Chen, J.; Ma, G.L.; et al. CSES observations of ELF wave radiation excited by the EISCAT heater. Phys. Plasmas 2020, 27, 122903. [Google Scholar] [CrossRef]
  24. Ginzburg, V.L. The Propagation of Electromagnetic Waves in Plasmas; Pergamon Press: Oxford, UK, 1970. [Google Scholar]
  25. Wang, X.; Zhou, C. Aspect dependence of Langmuir parametric instability excitation observed by EISCAT. Geophys. Res. Lett. 2017, 44, 9124–9133. [Google Scholar] [CrossRef]
  26. Villaseñor, J.; Wong, A.Y.; Song, B.; Pau, J.; McCarrick, M.; Sentman, D. Comparison of ELF/VLF generation modes in the ionosphere by the HIPAS heater array. Radio Sci. 1996, 31, 211–226. [Google Scholar] [CrossRef]
  27. Stubbe, P.; Kopka, H.; Rietveld, M.T.; Dowden, R.L. ELF and VLF wave generation by modulated HF heating of the current carrying lower ionosphere. J. Atmos. Terr. Phys. 1982, 44, 1123–1135. [Google Scholar] [CrossRef]
  28. Barr, R.; Stubbe, P.; Rietveld, M.T. ELF wave generation in the ionosphere using pulse modulated HF heating: Initial tests of a technique for increasing ELF wave generation efficiency. Ann. Geophys. 1999, 17, 759–769. [Google Scholar] [CrossRef]
  29. James, H.G.; Dowden, R.L.; Rietveld, M.T.; Stubbe, P.; Kopka, H. Simultaneous observations of ELF waves from an artificially modulated auroral electrojet in space and on the ground. J. Geophys. Res. Space Phys. 1984, 89, 1655–1666. [Google Scholar] [CrossRef]
  30. Kuo, S.P.; Snyder, A.; Chang, C.L. Electrojet-independent ionospheric extremely low frequency/very low frequency wave generation by powerful high frequency waves. Phys. Plasmas 2010, 17, 082904. [Google Scholar] [CrossRef]
  31. Evans, J.V. Theory and practice of ionosphere study by Thomson scatter radar. Proc. IEEE 1969, 57, 496–530. [Google Scholar] [CrossRef] [Green Version]
  32. Cheng, M.S.; Xu, B.; Wu, Z.S.; Li, H.Y.; Wang, Z.; Xu, Z.W.; Wu, J.; Wu, J. Observation of VHF incoherent scatter spectra disturbed by HF heating. J. Atmos. Sol. Terr. Phys. 2013, 105, 245–252. [Google Scholar] [CrossRef]
  33. Chen, F.F. Introduction to Plasma Physics and Controlled Fusion; Plenum Press: New York, NY, USA, 1984; pp. 82–94. [Google Scholar]
Figure 1. Results of the Dynasonde at (a) 10:28 and (b) 12:28; (c) relative disturbance of the horizontal geomagnetic field during the ELF/VLF ionospheric modification experiments.
Atmosphere 13 00228 g001
Figure 2. SEE frequency spectra of HF scattered signals from the EISCAT HF transmitter. The center frequency is 4.04 MHz. (a) Amplitude modulation approach; (b) Beat-wave modulation approach.
Atmosphere 13 00228 g002
Figure 3. Variations of the SEE spectral structure where the frequency shifts from center frequency f0 = 4.04 MHz.
Atmosphere 13 00228 g003
Figure 4. Spectrogram of the ELF magnetic field received by the ground receiver in AM HF heating.
Atmosphere 13 00228 g004
Figure 5. Amplitudes of the north–south magnetic field generated by the BW X-mode modulation heating for (a) 2017 Hz and (b) 3517 Hz.
Atmosphere 13 00228 g005
Figure 6. Electron density and temperature obtained using the EISCAT UHF radar for AM and BW modulation heating.
Atmosphere 13 00228 g006
Figure 7. Electron temperature profiles and residual errors with HF-off at 10:27:45, with O-mode HF-on at 10:28:25, with and X-mode HF-on at 11:00:25.
Atmosphere 13 00228 g007
Figure 8. (a,b) show the ion-line spectra with the HF-pump off and on, respectively. The x-axis represents the Doppler frequency and the y-axis represents altitude, with the pseudocolors corresponding to the echo power amplitude. (c) depicts the ion lines with the HF-pump off and on at 202.50 km in the maximum electron heating region. (d) presents the frequency distribution of the ion-line maximum intensity.
Atmosphere 13 00228 g008
Table 1. Heating schedule on 21 November 2019.
Modulation Cycle 1
O-Mode
Cycle 2
X-Mode
Cycle 3
O-Mode
Cycle 4
X-Mode
AM 1HF-on (5 min)10:28–10:3311:00–11:0511:30–11:3512:00–12:05
HF-off (5 min)10:33–10:3811:05–11:1011:35–11:4012:05–12:10
BW 2HF-on (8 min)10:38–10:4611:10–11:1811:40–11:4812:10–12:18
(f1 < f2)HF-off (2 min)10:46–10:4811:18–11:2011:48–11:5012:18–12:20
BWHF-on (8 min)10:48–10:5611:20–11:2811:50–11:5812:20–12:28
(f1 > f2)HF-off (2 min)10:56–10:5811:28–11:3011:58–12:00
1 Amplitude modulation (AM). 2 Beat-wave (BW).
Publisher’s Note: MDPI stays neutral with regard to jurisdictional claims in published maps and institutional affiliations.

