Comparative Life Cycle Environmental Impact Analysis of Lithium-Ion (LiIo) and Nickel-Metal Hydride (NiMH) Batteries


School of Engineering, Macquarie University, Sydney, NSW 2109, Australia
*
Author to whom correspondence should be addressed.
Batteries 2019, 5(1), 22; https://doi.org/10.3390/batteries5010022
Submission received: 31 December 2018
/
Revised: 30 January 2019
/
Accepted: 13 February 2019
/
Published: 18 February 2019
Abstract
:Batteries have been extensively used in many applications; however, very little is explored regarding the possible environmental impacts for their whole life cycle, even though a lot of studies have been carried out for augmenting performance in many ways. This research paper addresses the environmental effects of two different types of batteries, lithium-ion (LiIo) and nickel-metal hydride (NiMH) batteries, in terms of their chemical constituents. Life cycle impact analysis has been carried out by the CML, ReCiPe, EcoPoints 97, IPCC, and CED methods. The impacts are considered in categories such as global warming, eutrophication, freshwater aquatic ecotoxicity, human toxicity, marine aquatic ecotoxicity and terrestrial ecotoxicity. The results reveal that there is a significant environmental impact caused by nickel-metal hydride batteries in comparison with lithium-ion batteries. The reason behind these impacts is the relatively large amount of toxic chemical elements which are present as constituents of NiMH batteries. It can be anticipated that a better environmental performance can be achieved through optimization, especially by cautiously picking the constituents, taking into account the toxicity aspects, and by minimizing the impacts related to these chemicals.
1. Introduction
Batteries are important to run the modern world, providing energy for sectors and products from large-scale industries, to electric vehicles, to the smallest electronic items. They are a ubiquitous backup to retain an uninterrupted supply of power. Batteries can be classified as non-rechargeable primary batteries or rechargeable secondary batteries. Lithium-Ion (LiIo) and Nickel-Metal Hydride (NiMH) are popular rechargeable batteries among many more. Nowadays, the use of rechargeable batteries has increased due to the more popular portable electronics and sensors such as mobile phones, cameras, electric vehicles etc. Moreover, the Internet-of-Things (IoT) relies mostly on batteries for autonomous power supplies. Thus, the total power capacity of batteries was 800 MW in 2014, which has increased to more than double (1720 MW) within two years (2016), and it is likely to go up to 4000 MW by 2022 [1,2]. The increased usage implies an expansion of end-of-life disposal of the exhausted batteries. These batteries contain cadmium, lead, mercury, copper, zinc, manganese, lithium, or potassium, which are extremely hazardous to the environment regarding toxicity and human health effects. These chemicals are unhygienic and can affect the environment severely. Therefore, it is essential to quantify the possible environmental impacts for the whole life cycle of LiIo and NiMH batteries to save the environment and to guide policymakers or researchers.
The lifecycle assessment of environmental hazards from LiIo and NiMH batteries is not an easy task as it considers effects from the raw-material extraction to battery manufacturing, to end-of-life recycling of batteries. It is necessary to do a vast literature review on the life cycle of LiIo and NiMH batteries to find out the dangerous emissions over their entire life. The identification and estimation of various kinds of releases to air and land for various constituents and energy consumptions during the batteries’ lifetime is critical. Moreover, It is necessary to use appropriate state-of-the-art methods for calculating and comparing the effects.
Lifecycle assessment (LCA) is a very practical approach to assess the impacts of any item, unit or system as it quantifies the effects for a wide range of environmental indicators such as global warming, human toxicity, marine aquatic ecotoxicity, eutrophication, and acidification. The LCA approach considers the inputs and outputs, material flows, and emissions at each stage of a product [3,4,5]. It also analyzes the lifetime of a product, from raw-material extraction to manufacturing, usage and end-of-life waste disposal [6,7,8].
Prior research on life cycle assessments of lithium-ion batteries by Liang et al. [9] showed that there is a significant amount of greenhouse-gas emissions in battery production and disposal. They have estimated the carbon footprint of three different lithium-ion batteries quantitatively. However, they have not considered the regional variations of impacts by the lithium-ion batteries. Another research by Innocenzi et al. [10] highlighted the processes and lab-scale techniques for the treatment of spent rechargeable NiMH batteries. They have characterized NiMH accumulators and addressed their recycling routes. But the environmental hazards of NiMH accumulators have not been identified. Notter et al. [11] and Ellingsen et al. [12] evaluated the impacts associated with LiIo batteries for a few indicators, while the precise effects to resources, ecosystem and humankind have not been identified. Another recent work by Meng et al. [13] highlighted non-aqueous electrolytes, focusing on ionic liquids for NiMH Batteries. They used acid mixtures as substitutes for potassium hydroxide electrolytes and tested them through charging/discharging experiments. However, the environmental hazards of these materials use in NiMH has not been quantified. Hao et al. [14] evaluated the greenhouse-gas emissions during the production of LiIo batteries in China. They considered only the production phase of LiIo batteries, not the whole life cycle. Therefore, there are few contributions on impact assessment for LiIo and NiMH batteries but, to the authors’ knowledge, these assessments are for only one or two stages of the batteries’ life cycles such as production or recycling. Moreover, a comprehensive life cycle environmental impact estimation of LiIo and NiMH batteries could not be found in the literature, which is required not only to justify the better option but also to find out the impacting constituents and to substitute them for cleaner production. Therefore, this research aims to evaluate and compare the impacts of these batteries on the ecosystem and human health by developing a comprehensive life cycle inventory (LCI).
The ecoinvent database and previous literature are used to build the LCI through organizing the material flows, the life cycle inputs and outputs, and for developing an LCA system boundary for both batteries. The geographic location of the battery plants is Japan due to datasets availability and the high battery production capacity of Japan [15]. LCA is carried out by SimaPro software version 8.5 using the Raw Material Flows (RMF), Institute of Environmental Sciences (CML), ReCiPe, Eco-points 97, Intergovernmental Panel on Climate Change (IPCC), and Cumulative Energy Demand (CED) methods. Overall, the main contributions of this paper are as follows.
- Development of a comprehensive life cycle inventory (LCI) for LiIo and NiMH batteries.
- Assessment and comparison of the environmental impacts of these batteries considering the whole life cycle.
- Evaluation of batteries’ effects on human health and the ecosystem.
- Estimation of metal and gas-based releases to land, water, and air by the batteries.
- Quantification of carbon-based power consumption by the batteries.
- Accomplishment of uncertainty analysis for both of the studied batteries.
In the light of the above, the remainder of this paper is arranged as follows. Section 2 highlights the battery demands and production scenario. The methodology of this LCA research is described in Section 3. Section 4 depicts the outcome by the RMF, CML, ReCiPe, EcoPoints 97, IPCC, CED methods. The interpretation of the impact outcomes is presented in Section 5. Section 6 and Section 7 highlight the uncertainty analysis and the limitations of this work. Finally, the concluding remarks are mentioned in Section 8.
2. Battery Demands and Production Scenario
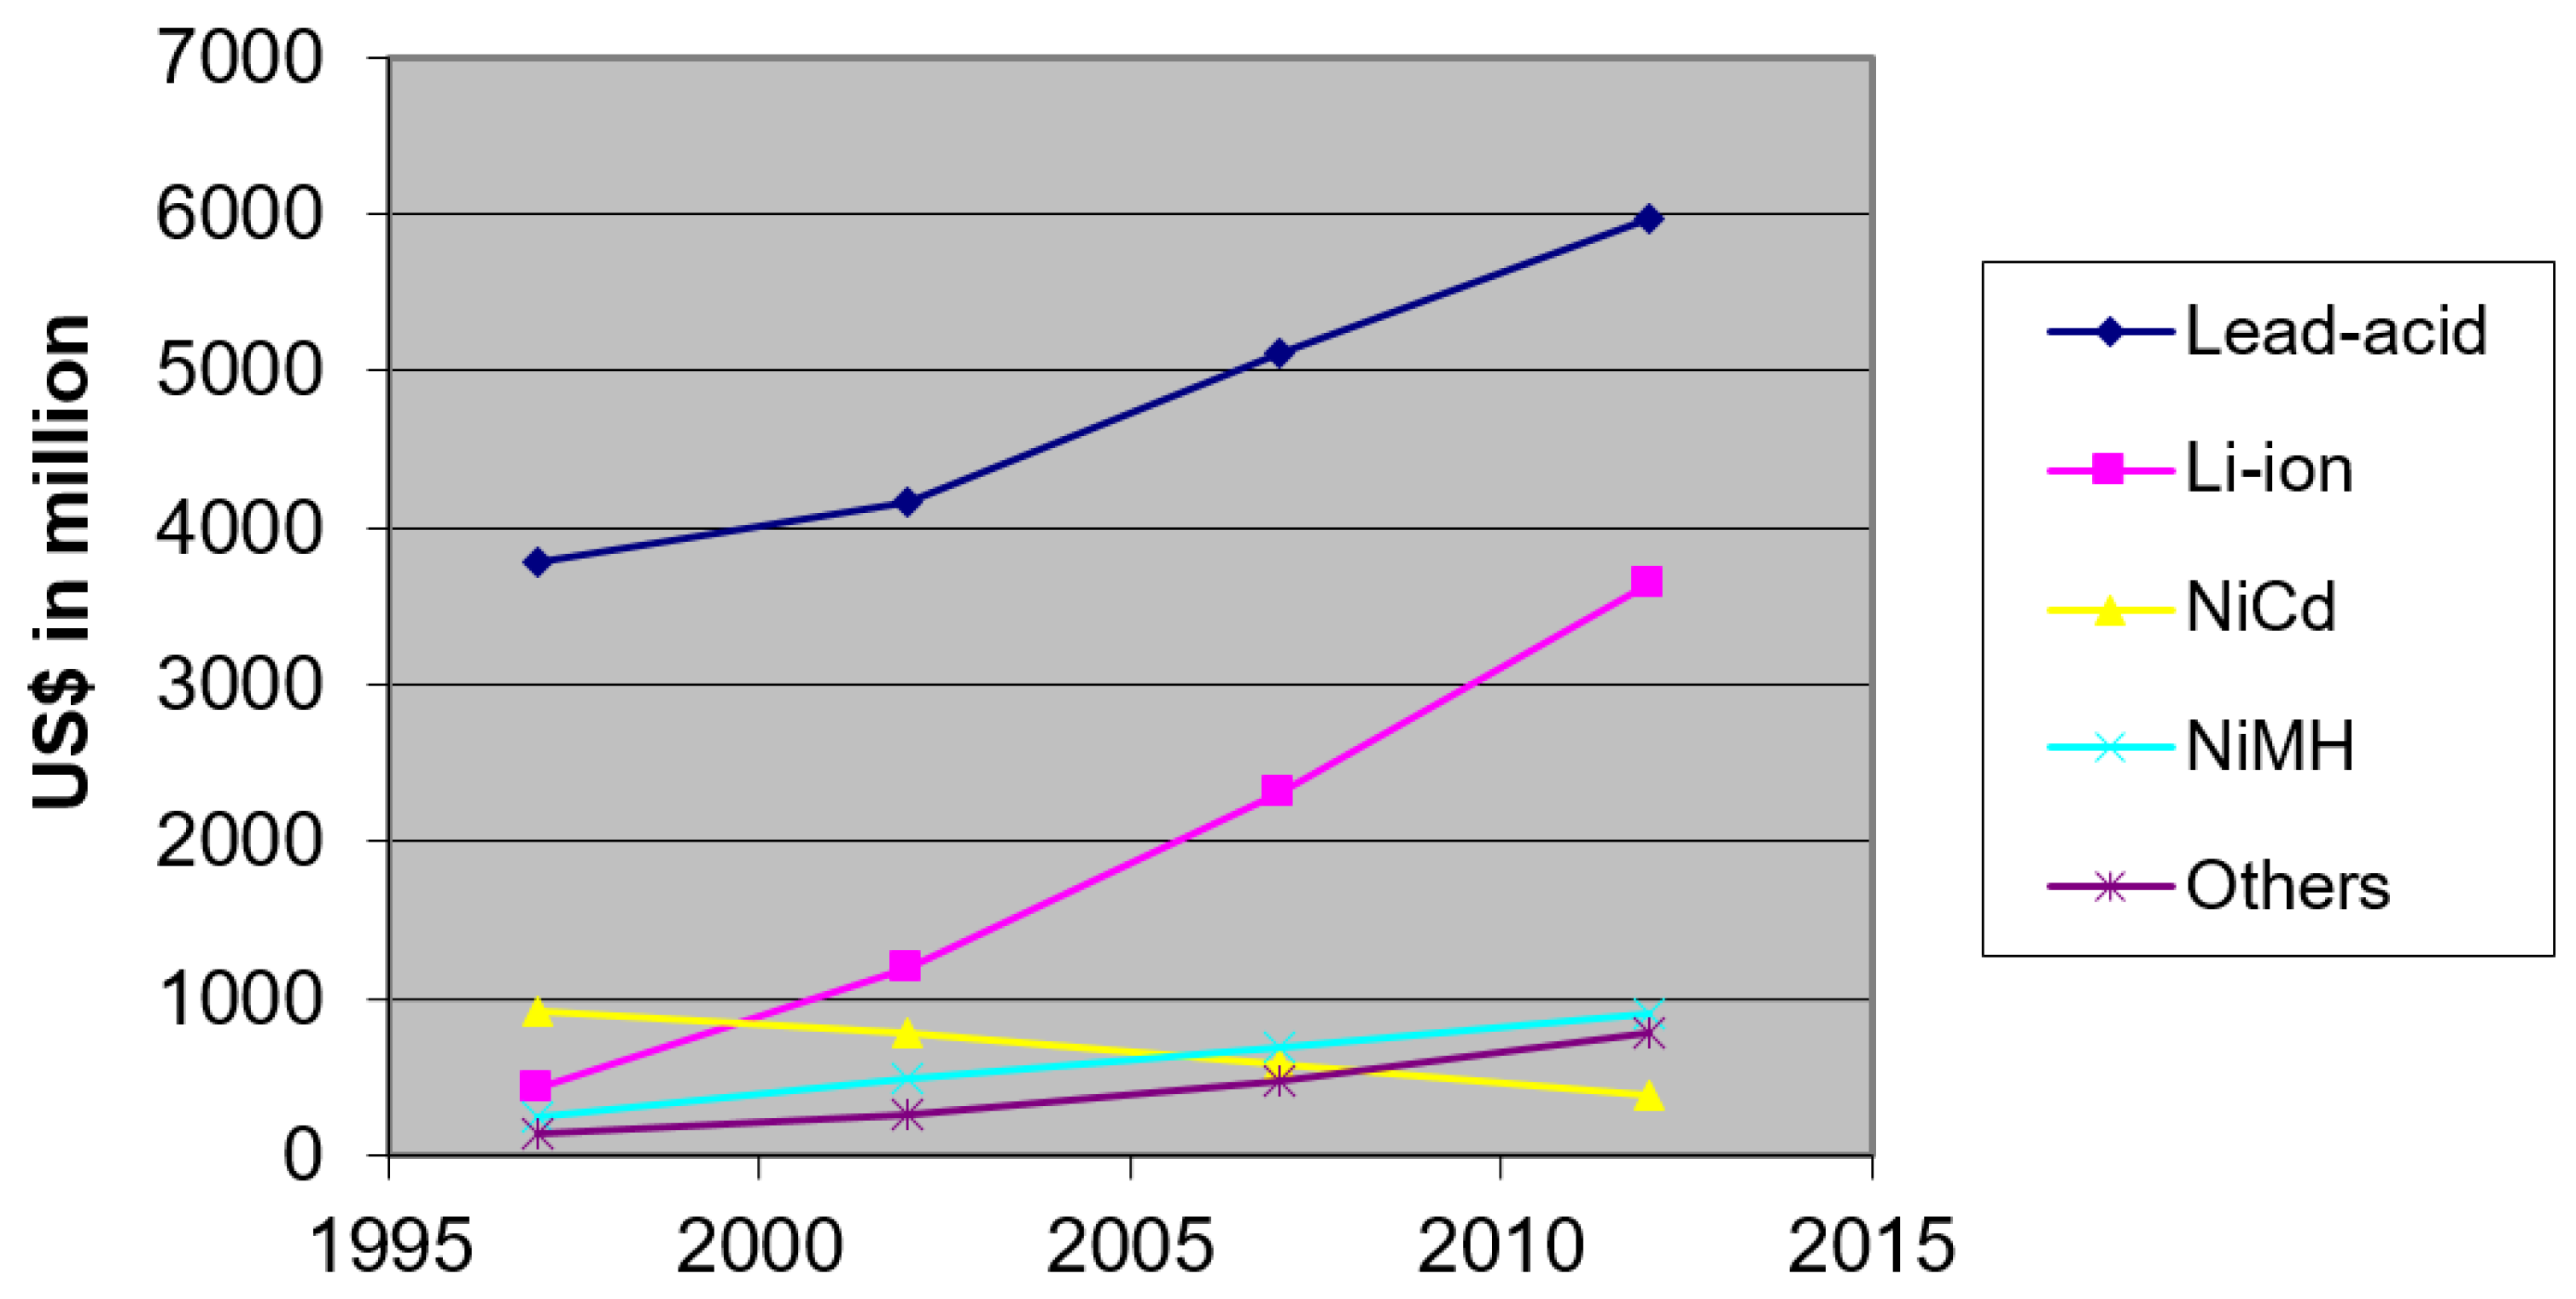
There is a considerable demand for rechargeable and non-rechargeable batteries all over the world. Many countries are producing batteries to meet these demands. This paper highlights the lifetime effects of two types of rechargeable batteries, LiIo and NiMH. The global battery demand scenario highlighted in Figure 1 shows that the LiIo battery demand was about 3700 million US$ in 2012, the second most significant among batteries [16]. The need for LiIo batteries had increased nearly seven times in 15 years from 1997 to 2012. However, the demand for NiMH batteries increased steadily to about 900 million US$ in 2012. Therefore, the previous demand curve indicates that the global use of LiIo and NiMH batteries is rising.
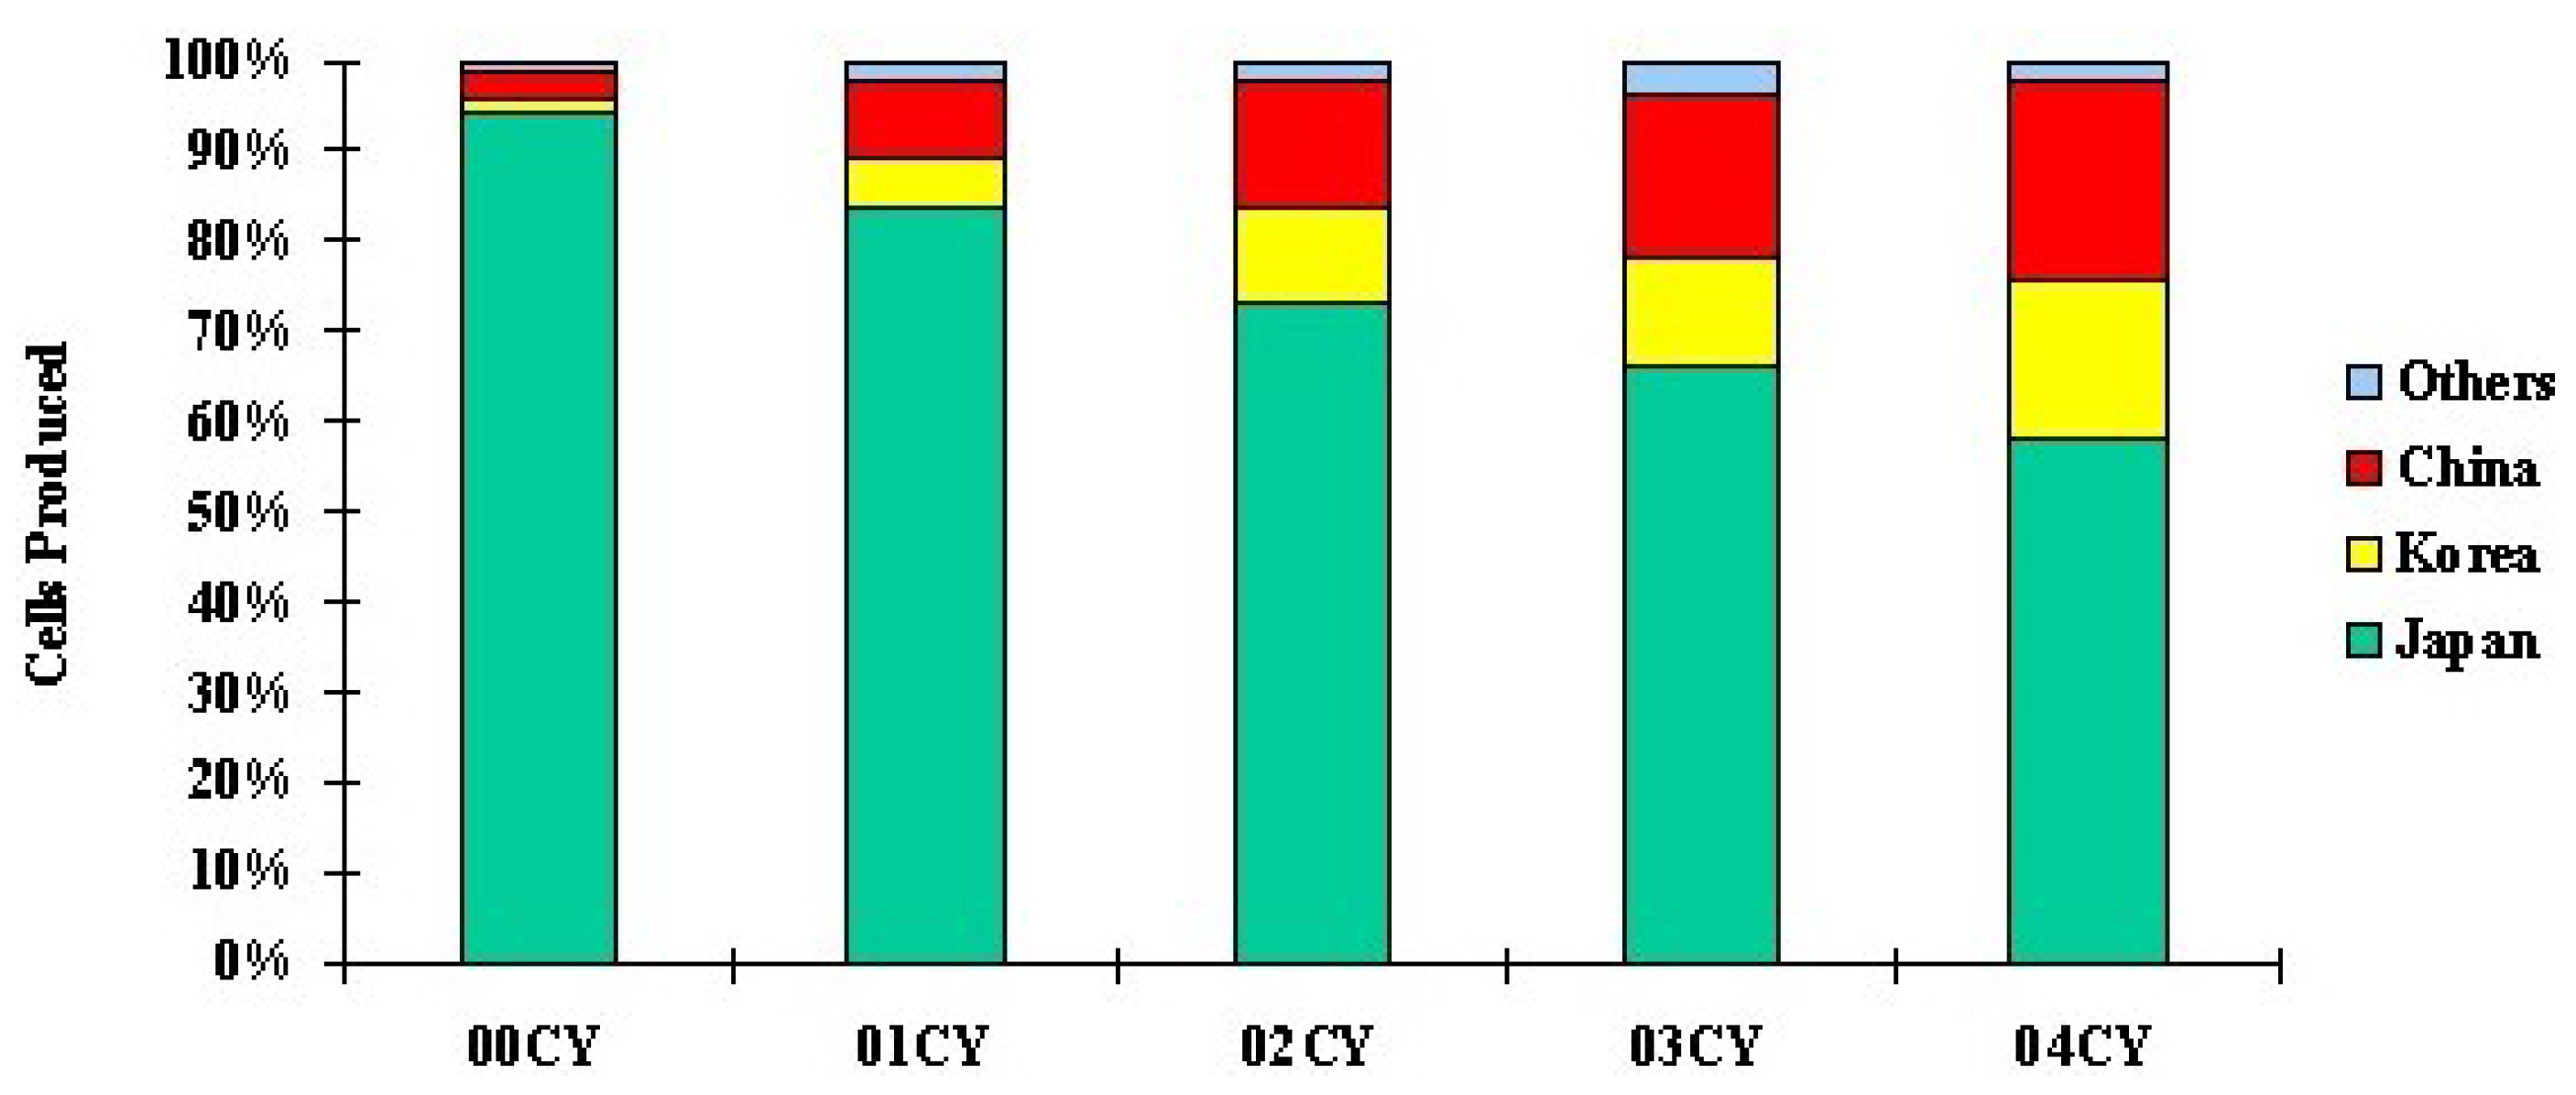
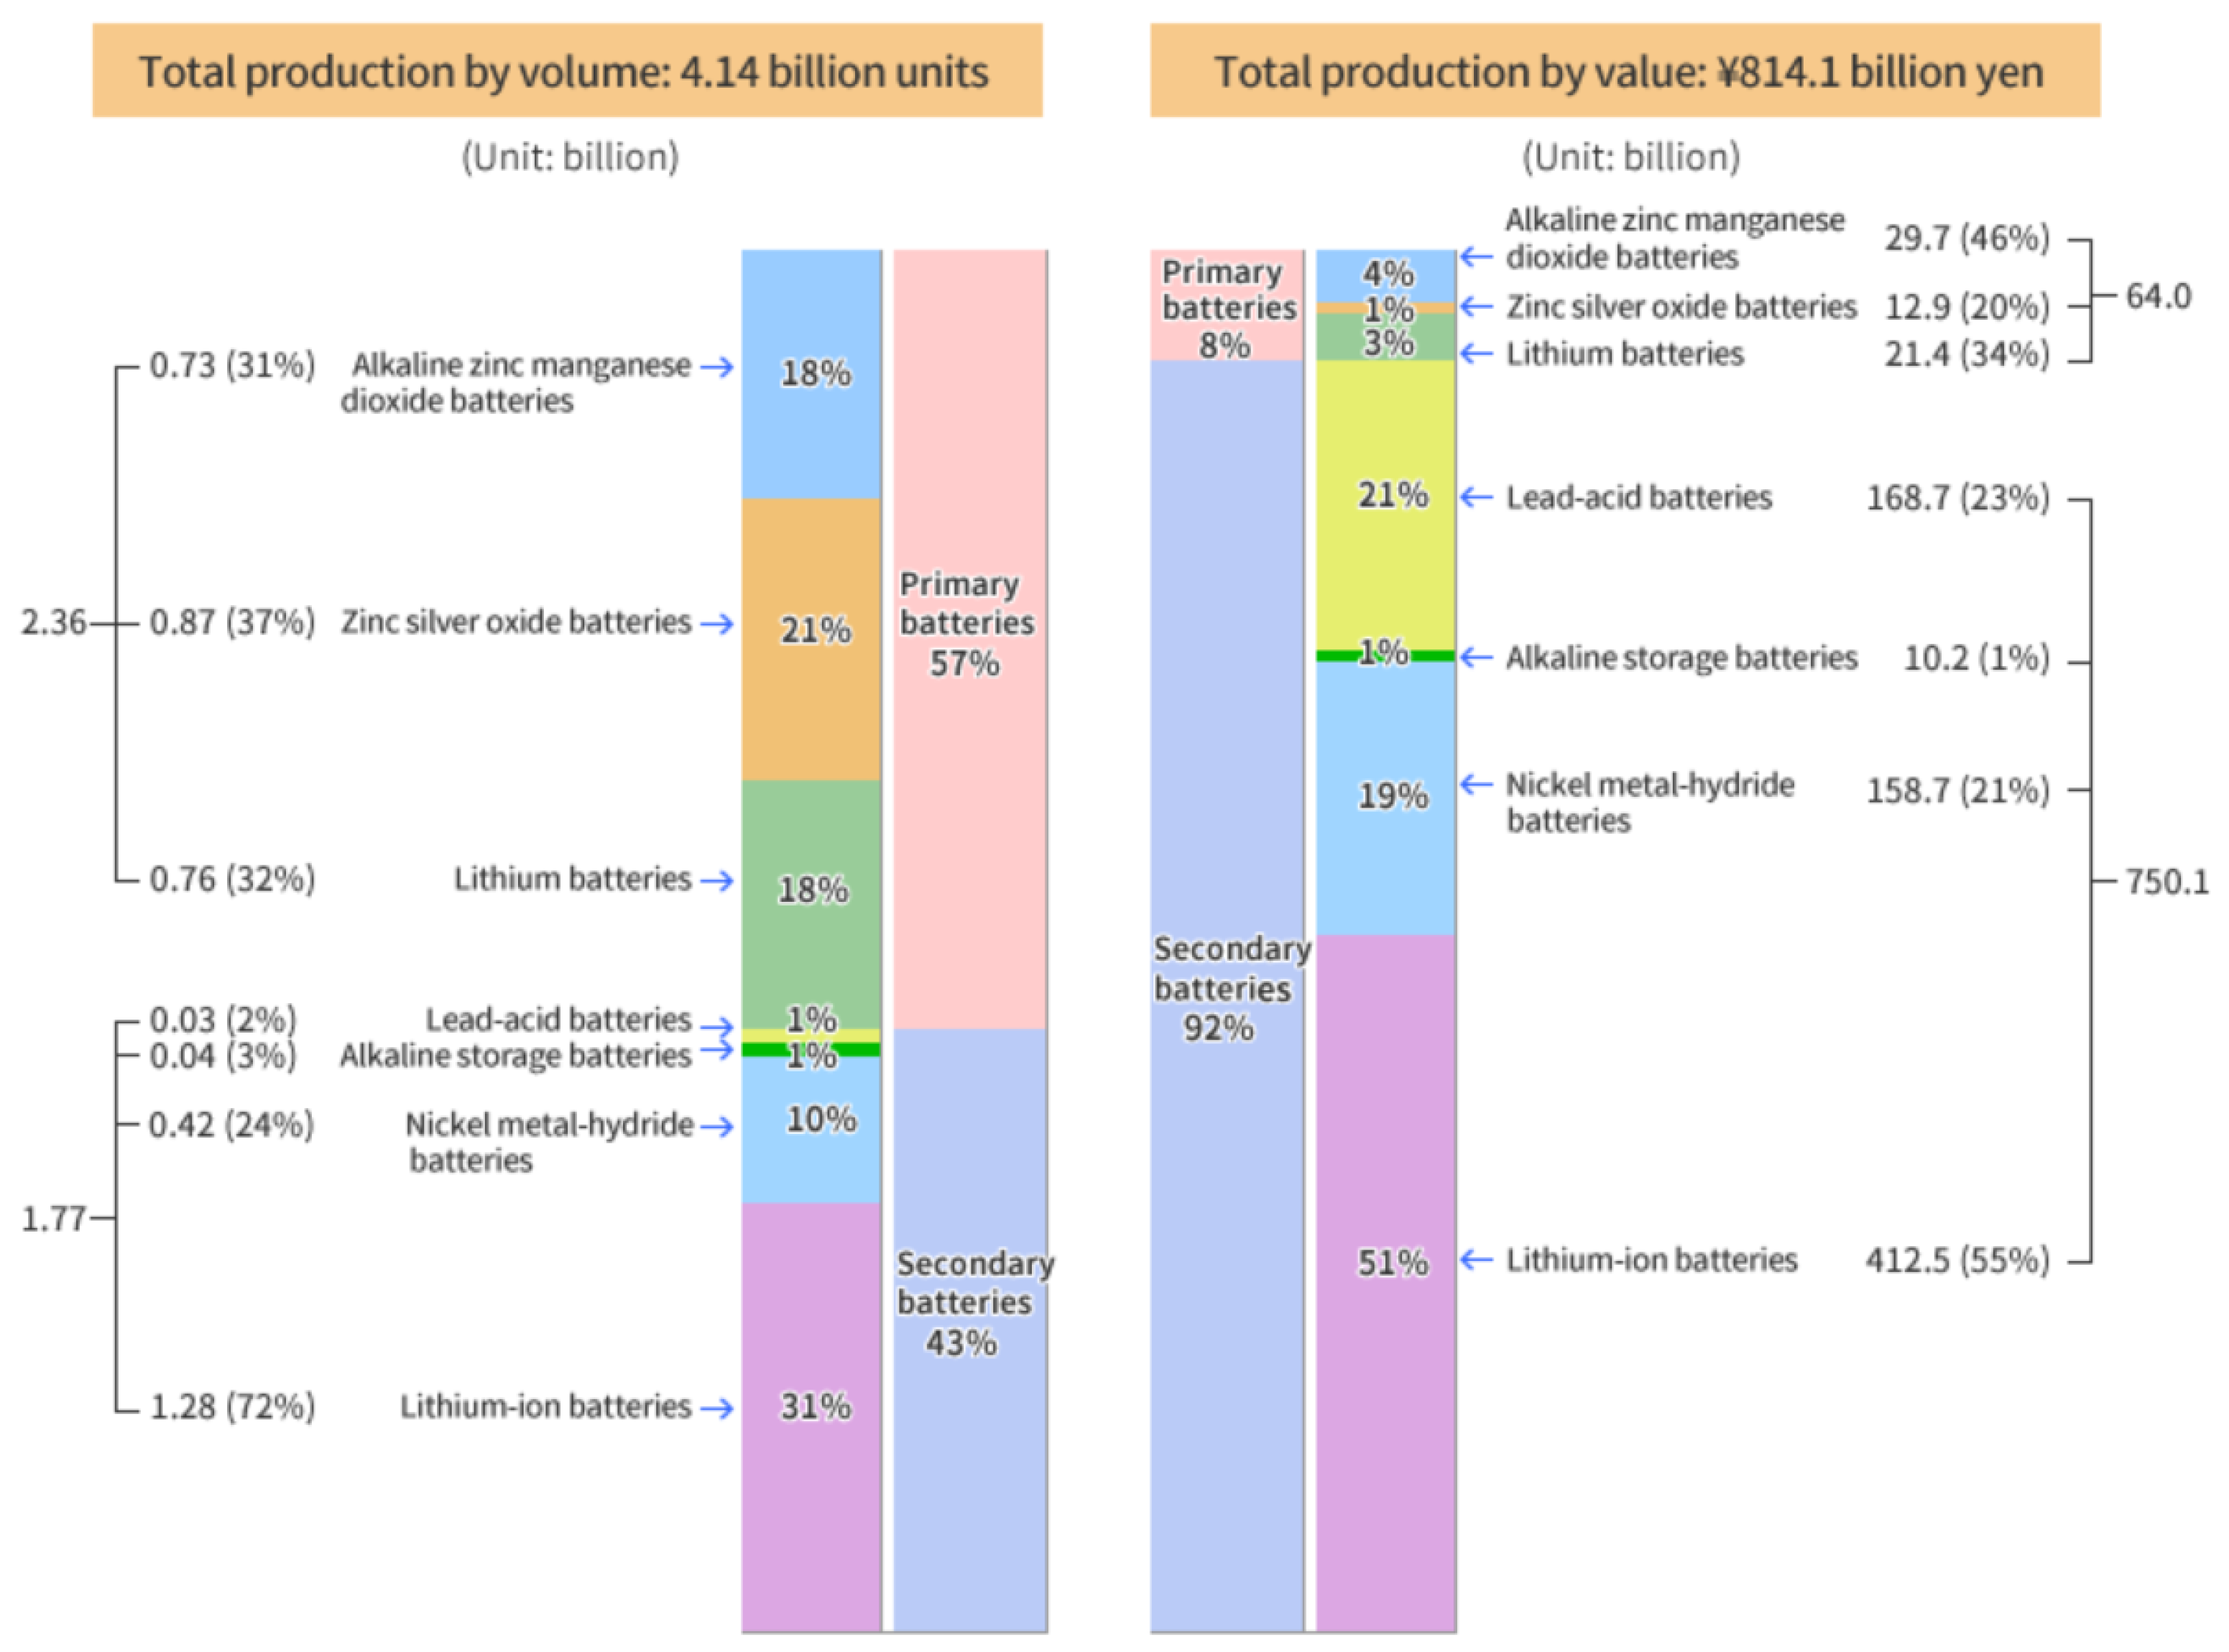
Figure 2 shows that Japan is the main battery-producing nation in the world [16]. Therefore, in this LCA analysis the battery plants’ location is Japan. The recent rechargeable-battery productions overview in Japan in 2017 is shown in Figure 3, which was obtained from [15]. The total number of batteries produced was about 4.14 billion; 43% of them are rechargeable batteries; 31% of the rechargeable-battery production by volume were the lithium-ion type, and 10% were the nickel-metal hydride type. The battery production by value scenario shows that about 92% of the total value of 814.1 billion Japanese yen was for secondary batteries. About 51% and 19% of secondary-battery values were LiIo and NiMH batteries, respectively. Therefore, in recent times the overall battery production scenario depicts that LiIo and NiMH batteries are being produced at a greater rate than other rechargeable batteries in Japan.
The last five years (2013–2017), battery sales in Japan for the categories of LiIo and NiMH are highlighted in Table 1, which is obtained from [17]. In 2013, LiIo batteries were sold for a value of about 279,364 million JPY, whereas the value for NiMH batteries was approximately 178,748 million JPY. Every year the demand for LiIo batteries were increased but in the case of NiMH the sales the scenario was the opposite. After five years, the value of selling LiIo batteries was approximately 422,366 million JPY, while the rate for NiMH was about 166,583 million JPY. The quantities of sales of LiIo and NiMH batteries also provide similar estimations from 2013 to 2017. These enormous sales of batteries indicate a more considerable amount of overall impact on the environment. Therefore, it is necessary to find out the chemicals or devices which are responsible for environmental impacts by LiIo and NiMH batteries and replace them by an environmentally friendly equivalent alternative without compromising performance.
3. Methodology
This paper analyzes and compares the life cycle environmental impact of lithium-ion and nickel-metal hydride batteries. life cycle environmental impact analysis is a categorized impact assessment technology based on ISO standardized methods. The LCA methodology is formed based on ISO 14040:2006 to ISO 14044:2006 [18,19]. The datasets are collected from the ecoinvent database [20,21], which originate from Hischier et al. [22].
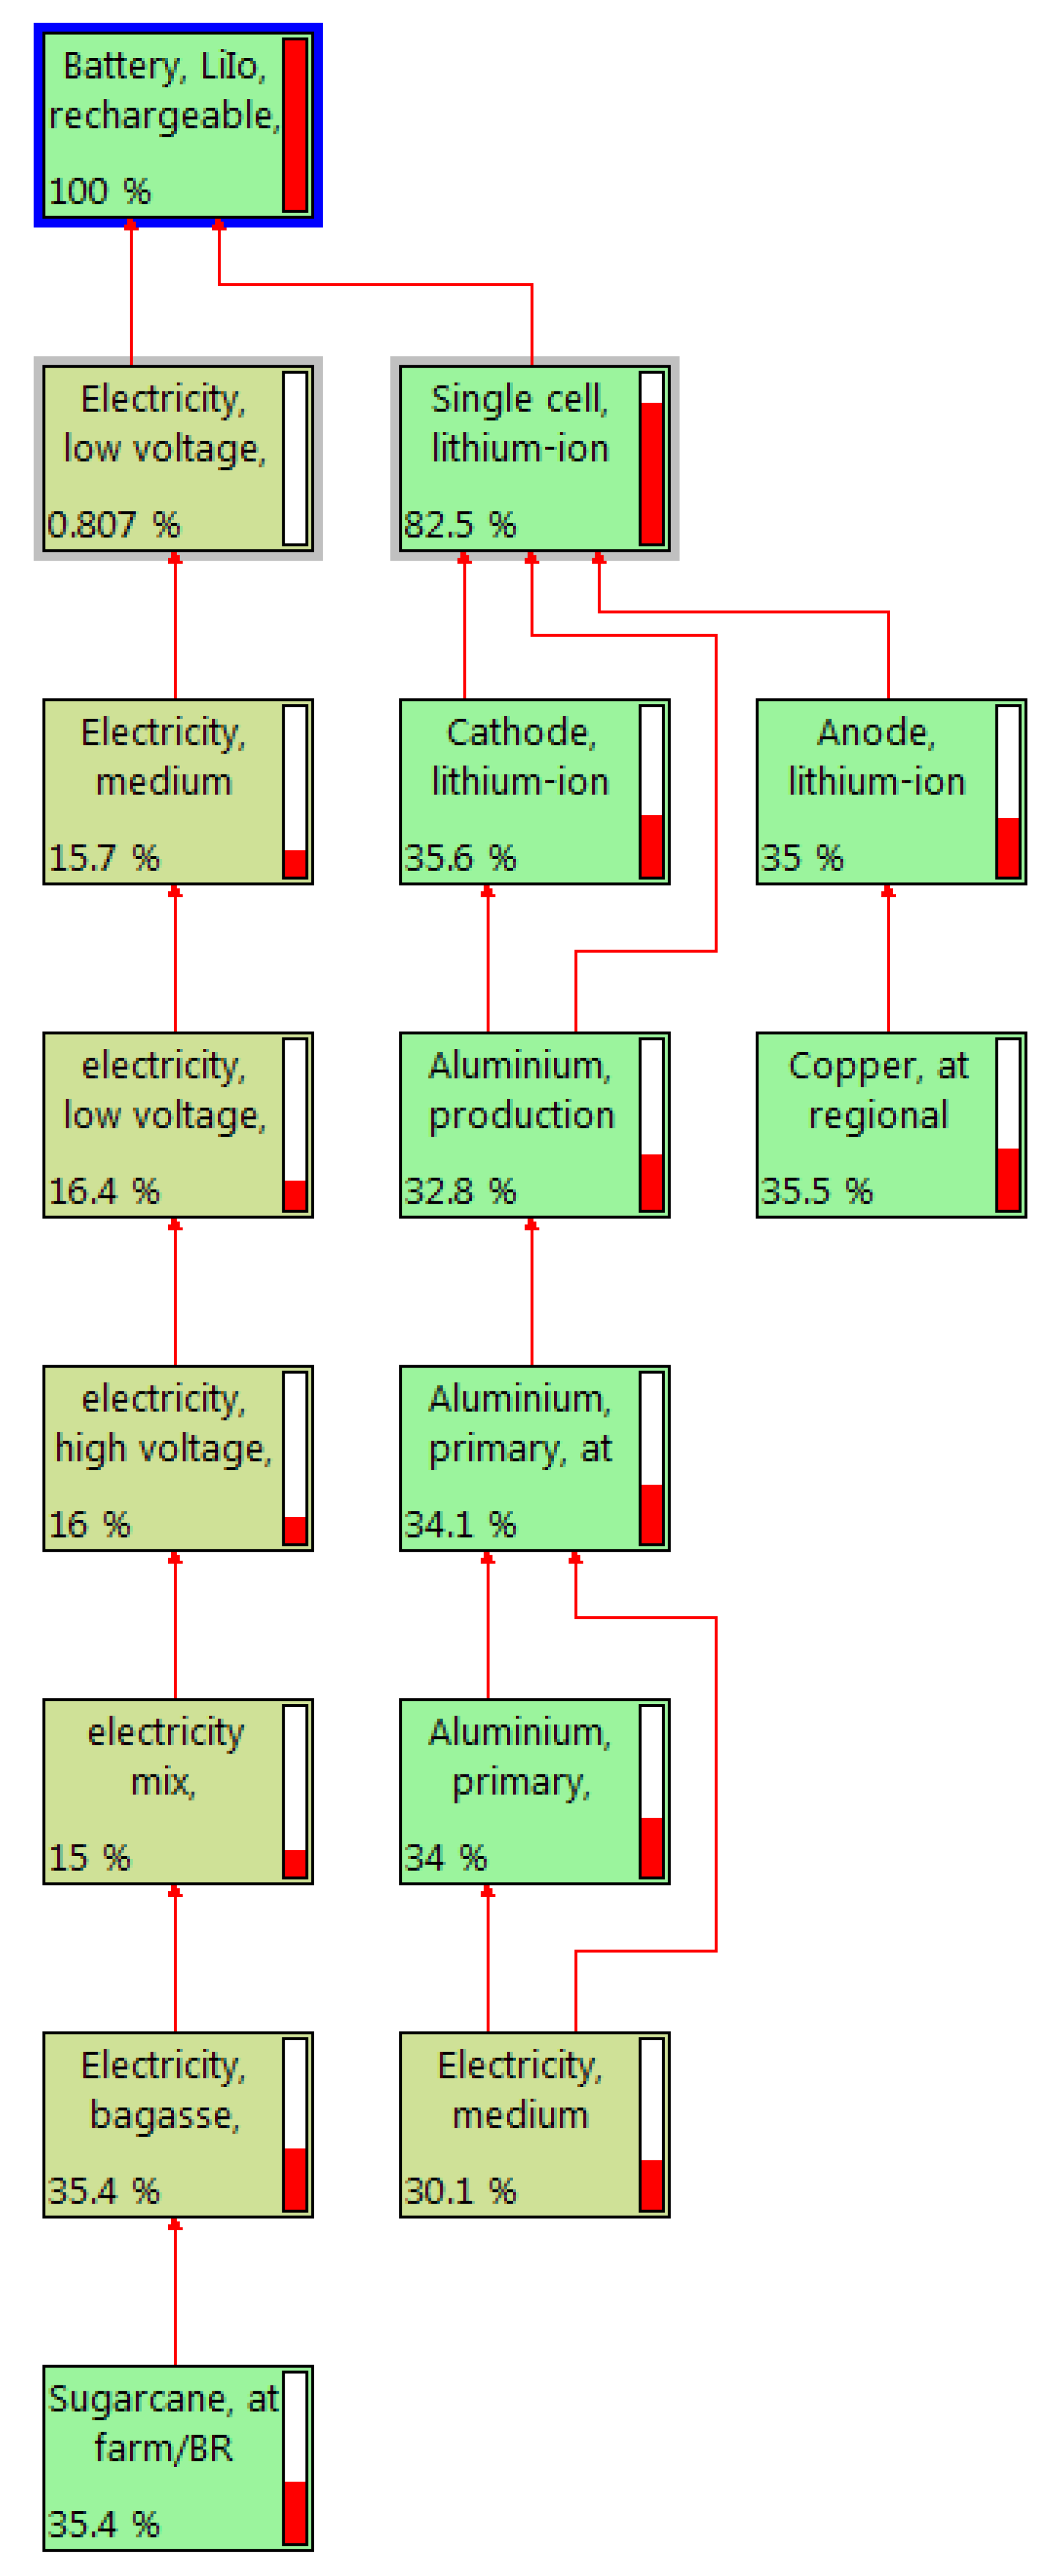
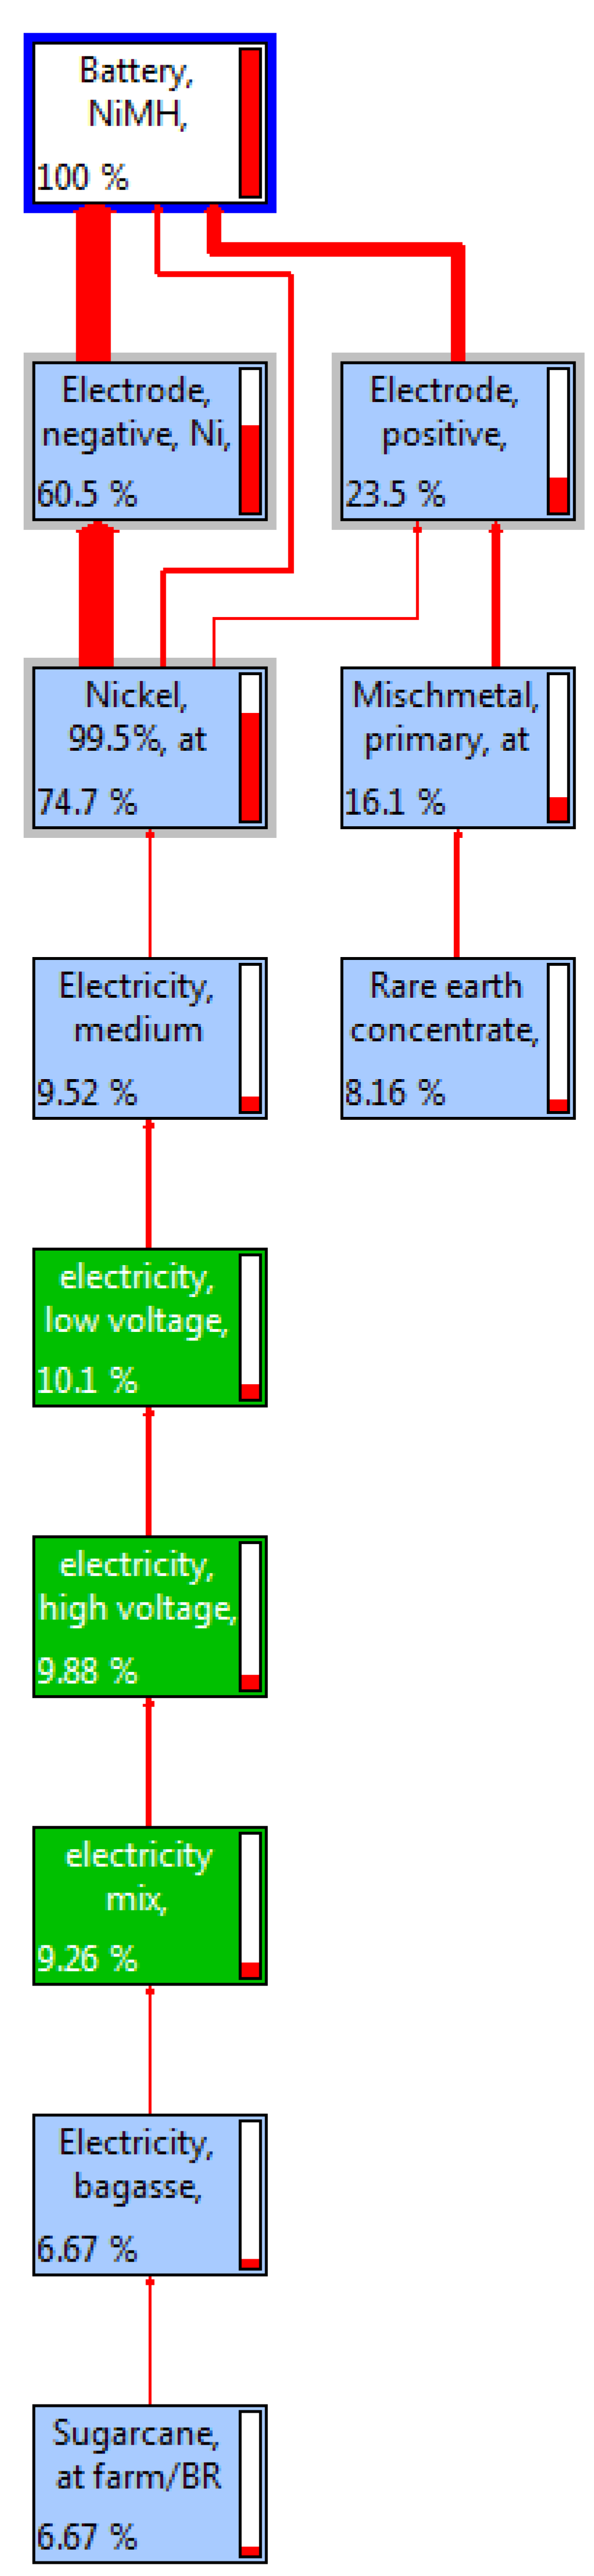
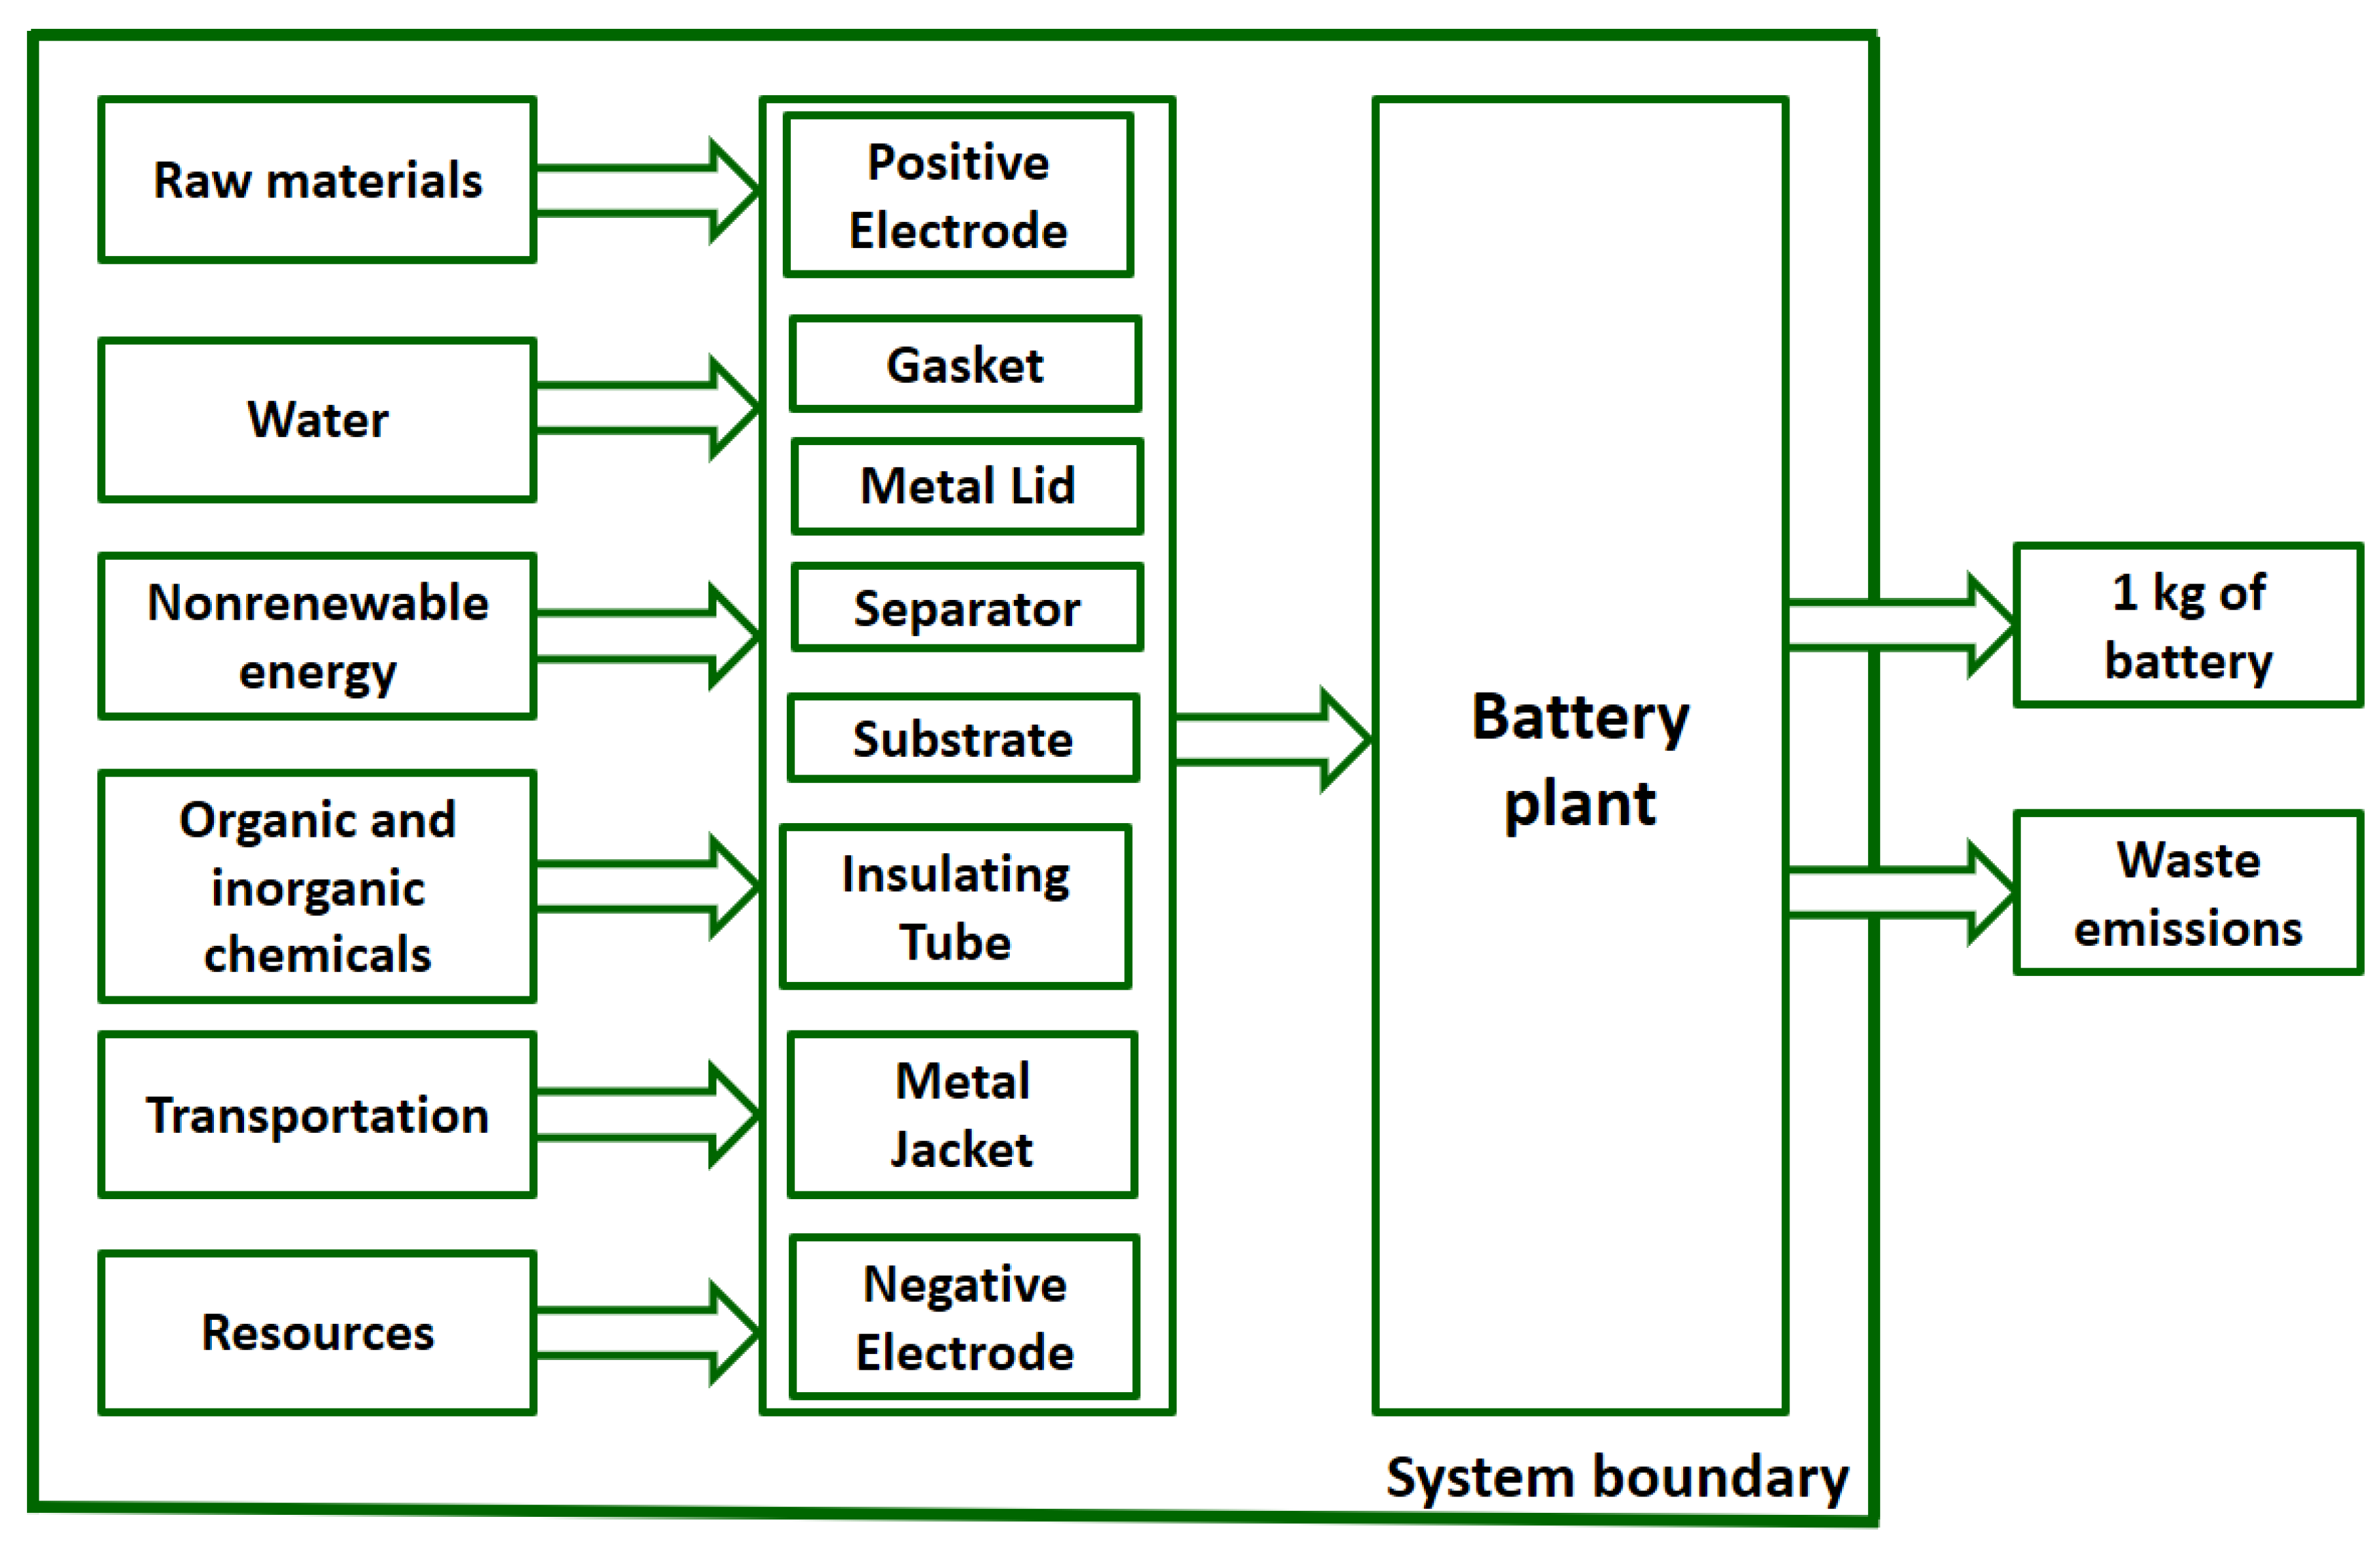
There are four basic steps which should be followed to perform a complete LCA: goal and scope definition, life cycle inventory, life cycle impact assessment, and outcome interpretation [23,24,25]. The first step of LCA is the goal and scope definition. In this study, the goal is to analyze and compare the environmental impacts caused by lithium ion and nickel-metal hydride batteries based on standardized methods. The scope of this research is the environmental emissions that are generated from the production of the unit amount of these batteries. The specifications of the considered batteries for life cycle environmental impact assessments are given in Table 2 [22]. Figure 4 shows the material flows in various stages of the LiIo battery plants. The types of energy consumption during the raw-material extraction to LiIo battery production are low voltage (0.81%), medium voltage (15.7%) and high voltage (16%). Biomass energy from sugarcane is consumed mostly, with a rate of 35.4% throughout the life cycle of the LiIo battery. About 30.1% medium electricity is used for Aluminium production. The respective rates of used Aluminium and Copper are 32.8% and 35.5%. Figure 5 shows the material flows in various stages of the NiMH battery plants. NiMH batteries mostly use Nickel at a rate of approximately 74.7%. About 60.5% of the Ni is used for the negative electrode, whereas about 23.5% is used for the positive electrode of the battery. The rates of other metals and earth substances are approximately 16.1% and 8.16%, respectively. Like LiIo batteries, NiMH also uses low, medium and high voltage electricity at the different stages of life. The rates of using low, medium and high voltages are 10.1%, 9.52%, and 9.88%. However, NiMH consumes about 9.26% of electricity mix originated from primary and secondary sources. About 6.67% of low-voltage electricity consumption is from sugarcane-based biomass plants. The functional unit [26,27,28] is 1 kg of the battery produced of each type (lithium-ion and nickel-metal hydride batteries). The system boundary (Figure 6) here includes the battery production phase, which is cradle-to-gate [3,29,30]. The life cycle inventories of the LiIo and NiMH battery plants are highlighted in Table 3 and Table 4, respectively. This analysis is done using SimaPro software version 8.5 [31]. The geographic region is considered as Japan. It is assumed that the battery plant is in Japan, and the raw materials used, and the electricity in use is also produced on the Asian continent. There is no co-product which is produced in conjunction with batteries; there is no need to apply allocation techniques.
For assessing the impacts, several LCA methodologies are applied which make it a hybrid LCA. The methodologies discussed here are the CML, ReCiPe, EcoPoints, IPCC, Raw material flow, and CED method. The Raw Material Flow method analyses and quantifies the emissions based on raw material inputs and outputs emitted to the soil, water, air, and tracks the plant emissions. On the other hand, the CML method and the ReCiPe method both are specifically designed for analysing production processes or systems of processes located on the European subcontinent. The CML method [32], developed by the Centre for Environmental Sciences of Leiden University, aims to analyse the environmental effects based on ten impact categories like global warming, human toxicity, abiotic depletion, ecotoxicity, terrestrial ecotoxicity, eutrophication, marine aquatic ecotoxicity, and photochemical oxidation. The ReCiPe method [33] also analyses the environmental impact based on various categories, which may be either midpoint based or endpoint based.
The IPCC (Intergovernmental Panel on Climate Change) method [34] aims to analyse the greenhouse-gas emissions based on various time frames like 20 years, 50 years, or 100 years. The EcoPoints method [35] analyses the emissions based on 13 impact categories based on significant elements emitted to the environment: carbon dioxide (CO2), nitrogen oxide (NOx), sulphur oxide (SOx), ammonia (NH3), nitrogen (N), copper (Cu), cadmium (Cd), Nickel (Ni), phosphorous (P), zinc (Zn), mercury (Hg), lead (Pb), and chromium (Cr).
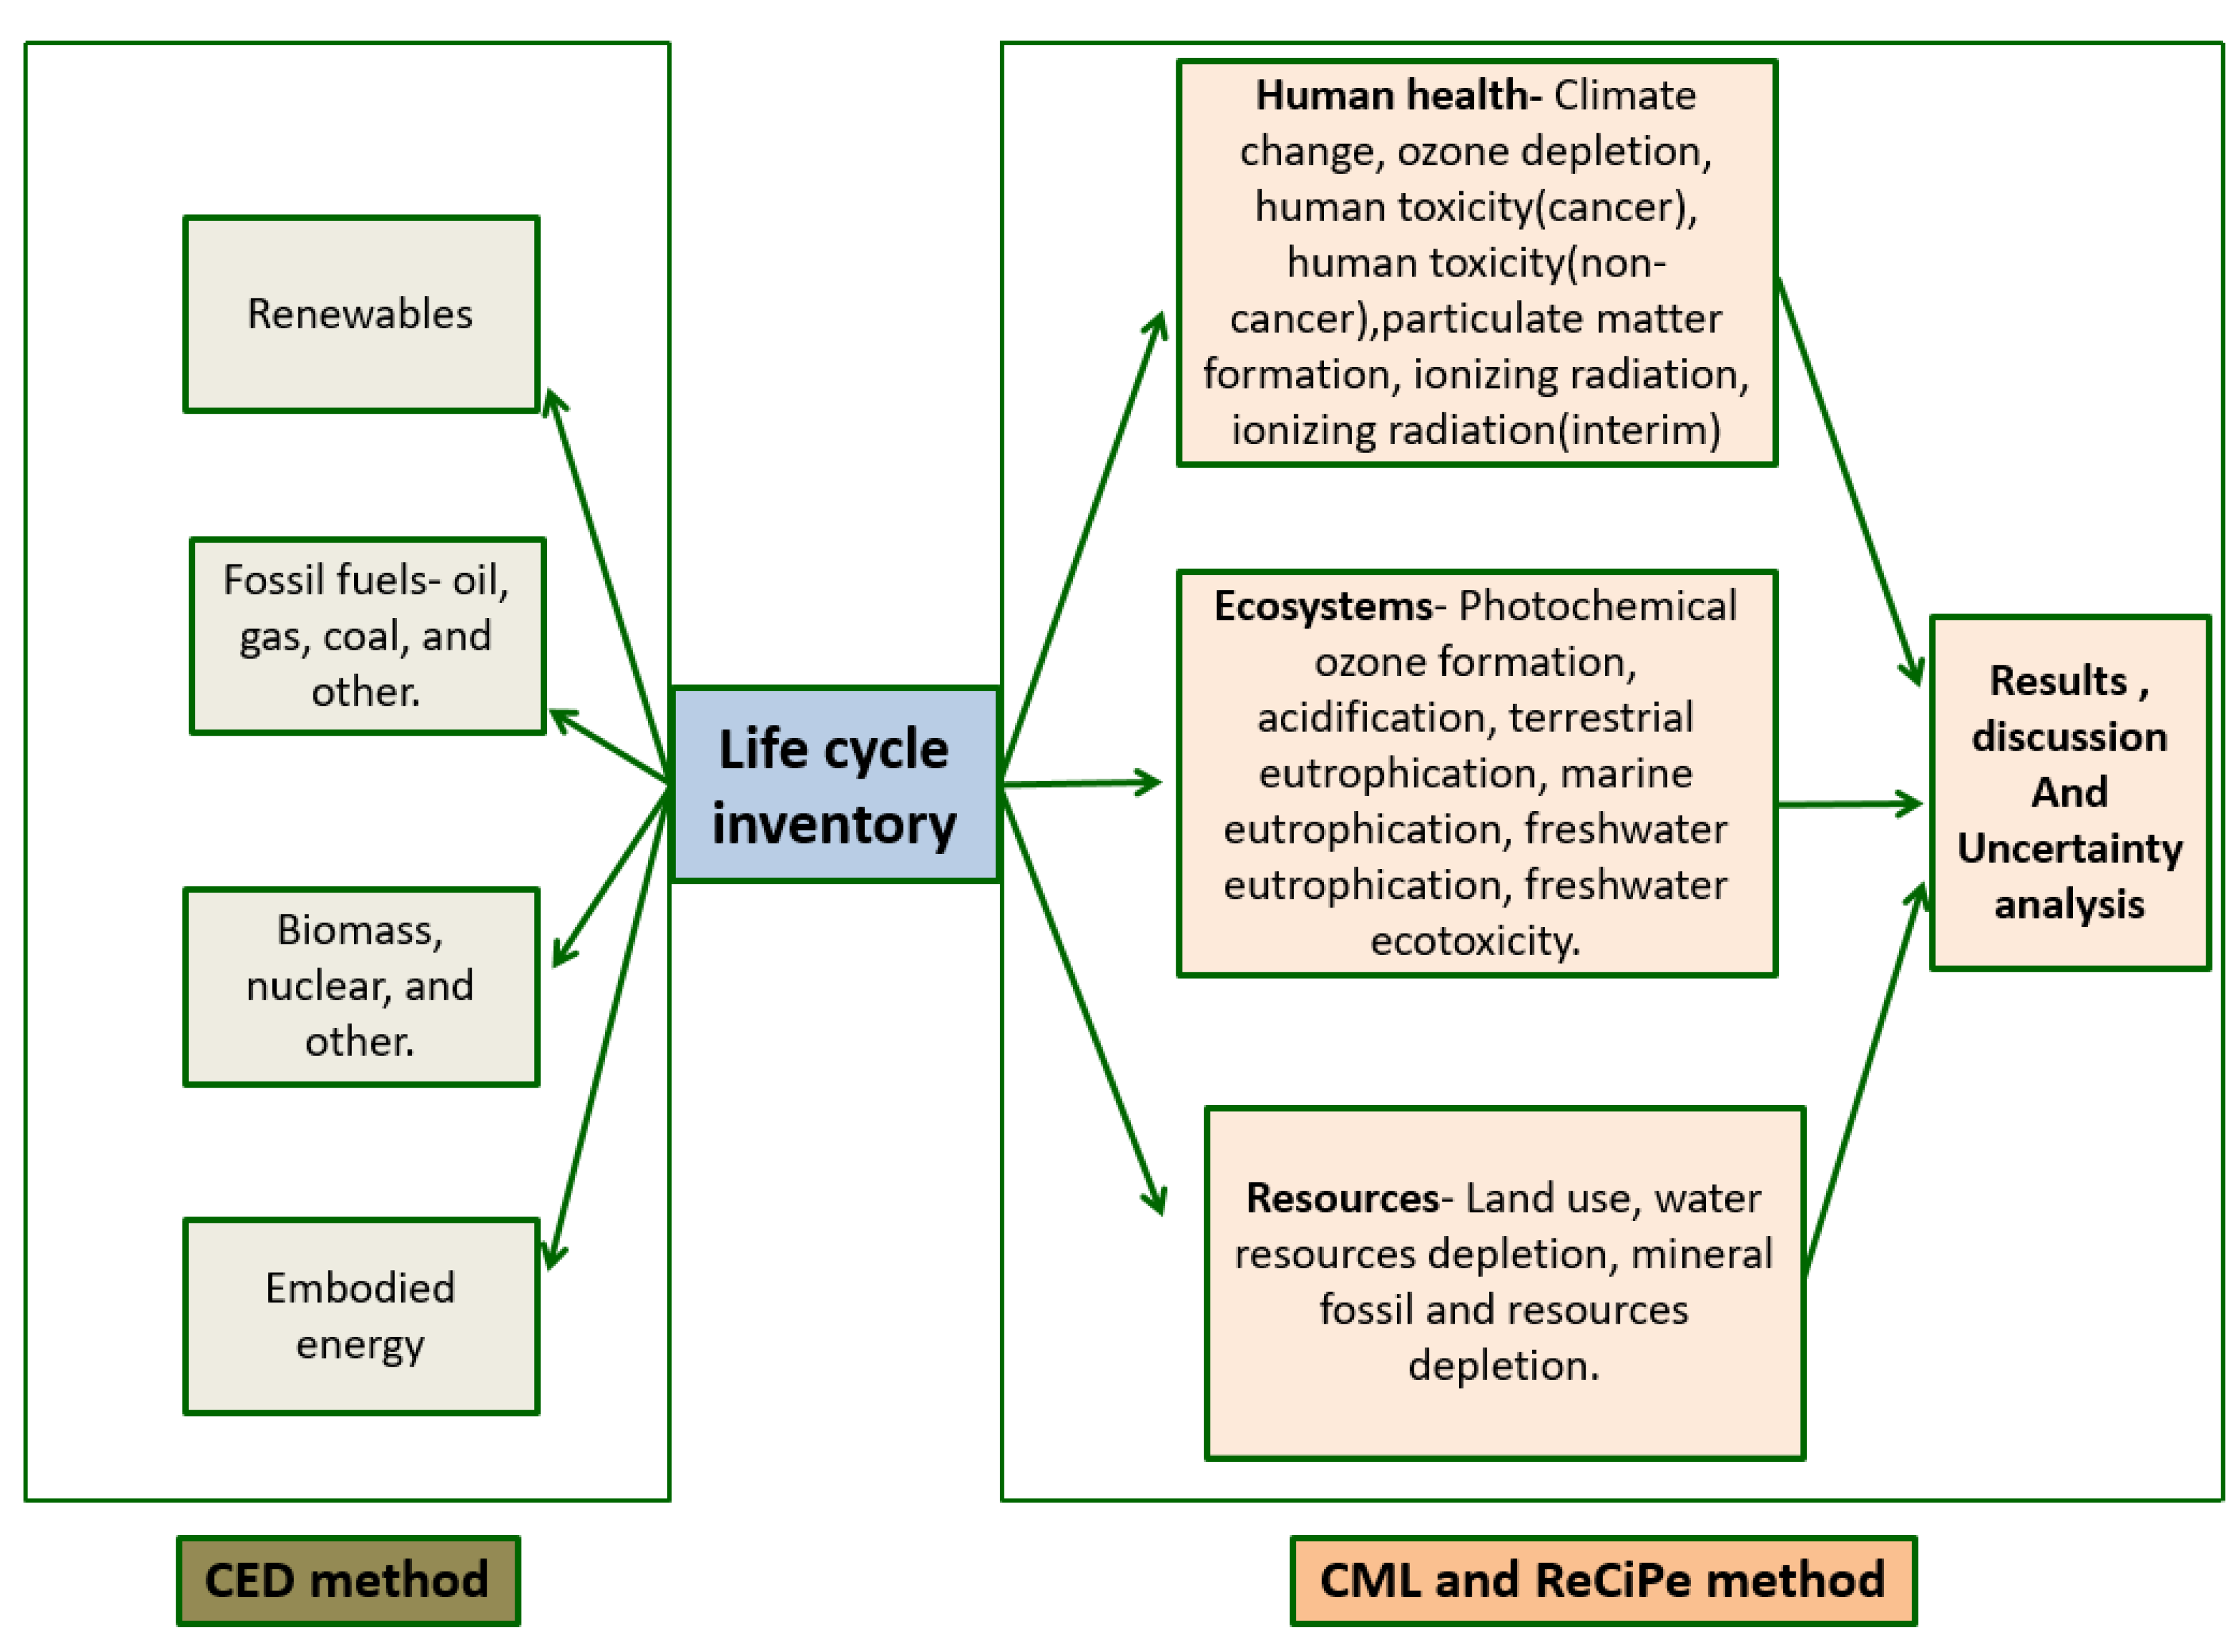
The CED (Cumulative Energy Demand) method [36] analyses the environmental effects based on the energy consumption in the form of fossil fuels, nuclear, renewables, and non-renewables. Figure 7 depicts the CED, and CML LCA approaches. Overall, the major components of these methods are analysed and compared here based on their respective impact categories to perform a detailed and complete life cycle impact analysis based on lithium-ion and nickel-metal hydride batteries.
4. Results
The outcomes of the LCA analysis are expressed in percentages, setting the maximum impact equal to 100 for comparison. Thus, all the presented values for the impact indicators found by the various LCA methods are relative. The findings from the comparative LCA analysis of LiIo and NiMH batteries by the RMF, CML, ReCiPe, Eco-points 97, IPCC, and CED methods are depicted in the following subsections.
4.1. RMF Method
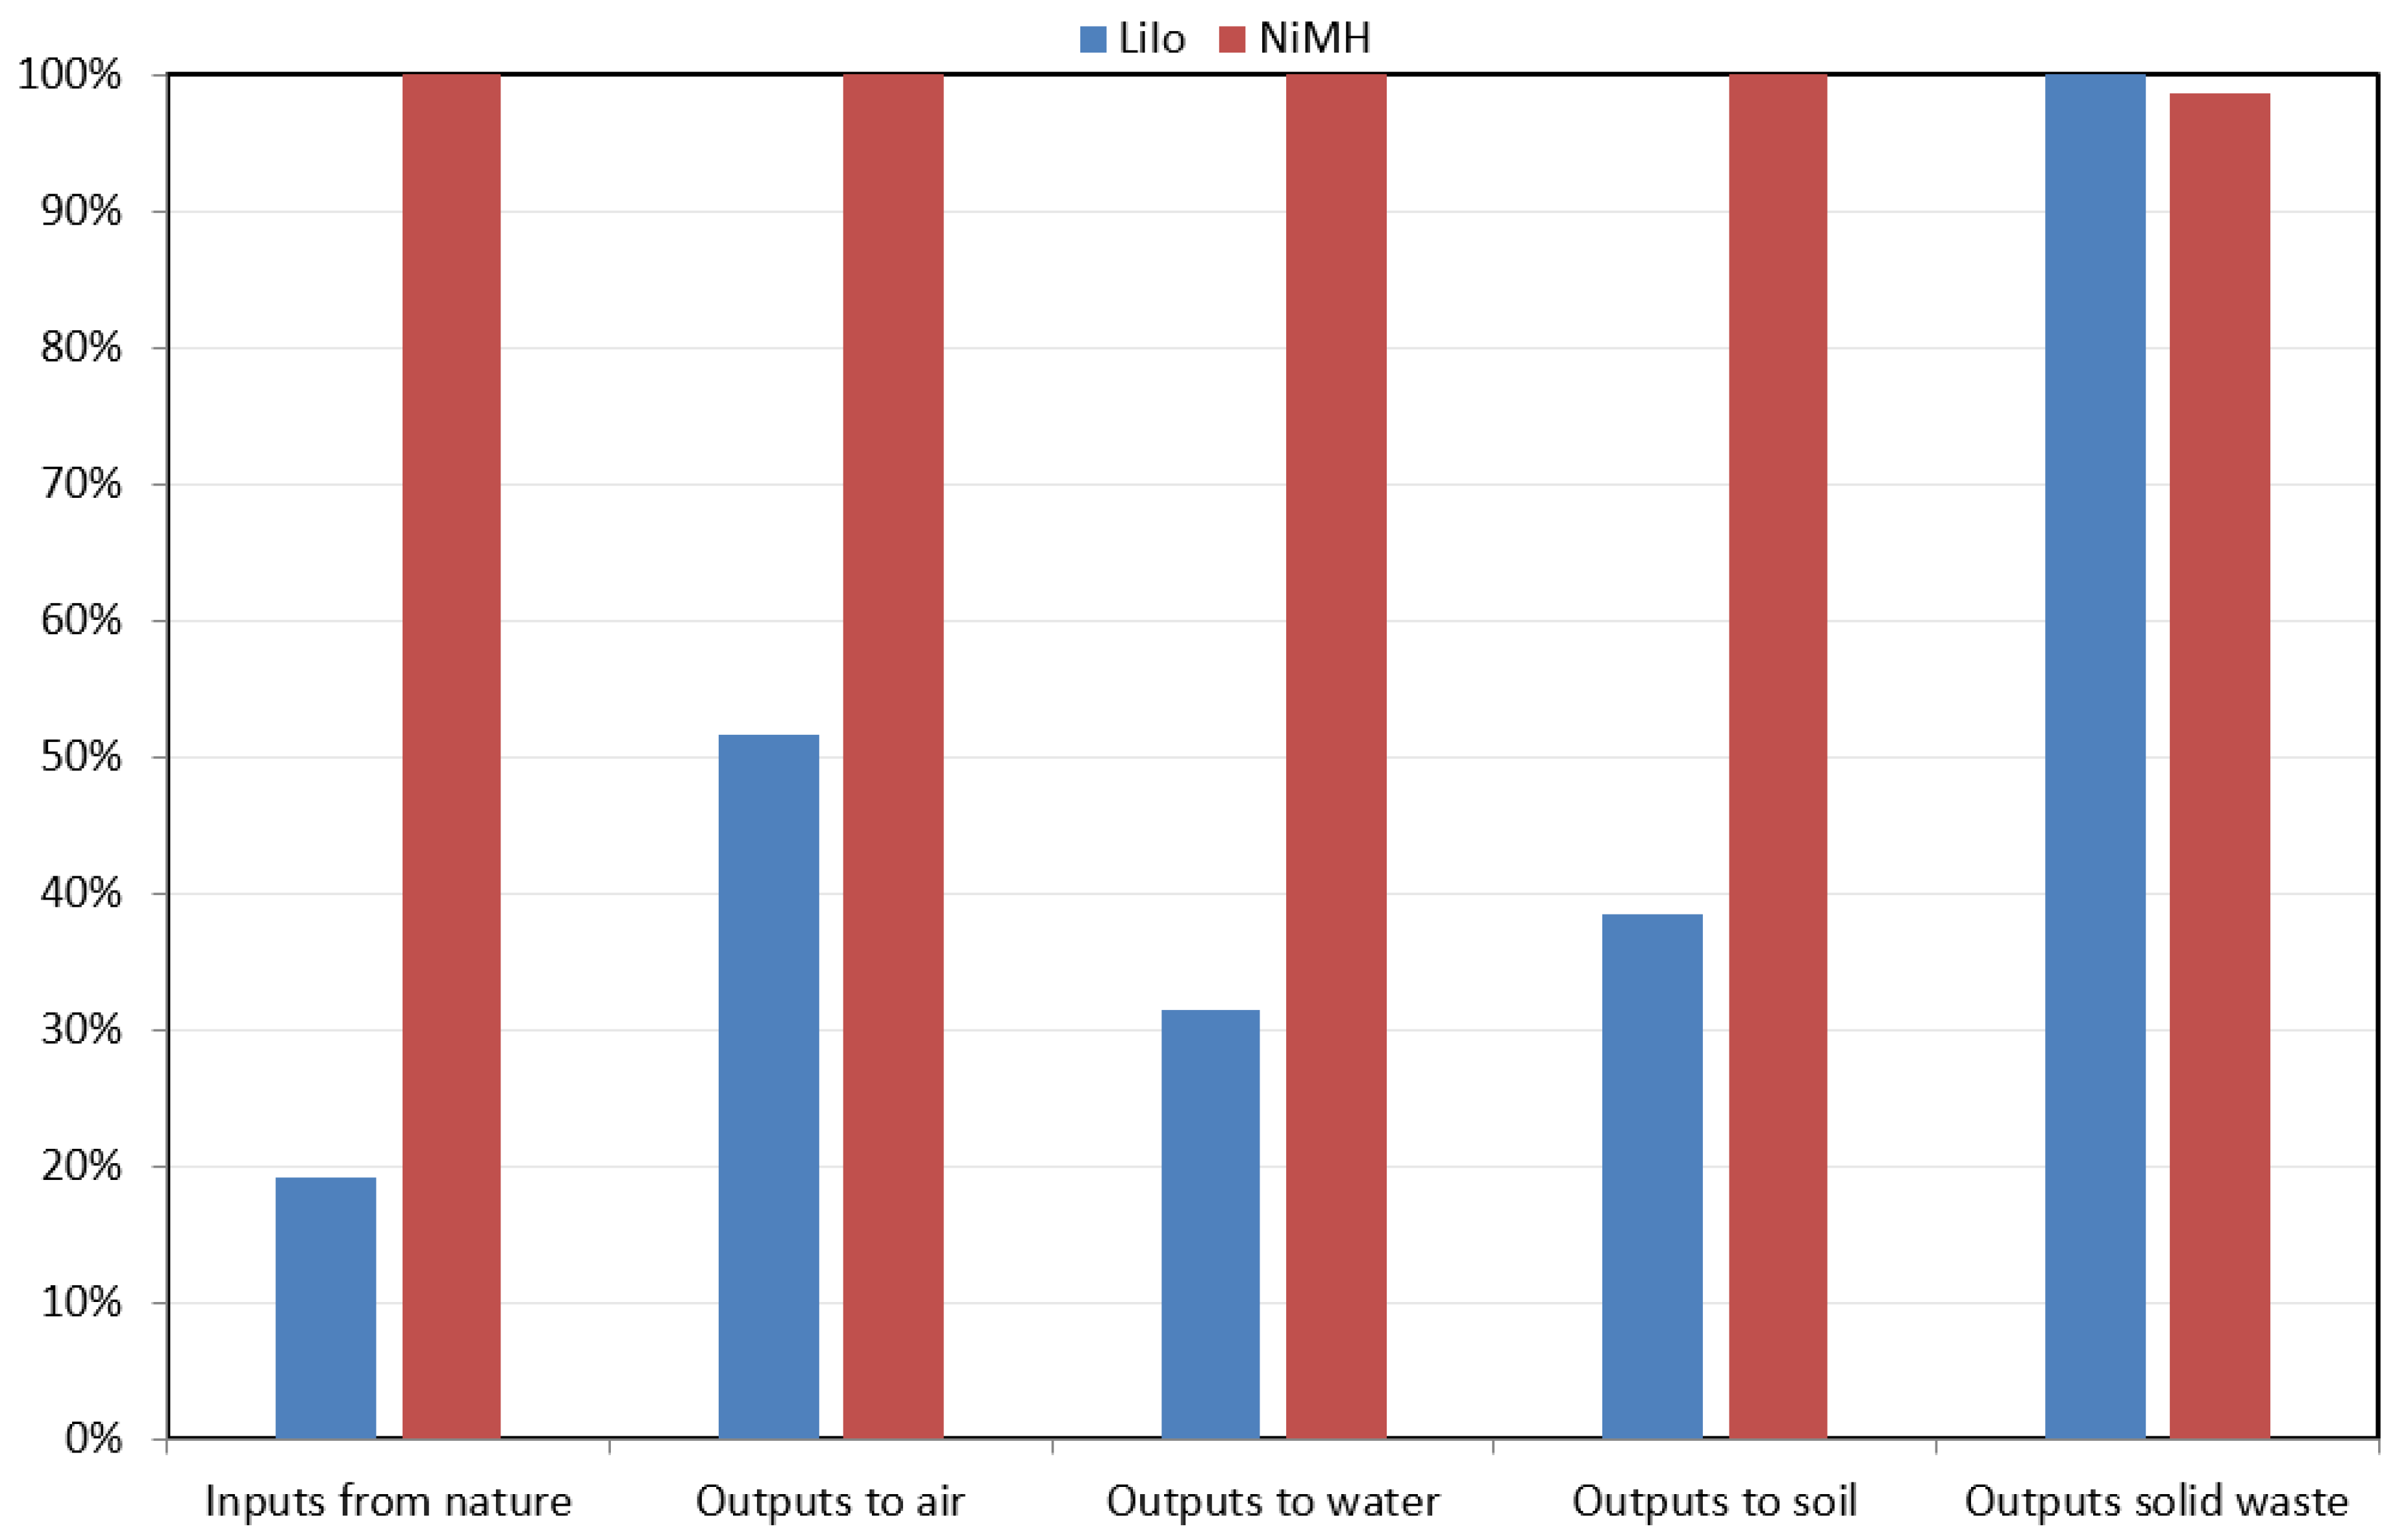
The analysis conducted by using RMF methods shows that, of these two types of batteries, nickel-metal hydride batteries consume a more significant amount of inputs from nature, and consequentially emits more outputs to air, water, soil, and waste. The results are presented in percentages here in Figure 8. The inputs and outputs from NiMH batteries are nearly 100%. The inputs from LiIo batteries are less than 20%. The output from LiIo batteries to air is 50%, to soil it is 38%, to water it is 32% and to waste it is 100%. Overall, the emissions to air, water, and land are more significant from NiMH batteries, but the waste emission is larger for LiIo batteries.
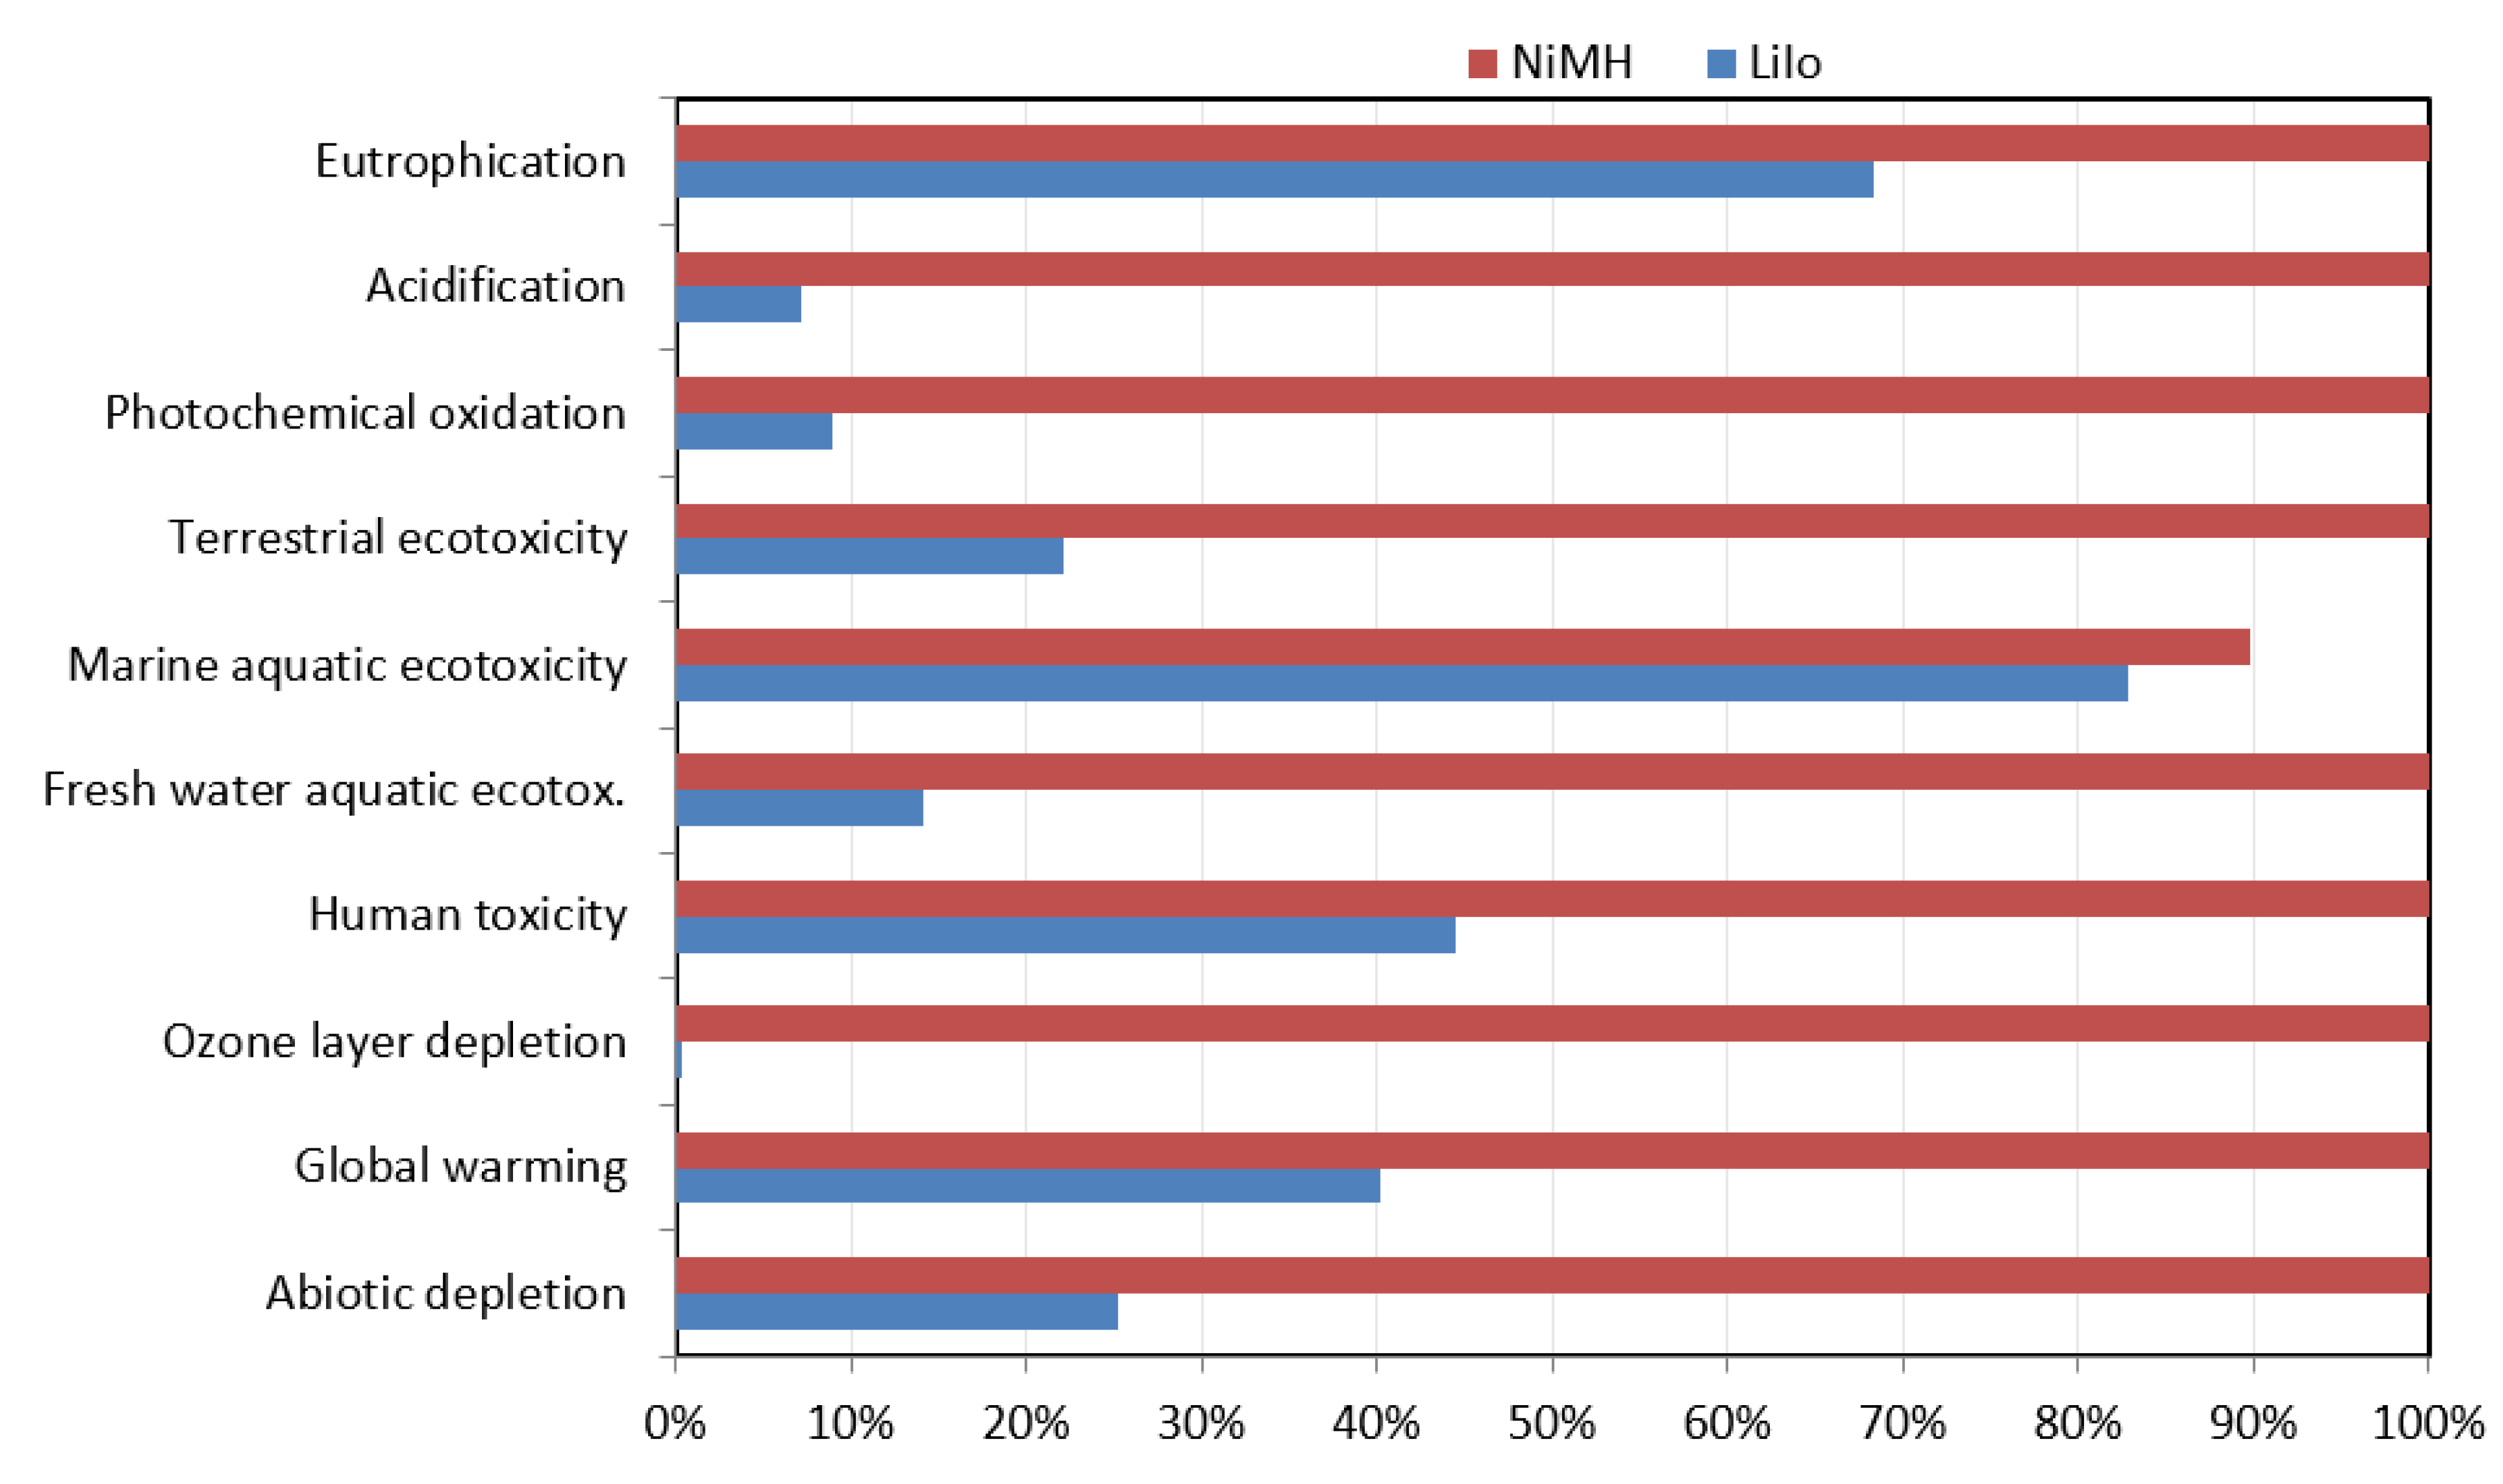
4.2. CML Method
The results obtained from the CML method show a comparative analysis between NiMH and LiIo batteries are based on ten impact categories. According to the analysis results presented in Figure 9, NiMH batteries have a significant impact on global warming, human toxicity, marine aquatic ecotoxicity, and acidification. As the comparative results are presented herein as percentages, it is evident that NiMH contributes nearly 100% for most of the categories, where LiIo contributes much less. The LiIo batteries have a significant impact on global warming (40%), human toxicity (45%), marine aquatic ecotoxicity (83%), and eutrophication (68%). Table 5 shows that the global warming value is 7.63 kg CO2 eq. from LiIo batteries and 1.9 × 101 from NiMH batteries. The human-toxicity value from LiIo batteries is 7.38 kg 1,4-DB eq., and from NiMH batteries it is 1.66 × 101 kg 1,4-DB eq. The marine aquatic ecotoxicity value is 8.62 × 10³ kg 1.4-DB eq. from LiIo batteries and 9.35 × 10³ kg 1,4-DB eq. from NiMH batteries. Overall, NiMH batteries are much more impactful to the environment than LiIo batteries.
4.3. ReCiPe Method
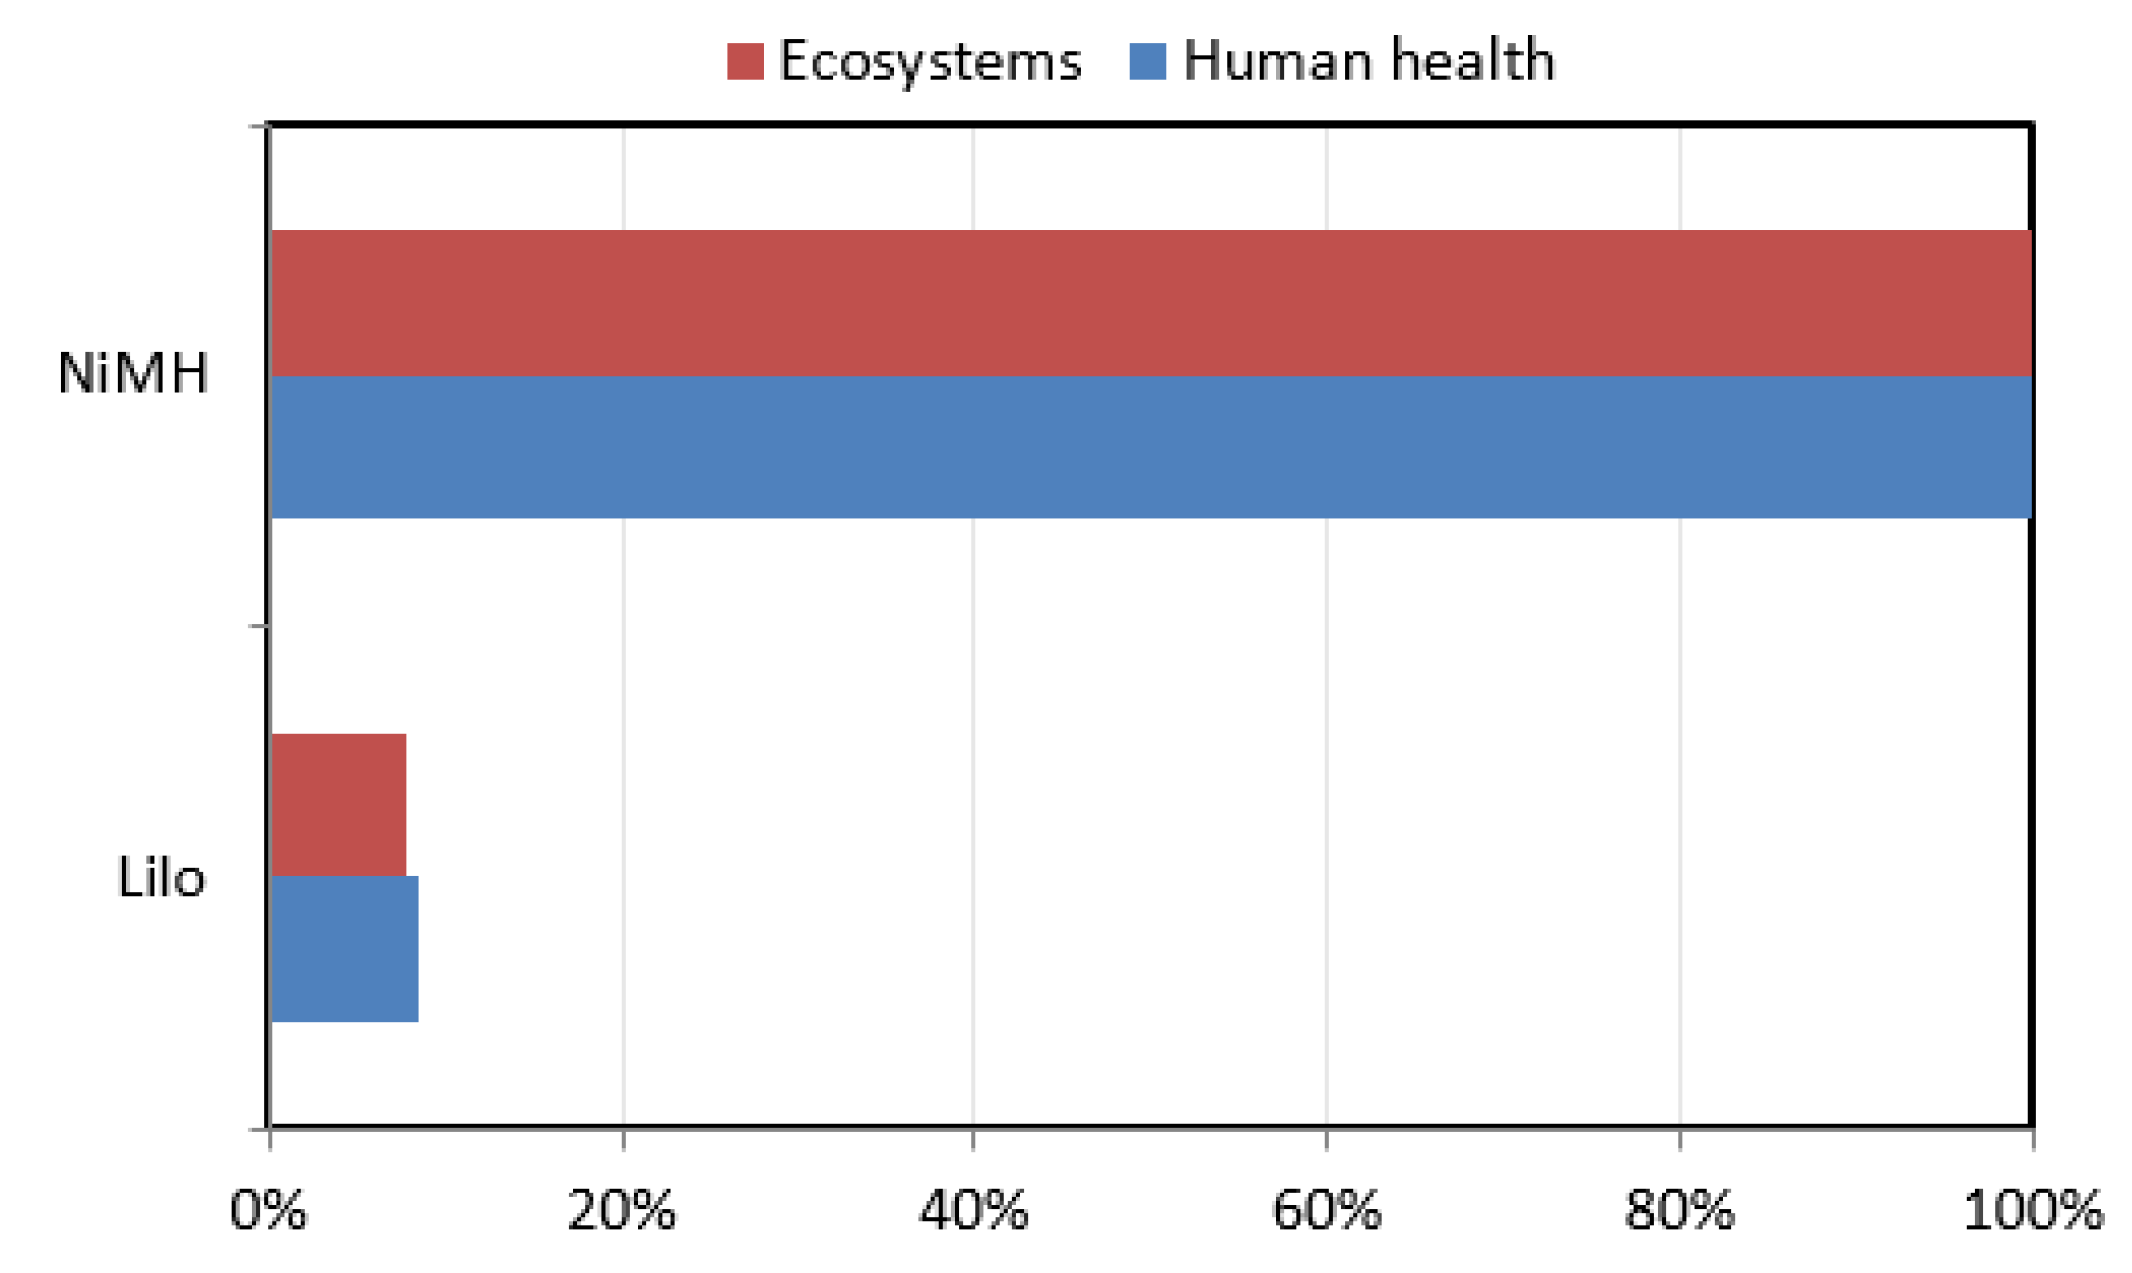
The ReCiPe method based on endpoint indicators is utilized here for conducting LCA analysis of the two different types of batteries. The analysis results in Figure 10 show significantly higher results for NiMH batteries. As the results are presented in percentage values here, the impacts on ecosystems and human health from NiMH batteries are nearly 100%, where as from LiIo batteries the impact is less than 10%.
4.4. EcoPoints 97 Method
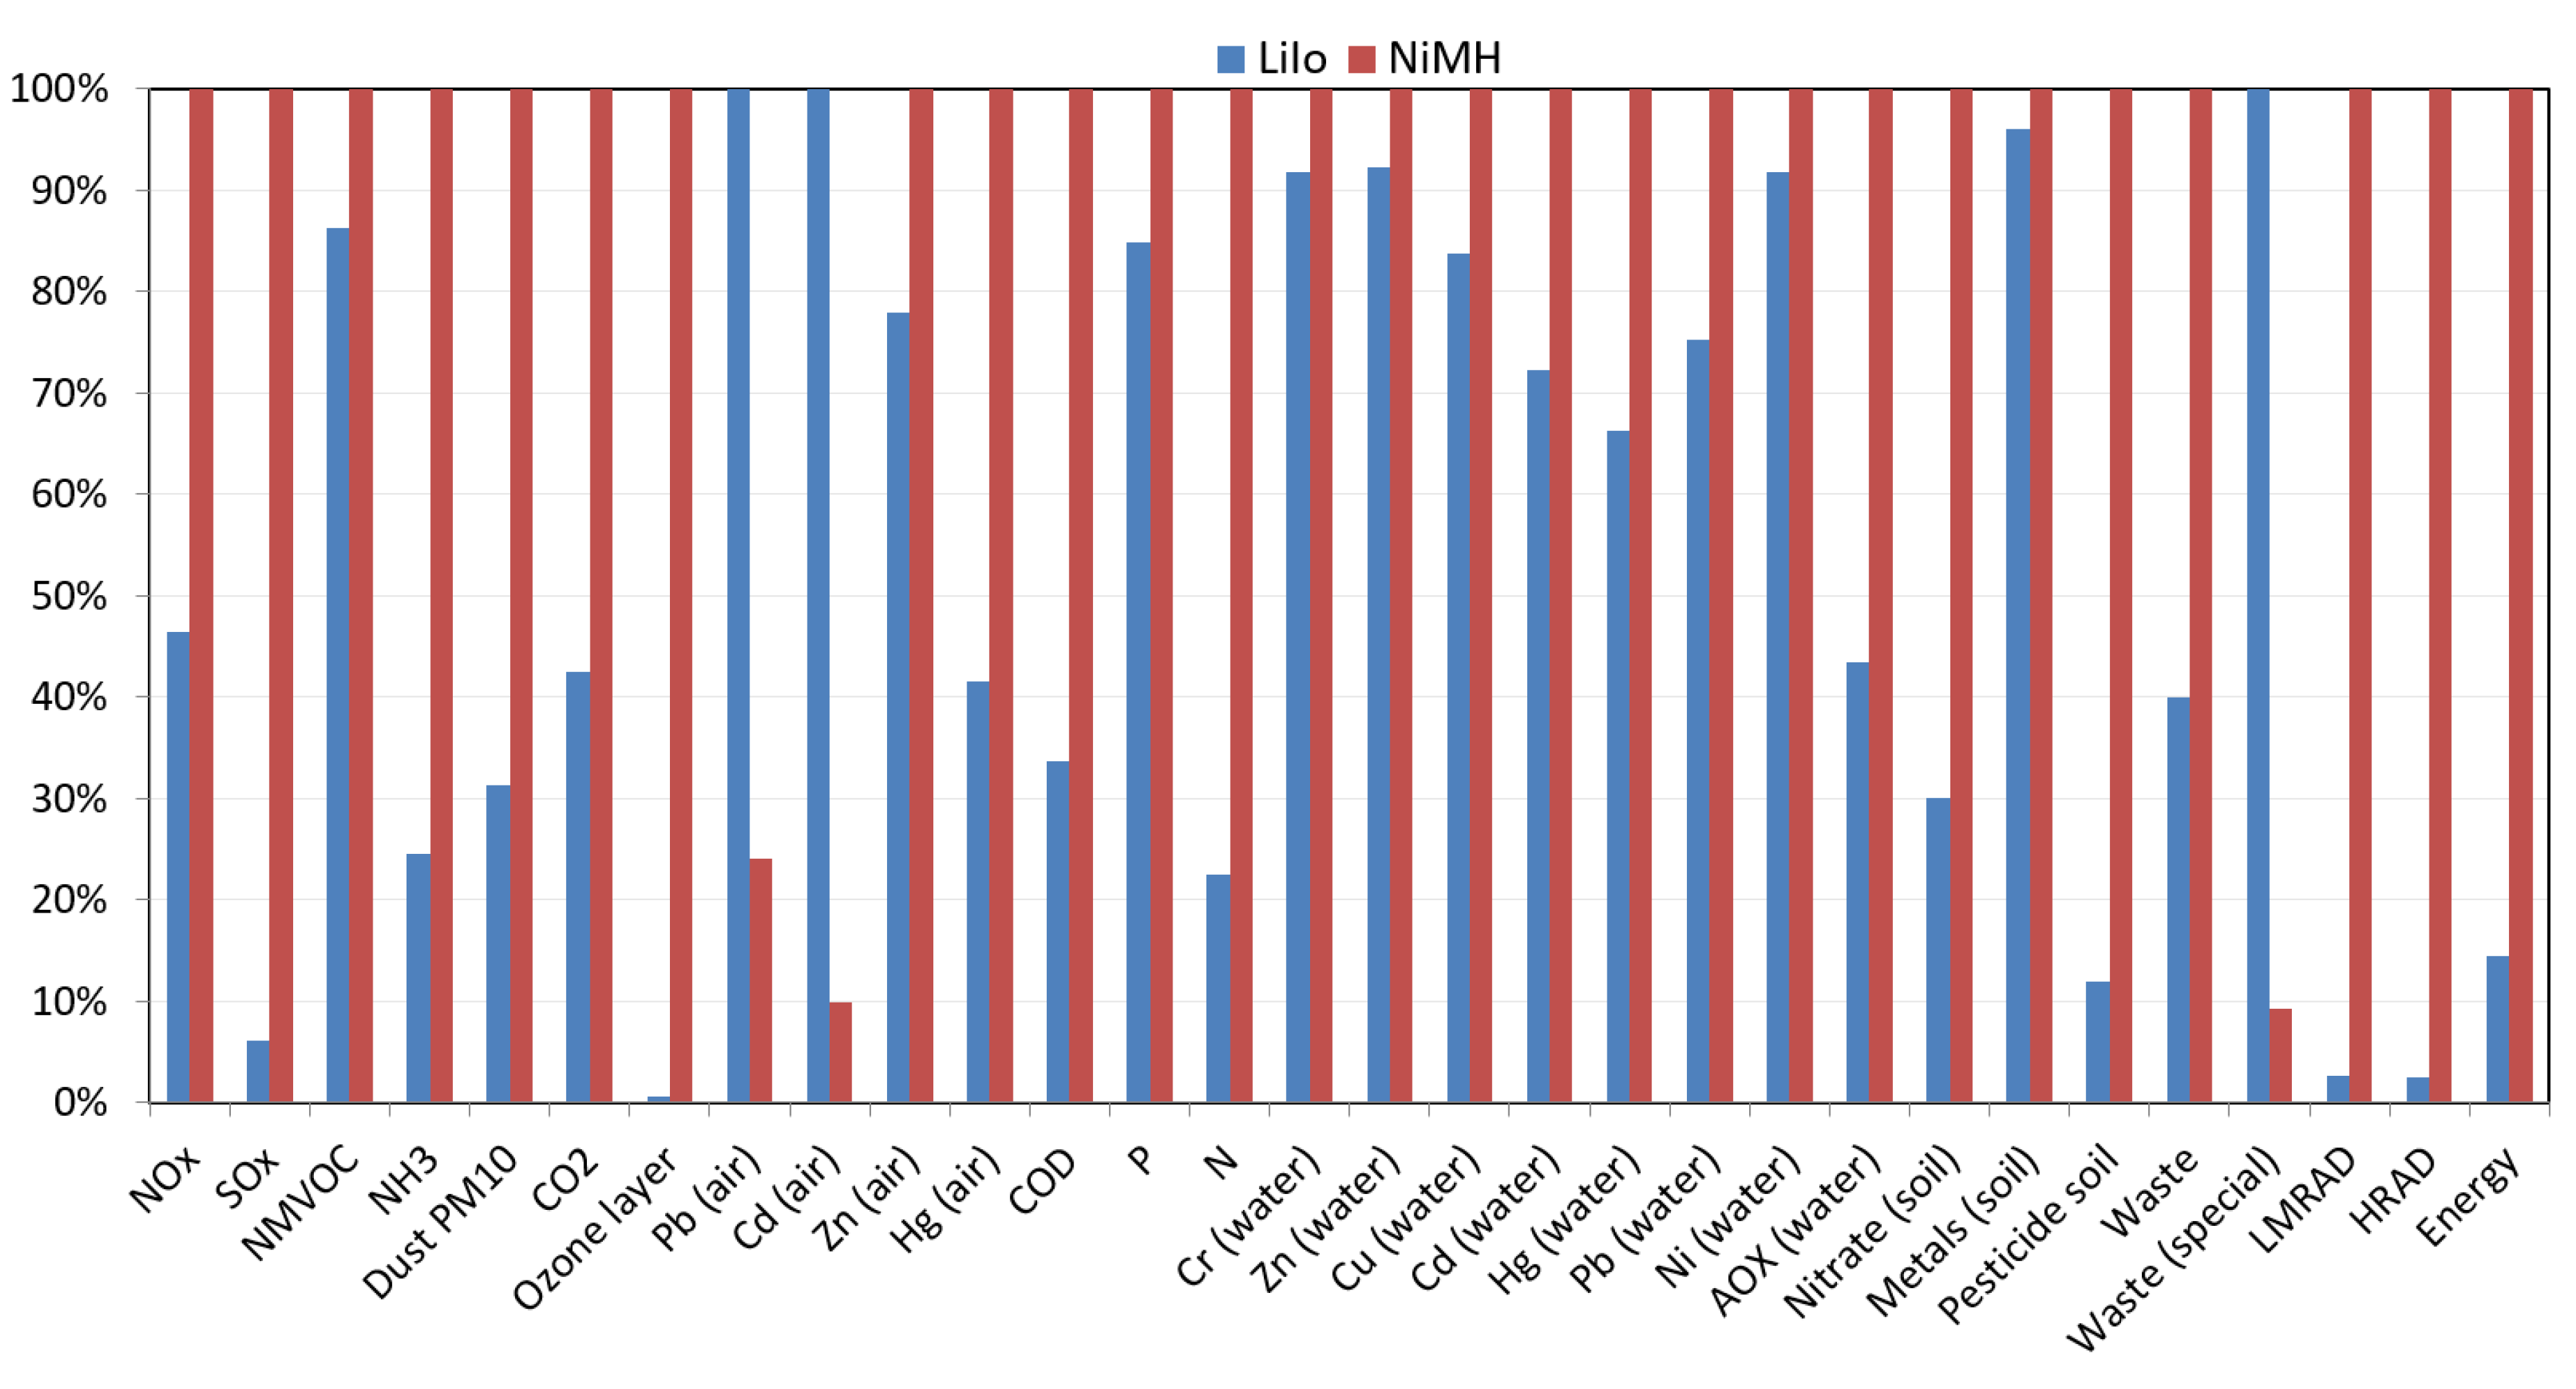
According to the analysis results presented in Table 6 using the EcoPoints 97 method, there are 20 harmful environmental emissions towards the environment from the production of 1 kg of both LiIo and NiMH batteries. Figure 11 indicates that, of these two types of batteries, the NiMH batteries are more detrimental towards the environment, emitting a couple of times higher nitrogen oxides, sulphur oxides, and carbon dioxide emissions than for LiIo batteries. From the production of 1 kg of NiMH batteries, the release of nitrogen oxides, sulphur oxides, and carbon dioxide are 5.47 × 10⁻² kg NO2 eq., 6.15 × 10⁻¹ kg SO2 eq., and 1.95 × 101 kg CO2 eq., respectively. From the production of 1 kg of LiIo batteries, the emission of nitrogen oxides, sulphur oxides, and carbon dioxide are 2.54 × 10⁻² kg NO2 eq., 3.74 × 10⁻² kg SO2 eq., and 8.27 kg CO2 eq., respectively.
4.5. IPCC Method
According to the results found by the IPCC method, the greenhouse-gas emission from LiIo battery is 8.27 kg CO2 eq. (29%) and from NiMH batteries the emission is 19.58 Kg CO2 eq. (71%). So, the greenhouse-gas impacts from NiMH batteries are significantly higher than for LiIo.
4.6. CED Method
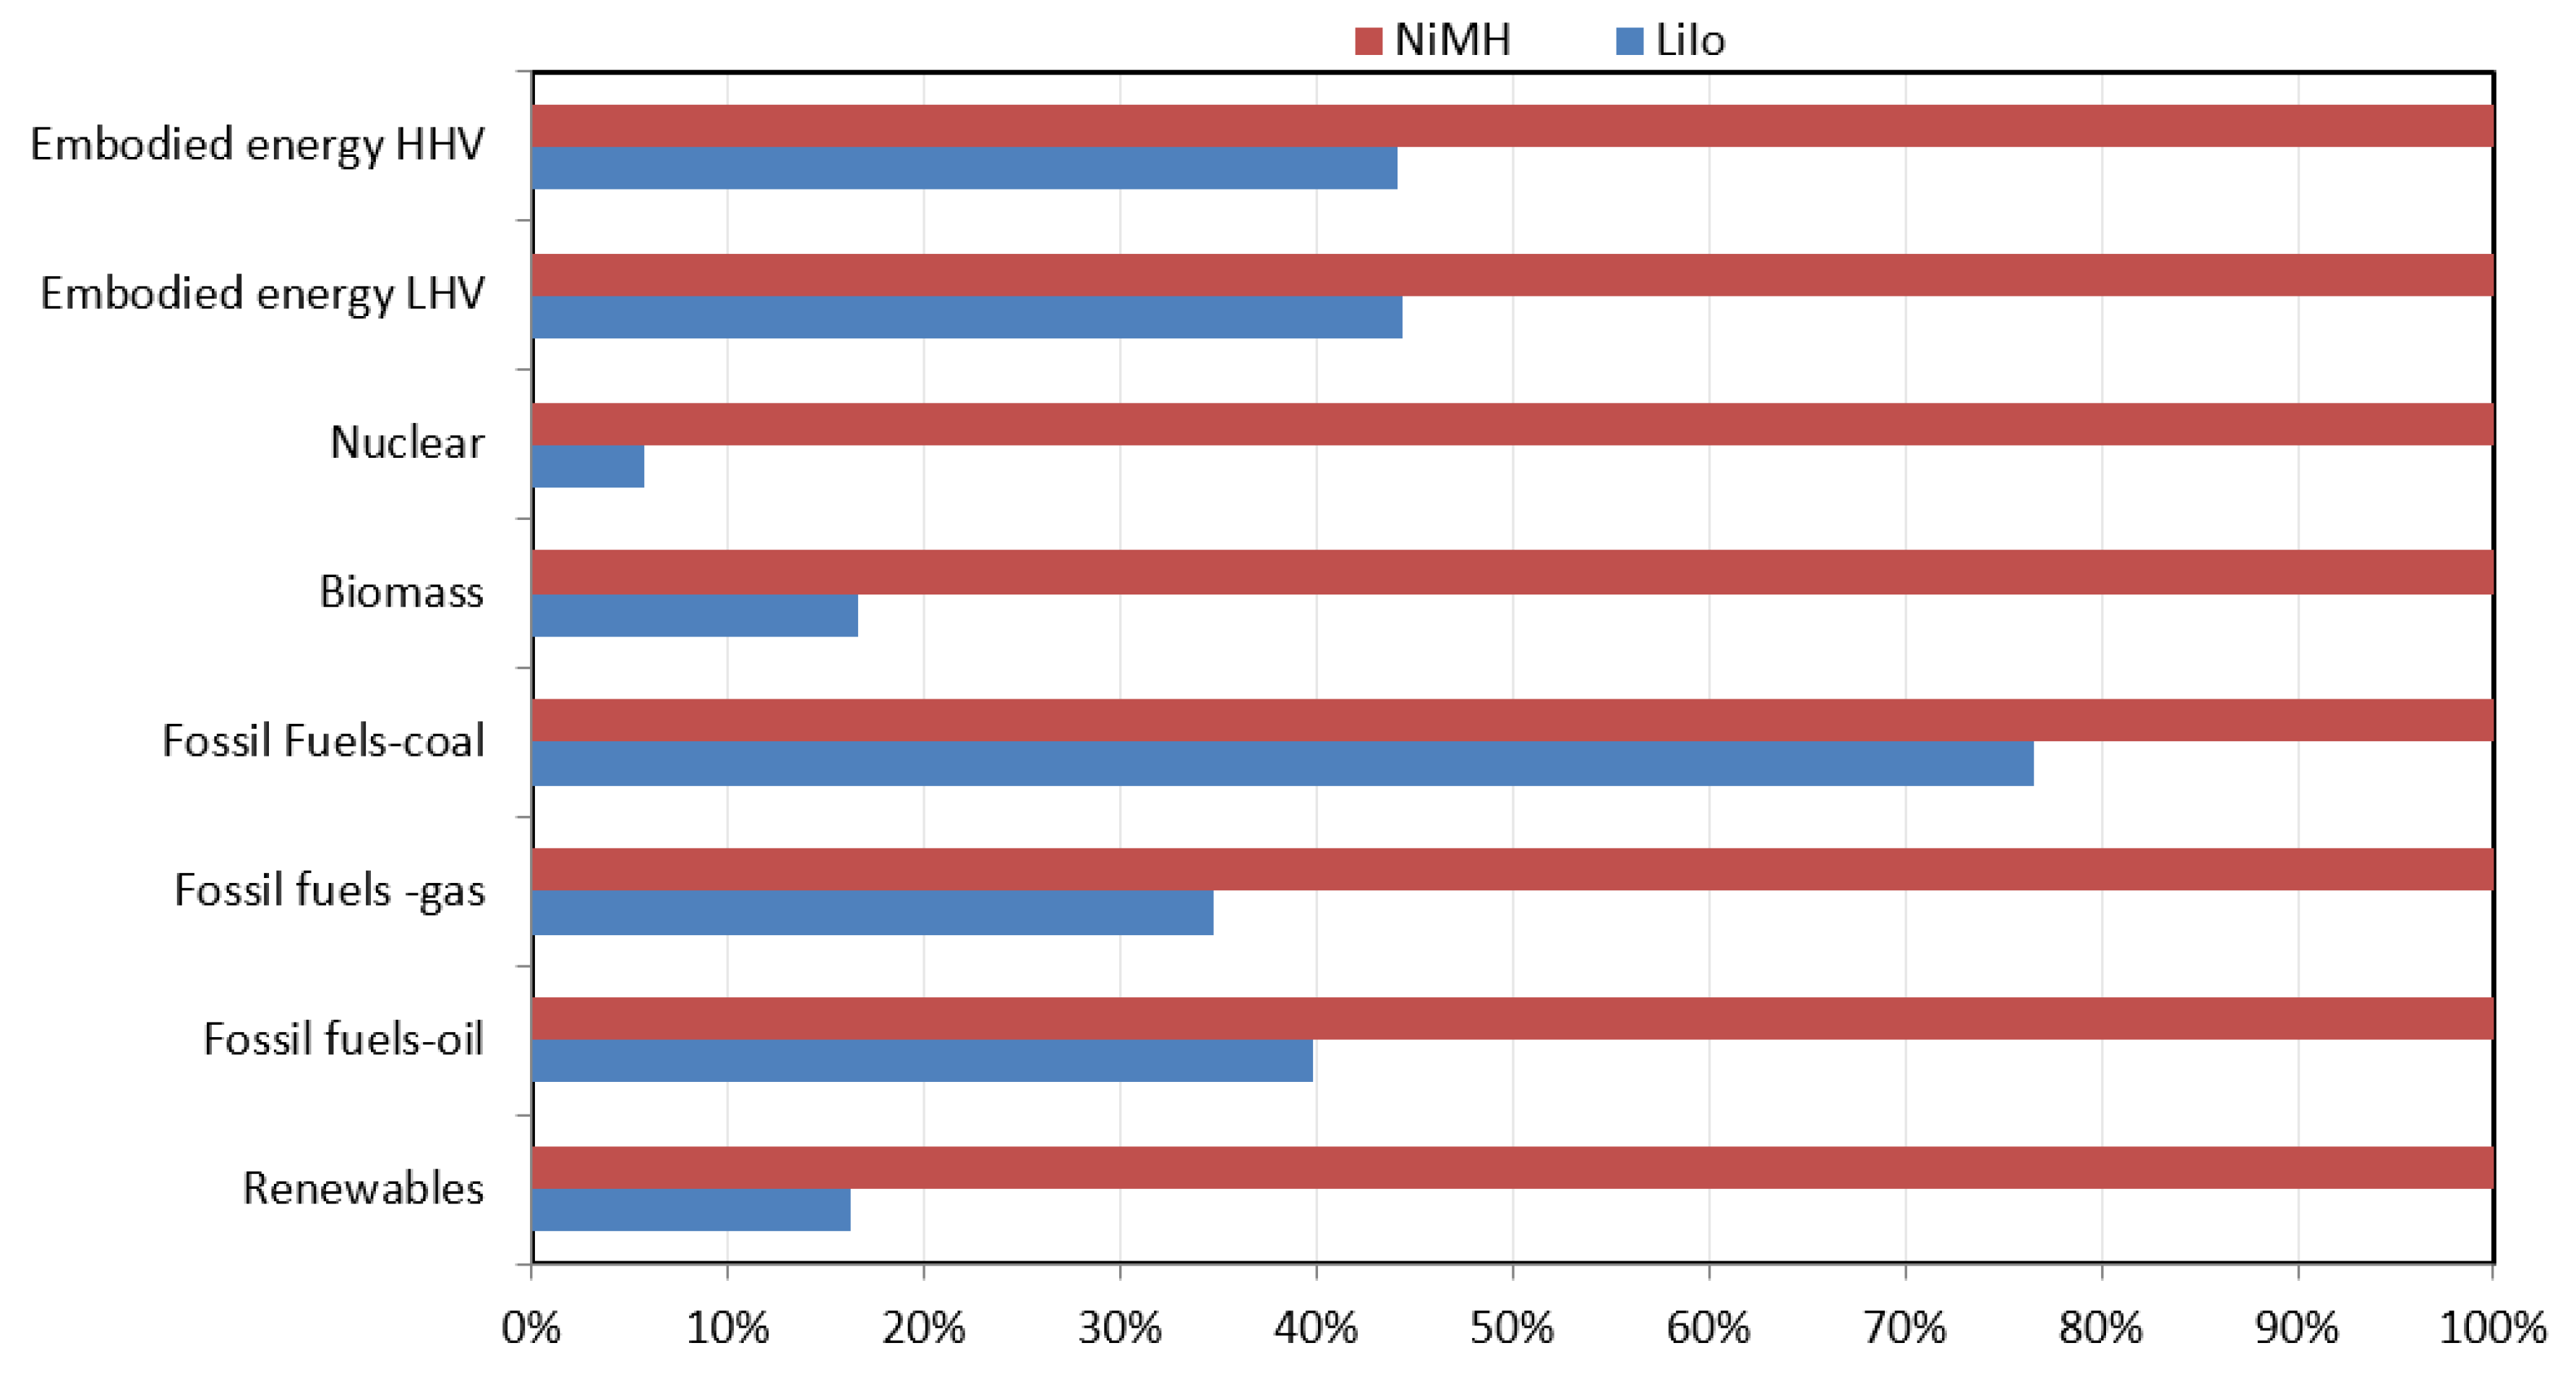
The analysis results based on the CED method show that NiMH batteries are much more energy-intensive than LiIo batteries (Figure 12). NiMH batteries mostly consume fossil fuels, renewables, and embodied energy, which is around 100%. Table 7 shows that the amount of coal-based fossil fuel consumed in the production of 1 kg LiIo is 5.39 × 101 MJ and for the production of 1 kg of NiMH is 7.05 × 101 MJ. The amount of embodied energy req.uired for producing LiIo is 1.02 × 10² MJ (LHV) and 1.05 × 10² MJ (HHV). The amount of embodied energy req.uired for producing NiMH is 2.30 × 10² MJ (LHV) and 2.38 × 10² MJ (HHV). The r enewable energy required for producing LiIo is 3.26 MJ and 2.01 × 101 MJ for NiMH.
5. Discussion
5.1. Impact Outcome Comparison
Finding the impacting elements of batteries and replacing them with alternative environmentally friendly materials without compromising the efficiency can save the environment from hazards. In this research, the most impacting materials used in LiIo and NiMH batteries are found by the CML method for ten different environmental indicators. Table 8 shows the category-wise most impacting materials for 1 kg of battery production.
For the LiIo battery, hydrogen fluoride is responsible for the highest impact of marine aquatic ecotoxicity with a rate of 4.83 × 10³ kg 1,4-DB eq., whereas methane is mostly accountable for ozone-layer depletion (7.20 × 10⁻⁸ kg CFC-11 eq.). The consumption of fossil fuels in the lifetime of a LiIo battery are the main reason for global warming (4.97 kg CO2 eq.). Nickel is mainly liable for freshwater aquatic ecotoxicity (4.20 × 10⁻² kg 1,4-DB eq.) and terrestrial ecotoxicity (7.74 × 10⁻³ kg 1,4-DB eq.). Abiotic depletion impact (5.24 × 10⁻⁵ MJ) mostly occurs due to the coal mining. Moreover, the use of sulphur dioxide is primarily accountable for acidification (2.91 × 10⁻² kg PO4 eq.) and photochemical oxidation (1.17 × 10⁻³ kg C2H4 eq.) by LiIo batteries. Therefore, it is essential to minimize or replace the use of the most impacting materials such as hydrogen fluoride, nickel, fossil fuels etc. in LiIo battery production for better environmental performance.
For the NiMH battery, the highest impacting indicator is marine aquatic ecotoxicity due to the use of hydrogen fluoride, with a rate of 3.07 × 10³ kg 1,4-DB eq., while ozone-layer depletion is the lowest affecting category (2.23 × 10⁻⁵ kg CFC-11 eq.), mostly from methane. The second-maximum effect from this type of battery is the human-toxicity indicator (8.34 kg 1,4-DB eq.) due to the use of cobalt. Global warming is the third-highest impacting category for the NiMH battery with a rate of 6.06 kg CO2 eq., mainly for fossil-fuel consumptions during the production. Therefore, the use of methane, hydrogen fluoride, cobalt etc. should be decreased to save the environment from the hazards of NiMH batteries.
5.2. Comparison of the Findings with Existing Studies
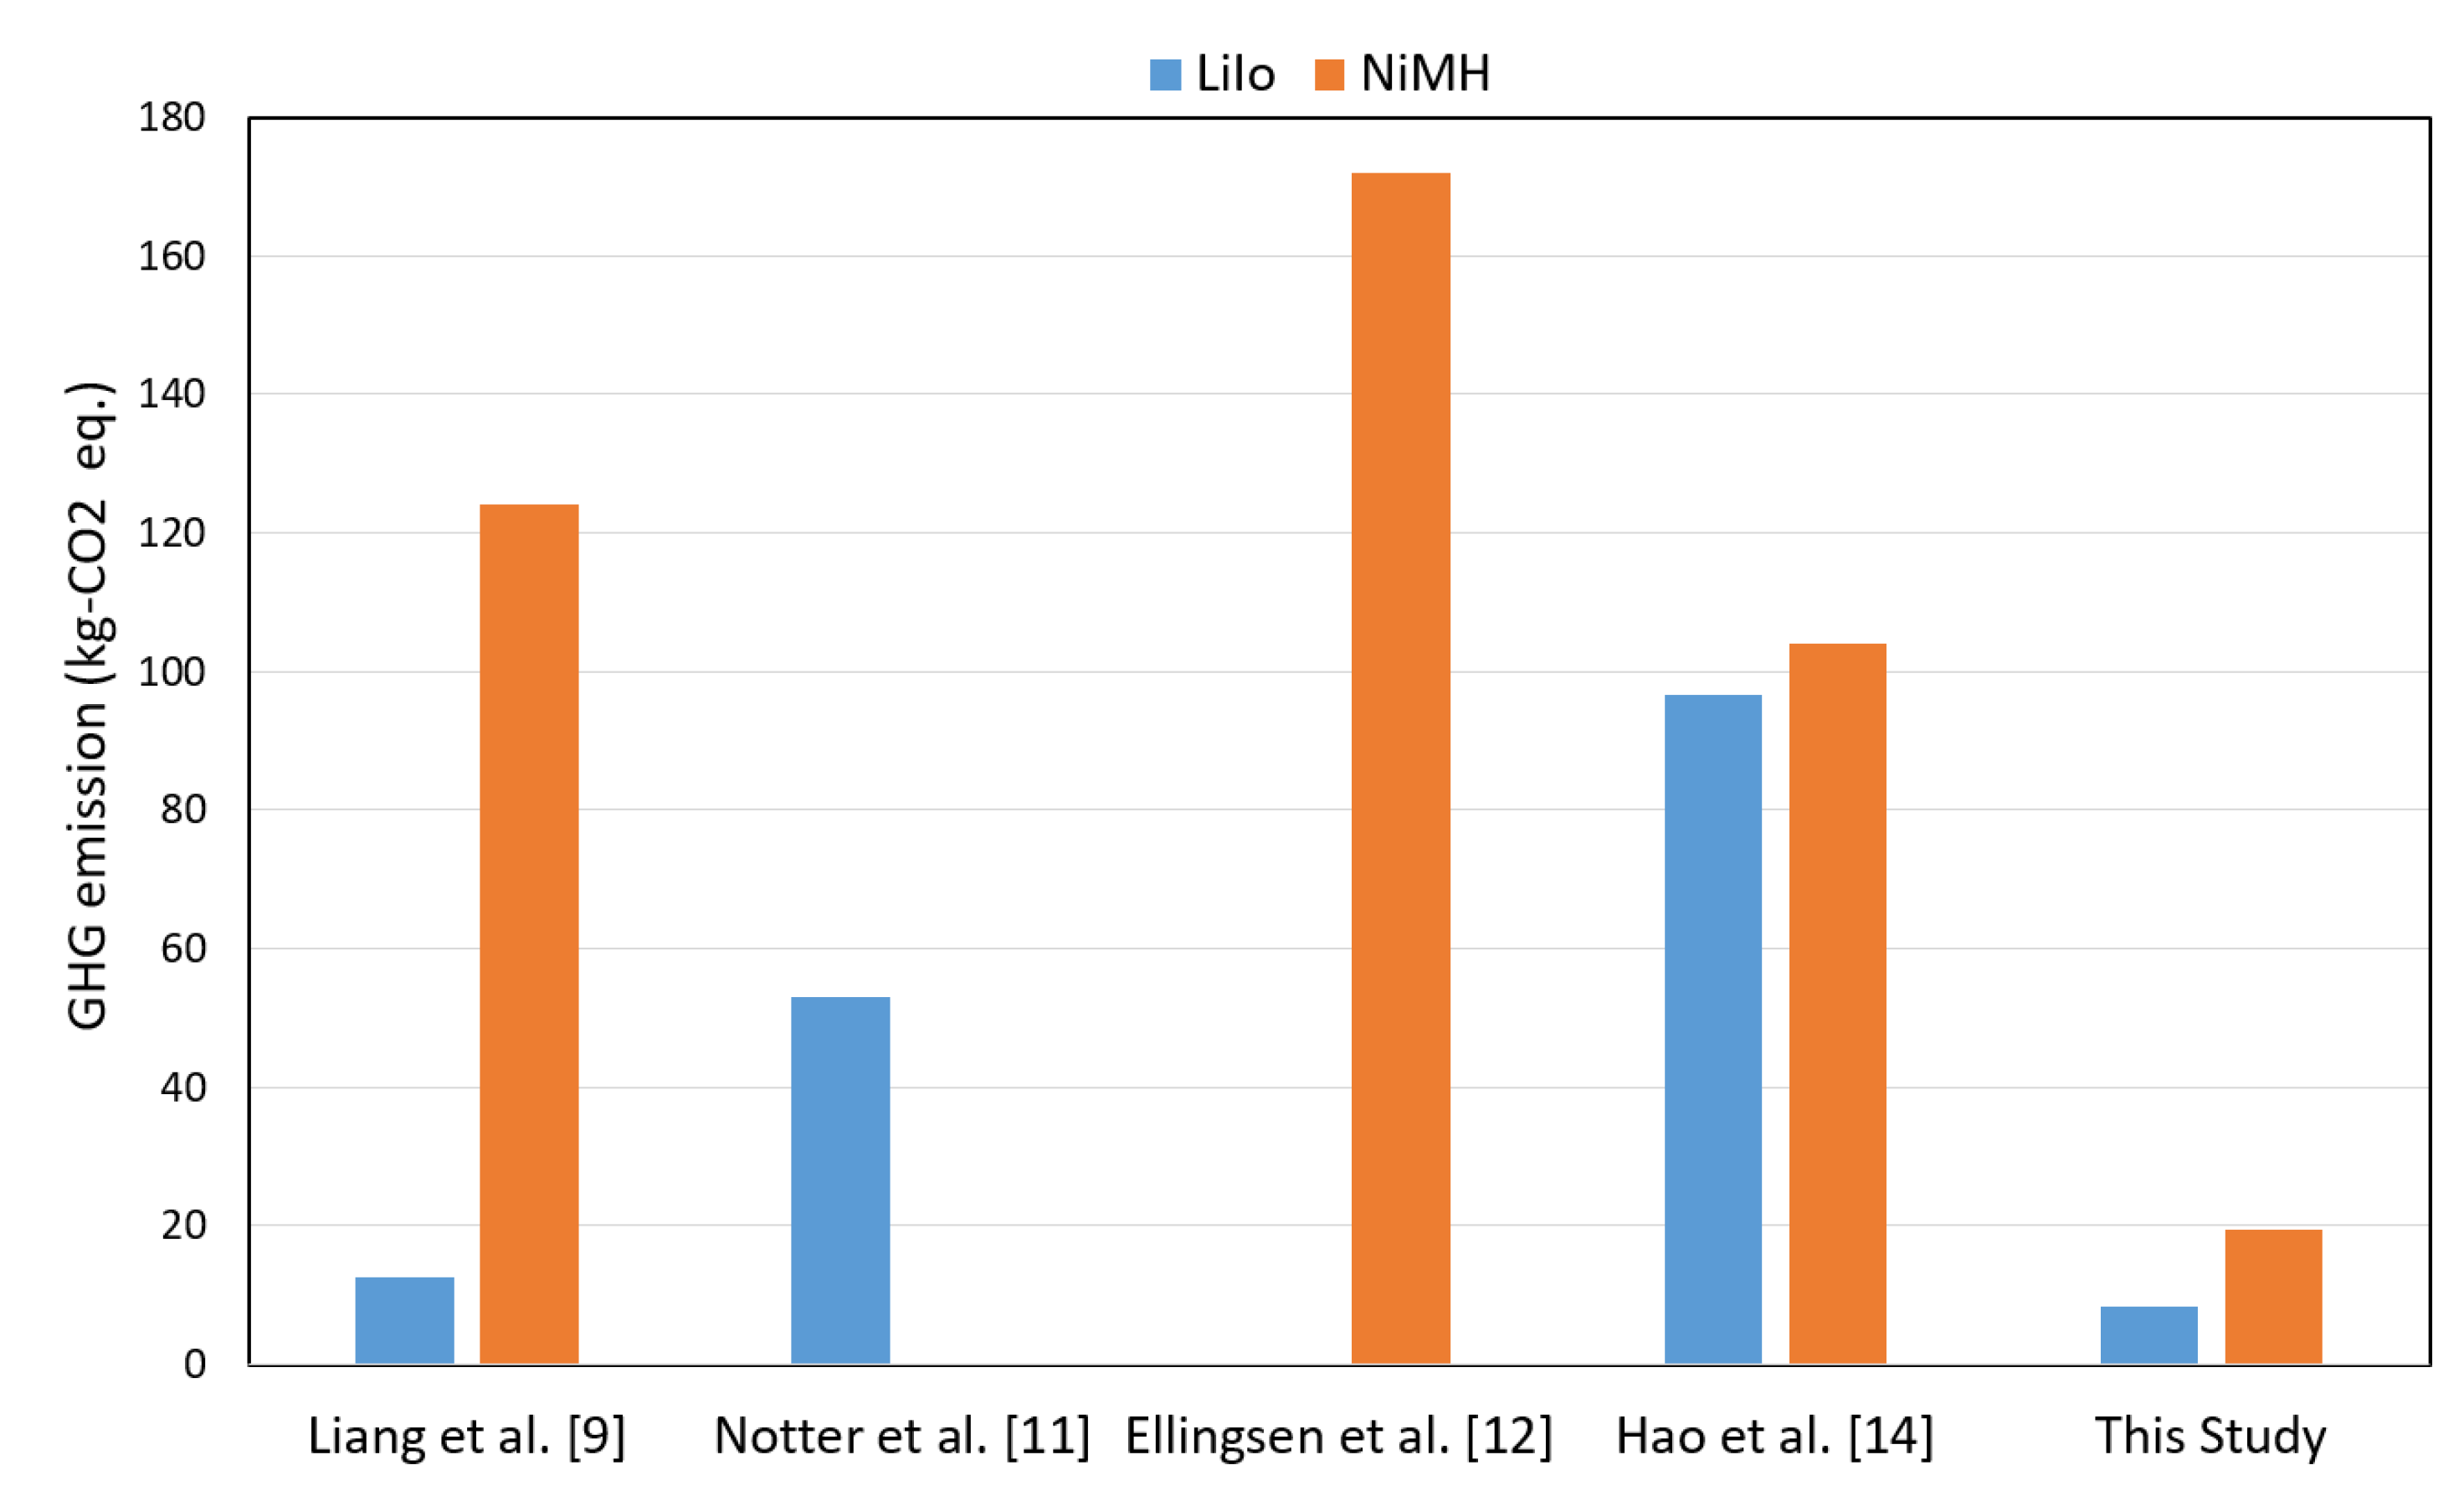
This paper assesses and compares the lifetime impacts of LiIo and NiMH batteries considering production in Japan. The outcome is compared (Figure 13) with the past contributions of similar batteries but different materials and locations. A recent contribution by Liang et al. [9] showed that a LiIo battery has a GWP effect of 12.5 kg CO2 eq., whereas Notter et al. [11] stated that approximately 53 kg CO2 eq. is the amount of GWP effect by a similar category of batteries. In this work, about 8.27 kg CO2 eq. is found by a LiIo battery produced in an Asian geographic location. Research of Ellingsen et al. [12] highlighted approximately 172 kg CO2 eq. of GWP effect by a NiMH battery. Another previous work by Hao et al. [14] shows that the GWP effect by a NiMH battery is about 104 kg CO2 eq., which is produced in China. However, in this work a NiMH of Japan gives approximately 19.5 kg CO2 of GWP effect, which is much less than Hao et al. and Liang et al. (124 kg CO2 eq.) [9]. Overall, the change in geographical location of battery plants, the used specimens, and the constituents of batteries provide a different environmental impact outcomes. This work shows that Japan gives superior environmental profiles than other countries of the literature such as China, Korea, etc.
6. Uncertainty Analysis
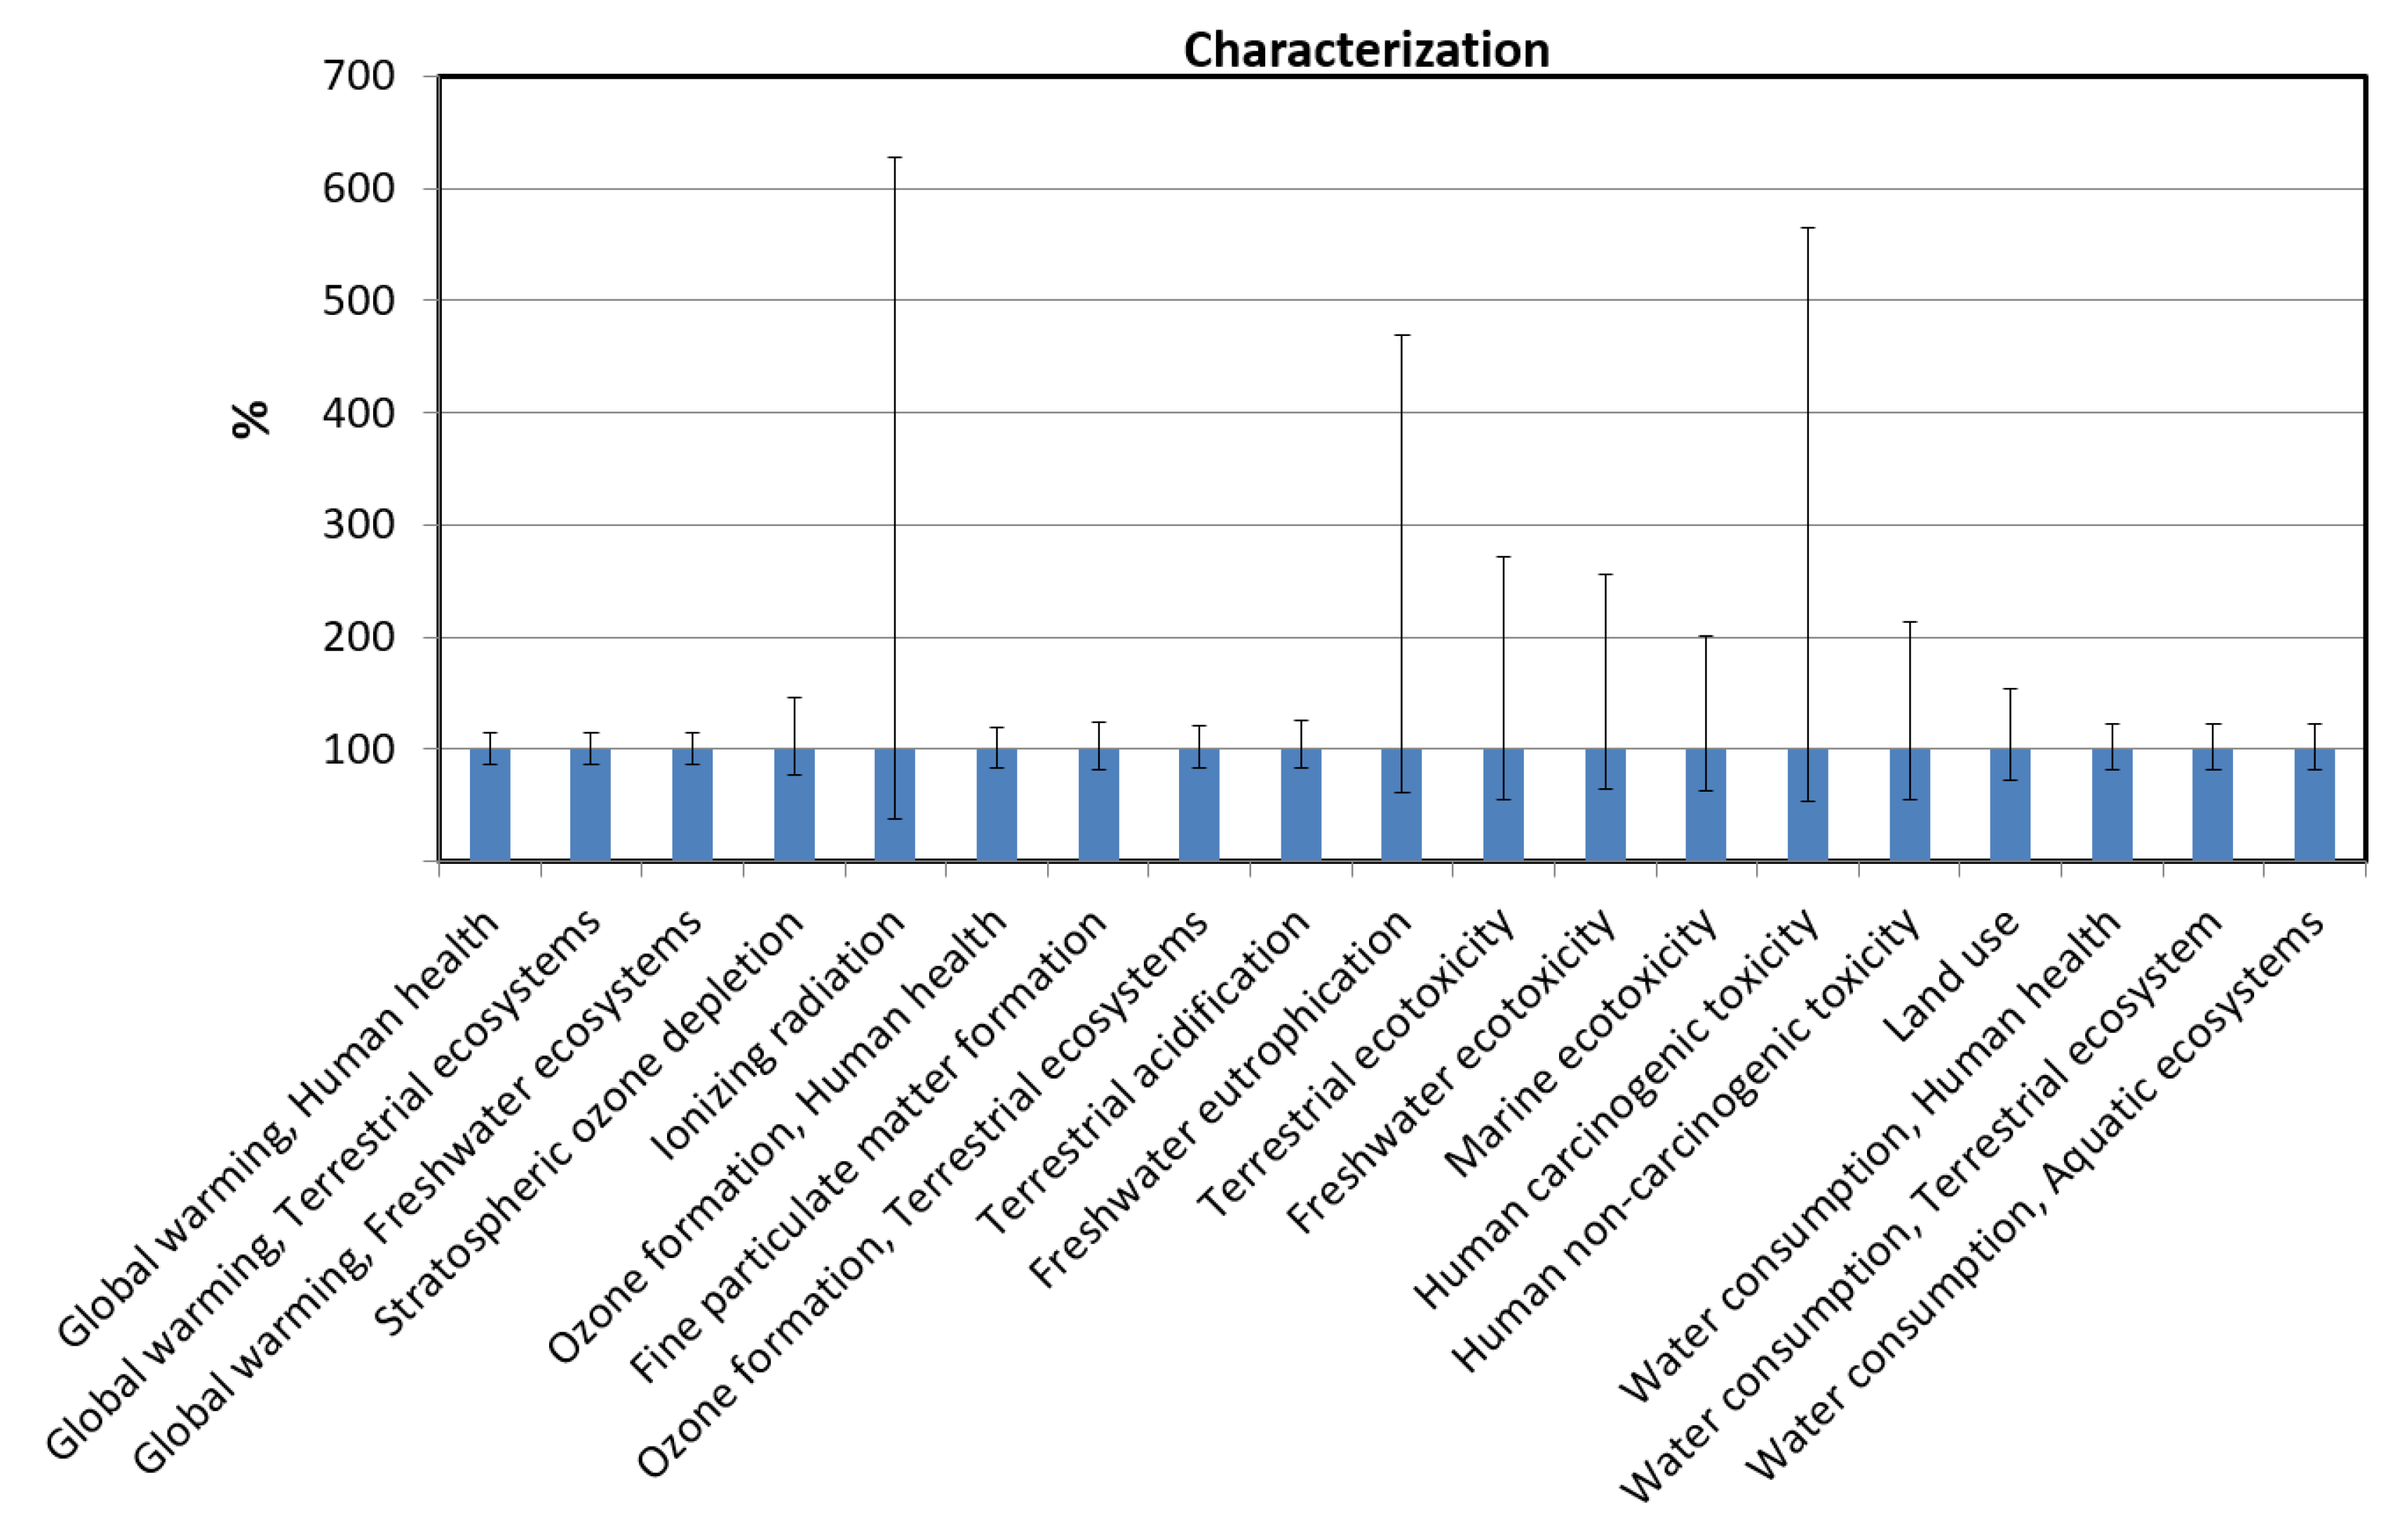
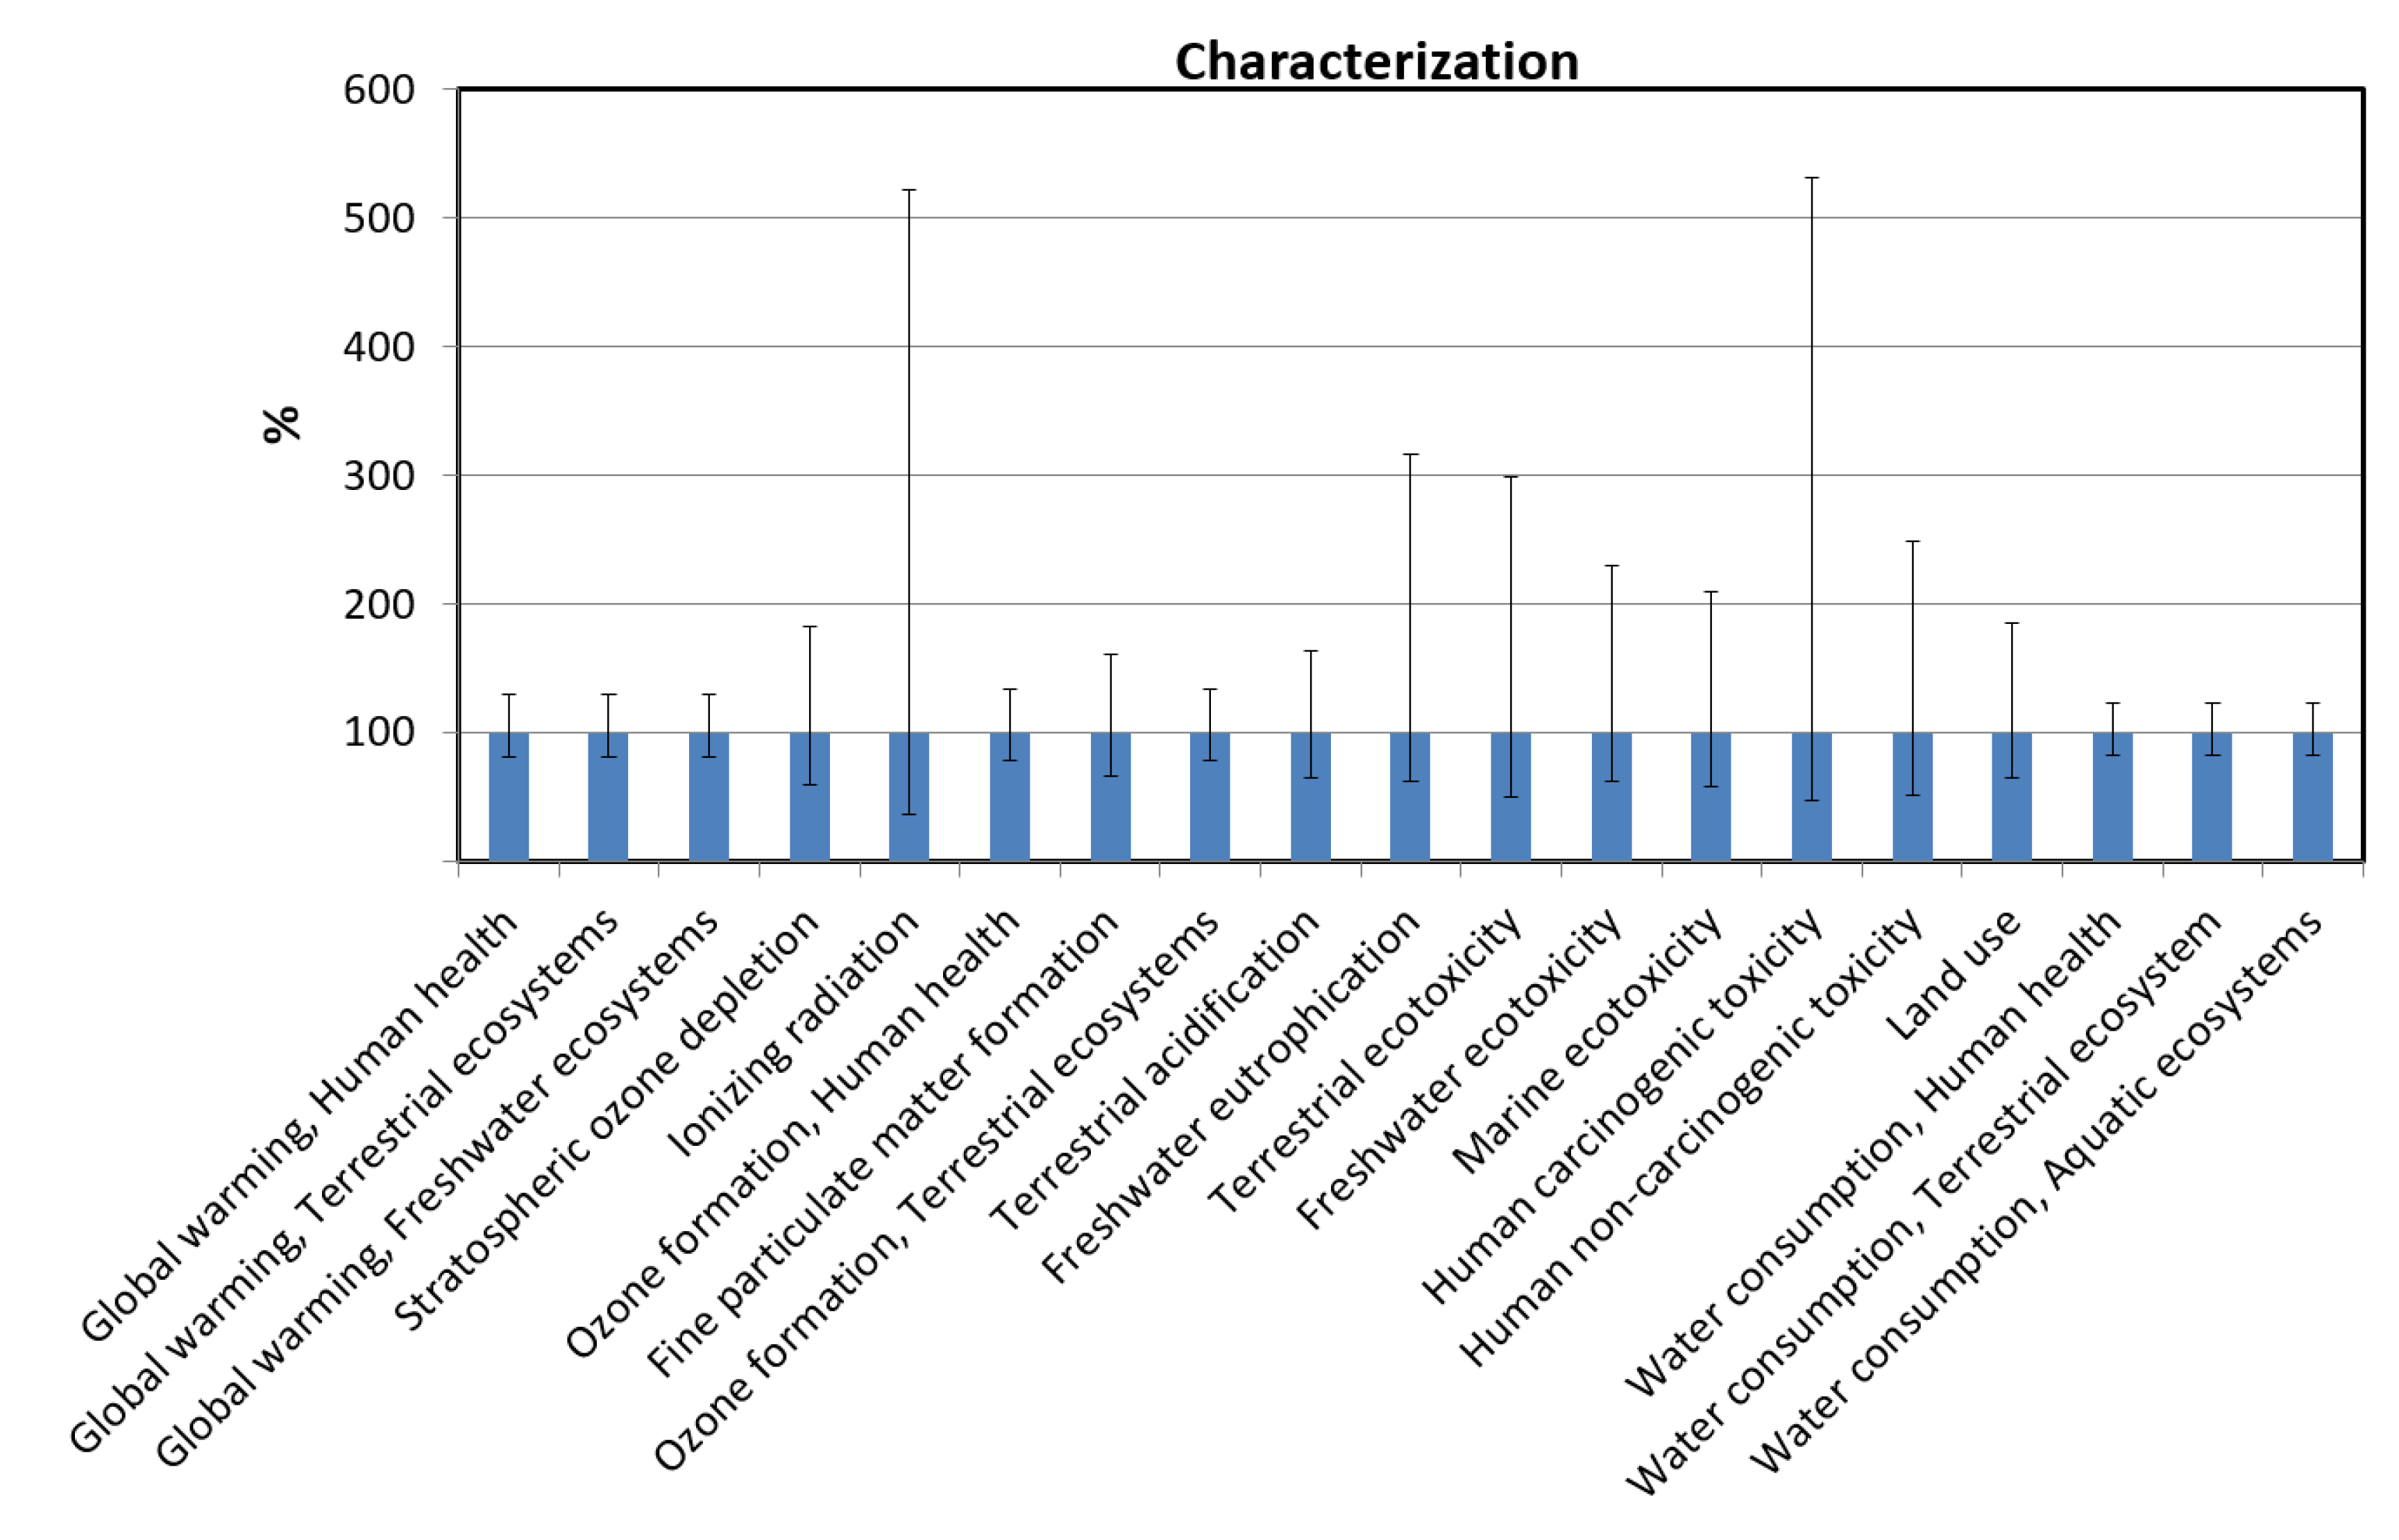
Uncertainty analysis is used to validate the accuracy of the datasets because in most cases the datasets are aggregated, averaged, and finalized based on several sources of data. In this study, the uncertainty of both LiIo and NiMH batteries are tested based on their uncertainty. The results of probability distributions for the batteries are shown in Figure 14 and Figure 15. In both of the distributions, the peak bars represent the amounts of maximum uncertainties. The outcome demonstrates that an unusual amount of probability exists in the categories of ionizing radiation, freshwater eutrophication, and human carcinogenic toxicity for LiIo batteries. On the other hand, NiMH batteries provide a substantial rate of uncertainty for the impact indicators of human carcinogenic toxicity and ionizing radiation. The rate of uncertainty present for the other impact categories is small, which proves that the used inventory datasets for LCA analysis of both of the batteries are robust.
7. Limitations
The limitations of this research are as follows:
- The environmental effects of rechargeable batteries other than LiIo and NiMH have not been considered in this research due to lack of robust datasets.
- The environmentally friendly substitution of dangerous battery constituents to escape from environmental hazards without degrading their performance has not been investigated.
- Means of abating fossil-fuel consumption in the manufacturing of batteries have not been studied.
- Economic analysis of the battery technologies has not been performed.
Further extension of this work could alleviate the shortcomings as mentioned above, and find a solution to escape from the dangerous impacts of the battery technologies by utilizing renewable energy sources and environmentally friendly materials for cleaner production and disposal.
8. Conclusions
In this paper, the environmental impacts of LiIo and NiMH batteries are assessed and compared through life cycle analysis by the CML, ReCiPe, EcoPoints 97, CED, and IPCC methods. The assessment is carried out by accomplishing all the required steps such as defining the goal and scope, developing the life cycle inventories, evaluating the effects and interpreting the impacts, using SimaPro software and the Ecoinvent database. The outcome reveals that LiIo batteries release lower greenhouse gases and metals such as carbon dioxide (8.27 kg CO2 eq.), nitrogen oxide (2.54 × 10⁻² kg NO2 eq.), sulfur oxide (3.74 × 10⁻² kg SO2 eq.), ammonia (9.53 × 10⁻⁴ kg), phosphorous (4.89 × 10⁻⁵ kg), lead (9.85 × 10⁻⁵ kg), cadmium (1.20 × 10⁻⁵ kg), zinc (6.15 × 10⁻⁵ kg) and mercury (5.19 × 10⁻⁷ kg) than NiMH batteries. Moreover, LiIo batteries use less fossil fuel than NiMH in their lifetime. However, the uncertainty analysis shows that the inventory datasets of the batteries are robust due to smaller variability in most of the impact categories. Overall, LiIo batteries are better for the environment than NiMH batteries for most of the impact indicators such as abiotic depletion (5.23 × 10⁻⁵ MJ), acidification (5.49 × 10⁻² kg SO2 eq.), human toxicity (7.38 kg 1,4-DB eq.), ozone layer depletion (2.90 × 10⁻⁷ kg CFC-11 eq.), freshwater aquatic eco-toxicity (1.60 × 10⁻¹ kg 1,4-DB eq.), marine aquatic eco-toxicity (8.62 × 10³ kg 14-DB eq.), terrestrial eco-toxicity (2.63 × 10⁻² kg 1,4-DB eq.) and photochemical oxidation (2.70 × 10⁻³ kg C2H4 eq.). These outcomes will help researchers to avoid the hazardous effects of batteries by replacing the impacting constituents with the environmentally friendly alternatives.
Author Contributions
Conceptualization, M.A.P.M.; Data curation, S.H.F.; Formal analysis, M.A.P.M.; Funding acquisition, C.L.; Investigation, M.A.P.M.; Methodology, S.H.F.; Project administration, C.L.; Resources, N.H. and C.L.; Software, N.H.; Supervision, N.H. and C.L.; Validation, N.H.; Visualization, N.H. and S.H.F.; Writing—original draft, M.A.P.M.; Writing—review and editing, S.H.F.
Funding
This research received no external funding.
Conflicts of Interest
The authors declare no conflict of interest.
Nomenclature
| Term | Description |
| kg CO2 eq. | Kilograms of carbon dioxide equivalent |
| kg CFC-11 eq. | Kilograms of CFC-11 equivalent |
| kg Cl- eq. | Kilograms of chlorine equivalent |
| kg Cd eq. | Kilograms of cadmium equivalent |
| kWh | Kilowatt hours |
| tkm | Tonne-kilometres |
| Kg N eq. | Kilograms of nitrogen equivalent |
| kg O3 eq. | Kilograms of ozone equivalent |
| MJ LHD | Mega joules of lower heating values |
| MJ HHD | Mega joules of higher heating values |
| kg 1,4-DB eq. | Kilograms of 1,4 dichlorobenzene equivalent |
| kg C2H4 eq. | Kilograms of ethylene equivalent |
| kg PO4 eq. | Kilograms of phosphate equivalent |
| kg SO2 eq. | Kilograms of sulphur dioxide equivalent |
| kg NO2 | Kilograms of nitrogen dioxide equivalent |
References
- Office of Electricity Delivery & Energy Reliability. DOE Global Energy Storage Database 2017. Available online: http://www.energystorageexchange.org/ (accessed on 20 January 2017).
- World Energy Outlook 2016; International Energy Agency: Paris, France, 2016; Available online: http://dx.doi.org/10.1787/weo-2016-en (accessed on 16 November 2016).
- Stavropoulos, P.; Giannoulis, C.; Papacharalampopoulos, A.; Foteinopoulos, P.; Chryssolouris, G. Life Cycle Analysis: Comparison between Different Methods and Optimization Challenges. Procedia CIRP 2016, 41, 626–631. [Google Scholar] [CrossRef] [Green Version]
- Farjana, S.H.; Huda, N.; Mahmud, M.A.P.; Rahman, S. Solar Industrial Process Heating Systems in Operation—Current SHIP Plants and Future Prospects in Australia. Renew. Sustain. Energy Rev. 2018, 91, 409–419. [Google Scholar] [CrossRef]
- Farjana, S.H.; Huda, N.; Mahmud, M.A.P. Environmental impact assessment of european non-ferro mining industries through life cycle assessment. IOP Conf. Ser. Earth Environ. Sci. 2018, 154, 012019. [Google Scholar] [CrossRef]
- Farjana, S.H.; Huda, N.; Mahmud, M.A.P. Life cycle analysis of copper-gold-lead-silver-zinc beneficiation process. Sci. Total Environ. 2019, 659, 41–52. [Google Scholar] [CrossRef] [PubMed]
- Mahmud, M.A.P.; Huda, N.; Farjana, S.H.; Lang, C. Environmental sustainability assessment of hydropower plant in Europe using life cycle assessment. IOP Conf. Ser. Mater. Sci. Eng. 2018, 351, 012006. [Google Scholar] [CrossRef]
- Mahmud, M.A.P.; Huda, N.; Farjana, S.H.; Lang, C. Environmental Impacts of Solar-Photovoltaic and Solar-Thermal Systems with life cycle Assessment. Energies 2018, 11, 2346. [Google Scholar] [CrossRef]
- Liang, Y.; Su, J.; Xi, B.; Yu, Y.; Ji, D.; Sun, Y.; Cui, C.; Zhu, J. Life cycle assessment of lithium-ion batteries for greenhouse gas emissions. Resour. Conserv. Recycl. 2017, 117, 285–293. [Google Scholar] [CrossRef]
- Innocenzi, V.; Ippolito, N.M.; Michelis, I.D.; Prisciandaro, M.; Medici, F.; Veglio, F. A review of the processes and lab-scale techniques for the treatment of spent rechargeable NiMH batteries. J. Power Sources 2017, 362, 202–218. [Google Scholar] [CrossRef]
- Notter, D.A.; Gauch, M.; Widmer, R.; Wager, P.; Stamp, A.; Zah, R.; Althaus, H.J. Contribution of Li-ion batteries to the environmental impact of electric vehicles. Environ. Sci. Technol. 2010, 44, 6550–6556. [Google Scholar] [CrossRef]
- Ellingsen, L.A.W.; Majeau-Bettez, G.; Singh, B.; Srivastava, A.K.; Valøen, L.O.; Strømman, A.H. Life cycle assessment of a lithium-ion battery vehicle pack. J. Ind. Ecol. 2014, 18, 113–124. [Google Scholar] [CrossRef]
- Meng, T.; Young, K.H.; Wong, D.F.; Nei, J. Ionic Liquid-Based Non-Aqueous Electrolytes for Nickel/Metal Hydride Batteries. Batteries 2017, 3, 4. [Google Scholar] [CrossRef]
- Hao, H.; Mu, Z.; Jiang, S.; Liu, Z.; Zhao, F. GHG Emissions from the Production of Lithium-Ion Batteries for Electric Vehicles in China. Sustainability 2017, 9, 504. [Google Scholar] [CrossRef]
- Total Battery Production Statistics of Japan 2017. Available online: http://www.baj.or.jp/e/statistics/01.html (accessed on 11 November 2018).
- The Freedonia Group, Inc. Available online: https://batteryuniversity.com/learn/archive/battery_statistics (accessed on 20 December 2018).
- Battery Association of Japan 2018, BAJ Battery Sales Statistics by Volume and Value. Available online: http://www.baj.or.jp/e/ (accessed on 20 December 2018).
- Pryshlakivsky, J.; Searcy, C. Fifteen years of ISO 14040: A review. J. Clean. Prod. 2013, 57, 115–123. [Google Scholar] [CrossRef]
- Mahmud, M.A.P.; Huda, N.; Farjana, S.H.; Lang, C. Environmental profile evaluations of piezoelectric polymers using life cycle assessment. IOP Conf. Ser. Earth Environ. Sci. 2018, 154, 012017. [Google Scholar] [CrossRef] [Green Version]
- Pascual-González, J.; Guillén-Gosálbez, G.; Mateo-Sanz, J.M.; Jiménez-Esteller, L. Statistical analysis of the ecoinvent database to uncover relationships between life cycle impact assessment metrics. J. Clean. Prod. 2016, 112, 359–368. [Google Scholar] [CrossRef]
- Mahmud, M.A.P.; Lee, J.; Kim, G.; Lim, H.; Choi, K.B. Improving the surface charge density of a contact-separation-based triboelectric nanogenerator by modifying the surface morphology. Microelectron. Eng. 2016, 159, 102–107. [Google Scholar] [CrossRef]
- Hischier, R.; Classen, M.; Lehmann, M.; Scharnhorst, W. Life Cycle Inventories of Electric and Electronic Equipment: Production, Use and Disposal; Ecoinvent Report No. 18; Empa/Technology & Society Lab, Swiss Centre for Life Cycle Inventories: Dubendorf, Switzerland, 2007. [Google Scholar]
- Farjana, S.H.; Huda, N.; Mahmud, M.A.P. life cycle environmental impact assessment of mineral industries. IOP Conf. Ser. Mater. Sci. Eng. 2018, 351, 17–23. [Google Scholar] [CrossRef]
- Mahmud, M.A.P.; Huda, N.; Farjana, S.H.; Asadnia, M.; Lang, C. Recent Advances in Nanogenerator-Driven Self-Powered Implantable Biomedical Devices. Adv. Energy Mater. 2017, 8, 172–210. [Google Scholar]
- Mahmud, M.A.P.; Farjana, S.H. Design and Construction of Refrigerant Charge Level Detecting Device in HVAC/R System with Microcontroller. Int. J. Eng. Adv. Technol. 2012, 1, 309–314. [Google Scholar]
- Lewandowska, A.; Matuszak-Flejszman, A.; Joachimiak, K.; Ciroth, A. Environmental life cycle assessment (LCA) as a tool for identification and assessment of environmental aspects in environmental management systems (EMS). Int. J. Life Cycle Assess. 2011, 16, 247–257. [Google Scholar] [CrossRef] [Green Version]
- Farjana, S.H.; Huda, N.; Mahmud, M.A.P.; Lang, C. Towards sustainable TiO2 production: An investigation of environmental impacts of ilmenite and rutile processing routes in Australia. J. Clean. Prod. 2018, 196, 1016–1025. [Google Scholar] [CrossRef]
- Mahmud, M.A.P.; Huda, N.; Farjana, S.H.; Lang, C. Environmental life cycle Assessment and Techno-Economic Analysis of Photovoltaic (PV) and Photovoltaic/Thermal (PV/T) Systems. In Proceedings of the 2018 IEEE International Conference on Environment and Electrical Engineering (EEEIC Europe), Palermo, Italy, 12–15 June 2018; Volume 1, pp. 1–5. [Google Scholar]
- Farjana, S.H.; Huda, N.; Mahmud, M.A.P.; Lang, C. Comparative life cycle assessment of uranium extraction processes. J. Clean. Prod. 2018, 202, 666–683. [Google Scholar] [CrossRef]
- Farjana, S.H.; Huda, N.; Mahmud, M.A.P.; Rahman, S. Solar process heat in industrial systems-A global review. Renew. Sustain. Energy Rev. 2018, 82, 2270–2286. [Google Scholar] [CrossRef]
- Marsmann, M.; Schiburr, A. Databases, software and LCA applications. J. Clean. Prod. 1993, 1, 206–207. [Google Scholar] [CrossRef]
- Ligthart, T.N.; Jongbloed, R.H.; Tamis, J.E. A method for improving Centre for Environmental Studies (CML) characterisation factors for metal (eco)toxicity—The case of zinc gutters and downpipes. Int. J. Life Cycle Assess. 2010, 15, 745–756. [Google Scholar] [CrossRef]
- Audenaert, A.; Cleyn, S.H.D.; Buyle, M. LCA of low-energy flats using the Eco-indicator 99 method: Impact of insulation materials. Energy Build. 2012, 47, 68–73. [Google Scholar] [CrossRef]
- Minx, J.C.; Callaghan, M.; Lamb, W.F.; Garard, J.; Edenhofer, O. Learning about climate change solutions in the IPCC and beyond. Environ. Sci. Policy 2017, 77, 252–259. [Google Scholar] [CrossRef]
- Pesso, C. Life cycle methods and applications: issues and perspectives. J. Clean. Prod. 1993, 1, 139–142. [Google Scholar] [CrossRef]
- Rohrlich, M.; Mistry, M.; Martens, P.N.; Buntenbach, S.; Ruhrberg, M.; Dienhart, M.; Briem, S.; Quinkertz, R.; Alkan, Z.; Kugeler, K. A method to calculate the cumulative energy demand (CED) of lignite extraction. Int. J. Life Cycle Assess. 2000, 5, 369–373. [Google Scholar] [CrossRef]
Figure 1.
Demands of rechargeable batteries in the world [16].
Figure 1.
Demands of rechargeable batteries in the world [16].

Figure 2.
Productions of rechargeable batteries in the countries [16].
Figure 2.
Productions of rechargeable batteries in the countries [16].

Figure 3.
Rechargeable battery production statistics in Japan [15].
Figure 3.
Rechargeable battery production statistics in Japan [15].

Figure 4.
Material flow sheet for 1 kg of LiIo battery production.

Figure 5.
Material flow sheet for 1 kg of NiMH battery production.

Figure 6.
System boundary of the batteries for life cycle impact assessment.

Figure 7.
Schematic diagram of the CED and CML methods of LCA analysis.

Figure 8.
Comparative LCA inputs and outputs of LiIo and NiMH batteries by the RMF approach.

Figure 9.
LCA outcome comparison per impact indicator, using the CML midpoint method.

Figure 10.
LCA outcome comparison of LiIo and NiMH batteries by the ReCiPe endpoint method.

Figure 11.
Comparison of metal and gas-based emissions of LiIo and NiMH batteries by the EcoPoints 97 method.
Figure 11.
Comparison of metal and gas-based emissions of LiIo and NiMH batteries by the EcoPoints 97 method.

Figure 12.
Comparative fuel-based energy consumption by LiIo and NiMH batteries, using the CED approach.
Figure 12.
Comparative fuel-based energy consumption by LiIo and NiMH batteries, using the CED approach.

Figure 13.
Comparison of the GHG emission outcomes of LiIo and NiMH batteries with existing studies.
Figure 13.
Comparison of the GHG emission outcomes of LiIo and NiMH batteries with existing studies.

Figure 14.
Uncertainty analysis outcome for LiIo batteries.

Figure 15.
Uncertainty analysis outcome for NiMH batteries.


Table 1.
Rechargeable battery sale statistics in Japan [17].
Table 1.
Rechargeable battery sale statistics in Japan [17].
| Amount (million JPY) | |||||
| 2013 | 2014 | 2015 | 2016 | 2017 | |
| LiIo | 279,364 | 349,761 | 360,705 | 385,368 | 422,366 |
| NiMH | 178,748 | 168,157 | 160,294 | 167,785 | 166,583 |
| Quantity (1000 pcs) | |||||
| 2013 | 2014 | 2015 | 2016 | 2017 | |
| LiIo | 844,622 | 955,644 | 1,031,850 | 1,277,108 | 1,320,502 |
| NiMH | 455,132 | 432,936 | 434,397 | 478,210 | 471,105 |
Table 2.
Specifications of the LiIo and NiMH batteries [22].
Table 2.
Specifications of the LiIo and NiMH batteries [22].
| LiIo | NiMH | |
|---|---|---|
| Model | FPCBP64 | UBP0767B |
| Size (l × w × h (mm)) | 128.00 × 77.00 × 20.00 | 138.00 × 105.00 × 20.00 |
| Weight (kg) | 0.19 | 0.591 |
| Capacity (mAh) | 4000 | 4500 |
| Number of cells | 4 | 1 |
Table 3.
life cycle inventory of LiIo battery developed for LCA analysis in this research.
| Products: | ||
|---|---|---|
| Battery, LiIo, rechargeable, prismatic, at plant/GLO U/AusSD U | 1.00 | kg |
| Inputs: | ||
| Reinforcing steel | 1.45 × 10⁻¹ | kg |
| Sheet rolling, steel | 1.45 × 10⁻¹ | kg |
| Transport, transoceanic freight ship | 7.81 | tkm |
| Electricity, low voltage, production UCTE, at grid | 1.08 × 10⁻¹ | kWh |
| Transport, lorry >16 t | 1.02 | tkm |
| Cable, three-conductor cable | 2.50 × 10⁻² | m |
| Cable, data cable in infrastructure | 3.73 × 10⁻¹ | m |
| Printed wiring board, surface mounted, unspec., solder mix | 3.38 × 10⁻³ | kg |
| Single cell, lithium-ion battery, lithium manganese oxide/graphite | 7.99 × 10⁻¹ | kg |
| Metal working factory | 4.58 × 10⁻¹⁰ | p |
| Outputs: | ||
| Heat, waste | 3.87 × 10⁻¹ | MJ |
Table 4.
life cycle inventory of NiMH battery developed for LCA analysis in this research.
| Products: | ||
|---|---|---|
| Battery, NiMH, rechargeable, prismatic, at plant/GLO U/AusSD U | 1.00 | kg |
| Inputs: | ||
| Acrylic acid, at plant | 1.34 × 10⁻³ | kg |
| Copper, primary, at refinery | 3.62 × 10⁻⁶ | kg |
| Electricity, medium voltage, at grid | 3.26 × 10⁻¹ | kWh |
| Electricity, medium voltage, at grid | 2.18 × 10⁻¹ | kWh |
| Electrode, negative, Ni | 3.59 × 10⁻¹ | kg |
| Electrode, positive, LaNi5 | 3.35 × 10⁻¹ | kg |
| Electrolyte, KOH, LiOH additive | 8.22 × 10⁻² | kg |
| Facilities precious metal refinery | 1.65 × 10⁻⁷ | p |
| Heat, natural gas, at industrial furnace | 8.35 | MJ |
| Injection moulding | 1.18 × 10⁻¹ | kg |
| Nickel, 99.5% | 5.83 × 10⁻² | kg |
| Polycarbonate | 8.12 × 10⁻² | kg |
| Polyethylene, LDPE, granulate | 1.83 × 10⁻² | kg |
| Polypropylene, granulate | 1.85 × 10⁻² | kg |
| Sheet rolling, copper | 3.62 × 10⁻⁶ | kg |
| Sheet rolling, steel | 1.05 × 10⁻¹ | kg |
| Steel, low-alloyed | 4.63 × 10⁻² | kg |
| Transport, freight, rail | 9.47 × 10⁻² | tkm |
| Transport, lorry >16t | 3.06 × 10⁻² | tkm |
| Water, decarbonised | 1.83 × 10² | kg |
| Zinc coating | 4.81 × 10⁻⁵ | m2 |
| Zinc, primary | 3.62 × 10⁻⁸ | kg |
| Outputs: | ||
| Heat, waste | 7.73 × 101 | MJ |
| Disposal, hazardous waste, 25% water | 8.84 × 10⁻¹ | kg |
Table 5.
Comparative impacts of LiIo and NiMH batteries by the CML midpoint method.
| Impact Category | LiIo | NiMH | Unit |
|---|---|---|---|
| Abiotic depletion | 5.23 × 10⁻⁵ | 2.07 × 10⁻⁴ | MJ |
| Global warming | 7.63 | 1.90 × 101 | kg CO2 eq |
| Ozone layer depletion | 2.90 × 10⁻⁷ | 9.61 × 10⁻⁵ | kg CFC-11 eq |
| Human toxicity | 7.38 | 1.66 × 101 | kg 1,4-DB eq |
| Fresh water aquatic ecotox. | 1.06× 10⁻¹ | 7.51 × 10⁻¹ | kg 1,4-DB eq |
| Marine aquatic ecotoxicity | 8.62 × 10³ | 9.35 × 10³ | kg 1,4-DB eq |
| Terrestrial ecotoxicity | 2.63 × 10⁻² | 1.18 × 10⁻¹ | kg 1,4-DB eq |
| Photochemical oxidation | 2.70 × 10⁻³ | 3.01 × 10⁻² | kg C2H4 eq |
| Acidification | 5.49 × 10⁻² | 7.64 × 10⁻¹ | kg SO2 eq |
| Eutrophication | 1.87 × 10⁻² | 2.74 × 10⁻² | kg PO4 eq |
Table 6.
Comparative effects of LiIo and NiMH batteries by EcoPoints 97 approach.
| Impact Category | LiIo | NiMH | Unit |
|---|---|---|---|
| NOx | 2.54 × 10⁻² | 5.47 × 10⁻² | kg NO2 eq. |
| SOx | 3.74 × 10⁻² | 6.15 × 10⁻¹ | kg SO2 eq. |
| NMVOC | 8.00 × 10⁻³ | 9.27 × 10⁻³ | kg |
| NH3 | 9.53 × 10⁻⁴ | 3.87 × 10⁻³ | kg |
| Dust PM10 | 8.39 × 10⁻³ | 2.68 × 10⁻² | kg |
| CO2 | 8.27 | 1.95 × 101 | kg CO2 eq. |
| Ozone layer | 5.64 × 10⁻⁷ | 9.40 × 10⁻⁵ | kg CFC-11 |
| Pb (air) | 9.85 × 10⁻⁵ | 2.38 × 10⁻⁵ | kg |
| Cd (air) | 1.20 × 10⁻⁵ | 1.18 × 10⁻⁶ | kg |
| Zn (air) | 6.15 × 10⁻⁵ | 7.89 × 10⁻⁵ | kg |
| Hg (air) | 5.19 × 10⁻⁷ | 1.25 × 10⁻⁶ | kg |
| COD | 1.27 × 10⁻² | 3.77 × 10⁻² | kg |
| P | 4.89 × 10⁻⁵ | 5.77 × 10⁻⁵ | kg |
| N | 4.62 × 10⁻⁴ | 2.05 × 10⁻³ | kg |
| Cr (water) | 1.24 × 10⁻⁴ | 1.35 × 10⁻⁴ | kg |
| Zn (water) | 4.58 × 10⁻⁸ | 4.96 × 10⁻⁸ | kg |
| Cu (water) | 1.21 × 10⁻⁸ | 1.44 × 10⁻⁸ | kg |
| Cd (water) | 1.67 × 10⁻⁹ | 2.31 × 10⁻⁹ | kg |
| Hg (water) | 6.04 × 10⁻⁷ | 9.11 × 10⁻⁷ | kg |
| Pb (water) | 2.47 × 10⁻⁴ | 3.28 × 10⁻⁴ | kg |
| Ni (water) | 1.87 × 10⁻⁸ | 2.04 × 10⁻⁸ | kg |
| AOX (water) | 1.86 × 10⁻¹ | 4.28 × 10⁻¹ | kg Cl- eq. |
| Nitrate (soil) | 3.52 × 10⁻⁴ | 1.17 × 10⁻³ | kg |
| Metals (soil) | 1.71 × 10⁻⁷ | 1.78 × 10⁻⁷ | kg Cd eq. |
| Pesticide soil | 9.87 × 10⁻⁷ | 8.20 × 10⁻⁶ | kg |
| Waste | 2.45 | 6.12 | kg |
| Waste (special) | 3.57 × 10⁻³ | 3.31 × 10⁻⁴ | kg |
| LMRAD | 2.51 × 10⁻³ | 9.41 × 10⁻² | cm3 |
| HRAD | 6.01 × 10⁻⁴ | 2.35 × 10⁻² | cm3 |
| Energy | 2.77 | 1.92 × 101 | MJ LHV |
Table 7.
Comparison of fuel-based energy consumption by LiIo and NiMH batteries.
| Impact Category | LiIo | NiMH | Unit |
|---|---|---|---|
| Renewables | 3.26 | 2.01 × 101 | MJ LHV |
| Fossil fuels-oil | 2.29 × 101 | 5.76 × 101 | MJ LHV |
| Fossil fuels -gas | 2.04 × 101 | 5.88 × 101 | MJ LHV |
| Fossil Fuels-coal | 5.39 × 101 | 7.05 × 101 | MJ LHV |
| Biomass | 3.37 × 10⁻¹ | 2.02 | MJ LHV |
| Nuclear | 1.23 | 2.15 × 101 | MJ LHV |
| Embodied energy LHV | 1.02 × 10² | 2.30 × 10² | MJ LHV |
| Embodied energy HHV | 1.05 × 10² | 2.38 × 10² | MJ HHV |
Table 8.
Category-wise most impactful substances for 1 kg battery production.
| Impact Category | Impactful Element | LiIo | NiMH | Unit |
|---|---|---|---|---|
| Abiotic depletion | Gas, mine, off-gas, process, coal mining | 5.24 × 10⁻⁵ | 2.08 × 10⁻⁴ | MJ |
| Global warming | Carbon dioxide, fossil | 4.97 | 6.06 | kg CO2 eq. |
| Ozone layer depletion | Methane, CFC | 7.20 × 10⁻⁸ | 2.23 × 10⁻⁵ | kg CFC-11 eq. |
| Human Toxicity | Cobalt | 4.00 × 10⁻³ | 8.34 | kg 1,4-DB eq. |
| Fresh water aquatic ecotoxicity | Nickel | 4.20 × 10⁻² | 1.06 × 10⁻¹ | kg 1,4-DB eq. |
| Marine aquatic ecotoxicity | Hydrogen fluoride | 4.83 × 10³ | 3.07 × 10³ | kg 1,4-DB eq. |
| Terrestrial Ecotoxicity | Nickel | 7.74 × 10⁻³ | 1.95 × 10⁻² | kg 1,4-DB eq. |
| Photochemical oxidation | Sulfur dioxide | 1.17 × 10⁻³ | 2.85 × 10⁻² | kg C2H4 eq. |
| Acidification | Sulfur dioxide | 2.91 × 10⁻² | 7.13 × 10⁻¹ | kg SO2 eq. |
| Eutrophication | Phosphate | 1.49 × 10⁻² | 1.86 × 10⁻² | kg PO4 eq. |
© 2019 by the authors. Licensee MDPI, Basel, Switzerland. This article is an open access article distributed under the terms and conditions of the Creative Commons Attribution (CC BY) license (http://creativecommons.org/licenses/by/4.0/).
Share and Cite
MDPI and ACS Style
Mahmud, M.A.P.; Huda, N.; Farjana, S.H.; Lang, C. Comparative Life Cycle Environmental Impact Analysis of Lithium-Ion (LiIo) and Nickel-Metal Hydride (NiMH) Batteries. Batteries 2019, 5, 22. https://doi.org/10.3390/batteries5010022
AMA Style
Mahmud MAP, Huda N, Farjana SH, Lang C. Comparative Life Cycle Environmental Impact Analysis of Lithium-Ion (LiIo) and Nickel-Metal Hydride (NiMH) Batteries. Batteries. 2019; 5(1):22. https://doi.org/10.3390/batteries5010022
Chicago/Turabian StyleMahmud, M. A. Parvez, Nazmul Huda, Shahjadi Hisan Farjana, and Candace Lang. 2019. "Comparative Life Cycle Environmental Impact Analysis of Lithium-Ion (LiIo) and Nickel-Metal Hydride (NiMH) Batteries" Batteries 5, no. 1: 22. https://doi.org/10.3390/batteries5010022
Note that from the first issue of 2016, this journal uses article numbers instead of page numbers. See further details here.