On the Use of Statistical Entropy Analysis as Assessment Parameter for the Comparison of Lithium-Ion Battery Recycling Processes

 , , and
Abstract
:1. Introduction
2. Materials and Methods
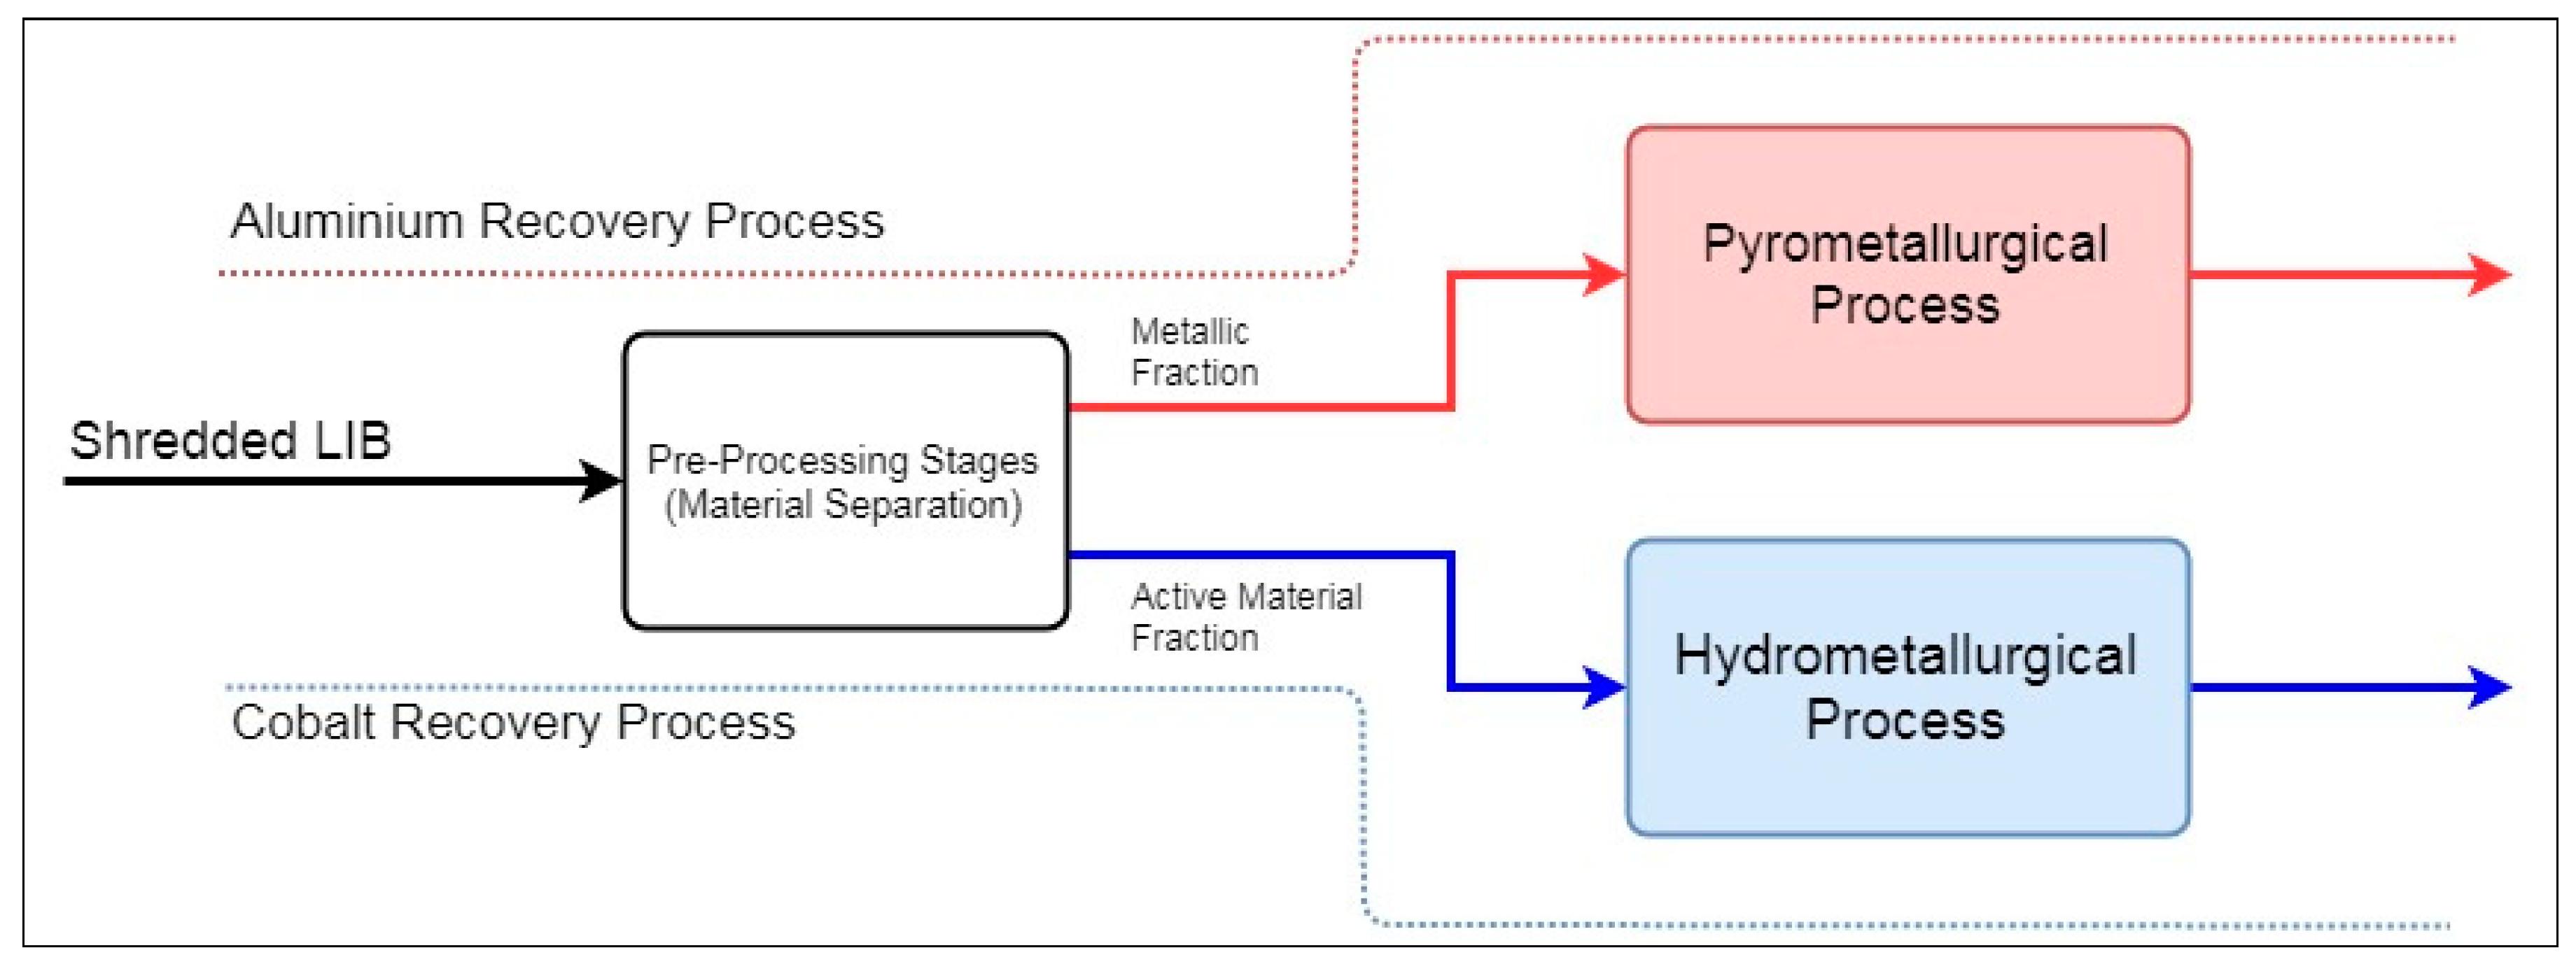
2.1. LIB Recycling Processes
- Aalto PP + Al-recovery Pyrometallurgical Process vs. CSU PP + Al-recovery Pyrometallurgical Process
- Aalto PP + Co-recovery Hydrometallurgical Process vs. CSU PP + Co-recovery Hydrometallurgical Process
2.1.1. Simulation-Based Analysis of Pre-Processing Stages
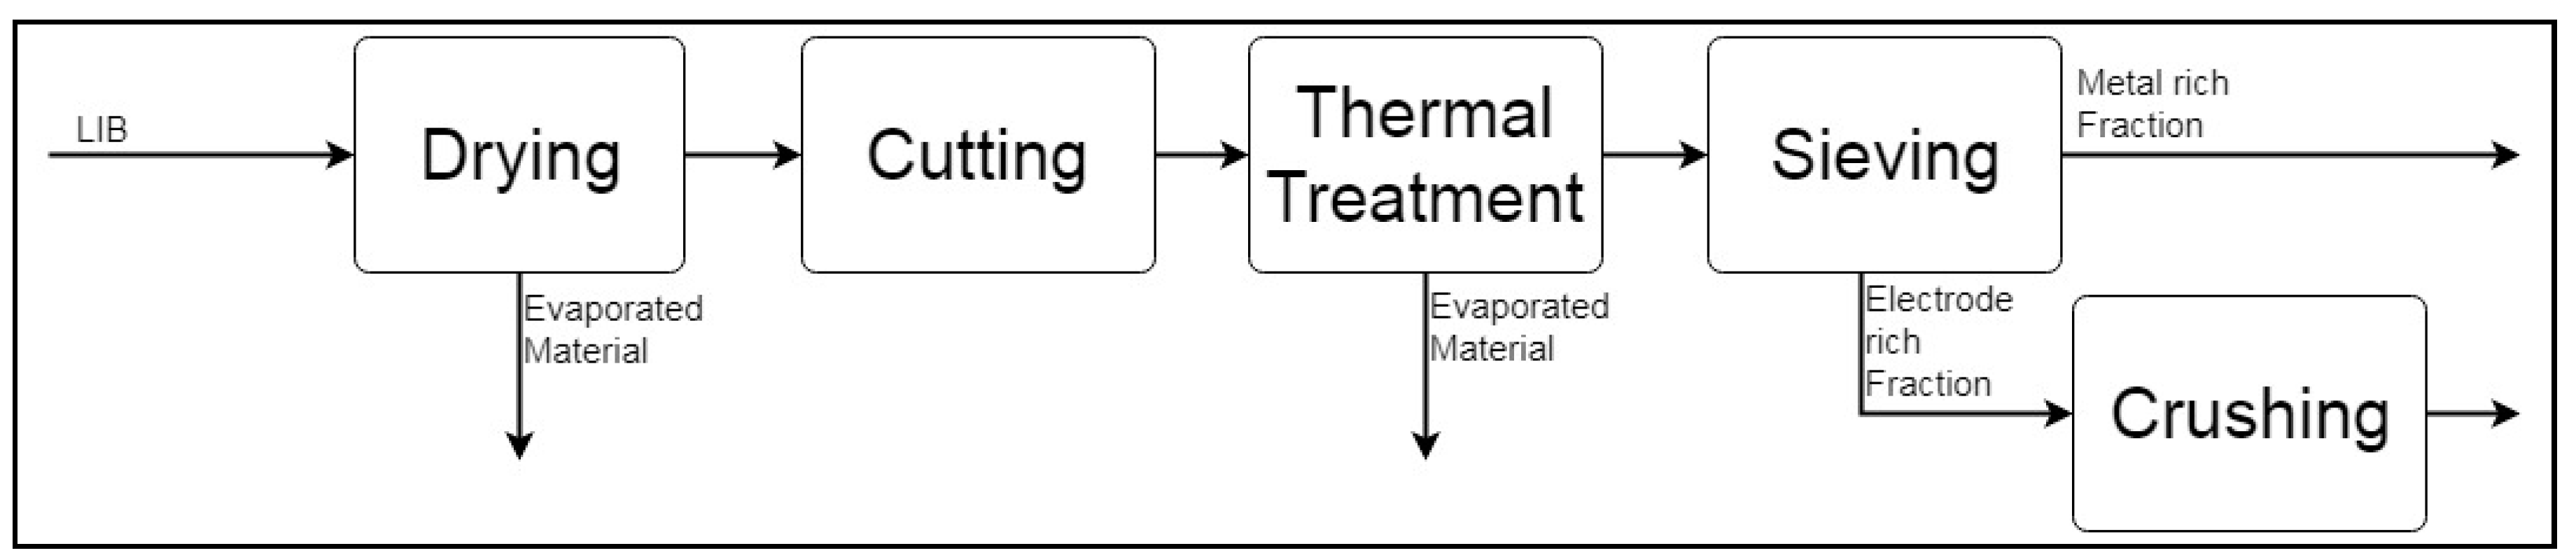
Aalto Pre-Processing
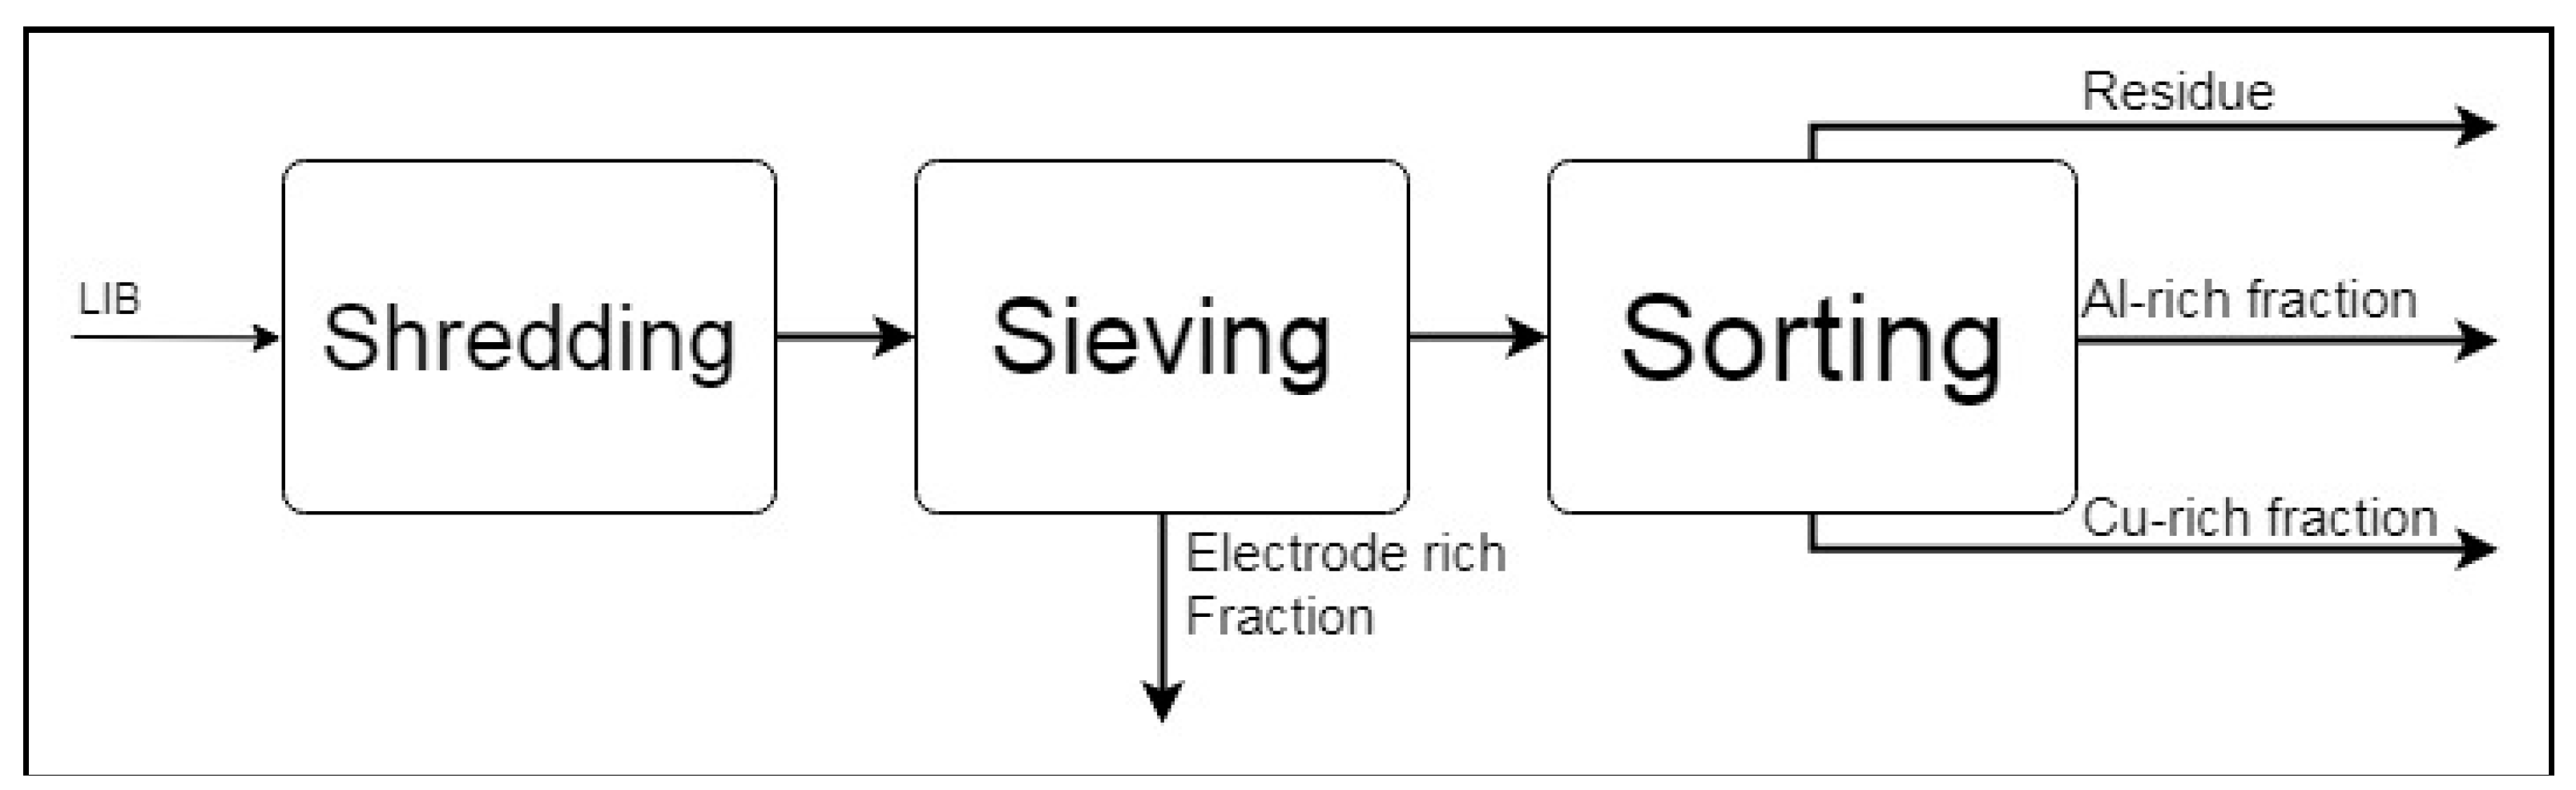
Central South University (CSU) LIB Mechanical Processing System
2.1.2. Simulation-Based Analysis of Pyro- and Hydrometallurgical Processes
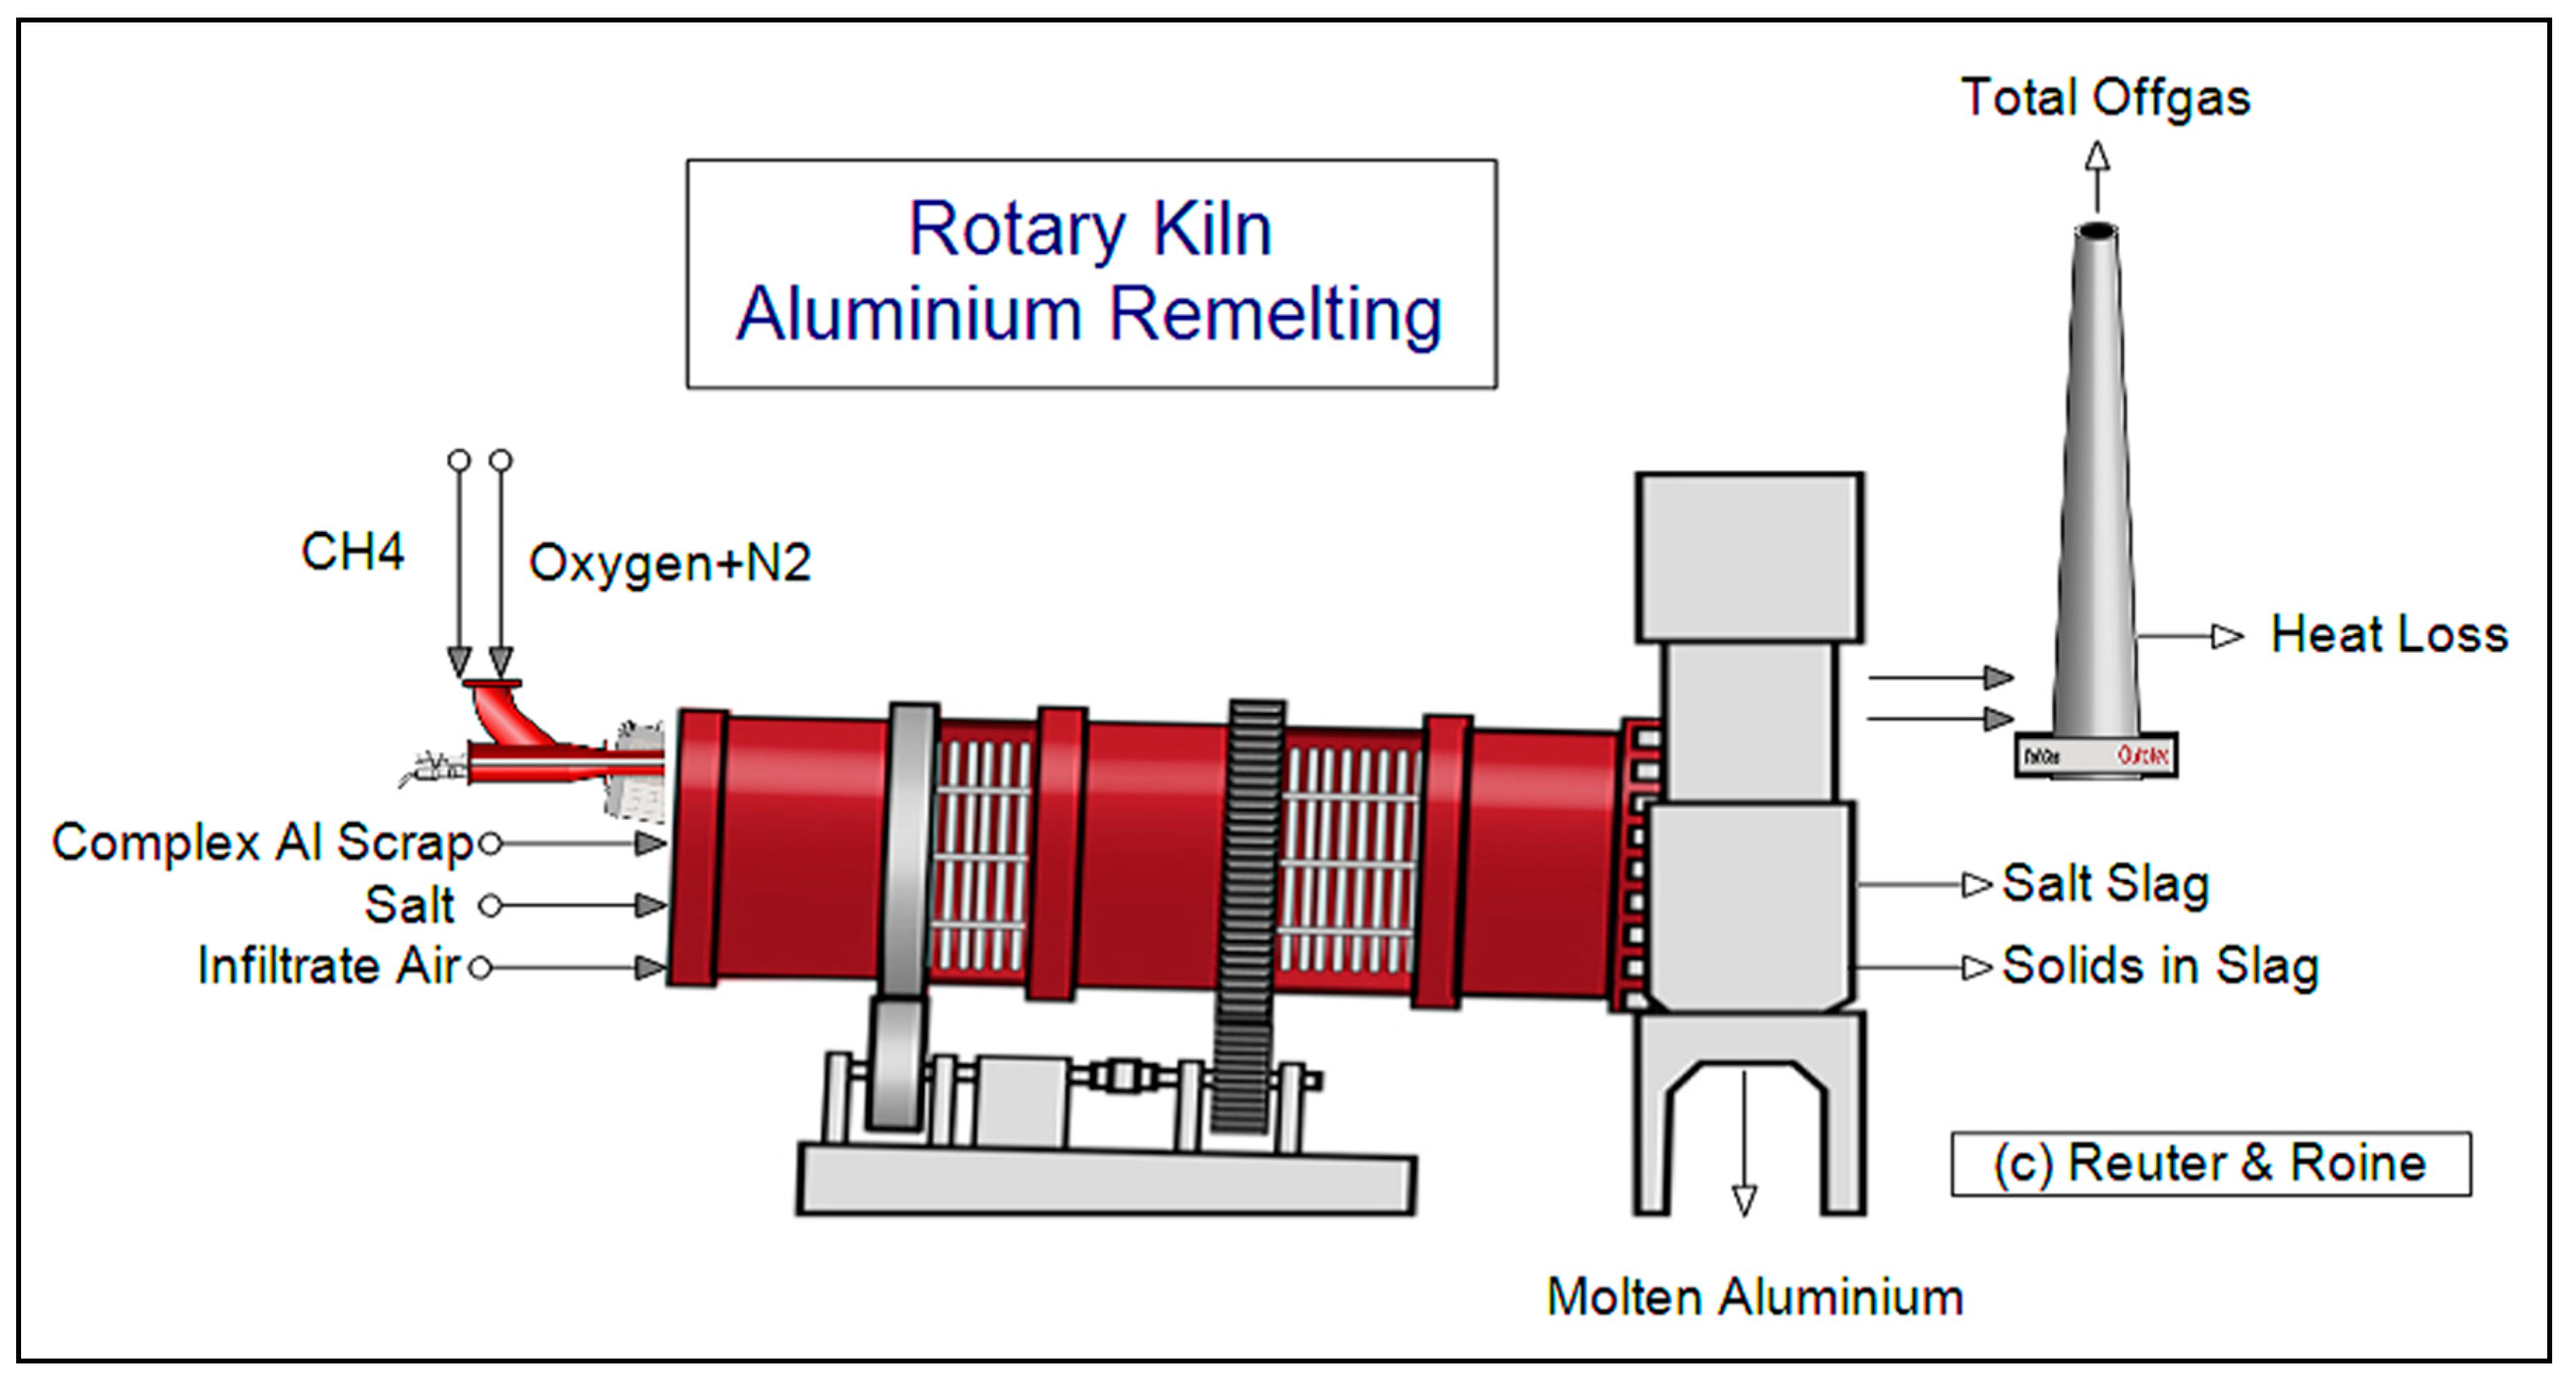
Simulation of the Al Recovery Process (Pyrometallurgy)
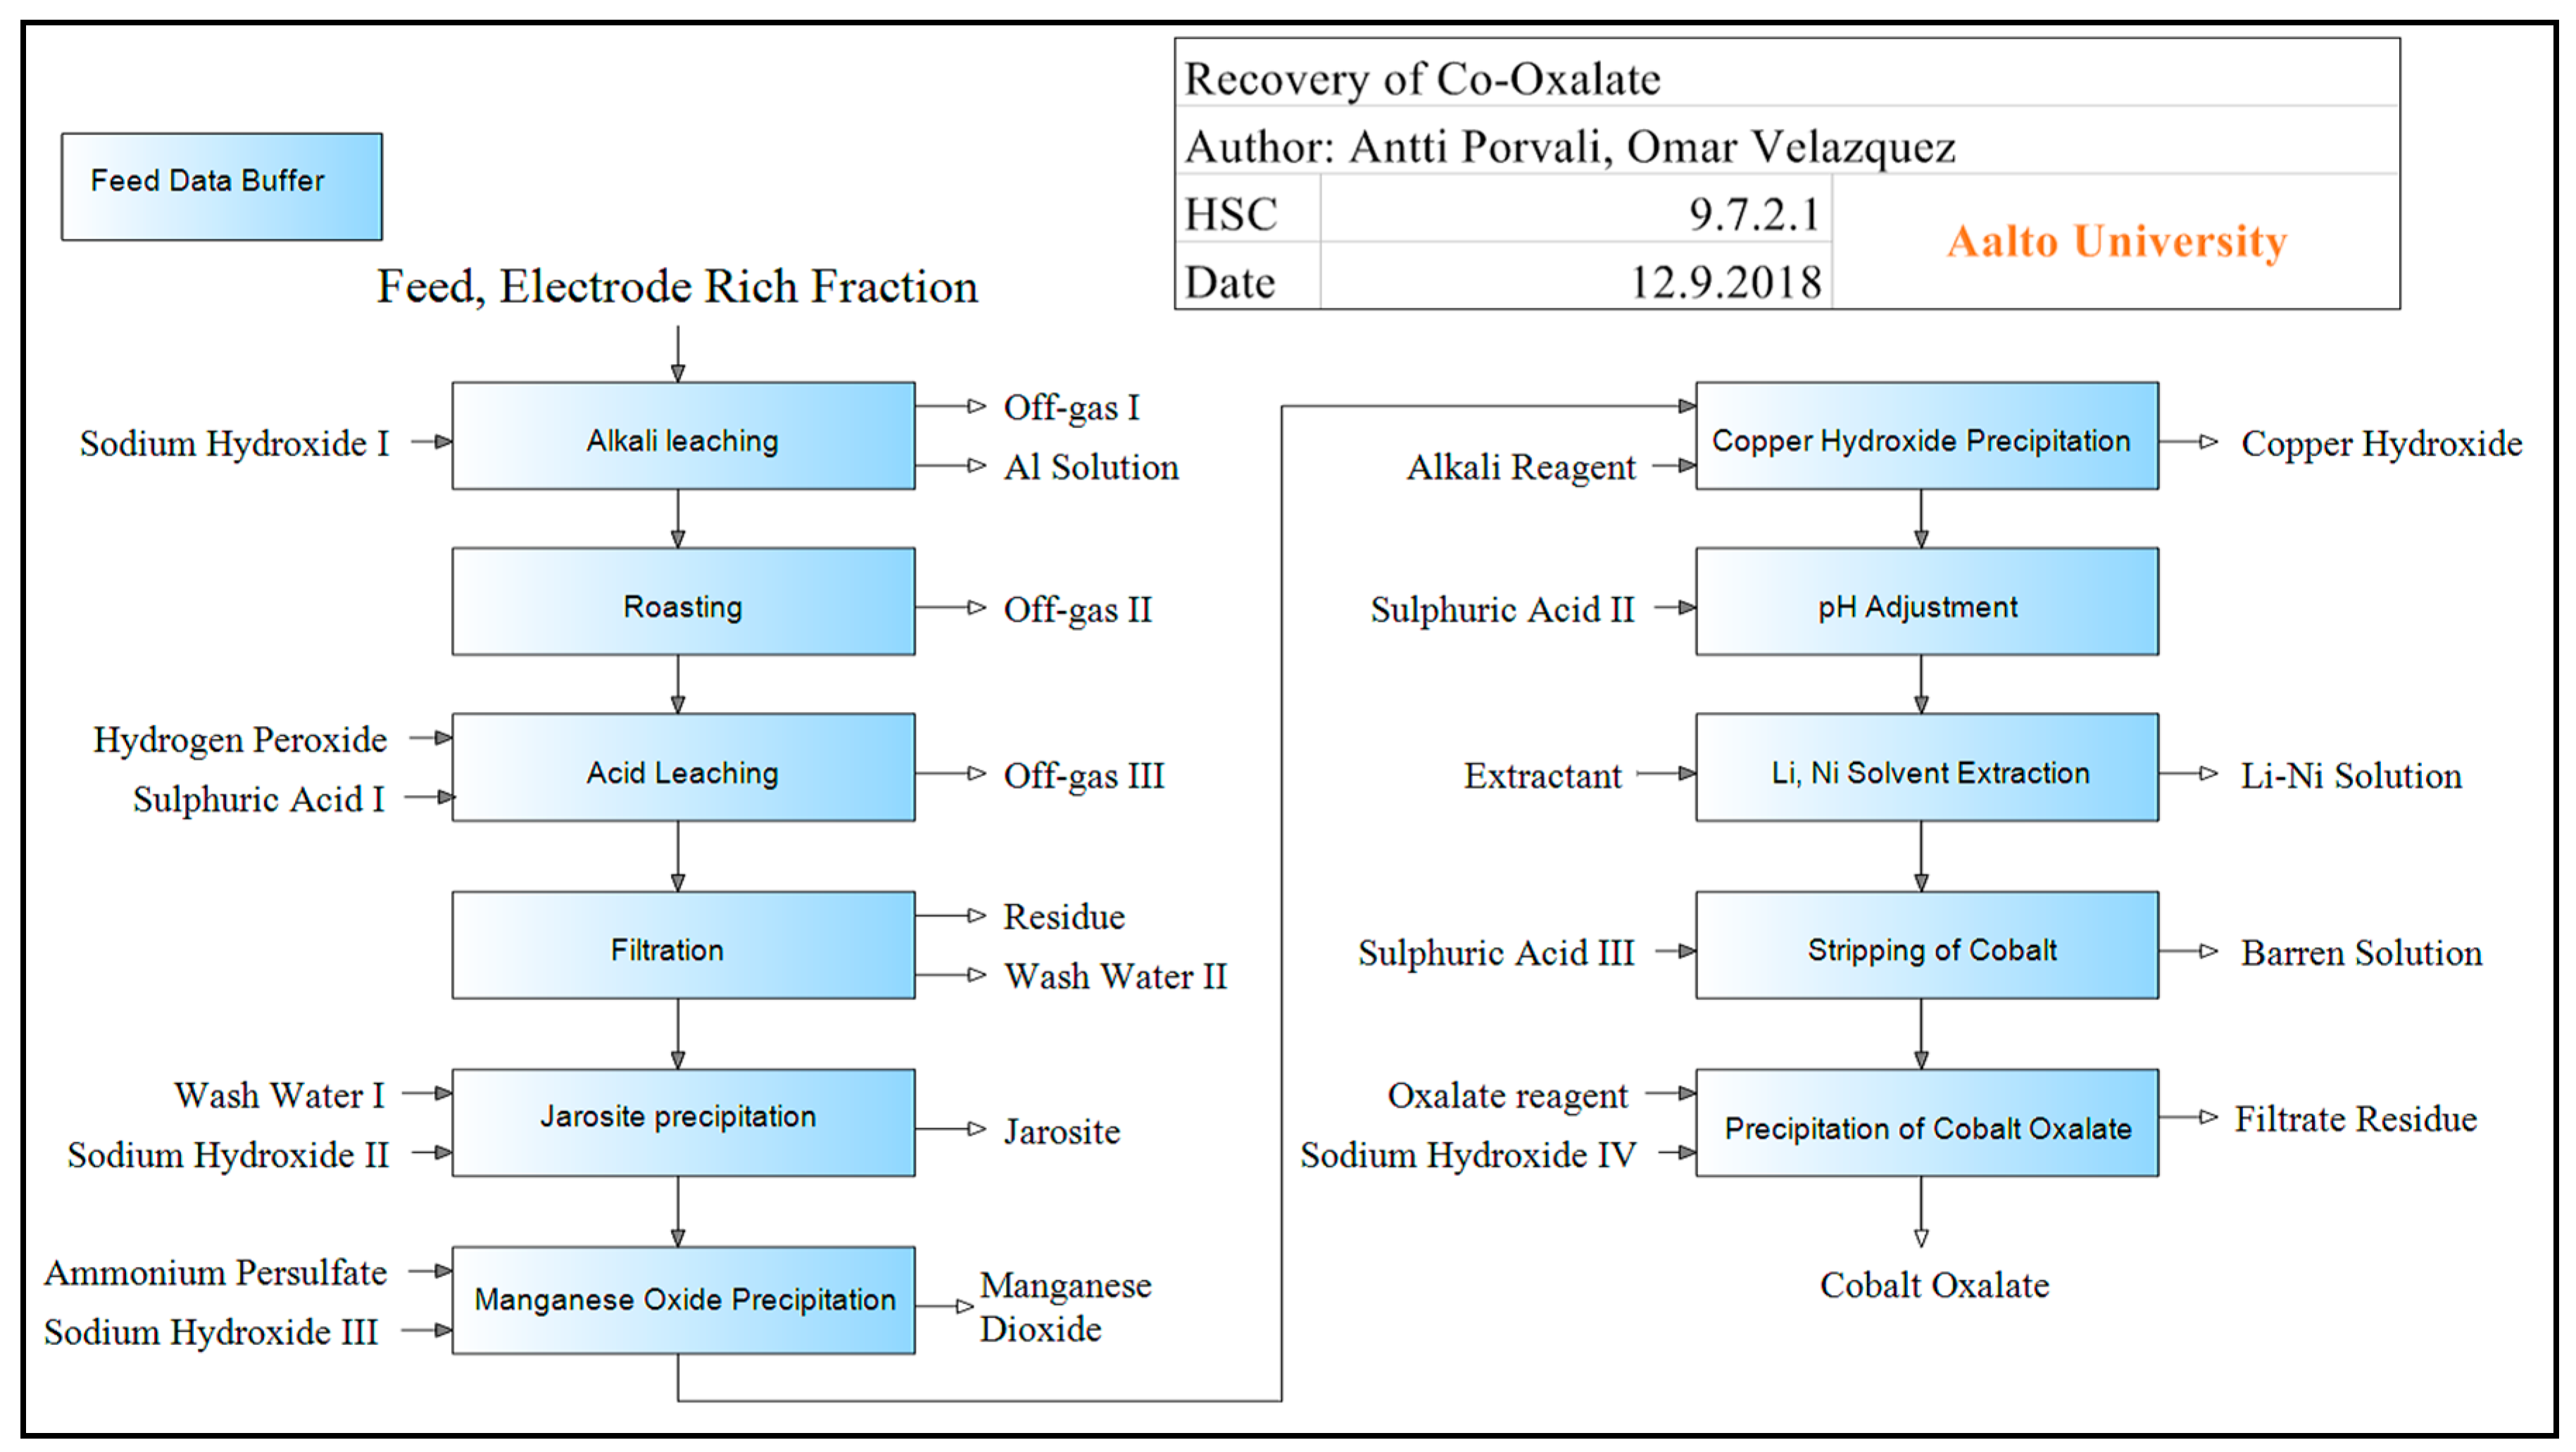
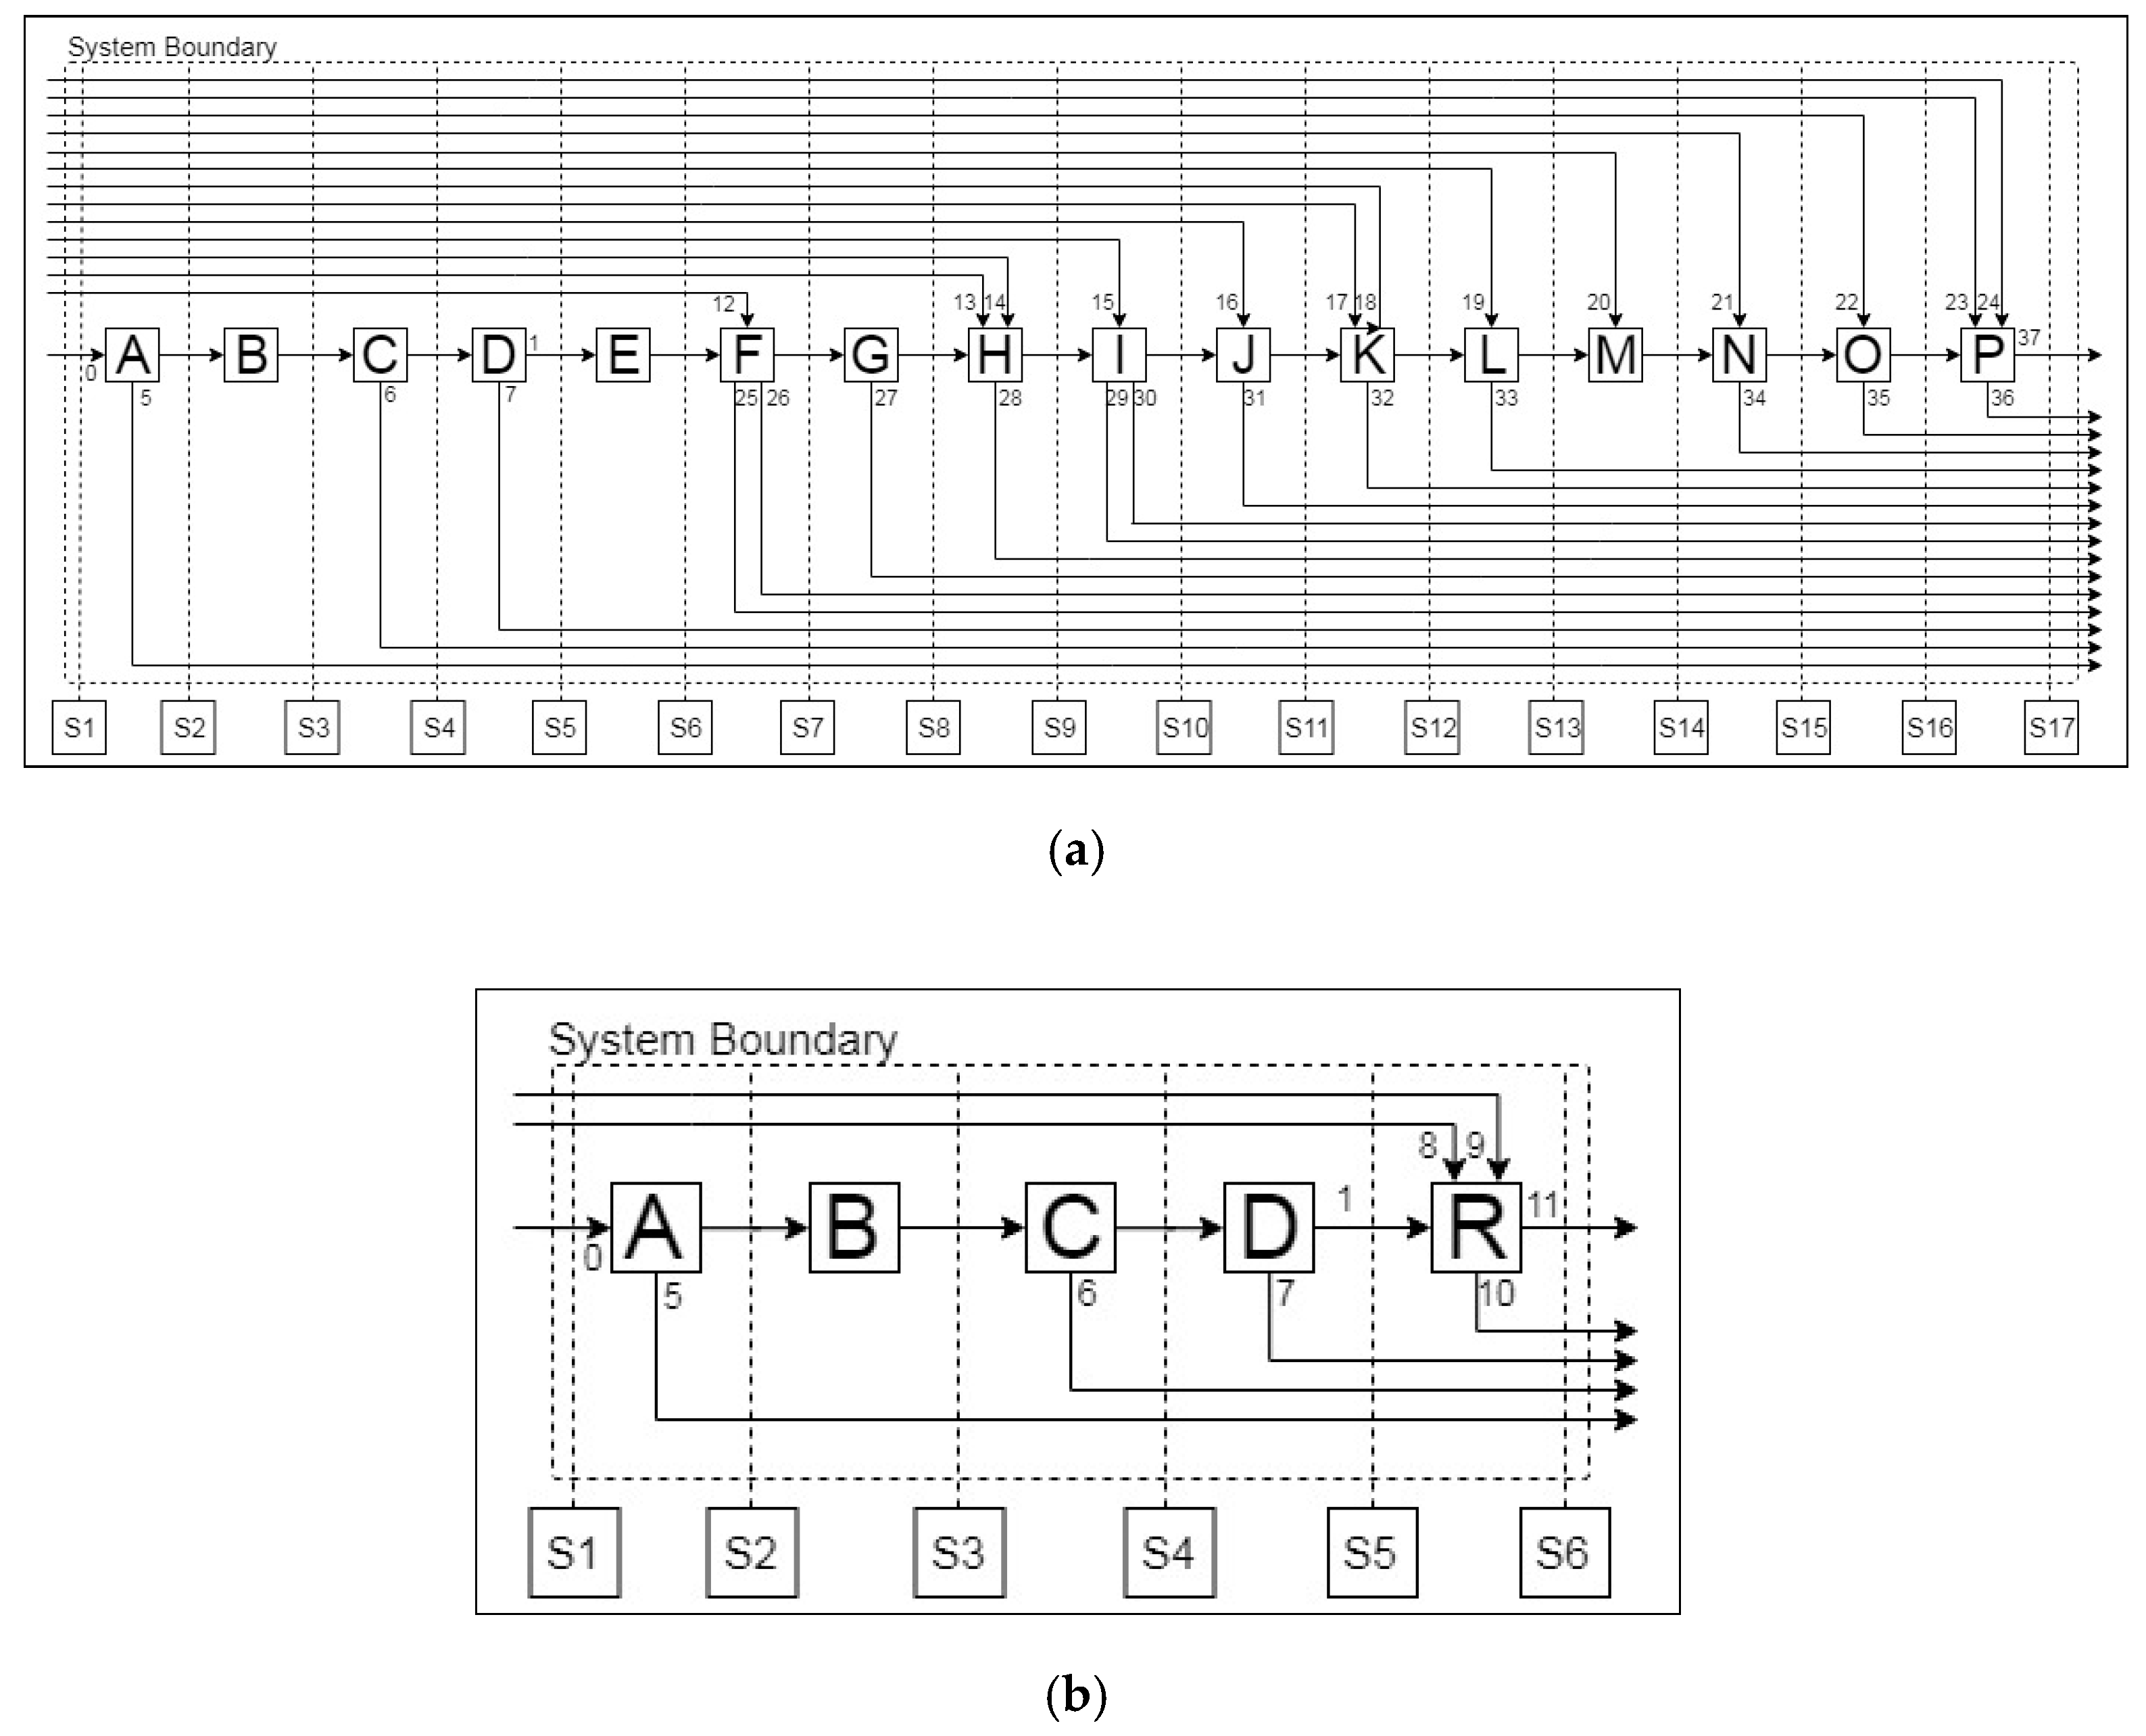
Simulation of the Cobalt Recovery Process (Hydrometallurgy)
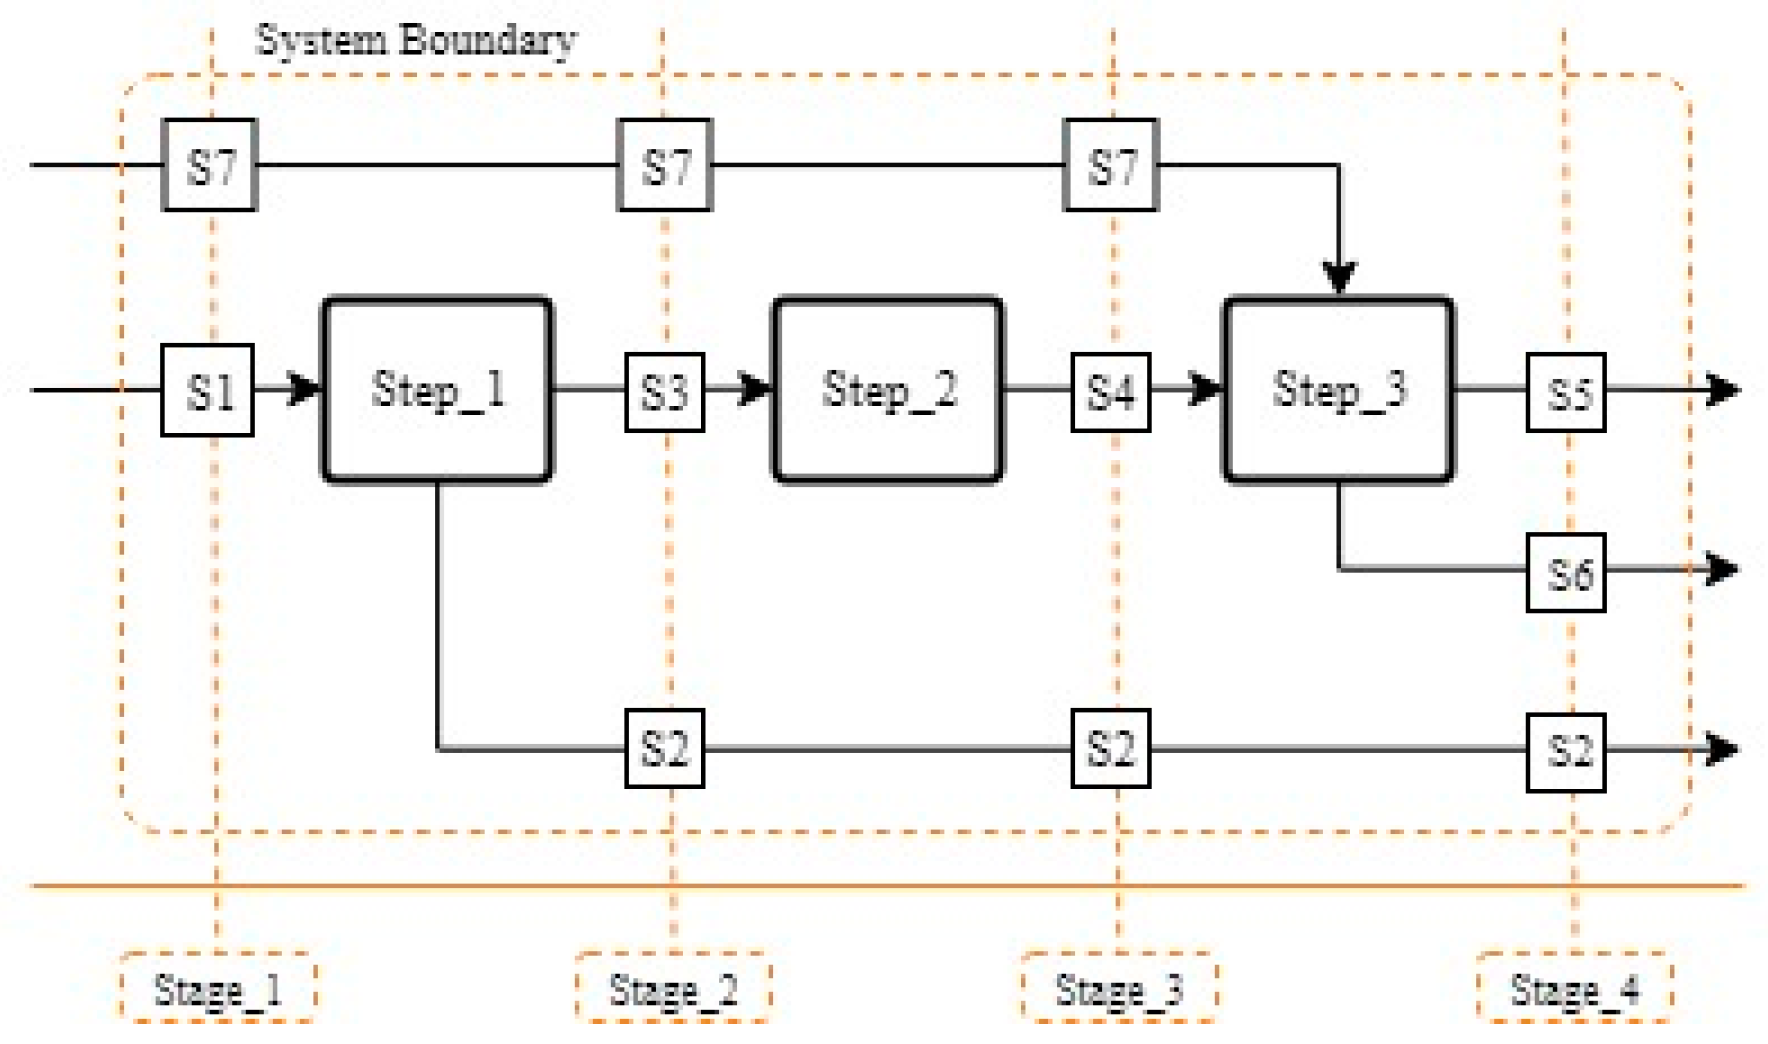
2.2. Mathematical Background of Material Flow Analysis and Relative Statistical Entropy
2.3. Application of MFA and RSE to Recovery Processes
3. Results and Discussion
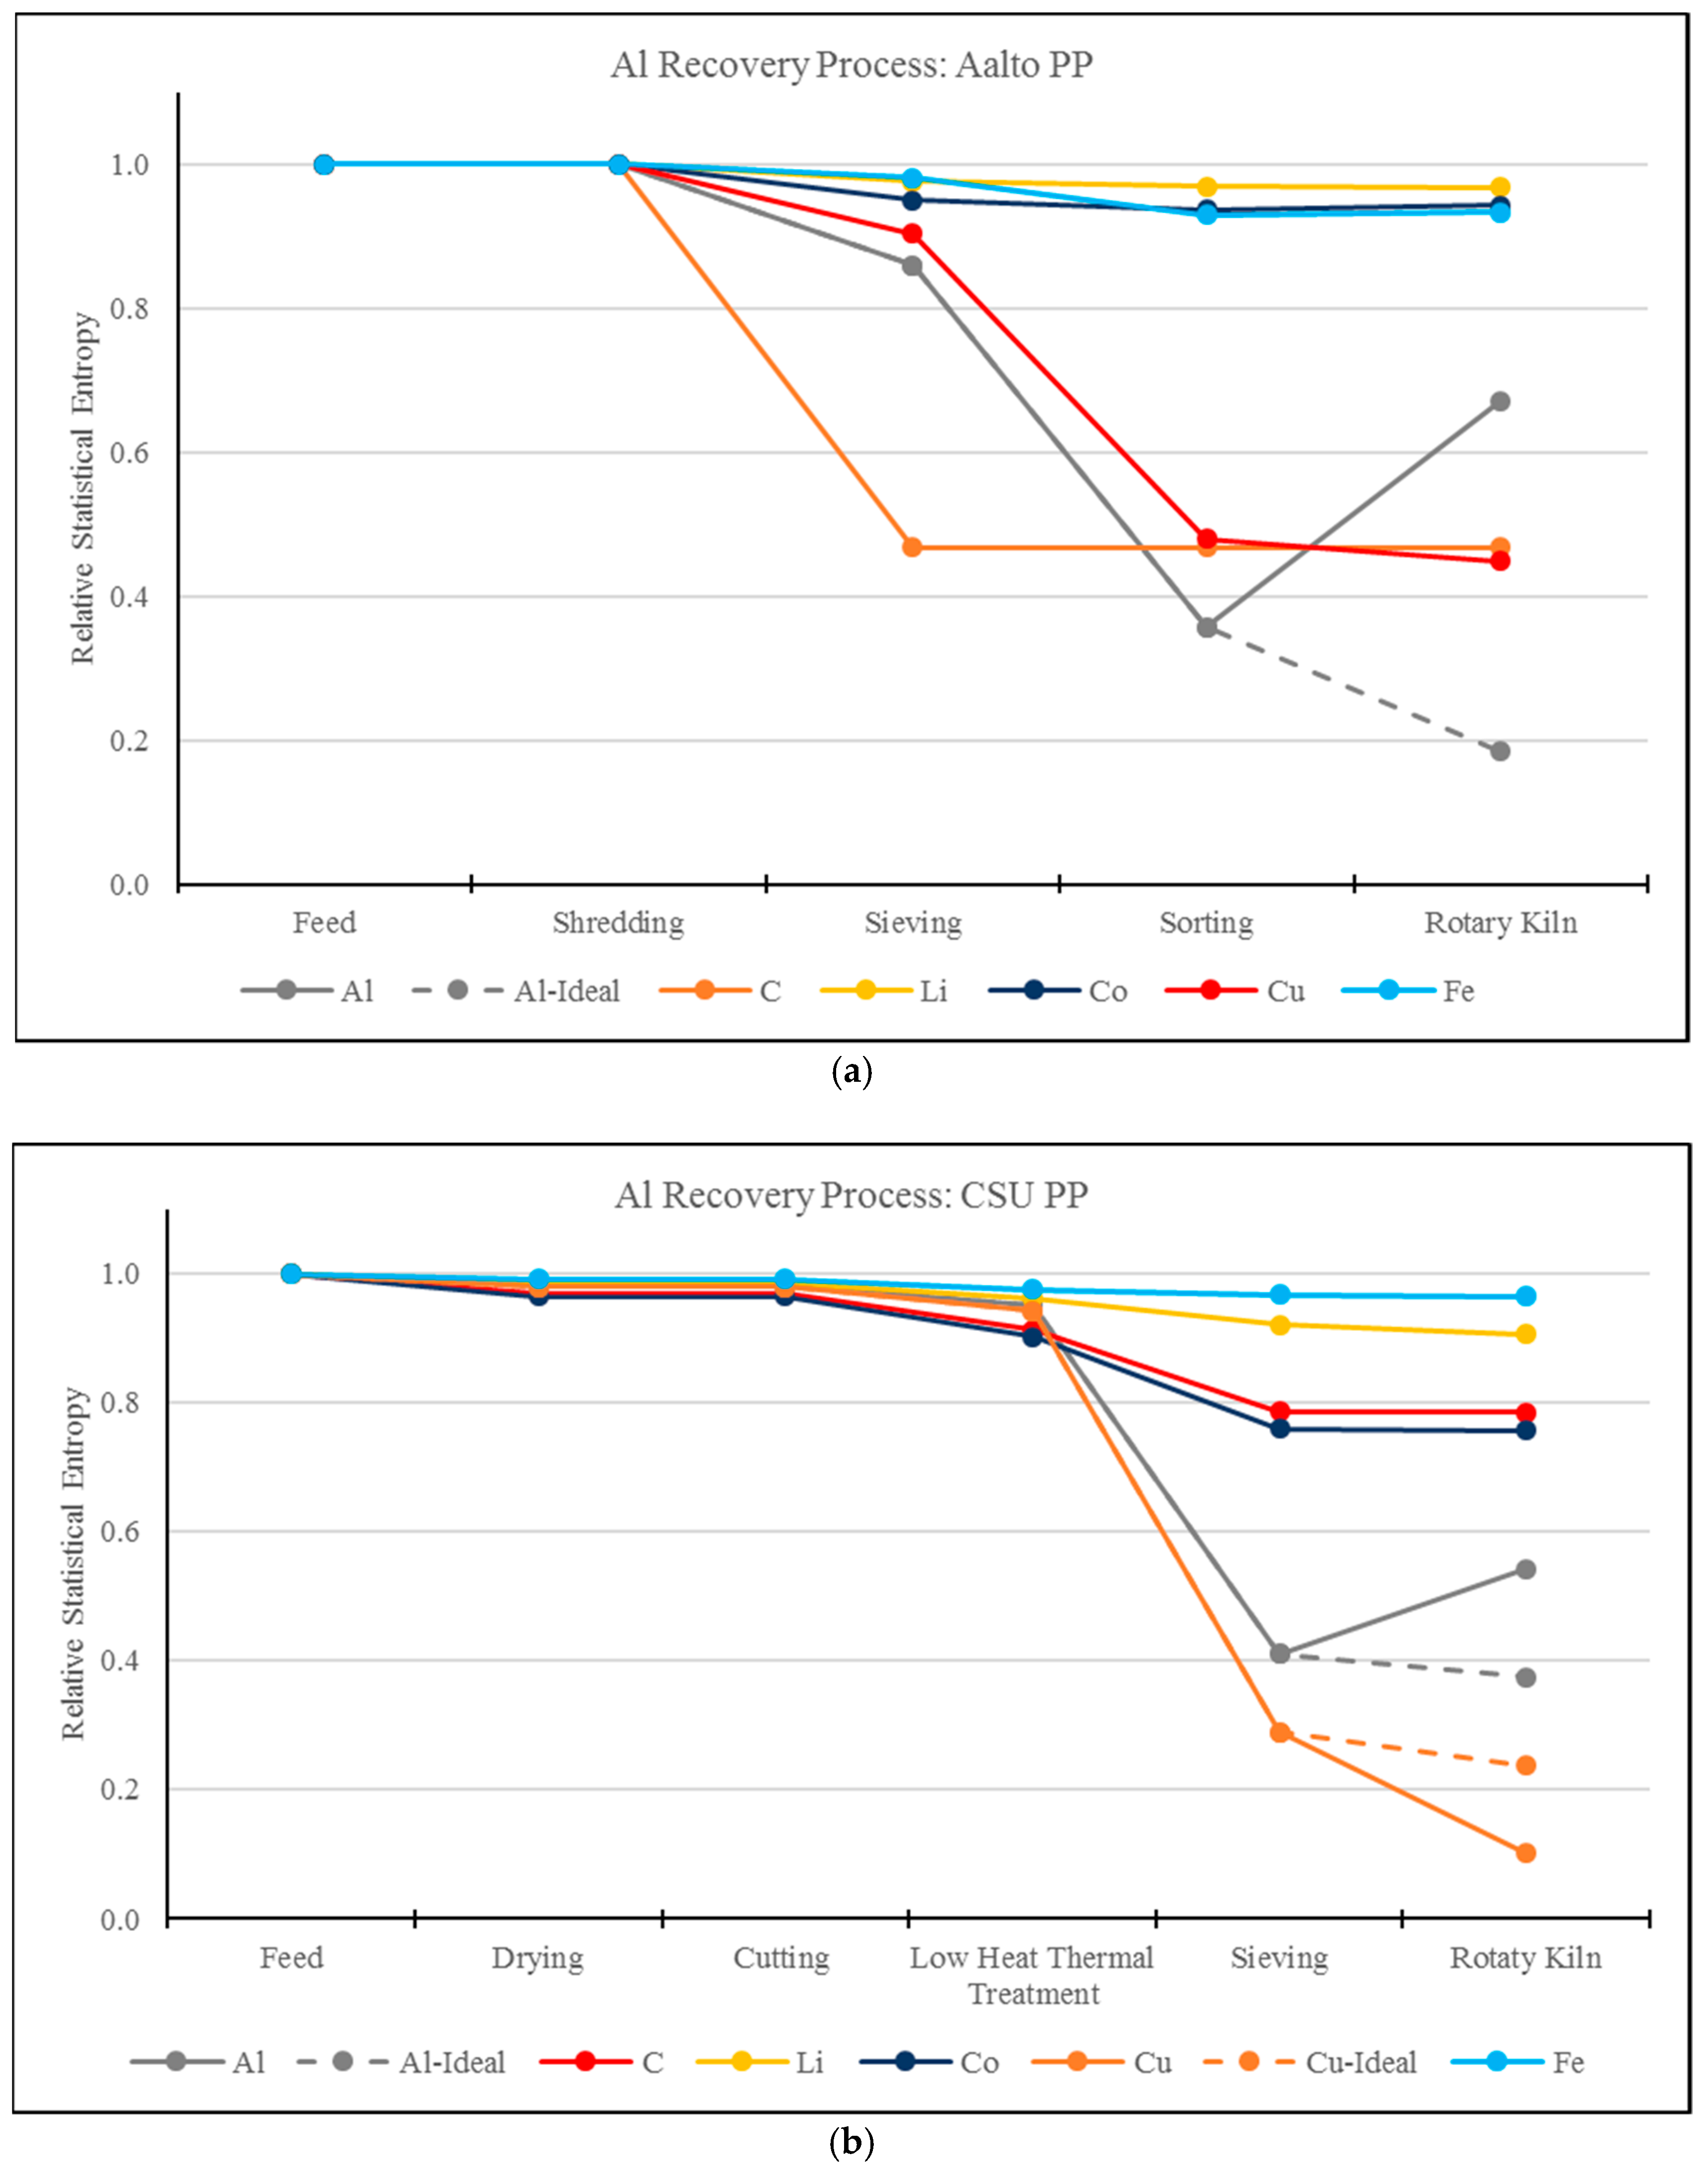
3.1. RSE Analysis of the Aluminum Recovery Processes
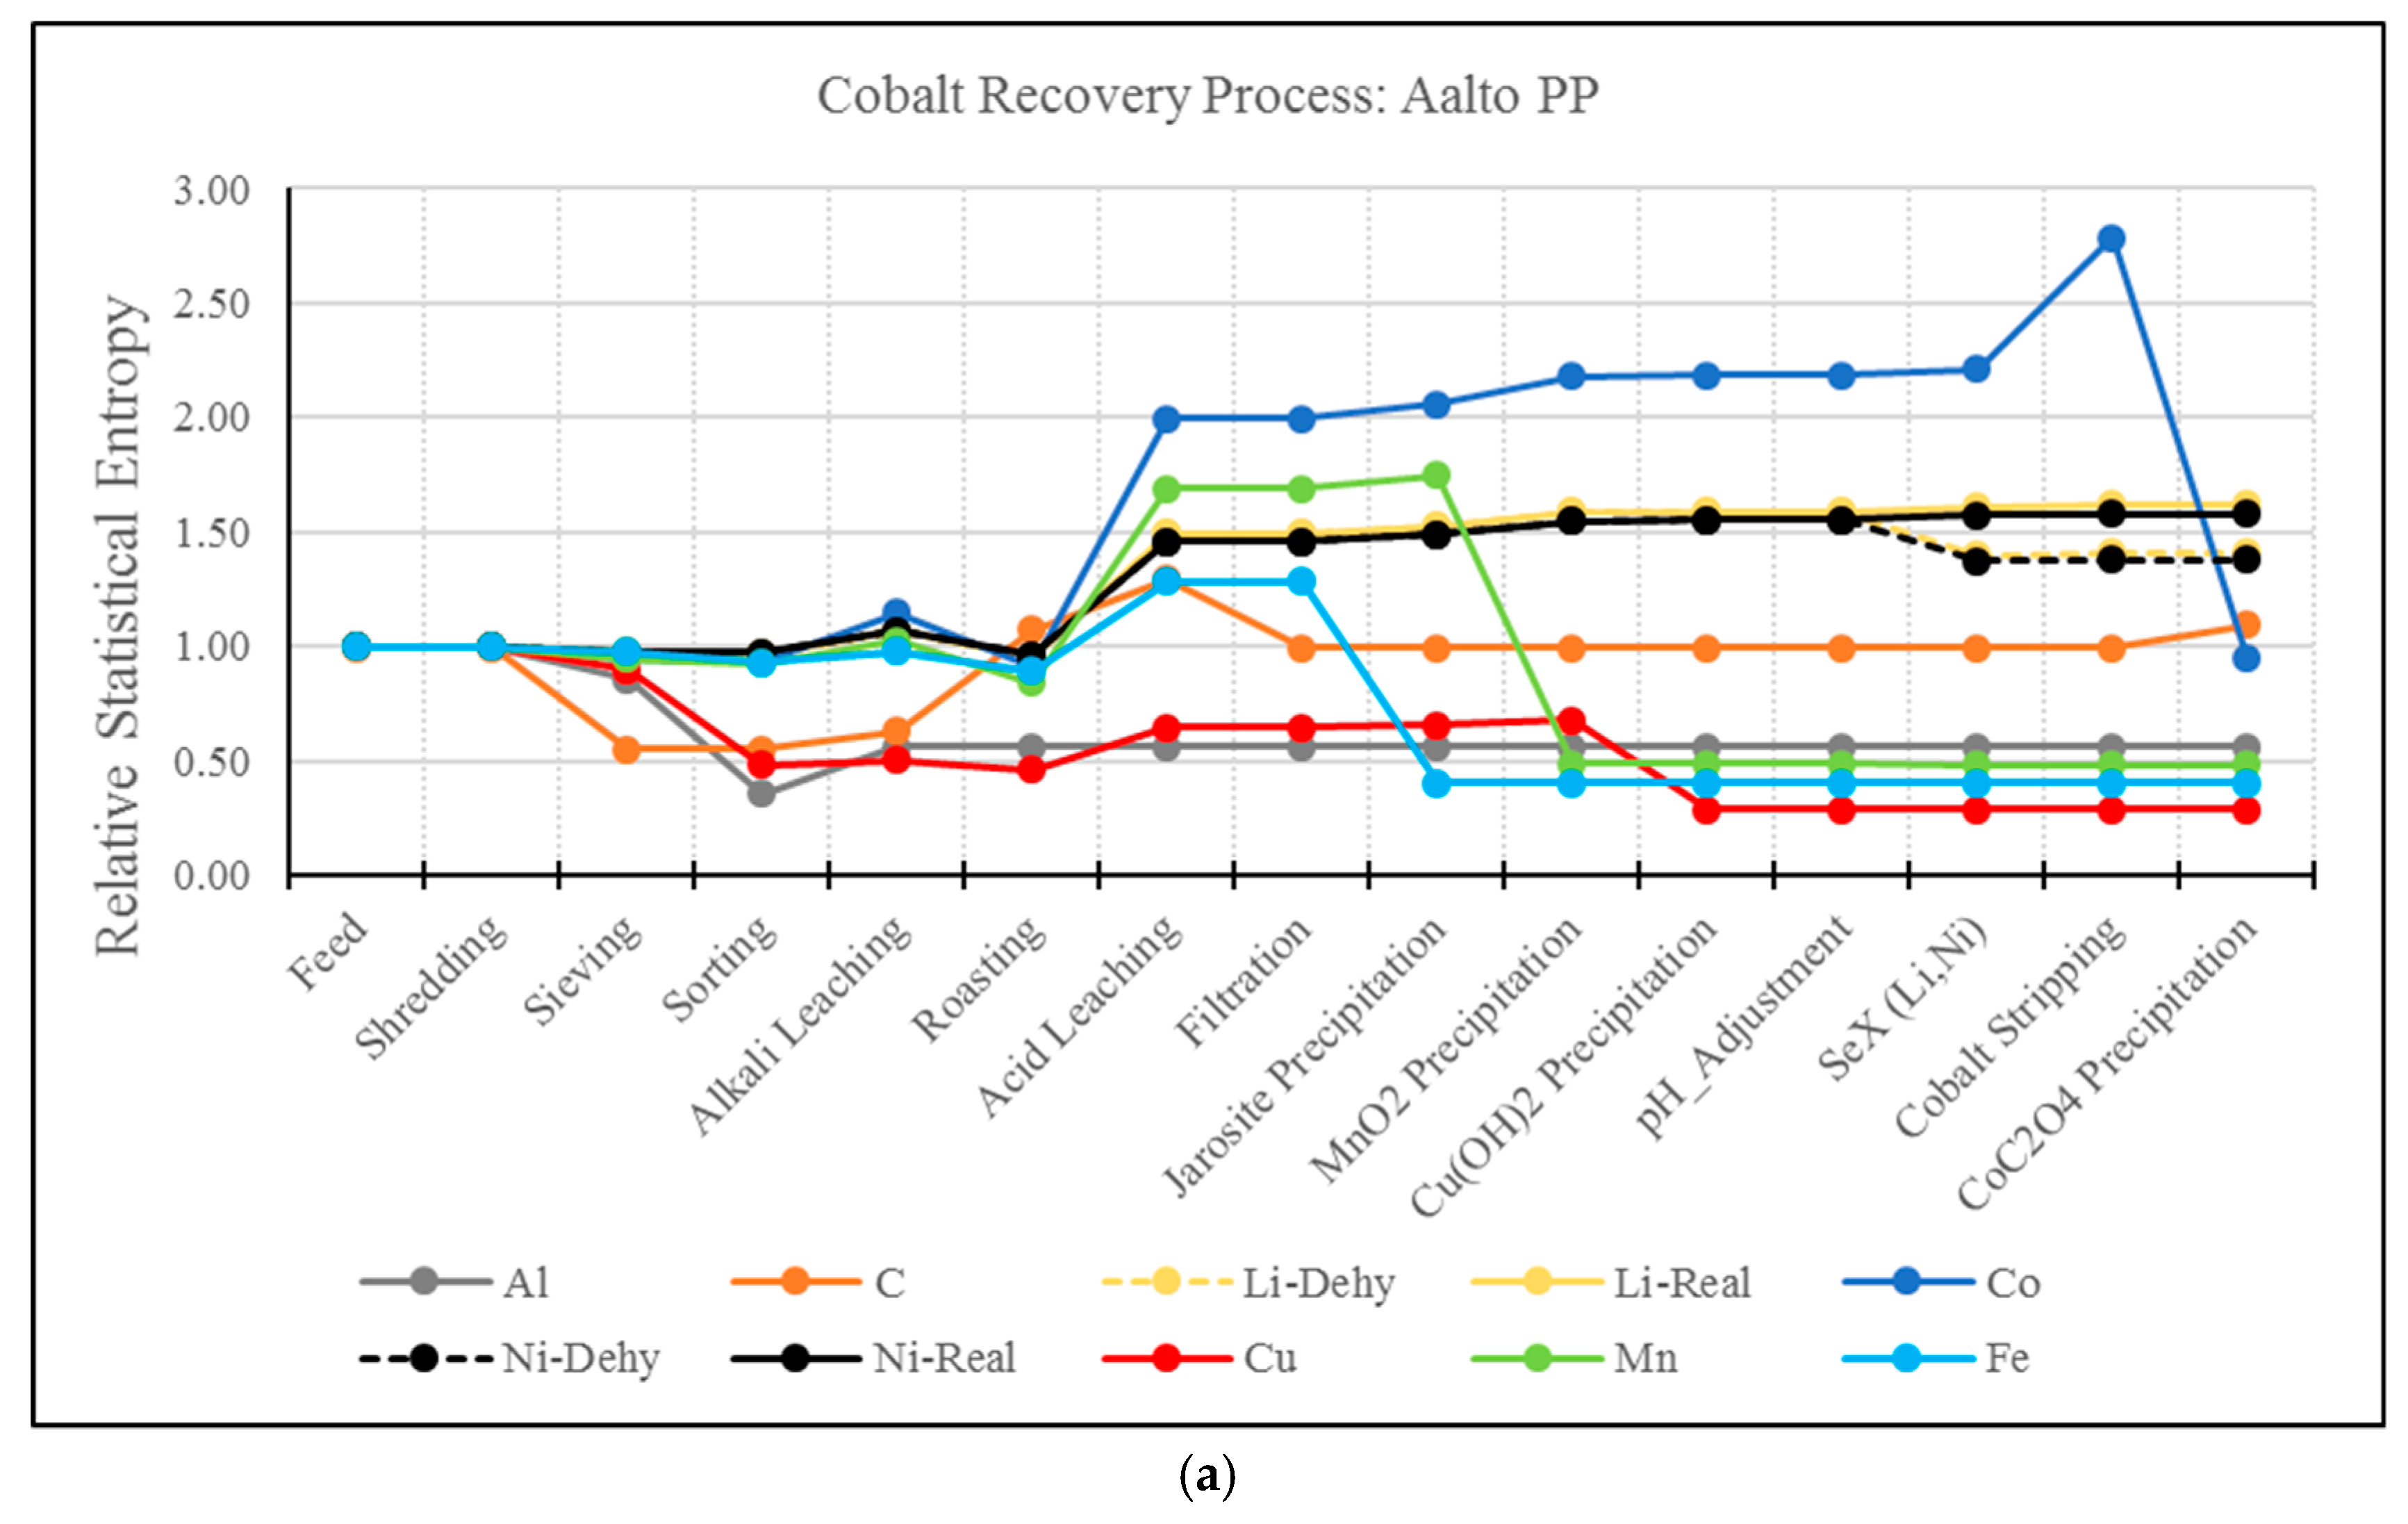
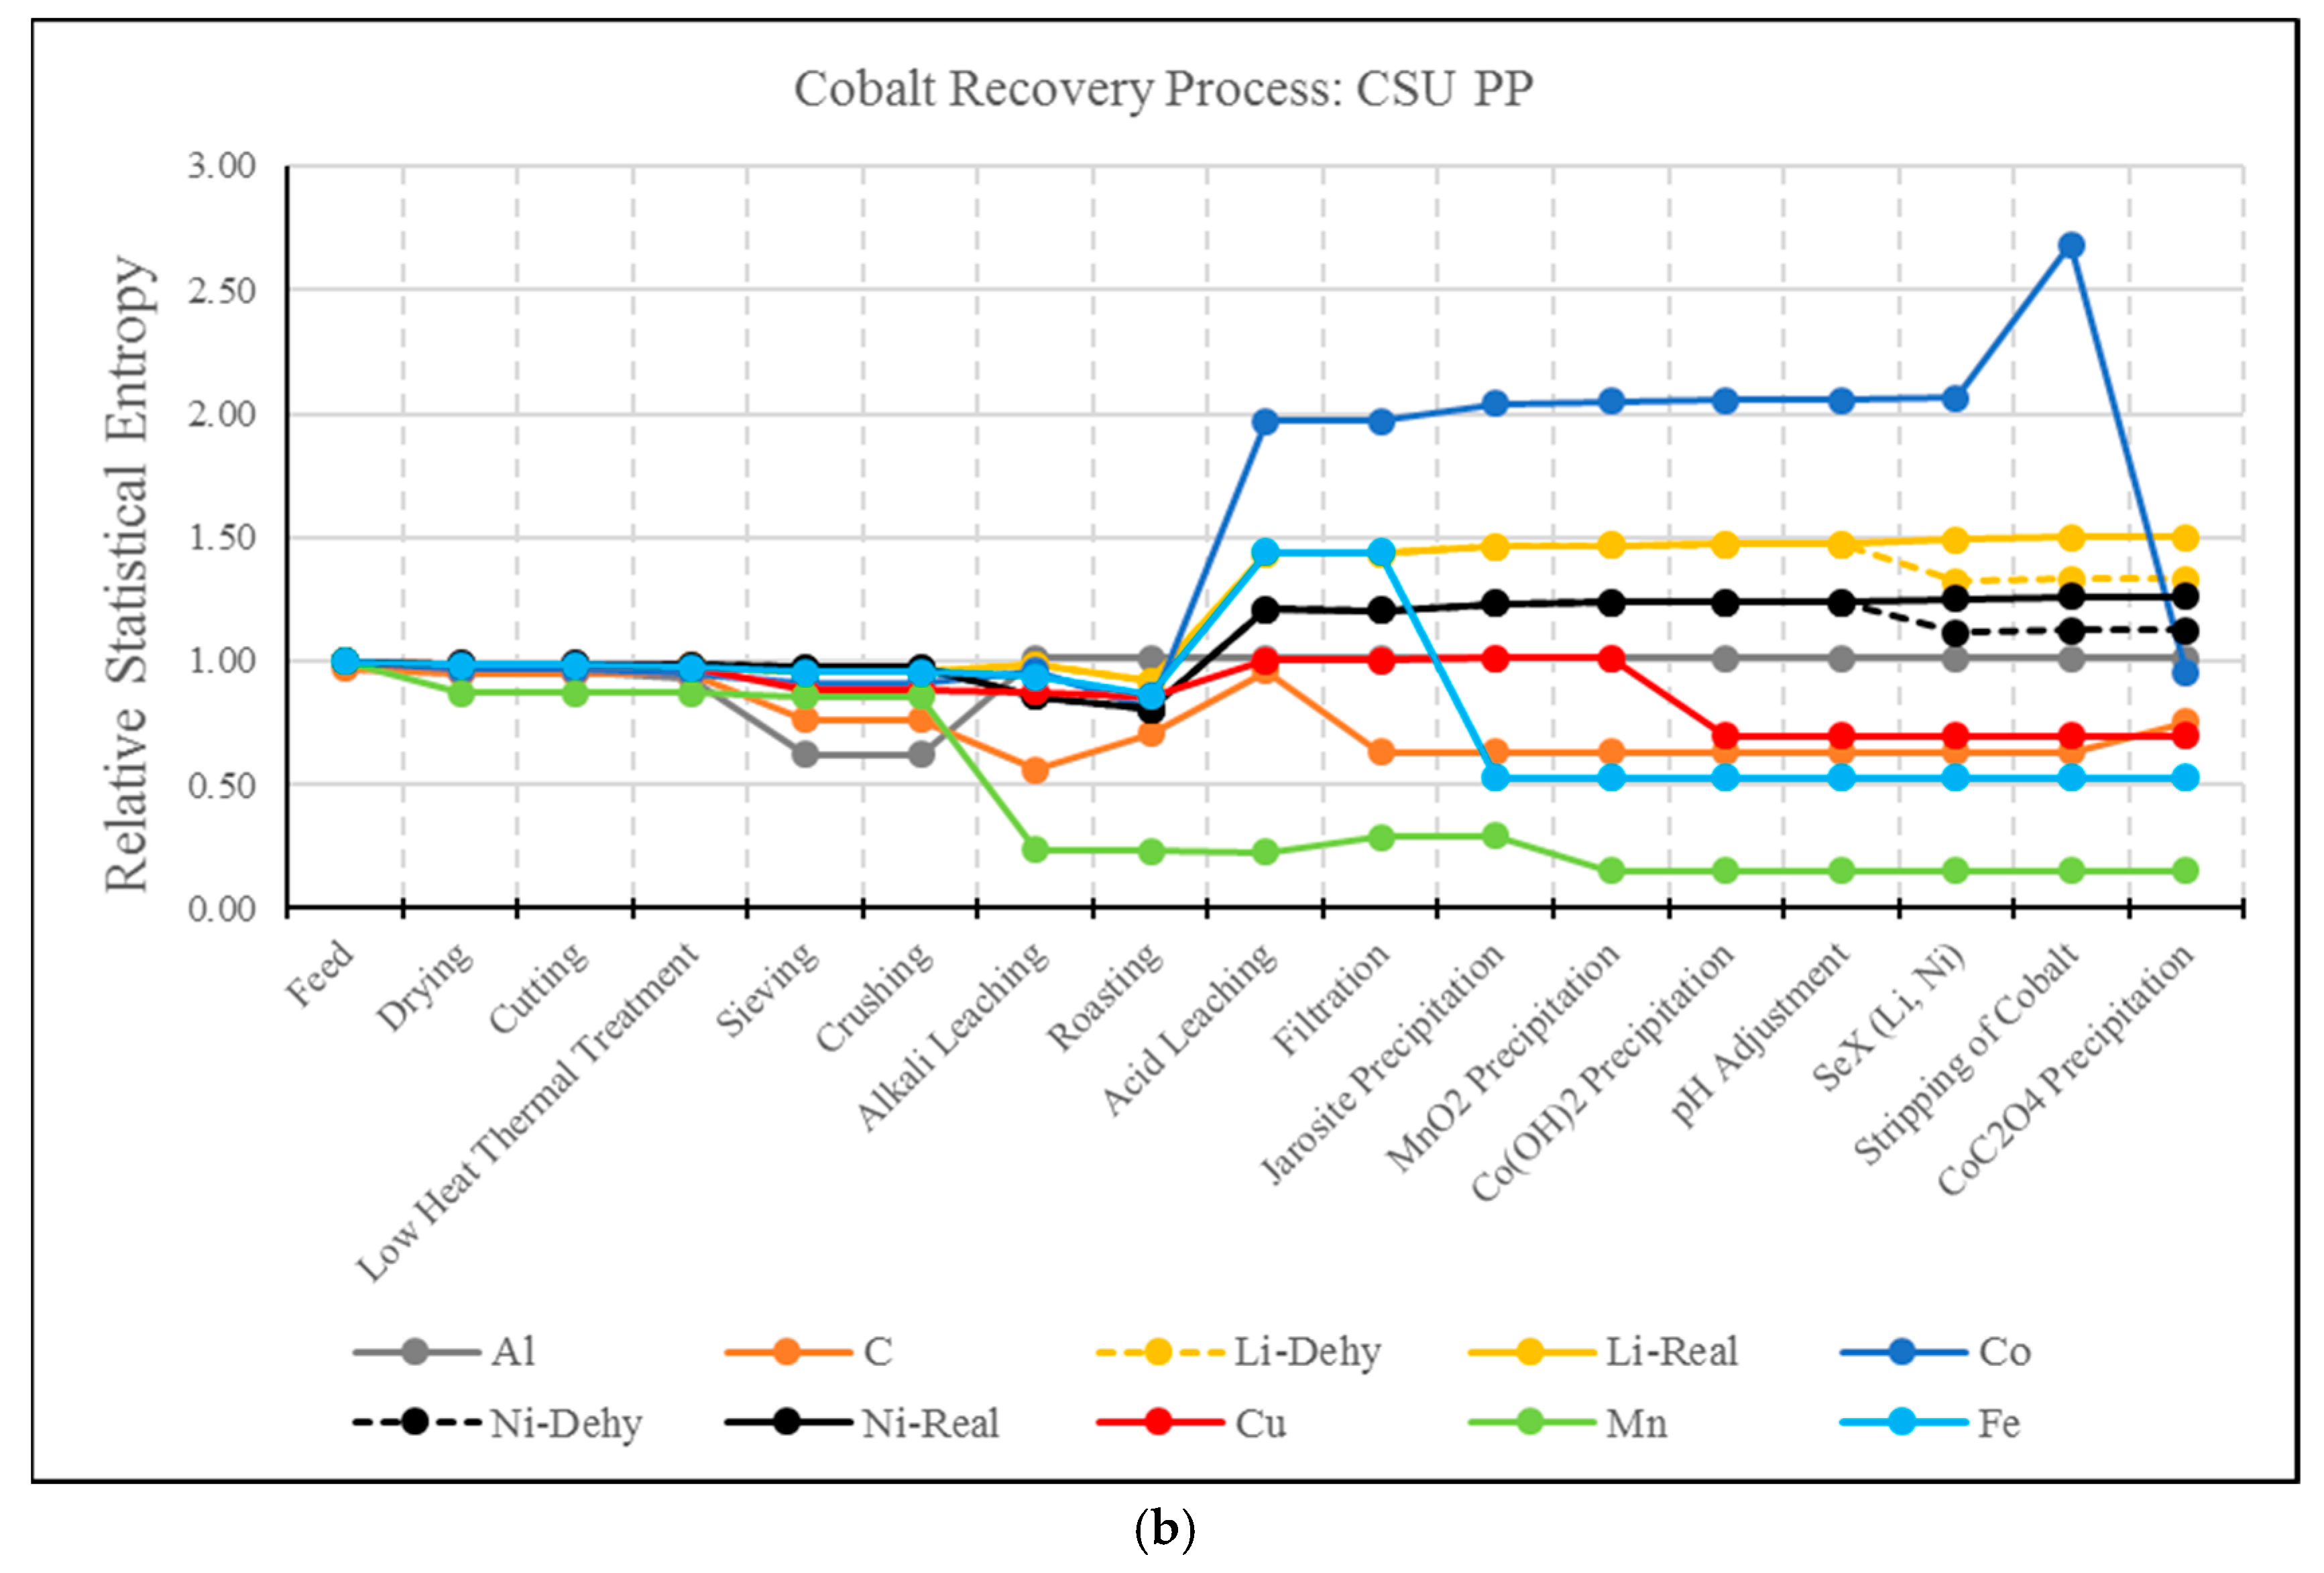
3.2. RSE Analysis Electrode Treatment Processes
4. Conclusions
- MFA and RSE methodology and analysis can be used as a tool to describe the correlation between different compounds in a process stream. As shown in this study, the addition of impurities (Al2O3) has an impact on the RSE value of other compounds (Al), reflecting an increase in entropy of Al.
- This work demonstrates the systemic view of this methodology by identifying the correlations of entropy between elements, for example, Al and Cu. In the CSU process, as Al is transformed to Al2O3 and lost to the slag phase, Cu is concentrated. This effect is not present in the Aalto process due to a preliminary mechanical separation step.
- The analysis of MFA and RSE is used as a viable option for decision making as it clarifies the difference between two recycling processes and the quality of the final products is similar.
- MFA and RSE is a methodology that weights on the influence of pre-processing stages, which were until now overlooked. After comparing RSE values, the process with the sharpest reduction in entropy in pre-processing stages also resulted in the decreased final values of RSE.
- A drawback of the MFA and RSE for the analysis of hydrometallurgical processes has been identified. As presented, this type of analysis present biased results for elements whose extraction is based on solubilization. For example, the solvent extraction steps of Li and Ni resulted in a significant increase in entropy, even though these elements have been effectively separated from the material matrix. The use of MFA and RSE in recycling processes should be further developed to account for the effect of solubilization.
- MFA and RSE bring a method for the analysis of streams in recycling processes that, coupled with other simulation-based analysis (e.g., exergy, and/or thermo-economics), may support the decision-making in favor of a circular economy.
Author Contributions
Funding
Acknowledgments
Conflicts of Interest
References
- Ellen MacArthur Foundation. Towards the Circular Economy; Ellen MacArthur Foundation: Isle of Wight, UK, 2013. [Google Scholar]
- Martin, G.; Rentsch, L.; Höck, M.; Bertau, M. Lithium market research—Global supply, future demand and price development. Energy Storage Mater. 2017, 6, 171–179. [Google Scholar] [CrossRef]
- Linden, D.; Reddy, B.T. (Eds.) Linden’s Handbook of Batteries, 4th ed.; McGraw Hill: New York, NY, USA, 2011. [Google Scholar]
- Georgi-Maschler, T.; Friedrich, B.; Weyhe, R.; Heegn, H.; Rutz, M. Development of a recycling process for Li-ion batteries. J. Power Sources 2012, 207, 173–182. [Google Scholar] [CrossRef]
- Heelan, J.; Gratz, E.; Zheng, Z.; Wang, Q.; Chen, M.; Apelian, D.; Wang, Y. Current and Prospective Li-Ion Battery Recycling and Recovery Processes. J. Miner. Met. Mater. Soc. 2016, 68, 2632–2638. [Google Scholar] [CrossRef]
- Nitta, N.; Wu, F.; Lee, J.T.; Yushin, G. Li-ion battery materials: Present and future. Mater. Today 2015, 18, 252–264. [Google Scholar] [CrossRef]
- Julien, C.M.; Mauger, A.; Zaghib, K.; Groult, H. Comparative Issues of Cathode Materials for Li-Ion Batteries. Inorganics 2014, 2, 132–154. [Google Scholar] [CrossRef]
- Frenzel, M.; Kullik, J.; Reuter, M.A.; Gutzmer, J. Raw material “criticality”—Sense or nonsense? J. Phys. D Appl. Phys. 2017, 50, 123002. [Google Scholar] [CrossRef]
- Chen, L.; Tang, X.; Zhang, Y.; Li, L.; Zeng, Z.; Zhang, Y. Process for the recovery of cobalt oxalate from spent lithium-ion batteries. Hydrometallurgy 2011, 108, 80–86. [Google Scholar] [CrossRef]
- Gratz, E.; Sa, Q.; Apelian, D.; Wang, Y. A closed loop process for recycling spent lithium ion batteries. J. Power Sources 2014, 262, 255–262. [Google Scholar] [CrossRef]
- Zheng, R.; Wang, W.; Dai, Y.; Ma, Q.; Liu, Y.; Mu, D.; Li, R.; Ren, J.; Dai, C. A closed-loop process for recycling LiNixCoyMn(1−x−y)O2 from mixed cathode materials of lithium-ion batteries. Green Energy Environ. 2016, 2, 42–50. [Google Scholar] [CrossRef]
- Valio, J. Critical Review on Lithium ion Battery Recycling; Aalto University: Uusimaa, Finland, 2017. [Google Scholar]
- Zhang, T.; He, Y.; Ge, L.; Fu, R.; Zhang, X.; Huang, Y. Characteristics of wet and dry crushing methods in the recycling process of spent lithium-ion batteries. J. Power Sources 2013, 240, 766–771. [Google Scholar] [CrossRef]
- da Costa, A.J.; Matos, J.F.; Bernardes, A.M.; Müller, I.L. Beneficiation of cobalt, copper and aluminum from wasted lithium-ion batteries by mechanical processing. Int. J. Miner. Process. 2015, 145, 77–82. [Google Scholar] [CrossRef]
- Brunner, P.H.; Rechberger, H. Practical Handbook of Material Flow Analysis; CRC Press LLC: Boca Raton, FL, USA, 2011. [Google Scholar]
- Bai, L.; Qiao, Q.; Li, Y.; Wan, S.; Xie, M.; Chai, F. Statistical entropy analysis of substance flows in a lead smelting process. Resour. Conserv. Recycl. 2015, 94, 118–128. [Google Scholar] [CrossRef]
- Rechberger, H.; Graedel, T.E. The contemporary European copper cycle: Statistical entropy analysis. Ecol. Econ. 2002, 42, 59–72. [Google Scholar] [CrossRef]
- Martínez, O.V.; van den Boogaart, K.G.; Lundström, M.; Santasalo-Aarnio, A.; Reuter, M.; Serna-Guerrero, R. Statistical entropy analysis as tool for circular economy: Proof of concept by optimizing a lithium-ion battery waste sieving system. J. Clean. Prod. 2019, 212, 1568–1579. [Google Scholar] [CrossRef]
- Llamas, A.A.; Delgado, A.V.; Capilla, A.V.; Cuadra, C.T.; Hultgren, M.; Peltomäki, M.; Roine, A.; Stelter, M.; Reuter, M.A. Simulation-based exergy, thermo-economic and environmental footprint analysis of primary copper production. Miner. Eng. 2019, 131, 51–65. [Google Scholar] [CrossRef]
- Porvali, A.; Aaltonen, M.; Ojanen, S.; Velazquez-Martinez, O.; Eronen, E.; Liu, F.; Wilson, B.P.; Serna-Guerrero, R.; Lundström, M. Mechanical and hydrometallurgical processes in HCl media for the recycling of valuable metals from Li-ion battery waste. Resour. Conserv. Recycl. 2019, 142, 257–266. [Google Scholar] [CrossRef]
- Dorella, G.; Mansur, M.B. A study of the separation of cobalt from spent Li-ion battery residues. J. Power Sources 2007, 170, 210–215. [Google Scholar] [CrossRef]
- Reuter, M.A.; Hudson, C.; van Schaik, A.; Heiskanen, K.; Meskers, C.; Hagelüken, C. Metal Recycling: Opportunities, Limits, Infrastructure; United Nations Environment Programme: Nairobi, Kenya, 2013. [Google Scholar]
- Nanoshel LCC. Aluminium Foil for Lithium Ion Battery. 2015. Available online: https://www.nanoshel.com/product/aluminum-foil (accessed on 5 November 2018).


| Element (i) | Al-Rich Fraction | Cu-Rich Fraction | Electrode Rich Fraction | Residue |
|---|---|---|---|---|
| Al | 60.59% | 0.18% | 1.80% | 0.00% |
| C | 0.00% | 0.00% | 54.13% | 0.00% |
| Li | 1.20% | 0.45% | 3.78% | 2.02% |
| Co | 11.66% | 1.91% | 23.31% | 10.57% |
| Ni | 1.30% | 0.50% | 2.54% | 0.90% |
| Cu | 1.68% | 74.37% | 2.45% | 1.99% |
| Fe | 0.46% | 0.92% | 0.66% | 0.00% |
| Mn | 1.51% | 0.14% | 11.33% | 5.43% |
| Plastics | 21.59% | 21.53% | 0.00% | 79.09 |
| Element (i) | Metal-Rich Fraction | Electrode-Rich Fraction |
|---|---|---|
| Al | 34.25% | 0.09% |
| C | 1.18% | 31.10% |
| Li | 2.00% | 4.34% |
| Co | 1.39% | 36.88% |
| Ni | 0.38% | 10.01% |
| Cu | 54.80% | 0.15% |
| Mn | 6.74% | 16.68% |
| Fe | 0.87% | 0.23% |
| Others | 0.21% | 0.51% |
| Pre-Processing (PP) System | Al-wt% at “Molten Aluminium” | Cu-wt% at “Molten Aluminium” |
|---|---|---|
| Aalto PP | 74.24% | 25.76% |
| CSU PP | 15.38% | 84.62% |
| Element (i) | Recovery with Aalto PP Stages | Quality of Element (Aalto PP) | Recovery with CSU PP Stages | Quality of Element (CSU PP) | Extraction Stage | Compound Form of Element |
|---|---|---|---|---|---|---|
| Al | 99% | 0.016% | 99% | 0,054% | Alkali Leaching | Al(OH)4− |
| Li | 93% | 0.13% | 92% | 0.18% | Li-Ni Solvent Extraction | Li+ |
| Co | 89% | 40.1% | 89% | 40.1% | Precipitation of Cobalt Oxalate | CoC2O4 |
| Ni | 97% | 0.087% | 96% | 0.044% | Li-Ni Solvent Extraction | Ni+2 |
| Cu | 98% | 65.1% | 98% | 65.1% | Copper Hydroxide Precipitation | Cu(OH)2 |
| Mn | 98% | 62.7% | 97% | 62.7% | Manganese Oxide Precipitation | MnO2 |
| Fe | 99% | 34.6% | 99% | 34.6% | Jarosite Precipitation | Jarosite NaFe3(SO4)2(OH)6 |
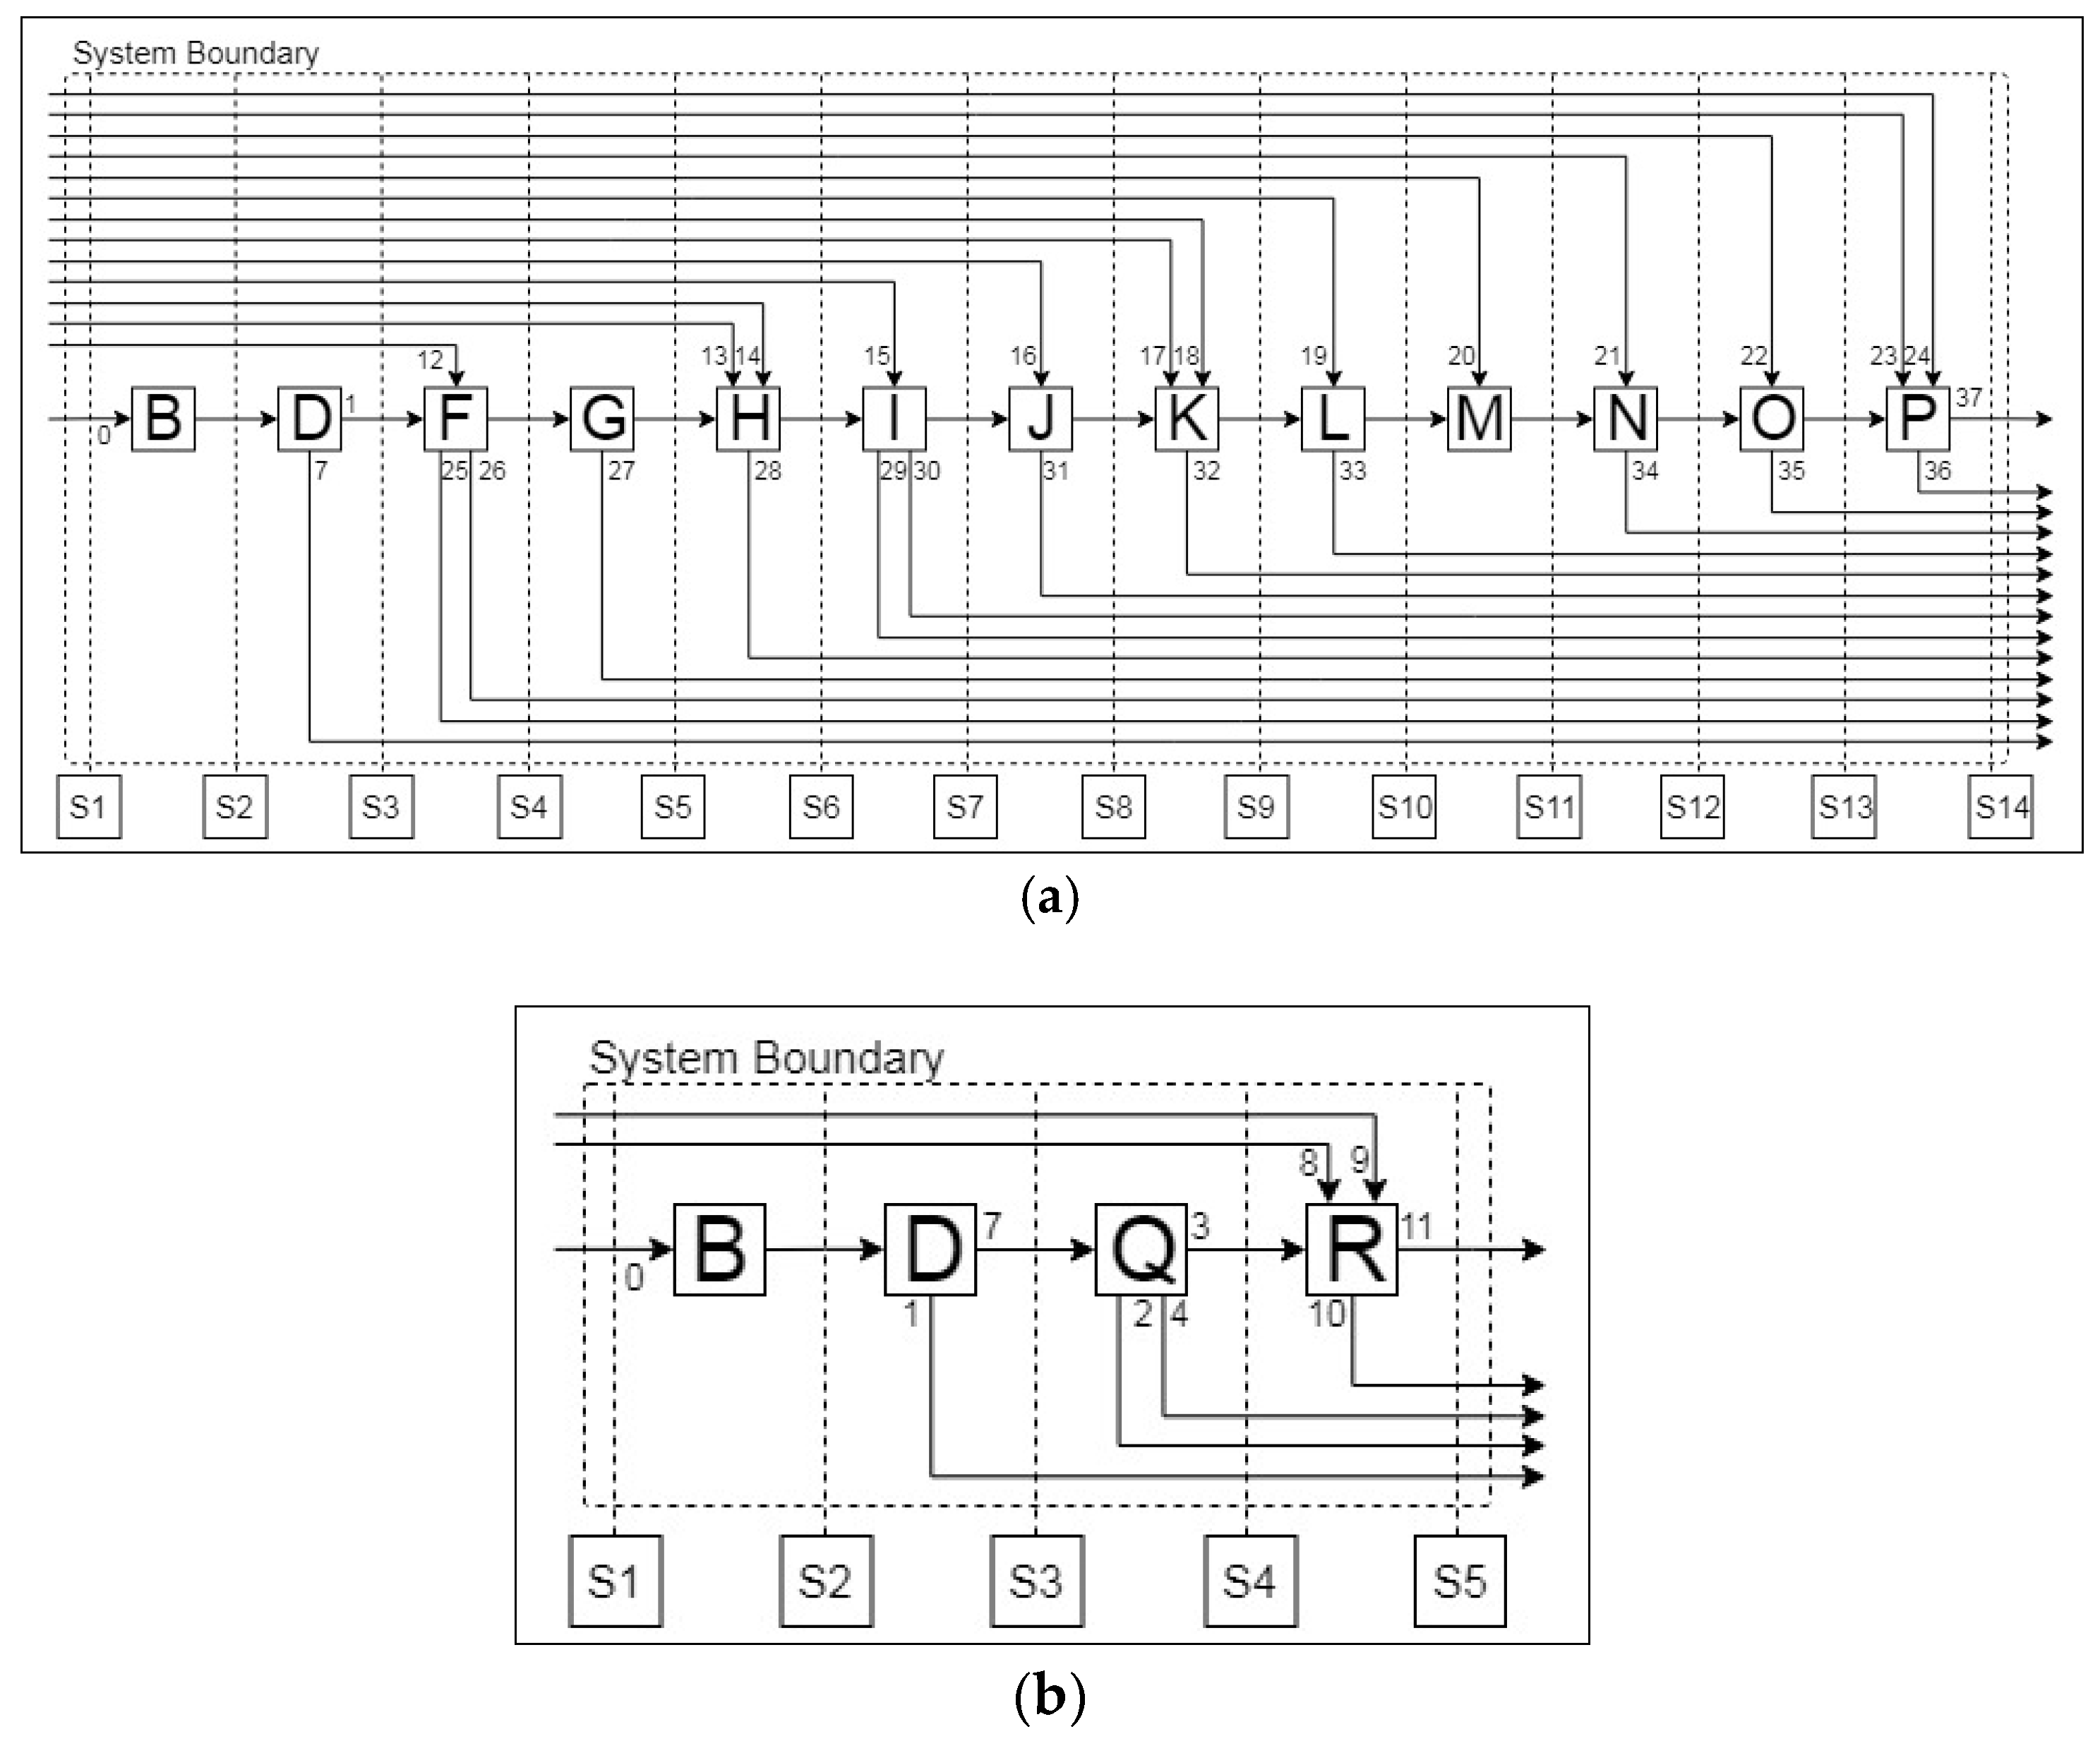
| Unit Operations | ||
| A. Drying | G. Roasting | M. pH Adjustment |
| B. Cutting/Shredding | H. Acid Leaching | N. SeX (Li, Ni) |
| C. Low Heat Thermal Treatment | I. Filtration | O. Stripping of Cobalt |
| D. Sieving | J. Jarosite Precipitation | P. CoC2O4 Precipitation |
| E. Crushing | K. MnO2 Precipitation | Q. Sorting |
| F. Alkali Leaching | L. Cu(OH)2 Precipitation | R. Rotary Kiln |
| Stream List | ||
| 0. Lithium-ion battery (LIB) | 1. Electrode Rich Fraction | 2. Residue |
| 3. Al-rich Fraction | 4. Cu-rich Fraction | 5. Evaporated Material I |
| 6. Evaporated Material II | 7. Metal-rich Fraction | 8. KCl |
| 9. NaCl | 10. Slag | 11. Molten Aluminium |
| 12. Sodium Hydroxide I | 13. Hydrogen Peroxide | 14. Sulphuric Acid I |
| 15. Wash Water I | 16. Sodium Hydroxide II | 17. Ammonium Persulfate |
| 18. Sodium Hydroxide III | 19. Alkali Reagent | 20. Sulphuric Acid II |
| 21. Extractant | 22. Sulphuric Acid III | 23. Sodium Hydroxide IV |
| 24. Oxalate Reagent | 25. Off-gas I | 26. Al Solution |
| 27. Off-gas II | 28. Off-gas III | 29. Residue |
| 30. Wash Water II | 31. Jarosite | 32. Manganese Oxide |
| 33. Copper Hydroxide | 34. Li-Ni Solution | 35. Barren Solution |
| 36. Filtrate Residue | 37. Cobalt Oxalate | |
© 2019 by the authors. Licensee MDPI, Basel, Switzerland. This article is an open access article distributed under the terms and conditions of the Creative Commons Attribution (CC BY) license (http://creativecommons.org/licenses/by/4.0/).
Share and Cite
Velázquez-Martinez, O.; Porvali, A.; van den Boogaart, K.G.; Santasalo-Aarnio, A.; Lundström, M.; Reuter, M.; Serna-Guerrero, R. On the Use of Statistical Entropy Analysis as Assessment Parameter for the Comparison of Lithium-Ion Battery Recycling Processes. Batteries 2019, 5, 41. https://doi.org/10.3390/batteries5020041
Velázquez-Martinez O, Porvali A, van den Boogaart KG, Santasalo-Aarnio A, Lundström M, Reuter M, Serna-Guerrero R. On the Use of Statistical Entropy Analysis as Assessment Parameter for the Comparison of Lithium-Ion Battery Recycling Processes. Batteries. 2019; 5(2):41. https://doi.org/10.3390/batteries5020041
Chicago/Turabian StyleVelázquez-Martinez, Omar, Antti Porvali, Karl Gerard van den Boogaart, Annukka Santasalo-Aarnio, Mari Lundström, Markus Reuter, and Rodrigo Serna-Guerrero. 2019. "On the Use of Statistical Entropy Analysis as Assessment Parameter for the Comparison of Lithium-Ion Battery Recycling Processes" Batteries 5, no. 2: 41. https://doi.org/10.3390/batteries5020041