
On the Road to Sustainable Energy Storage Technologies: Synthesis of Anodes for Na-Ion Batteries from Biowaste

 , and
, and
Abstract
: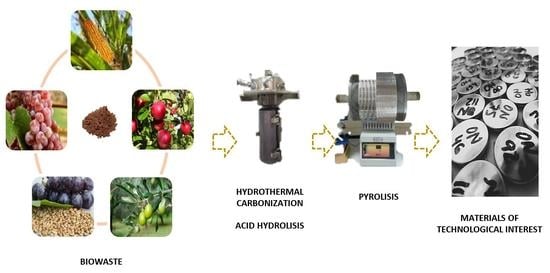
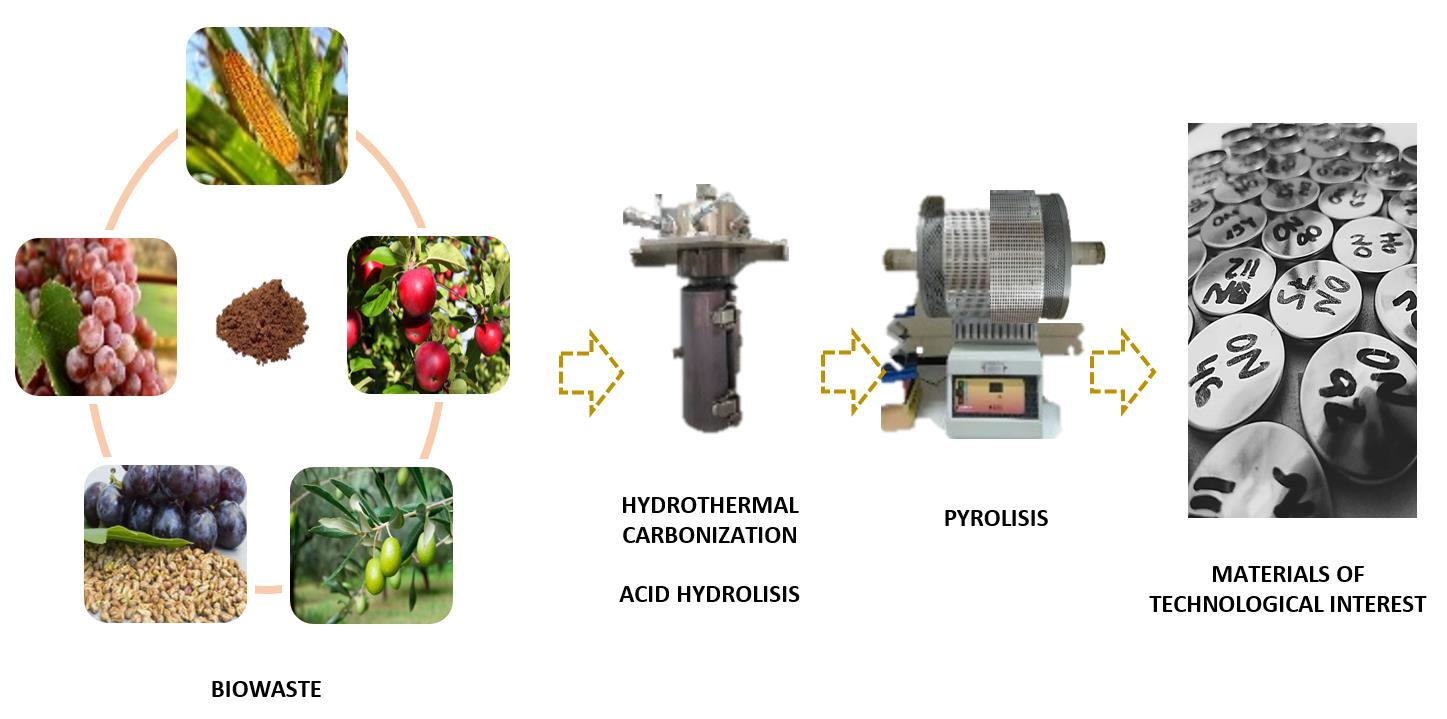
1. Introduction
2. Results and Discussion
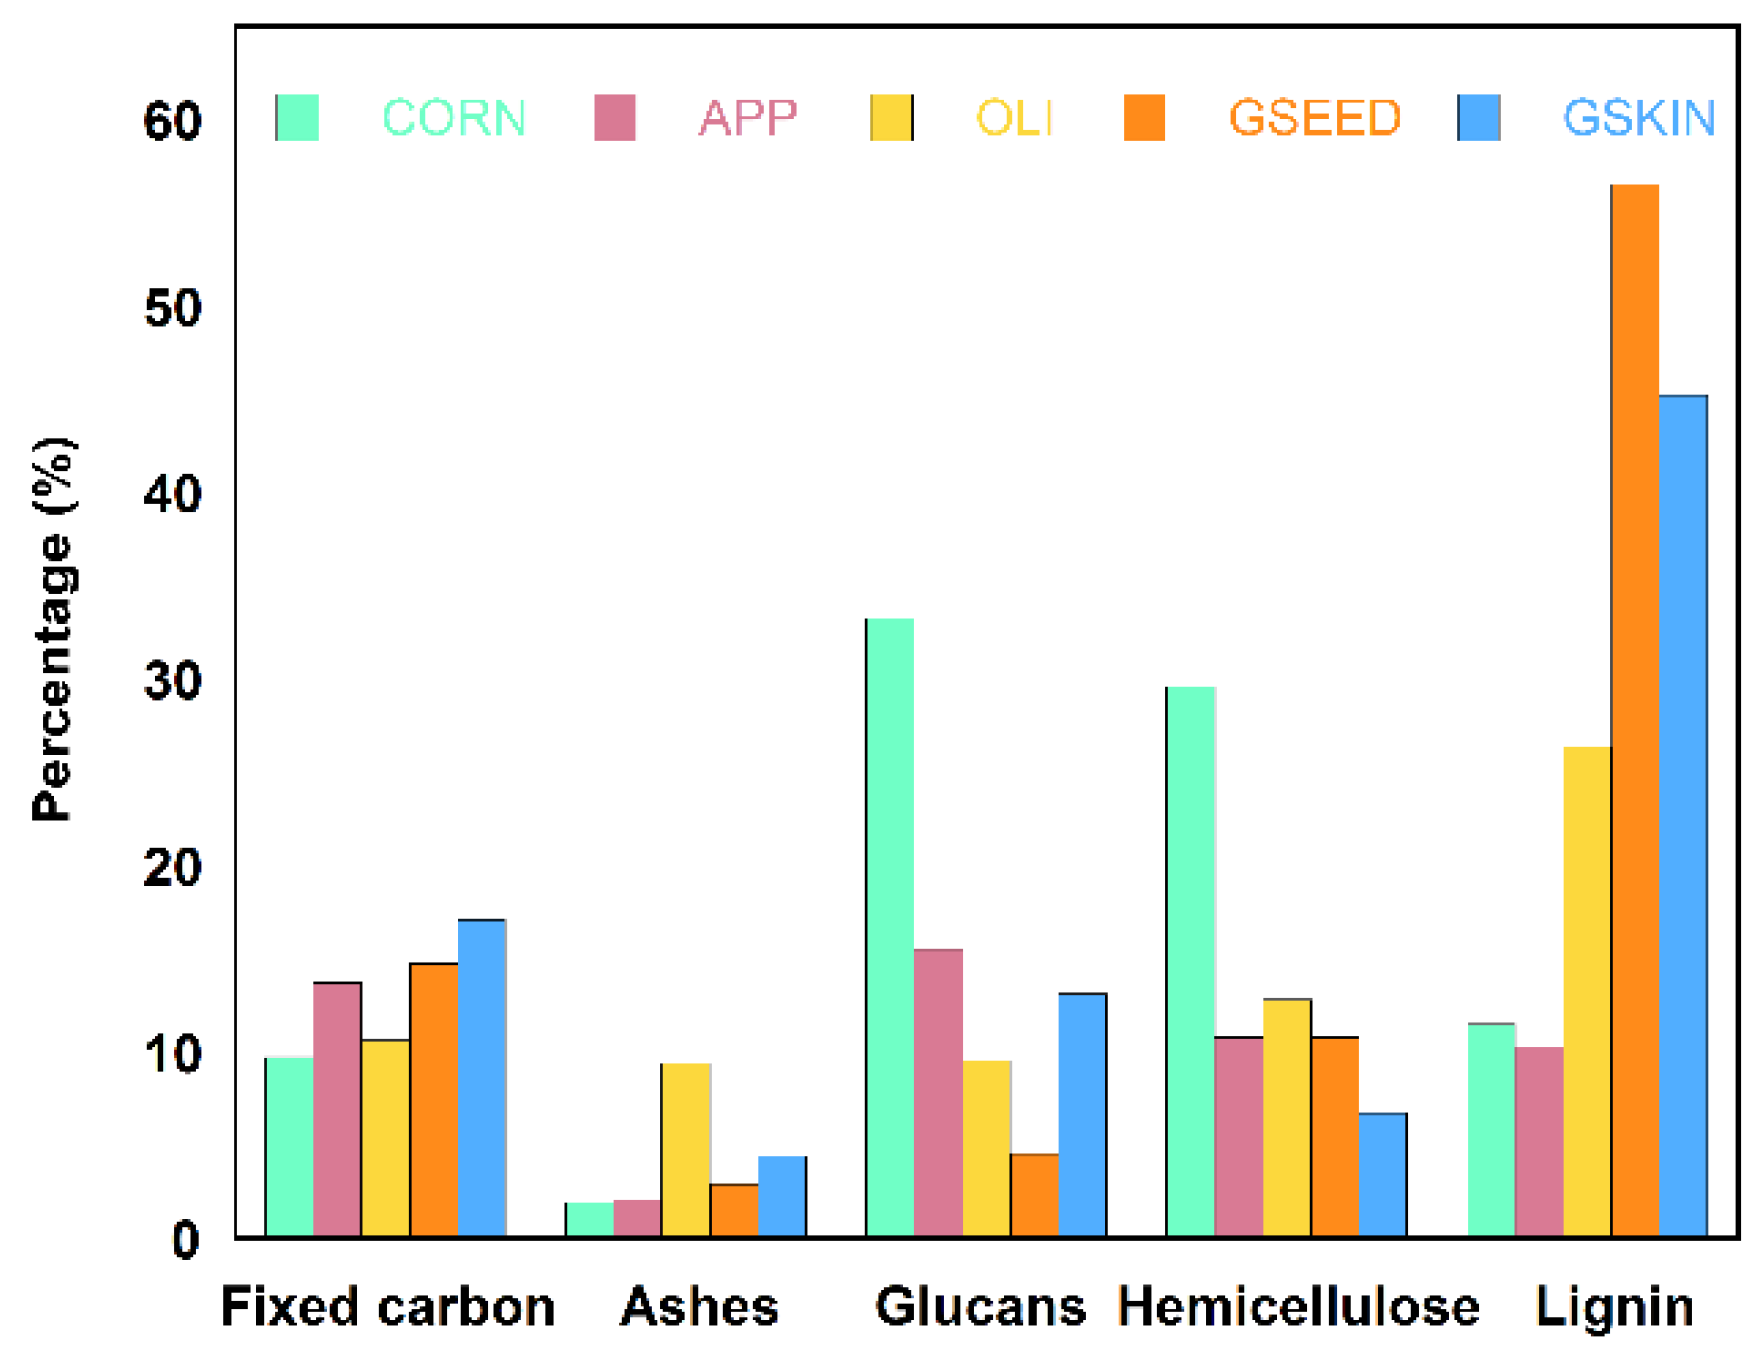
2.1. Characterization of Biowaste Samples
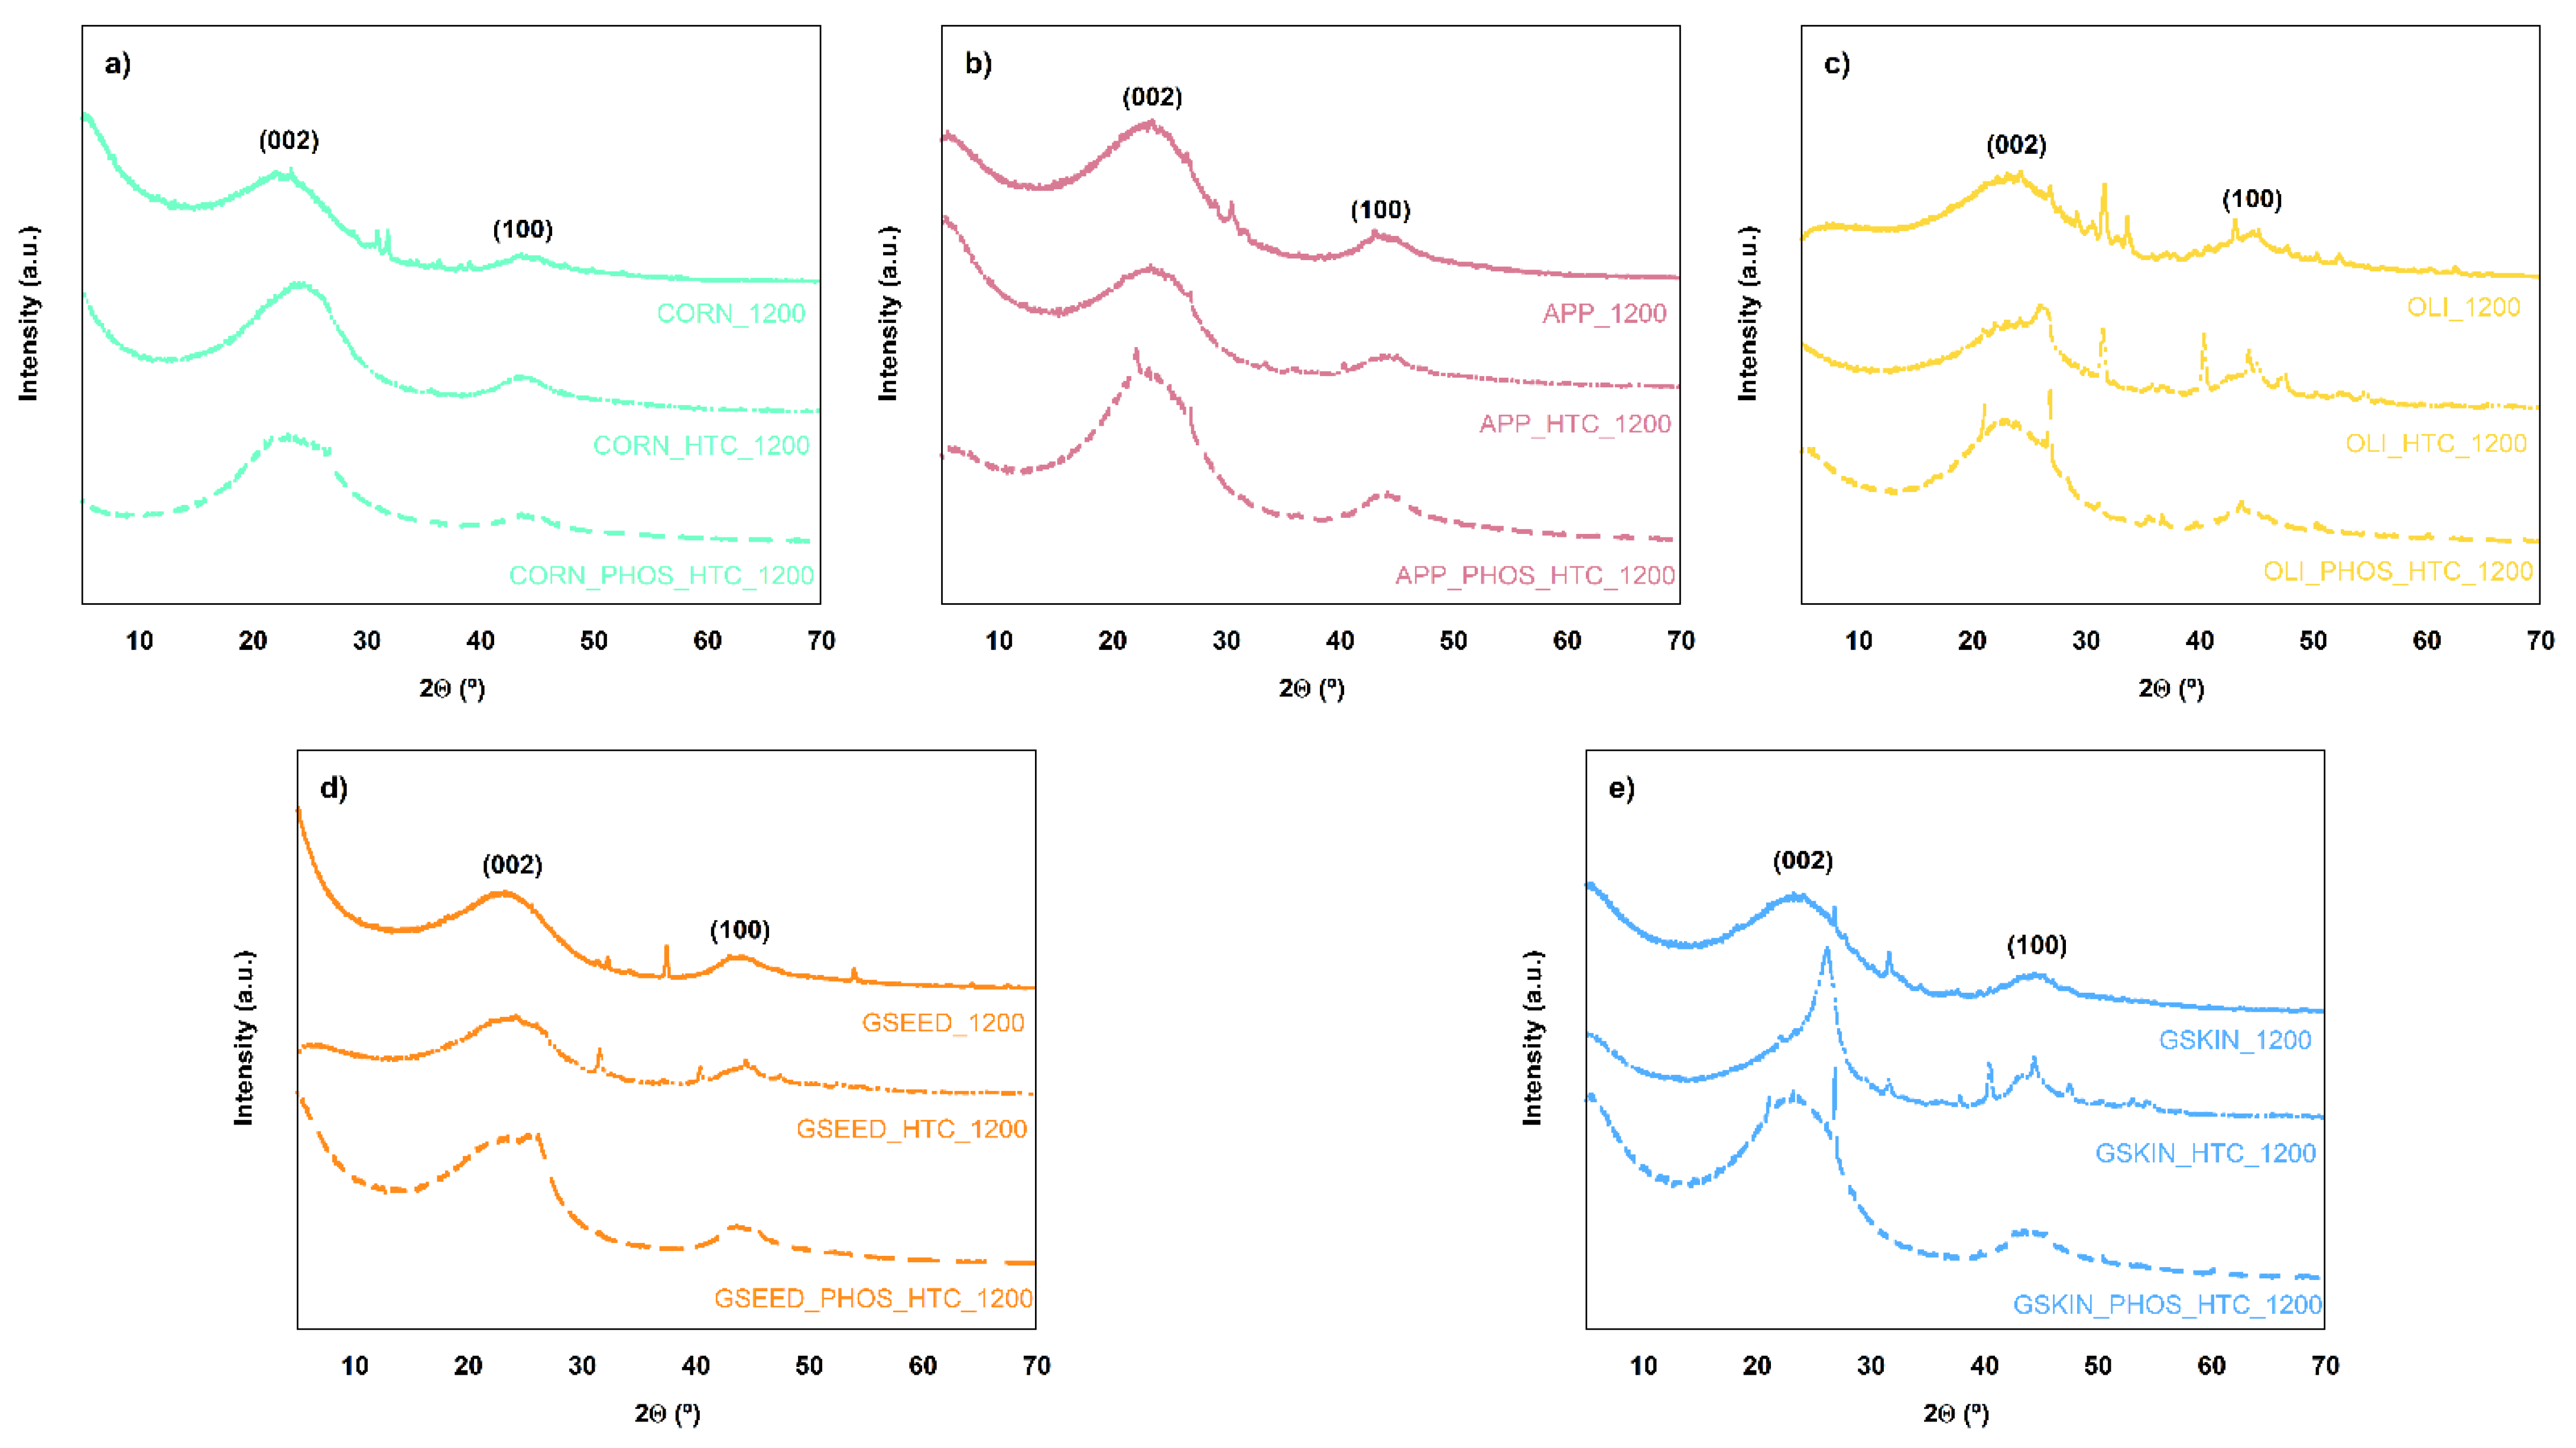
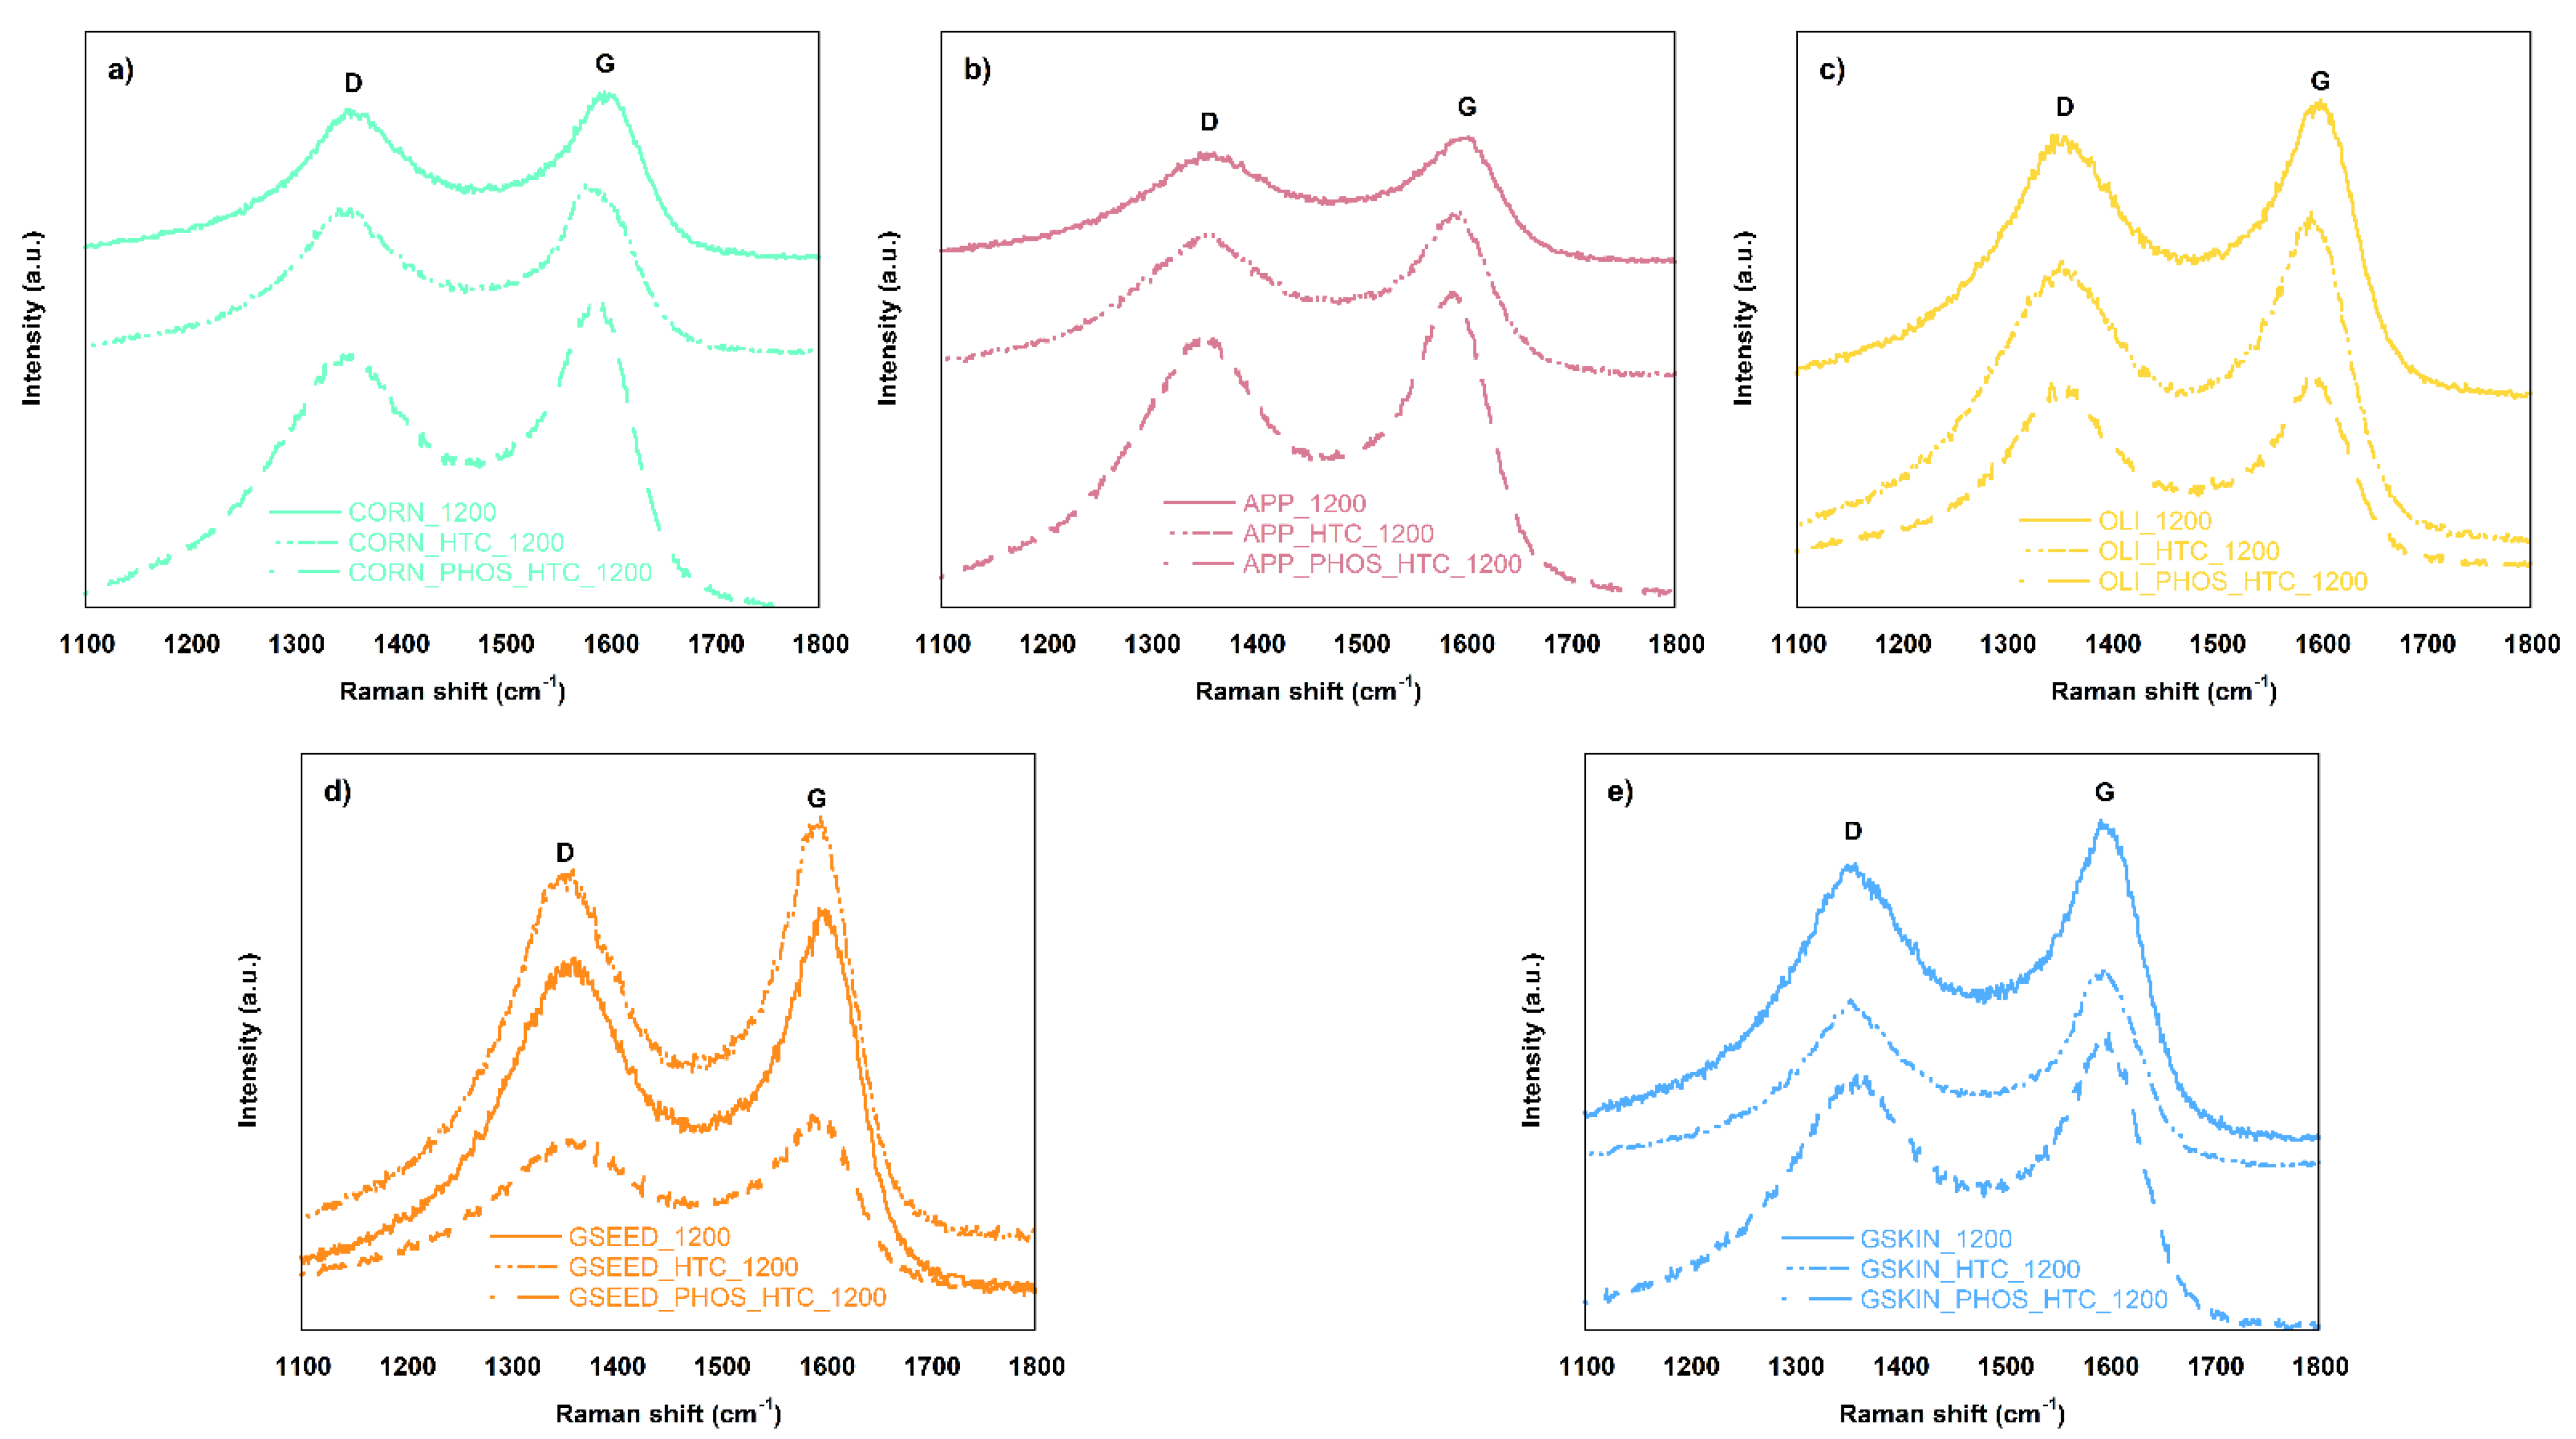
2.2. Characterization of Hard Carbons
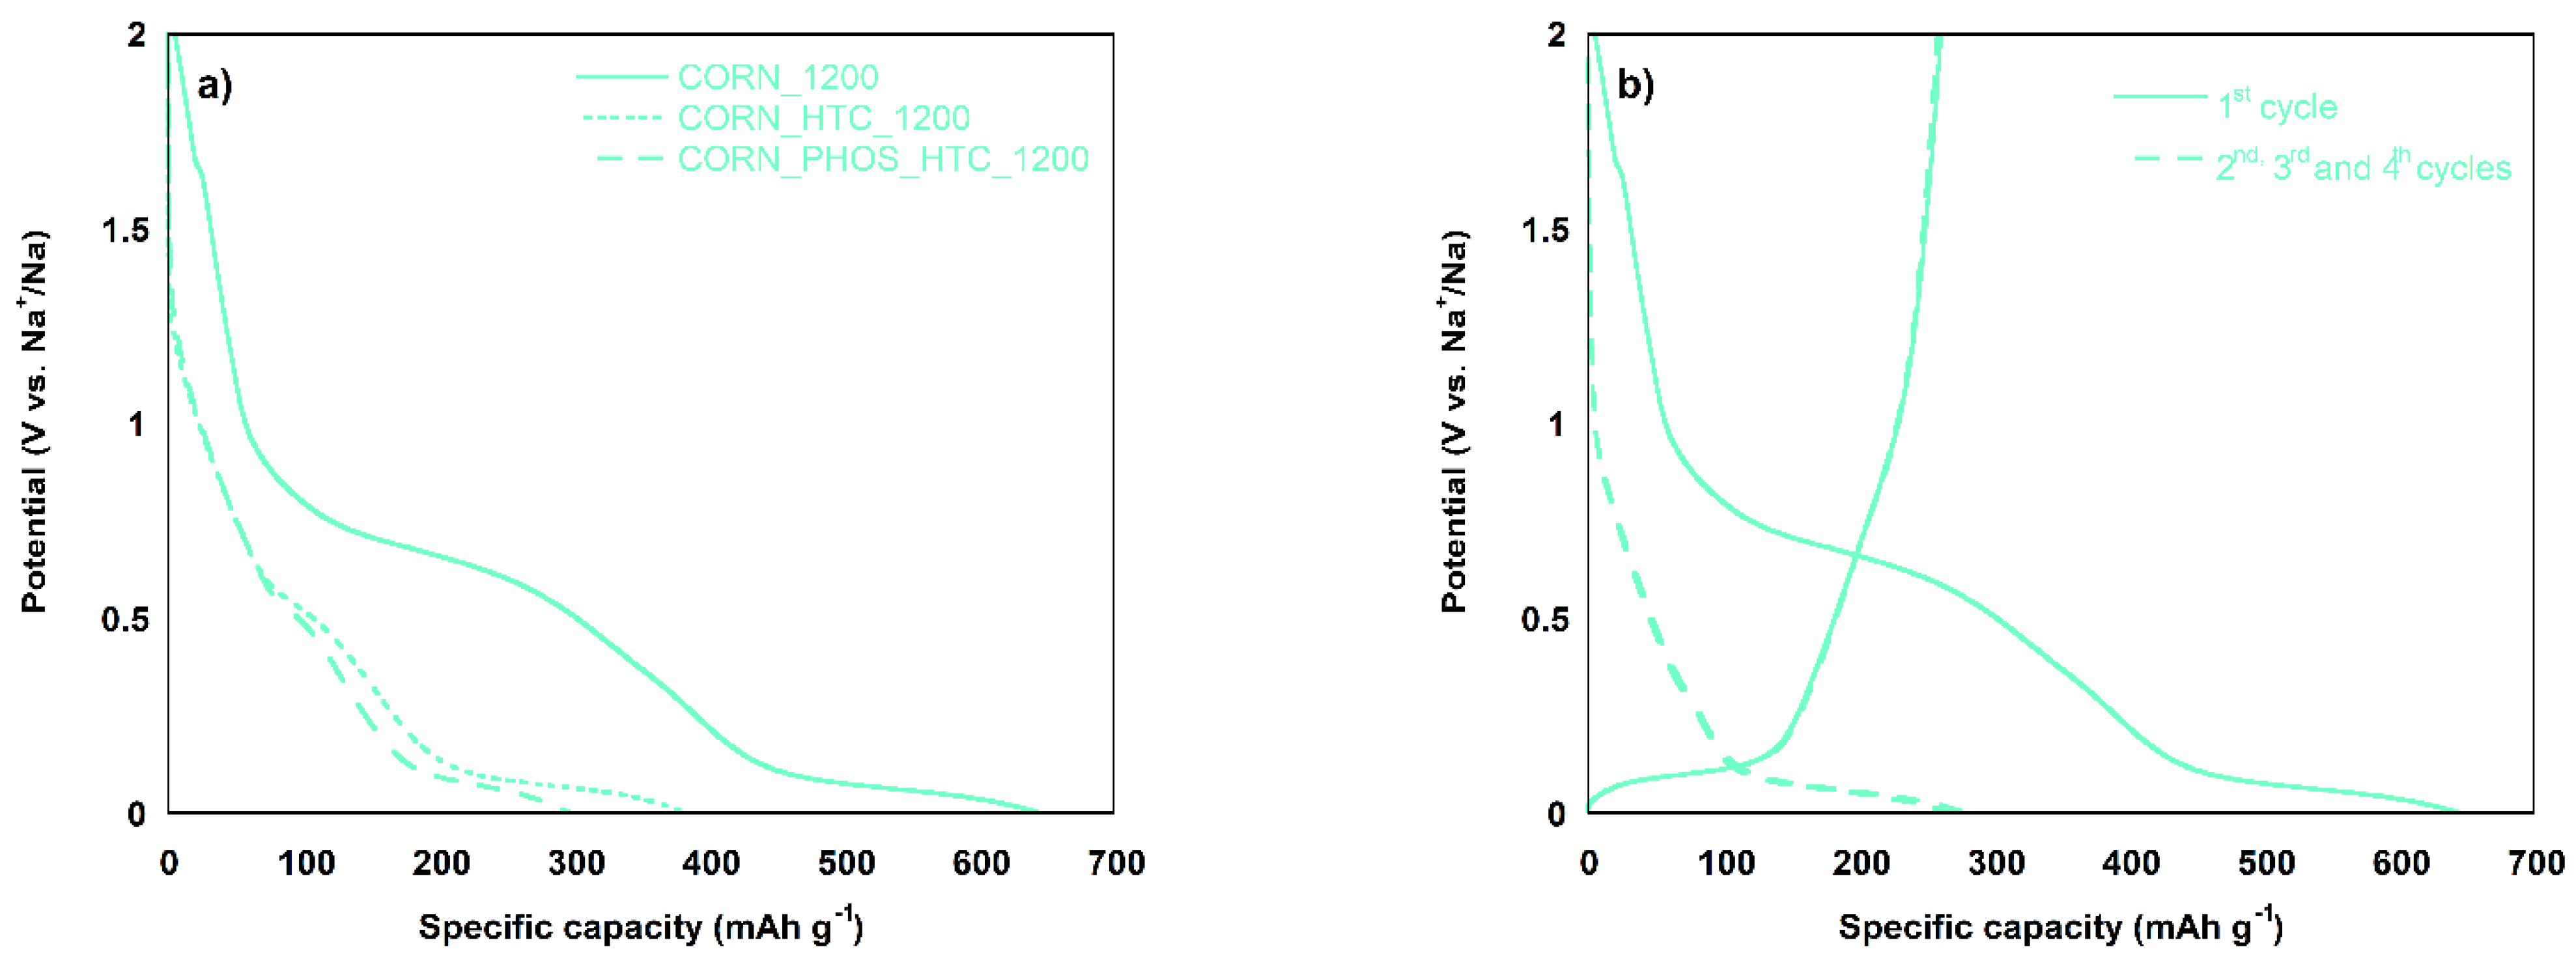
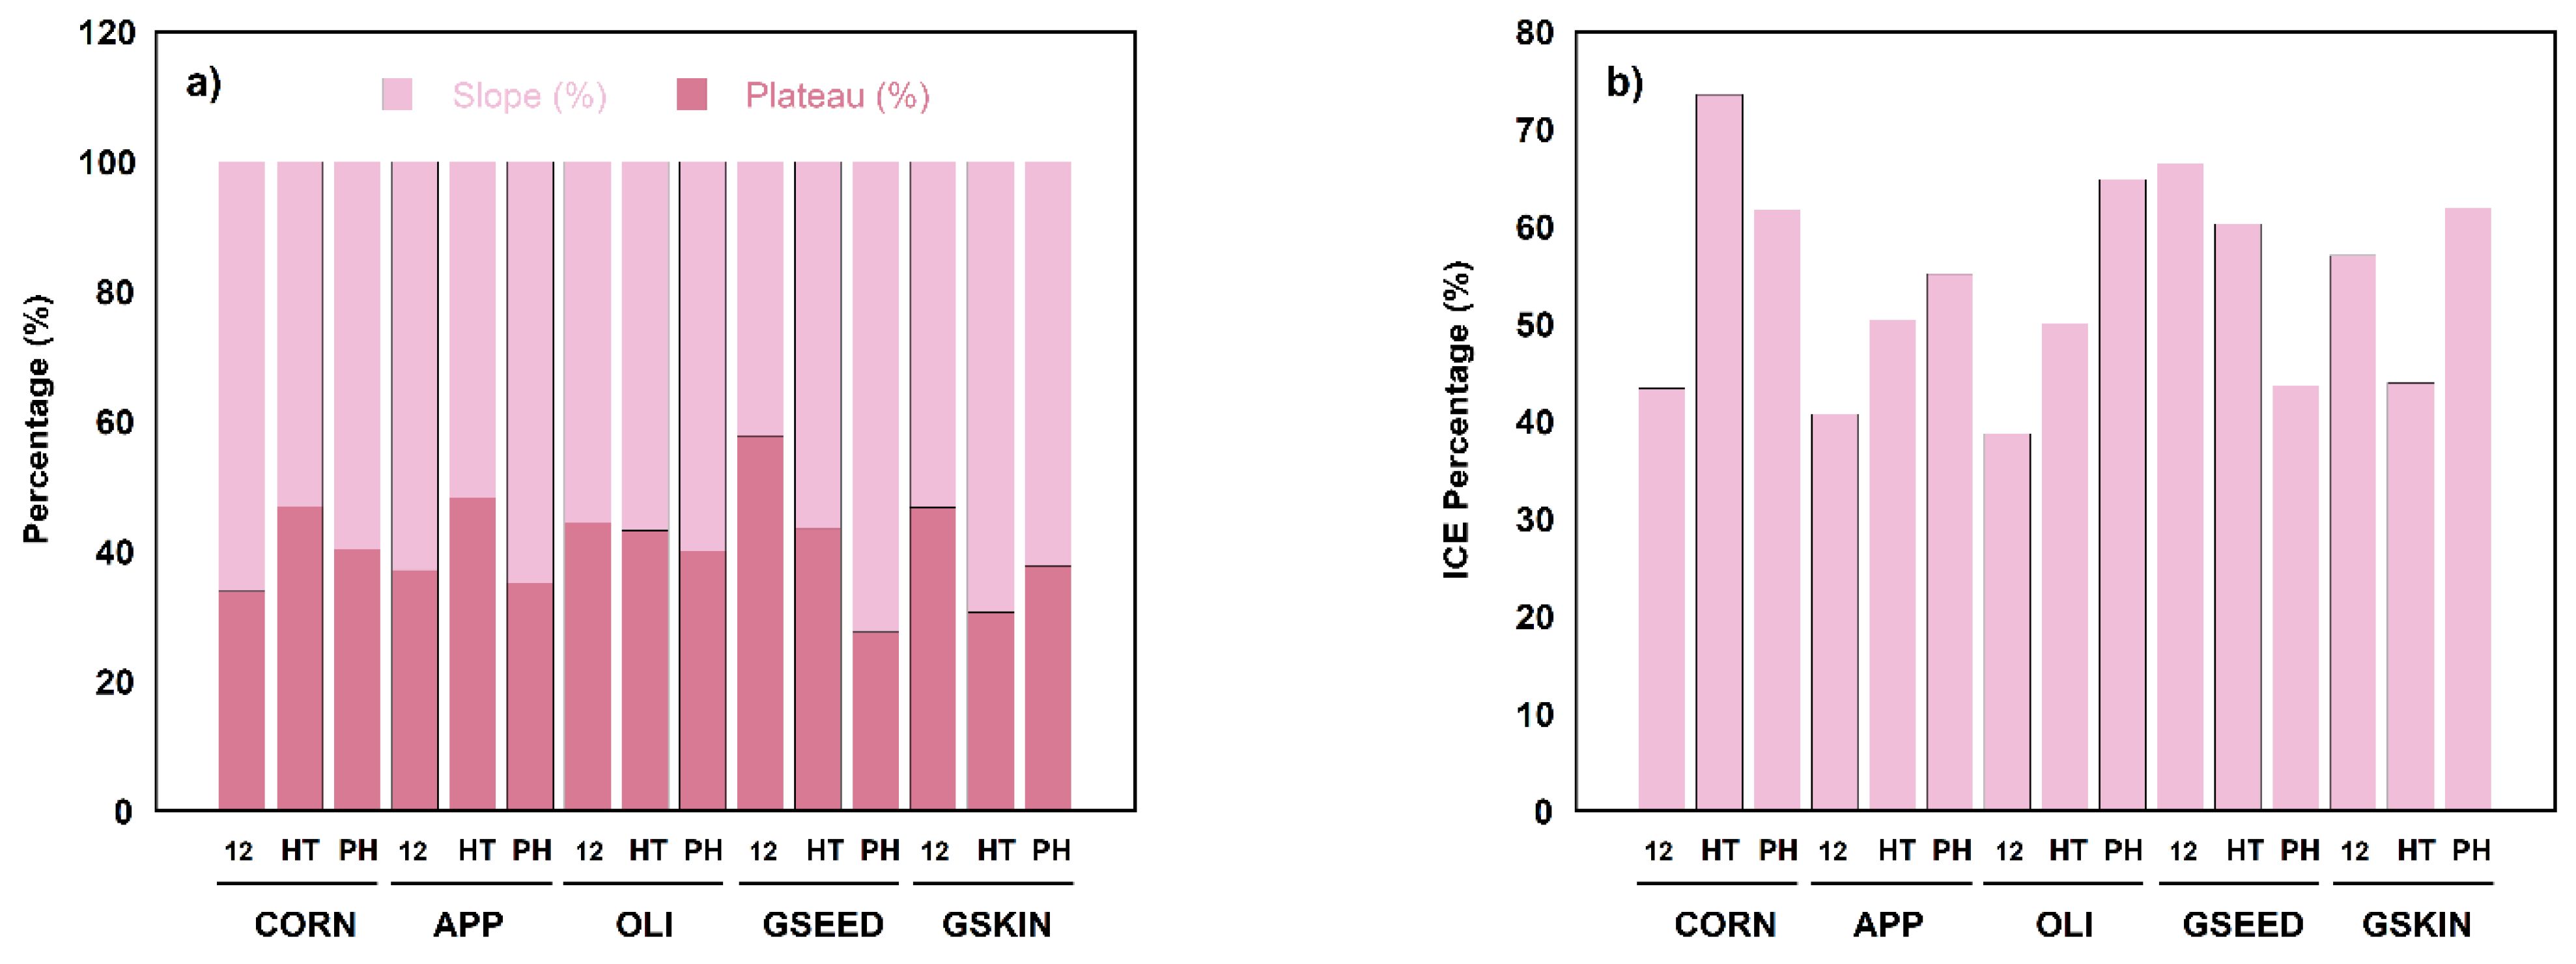
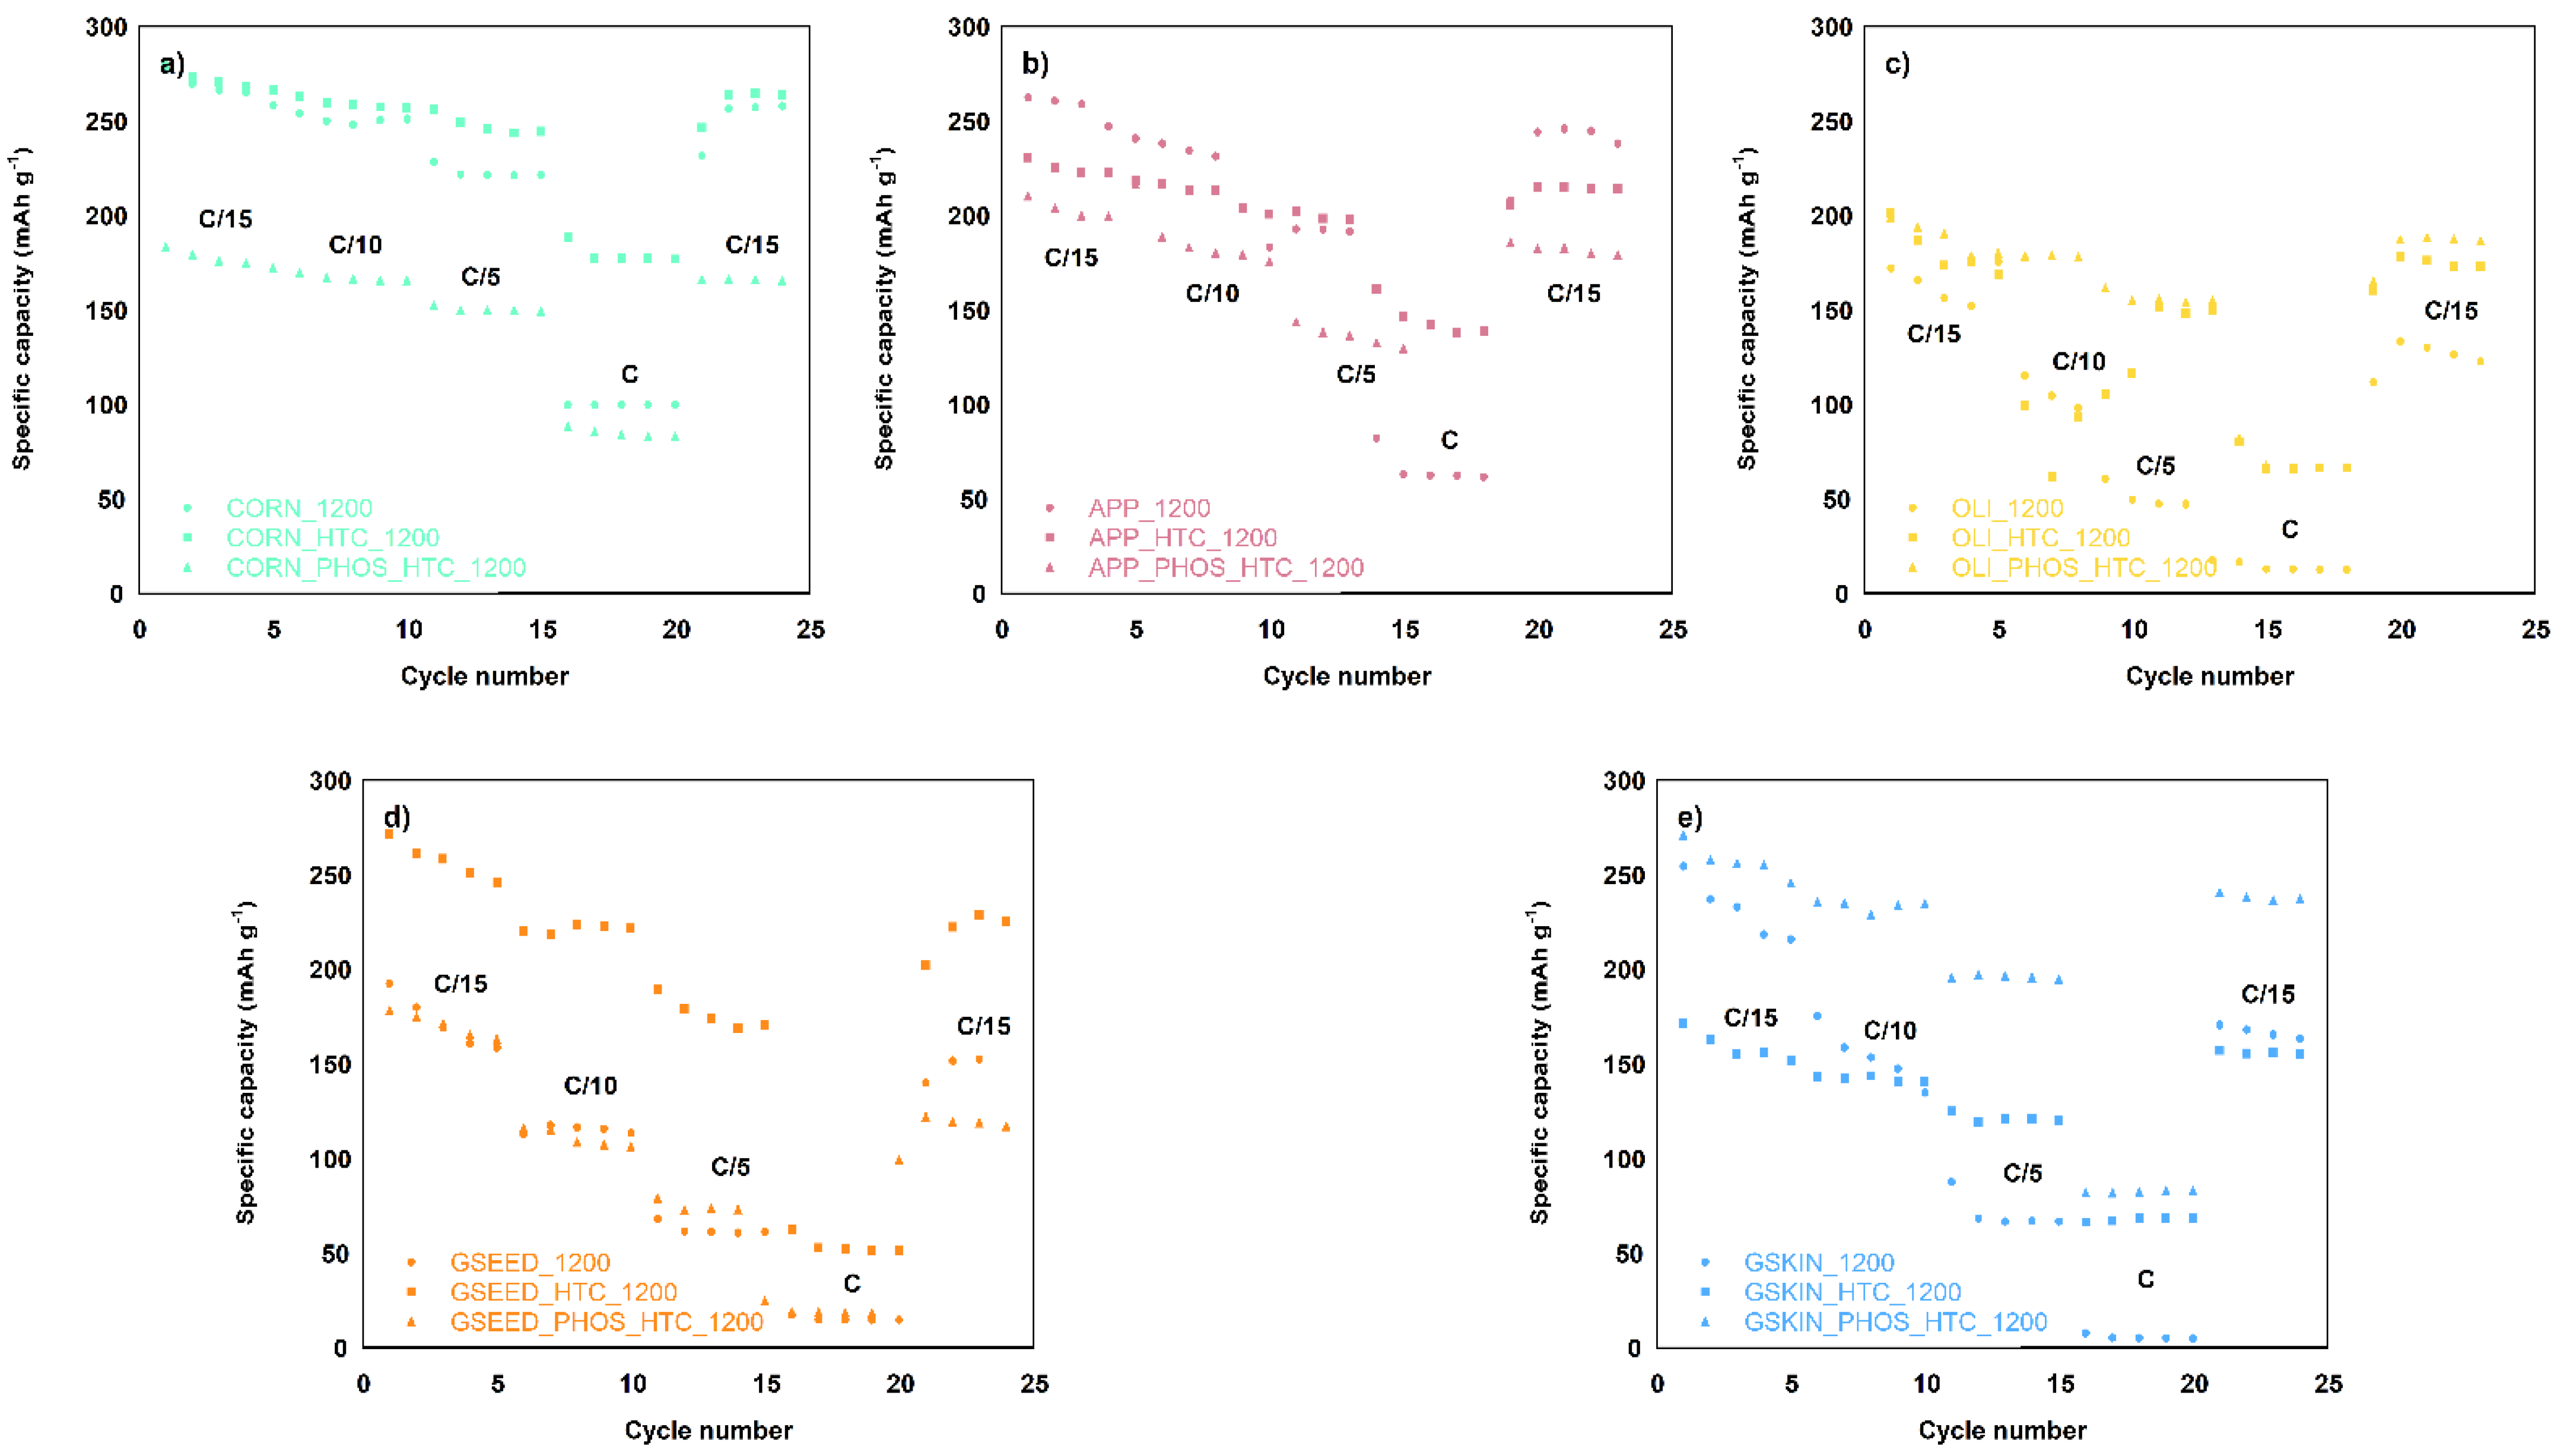
2.3. Electrochemical Tests
3. Materials and Methods
3.1. Biowaste
3.2. Characterization Techniques
3.3. Hard Carbon Production
3.4. Electrochemical Tests
4. Conclusions
Author Contributions
Funding
Informed Consent Statement
Data Availability Statement
Acknowledgments
Conflicts of Interest
References
- European Commission. Communication from the Commission: The European Green Deal. 2019. Available online: https://eur-lex.europa.eu/legal-content/EN/TXT/?qid=1596443911913&uri=CELEX:52019DC0640#document2 (accessed on 14 January 2021).
- Larcher, D.; Tarascon, J.M. Towards greener and more sustainable batteries for electrical energy storage. Nat. Chem. 2015, 7, 19–29. [Google Scholar] [CrossRef] [PubMed]
- Lu, M.; Huang, Y.; Chen, C. Cedarwood Bark-Derived Hard Carbon as an Anode for High-Performance Sodium-Ion Batteries. Energy Fuels 2020, 34, 11489–11497. [Google Scholar] [CrossRef]
- Wang, L.; Hu, J.; Yu, Y.; Huang, K.; Hu, Y. Lithium-air, lithium-sulfur, and sodium-ion, which secondary battery category is more environmentally friendly and promising based on footprint family indicators? J. Clean. Prod. 2020, 276, 124244. [Google Scholar] [CrossRef]
- Zhang, H.; Zhang, W.; Ming, H.; Pang, J.; Zhang, H.; Cao, G.; Yang, Y. Design advanced carbon materials from lignin-based interpenetrating polymer networks for high performance sodium-ion batteries. Chem. Eng. J. 2018, 341, 280–288. [Google Scholar] [CrossRef]
- Kim, J.H.; Jung, M.J.; Kim, M.J.; Lee, Y.S. Electrochemical performances of lithium and sodium ion batteries based on carbon materials. J. Ind. Eng. Chem. 2018, 61, 368–380. [Google Scholar] [CrossRef]
- Palomares, V.; Blas, M.; Serras, P.; Iturrondobeitia, A.; Peña, A.; Lopez-Urionabarrenechea, A.; Lezama, L.; Rojo, T. Waste Biomass as in Situ Carbon Source for Sodium Vanadium Fluorophosphate/C Cathodes for Na-Ion Batteries. ACS Sustain. Chem. Eng. 2018, 6, 16386–16398. [Google Scholar] [CrossRef]
- Wang, W.; Gang, Y.; Hu, Z.; Yan, Z.; Li, W.; Li, Y.; Gu, Q.F.; Wang, Z.; Chou, S.L.; Liu, H.K.; et al. Reversible structural evolution of sodium-rich rhombohedral Prussian blue for sodium-ion batteries. Nat. Commun. 2020, 11, 3572. [Google Scholar] [CrossRef] [Green Version]
- Li, H.; Xu, M.; Zhang, Z.; Lai, Y.; Ma, J. Engineering of Polyanion Type Cathode Materials for Sodium-Ion Batteries: Toward Higher Energy/Power Density. Adv. Funct. Mater. 2020, 30, 2000473. [Google Scholar] [CrossRef]
- Zhao, C.; Wang, Q.; Yao, Z.; Wang, J.; Sánchez-Lengeling, B.; Ding, F.; Qi, X.; Lu, Y.; Bai, X.; Li, B.; et al. Rational design of layered oxide materials for sodium-ion batteries. Science 2020, 370, 708–712. [Google Scholar] [CrossRef] [PubMed]
- Petrovičovà, B.; Ferrara, C.; Brugnetti, G.; Ritter, C.; Fracchia, M.; Ghigna, P.; Pollastri, S.; Triolo, C.; Spadaro, L.; Ruffo, R.; et al. Effect of germanium incorporation on the electrochemical performance of electrospun Fe2O3 nanofibers-based anodes in sodium-ion batteries. Appl. Sci. 2021, 11, 1483. [Google Scholar] [CrossRef]
- Gavrilin, I.M.; Kudryashova, Y.O.; Kulova, T.L.; Skundin, A.M.; Gavrilov, S.A. The effect of growth temperature on the process of insertion/extraction of sodium into germanium nanowires formed by electrodeposition using indium nanoparticles. Mater. Lett. 2021, 287, 129303. [Google Scholar] [CrossRef]
- Kulova, T.L.; Skundin, A.M. The Use of Phosphorus in Sodium-Ion Batteries—A Review. Russ. J. Electrochem. 2020, 56, 3–19. [Google Scholar] [CrossRef]
- Liu, Y.; Liu, Q.; Jian, C.; Cui, D.; Chen, M.; Li, Z.; Li, T.; Nilges, T.; He, K.; Jia, Z.; et al. Red-phosphorus-impregnated carbon nanofibers for sodium-ion batteries and liquefaction of red phosphorus. Nat. Commun. 2020, 11, 2520. [Google Scholar] [CrossRef]
- Opra, D.P.; Gnedenkov, S.V.; Sinebryukhov, S.L.; Gerasimenko, A.V.; Ziatdinov, A.M.; Sokolov, A.A.; Podgorbunsky, A.B.; Ustinov, A.Y.; Kuryavyi, V.G.; Mayorov, V.Y.; et al. Enhancing lithium and sodium storage properties of tio2(B) nanobelts by doping with nickel and zinc. Nanomaterials 2021, 11, 1703. [Google Scholar] [CrossRef] [PubMed]
- Wang, W.; Liu, Y.; Wu, X.; Wang, J.; Fu, L.; Zhu, Y.; Wu, Y.; Liu, X. Advances of TiO2 as Negative Electrode Materials for Sodium-Ion Batteries. Adv. Mater. Technol. 2018, 3, 1800004. [Google Scholar] [CrossRef]
- Wang, H.; Yu, W.; Shi, J.; Mao, N.; Chen, S.; Liu, W. Biomass derived hierarchical porous carbons as high-performance anodes for sodium-ion batteries. Electrochim. Acta 2016, 188, 103–110. [Google Scholar] [CrossRef]
- Zhao, L.F.; Hu, Z.; Lai, W.H.; Tao, Y.; Peng, J.; Miao, Z.C.; Wang, Y.X.; Chou, S.L.; Liu, H.K.; Dou, S.X. Hard Carbon Anodes: Fundamental Understanding and Commercial Perspectives for Na-Ion Batteries beyond Li-Ion and K-Ion Counterparts. Adv. Energy Mater. 2021, 11, 2002704. [Google Scholar] [CrossRef]
- Hasa, I.; Dou, X.; Buchholz, D.; Shao-Horn, Y.; Hassoun, J.; Passerini, S.; Scrosati, B. A sodium-ion battery exploiting layered oxide cathode, graphite anode and glyme-based electrolyte. J. Power Sources 2016, 310, 26–31. [Google Scholar] [CrossRef]
- Lee, M.E.; Lee, S.M.; Choi, J.; Jang, D.; Lee, S.; Jin, H.J.; Yun, Y.S. Electrolyte-Dependent Sodium Ion Transport Behaviors in Hard Carbon Anode. Small 2020, 16, 2001053. [Google Scholar] [CrossRef] [PubMed]
- Pei, L.; Cao, H.; Yang, L.; Liu, P.; Zhao, M.; Xu, B.; Guo, J. Hard carbon derived from waste tea biomass as high-performance anode material for sodium-ion batteries. Ionics 2020, 26, 5535–5542. [Google Scholar] [CrossRef]
- Jin, Q.; Wang, K.; Li, H.; Li, W.; Feng, P.; Zhang, Z.; Wang, W.; Zhou, M.; Jiang, K. Tuning microstructures of hard carbon for high capacity and rate sodium storage. Chem. Eng. J. 2021, 417, 128104. [Google Scholar] [CrossRef]
- Saavedra Rios, C.D.M.; Simonin, L.; De Geyer, A.; Ghimbeu, C.M.; Dupont, C. Unraveling the properties of biomass-derived hard carbons upon thermal treatment for a practical application in Na-ion batteries. Energies 2020, 13, 3513. [Google Scholar] [CrossRef]
- Alvin, S.; Chandra, C.; Kim, J. Extended plateau capacity of phosphorus-doped hard carbon used as an anode in Na- and K-ion batteries. Chem. Eng. J. 2020, 391, 123576. [Google Scholar] [CrossRef]
- Kubota, K.; Shimadzu, S.; Yabuuchi, N.; Tominaka, S.; Shiraishi, S.; Abreu-Sepulveda, M.; Manivannan, A.; Gotoh, K.; Fukunishi, M.; Dahbi, M.; et al. Structural Analysis of Sucrose-Derived Hard Carbon and Correlation with the Electrochemical Properties for Lithium, Sodium, and Potassium Insertion. Chem. Mater. 2020, 32, 2961–2977. [Google Scholar] [CrossRef]
- Bobyleva, Z.V.; Drozhzhin, O.A.; Dosaev, K.A.; Kamiyama, A.; Ryazantsev, S.V.; Komaba, S.; Antipov, E.V. Unveiling pseudocapacitive behavior of hard carbon anode materials for sodium-ion batteries. Electrochim. Acta 2020, 354, 136647. [Google Scholar] [CrossRef]
- Alvin, S.; Chandra, C.; Kim, J. Controlling intercalation sites of hard carbon for enhancing Na and K storage performance. Chem. Eng. J. 2021, 411, 128490. [Google Scholar] [CrossRef]
- Matei Ghimbeu, C.; Zhang, B.; Martinez de Yuso, A.; Réty, B.; Tarascon, J.M. Valorizing low cost and renewable lignin as hard carbon for Na-ion batteries: Impact of lignin grade. Carbon 2019, 153, 634–647. [Google Scholar] [CrossRef]
- Saha, A.; Sharabani, T.; Evenstein, E.; Nessim, G.D.; Noked, M.; Sharma, R. Probing Electrochemical Behaviour of Lignocellulosic, Orange Peel Derived Hard Carbon as Anode for Sodium Ion Battery. J. Electrochem. Soc. 2020, 167, 090505. [Google Scholar] [CrossRef]
- Arie, A.A.; Tekin, B.; Demir, E.; Demir-Cakan, R. Hard carbons derived from waste tea bag powder as anodes for sodium ion battery. Mater. Technol. 2019, 34, 515–524. [Google Scholar] [CrossRef]
- Xu, Z.; Huang, Y.; Ding, L.; Huang, J.; Gao, H.; Li, T. Highly Stable Basswood Porous Carbon Anode Activated by Phosphoric Acid for a Sodium Ion Battery. Energy Fuels 2020, 34, 11565–11573. [Google Scholar] [CrossRef]
- Wu, F.; Zhang, M.; Bai, Y.; Wang, X.; Dong, R.; Wu, C. Lotus Seedpod-Derived Hard Carbon with Hierarchical Porous Structure as Stable Anode for Sodium-Ion Batteries. ACS Appl. Mater. Interfaces 2019, 11, 12554–12561. [Google Scholar] [CrossRef]
- Arie, A.A.; Kristianto, H.; Muljana, H.; Stievano, L. Rambutan peel based hard carbons as anode materials for sodium ion battery. Fuller. Nanotub. Carbon Nanostruct. 2019, 27, 953–960. [Google Scholar] [CrossRef]
- Lima, C.S.S.; Conceição, M.M.; Silva, F.L.H.; Lima, E.E.; Conrado, L.S.; Leão, D.A.S. Characterization of acid hydrolysis of sisal. Appl. Energy 2013, 102, 254–259. [Google Scholar] [CrossRef]
- Chen, W.H.; Ye, S.C.; Sheen, H.K. Hydrolysis characteristics of sugarcane bagasse pretreated by dilute acid solution in a microwave irradiation environment. Appl. Energy 2012, 93, 237–244. [Google Scholar] [CrossRef]
- Hao, W.; Björkman, E.; Lilliestråle, M.; Hedin, N. Activated carbons prepared from hydrothermally carbonized waste biomass used as adsorbents for CO2. Appl. Energy 2013, 112, 526–532. [Google Scholar] [CrossRef]
- Wang, G.; Zhang, J.; Lee, J.Y.; Mao, X.; Ye, L.; Xu, W.; Ning, X.; Zhang, N.; Teng, H.; Wang, C. Hydrothermal carbonization of maize straw for hydrochar production and its injection for blast furnace. Appl. Energy 2020, 266, 114818. [Google Scholar] [CrossRef]
- Heilmann, S.M.; Jader, L.R.; Harned, L.A.; Sadowsky, M.J.; Schendel, F.J.; Lefebvre, P.A.; von Keitz, M.G.; Valentas, K.J. Hydrothermal carbonization of microalgae II. Fatty acid, char, and algal nutrient products. Appl. Energy 2011, 88, 3286–3290. [Google Scholar] [CrossRef]
- Bhaskar, T.; Pandey, A.; Mohan, S.V.; Lee, D.-J.; Khanal, S.K. Waste Biorefinery: Potential and Perspectives; Elsevier B.V.: Amsterdam, The Netherlands, 2018; pp. 129–156. [Google Scholar]
- Torres, M.D.; Kraan, S.; Dominguez, H. Sustainable Seaweed Technologies: Cultivation, Biorefinery and Applications; Elsevier Inc.: Amsterdam, The Netherlands, 2020; pp. 191–205. [Google Scholar]
- Górka, J.; Vix-Guterl, C.; Matei Ghimbeu, C. Recent Progress in Design of Biomass-Derived Hard Carbons for Sodium Ion Batteries. J. Carbon Res. 2016, 2, 24. [Google Scholar] [CrossRef] [Green Version]
- Shen, J.; Zhu, S.; Liu, X.; Zhang, H.; Tan, J. The prediction of elemental composition of biomass based on proximate analysis. Energy Convers. Manag. 2010, 51, 983–987. [Google Scholar] [CrossRef]
- Dou, X.; Hasa, I.; Saurel, D.; Vaalma, C.; Wu, L.; Buchholz, D.; Bresser, D.; Komaba, S.; Passerini, S. Hard carbons for sodium-ion batteries: Structure, analysis, sustainability, and electrochemistry. Mater. Today 2019, 23, 87–104. [Google Scholar] [CrossRef]
- Joint Committee on Powder Diffraction Standards (JCPDS) International Centre for Diffraction Data (ICDD). International Centre for Diffraction Data (ICDD). 2021. Available online: https://www.icdd.com/pdfsearch/ (accessed on 20 April 2021).
- Clemente, J.S.; Beauchemin, S.; Thibault, Y.; Mackinnon, T.; Smith, D. Differentiating Inorganics in Biochars Produced at Commercial Scale Using Principal Component Analysis. ACS Omega 2018, 3, 6931–6944. [Google Scholar] [CrossRef] [PubMed]
- Deraman, M.; Sazali, N.E.S.; Hanappi, M.F.Y.M.; Tajuddin, N.S.M.; Hamdan, E.; Suleman, M.; Othman, M.A.R.; Omar, R.; Hashim, M.A.; Basri, N.H.; et al. Graphene/semicrystalline-carbon derived from amylose films for supercapacitor application. J. Phys. Conf. Ser. 2016, 739, 12085. [Google Scholar] [CrossRef] [Green Version]
- Ross, J.R.H. Catalyst Characterization. In Contemporary Catalysis; The Royal Society of Chemistry: London, UK, 2019; pp. 121–132. ISBN 9780444634740. [Google Scholar]
- Yang, L.; Hu, M.; Zhang, H.; Yang, W.; Lv, R. Pore structure regulation of hard carbon: Towards fast and high-capacity sodium-ion storage. J. Colloid Interface Sci. 2020, 566, 257–264. [Google Scholar] [CrossRef]
- Sánchez-Fontecoba, P. Advanced Anode Materials for Sodium Ion Batteries. University of the Basque Country (UPV/EHU). 2017. Available online: https://addi.ehu.es/handle/10810/24246?locale-attribute=en (accessed on 20 May 2021).
- Xiao, B.; Rojo, T.; Li, X. Hard Carbon as Sodium-Ion Battery Anodes: Progress and Challenges. ChemSusChem 2019, 12, 133–144. [Google Scholar] [CrossRef]
- He, H.; Sun, D.; Tang, Y.; Wang, H.; Shao, M. Understanding and improving the initial Coulombic efficiency of high-capacity anode materials for practical sodium ion batteries. Energy Storage Mater. 2019, 23, 233–251. [Google Scholar] [CrossRef]
- Carboni, M.; Manzi, J.; Armstrong, A.R.; Billaud, J.; Brutti, S.; Younesi, R. Analysis of the Solid Electrolyte Interphase on Hard Carbon Electrodes in Sodium-Ion Batteries. ChemElectroChem 2019, 6, 1745–1753. [Google Scholar] [CrossRef] [Green Version]
- Zhu, Z.; Zeng, X.; Wu, H.; Wang, Y.; Cheng, H.; Dong, P.; Li, X.; Zhang, Y.; Liu, H. Green energy application technology of litchi pericarp-derived carbon material with high performance. J. Clean. Prod. 2021, 286, 124960. [Google Scholar] [CrossRef]
- Cong, L.; Tian, G.; Luo, D.; Ren, X.; Xiang, X. Hydrothermally assisted transformation of corn stalk wastes into high-performance hard carbon anode for sodium-ion batteries. J. Electroanal. Chem. 2020, 871, 114249. [Google Scholar] [CrossRef]
- Kamiyama, A.; Kubota, K.; Igarashi, D.; Youn, Y.; Tateyama, Y.; Ando, H.; Gotoh, K.; Komaba, S. MgO-Template Synthesis of Extremely High Capacity Hard Carbon for Na-Ion Battery. Angew. Chem. Int. Ed. 2020, 5120, 5114–5120. [Google Scholar] [CrossRef]
- Wang, Y.; Feng, Z.; Zhu, W.; Gariépy, V.; Gagnon, C.; Provencher, M.; Laul, D.; Veillette, R.; Trudeau, M.L.; Guerfi, A.; et al. High capacity and high efficiency maple tree-biomass-derived hard carbon as an anode material for sodium-ion batteries. Materials 2018, 11, 1294. [Google Scholar] [CrossRef] [Green Version]
- Dahbi, M.; Kiso, M.; Kubota, K.; Horiba, T.; Chafik, T.; Hida, K.; Matsuyama, T.; Komaba, S. Synthesis of hard carbon from argan shells for Na-ion batteries. J. Mater. Chem. A 2017, 5, 9917–9928. [Google Scholar] [CrossRef]
- Rath, P.C.; Patra, J.; Huang, H.T.; Bresser, D.; Wu, T.Y.; Chang, J.K. Carbonaceous Anodes Derived from Sugarcane Bagasse for Sodium-Ion Batteries. ChemSusChem 2019, 12, 2302–2309. [Google Scholar] [CrossRef] [PubMed]
- Li, X.; Zeng, X.; Ren, T.; Zhao, J.; Zhu, Z.; Sun, S.; Zhang, Y. The transport properties of sodium-ion in the low potential platform region of oatmeal-derived hard carbon for sodium-ion batteries. J. Alloys Compd. 2019, 787, 229–238. [Google Scholar] [CrossRef]
- Caballero, B.M.; López-Urionabarrenechea, A.; Pérez, B.; Solar, J.; Acha, E.; de Marco, I. Potentiality of “orujillo” (olive oil solid waste) to produce hydrogen by means of pyrolysis. Int. J. Hydrogen Energy 2020, 5, 20549–20557. [Google Scholar] [CrossRef]
- Dávila, I.; Gullón, P.; Labidi, J. Influence of the heating mechanism during the aqueous processing of vine shoots for the obtaining of hemicellulosic oligosaccharides. Waste Manag. 2021, 120, 146–155. [Google Scholar] [CrossRef]
- Ministerio de Agricultura Pesca y Alimentación. Superficie y Producción de Cereales en España. 2018. Available online: https://www.mapa.gob.es/es/agricultura/temas/producciones-agricolas/cultivos-herbaceos/cereales/default.aspx (accessed on 20 May 2021).
- Miranda, M.T.; Sepúlveda, F.J.; Arranz, J.I.; Montero, I.; Rojas, C.V. Analysis of pelletizing from corn cob waste. J. Environ. Manag. 2018, 228, 303–311. [Google Scholar] [CrossRef]
- Calvete-Torre, I.; Muñoz-Almagro, N.; Pacheco, M.T.; Antón, M.J.; Dapena, E.; Ruiz, L.; Margolles, A.; Villamiel, M.; Moreno, F.J. Apple pomaces derived from mono-varietal Asturian ciders production are potential source of pectins with appealing functional properties. Carbohydr. Polym. 2021, 264, 117980. [Google Scholar] [CrossRef]


| Corn Cob | Apple Pomace | Olive Mill Solid Waste | Deffated Grape Seed | Dry Grape Skin | ||
|---|---|---|---|---|---|---|
| Proximate analysis 1 | Moisture | 8.70 | 5.80 | 6.70 | 13.90 | 8.30 |
| Volatiles | 72.70 | 73.90 | 68.40 | 59.00 | 64.30 | |
| Fixed carbon3 | 16.80 | 18.30 | 16.10 | 24.60 | 23.30 | |
| Ashes | 1.80 | 2.00 | 8.80 | 2.50 | 4.10 | |
| Elemental analysis 1 | Carbon | 43.50 | 41.70 | 44.10 | 47.40 | 48.60 |
| Hydrogen | 7.00 | 7.80 | 6.30 | 6.70 | 7.00 | |
| Nitrogen | 0.40 | 0.60 | 1.60 | 1.90 | 3.00 | |
| Sulfur | 0.20 | 0.20 | 0.20 | 0.20 | 0.20 | |
| Oxygen | 42.80 | 48.10 | 35.80 | 38.50 | 33.20 | |
| Others3 | 6.10 | 1.60 | 12.00 | 5.30 | 8.00 | |
| Constituent analysis 2 | Extractives | 9.60 | 44.30 | 37.60 | 9.70 | 16.80 |
| Glucans | 33.20 | 15.50 | 9.50 | 4.50 | 13.10 | |
| Xylans | 27.60 | 6.60 | 11.90 | 10.50 | 6.20 | |
| Arabinans | 2.00 | 4.20 | 0.90 | 0.30 | 0.50 | |
| Lignin | 11.50 | 10.30 | 26.40 | 56.50 | 45.20 | |
| Others3 | 16.10 | 19.10 | 13.70 | 18.50 | 18.20 | |
| Samples | Carbon | Hydrogen | Nitrogen | |
|---|---|---|---|---|
| CORN | 1200 | 80.08 | 0.45 | 1.56 |
| HTC_1200 | 89.31 | 0.25 | 2.68 | |
| PHOS_HTC_1200 | 51.69 | 0.27 | 1.60 | |
| OLI | 1200 | 70.68 | 0.83 | 1.59 |
| HTC_1200 | 70.76 | 0.39 | 2.27 | |
| PHOS_HTC_1200 | 49.94 | 0.13 | 1.46 | |
| Samples | d002 (Å) | La (Å) | Lc (Å) | N | AD/AG 01 | AD/AG 02 | |
|---|---|---|---|---|---|---|---|
| CORN | 1200 | 3.98 | 38.50 | 10.61 | 2.67 | 2.25 | 2.29 |
| HTC_1200 | 3.80 | 38.47 | 9.53 | 2.51 | 2.66 | 1.52 | |
| PHOS_HTC_1200 | 3.92 | 36.39 | 8.91 | 2.27 | 1.58 | 1.89 | |
| APP | 1200 | 3.90 | 37.06 | 9.38 | 2.41 | 1.91 | 1.32 |
| HTC_1200 | 3.87 | 37.37 | 10.23 | 2.64 | 2.11 | 0.87 | |
| PHOS_HTC_1200 | 3.93 | 36.81 | 9.42 | 2.40 | 1.85 | 1.77 | |
| OLI | 1200 | 3.81 | 40.52 | 8.23 | 2.16 | 1.70 | 0.61 |
| HTC_1200 | 3.75 | 35.84 | 8.63 | 2.30 | 1.90 | 1.71 | |
| PHOS_HTC_1200 | 3.89 | 45.88 | 9.41 | 2.42 | 1.91 | --- | |
| GSEED | 1200 | 3.92 | 39.89 | 10.01 | 2.56 | 1.19 | 1.16 |
| HTC_1200 | 3.85 | 39.04 | 9.97 | 2.59 | 1.80 | --- | |
| PHOS_HTC_1200 | 3.85 | 41.80 | 10.03 | 2.61 | 2.71 | 2.00 | |
| GSKIN | 1200 | 3.86 | 35.53 | 9.51 | 2.46 | 2.30 | --- |
| HTC_1200 | 3.50 | 45.61 | 35.67 | 10.18 | 1.84 | 1.77 | |
| PHOS_HTC_1200 | 3.88 | 35.10 | 9.46 | 2.44 | 2.91 | 2.98 | |
| Samples | Initial Discharge Capacity (mAh·g−1) | Specific Capacity (mAh·g−1) | Initial Coulombic Efficiency (%) | |
|---|---|---|---|---|
| CORN | 1200 | 644.48 | 265.17 | 43.39 |
| HTC_1200 | 378.96 | 268.54 | 73.49 | |
| PHOS_HTC_1200 | 297.09 | 169.66 | 61.69 | |
| APP | 1200 | 644.64 | 247.19 | 40.73 |
| HTC_1200 | 457.76 | 222.47 | 50.41 | |
| PHOS_HTC_1200 | 381.57 | 196.63 | 55.11 | |
| OLI | 1200 | 444.09 | 149.44 | 38.75 |
| HTC_1200 | 468.09 | 174.16 | 50.00 | |
| PHOS_HTC_1200 | 320.86 | 182.90 | 64.81 | |
| GSEED | 1200 | 289.59 | 158.42 | 66.47 |
| HTC_1200 | 450.76 | 244.94 | 60.25 | |
| PHOS_HTC_1200 | 437.63 | 162.92 | 43.65 | |
| GSKIN | 1200 | 446.47 | 215.73 | 57.03 |
| HTC_1200 | 385.61 | 149.44 | 43.96 | |
| PHOS_HTC_1200 | 437.84 | 243.82 | 61.89 | |
| Electrochemical Performance (mAh·g−1) | Initial Coulombic Efficiency (%) | References | |
|---|---|---|---|
| Waste tea bag | 282.40 (30.00 mA·g−1) | 69.00 | [30] |
| Maple tree | 332.00 (30.00 mA·g−1) | 88.30 | [56] |
| Argan shell | 286.00 (25.00 mA·g−1) | 76.90 | [57] |
| Sugarcane bagasse | 290.00 (30.00 mA·g−1) | 70.00 | [58] |
| Oatmeal | 272.40 (20.00 mA·g−1) | 46.64 | [59] |
| Corn cob | 268.54 (24.80 mA·g−1) | 73.49 | This work |
| Grape skin | 243.82 (24.80 mA·g−1) | 61.89 | This work |
| Grape seed | 244.94 (24.80 mA·g−1) | 60.25 | This work |
| Apple pomace | 247.19 (24.80 mA·g−1) | 40.73 | This work |
Publisher’s Note: MDPI stays neutral with regard to jurisdictional claims in published maps and institutional affiliations. |
© 2022 by the authors. Licensee MDPI, Basel, Switzerland. This article is an open access article distributed under the terms and conditions of the Creative Commons Attribution (CC BY) license (https://creativecommons.org/licenses/by/4.0/).
Share and Cite
Nieto, N.; Noya, O.; Iturrondobeitia, A.; Sanchez-Fontecoba, P.; Pérez-López, U.; Palomares, V.; Lopez-Urionabarrenechea, A.; Rojo, T. On the Road to Sustainable Energy Storage Technologies: Synthesis of Anodes for Na-Ion Batteries from Biowaste. Batteries 2022, 8, 28. https://doi.org/10.3390/batteries8040028
Nieto N, Noya O, Iturrondobeitia A, Sanchez-Fontecoba P, Pérez-López U, Palomares V, Lopez-Urionabarrenechea A, Rojo T. On the Road to Sustainable Energy Storage Technologies: Synthesis of Anodes for Na-Ion Batteries from Biowaste. Batteries. 2022; 8(4):28. https://doi.org/10.3390/batteries8040028
Chicago/Turabian StyleNieto, Nekane, Olatz Noya, Amaia Iturrondobeitia, Paula Sanchez-Fontecoba, Usue Pérez-López, Verónica Palomares, Alexander Lopez-Urionabarrenechea, and Teófilo Rojo. 2022. "On the Road to Sustainable Energy Storage Technologies: Synthesis of Anodes for Na-Ion Batteries from Biowaste" Batteries 8, no. 4: 28. https://doi.org/10.3390/batteries8040028