
Analyzing Political Polarization on Social Media by Deleting Bot Spamming


Department of Informatics, Modeling, Electronics and Systems Engineering, University of Calabria, 87036 Rende, Italy
*
Author to whom correspondence should be addressed.
Big Data Cogn. Comput. 2022, 6(1), 3; https://doi.org/10.3390/bdcc6010003
Submission received: 15 November 2021
/
Revised: 15 December 2021
/
Accepted: 25 December 2021
/
Published: 4 January 2022
(This article belongs to the Special Issue Big Data and Cognitive Computing: 5th Anniversary Feature Papers)
Abstract
:Social media platforms are part of everyday life, allowing the interconnection of people around the world in large discussion groups relating to every topic, including important social or political issues. Therefore, social media have become a valuable source of information-rich data, commonly referred to as Social Big Data, effectively exploitable to study the behavior of people, their opinions, moods, interests and activities. However, these powerful communication platforms can be also used to manipulate conversation, polluting online content and altering the popularity of users, through spamming activities and misinformation spreading. Recent studies have shown the use on social media of automatic entities, defined as social bots, that appear as legitimate users by imitating human behavior aimed at influencing discussions of any kind, including political issues. In this paper we present a new methodology, namely TIMBRE (Time-aware opInion Mining via Bot REmoval), aimed at discovering the polarity of social media users during election campaigns characterized by the rivalry of political factions. This methodology is temporally aware and relies on a keyword-based classification of posts and users. Moreover, it recognizes and filters out data produced by social media bots, which aim to alter public opinion about political candidates, thus avoiding heavily biased information. The proposed methodology has been applied to a case study that analyzes the polarization of a large number of Twitter users during the 2016 US presidential election. The achieved results show the benefits brought by both removing bots and taking into account temporal aspects in the forecasting process, revealing the high accuracy and effectiveness of the proposed approach. Finally, we investigated how the presence of social bots may affect political discussion by studying the 2016 US presidential election. Specifically, we analyzed the main differences between human and artificial political support, estimating also the influence of social bots on legitimate users.
1. Introduction
The last few years have been characterized by a marked growth in the use of social media, leading to the production of huge amounts of digital data effectively exploitable to investigate human dynamics and behaviors. Such data, commonly referred as Social Big Data, contain valuable information about people that makes them intrinsically suited to a very large set of application fields [1], such as regions-of-interest and user trajectory extraction [2], influence maximization [3], sentiment analysis and emotional profiling [4,5], topic detection and opinion mining [6,7]. However, the quality of data extracted from social media can be lowered by the presence of fake news that can hinder this type of analysis, leading to misleading results.
This paper focuses on the use of social media data, in particular those coming from Twitter, to estimate the polarization of public opinion concerning a political event characterized by the rivalry of different factions or parties. In particular, we propose a new methodology, called TIMBRE (Time-aware opInion Mining via Bot REmoval) that exploits a keyword-based classification to determine the political polarization of social media posts. The proposed methodology is temporally aware, as it takes into account time-related aspects in computing the importance weight of each classified post. This weight represents the relevance of that post on the voting intentions of the user who published it. Finally, the political orientation of a user is obtained starting from his/her published posts, according to their polarization and weight.
Depending on the political event, social media users can be classified towards a particular faction, candidate, or choice. However, in this kind of application, the results could be biased and distorted by many factors, including data artificially produced by social media bots. They consist of software applications used to automatically generate messages on social media so as to influence public opinion, spam messages or amplify propaganda. Bots can act as fake accounts (e.g., for posting messages and gaining followers itself) or as followers of other social media users. It is estimated that 9–15% of Twitter accounts may be social bots. Due to this, a key aspect of TIMBRE is the bot removal step, aimed at avoiding the distortion effect introduced by the presence of bot-generated data. In this way the methodology is able to grasp the real voting intentions on social media platforms, capturing only the polarization of legitimate users who belong to the voting eligible population.
To test the proposed methodology we applied it to a real-world case study that analyzes the polarization of a large number of Twitter users during the 2016 US presidential elections, which was characterized by the rivalry between Hillary Clinton and Donald Trump. This use case is particularly interesting, since it was characterized by a marked use of Twitter to foster political debate along with a significant activity by social bots, which would have strongly influenced voter decisions [8,9,10]. In particular, we focused on the analysis of the main US Swing States, characterized by a great political uncertainty, finding out that both the temporal weighting of posts and bot removal are crucial in order to get a correct estimate of users’ voting intentions. The achieved results have been compared with opinion polls collected before voting and with the actual results obtained after the vote, revealing a high accuracy of TIMBRE in estimating the polarization of social media users. In particular, our methodology was able to correctly identify the winner in 8 out of 10 Swing States, outperforming the opinion polls, which identified the winning candidate in 6 out of 10 cases.
As a last step, we studied how the presence of social bots may have affected political discussion around the 2016 US presidential election, focusing on two main aspects. On one hand we analyzed the publishing behavior of both real users and social bots, along with the differences between human and artificial political support. On the other hand, we exploited a competitive diffusion model to estimate the degree of influence of social bots on legitimate users.
The remainder of the paper is organized as follows. Section 1.1 reviews the main social bot detection techniques present in literature. Section 2 discusses related work. Section 3 describes the proposed methodology. Section 4 presents the case study and obtained results. Finally, Section 5 concludes the paper.
1.1. Problem Statement
The last few years have been characterized by a marked growth of social media legitimate use and manipulation, fostering democratic conversation about socio-political issues [9] and, at the same time, a large spread of misinformation. This phenomenon has made social platforms one of the most used sources of information, exposing users to risks caused by the lack of veracity of news. Moreover, political online discussion is often strongly polarized, leading to the formation of echo chambers that provide selective exposure to news sources biasing the opinion of users. This effect sometimes is amplified by the priority policies of the main social media platforms, which tend to favor engaging rather than trustworthy posts [11]. In such a scenario, getting reliable and impartial news, discerning them from rumor, constructed reports and fake news, could be a hard task. Social bots, also known as a sybil account, are among the factors that most undermine the reliability of online news. They can be defined as algorithmically-driven entities that automatically produce content and interact with humans on social media, trying to emulate and alter their behavior. In a political scenario, bots can be used illicitly to artificially increase the support for a candidate, influencing the outcome of the election. Campaigns of this type are usually called astroturf or Twitter bombs. Many efforts were made by the research community towards developing social bot detection and classification systems, especially on Twitter, one of the most used microblogging platforms. According to [12], state-of-the-art techniques can be categorized in three main classes: graph-based detection, crowdsourcing and machine learning.
Graph-based detection. Methods in this category exploit a graph-based representation of a social network to understand the relationships between edges or links across accounts, using this information for detecting bot activity. As described in [13], there are three main graph based approaches aimed at detecting social bots and malicious accounts: (i) trust propagation that quantifies the strength of the relationship among users; (ii) graph clustering groups similar users according to their characteristics. (iii) graph analysis that relies on several metrics and properties of the social graph, like degree distribution and centrality measures. SybilWalk [14] is a sybil detection method that exploits a random walk-based method on an undirected social graph. It proceeds by assigning a score to users in the social graph, which is then used to classify them as legitimate users or sybils. Mehrotra et al. [15] proposed a supervised method for fake followers detection based on several centrality metrics which exploits a Random Forest classifier.
Crowdsourcing. This class of methods leverages human detection to identify social bot behaviors, seeking patterns across profile information or shared content. As an example, DARPA held a Twitter bot challenge competition [16] in which teams were asked to identify influential bots that supported pro-vaccination discussions on Twitter. A common use of human annotation in bot detection involves the generation of annotated datasets, which can be then used by supervised techniques. In [17] four annotators were employed for the classification of Twitter profiles as bot or human, starting from a wide range of features such as the number of tweets or favorites. Similarly, in [18] ten volunteers were tasked with labeling 2000 random accounts, in order to build a ground truth dataset.
Machine learning. These methods are based on machine learning algorithms and statistical techniques for social bot detection. Kantepe et al. [19] proposed a supervised approach which relies on an extensive process of feature extraction. In particular, they used Apache Spark for data collection, categorizing features in three types, i.e., user, tweet and periodic features. Afterwards, a gradient boosting classifier is used to label users as human or bots. Devis et al. [20] proposed Botometer (formerly BotOrNot), a classification system that leverages more than one thousand features to evaluate the extent to which a Twitter account exhibits similarity to the known characteristics of social bots. Specifically, such features are extracted from available meta-data, shared content, and interaction patterns. Ersahin et al. [21] presented a supervised method for fake account detection on Twitter which leverages a naïve bayes classifier and an entropy minimization discretization technique. Cai et al. [22] proposed a behavior-enhanced deep learning model (BeDM) for social bot detection. In particular, they jointly exploited a convolutional neural network and a long short-term memory network to capture temporal patterns in user behavior.
2. Related Work
With the rapid growth in their use, social media platforms have become a valuable source of information, effectively exploitable in many application fields. In particular social media data can be leveraged for investigating the patterns of information diffusion, the interactions between users and their opinion about a specific topic [7]. Several opinion mining techniques have been proposed in literature for understanding the opinion of social media users regarding political events. These techniques belong to a research area called computational politics, that includes a wide range of methods aimed at analyzing the behavior of social media users during a political event of interest, modeling and influencing their perception and opinion about facts, events and public decisions.
Belcastro et al. [7] proposed an opinion mining technique, namely IOM-NN, aimed at discovering the political polarization of social media users during election campaigns characterized by the competition of political factions. The methodology relies on an iterative and incremental procedure based on feed-forward neural networks, aimed at determining the political orientation of posts used for discovering the political polarization of social media users. Marozzo and Bessi [23] proposed a methodology that exploits the keywords contained in tweets for calculating the polarization of social media users and news sites during political campaigns. Diamantini et al. [24] proposed a lexicon-based sentiment analysis algorithm, which uses a combination of word sense disambiguation and negation handling techniques for extracting user opinion from social media data. Burnap et al. [25] proposed a model for using Twitter as an election forecasting tool, applying it to the UK 2015 General Election. Oikonomou et al. [26] used a naïve bayes classifier with text mining techniques given by TextBlob, a Python library which provides an API for Natural language processing (NLP), to predict the outcome of USA presidential elections in three states of interest (i.e., Florida, Ohio and North Carolina). Jaidka et al. [27] compared three different methods (i.e., volumetric, sentiment and social media analysis) in order to predict the outcome of the elections from Twitter posts in three Asian countries: Malaysia, India, and Pakistan. Olorunnimbe et al. [28] presented an incremental learning method based on multiple naïve bayes independent models for predicting the political orientation of users over time. Wong et al. [29] modeled the political behaviour of users by analyzing their publishing activity using SentiStrength, a lexicon-based sentiment analysis tool. Alashri et al. [30] leveraged CoreNLP, one of the most popular tools for natural language processing, for the analysis of Facebook posts related to the 2016 US presidential election. Specifically, authors examined the dynamics between candidate posts and comments they received on Facebook for calculating a score for each political candidate aimed at measuring his/her credibility. Finally, Singh et al. [31] carried out a comparison among four machine and deep learning algorithms (i.e., textblob, naïve bayes, SVM, and BERT [32]) for sentiment analysis, taking the 2020 US presidential election as a case study. Authors found that the use of BERT leads to the best results, which shows the effectiveness of transformer-based language representation models.
The aforementioned techniques are often heavily dependent on the representativeness of social media data. As a consequence, the bias introduced by content artificially produced by social media bots can compromise the final results. There are several studies that show how the presence of social bots has altered the political discussion on social media platforms. As regards the 2016 US presidential election, Bessi and Ferrara [9] analyzed the pervasive presence and activity of social bots involved in social media conversation. They found out that about 400,000 bots were engaged in the political discussion about the Presidential election, responsible for roughly 3.8 million tweets (i.e., about one-fifth of the entire conversation). For this reason, the methodology we propose in this work filters out the data produced by social bots, identifying them through the use of the Botometer [20] framework. Thus, by jointly exploiting a bot detection system and a temporally-aware polarization technique, TIMBRE is able to accurately detect the real voting intentions on social media platforms, capturing only the polarization of legitimate users.
Our manuscript is one of the few research works that focuses on the study of bots and their effect on the specific task of analyzing election results. We show how the estimation of election results from social data can be biased by the presence of bots, measuring this effect in terms of voting percentages estimates and incorrectly classified states. We also show how bots have influenced social discussions by analyzing information production patterns and the spread of influence within the social network.
3. Materials and Methods
As mentioned above, TIMBRE (Time-aware opInion Mining via Bot REmoval) exploits a keyword-based classification for determining the political polarization of social media users and the Botometer framework to distinguish legitimate users (i.e., voters) from social bots. In addition, it analyzes how the presence of social media bots may have negatively affected online discussion during the political event under analysis, potentially altering public opinion.
Given a political event , a set of the factions , and a set the keywords associated to , the proposed methodology consists of four main steps:
- Post collection: posts are collected by using the set of keywords related to the political event .
- Post classification and weighting: for each post we determine its political orientation, neutral or in favor of a specific faction , and a weight indicating the importance of the post p in estimating the voting intentions of the user u who published it.
- User polarization and classification: starting from classified posts and related weights, we determine the political partisanship of each user in our dataset, classifying it as a real user or a social bot. This information is then used to forecast the outcome of the event .
- Bot influence analysis: during this step we analyze information production patterns, estimating also the degree of influence of social bots on real users.
For each step, a formal description is provided in the following sections.
3.1. Post Collection
A political event is characterized by the rivalry of different parties or factions . Examples of political events and relative factions are: (i) municipal election, in which a faction supports a mayor candidate; (ii) parliament election, in which a faction supports a party; (iii) presidential election, in which a faction supports a presidential candidate. Following the approach proposed in [7], posts are collected by using the keywords that people commonly use to refer to a given political event on social media. Such keywords K can be divided in two classes:
- -
- , which contains generic keywords that can be associated with without referring to any specific faction in .
- -
- , where contains the keywords used for supporting .
The keywords in K are given as input to public APIs provided by social media platforms, which permit collecting posts containing one or more keywords. Since data collection is usually a continuous process, new keywords can be discovered and integrated in K during the collection procedure. As the author of [7] highlighted, obtaining a representative collection of posts depends on two main factors: (i) the quality and the number of keywords used; (ii) the amount of data that can be downloaded from social media. Regarding the latter factor, it is worth mentioning that it is increasingly difficult to obtain complete data from social media platforms due to the restrictions introduced for protecting the privacy of users. The collected posts are pre-processed before the analysis as follows:
- Hashtags are normalized removing non-alphanumerical character and transforming them to lowercase. This way we can avoid differences between different versions of the same hashtag, e.g., , or becomes .
- Data representativeness is further improved by filtering out all the posts having a language different from the one spoken in the nation hosting the considered political event.
As the proposed method relies on a hashtag-based analysis without exploiting other textual information, no further preprocessing like stopwords removal or lemmatization is needed. The output of this step is a collection of posts P related to the event .
3.2. Post Classification and Weighting
In this phase we assign each post included in P to a specific faction in by analyzing the keywords it contains, defined as the set . In particular, if a post p contains only keywords that are in favor of a specific faction f, then p is classified as in favor of f; otherwise, p is classified as neutral. This is a very strict and conservative partisanship assignment, which leads to a small but high-confidence annotated dataset, likely less prone to misclassification than automatic machine-learning techniques.
Besides classifying posts in favor of a specific faction, we determine a weight indicating the importance of the post p in estimating the voting intentions of the user u who published it. The intuition behind this is that more recent posts are more suited for deriving useful information about voting intentions of a user. In fact, users’ polarization can vary over time as they can influence each other or be influenced by external events, such as political debates or scandals. The importance weight is computed as follows. Given a user and the set of his/her posts , we determine as the day the user u published his/her last post before the end of . Given a post p published by user u the day d, and , we define the importance weight as:
This weight undergoes exponential decay according to a constant (decay rate): larger values of this constant make the quantity vanish much more rapidly. Algorithm 1 shows the pseudo-code of the classification procedure, whose output S consists of a set of triple containing the post p, the associated faction and the importance weight .
| Algorithm 1: Post classification and weighting |
 |
3.3. User Polarization and Classification
Starting from the set S containing classified and weighted posts, we use a one-vs-all strategy for determining the political partisanship of each user in our dataset. Specifically, given the set of opposing factions , we compute user polarization as follows. Given a user , let be the set containing all of his/her posts, and its subset containing only post published by u classified as in favor of f in the previous step. For each faction f we determine the support of u towards f as:
As the above formula is normalized in the interval , positive values of means that user u tends to be polarized towards the faction f, and the polarization become stronger as approaches the value of 1. Negative values, instead, suggest a polarization towards the set of all the remaining factions. Therefore, given a threshold used for assign a faction only to users who show a strong polarization, political partisanship of u is determined as follows:
- -
- , if
- -
- otherwise
Besides determining user partisanship, we also exploited the Botometer framework for the automatic classification of social media users into real or fake accounts, related to potential electors and automatic entities respectively. Given a user u Botometer determines a real-valued score which measures the likelihood that user u is a social bot. According to prior studies ([9,20]), we selected a threshold value for l equal to , for the classification process. At the end of the entire procedure two dictionaries B and R are obtained, related to bots and real users respectively, composed by key-value pairs. The pseudo-code of the user polarization and classification procedure is shown in Algorithm 2.
| Algorithm 2: User polarization and classification |
 |
Once the user polarization and classification step is completed, the outcome of the political event can be determined starting from the R set, containing the polarity of legitimate users. Let be the subset of R containing all users polarized in favor of f; the final consensus for each faction is determined as follows:
3.4. Bot Influence Analysis
During this step we analyze how the presence of social media bots may affect political discussion around the event under analysis. After having built the set P of classified posts and the sets R and B, indicating bots and real users partisanship, the proposed methodology analyzes them exploiting different algorithms and techniques, focusing on the following aspects.
- Information production patterns. During this step, the publishing behavior of both real users and social bots is analyzed, focusing on the differences between human and artificial political support.
- Influence spread. This step is aimed at estimating the degree of influence of social bots, clustered according to their partisanship, on real social users. To achieve that, TIMBRE builds a graph based on repost relationships, analyzing the spread of influence through a competitive version of the Linear Threshold diffusion model. Specifically, we adapted the Separated-Threshold Model for Competing Technologies [33] to our purposes, as described below.
First of all, we built the repost graph , a directed graph where is the set of bots and real users involved in repost relationships and E is the set of edges where v reposted u, with . For each edge we assigned a unique real-valued weight corresponding to the impact of node u on v, computed as follows. Let be the number of times node v reposted u and the number of total reposts made by v; the weight of the edge is defined as: , with . Therefore, a node u has a high influence on v if v shows a high tendency in reposting u’s posts more then the others.
Once the network is built, given the set of factions involved in the political event , and the set of polarized bots , we partitioned this set in n disjoint subsets , such as contains only social bots polarized towards the faction f. For remaining users (i.e., neutral bots and real users ), a threshold values for each faction is selected, picked uniformly at random in the interval , representing the resistance of user u to be influenced in favor of the faction f. At the step t, for each faction , let be the set of nodes influenced by faction f. During this step, a neutral node v becomes polarized towards f if , which means that the influence exercised on v in favor of f is higher than its resistance to that faction. If for the node v more than one threshold is exceeded during the step t, then this node will be polarized in favor of the faction that exercises the highest influence. This process ends when all neutral nodes become influenced, returning n disjoint sets, containing the users (both real and bot) polarized towards one of the factions and an additional set containing unpolarized nodes.
4. Results and Discussion
In the following we discuss a case study related to the 2016 US presidential election characterized by the rivalry between Hillary Clinton and Donald Trump. Our analysis focused on 10 US Swing States: Colorado, Florida, Iowa, Michigan, Ohio, New Hampshire, North Carolina, Pennsylvania, Virginia, and Wisconsin. These states are given high strategic importance as they are characterized by a great political uncertainty. Therefore, information manipulation in those states, carried out by influencing the political orientation of social media users, can have significant effects on the election outcome.
As explained in Section 3.1, posts were collected using a set of neutral keywords and two sets of faction keywords, one for each candidate. An extract of these sets is shown in the following:
- = {election2016, elections2016, uselections, uselection, earlyvote, ivoted}
- = {clintokaine16, democrats, hillary16, imwithher, nevertrump, strongertogether}
- = {wakeupamerica, votetrump, maga, trump16, americafirst, neverhillary, podestaemails}
We analyzed about 4.7 million posts posted by 1.5 million users, finding a non-negligible impact of social bots on political discussion. As shown in Table 1, states like Colorado, Iowa and Ohio, are characterized by a high rate of bot posts, from 20.6% to 24.6%. Furthermore, 7% of total user accounts have been identified as social bots, which produced about 15% of the total posts related to the 2016 US presidential election coming from the analyzed swing states. This last result is in agreement with [9], which found a percentage of posts published by bots equal to 20%, albeit using a different sample of tweets and analysis methodology.
Collected data are representative of the analyzed event as:
- All the posts under analysis have the lang field set to en (i.e., English).
- About 94% of the social media users in the USA are adults and almost equally divided by gender (42.7% females and 57.3% males).
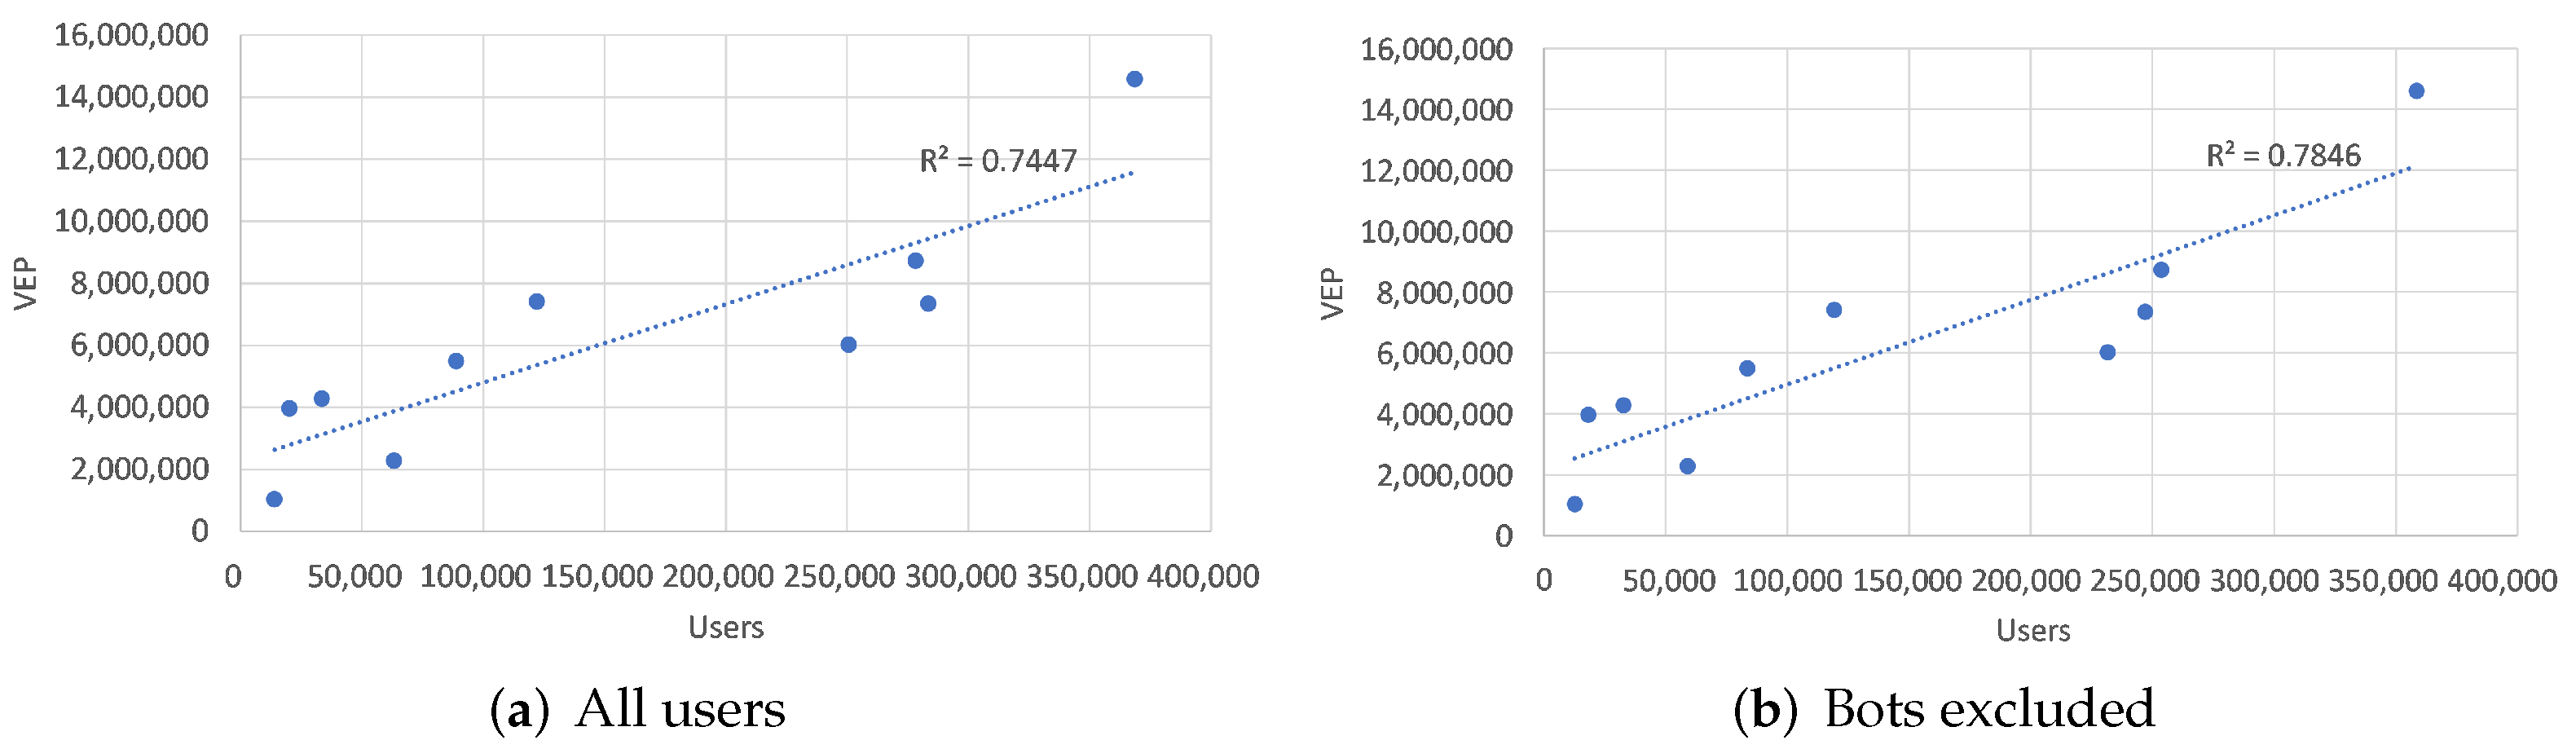
- For each state, we measured the correlation between collected users and voting eligible population (VEP). We observed a strong linear correlation, with a Pearson coefficient , which improved after removing bots reaching . Both results are significant at , therefore collected users can be considered voters in the related swing state. Figure 1 summarizes these results by showing a linear interpolation, along with the goodness-of-fit measured through the determination coefficient ().
In the next two subsections, we analyze the polarization of users during the 2016 US presidential election campaign and how the presence of bots may have affected the political discussion on Twitter.
4.1. Polarization Analysis
In this step we exploited Algorithms 1 and 2, described in Section 3.2 and Section 3.3, for determining the political orientation of the collected posts and the corresponding users. Furthermore, posts are assigned an importance weight and users are classified as real accounts or social bots. The decay rate and the threshold have been set to and respectively. Table 2, shows how the support detected for the different factions is distributed among real users and bots. We would like to clarify that with pro-X bots we indicate Twitter accounts classified as bots, which have mainly published tweets in favor of candidate X.
We found a greater presence of pro-Trump bots, which have a more marked impact on the online discussion, producing almost 18% of the contents classified as in favor of Trump. This suggests a greater use of social bots that published contents supporting the Trump political positioning compared to the other faction, which however shows a quite high volume of bot-generated content, in line with work [9].
Once posts and users were classified according to their polarity and social bot were detected using Botometer, we determined the outcome of the 2016 US election as explained in Section 3.3. The achieved results are summarized in Table 3, which shows a comparison among the real voting percentages, the average values of the latest opinion polls before the election, and the results obtained by using TIMBRE. The winning candidate is written in bold when it is correctly identified.
Compared to the latest opinion polls, which gave a correct forecast for only 6 out of 10 swing states, the proposed methodology was able to correctly identify the winning candidate in 8 out of 10 states, confirming its ability to accurately determine the polarization of social media users. TIMBRE outperformed the latest opinion polls even in terms of average absolute error, improving it from to . We computed this metric only focusing on wrong predictions by using the following formula:
where and are the set of considered factions and states, and are the real and predicted voting percentages related to the faction f in the state s, and is a binary function which outputs 1 if the predicted polarity is wrong, 0 otherwise (i.e., the winning candidate is correctly identified). Using this metric we both penalized the absolute error in terms of percentage points and the inversions predicted polarity, which can be a crucial issue while analyzing these states, characterized by a high degree of uncertainty. Another noteworthy advantage is related to the number of polarized users, which is much larger than that of the people interviewed. Consequently, this approach can be thought as a valid alternative to traditional opinion polls, since it is able to capture the opinion of a larger number of people more quickly and at a lower cost.
We further extended our experimental evaluation by analyzing the benefits brought by each of the two key steps introduced by the proposed methodology: temporal weighting and bot removal.
The achieved results, reported in Table 4, show that both the temporal weighting of posts and bot removal steps are crucial in order to get a correct estimate of users’ voting intentions. In particular, the base version of the proposed methodology, that does not leverage neither the removal of bots nor the temporal weighing of posts, achieved the same accuracy of the latest polls, correctly identifying the winning candidate in 6 out of 10 states. By adding the bot removal step to the base version, the resulting methodology was able to correctly predict the final outcome in Colorado, increasing its accuracy from 6 to 7 out of 10 states correctly classified. Similarly, by only adding the time-base weighting mechanism, we observed an increase in the forecasting ability of our methodology, which corrected its prediction for the state of Florida. Finally, TIMBRE was able to maintain the benefits coming from both of the aforementioned steps, combining them and correctly determining the winning candidate in 8 out of 10 states. Finally, it is worth noting that the results for Pennsylvania and Wisconsin that were not correctly predicted by TIMBRE were not correctly predicted even by opinion polls.
4.2. Bot Influence Analysis
In this section we analyze how the presence of social bots may have affected the political online discussion around the 2016 US presidential election. Specifically, we firstly analyzed the publishing behavior of both real users and social bots focusing on the patterns of information production. Then, we studied the main differences in supporting the two candidates between human-driven and artificial accounts. Finally, we estimated the degree of influence of social bots on legitimate users using a competitive information diffusion model.
4.2.1. Information Production Patterns
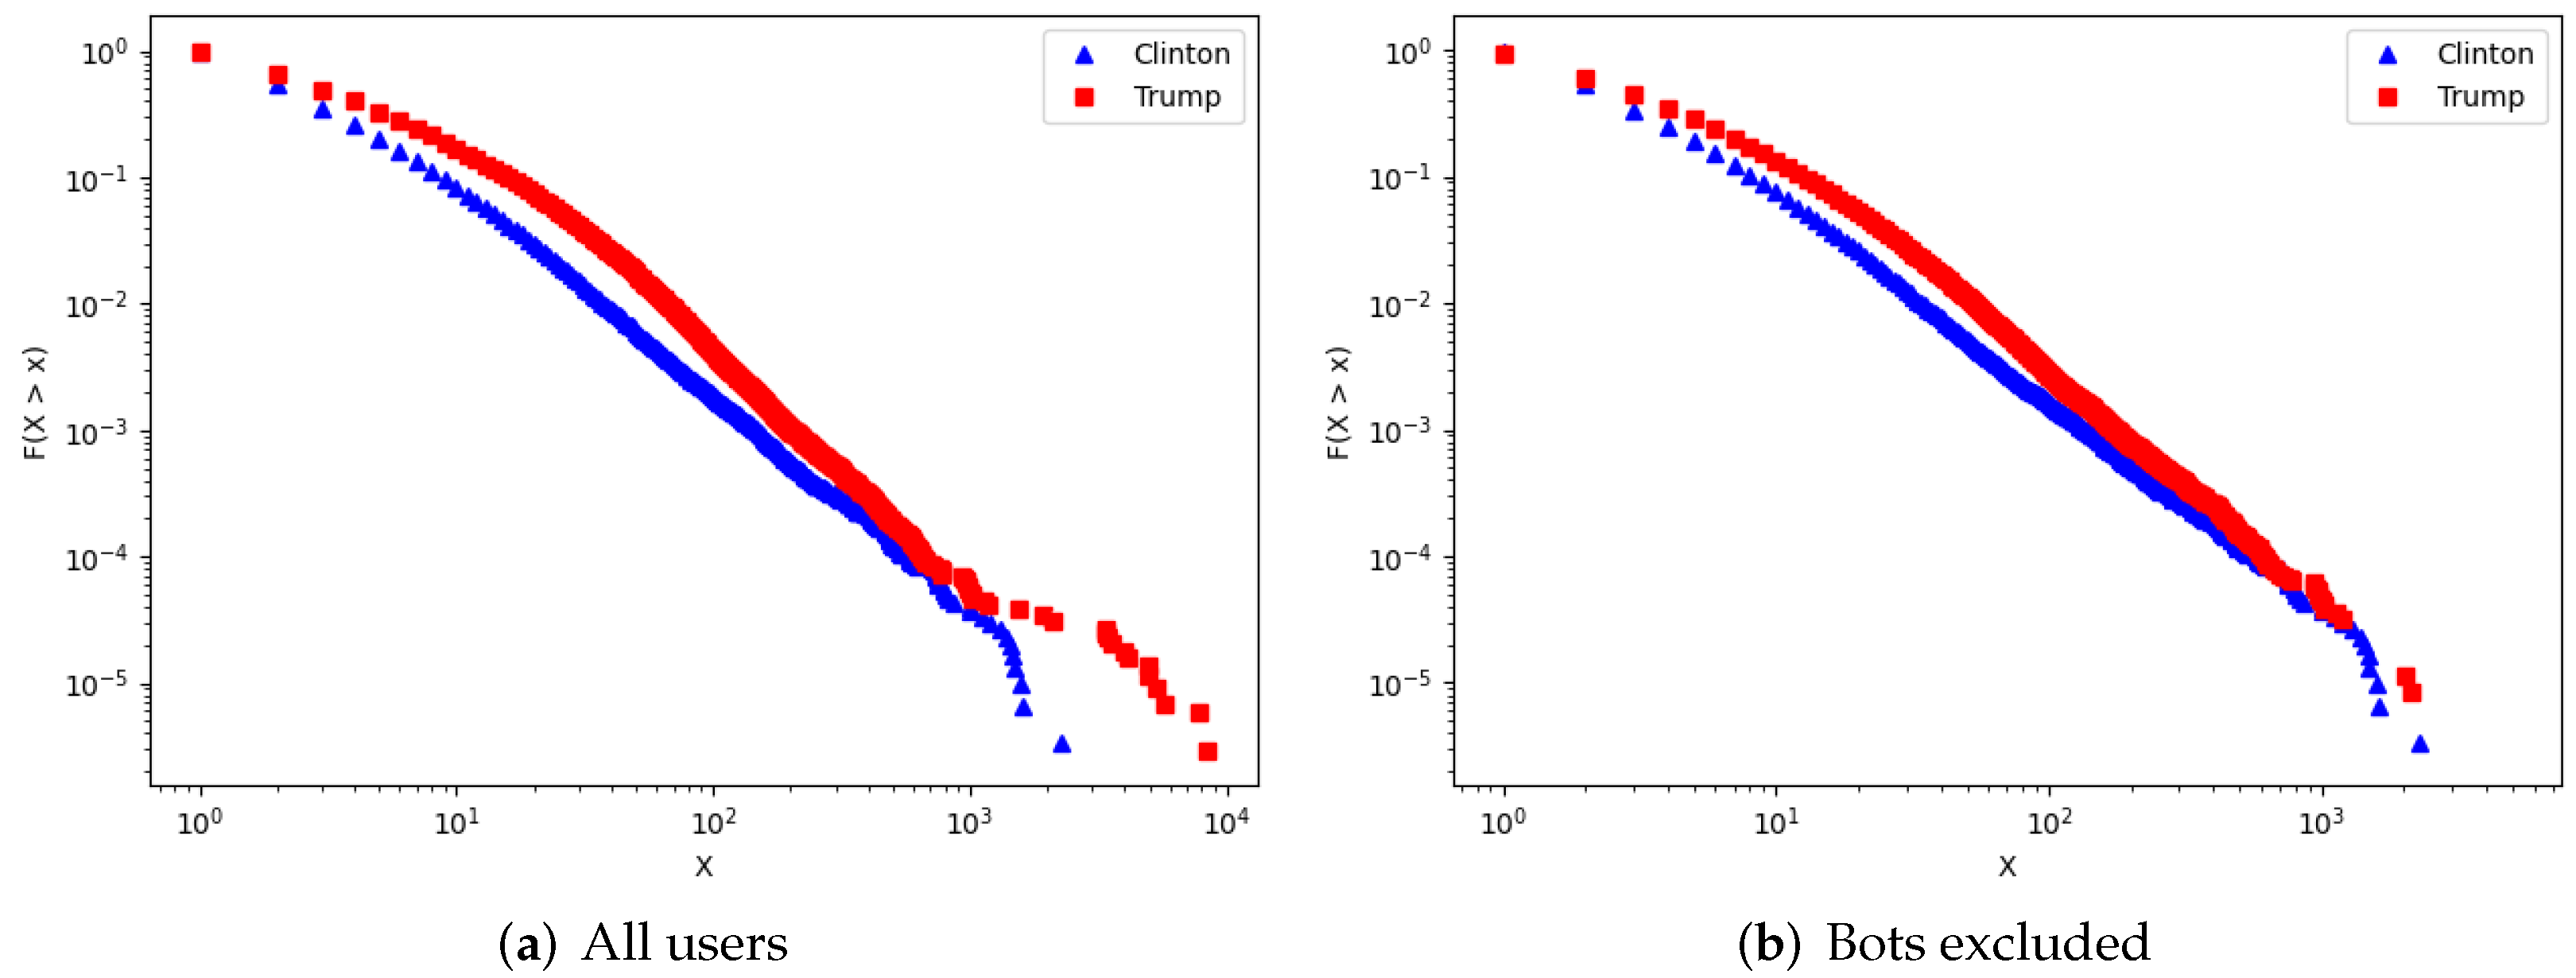
In order to extract the publishing behavior of social media users involved in the political discussion, we used the information about their political orientation coming from the user polarization step, computing a publishing model for each candidate. In particular, such models are represented by the complementary cumulative distribution function (CCDF) of the number of posts posted by users supporting Clinton and Trump respectively. Obtained results considering all accounts and excluding Bot accounts from them are shown in Figure 2. Specifically, for a given number of posts x the scatter plots show, in a log-log scale, the frequency of users publishing a number of posts greater than x (i.e., ).
Analyzing the publishing behavior of all polarized users (both real and fake accounts), shown in Figure 2a, we observed a greater publication tendency of pro-Trump accounts, which result much more prolific than pro-Clinton ones. However, the role of polarized bots behind this phenomenon should be investigated: for this purpose Figure 2b shows the publishing behavior of legitimate users only. By excluding the bots from the CCDF of both candidates, we observed a narrowing of the distance between the two curves relating to pro-Trump and pro-Clinton users. Therefore the polarity does not seem to be a deciding factor affecting the volume of posts published by legitimate users. As a consequence, it can be deduced that the differences emerging in Figure 2a are due to an amplifying effect caused by social bots. Moreover, this agrees with the higher activity of pro-Trump bots with respect to pro-Clinton ones, detected in the previous sections. For completeness, in Table 5 we provide the description of the most prolific real accounts in our dataset, according to the detected polarity. In particular, for each candidate we selected the user labeled as real by Botometer that published the highest number of posts, i.e., the rightmost point of the scatter plot in Figure 2b.
Despite the high number of published posts, Botometer gave for the two accounts a BotScore score far below 0.5, which suggests that they are truly managed by prominent users or news sites, but not by automatic entities.
4.2.2. Influence Spread
This last step is aimed at estimating the degree of influence of social bots on legitimate users, following the approach described in Section 3.4. For this purpose, we built a graph G based on repost relationships characterized by 437,854 nodes and almost 1.5 million edges. From that graph have been removed self-loops, duplicated edges and isolated nodes. Afterwards we analyzed the spread of influence by adapting the Separated-Threshold Model for Competing Technologies (see Section 3.4) to our case study, characterized by the rivalry of two candidates. Due to this, the diffusion process starts from two distinct seed-sets containing respectively the bots polarized for the Democratic and the Republican party. When convergence is reached, we end up with a list of influenced nodes labeled with the related polarity. We conducted 20 simulations varying the initial assignment of the random thresholds that represent the resistance of the users in the network to be influenced by social bots. Starting from the achieved results we computed two quantities:
- The expected spread for each candidate, determined as the average number of influenced nodes across the 20 simulations by pro-Trump and pro-Clinton nodes.
- The set of influenceable nodes, obtained through the voting technique. In particular, all the nodes activated at least once during the different simulations were assigned to the faction that influenced them the greatest number of times.
The final results obtained after the different simulations of the diffusion process are shown in Table 6. Both the expected number of influenced nodes and the total number of influenceable nodes confirmed the greatest activity of pro-Trump bots, which had a more marked impact on social media conversation compared to pro-Clinton ones. In particular, the expected number of nodes influenced by the seed-set of pro-Trump bots was 12.4 times greater than compared to the opposite seed-set of pro-Clinton ones. Similarly, the number of influenceable nodes was 7.8 times greater.
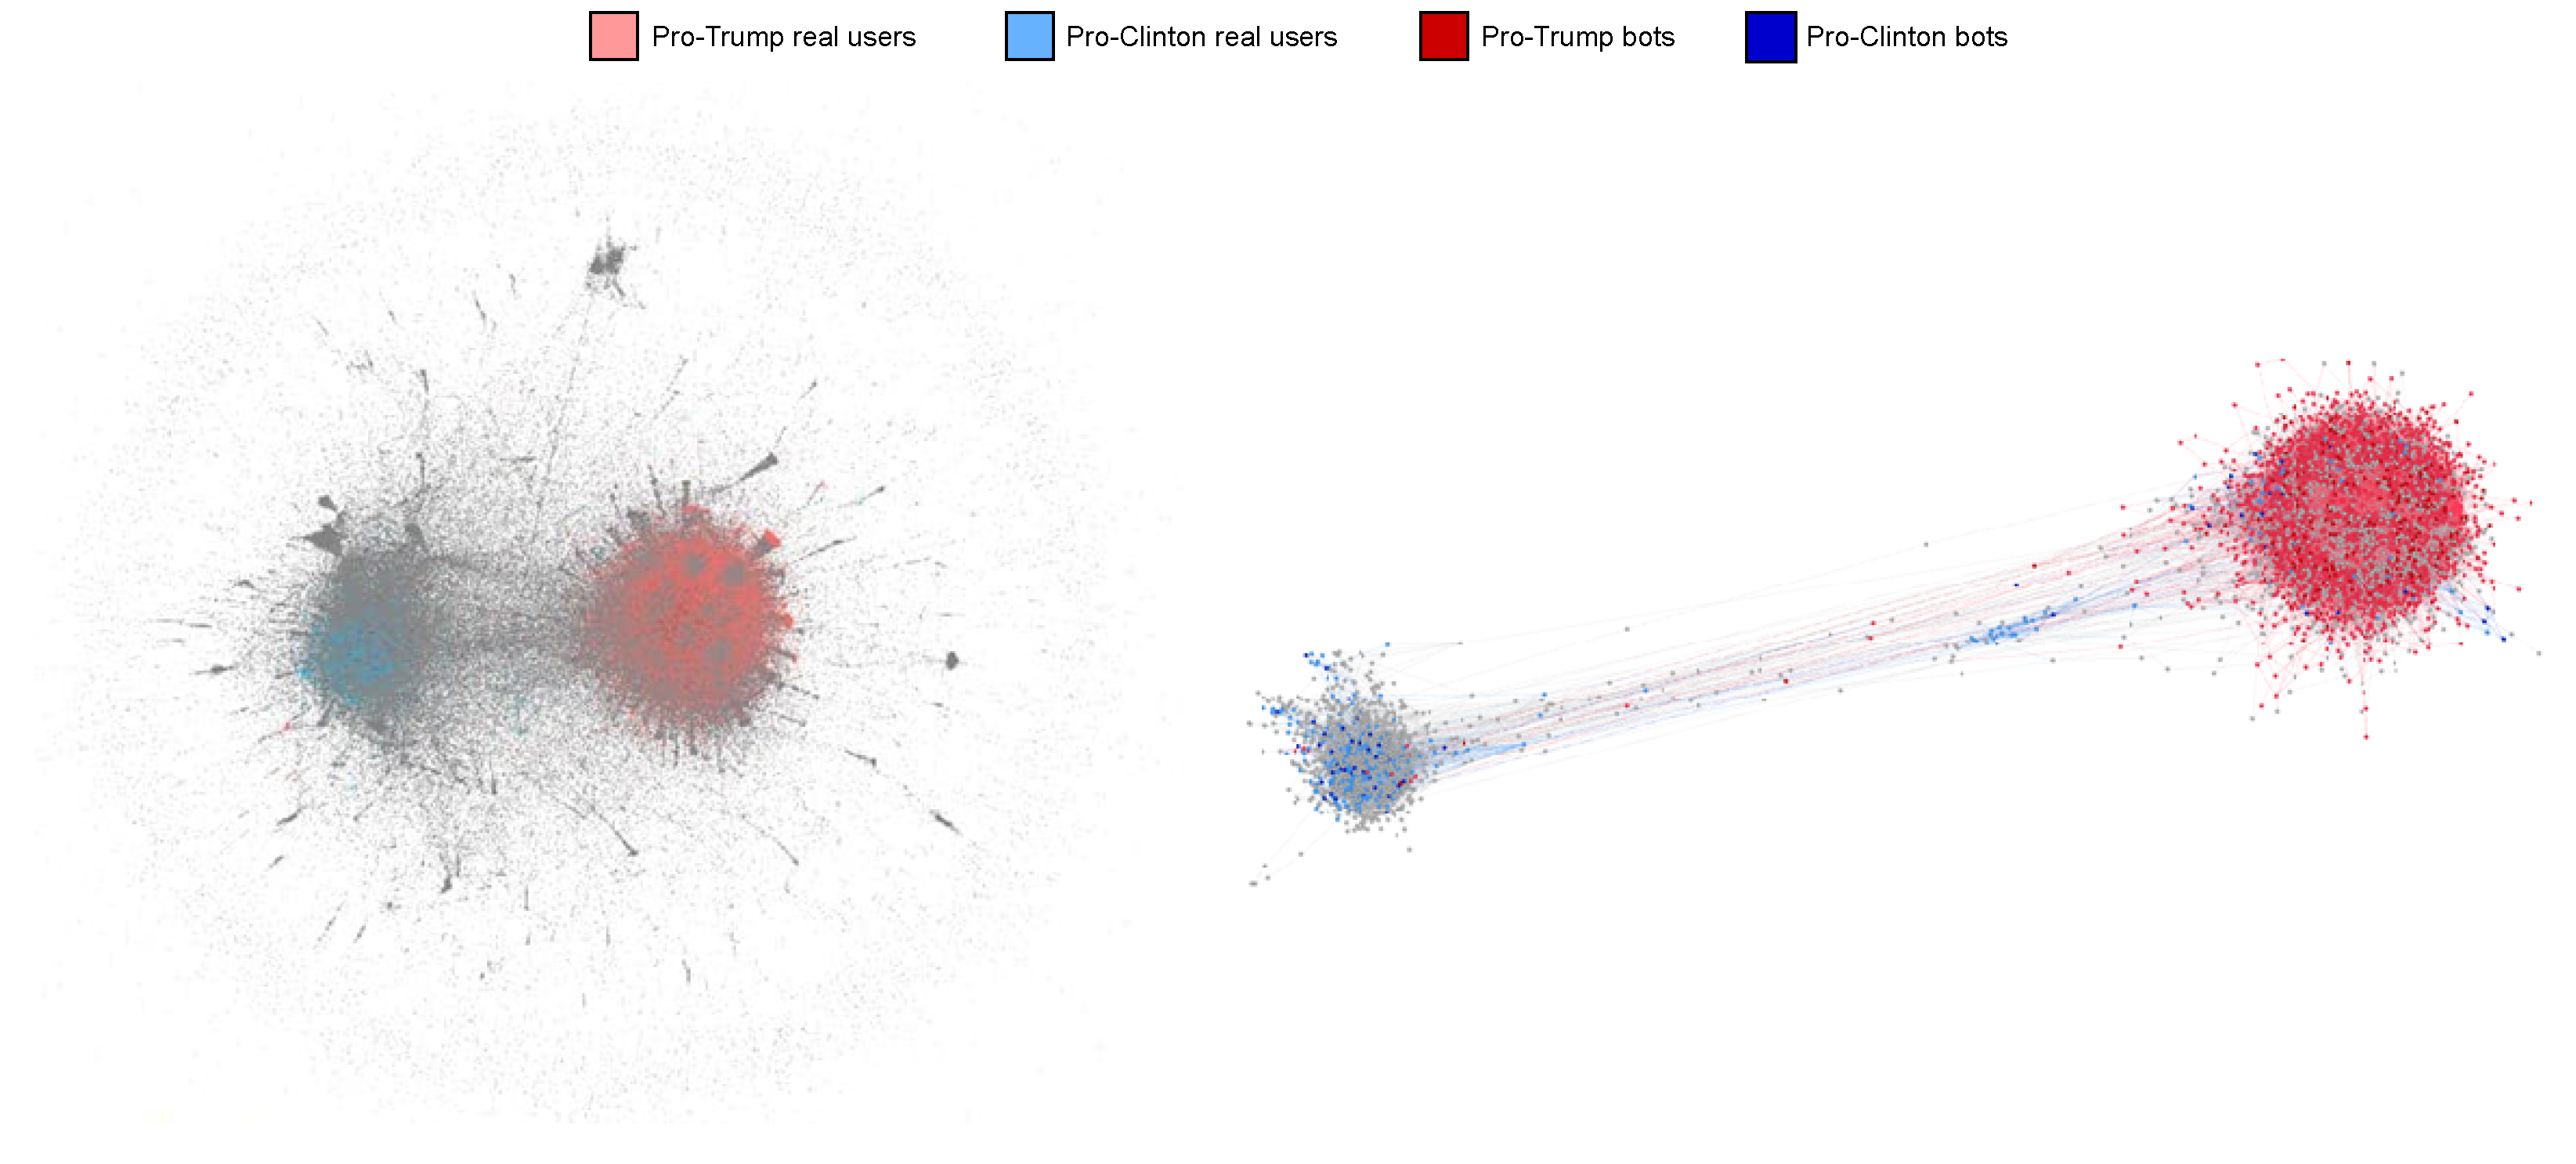
Figure 3 graphically summarizes the results obtained in this step. In particular, the entire G graph is plotted (left graph), coloring the different nodes according to their polarity and characteristics. In particular, the polarized bots belonging to pro-Trump and pro-Clinton seed-sets are colored in dark red and dark blue respectively, influenceable nodes assigned to Trump are represented in light red, those assigned to Clinton in light blue and neutral nodes in gray. Finally, in order to obtain a clearer view of the influenced nodes in the network, we reduced the initial graph by 90% while keeping the top-k nodes with highest degree (right graph). In this way we maintained almost unchanged the polarity-based clustering structure emerged in the total graph, achieving a neater representation of the results of the diffusion process.
5. Conclusions and Final Remarks
This paper proposes a new methodology, namely TIMBRE (Time-aware opInion Mining via Bot REmoval), aimed at discovering the polarization of social media users during election campaigns characterized by the rivalry of political factions or parties. This methodology exploits a keyword-based classification to determine the political polarization of social media posts and users. It is temporally-aware, as it considers time-related aspects in deciding how much a post can be helpful to determine the voting intentions of the user who published it. Moreover, it recognizes and filters out data produced by social media bots, algorithmically-driven entities that participate in online discussion with the aim of altering the public opinion about political candidates.
In order to assess the effectiveness of TIMBRE, it was applied to a real-world case study related to the 2016 US presidential election. By leveraging Twitter metadata, we focused only on posts coming from 10 US Swing States, in particular: Colorado, Florida, Iowa, Michigan, Ohio, New Hampshire, North Carolina, Pennsylvania, Virginia, and Wisconsin. The achieved results showed the high accuracy of the proposed approach, along with the benefits brought on forecasting accuracy by its two key steps, i.e., temporal weighting and bot removal. Specifically, our methodology was able to correctly identify the winning candidate in 8 states out of 10, with an average absolute error of 0.9 percentage points, outperforming the latest opinion polls, which identified the winner in 6 out of 10 cases, with an average error of points.
As a final step, we investigated how the presence of social bots may have affected political discussion around the 2016 US presidential election. In particular, we firstly analyzed the publishing behavior of both real users and social bots focusing on the patterns of information production. Then, we studied the main differences in supporting the two main candidates between human-driven and artificial accounts. Finally, we estimated the degree of influence of social bots on legitimate users finding out that in the analyzed scenario bots had a marked impact on social media conversation, showing a significant activity and influence on legitimate users. The obtained results are based on a politically neutral research analysis that produces accurate estimates, which are in accordance with related work. In addition, it is worth noticing that, although our analysis discovered a high presence of social media bots that may have affected online political discussion, it is impossible to know who was running those bots, as they can also be exploited for provocative campaigns or as part of an information war.
Author Contributions
Conceptualization, R.C. and F.M.; methodology, R.C. and F.M.; validation, R.C.; investigation, F.M.; writing—original draft preparation, R.C., F.M., D.T. and P.T.; supervision, D.T. and P.T. All authors have read and agreed to the published version of the manuscript.
Funding
This research received no external funding.
Institutional Review Board Statement
Not applicable.
Informed Consent Statement
Not applicable.
Data Availability Statement
The data that support the findings of this study are publicly available. In particular, this data was gathered using Twitter APIs available at https://developer.twitter.com (accessed on 24 December 2021).
Conflicts of Interest
The authors declare no conflict of interest.
References
- Belcastro, L.; Marozzo, F.; Talia, D. Programming Models and Systems for Big Data Analysis. Int. J. Parallel Emergent Distrib. Syst. 2019, 34, 632–652. [Google Scholar] [CrossRef]
- Belcastro, L.; Marozzo, F.; Perrella, E. Automatic Detection of User Trajectories from Social Media Posts. Expert Syst. Appl. 2021, 186, 115733. [Google Scholar] [CrossRef]
- Cantini, R.; Marozzo, F.; Mazza, S.; Talia, D.; Trunfio, P. A Weighted Artificial Bee Colony Algorithm for Influence Maximization. Online Soc. Netw. Media 2021, 26, 100167. [Google Scholar] [CrossRef]
- Stella, M.; Restocchi, V.; De Deyne, S. #Lockdown: Network-enhanced Emotional Profiling in the Time of Covid-19. Big Data Cogn. Comput. 2020, 4, 14. [Google Scholar]
- Spettel, S.; Vagianos, D. Twitter Analyzer—How to Use Semantic Analysis to Retrieve an Atmospheric Image around Political Topics in Twitter. Big Data Cogn. Comput. 2019, 3, 38. [Google Scholar] [CrossRef] [Green Version]
- Cantini, R.; Marozzo, F.; Bruno, G.; Trunfio, P. Learning Sentence-to-Hashtags Semantic Mapping for Hashtag Recommendation on Microblogs. ACM Trans. Knowl. Discov. Data 2022, 16, 1–26. [Google Scholar] [CrossRef]
- Belcastro, L.; Cantini, R.; Marozzo, F.; Talia, D.; Trunfio, P. Learning Political Polarization on Social Media Using Neural Networks. IEEE Access 2020, 8, 47177–47187. [Google Scholar] [CrossRef]
- Allcott, H.; Gentzkow, M. Social Media and Fake News in the 2016 Election. J. Econ. Perspect. 2017, 31, 211–236. [Google Scholar] [CrossRef] [Green Version]
- Bessi, A.; Ferrara, E. Social Bots Distort the 2016 US Presidential Election Online Discussion. First Monday, 7 November 2016. Available online: https://ssrn.com/abstract=2982233 (accessed on 24 December 2021).
- Jin, Z.; Cao, J.; Guo, H.; Zhang, Y.; Wang, Y.; Luo, J. Detection and Analysis of 2016 US Presidential Election Related Rumors on Twitter. In Proceedings of the International Conference on Social Computing, Behavioral-cultural Modeling and Prediction and Behavior Representation in Modeling and Simulation, Washington, DC, USA, 5–8 July 2017; Springer: Cham, Switzerland, 2017; pp. 14–24. [Google Scholar]
- Shao, C.; Ciampaglia, G.L.; Varol, O.; Flammini, A.; Menczer, F. The Spread of Fake News by Social Bots. arXiv 2017, arXiv:1707.07592. [Google Scholar]
- Alothali, E.; Zaki, N.; Mohamed, E.A.; Alashwal, H. Detecting Social Bots on Twitter: A Literature Review. In Proceedings of the 2018 International Conference on Innovations in Information Technology (IIT), Al Ain, United Arab Emirates, 18–19 November 2018; pp. 175–180. [Google Scholar] [CrossRef]
- Adewole, K.S.; Anuar, N.B.; Kamsin, A.; Varathan, K.D.; Razak, S.A. Malicious Accounts: Dark of the Social Networks. J. Netw. Comput. Appl. 2017, 79, 41–67. [Google Scholar] [CrossRef]
- Jia, J.; Wang, B.; Gong, N.Z. Random Walk Based Fake Account Detection in Online Social Networks. In Proceedings of the 2017 47th Annual IEEE/IFIP International Conference on Dependable Systems and Networks (DSN), Denver, CO, USA, 26–29 June 2017; pp. 273–284. [Google Scholar] [CrossRef]
- Mehrotra, A.; Sarreddy, M.; Singh, S. Detection of Fake Twitter Followers Using Graph Centrality Measures. In Proceedings of the 2016 2nd International Conference on Contemporary Computing and Informatics (IC3I), Greater Noida, India, 14–17 December 2016; pp. 499–504. [Google Scholar]
- Subrahmanian, V.S.; Azaria, A.; Durst, S.; Kagan, V.; Galstyan, A.; Lerman, K.; Zhu, L.; Ferrara, E.; Flammini, A.; Menczer, F. The DARPA Twitter Bot Challenge. Computer 2016, 49, 38–46. [Google Scholar] [CrossRef] [Green Version]
- Gilani, Z.; Kochmar, E.; Crowcroft, J. Classification of Twitter Accounts into Automated Agents and Human Users. In Proceedings of the 2017 IEEE/ACM International Conference on Advances in Social Networks Analysis and Mining, Sydney, Australia, 31 July–3 August 2017; pp. 489–496. [Google Scholar]
- Alarifi, A.; Alsaleh, M.; Al-Salman, A. Twitter Turing Test: Identifying Social Machines. Inf. Sci. 2016, 372, 332–346. [Google Scholar] [CrossRef]
- Kantepe, M.; Ganiz, M.C. Preprocessing Framework for Twitter Bot Detection. In Proceedings of the 2017 International Conference on Computer Science and Engineering, Antalya, Turkey, 5–8 October 2017; pp. 630–634. [Google Scholar]
- Davis, C.A.; Varol, O.; Ferrara, E.; Flammini, A.; Menczer, F. Botornot: A system to Evaluate Social Bots. In Proceedings of the 25th International Conference Companion on World Wide Web, Montréal, QC, Canada, 11–15 April 2016; pp. 273–274. [Google Scholar]
- Erşahin, B.; Aktaş, Ö.; Kılınç, D.; Akyol, C. Twitter Fake Account Detection. In Proceedings of the 2017 International Conference on Computer Science and Engineering (UBMK), Antalya, Turkey, 5–8 October 2017; pp. 388–392. [Google Scholar]
- Cai, C.; Li, L.; Zengi, D. Behavior Enhanced Deep Bot Detection in Social Media. In Proceedings of the 2017 IEEE International Conference on Intelligence and Security Informatics (ISI), Beijing, China, 22–24 July 2017; pp. 128–130. [Google Scholar]
- Marozzo, F.; Bessi, A. Analyzing Polarization of Social Media Users and News Sites during Political Campaigns. Soc. Netw. Anal. Min. 2018, 8, 1–13. [Google Scholar] [CrossRef]
- Diamantini, C.; Mircoli, A.; Potena, D.; Storti, E. Social Information Discovery Enhanced by Sentiment Analysis Techniques. Future Gener. Comput. Syst. 2018, 95, 816–828. [Google Scholar] [CrossRef]
- Burnap, P.; Gibson, R.; Sloan, L.; Southern, R.; Williams, M. 140 Characters to Victory? Using Twitter to Predict the UK 2015 General Election. Elect. Stud. 2016, 41, 230–233. [Google Scholar] [CrossRef] [Green Version]
- Oikonomou, L.; Tjortjis, C. A Method for Predicting the Winner of the USA Presidential Elections using Data extracted from Twitter. In Proceedings of the 2018 South-Eastern European Design Automation, Computer Engineering, Computer Networks and Society Media Conference (SEEDA_CECNSM), Kastoria, Greece, 22–24 September 2018; pp. 1–8. [Google Scholar]
- Jaidka, K.; Ahmed, S.; Skoric, M.; Hilbert, M. Predicting Elections from Social Media: A Three-country, Three-method Comparative Study. Asian J. Commun. 2018, 29, 252–273. [Google Scholar] [CrossRef] [Green Version]
- Olorunnimbe, M.K.; Viktor, H.L. Tweets as a Vote: Exploring Political Sentiments on Twitter for Opinion Mining. In Proceedings of the International Symposium on Methodologies for Intelligent Systems, Lyon, France, 21–23 October 2015; pp. 180–185. [Google Scholar]
- Wong, F.M.F.; Tan, C.W.; Sen, S.; Chiang, M. Quantifying Political Leaning from Tweets, Retweets, and Retweeters. IEEE Trans. Knowl. Data Eng. 2016, 28, 2158–2172. [Google Scholar] [CrossRef] [Green Version]
- Alashri, S.; Kandala, S.S.; Bajaj, V.; Ravi, R.; Smith, K.L.; Desouza, K.C. An Analysis of Sentiments on Facebook during the 2016 US Presidential Election. In Proceedings of the 2016 IEEE/ACM International Conference on Advances in Social Networks Analysis and Mining (ASONAM), San Francisco, CA, USA, 18–21 August 2016; pp. 795–802. [Google Scholar]
- Singh, A.; Kumar, A.; Dua, N.; Mishra, V.K.; Singh, D.; Agrawal, A. Predicting Elections Results using Social Media Activity A Case Study: USA Presidential Election 2020. In Proceedings of the 2021 7th International Conference on Advanced Computing and Communication Systems (ICACCS), Coimbatore, India, 19–20 March 2021; Volume 1, pp. 314–319. [Google Scholar] [CrossRef]
- Devlin, J.; Chang, M.W.; Lee, K.; Toutanova, K. Bert: Pre-training of Deep Bidirectional Transformers for Language Understanding. arXiv 2018, arXiv:1810.04805. [Google Scholar]
- Borodin, A.; Filmus, Y.; Oren, J. Threshold Models for Competitive Influence in Social Networks. In Proceedings of the International Workshop on Internet and Network Economics, Stanford, CA, USA, 13–17 December 2010; pp. 539–550. [Google Scholar]
Figure 1.
Linear interpolation: analyzed users vs. voting eligible population (VEP).

Figure 2.
CCDF of published posts for real and bot users classified by supported faction.

Figure 3.
Visualization of the diffusion process on the repost graph. The total graph (on the left) and the sampled graph (on the right) are shown, whose nodes are colored according to their polarity.
Figure 3.
Visualization of the diffusion process on the repost graph. The total graph (on the left) and the sampled graph (on the right) are shown, whose nodes are colored according to their polarity.


Table 1.
Collected posts and users per state.
| State | #Users | %Bots | #Posts | %Bot Posts |
|---|---|---|---|---|
| Colorado | 20,029 | 9.57% | 45,197 | 22.15% |
| Florida | 368,593 | 2.73% | 604,482 | 13.89% |
| Iowa | 63,264 | 6.82% | 162,567 | 20.52% |
| Michigan | 122,141 | 2.40% | 444,321 | 19.79% |
| New Hampshire | 13,920 | 9.39% | 30,523 | 20.58% |
| North Carolina | 283,419 | 12.88% | 1,108,556 | 12.77% |
| Ohio | 88,896 | 6.11% | 293,150 | 24.55% |
| Pennsylvania | 278,255 | 8.89% | 978,913 | 11.45% |
| Virginia | 250,622 | 7.63% | 955,821 | 12.65% |
| Wisconsin | 33,446 | 2.30% | 72,197 | 19.60% |
| Total | 1,522,585 | 7.03% | 4,695,727 | 14.52% |
Table 2.
Supporting posts and users per candidate.
| Polarization | #Users | %Bots | #Posts | %Bot Posts |
|---|---|---|---|---|
| Pro-Trump | 94,124 | 26.70% | 194,428 | 17.86% |
| Pro-Clinton | 78,900 | 10.00% | 128,154 | 8.27% |
Table 3.
Voting percentages estimates of the 2016 US presidential election.
| State | Real | Polls | TIMBRE | |||
|---|---|---|---|---|---|---|
| Clinton | Trump | Clinton | Trump | Clinton | Trump | |
| Colorado | 48.2 | 43.3 | 43.3 | 40.4 | 47.7 | 43.8 |
| Florida | 47.8 | 49.0 | 46.4 | 46.6 | 48.1 | 48.7 |
| Iowa | 41.7 | 51.1 | 41.3 | 44.3 | 34.1 | 58.7 |
| Michigan | 47.3 | 47.5 | 45.4 | 42.0 | 41.7 | 53.1 |
| New Hampshire | 47.0 | 46.6 | 43.3 | 42.7 | 56.8 | 36.9 |
| North Carolina | 46.2 | 49.8 | 46.4 | 46.4 | 44.7 | 51.2 |
| Ohio | 43.6 | 51.7 | 42.3 | 45.8 | 43.9 | 51.4 |
| Pennsylvania | 47.9 | 48.6 | 46.2 | 44.3 | 51.5 | 45.0 |
| Virginia | 49.8 | 44.4 | 47.3 | 42.3 | 49.9 | 44.3 |
| Wisconsin | 46.5 | 47.2 | 46.8 | 40.3 | 52.0 | 41.7 |
| Correctly classified | - | 6/10 | 8/10 | |||
| Posts | - | - | 277,181 | |||
| Users | - | ≈10,000 | 140,003 | |||
| Avg. accuracy | - | 0.6 | 0.8 | |||
| Avg. absolute error | - | 1.2 | 0.9 | |||
The winning candidate for each state is highlighted in bold.
Table 4.
Results comparison in terms of winning faction and analysis of the contribution brought by each step of TIMBRE. “C” and “T” stand for Clinton and Trump respectively.
Table 4.
Results comparison in terms of winning faction and analysis of the contribution brought by each step of TIMBRE. “C” and “T” stand for Clinton and Trump respectively.
| State | Real | Polls | Base | Bot Removal | Temporal Weighting | TIMBRE |
|---|---|---|---|---|---|---|
| Colorado | C | C | T | C | T | C |
| Florida | T | T | C | C | T | T |
| Iowa | T | T | T | T | T | T |
| Michigan | T | C | T | T | T | T |
| New Hampshire | C | C | C | C | C | C |
| North Carolina | T | Tie | T | T | T | T |
| Ohio | T | T | T | T | T | T |
| Pennsylvania | T | C | C | C | C | C |
| Virginia | C | C | C | C | C | C |
| Wisconsin | T | C | C | C | C | C |
| Correctly classified | - | 6/10 | 6/10 | 7/10 | 7/10 | 8/10 |
The correctly predicted winning candidate is highlighted in bold.
Table 5.
Description of the most prolific real accounts supporting each candidate.
| Polarity | Screen Name | Bot Score (Botometer) | #Posts | Example Post |
|---|---|---|---|---|
| Pro-Trump | @TheJonFerns | 0.18 | 3650 | “Not even Hillary Clinton’s campaign chief Podesta believes her. #podestamails” |
| Pro-Clinton | @Kaliburger | 0.16 | 4004 | “Think we should always have a woman as President. #imwithher” |
Table 6.
Obtained results after 20 simulations of the diffusion process.
| Expected Number of Influenced Nodes | Total Number of Influenceable Nodes | |
|---|---|---|
| Pro-Trump bots | 31,629 (2.4%) | 99,833 (7.5%) |
| Pro-Clinton bots | 2547 (0.2%) | 12,775 (1.0%) |
Publisher’s Note: MDPI stays neutral with regard to jurisdictional claims in published maps and institutional affiliations. |
© 2022 by the authors. Licensee MDPI, Basel, Switzerland. This article is an open access article distributed under the terms and conditions of the Creative Commons Attribution (CC BY) license (https://creativecommons.org/licenses/by/4.0/).
Share and Cite
MDPI and ACS Style
Cantini, R.; Marozzo, F.; Talia, D.; Trunfio, P. Analyzing Political Polarization on Social Media by Deleting Bot Spamming. Big Data Cogn. Comput. 2022, 6, 3. https://doi.org/10.3390/bdcc6010003
AMA Style
Cantini R, Marozzo F, Talia D, Trunfio P. Analyzing Political Polarization on Social Media by Deleting Bot Spamming. Big Data and Cognitive Computing. 2022; 6(1):3. https://doi.org/10.3390/bdcc6010003
Chicago/Turabian StyleCantini, Riccardo, Fabrizio Marozzo, Domenico Talia, and Paolo Trunfio. 2022. "Analyzing Political Polarization on Social Media by Deleting Bot Spamming" Big Data and Cognitive Computing 6, no. 1: 3. https://doi.org/10.3390/bdcc6010003