Article

Triggers and Tweets: Implicit Aspect-Based Sentiment and Emotion Analysis of Community Chatter Relevant to Education Post-COVID-19

1
College of Engineering, Abu Dhabi University, Abu Dhabi P.O. Box 59911, United Arab Emirates
2
College of Technological Innovation, Zayed University, Abu Dhabi P.O. Box 144534, United Arab Emirates
*
Author to whom correspondence should be addressed.
Big Data Cogn. Comput. 2022, 6(3), 99; https://doi.org/10.3390/bdcc6030099
Submission received: 11 August 2022 / Revised: 4 September 2022 / Accepted: 7 September 2022 / Published: 16 September 2022

Abstract

:
This research proposes a well-being analytical framework using social media chatter data. The proposed framework infers analytics and provides insights into the public’s well-being relevant to education throughout and post the COVID-19 pandemic through a comprehensive Emotion and Aspect-based Sentiment Analysis (ABSA). Moreover, this research aims to examine the variability in emotions of students, parents, and faculty toward the e-learning process over time and across different locations. The proposed framework curates Twitter chatter data relevant to the education sector, identifies tweets with the sentiment, and then identifies the exact emotion and emotional triggers associated with those feelings through implicit ABSA. The produced analytics are then factored by location and time to provide more comprehensive insights that aim to assist the decision-makers and personnel in the educational sector enhance and adapt the educational process during and following the pandemic and looking toward the future. The experimental results for emotion classification show that the Linear Support Vector Classifier (SVC) outperformed other classifiers in terms of overall accuracy, precision, recall, and F-measure of 91%. Moreover, the Logistic Regression classifier outperformed all other classifiers in terms of overall accuracy, recall, an F-measure of 81%, and precision of 83% for aspect classification. In online experiments using UAE COVID-19 education-related data, the analytics show high relevance with the public concerns around the education process that were reported during the experiment’s timeframe.

1. Introduction

The COVID-19 outbreak started in November 2019 and has been declared a global pandemic by WHO since March 2020 [1]. Several precautions have been recommended to fight its spread. As a result, all modes of public life shifted to online platforms to the full extent possible. Education around the world experienced a major interruption as educational institutions were forced to shift to distance learning. Some institutes were ready for the transition; however, the overwhelming majority were not [2]. Subsequently, many challenges have been reported concerning the new pedagogy, the online examination environment, and the lack of interaction among students as well as with their teachers [3,4]. In connection to these concerns, increased levels of anxiety, stress, and fear have been reported [5].
Several survey-based studies have attempted to investigate the impact of these changes on students [6] and teachers [7], as well as the efficacy of the educational process in its current state. These surveys were limited by time, sample size, and target group, making them less informative [8,9]. A few surveys addressed mental health-related factors affecting students and teachers post-lockdown, yet those surveys suffer from the same limitations [10,11,12]. Moreover, in addition to being limited by time, sample size, location, and focus, existing questionnaires addressing mental health-related factors have various drawbacks, including: (1) reliance on closed-ended questions that do not uncover the underlying causes of negative emotions or feelings [13], and (2) the inadequacy of responses [14]. These limitations in surveying-based methods accentuate a more informative and comprehensive analytical framework to reveal the emotional triggers causing several negative emotions among students and teachers, administrative staff, and parents. Social media discourse offers a wealth of insight into the public’s concerns around several events [15,16]. People use Twitter to informally express their opinions and express their emotions about different topics [17,18,19,20]. Existing ABSA frameworks in the education sector focus on the evaluation of higher-education students’ satisfaction [21,22], feedback on learning efficacy [23], and teaching performance [24], as well as higher education institutions’ reviews [22]. Nonetheless, to the best of our knowledge, there exists no research work conducting aspect-based sentiment and emotion analysis in the education sector to understand the emotional triggers of various stakeholders. To this end, we propose a framework to infer the major emotional triggers, across levels of society, toward post-COVID-19 education using machine learning. Specifically, the proposed framework employs Implicit ABSA and relies on Twitter data as a source of emotions and triggers as expressed in chatter. The method in this study applies several raw data preprocessing techniques to obtain clean Twitter chatter data. Next, the annotation of several emotional triggers relevant to e-learning post the pandemic is conducted to generate a training dataset. Several machine learning classifiers are trained on the labeled data to predict emotions and associated emotional triggers. Finally, the predicted insights are visualized using several spatiotemporal visualizations to inform decision-makers in the education sector. The experimental results for emotion classification show that the Linear SVC outperformed other classifiers in terms of overall accuracy, precision, recall, and had an F-measure of 91%. Moreover, the Logistic Regression classifier outperformed all other classifiers with overall accuracy, recall, and had an F-measure of 81% and a precision of 83% for aspect classification. In the online experiments, using UAE COVID-19 education-related data, the analytics show high relevance with the public concerns around the education process that were reported during the experimental timeframes.
This paper is organized as follows: Section 2 explores the extent of the literature on various research studies related to the defined problem, Section 3 introduces the proposed framework, and Section 4 discusses the experimental results.

2. Literature Review

In this section, we review the literature related to the impact of the COVID-19 outbreak on mental health in the education sector. In addition, we survey some research works addressing ABSA in the field of education.

2.1. COVID-19 Outbreak Impact on the Education Sector Using Surveying Techniques

Several studies have investigated the impact of the COVID-19 outbreak on the educational sector through surveys and questionnaires. These research works relied on online surveys, interviews, or questionnaires with a variety of sampling and analysis techniques either through specific platforms, social media, journals, and literature, or a combination of these sources. Based on review and comparison, it has been observed that the surveying techniques are limited in terms of the study focus, targeted population and sample size, location, and time interval.
The reviewed literature was mainly focused on the effect of the pandemic on the education sector [25], including learning efficacy [26,27,28] and evaluating the efficiency of distance learning as an alternative solution during pandemics [29], as well as the impact on students. Different groups of students were targeted in different studies; for example, the majority of the studies primarily targeted higher education students, with some focused on specific colleges [30] or limited-income students [31]. Such studies targeting narrow populations may provide inaccurate insights on a greater scale. Therefore, in an attempt to overcome this limitation and provide better insight, some studies were focused on assessing the impact on students and their parents to provide a more wholesome analysis [32,33].
Several studies were focused on assessing the mental health of students, parents, and educational personnel post-outbreak. Even though some studies targeted relatively large geographical areas, surveying responders from four countries [25], most of the studies were limited to specific locations. For instance, the studies focused on the mental health assessment of college students were limited to specific countries such as the United States [34,35], Saudi Arabia [36], and Bangladesh [37]. Similarly, the studies focused on assessing the impact on parents’ mental health were limited in geographical coverage, targeting parents only in the United States [38] and China [39]. Moreover, some studies were focused on the evaluation of mental health services during the pandemic [40]; however, these were more limited in geographical coverage as they only evaluated mental health services in New York City.
A couple of studies targeted a wider range of respondents in the educational sector, including staff, educators, and students [25,41]. However, such studies were conducted in a limited time interval, for example, during the early phase of the pandemic [33]. This disregards the importance of the preceding intervals on the comprehension of the studies. However, Alqahtani et al. [27] addressed this limitation by allowing the user to adjust the timeframe as appropriate.
While most of these studies revealed negative impacts, some have revealed some positive impacts, reporting agility, innovation, and increased technological skills in some cases. While these results are not general, they are valuable. The overall conclusion inferred from these studies is that distance learning can be a temporary alternative but not a complete substitute as it still lacks efficiency.
Table 1 provides a comparison of these studies. All the studies were compared across the following criteria: surveying method used, respondents’ sample, the focus of the study, as well as country and language of the survey.

2.2. Aspect-Based Sentiment Analysis in the Field of Education

Aspect-based Sentiment Analysis (ABSA) has been deployed for education evaluation purposes since before the emergence of COVID-19. Multiple researchers have investigated the practicality of using the Natural Language Processing (NLP) technique to evaluate reviews and opinions on different topics and aspects. For instance, in 2019, Nikola et al. [21] proposed an ABSA system for the automated mining of free text reviews. This proposal aimed to monitor Serbian university students’ satisfaction through two sets of data sources: official student opinion surveys and review websites such as “Rate my professors” [42]. While this research proved successful in sentiment polarity detection for both data sets, it concluded that the source of the reviews highly affects the quality of the ABSA. Separately, Kastrati et al. [23] proposed a weakly supervised ABSA framework to provide educators and course designers with insight into the main factors affecting the educational process through students’ opinions. This framework was tested on two real-world datasets collected from both online and traditional classroom setups. The results of this research provide insight into the effectiveness of online courses in general when applied to students’ feedback. In another work, Sindhu et al. [24] proposed the use of a two-layered Long Short-term Memory (LSTM) model for aspect extraction and sentiment polarity detection on two manually tagged datasets. The presence of multiple aspects within a sentence without connectives affected the accuracy of the system, introducing a drawback to this implementation.
Other ABSA systems have used social media networks as the data source. Balachandran et al. [22] proposed an online review system dedicated to higher education institutions. This proposed system aims to assist students in the institution selection process through the feedback retrieved from social network sites such as Facebook and Twitter. Data collection was through the Application Programming Interface (API) of Facebook and Twitter, which provide large quantities of relatively clean data. The end product is a system that categorizes reviews based on sentiment polarity, generates statistical summaries, and provides an aspect-based evaluation of the institutions and recommendations. However, this implementation is still limited to certain data sources. In addition, Alassaf et al. [43] implemented ABSA using a hybrid selection method on Arabic tweets. This implementation extracts the aspects from education-related categories, including quality of teaching, electronic services, activities, etc. However, this was only limited to Arabic tweets related to Qassim University.
To the best of the authors’ knowledge, none of the extant research that was aimed at evaluating the educational process during the COVID-19 pandemic proposed the use of ABSA. However, the closest proposal implemented the Ensemble Learning-based Sentiment Analysis (ELSA) algorithm to assess the adoption rate of e-learning during COVID-19 in the educational sector [44].
Table 2 provides a comparison of the different literature reviews that were summarized above. The comparison is across the method used, the focus of the study, the data source, and the language used for the natural language input.

2.3. Contribution

After the critical analysis of the reviewed literature, several limitations were identified. In addition to the limitations of traditional surveying methods, these studies were limited in terms of the targeted population, source and method of data collection, as well as geographical coverage and time interval; hence, the inferred insights. These limitations accentuated a more adaptive approach to infer more representative insights relevant to variable locations, timeframes, and events. In contrast to surveying techniques, social media platforms offer real-time access to public opinions and emotions across the world, relevant to several life events [22,43,44].
To address the limitations inherent to traditional surveys and other techniques presented in the previous research studies, this research proposes a real-time automatic analytics framework to provide representative and timely insights into the varying impacts of several life events, such as COVID-19, on the public relevant to the educational sector. This proposed framework considers feedback from all groups of society, especially the main stakeholders in the educational sector, such as students, parents, and educational personnel using social media chatter data. We focus specifically on Twitter, yet the proposed methods can be applied to other social media platforms. The proposed framework is not limited to a specific time or location; rather, it monitors public emotion continuously and allows several temporal and spatial filters for more fine-grained analysis. Furthermore, this study is the first to propose this mode of analysis for the educational sector. Previous studies proposing aspects-based sentiment analysis in the field of education addressed different types of concerns and targeted different populations. However, this study is more holistic in its analysis, target group, and coverage.

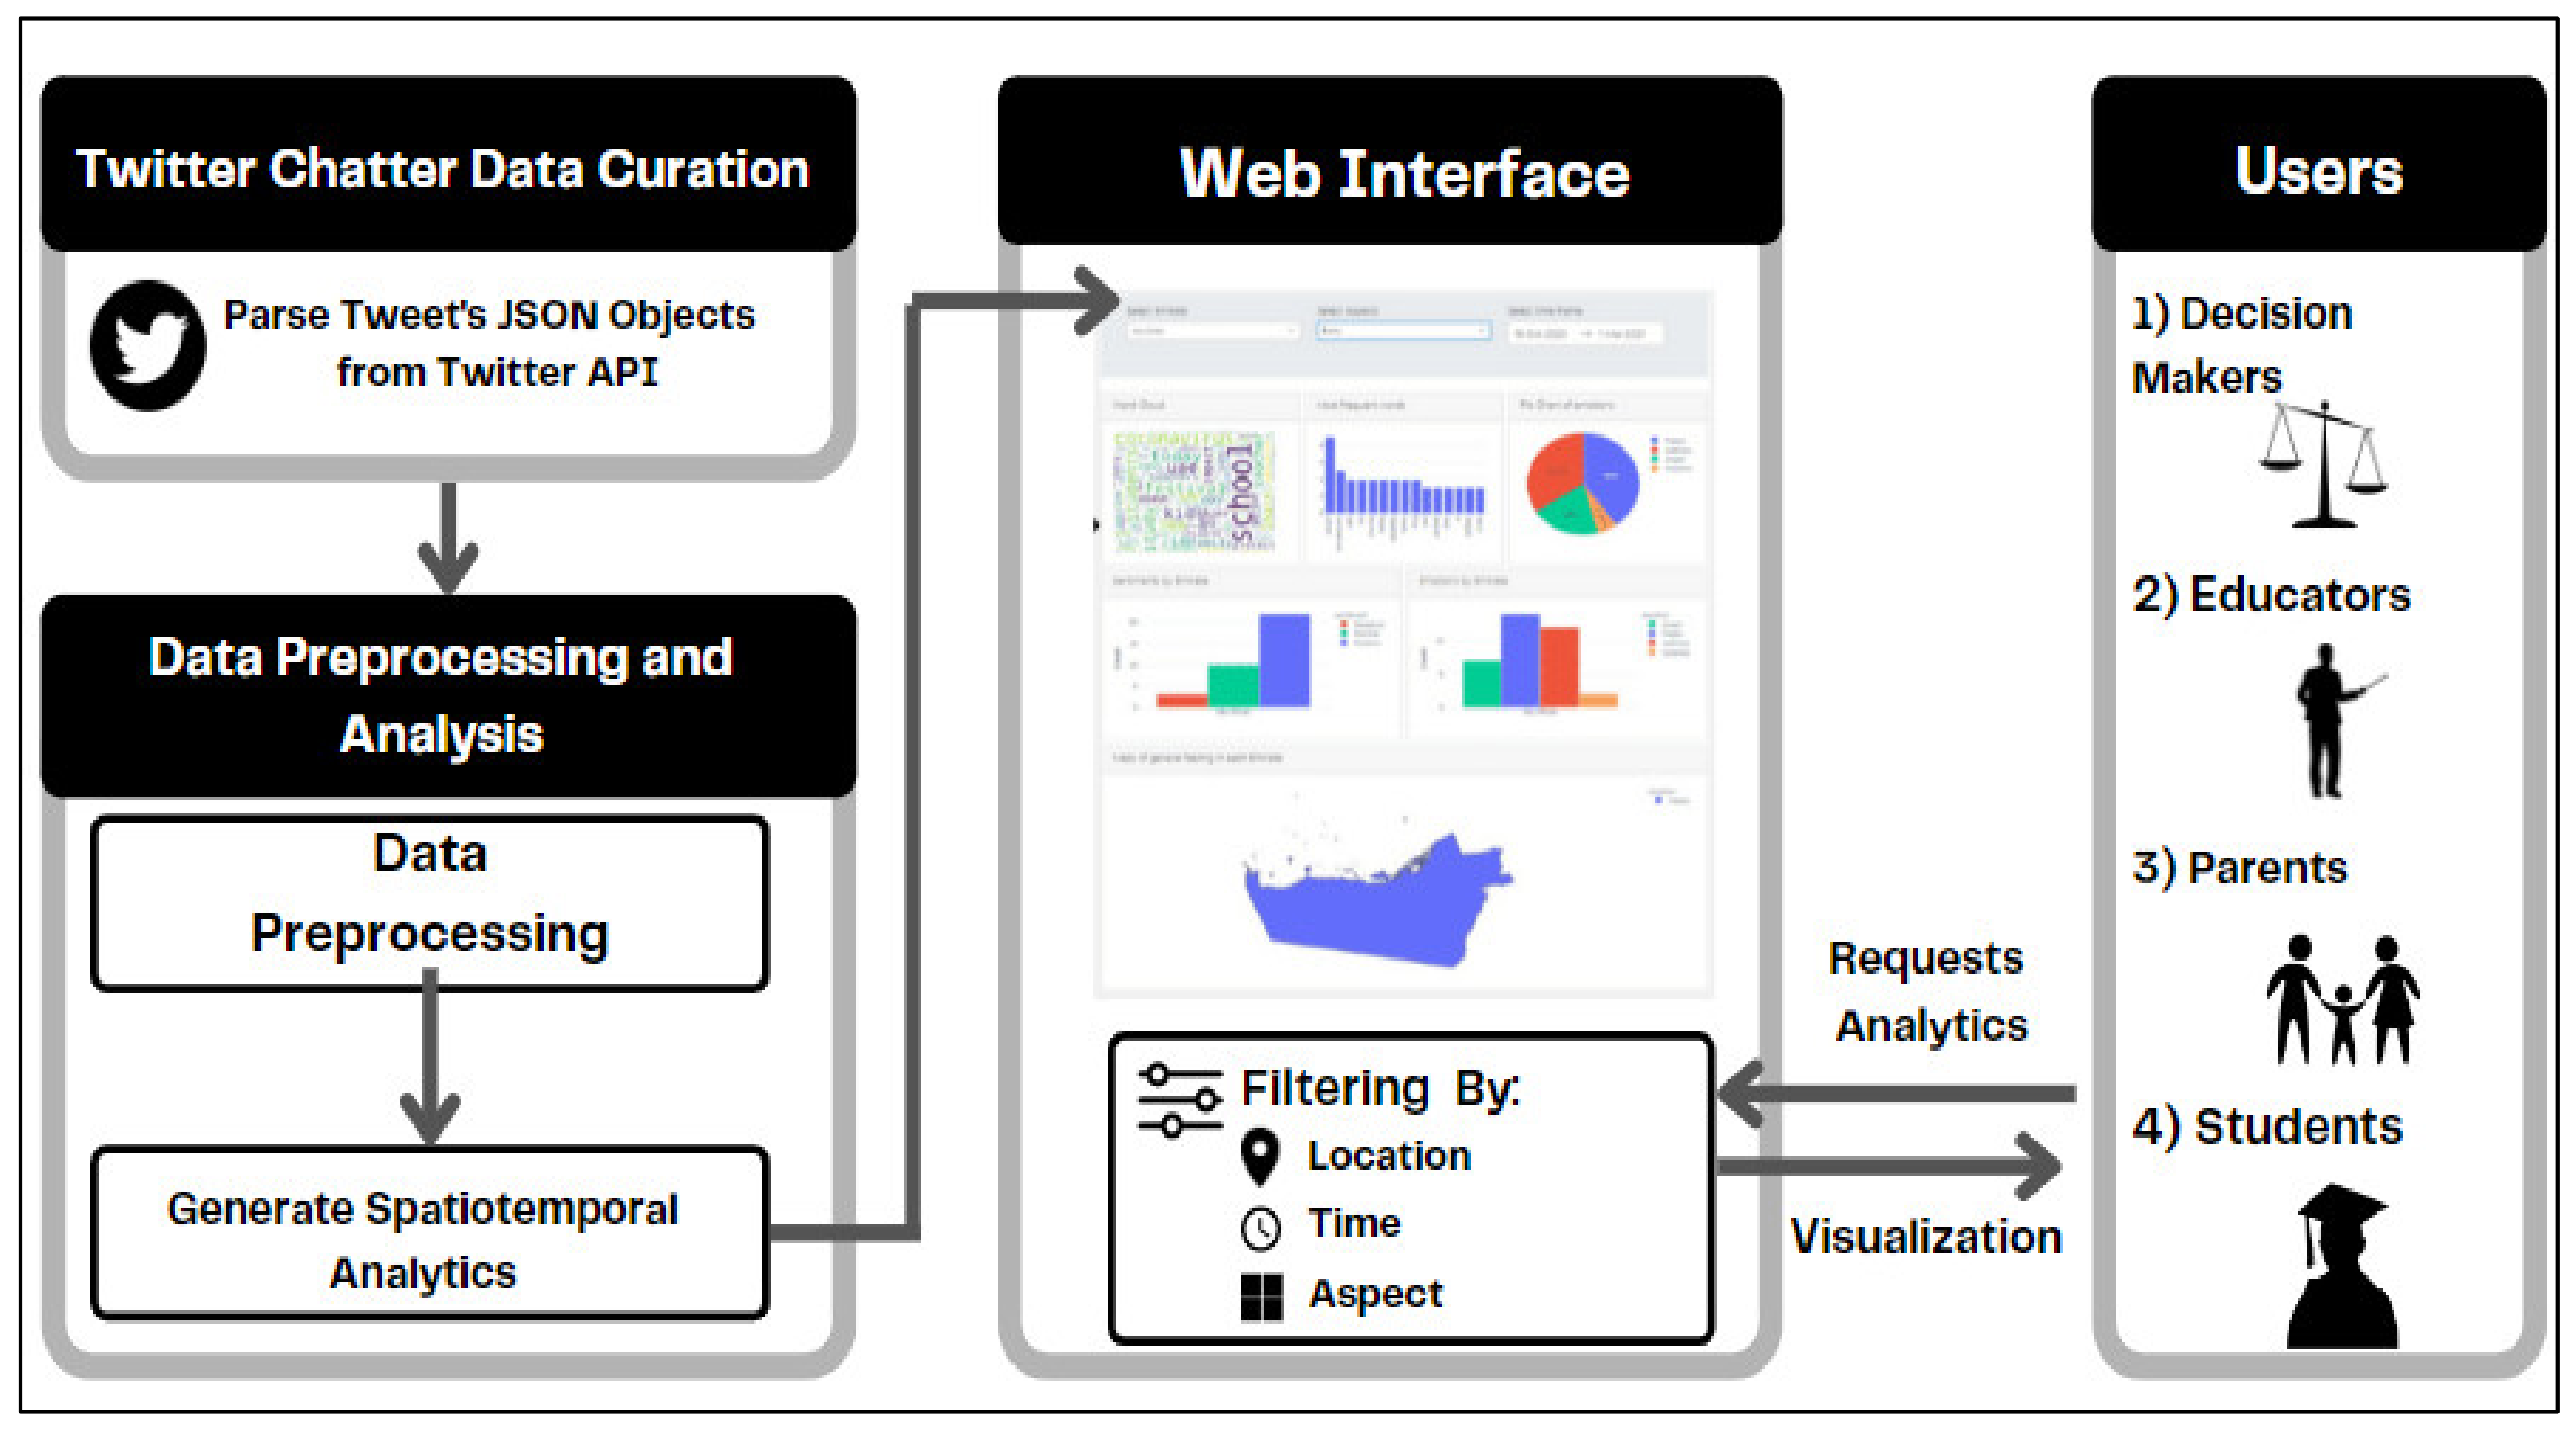
3. Proposed Framework

3.1. Overall System Description

The proposed framework is composed of three main modules. The first module is responsible for social media data curation. The second module is focused on data preprocessing and analysis. It generates several analytics using machine learning models. The last module is the web interface providing access to different stakeholders to real-time analytics based on several filtering parameters such as location, time, and aspects. The proposed framework is illustrated in Figure 1. In subsequent sections, we further describe the detailed components of the second module, which is responsible for producing well-being analytics.

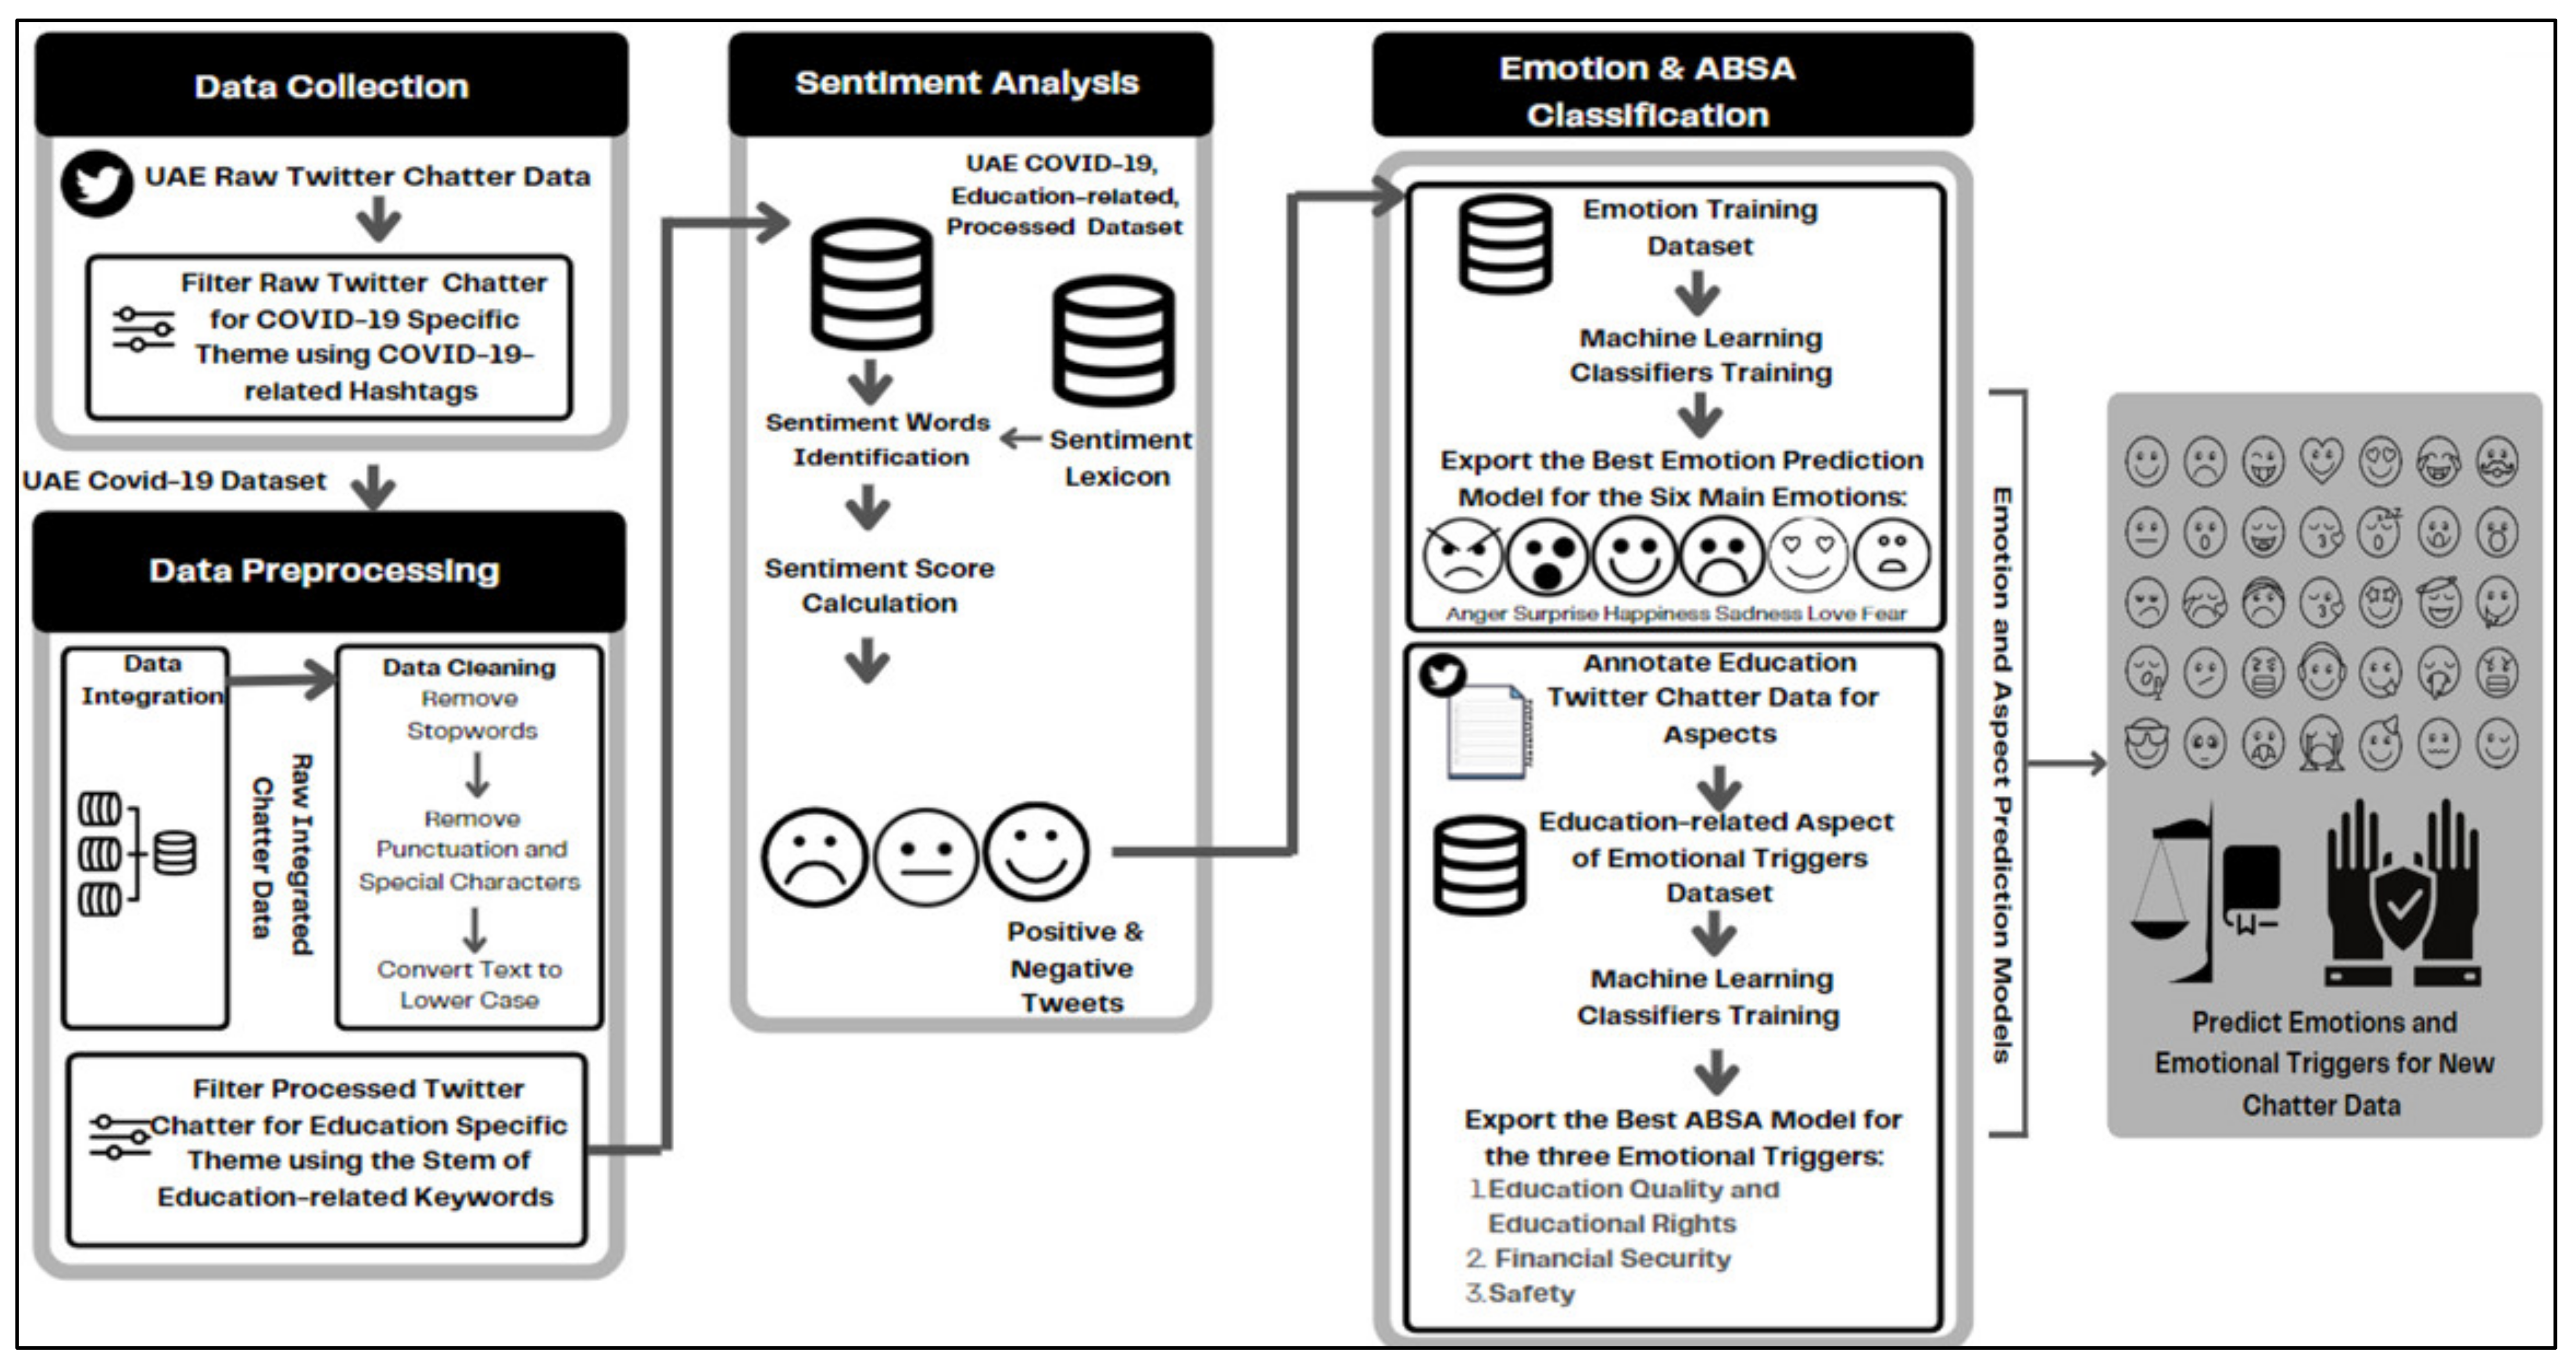
3.2. Analytics Module

The second module, depicted in Figure 2, is responsible for generating several insights into the public’s emotions relevant to the education sector. It performs three main tasks. These are: (i) Preprocessing, (ii) Sentiment analysis, and (iii) Emotion and Aspect-based classification. In subsequent sections, we provide a detailed explanation of each of these tasks.

3.2.1. Data Preprocessing

For the purpose of experiments, we use several Twitter Chatter training datasets and produce a UAE-specific COVID-19 dataset to test the proposed analytics framework on UAE-specific data. The training dataset for emotion classification and ABSA are explained in the respective sections: Section 3.2.3 and Section 3.2.4.
The experimental UAE COVID-19 Twitter Chatter Dataset [45] is a bilingual UAE GeoTagged dataset available in both English and Arabic languages. In our experiments, we use the English dataset. The raw dataset was collected through Twitter API using filtering keywords and hashtags relevant to COVID-19, such as: “corona”, “coronavirus”, “COVID”, “Covid”, and “Corona”. The filtering keywords and hashtags were specified in the parsing function of the Twitter API so as to collect UAE, COVID-19-specific chatter data. The structure of the raw dataset is as follows:
  • ▪ NO.: a serial number;
  • ▪ Tweet Text: COVID-19, UAE-specific Twitter data;
  • ▪ Tweet ID: Twitter-unique Tweet ID;
  • ▪ Date: Date of Tweets;
  • ▪ Likes: Number of likes received for the specific Tweet;
  • ▪ Retweets: number of times the Tweet was retweeted;
  • ▪ Place: includes the full geotag provided by Twitter in JSON format.
Since the dataset is collected on hourly bases and chatter data for each hour is stored in a separate CSV file, the first processing task was to integrate all of the distinct files into one main dataset and remove redundancy and repetitions caused by retweets. The data used for these experiments are collected from 11 October 2020 and up to the date of this study, with a total number of 171,873 tweets.
Next, several text cleaning and natural language processing tasks [46] were conducted to clean the chatter data from peculiarities that do not bear any semantic value. For instance, the following cleaning tasks were conducted:
  • ▪ Stopwords and common word removal [47]: commonly repeated words that do not bear relevant emotional or sentimental orientation were extracted, such as “covid”, “covid19”, and “corona”, “a”, “the”, “in”, etc.
  • ▪ Single and double character, and punctuation and special character removal
  • ▪ Conversion to lowercase so as to eliminate redundancy caused by letters’ capitalization. For instance: “DANGEROUS,” “Dangerous,” and “dangerous” can be considered two different features if not converted to lowercase.
  • ▪ Stemming and lemmatization reduce feature space dimensionality and reduce redundancy [48].
  • ▪ Filter the dataset to create an education-related chatter dataset by extracting the tweets that contain any morphological derivation of the stem of a set of keywords related to the educational context such as education, school, university, teacher, professor, exam, learning, etc.
Some examples of education-related tweets extracted from the UAE Twitter Chatter Dataset are illustrated in Table 3.

3.2.2. Sentiment Analysis

At this stage, the education-related tweets were analyzed to identify the overall sentiment score of the tweet. This task was carried out to identify tweets that have emotional orientation compared to neutral tweets that only contain information, instructions, or announcements that do not reflect the special emotional state of the public.
For the sentiment analysis task, a lexicon-based approach was adopted. Using a lexicon-based sentiment annotation tool [49], a lexicon containing a set of sentiment words, each with an associated sentiment score, was used to assign a polarity score for each word in the tweet. After weighing the individual words in the tweet, an overall normalized sentiment score of the tweet was calculated in the range [−1.0, 1.0]. The score ‘0′ was considered “neutral,” a positive score (i.e., greater than zero) was considered “positive,” and a negative score (i.e., less than zero) was considered “negative.” These generated labels were validated manually by two human experts, and disagreements were resolved. Some examples of labeled tweets are provided in Table 4. From this module, only tweets with explicit polarity and sentiment are fed to the emotion analysis module. Neutral tweets that do not have significant emotional orientation are dropped.

3.2.3. Emotion Analysis

To perform emotion analysis, several machine learning classifiers were trained on an annotated training dataset available in [50], labeled with the six most common human emotions, i.e., Happiness, Sadness, Surprise, Fear, Love, and Anger. The dataset has 21,586 tweets and was collected through the Twitter API using hashtags associated with the six explicit emotions. For example, ‘Peace’ is associated with ‘Happiness’. The statistics of the emotion training dataset are illustrated in Table 5.
Sample tweets, along with the associated keywords and the associated emotion labels, are illustrated in Table 6. The emotional analysis was conducted to identify the public’s specific emotional state relevant to particular aspects (i.e., concerns) in the field of education. For instance, parents might feel “Sad”, “Fearful”, or “Angry” about their kid’s “Safety” in the case of safety breaches and disease outbreaks in a particular school. On the other hand, parents might be very “Happy” about the school and the government taking all necessary precautions to protect their kids’ “Safety” while attending the school. Therefore, to have a comprehensive understanding of the emotional triggers in society relevant to the education sector and the education process, it is important to not only identify emotional triggers but also understand what type of emotions are triggered by these triggers.

3.2.4. Aspect-Based Sentiment Analysis

To detect the societal emotional triggers associated with different emotions relevant to the educational process, an education-related Twitter chatter training dataset [51] was used to manually label the tweets with the most representative emotional triggers (i.e., aspects). Three human annotators conducted the annotation and resolved the disagreement. As a result, three distinct aspects were defined to represent the most significant emotional triggers impacting societal emotions and opinions relevant to the educational process. These aspects are “Education Quality and Educational Rights”, “Financial Security”, and “Safety”. The total number of samples in the training dataset is 1179. The statistics of the emotional trigger dataset are summarized in Table 7.
These three aspects were identified as the most prevalent emotional triggers around the educational process resulting from the transformation that took place during and post lockdown. Students, parents, educators, and officials shared many concerns about the quality of the education process after the shift to online education. Mixed feelings ranging from an appreciation for the quick resolutions and fast transformation that prevented education’s interruption, and fear and worry associated with the efficacy of online education were common on social media chatter. This variability in emotions and the emotional trigger was not only present on social media but was also reported in the news.
According to the United Nations COVID-19 Socio-Economic analysis in the UAE, a decline of 13% in the employment rate is expected in the Arabian Gulf region [52]. The unemployment rate in the UAE has increased to 5% in 2020 alone [53], raising concerns about job losses due to the pandemic among a large segment of the public. The increase in job insecurity has led to financial security concerns [54]. Job and financial insecurities have influenced different segments of society, including teachers, educational staff, and parents. Therefore, they were considered among the key aspects. Moreover, in Australia, for example, studies report that 40,000 tertiary education staff have lost their jobs, 60% of which were held by women [55]. Working parents were among the most impacted segments; for instance, 51.7 million parents have lost their jobs due to COVID-19 in the US alone [56], leaving them unable to pay for their children’s tuition. Furthermore, approximately 56% of undergraduate students reported being unable to afford college tuition due to COVID-19 and its consequent job insecurities [57]. Hence, “Education Quality and Educational Rights” were among the key concerns that had to be represented in the aspects. Finally, over 397,000 cases and at least 90 deaths were reported due to COVID-19 in the US higher educational institutions alone [58]. Consequently, more educational staff, parents, and students were concerned about their safety and expressed fear of death; hence, these two factors were considered key aspects. Table 8 illustrates a sample of the tweets with associated aspects.

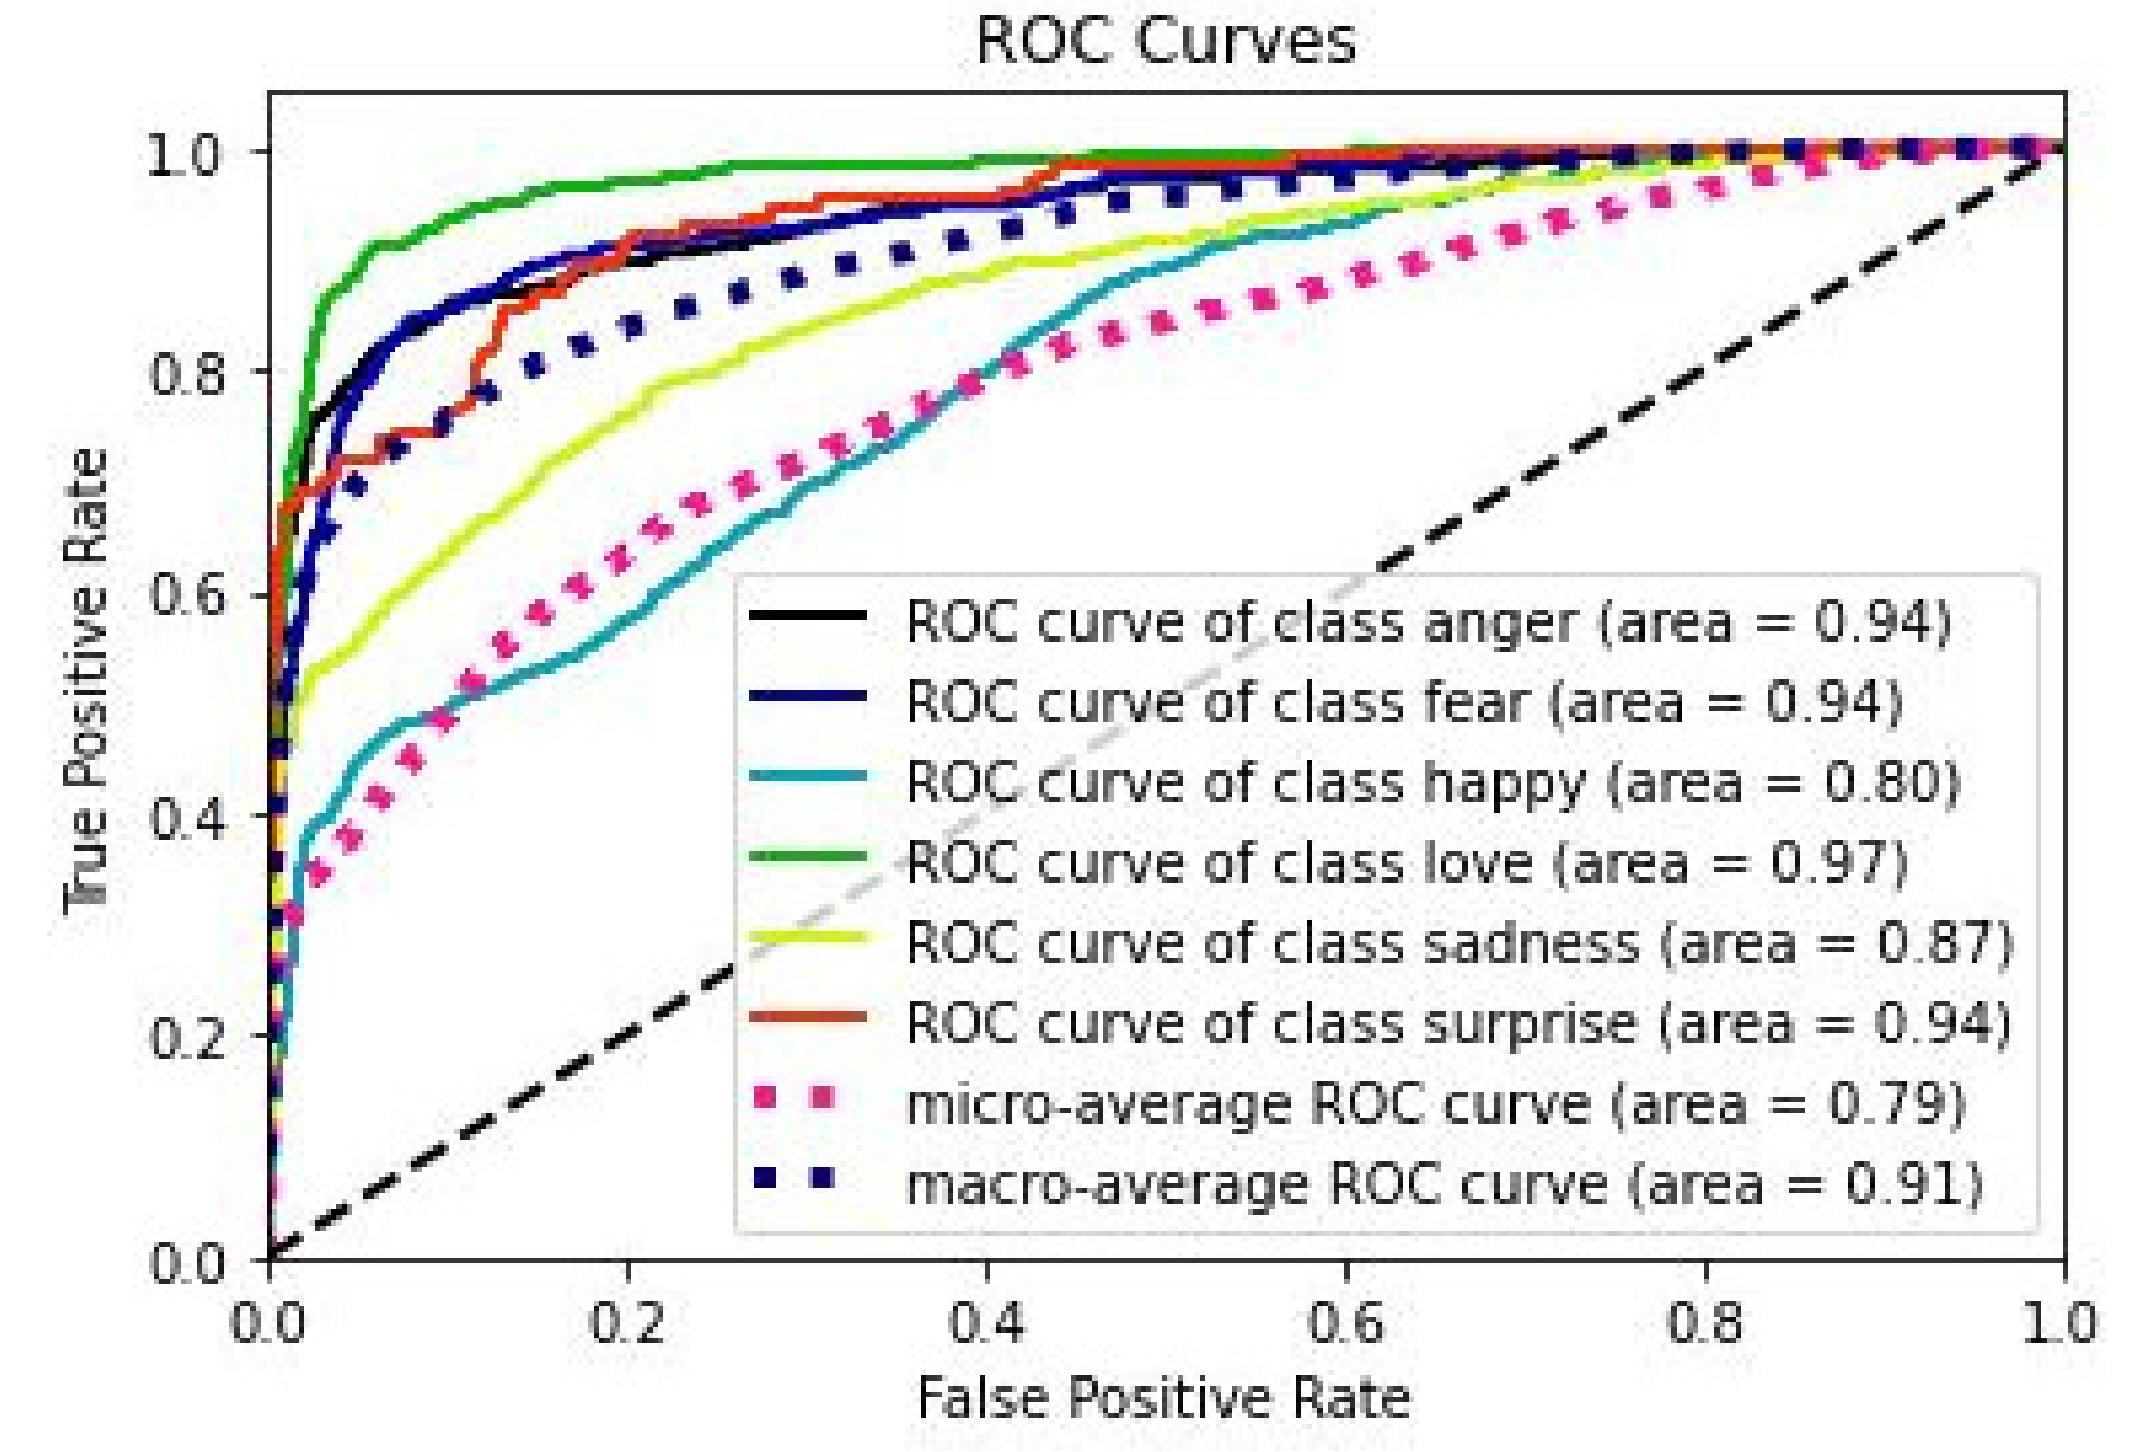
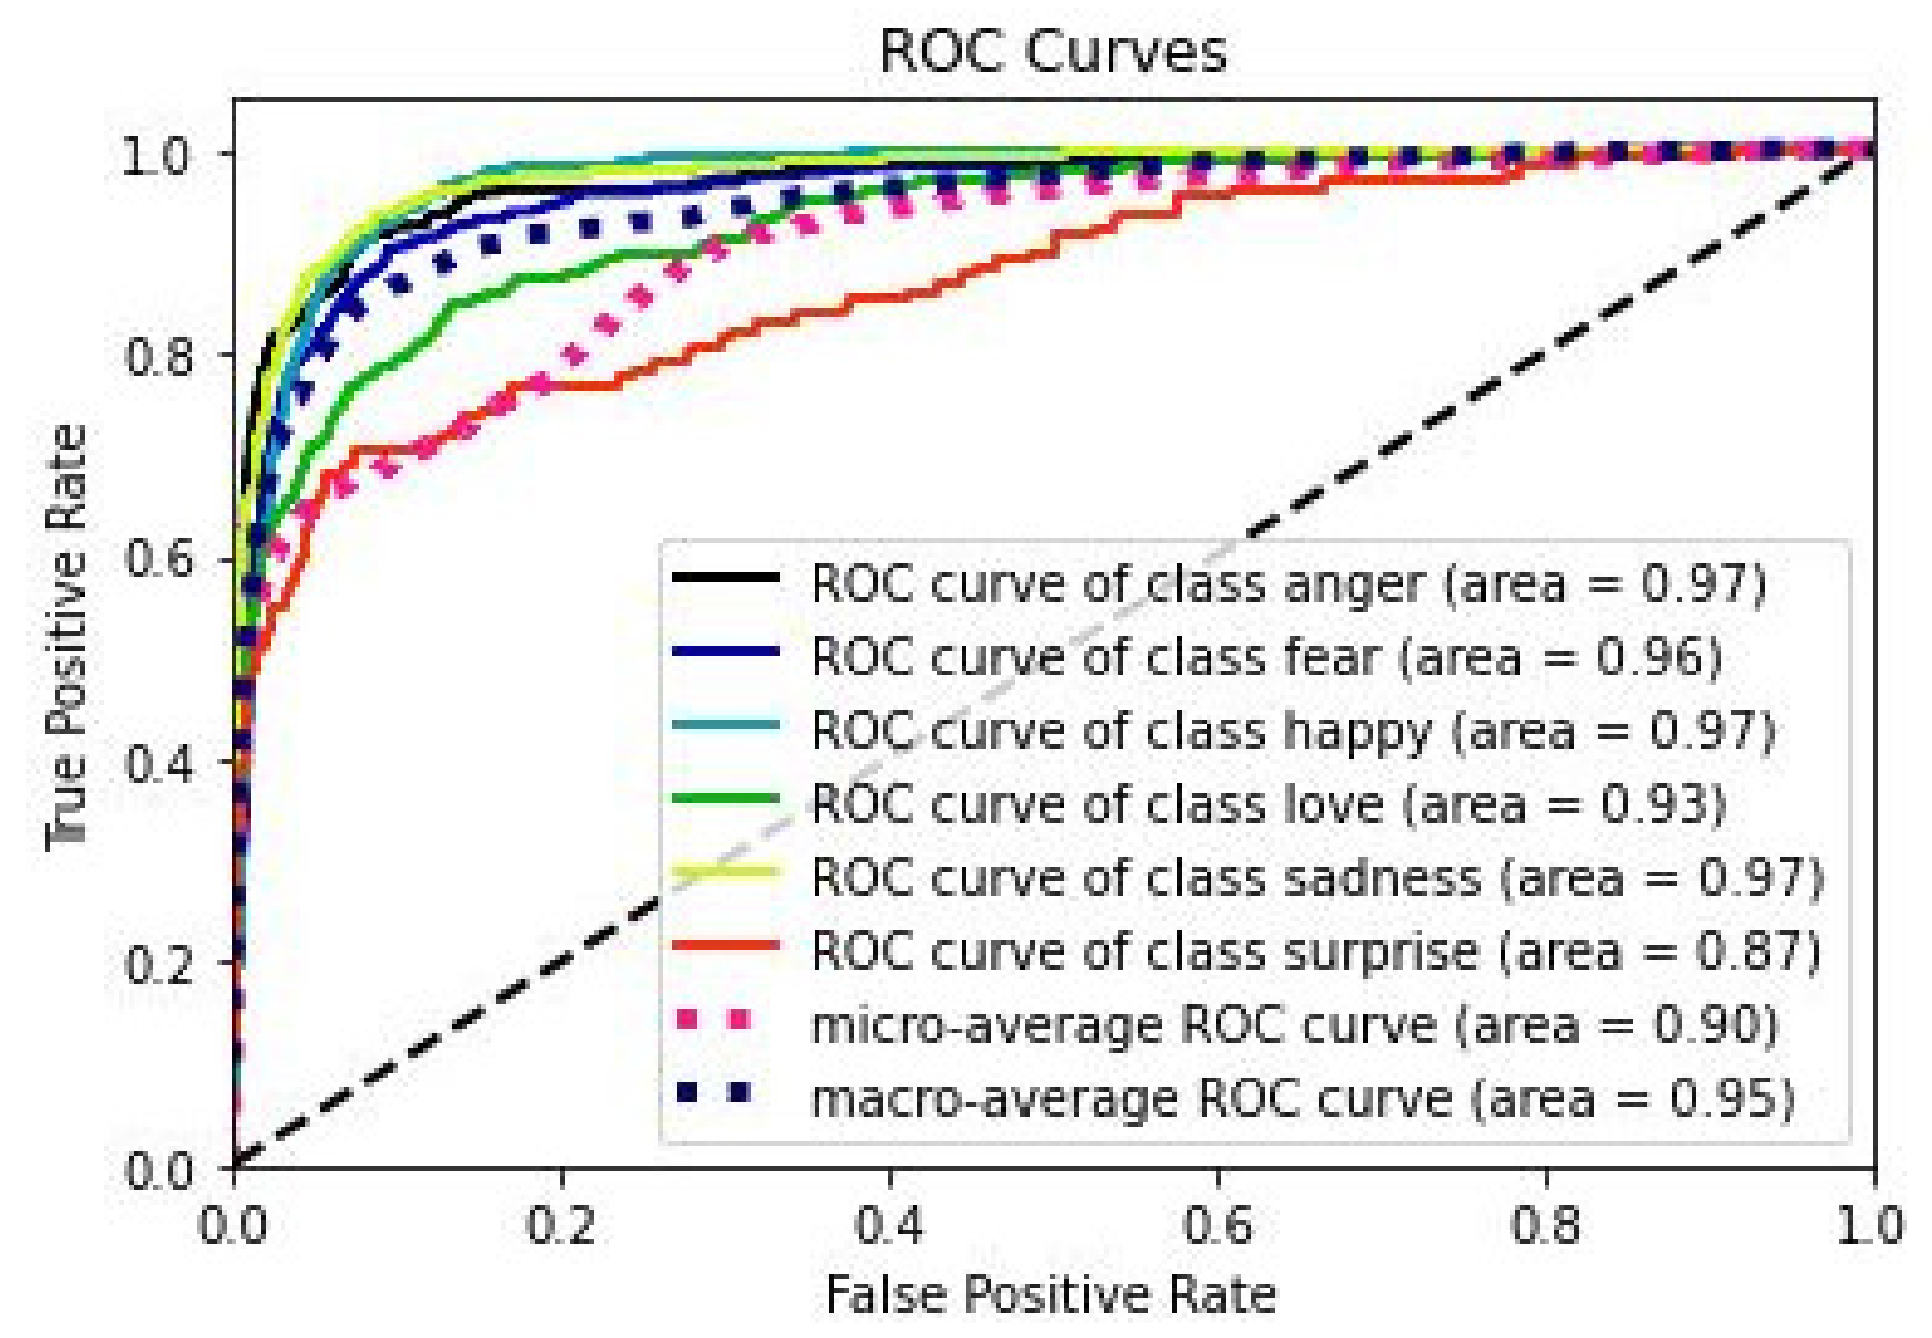
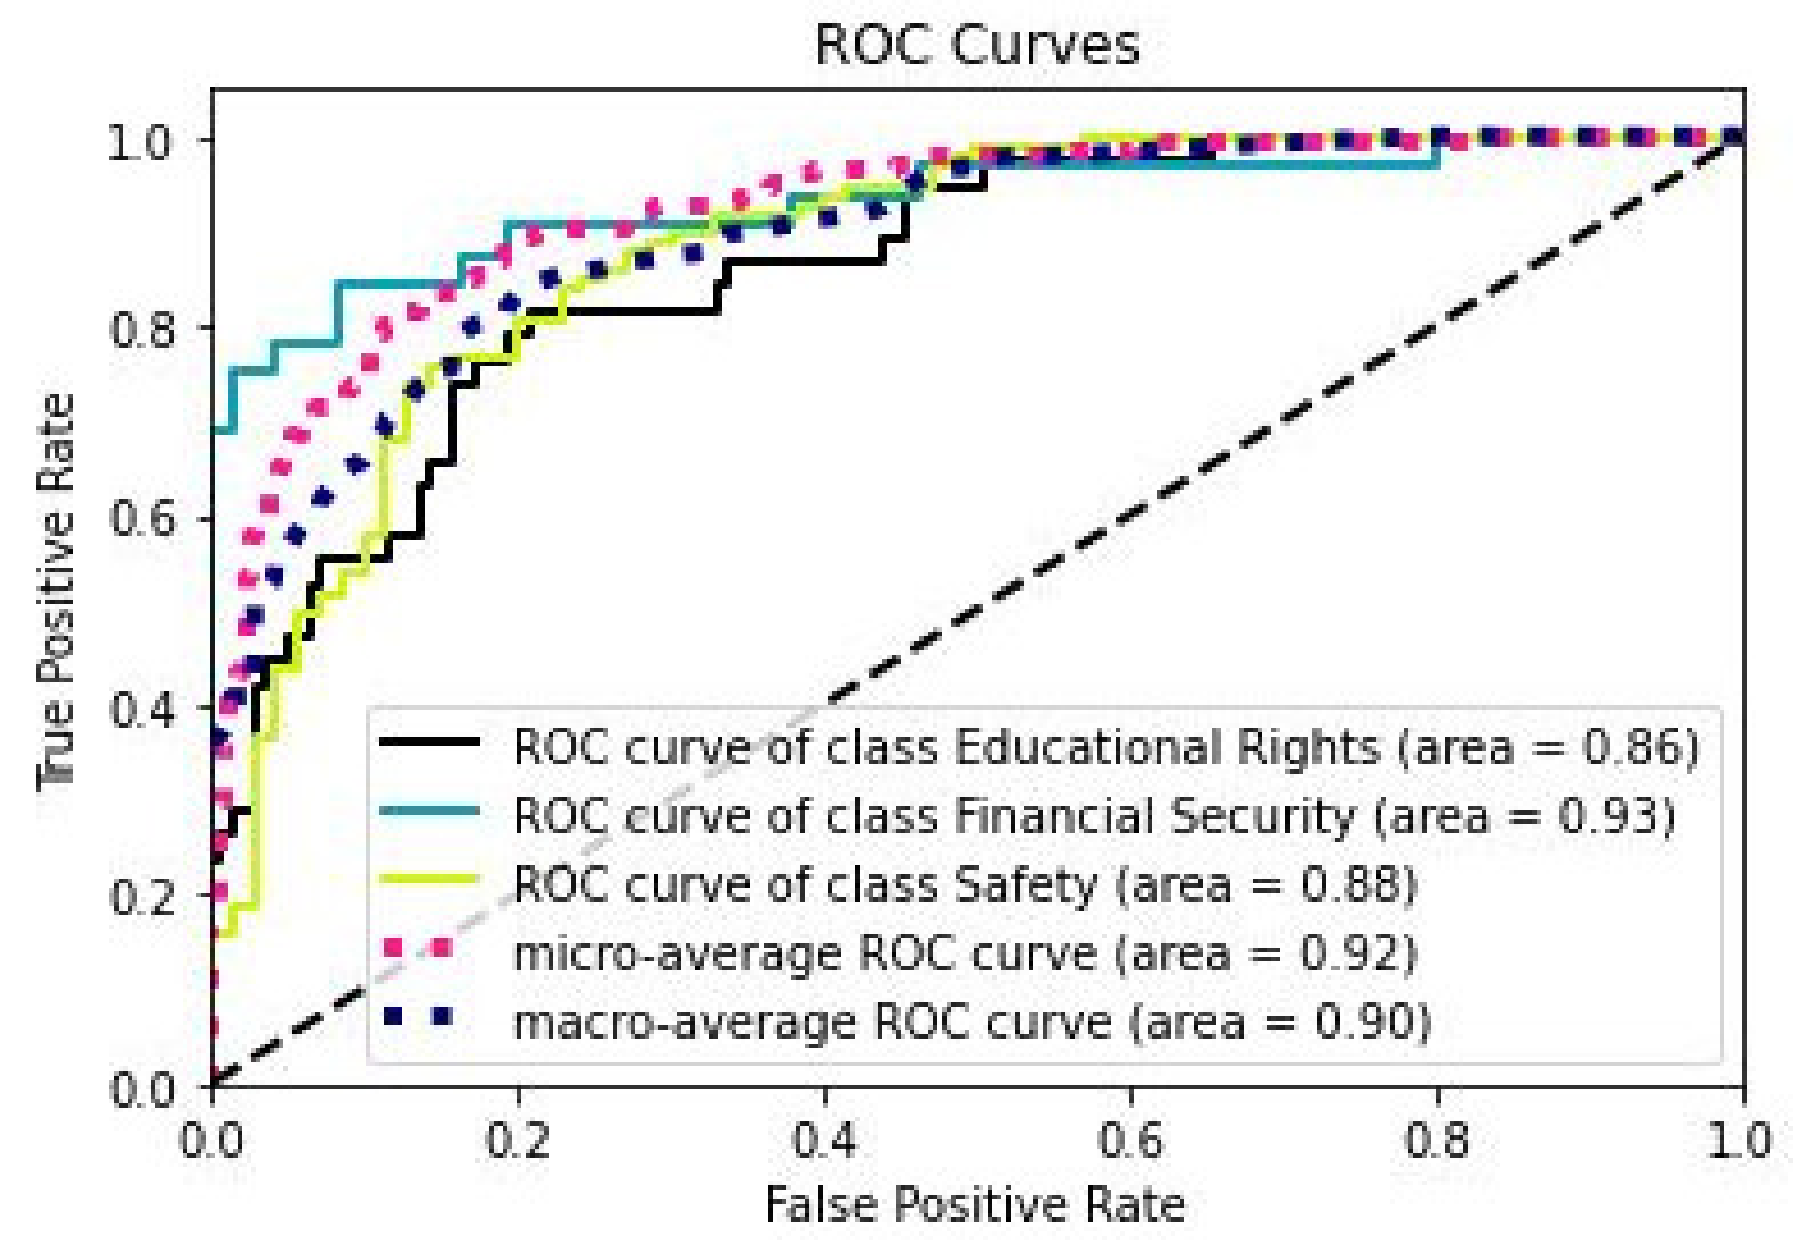
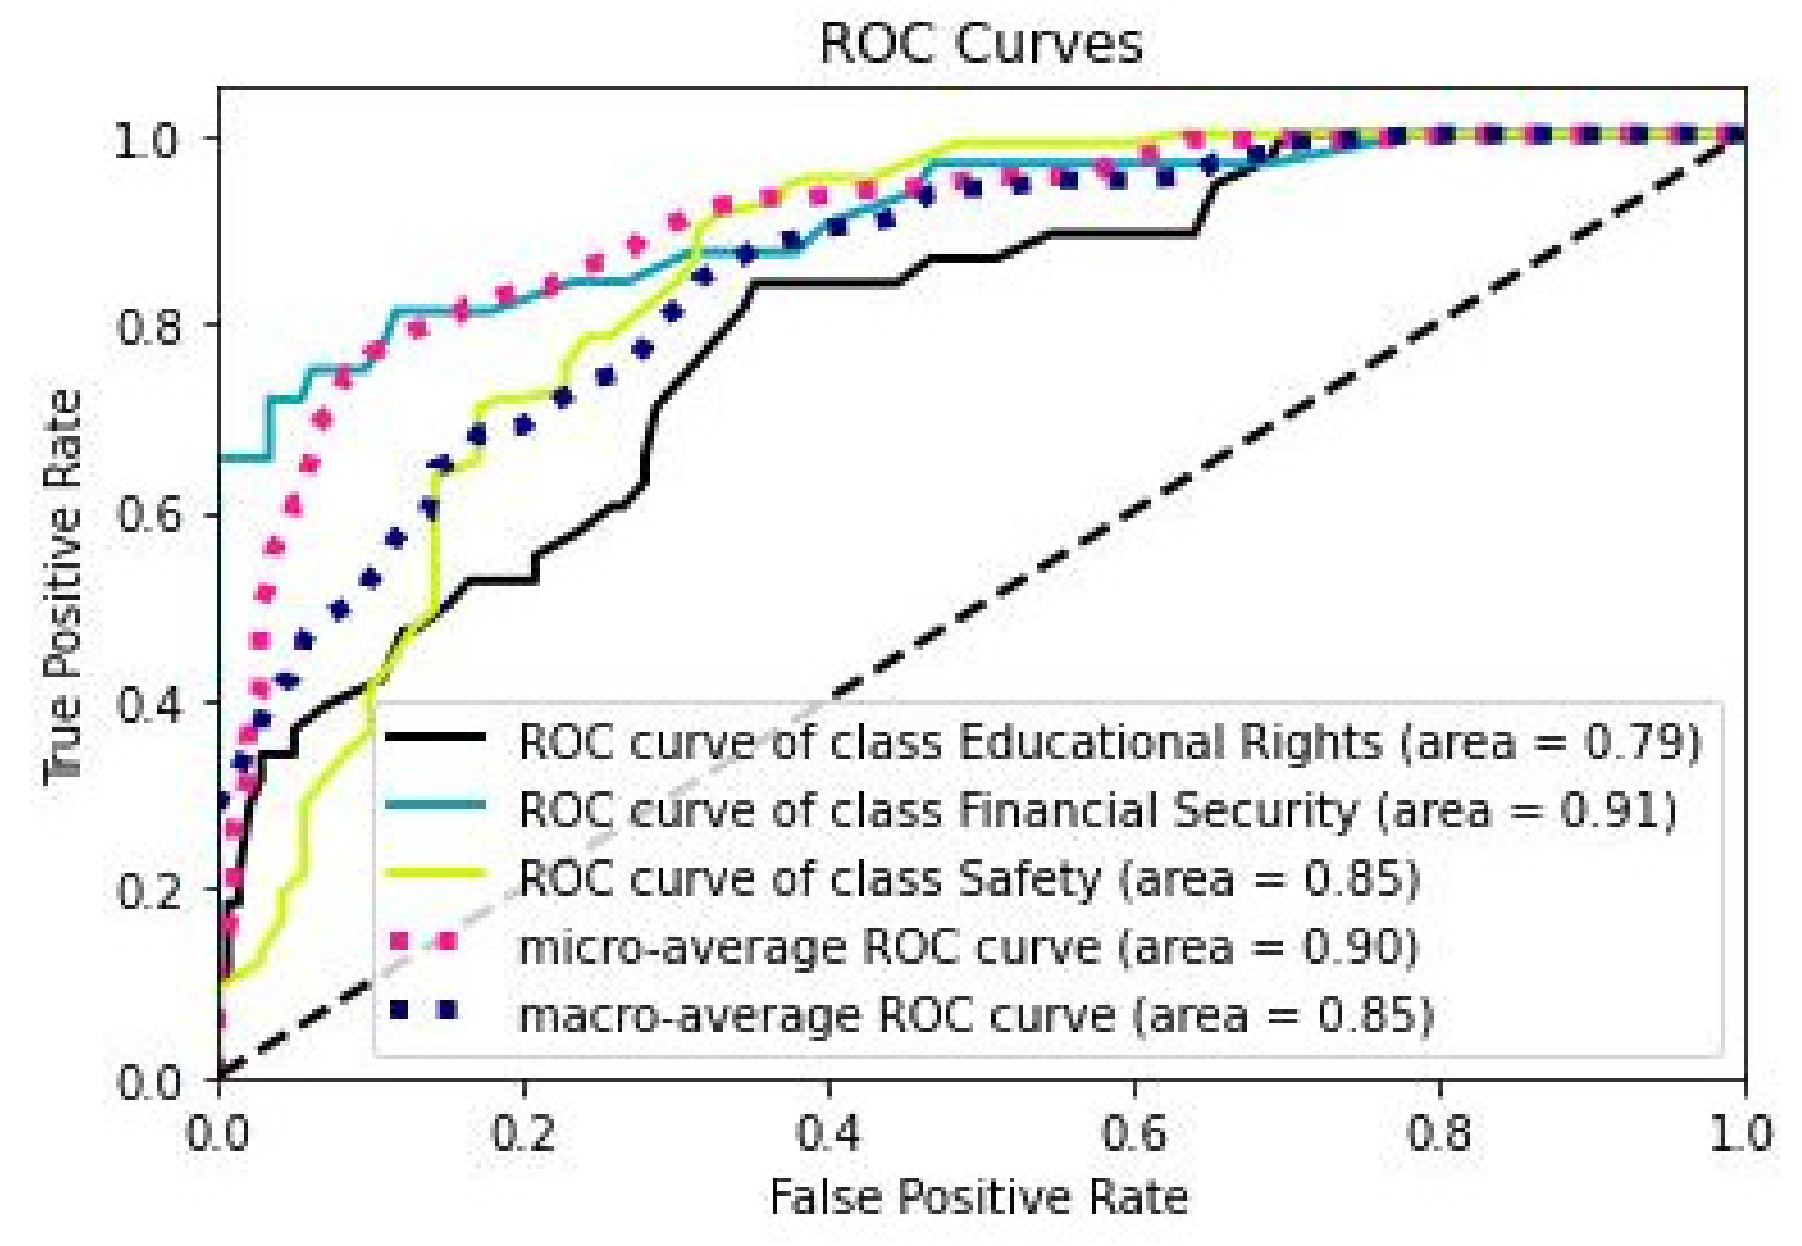
4. Experimental Work and Discussion of Results

The offline experiments were conducted to evaluate and identify the most accurate classification model for detecting societal emotions and emotional triggers. Further, the selected prediction models were deployed in a responsive web application to facilitate inference-making regarding public sentiment and the associated emotions and emotional triggers using real-time data. Online experiments on real-time data are demonstrated subsequent section to show the efficacy of the proposed framework in producing relevant analytics using several test scenarios.

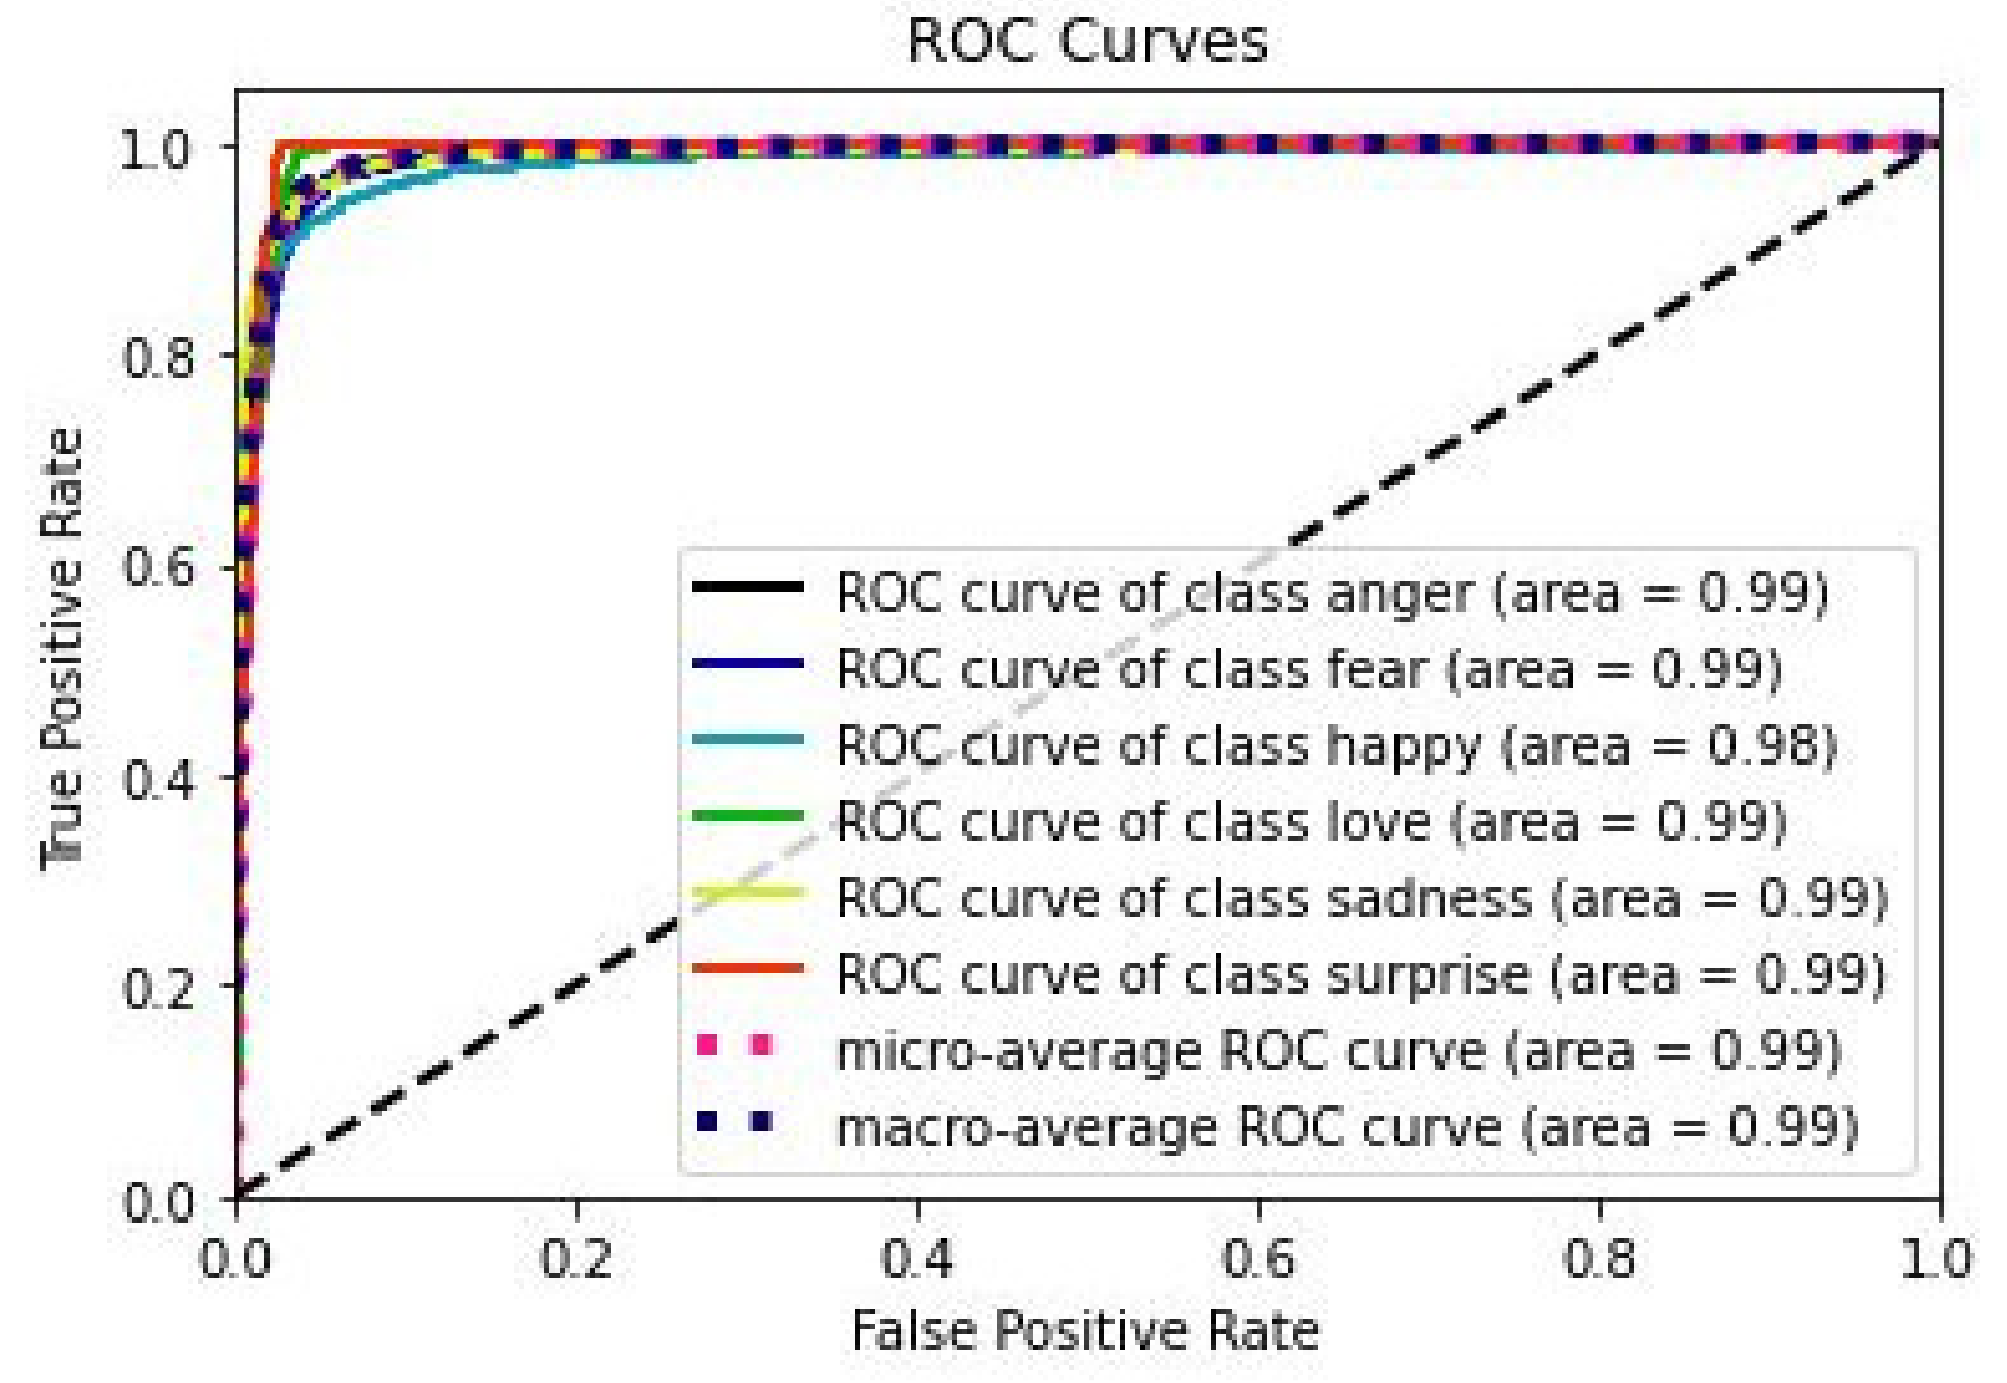
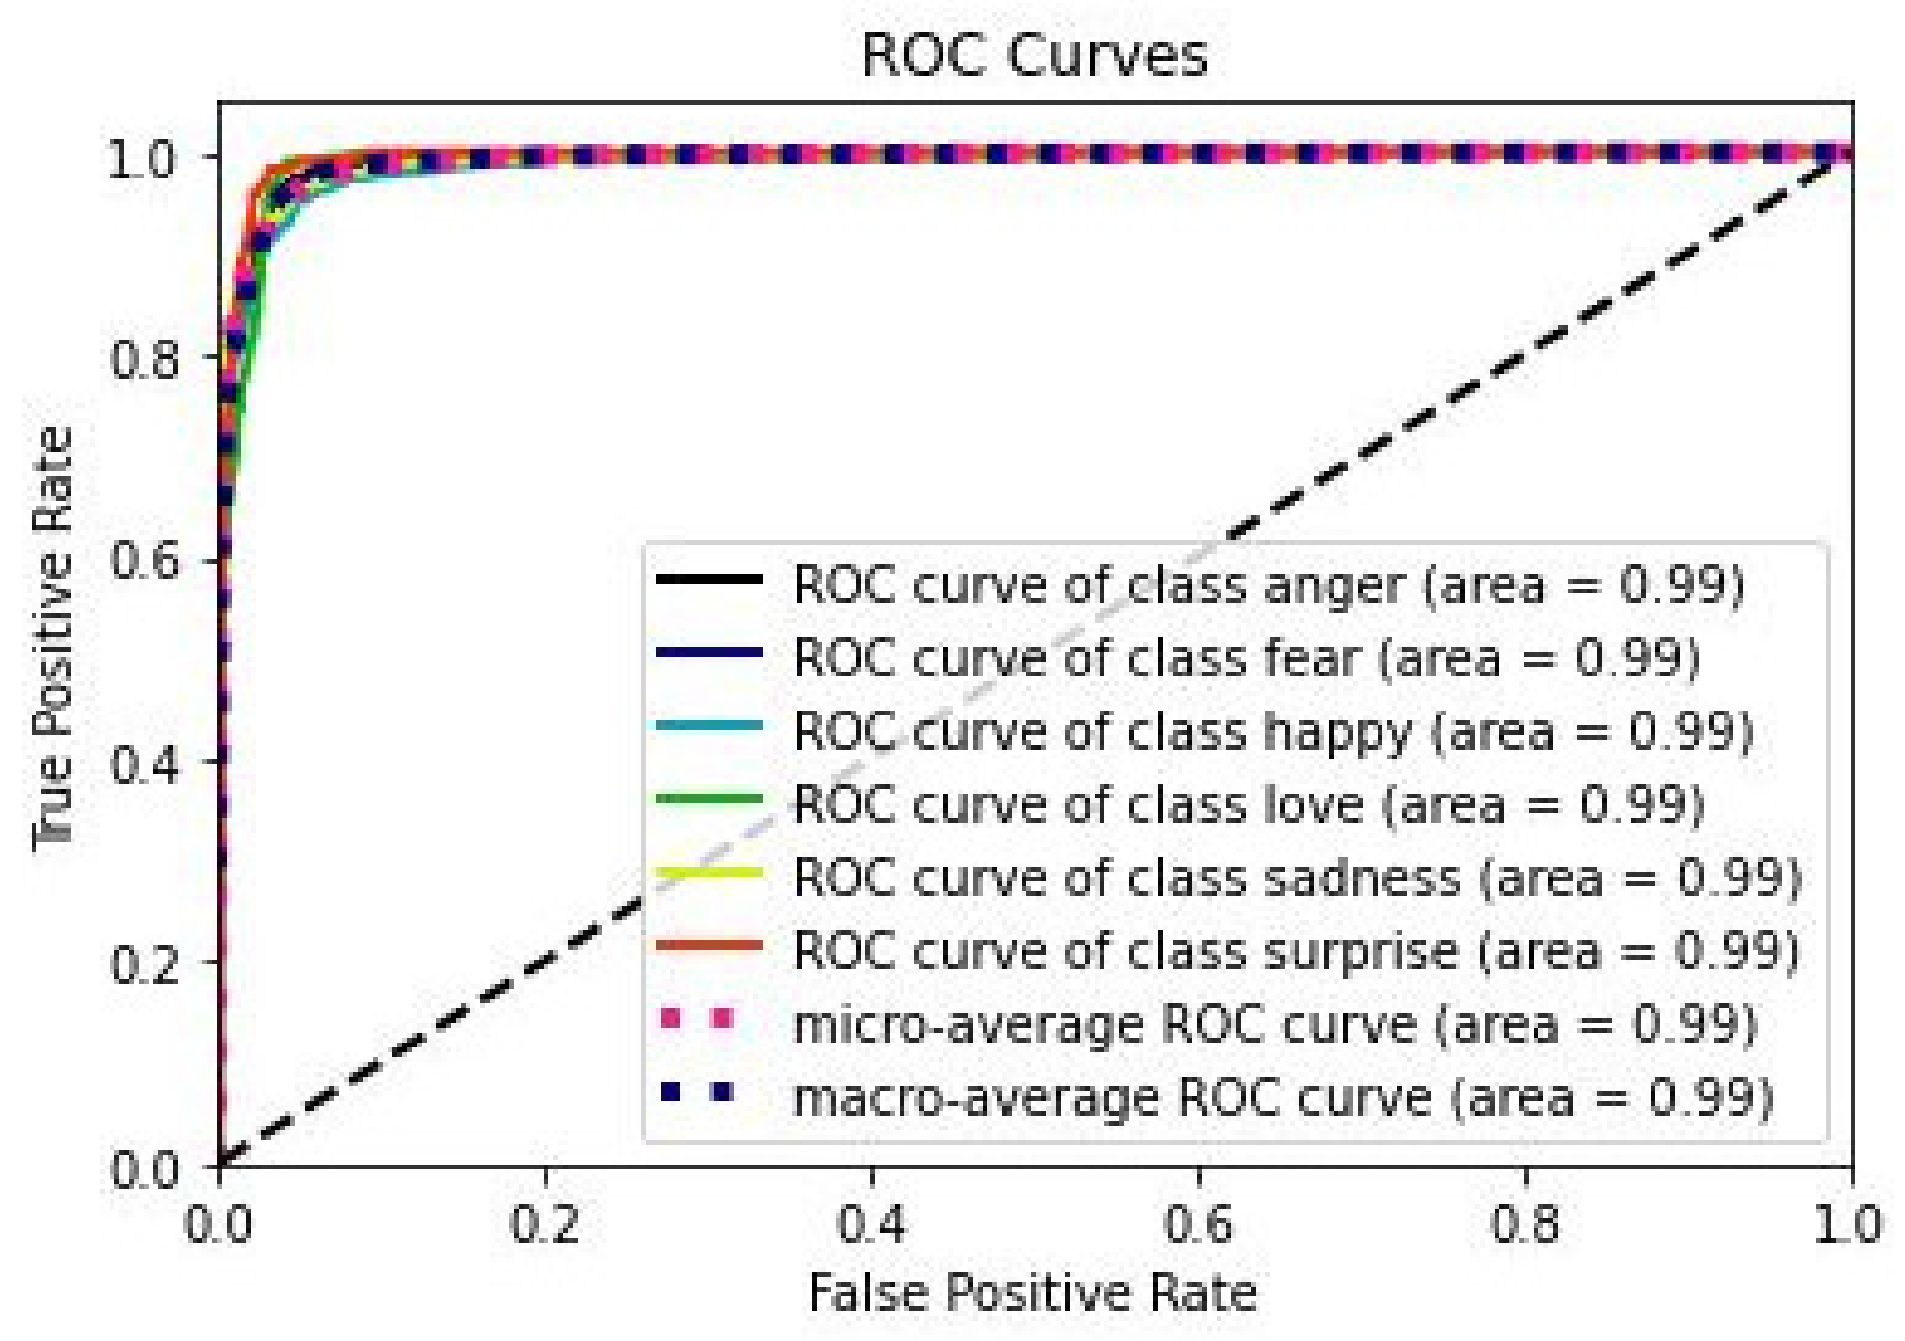
4.1. Offline Experiments

A comparative evaluation of the four predictive models trained on the normalized frequency bag of words (TF-IDF-BoW) feature vectors is summarized in Table 7, Table 8, Table 9 and Table 10. Classification models that reported successful classification results in the literature are used [59,60,61]. These are Logistic Regression, Linear SVC (Support Vector Classifier), Multinomial Naïve Bayes, and Random Forests. For the logistic regression model, the random state was set to 42, and the inverse regularization strength was set to one to control the penalty strength, which can also be effective in multiple classes. Furthermore, the weights of the classes were set to balanced mode, which automatically modifies the weights such that they are inversely proportional to the frequencies of the classes in the input data. For MultinomialNB, the prior class is assigned to none, so priors are adjusted according to the data. The random state was set to zero for the Random state to control the unpredictability of the sample’s bootstrapping, and a value of 100 trees was selected. Further, a value of 100 was set for iterations to run, and the penalization’s norm for LinearSVC was set to l2. Equations (1)–(4) show the mathematical formulations of the four classification models.
Logistics regression is based on using a logit function (e.g., Sigmoid) to estimate the probability, p , that a binary event, y , will occur. It determines each predictor, X i , independent contribution to the variance in the dependent variable, y , as shown in Equation (1):
Sigmoid   Equation   ( Logistic   Equation ) :   p = 1 1 + e y   ,   p = 1 1 + e β 0 + β 1 X 1 + β 2 X 2 + + β n X n
y = β + β 1 X 1 + β 2 X 2 + + β n X n   ,   where   X 1 ,   X 2   and   X n   are   explanatory   variables   and   y   is   the   dependent   variable  
Linear SVC (Support Vector Classifier) defines a hyperplane that optimizes the separation of the data points to their prospective classes in an n -dimensional space. These data points are thus near the border. It was calculated based on a mathematical model presented in Equation (2) to enable linear domain division [62].
y = W X + γ   ,   where   W   is   a   weighted   vector   ,   X   is   input   vector   ,   and   γ   is   bias
Multinomial Naïve Bayes is based on calculating the conditional probability of each aspect, k , given a predictor, p , as shown in Equation (3):
P k | p = P k * P ( p | k ) P p ,   for   class   k   and   predictor   p
Random Forests classification result is the average of the feature importance over all the trees as shown in Equation (4) [63]:
R F f i j = j     a l l   t r e e s n o r m   f i i j T ,   for   T   trees  
where   n o r m   f i i j   is   the   normalized   feature   importance   for   i   in   tree   j ,   which   is   expressed   as :
n o r m   f i i = f i i j     a l l   f e a t u r e s f i j ,   where   f i   is   the   feature   importance   expressed   as :
f i i = j   : n o d e   j   s p l i t s   o n   f e a t u r e   i   n i j k     a l l   n o d e s   n i k
The evaluation was carried out using a hold-out approach where 85% of the dataset was used for training the predictive models, and 15% of the dataset was used to test the models. Accuracy, Precision, Recall, and F-Measure are the performance evaluation metrics used throughout the evaluation of the experimental results. For each of the emotions or emotional trigger classes, such as ’happiness’, the classification results could be any of the following:
  • ▪ True Positive (TP): Predicted emotion is happiness, and the ground truth is happiness;
  • ▪ True Negative (TN): Predicted emotion is any non-happiness emotion, and the ground truth is any non-happiness emotion;
  • ▪ False Positive (FP): Predicted emotion is happiness emotion, while the ground truth is any non-happiness emotion;
  • ▪ False Negative (FN): Predicted emotion is any non-happiness emotion, while the ground truth is happiness.
Accuracy is the percentage of correctly labeled tweets and can be calculated using Equation (5).
A c c u r a c y = T P + T N T P + F P + F N + T N
Precision is the percentage of correctly predicted positive tweets relative to all positive predictions of each class. Precision represents the sensitivity of the prediction model and can be calculated using Equation (6).
P r e c i s i o n = T P T P + F P
Recall is the percentage of correctly predicted positive tweets relative to all positive tweets in the dataset. Recall represents the completeness of the prediction and can be calculated using Equation (7).
R e c a l l = T P T P + F N
Finally, the F-Measure is the harmonic mean of the recall and precision and is the most representative measure as it is not affected by the class imbalance, it can be calculated using Equation (8).
F M e a s u r e = 2 * R e c a l l * P r e c i s i o n R e c a l l + P r e c i s i o n
Table 9 illustrates the model-level average Accuracy, Precision, Recall, and F-Measure of Logistic Regression, Linear SVC (Support Vector Classifier), Multinomial Naïve Bayes, and Random Forests for emotion classification. The experimental results show that the Linear SVC classifier outperformed other classifiers in terms of overall accuracy, precision, recall, and had an F-measure of 91%. Hence, Linear SVC was selected to build the prediction model for emotions in the educational tweets in the real-time system.
Table 9. Emotions classification experiments—Model-based results.
ClassifierAccuracyPrecisionRecallF-Measure
Logistic Regression90.0090.0090.0090.00
Linear SVC91.0091.0091.0091.00
Multinomial Naïve Bayes67.0077.0067.0060.00
Random Forests90.0090.0090.0090.00
Detailed analysis of prediction quality per class, i.e., per emotion, is presented in Table 10. By analyzing class-wise prediction quality and focusing on the SVC, it is clear that the predictive model is reliable in detecting the correct target emotion with high accuracy and precision, as well as retrieving all related samples to a particular emotion with high recall. The values of precision for the majority class emotions: “Happiness”, “Sadness”, “Fear, and “Anger” range between 90% and 93%, which indicate that the selected predictive model is sensitive and very precise in detecting the exact emotion in the retrieved chatter data. Moreover, by considering the recall value for the same model, SVC, and for the same majority class emotions, we can see that the recall value ranges between 87% and 95%, which further indicates the completeness of the selected predictive model. It is able to retrieve most of the samples related to a particular emotion. In contrast, “Surprise” and “Love” achieved slightly lower accuracy compared to “Happiness”, “Anger”, “Fear”, and “Sadness”. This is due to the fact that the percentage of samples representing “Happiness”, “Fear”, “Sadness”, and “Anger” surpass the percentage of samples belonging to “Surprise” and “Love” in the experimental chatter data by 88%. Furthermore, Figure 3, Figure 4, Figure 5 and Figure 6 represent the Receiver Operating Characteristic (ROC) curves for the four classifiers, which show excellent performance, with the area under the curve ranging between 80 and 99 for the three most prominent emotions, i.e., Anger, Fear, and Happiness.
Table 10. Emotions classification experiments—Class-based results.
ClassMeasureClassifier
Logistic RegressionLinear SVCMultinomial NBRandom Forests
AngerAccuracy0.900.870.270.86
Precision0.890.910.950.93
Recall0.900.870.270.86
F-measure0.900.890.430.89
FearAccuracy0.850.880.260.85
Precision0.890.900.930.89
Recall0.860.880.270.86
F-measure0.870.890.410.87
HappinessAccuracy0.880.930.980.93
Precision0.940.910.610.88
Recall0.880.930.990.94
F-measure0.910.920.750.90
LoveAccuracy0.970.810.070.74
Precision0.720.811.000.83
Recall0.970.810.080.75
F-measure0.830.810.140.78
SadnessAccuracy0.920.940.920.93
Precision0.950.930.690.93
Recall0.920.950.930.93
F-measure0.930.940.790.93
SurpriseAccuracy0.850.740.010.78
Precision0.690.811.000.80
Recall0.850.740.020.78
F-measure0.760.770.030.79
Table 11 illustrates the model-based average Accuracy, Precision, Recall, and F-measure of the Logistic Regression, Linear SVC, Multinomial Naïve Bayes, and Random Forests predictions models for emotional trigger (i.e., aspect) classification. The Logistic Regression classifier outperformed all other classifiers in terms of overall accuracy, recall, and F-measure of 81%, and 83% precision. Table 12 demonstrates the class-wise experimental prediction results, i.e., prediction accuracy per emotional trigger. Due to the data imbalance, the class-wise comparison shows significantly improved performance of the four classification models toward the aspect of “Safety”, which was most represented in the chatter data constituting 54% of the samples. This is expected as “Safety” would be the most prominent concern of students, parents, and educators. However, despite the data imbalance toward the class “Safety”, by considering the performance quality of the Logistic Regression prediction model that produced the best model-based prediction results, we can see that the prediction accuracy for the minority classes (i.e., “Educational Quality and Educational Rights” and “Financial Security”), are within an acceptable range for this type of data. Given the mixed nature of human feelings and concerns, some tweets may be related to multiple aspects, especially when it comes to “Educational Rights” and “Financial Security” this explains the slightly reduced prediction accuracy of these two aspects. Furthermore, Figure 7, Figure 8, Figure 9 and Figure 10 represent the ROC curves for the four classifiers, which show very good performance with an area under the curve ranging between 88 and 93 for the three aspects using Logistic Regression.
Table 11. Aspects-based sentiment analysis overall results.
ClassifierAccuracyPrecisionRecallF-Measure
Logistic Regression81.0083.0081.0081.00
Linear SVC77.0078.0077.0077.00
Multinomial Naïve Bayes70.0080.0070.0063.00
Random Forests77.0079.0077.0075.00
Table 12. ABSA classification results per-class.
ClassMeasureClassifier
Logistic RegressionLinear SVCMultinomial NBRandom Forests
SafetyAccuracy0.850.851.000.97
Precision0.880.800.670.75
Recall0.860.861.000.97
F-measure0.870.830.800.84
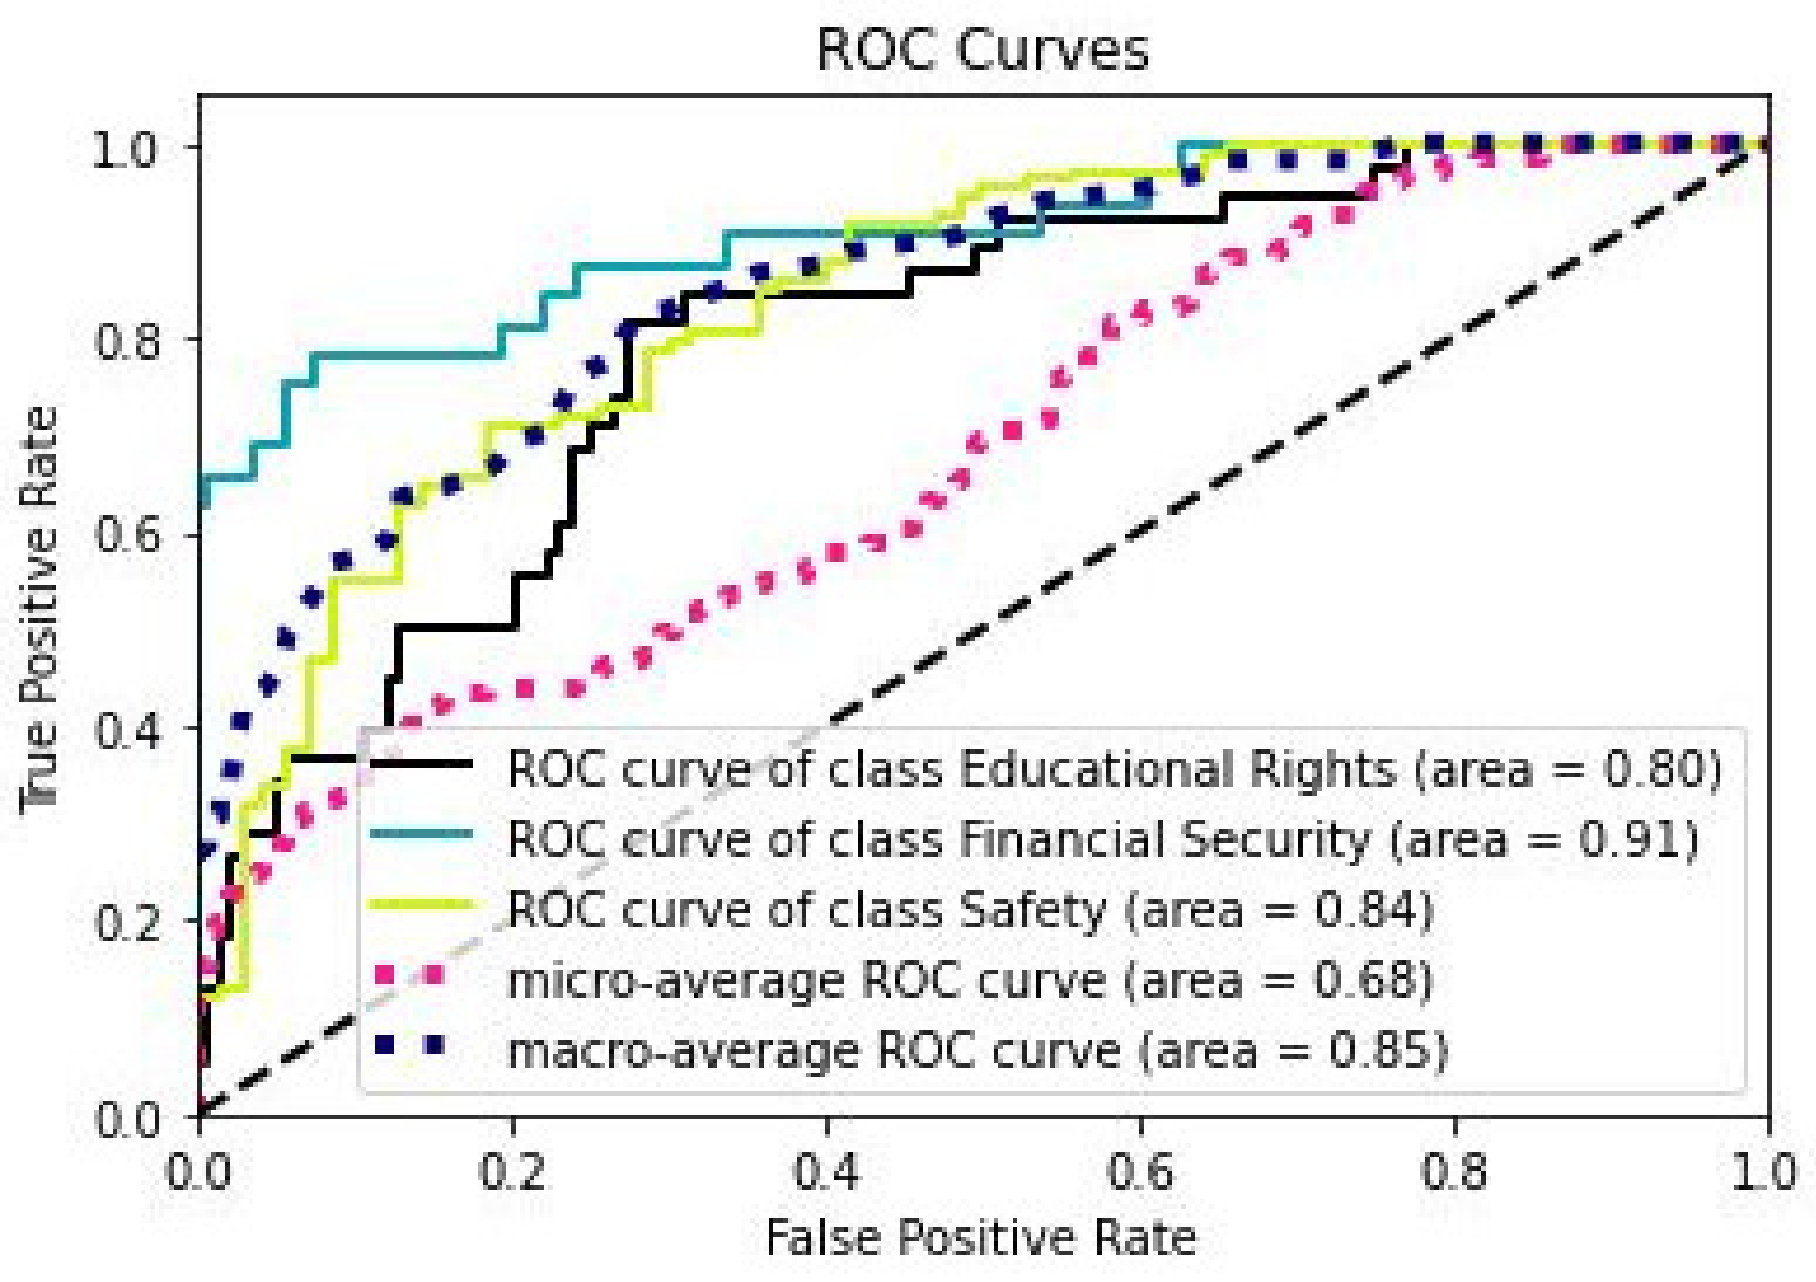
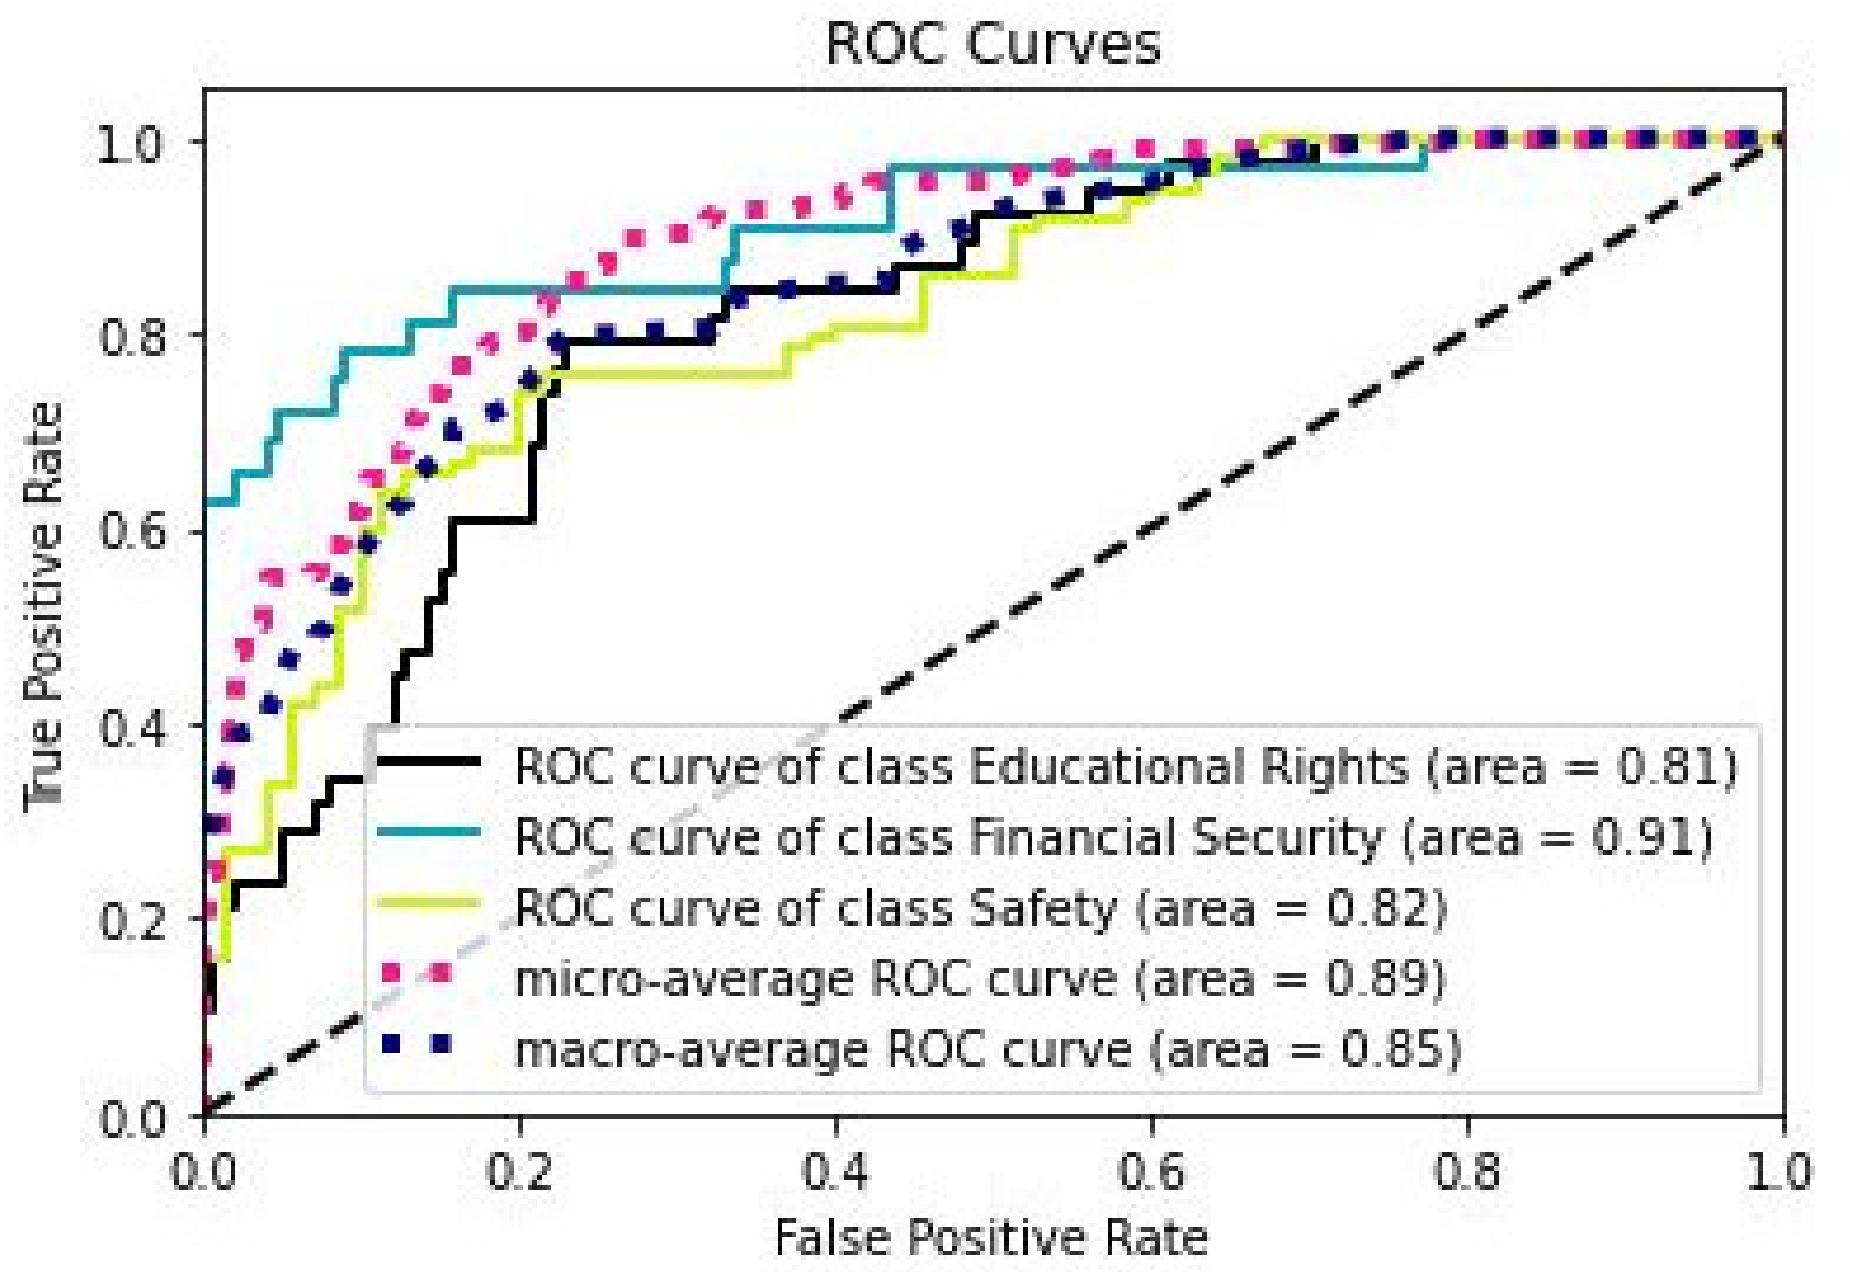
Education Quality and Educational
Right
Accuracy0.780.600.070.40
Precision0.590.591.000.79
Recall0.790.610.070.39
F-measure0.680.600.130.52
FinancialSecurityAccuracy0.650.700.550.60
Precision1.001.001.000.92
Recall0.650.700.550.60
F-measure0.790.820.710.73

4.2. Online Experiments

In this section, we demonstrate several real-time test scenarios conducted through a responsive website to validate the accuracy of the proposed framework in inferring insights about societal emotions and emotional triggers relevant to the educational sector post-COVID-19. These scenarios are based on various parameters to validate whether the proposed analytics framework is capable of inferring accurate emotional insight. Table 13 summarizes real-time test scenarios.

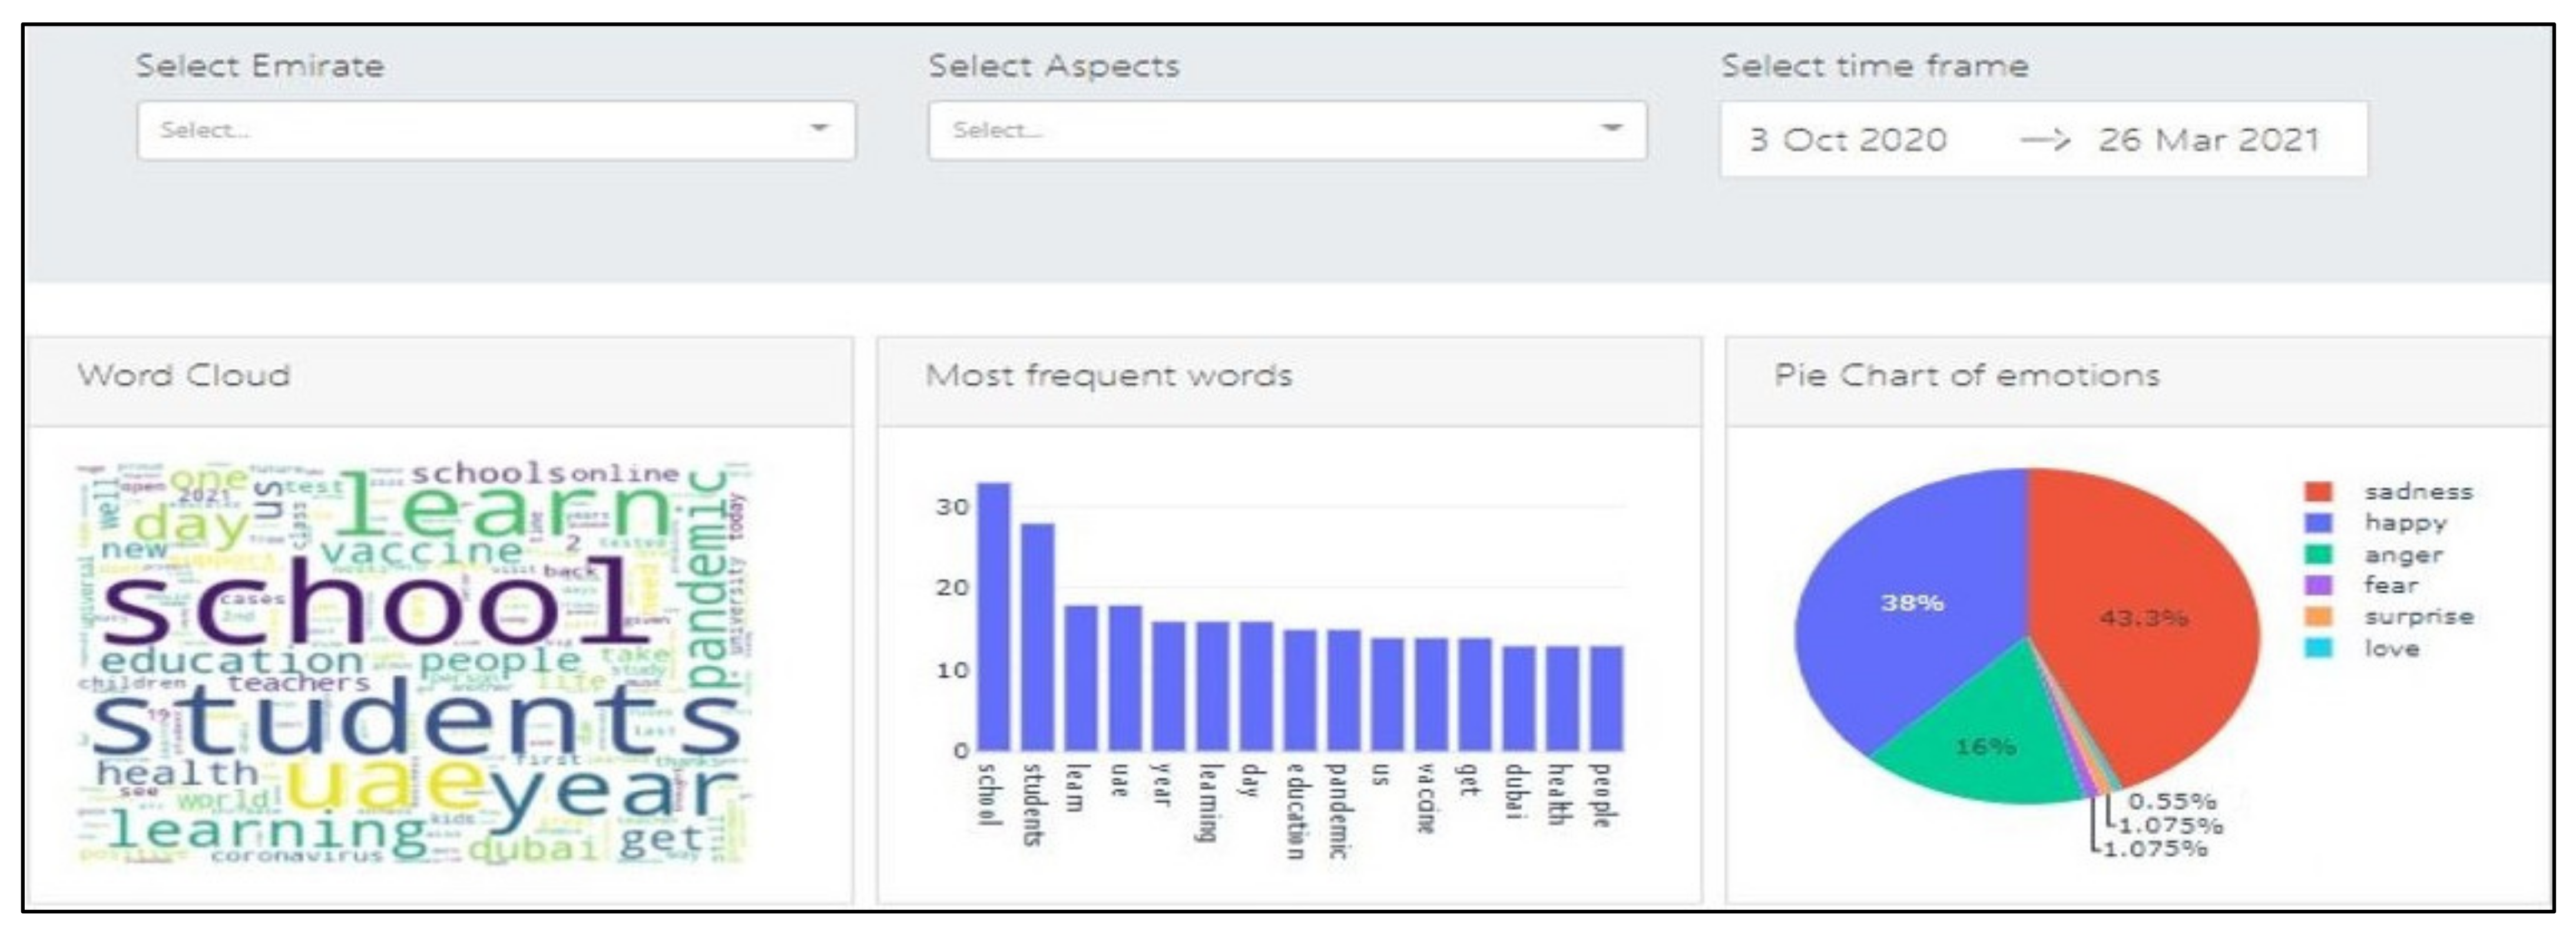
4.2.1. Testing Scenario 1

In this testing scenario, we demonstrate the analytics of the Twitter chatter data across the UAE from 03 October 2020 to 26 March 2021. Figure 11 shows the resulting sentiment and emotion analytics. The word cloud and the most frequent words bar charts show that “school” and “students” were the most frequent words in the retrieved chatter data confirming the relevance of the retrieved chatter data to the education sector. In addition, the emotion pie chart shows that the emotions of “sadness” and “happiness” dominated the majority of the UAE chatter in the specified timeframe with percentages of 43.3% and 38%, respectively.

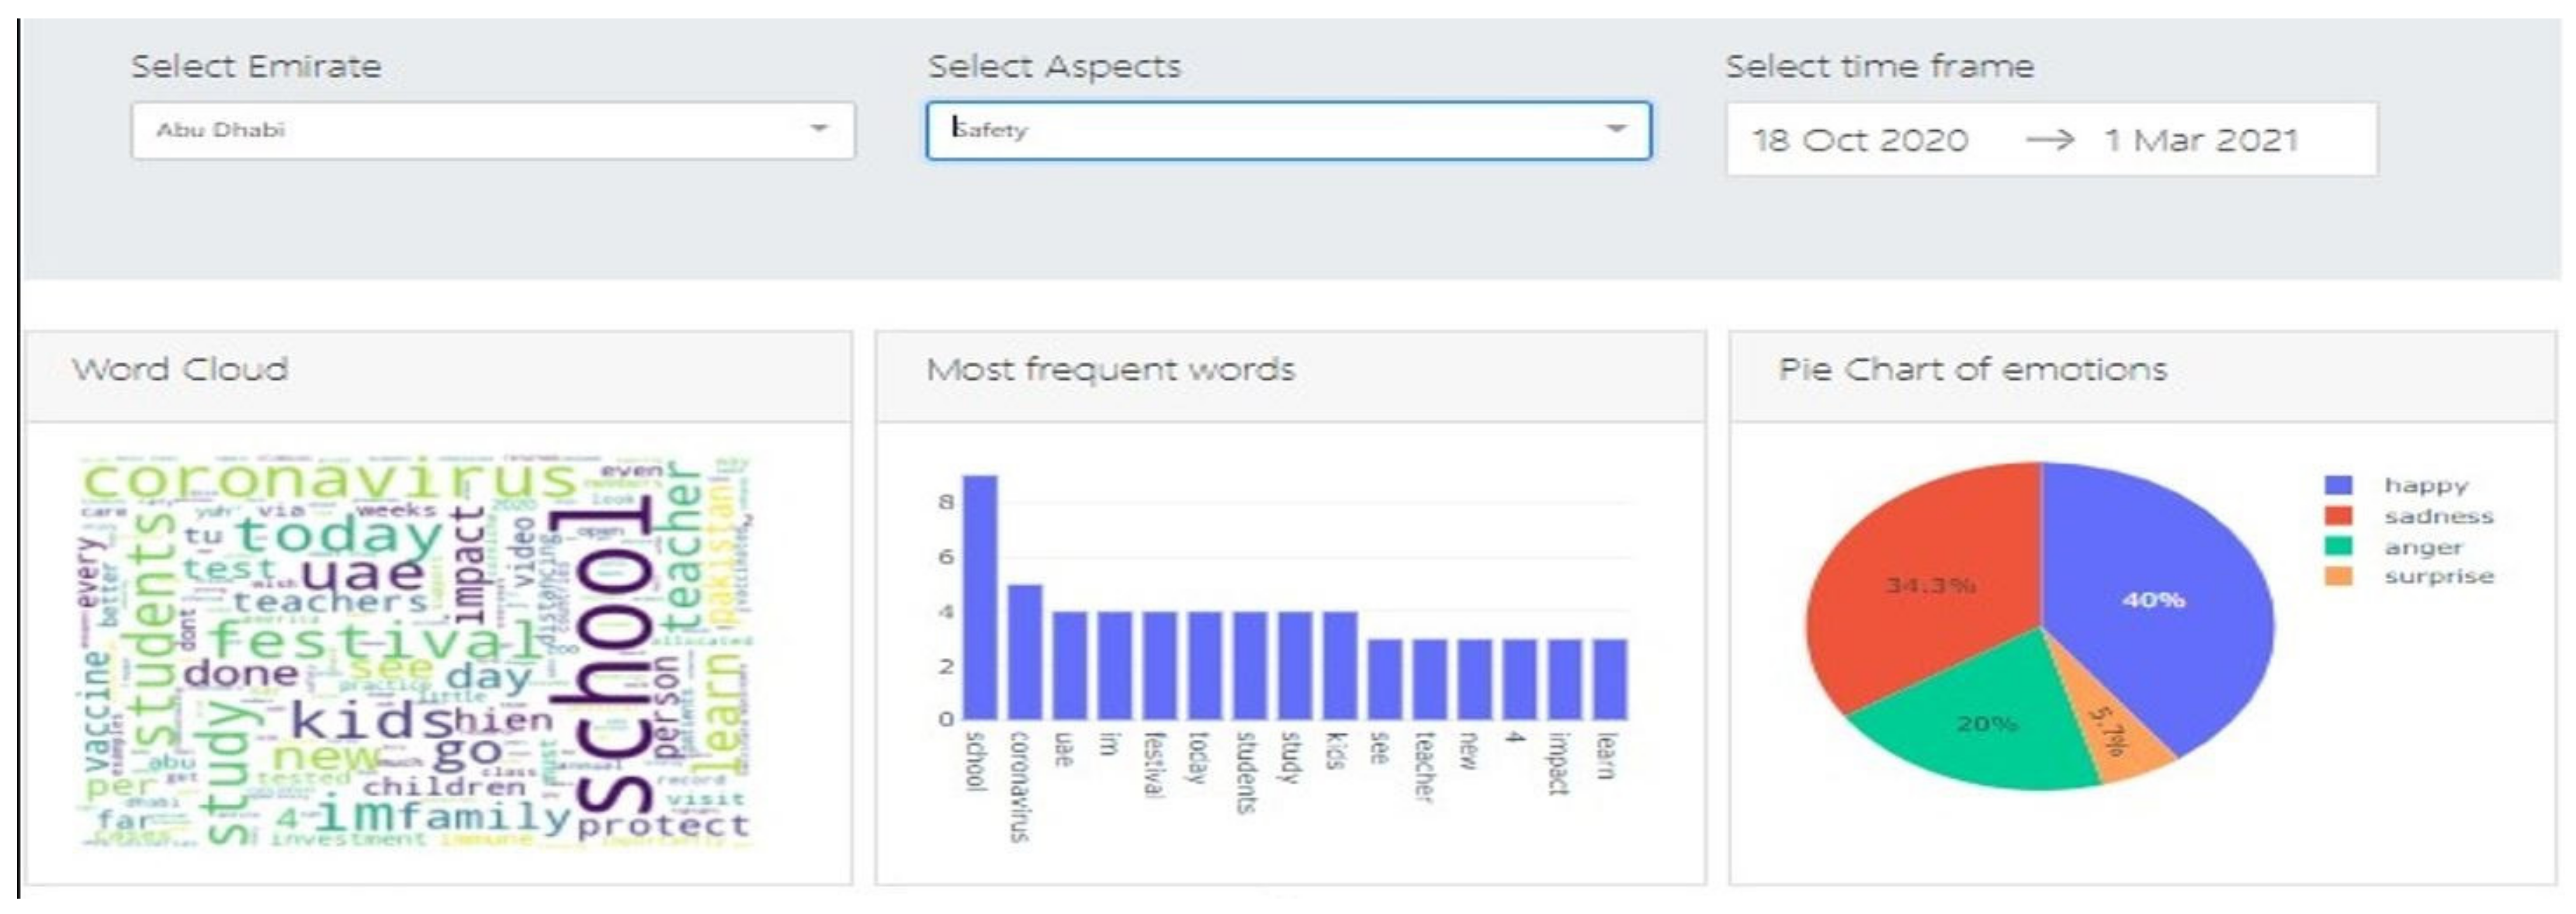
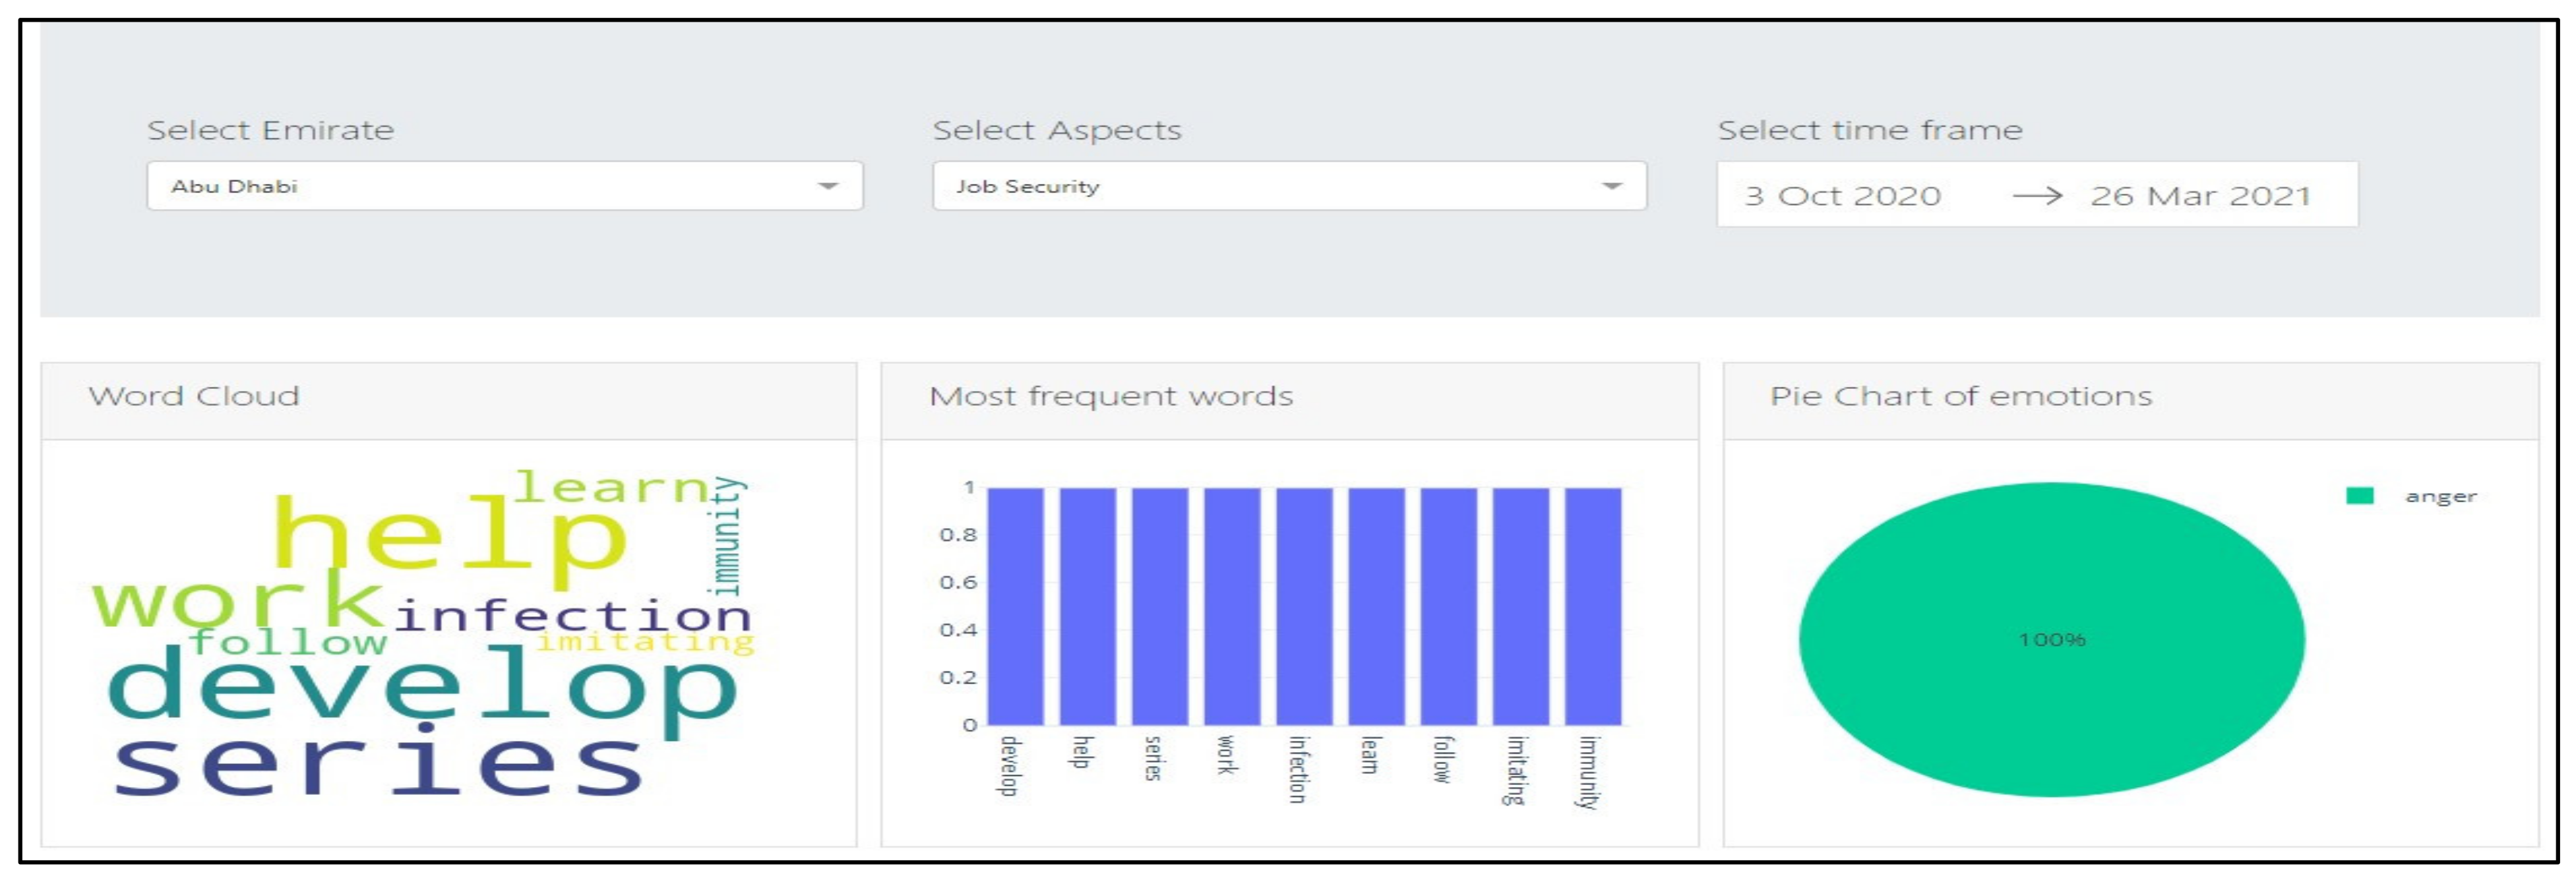
4.2.2. Testing Scenario 2

To obtain more fine-grained analytics, in the second testing scenario, we demonstrate the analytics for a specific location (i.e., Abu Dhabi), a smaller timeframe (18 October 2020 to 1 March 2021), and we focus the analysis on a specific emotional trigger/aspect (Safety). The results are shown in Figure 12. The emotional analytics show that the “Happy” emotion is the most prominent societal emotion relevant to “Safety” in the emirate of Abu Dhabi, surpassing all other emotions detected in the public chatter related to education. By looking at the word cloud and word frequency charts, we can see “school”, “Learn”, “student”, and “teacher” among the most frequent words indicating the relevance of the chatter data to the educational domain. We can infer that the public felt happy about the Safety measure taken locally to protect the school students. Prior to the selected timeframe, the Department of Education and Knowledge in Abu Dhabi (ADEK) has released the reopening policies, guidelines, and protocols with a detailed framework, including the preventive measures to be followed and space management, the timeline for resumption of operation, entry requirements for both staff and students, as well as the criteria for reopening; covering all expected and thought-through situations [64]. Therefore, it is evident that the public had a positive attitude and opinions toward the safety measures followed at Abu Dhabi schools.

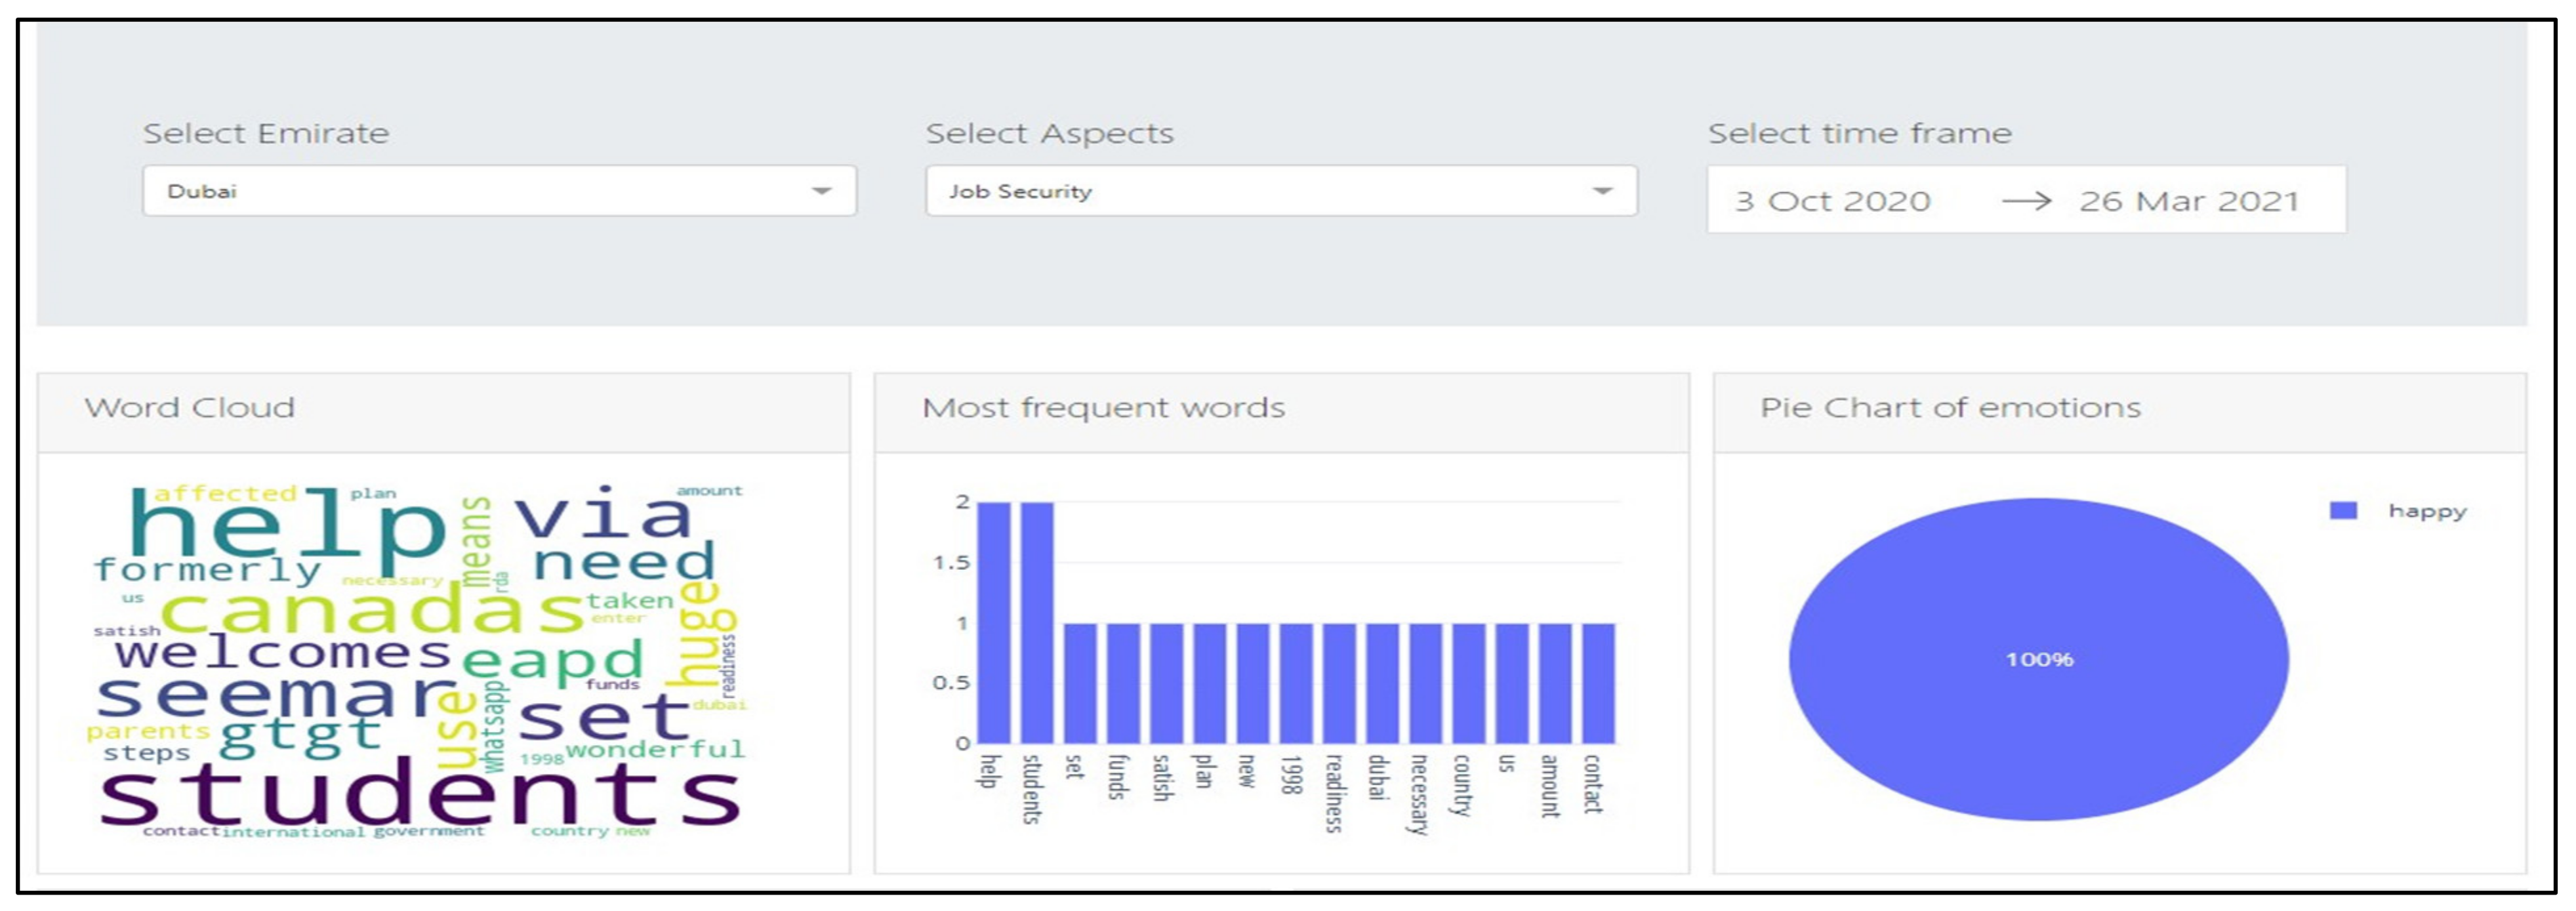
4.2.3. Testing Scenario 3

The third testing scenario focuses on the same timeframe used in scenario#1 but targets a different emirate (Dubai) and focuses on a specific emotional trigger (Financial Security). The results are illustrated in Figure 13. Interestingly, despite the fact that the analytics for the first test scenario over the same timeframe revealed mixed societal emotions across all emirates, this test scenario shows that happiness was prominent in Dubai relevant to “Financial Security”. We can infer that the public of the Emirate of Dubai felt positive and happy about financial security and were not worried about losing their jobs nor worried about school tuition and fees. This can be further supported by the overall increase in the employment rate of the non-oil private sector in Dubai during the specified timeframe [65].

4.2.4. Testing Scenario 4

To construct a comparison with test scenario#3, scenario#4 focused on the same aspect and timeframe (Financial Security, 03 October 2020 to 26 March 2021) yet targeted a different emirate (Abu Dhabi). Figure 14 shows the emotion analytics results. By looking at the word cloud, we can see “develop” and “Help” are the most frequent in the selected timeframe and in the emirate of Abu Dhabi. In addition, the analytics show that “Anger” was the most prominent emotion in Abu Dhabi relevant to the selected aspect “Financial Security”. These analytics are quite representative of the educational sector situation in the selected timeframe when it comes to financial security, as many teachers lost their jobs after the COVID-19 outbreak. Many private educational institutes released teaching and academic staff, which resulted in a great state of anger among the public. As a result, the residents of the emirate of Abu Dhabi felt negative about job security and were concerned about their jobs.

5. Conclusions

The COVID-19 pandemic has affected every sector worldwide since 2020, and education is no exception. COVID-19 has impacted the mode of delivery as educational institutions around the globe were forced to switch to online learning. This sudden change had an evident influence on the mental health of the public, including educational staff, students, and parents. Consequently, the public expressed their concerns on different social media platforms, mainly Twitter. Although multiple research works have explored the impact of distance learning on the public’s well-being through social media, the literature was still limited in the data collection method, study focus, target audience, geographical coverage, and timeframe. To address these limitations in existing research works, his paper proposed an implicit ABSA framework that identifies the emotions and classifies the associated aspects of emotional triggers from education-related Twitter chatter data in the UAE. The proposed framework aims to provide in-depth insights into the sources of the public’s concerns relevant to the educational sector through representative spatiotemporal analytics. These comprehensive insights support decision-makers in the educational sector. The context of COVID-19 was a showcase of an application where this framework’s results and contribution are most evident; however, the framework is applicable to various contexts and sectors. To the best of the authors’ knowledge, this is the first study implementing ABSA for education-related data collected from Twitter during the COVID-19 pandemic and focusing on well-being factors. The experimental results for emotion classification show that the Linear SVC classifier outperformed other classifiers in terms of overall accuracy, precision, recall, and had an F-measure of 91%. Moreover, the Logistic Regression classifier outperformed all other classifiers with overall accuracy, recall, and had an F-measure of 81%, and a precision of 83% for aspect classification. In online experiments, using UAE COVID-19 education-related data, the analytics show high relevance with the public concerns around the education process that were reported during the timeframe of the experiment. These results confirm that the proposed analytical framework can produce reliable insights into public emotions and emotional triggers to aid decision-makers in making informed decisions in different real-life events.
This study was focused on English tweets, whereas more representative insights can be inferred by analyzing Arabic, Hindi, and other languages that are spoken in multilingual countries. In the future, this framework will be extended to cover multilingual analytics and offer continuous insights on several societal events relevant to other sectors, not only the educational sector.

Author Contributions

H.I. conceived the idea, proposed the analytics framework, designed the system, and contributed to writing, results analysis, and supervision. N.H. contributed to writing, results analysis, and system design and modeling. A.K. contributed to writing and system design. R.E. contributed to implementation, data curation, and results analysis. All authors have read and agreed to the published version of the manuscript.

Funding

This research project was funded by the Office of Research & Sponsored Programs, Abu Dhabi University.

Institutional Review Board Statement

The paper does not use human and animal subjects as part of the conducted experiments. Experiments were conducted on Twitter chatter data, and the dataset is anonymized in compliance with the Twitter privacy policy.

Informed Consent Statement

The experiments do not involve any individual details. Experiments were conducted to research Twitter chatter data. All the used datasets are anonymized in compliance with the Twitter privacy policy.

Data Availability Statement

Emotional Triggers annotated data can be requested from the corresponding author: [email protected].

Acknowledgments

The authors would like to thank the colleagues who participated in data annotation and validation.

Conflicts of Interest

The authors declare no conflict of interest.

References

  1. Cheikh Ismail, L.; Mohamad, M.N.; Bataineh, M.F.; Ajab, A.; Al-Marzouqi, A.M.; Jarrar, A.H.; Abu Jamous, D.O.; Ali, H.I.; Al Sabbah, H.; Hasan, H.; et al. Impact of the Coronavirus Pandemic (COVID-19) Lockdown on Mental Health and Well-Being in the United Arab Emirates. Front. Psychiatry 2021, 12, 633230. [Google Scholar] [CrossRef] [PubMed]
  2. Zalite, G.G.; Zvirbule, A. Digital readiness and competitiveness of the EU higher education institutions: The COVID-19 pandemic impact. Emerg. Sci. J. 2020, 4, 297–304. [Google Scholar] [CrossRef]
  3. Pokhrel, S.; Chhetri, R. A Literature Review on Impact of COVID-19 Pandemic on Teaching and Learning. High. Educ. Futur. 2021, 8, 133–141. [Google Scholar] [CrossRef]
  4. Alawamleh, M.; Al-Twait, L.M.; Al-Saht, G.R. The effect of online learning on communication between instructors and students during Covid-19 pandemic. Asian Educ. Dev. Stud. 2022, 11, 380–400. [Google Scholar] [CrossRef]
  5. Sahu, P. Closure of Universities Due to Coronavirus Disease 2019 (COVID-19): Impact on Education and Mental Health of Students and Academic Staff. Cureus 2020, 12, e7541. [Google Scholar] [CrossRef] [PubMed]
  6. Gopal, R.; Singh, V.; Aggarwal, A. Impact of online classes on the satisfaction and performance of students during the pandemic period of COVID 19. Educ. Inf. Technol. 2021, 26, 6923–6947. [Google Scholar] [CrossRef]
  7. Rasmitadila; Aliyyah, R.R.; Rachmadtullah, R.; Samsudin, A.; Syaodih, E.; Nurtanto, M.; Tambunan, A.R.S. The perceptions of primary school teachers of online learning during the COVID-19 pandemic period: A case study in Indonesia. J. Ethn. Cult. Stud. 2020, 7, 90–109. [Google Scholar] [CrossRef]
  8. Sintema, E.J. Effect of COVID-19 on the Performance of Grade 12 Students: Implications for STEM Education. Eurasia J. Math. Sci. Technol. Educ. 2020, 16, em1851. [Google Scholar] [CrossRef]
  9. Thapa, S.; Sotang, N.; Adhikari, J.; Ghimire, A.; Limbu, A.K.; Joshi, A.; Adhikari, S. Impact of COVID-19 Lockdown on Agriculture Education in Nepal: An Online survey. Pedagog. Res. 2020, 5, em0076. [Google Scholar] [CrossRef]
  10. Chu, Y.H.; Li, Y.C. The Impact of Online Learning on Physical and Mental Health in University Students during the COVID-19 Pandemic. Int. J. Environ. Res. Public Health 2022, 19, 2966. [Google Scholar] [CrossRef]
  11. Baltà-Salvador, R.; Olmedo-Torre, N.; Peña, M.; Renta-Davids, A.I. Academic and emotional effects of online learning during the COVID-19 pandemic on engineering students. Educ. Inf. Technol. 2021, 26, 7407–7434. [Google Scholar] [CrossRef] [PubMed]
  12. Bolatov, A.K.; Seisembekov, T.Z.; Askarova, A.Z.; Baikanova, R.K.; Smailova, D.S.; Fabbro, E. Online-Learning due to COVID-19 Improved Mental Health Among Medical Students. Med. Sci. Educ. 2021, 31, 183–192. [Google Scholar] [CrossRef] [PubMed]
  13. Albudaiwi, D. Advantages and disadvantages of surveys. SAGE Encycl. Commun. Res. Methods 2018, 1735–1737. [Google Scholar]
  14. Debois, S. 10 Advantages and Disadvantages of Questionnaires (Updated 2019); Survey Anyplace: Antwerp, Belgium, 2019. [Google Scholar]
  15. Iwendi, C.; Mohan, S.; Khan, S.; Ibeke, E.; Ahmadian, A.; Ciano, T. COVID-19 fake news sentiment analysis. Comput. Electr. Eng. 2022, 101, 107967. [Google Scholar] [CrossRef] [PubMed]
  16. Bibi, M.; Abbasi, W.A.; Aziz, W.; Khalil, S.; Uddin, M.; Iwendi, C.; Gadekallu, T.R. A novel unsupervised ensemble framework using concept-based linguistic methods and machine learning for twitter sentiment analysis. Pattern Recognit. Lett. 2022, 158, 80–86. [Google Scholar] [CrossRef]
  17. Cotfas, L.A.; Delcea, C.; Roxin, I.; Ioanǎş, C.; Gherai, D.S.; Tajariol, F. The Longest Month: Analyzing COVID-19 Vaccination Opinions Dynamics from Tweets in the Month following the First Vaccine Announcement. IEEE Access 2021, 9, 33203–33223. [Google Scholar] [CrossRef]
  18. Khatua, A.; Cambria, E.; Ho, S.S.; Na, J.C. Deciphering Public Opinion of Nuclear Energy on Twitter. In Proceedings of the International Joint Conference on Neural Networks, Glasgow, UK, 19–24 July 2020; Institute of Electrical and Electronics Engineers Inc.: Piscataway, NJ, USA, 2020. [Google Scholar]
  19. Kristiyanti, D.A.; Umam, A.H.; Wahyudi, M.; Amin, R.; Marlinda, L. Comparison of SVM Naïve Bayes Algorithm for Sentiment Analysis Toward West Java Governor Candidate Period 2018–2023 Based on Public Opinion on Twitter. In Proceedings of the 2018 6th International Conference on Cyber and IT Service Management, CITSM 2018, Parapat, Indonesia, 7–9 August 2018; Institute of Electrical and Electronics Engineers Inc.: Piscataway, NJ, USA, 2019. [Google Scholar]
  20. Younus, A.; Qureshi, M.A.; Asar, F.F.; Azam, M.; Saeed, M.; Touheed, N. What do the average twitterers say: A twitter model for public opinion analysis in the face of major political events. In Proceedings of the 2011 International Conference on Advances in Social Networks Analysis and Mining, ASONAM 2011, Kaohsiung, Taiwan, 25–27 July 2011; pp. 618–623. [Google Scholar]
  21. Nikolić, N.; Grljević, O.; Kovačević, A. Aspect-based sentiment analysis of reviews in the domain of higher education. Electron. Libr. 2020, 38, 44–64. [Google Scholar] [CrossRef]
  22. Balachandran, L.; Kirupananda, A. Online reviews evaluation system for higher education institution: An aspect based sentiment analysis tool. In Proceedings of the International Conference on Software, Knowledge Information, Industrial Management and Applications, SKIMA, Phnom Penh, Cambodia, 3–5 December 2018; Institute of Electrical and Electronics Engineers Inc.: Piscataway, NJ, USA, 2018; Volume 2017. [Google Scholar]
  23. Kastrati, Z.; Imran, A.S.; Kurti, A. Weakly Supervised Framework for Aspect-Based Sentiment Analysis on Students’ Reviews of MOOCs. IEEE Access 2020, 8, 106799–106810. [Google Scholar] [CrossRef]
  24. Sindhu, I.; Muhammad Daudpota, S.; Badar, K.; Bakhtyar, M.; Baber, J.; Nurunnabi, M. Aspect-Based Opinion Mining on Student’s Feedback for Faculty Teaching Performance Evaluation. IEEE Access 2019, 7, 108729–108741. [Google Scholar] [CrossRef]
  25. Michael Onyema, E.; Chika Eucheria, N.; Ayobamidele Obafemi, F.; Sen, S.; Grace Atonye, F.; Sharma, A.; Omar Alsayed, A. Impact of Coronavirus Pandemic on Education. J. Educ. Pract. 2020, 11, 108–121. [Google Scholar] [CrossRef]
  26. Agarwal, S.; Dewan, J. An Analysis of the Effectiveness of Online Learning in Colleges of Uttar Pradesh during the COVID 19 Lockdown. J. Xi’an Univ. Archit. Technol. 2020, XII, 2957–2963. [Google Scholar]
  27. Alqahtani, A.Y.; Rajkhan, A.A. E-Learning Critical Success Factors during the COVID-19 Pandemic: A Comprehensive Analysis of E-Learning Managerial Perspectives. Educ. Sci. 2020, 10, 216. [Google Scholar] [CrossRef]
  28. Dhawan, S. Online Learning: A Panacea in the Time of COVID-19 Crisis. J. Educ. Technol. Syst. 2020, 2020, 5–22. [Google Scholar] [CrossRef]
  29. Kaur, N.; Dwivedi, D.; Arora, J.; Gandhi, A. Study of the effectiveness of e-learning to conventional teaching in medical undergraduates amid COVID-19 pandemic. Natl. J. Physiol. Pharm. Pharmacol. 2020, 10, 563–567. [Google Scholar] [CrossRef]
  30. Hergüner, G.; Yaman, Ç.; Sari, S.Ç.; Yaman, M.S.; Dönmez, A. The Effect of Online Learning Attitudes of Sports Sciences Students on their Learning Readiness to Learn Online in the Era of the New Coronavirus Pandemic (COVID-19). TOJET Turkish Online J. Educ. Technol. 2021, 20, 68–77. [Google Scholar]
  31. Kapasia, N.; Paul, P.; Roy, A.; Saha, J.; Zaveri, A.; Mallick, R.; Barman, B.; Das, P.; Chouhan, P. Impact of lockdown on learning status of undergraduate and postgraduate students during COVID-19 pandemic in West Bengal, India. Child. Youth Serv. Rev. 2020, 116, 105194. [Google Scholar] [CrossRef]
  32. Lau, E.Y.H.; Lee, K. Parents’ Views on Young Children’s Distance Learning and Screen Time During COVID-19 Class Suspension in Hong Kong. Early Educ. Dev. 2020, 32, 863–880. [Google Scholar] [CrossRef]
  33. Whittle, S.; Bray, K.; Lin, S.; Schwartz, O. Parenting and child and adolescent mental health during the COVID-19 pandemic. Rev. Psicol. Clínica Niños Adolesc. 2020, 8, 35–42. [Google Scholar]
  34. Kidd, W.; Murray, J. The COVID-19 pandemic and its effects on teacher education in England: How teacher educators moved practicum learning online. Eur. J. Teach. Educ. 2020, 43, 542–558. [Google Scholar] [CrossRef]
  35. Son, C.; Hegde, S.; Smith, A.; Wang, X.; Sasangohar, F. Effects of COVID-19 on college students’ mental health in the United States: Interview survey study. J. Med. Internet Res. 2020, 22, 14. [Google Scholar] [CrossRef]
  36. Moawad, R.A. Online Learning during the COVID-19 Pandemic and Academic Stress in University Students. Rev. Românească pentru Educ. Multidimens. 2020, XII, 100–107. [Google Scholar] [CrossRef]
  37. Faisal, R.A.; Jobe, M.C.; Ahmed, O.; Sharker, T. Mental Health Status, Anxiety, and Depression Levels of Bangladeshi University Students During the COVID-19 Pandemic. Int. J. Ment. Health Addict. 2022, 20, 1500–1515. [Google Scholar] [CrossRef] [PubMed]
  38. Tartavulea, C.V.; Albu, C.N.; Albu, N.; Dieaconescu, R.I.; Petre, S. Online Teaching Practices and the Effectiveness of the Educational Process in the Wake of the COVID-19 Pandemic. Amfiteatru Econ. J. 2020, 22, 920. [Google Scholar] [CrossRef]
  39. Wu, M.; Xu, W.; Yao, Y.; Zhang, L.; Guo, L.; Fan, J.; Chen, J. Mental health status of students’ parents during COVID-19 pandemic and its influence factors. Gen. Psychiatry 2020, 33, 100250. [Google Scholar] [CrossRef] [PubMed]
  40. Seidel, E.J.; Mohlman, J.; Basch, C.H.; Fera, J.; Cosgrove, A.; Ethan, D. Communicating Mental Health Support to College Students During COVID-19: An Exploration of Website Messaging. J. Community Health 2020, 45, 1259–1262. [Google Scholar] [CrossRef] [PubMed]
  41. Brown, N.; te Riele, K.; Shelley, B.; Woodroffe, J. Learning at Home during COVID-19: Effects on Vulnerable Young Australians; University of Tasmania: Hobart, Australia, 2020. [Google Scholar]
  42. Students Rate My Professors. Available online: http://www.ratemyprofessors.com/ (accessed on 10 August 2022).
  43. Alassaf, M.; Qamar, A.M. Aspect-Based Sentiment Analysis of Arabic Tweets in the Education Sector Using a Hybrid Feature Selection Method. In Proceedings of the 2020 14th International Conference on Innovations in Information Technology (IIT), Al Ain, United Arab Emirates, 17–18 November 2020; pp. 178–185. [Google Scholar] [CrossRef]
  44. Sirajudeen, S.; Balaganesh; Haleema; Devi, V.A. Application of Ensemble Techniques Based Sentiment Analysis to Assess the Adoption Rate of E-Learning During COVID-19 among the Spectrum of Learners. In Artificial Intelligence and Sustainable Computing for Smart City; Springer: Cham, Switzerland, 2021; pp. 187–202. [Google Scholar] [CrossRef]
  45. Altai Rami TwitterData. Available online: https://github.com/RamiAltai/TwitterData (accessed on 31 August 2022).
  46. Grosz, B.J. Natural language processing. Artif. Intell. 1982, 19, 131–136. [Google Scholar] [CrossRef]
  47. Alam, S.; Yao, N. The impact of preprocessing steps on the accuracy of machine learning algorithms in sentiment analysis. Comput. Math. Organ. Theory 2019, 25, 319–335. [Google Scholar] [CrossRef]
  48. Balakrishnan, V.; Ethel, L.-Y. Stemming and Lemmatization: A Comparison of Retrieval Performances. Lect. Notes Softw. Eng. 2014, 2, 262–267. [Google Scholar] [CrossRef]
  49. Lorla, S. TextBlob Documentation. TextBlob 2020. Available online: https://textblob.readthedocs.io/en/dev/ (accessed on 8 August 2022).
  50. Saravia, E.; Toby Liu, H.C.; Huang, Y.H.; Wu, J.; Chen, Y.S. Carer: Contextualized affect representations for emotion recognition. In Proceedings of the 2018 Conference on Empirical Methods in Natural Language Processing, EMNLP 2018, Brussels, Belgium, 31 October–4 November 2018; pp. 3687–3697. [Google Scholar]
  51. Preda, G.; Chawla, A. COVID19 Tweets|Kaggle. Available online: https://www.kaggle.com/datasets/gpreda/covid19-tweets (accessed on 10 August 2022).
  52. United Nation COVID-19 Socio-Economic Analysis for the United Arab Emirates. Available online: https://www.undp.org/arab-states/publications/united-nations-covid-19-socio-economic-analysis-united-arab-emirates (accessed on 10 August 2022).
  53. O’Neill, A. United Arab Emirates Unemployment Rate. Available online: http://www.tradingeconomics.com/united-arab-emirates/unemployment-rate?embed?embed (accessed on 10 August 2022).
  54. Allen, J.; Cotter-Roberts, A.; Kadel, R.; Hughes, K.; Dyakova, M. COVID-19 impact on financial security: Evidence from the National Public Engagement Survey in Wales. Eur. J. Public Health 2021, 31, iii462. [Google Scholar] [CrossRef]
  55. MacGregor, K. Study Finds 40,000 Tertiary Jobs Lost during Pandemic. Available online: https://www.universityworldnews.com/post.php?story=20210917061003607 (accessed on 10 August 2022).
  56. Leonhardt, M. 51.7 Million Parents have Lost Income during the Coronavirus Pandemic; CNBC: Englewood Cliffs, NJ, USA, 2020. [Google Scholar]
  57. Dickler, J. More than Half of Students Can’t Afford College Tuition Post-Pandemic. Available online: https://www.cnbc.com/2020/06/04/more-than-half-of-students-probably-cant-afford-college-due-to-covid-19.html (accessed on 10 August 2022).
  58. The New York Times. Tracking the Coronavirus at U.S. Colleges and Universities; The New York Times: New York, NY, USA, 2020. [Google Scholar]
  59. Ismail, H.M.; Harous, S.; Belkhouche, B. A Comparative Analysis of Machine Learning Classifiers for Twitter Sentiment Analysis. Res. Comput. Sci. 2016, 110, 71–83. [Google Scholar] [CrossRef]
  60. Ismail, H.M.; Zaki, N.; Belkhouche, B. Using Custom Fuzzy Thesaurus to Incorporate Semantic and Reduce Data Sparsity for Twitter Sentiment Analysis. In Proceedings of the 2016 3rd International Conference on Soft Computing and Machine Intelligence, ISCMI 2016, Dubai, United Arab Emirates, 23–25 November 2016; Institute of Electrical and Electronics Engineers Inc.: Piscataway, NJ, USA, 2017; pp. 47–52. [Google Scholar]
  61. Ismail, H.M.; Belkhouche, B.; Zaki, N. Semantic Twitter sentiment analysis based on a fuzzy thesaurus. Soft Comput. 2018, 22, 6011–6024. [Google Scholar] [CrossRef]
  62. Suthaharan, S. Machine Learning Models and Algorithms for Big Data Classification; Springer Science+Business Media: New York, NY, USA, 2016; Volume 36, ISBN 978-1-4899-7640-6. [Google Scholar]
  63. Ronaghan, S. The Mathematics of Decision Trees, Random Forest and Feature Importance in Scikit-learn and Spark. Available online: https://towardsdatascience.com/the-mathematics-of-decision-trees-random-forest-and-feature-importance-in-scikit-learn-and-spark-f2861df67e3 (accessed on 10 August 2022).
  64. ADEK Private School Reopening Policies and Guidelines for Academic Year 2021/22. Available online: https://www.adek.gov.ae/Education-System/Parent-Resource-Hub/Private-School-Reopening-Policies-and-Guidelines (accessed on 10 August 2022).
  65. Fattah, Z. Dubai: Dubai Turns Page on COVID-19 with Hottest Jobs Market in Two Years—The Economic Times; The Times Group: New Delhi, India, 2021. [Google Scholar]
Figure 1. The proposed analytics framework architecture.
Bdcc 06 00099 g001
Figure 2. Analytics module.
Bdcc 06 00099 g002
Figure 3. Logistic regression ROC—emotions classification.
Bdcc 06 00099 g003
Figure 4. Random forest ROC—emotions classification.
Bdcc 06 00099 g004
Figure 5. SVC ROC—emotions classification.
Bdcc 06 00099 g005
Figure 6. MultinomialNB ROC—emotions classification.
Bdcc 06 00099 g006
Figure 7. Logistic regression ROC—Aspect classification.
Bdcc 06 00099 g007
Figure 8. Random forest ROC—Aspect classification.
Bdcc 06 00099 g008
Figure 9. SVC ROC—Aspect classification.
Bdcc 06 00099 g009
Figure 10. MultinomialNB ROC—Aspect classification.
Bdcc 06 00099 g010
Figure 11. Testing Scenario#1.
Bdcc 06 00099 g011
Figure 12. Testing Scenario#2.
Bdcc 06 00099 g012
Figure 13. Testing Scenario#3.
Bdcc 06 00099 g013
Figure 14. Testing Scenario#4.
Bdcc 06 00099 g014
Table 1. Comparison of literature related to the impact of COVID-19 on education sector using surveying techniques.
StudySurveying MethodSampleFocusCountry and Language
Edeh, et al. [25]Online survey platform,
newspapers, journals,
media, literature reports
200 respondents
(Teachers, students, parents, and policymakers)
Effects on the education sectorNigeria /Bangladesh
/India/KSA,
English
Swati Agarwal, et al. [26]Online survey100 students, 50 faculty members in viz. Lucknow, Agra, Meerut, and Bareilly Learning efficacyIndia,
English
Ammar Y. Alqahtani, et al. [27]A survey, AHP
method, TOPSIS
method
Management staff from 69 educational institutionsLearning efficacyKSA,
English
Shivangi Dhawan [28]SWOC analysisNot SpecifiedLearning efficacy India,
English
Kaur, et al. [29]Online cross-sectional
Self-designed questionnaire based on a
5-point Likert scale
983 medicals
students
Learning efficacyIndia,
English
Gülten Hergüner et al. [30]Correlational
survey model
599 (271 female + 328 male) sports sciences students from seven state universitiesImpact on sports sciences college studentsTurkey,
English
Nanigopal Kapasiaa, et al. [31]Online survey232 Undergraduate and postgraduate students of various colleges and universities of West BengalImpact on Limited Income StudentsIndia,
English
Eva Yi Hung Lau, et al. [32]Social media platforms (3
Facebook fan pages) survey
6702 kindergarten primary school parentsImpact on nursery students
and their parents
Hong Kong,
English
Sarah Whittle, et al. [33]Survey from Online advertising
and Facebook advertisements
381 parents
481 children
Mental health of students and parents during the early phase of the pandemicAustralia/UK,
English
Warren, et al. [34]Interviewsurveys195 students from Texas A& M University
President’s Excellence
(X-Grant) award
Mental health assessment of college studentsUnited States,
English
Changwon Son, et al. [35]Online
Interview
Survey
195 students from a large public universityMental health assessment of college studentsUnited States,
English
Ruba Abdelmatloub Moawad [36]Online
questionnaire
646 students from the College of Education (King Saud University)Mental health assessment of college studentsKSA,
English
Rajib Ahmed Faisal, et al. [37]Online survey
(snowball sampling technique)
874 Bangladeshi university studentsMental health assessment of college studentsBangladeshi,
Bangla
language
Tartavulea, et al. [38]National Panel Study of Coronavirus pandemic (NPSC-19)3338 householdsMental health assessment of parentsUnited States,
English
Wu M, et al. [39]Perceived Stress Scale (PSS-10), General Anxiety Disorder (GAD-7), Patient Health Questionnaire (PHQ-9), Social Support Rating Scale (SSRS) 1163 parents /Shanghai Clinical Research Center for Mental HealthMental health assessment of parentsChina,
English
Erica J. Seidel, et al. [40]Survey138 websites; over 2000 college studentsMental health services and community-based resources NYC,
English
Brown, et al. [41]Interviews/conversations,
Online stakeholder survey
Secondary sources/grey
Literature, Literature
121 respondents
(Organizations staff, students, parents, caretakers)
Impact on young studentsAustralia¸
English
Table 2. Summary of ABSA research studies in the field of education.
StudyMethodFocusSourceLanguage
Nikola, et al. [21]Explicit Lexicon-based ABSA at the sentence
segment level
Evaluation of higher education satisfactionOfficial student surveys/
“Rate my professors” website
Serbian
Kastrati, et al. [23]Explicit ABSA using Lexicon-based weak supervised Online Learning Efficacy Students’ reviews collected from online and traditional classroom settingsEnglish
Sindhu, et al. [24]Implicit ABSA using two-layered LSTM modelFaculty Teaching PerformanceSemEval-2014 data set/
manually tagged dataset of the last 5 years from Sukkur IBA University
English
Balachandran, et al. [22]Explicit ABSA using NLPHigher education institution evaluation and recommendation system Twitter and Facebook APIsNot
Specified
Alassaf, et al. [43]Implicit ABSA—SVMEffectiveness of hybrid selection method Tweets related to Qassim UniversityArabic
Sirajudeen, et al. [44]Ensemble Learning-based Sentiment Analysis (ELSA)Impact of e-Learning on StudentsSchool, college, and university studentsEnglish
Table 3. Sample education-related UAE Twitter Chatter Data.
Education-Related Tweets
“Great meeting with UAE Min. Educ HE Hussain Al Hammadi—focused on e-learning especially under COVID, training, curriculum review to match 21st century learning expectations, etc. These will be fleshed out in MOU to be signed between UAE and Sierra Leone.”
“From vital COVID-19 Management in a particular challenging time for schools to emergency First Aid management, Health checks, Health education and general day to day support whilst running busy health care centers in our schools, we are grateful for our Healthcare teams.”
“Teachers have been on the frontline every day during Covid. So why scapegoat them What an eye opener.”
“Discussing the procedures and challenges of accepting students for the fall semester of the academic year 2020/2021 during the COVID-19 pandemic. The Admissions Department at the University of Sharjah held the meeting with the Dean of Academic Support Services.”
“What topics are trending in the workplace with the shift to remote work amid the coronavirus pandemic, online learning related to mindfulness, cybersecurity, and hybrid tech capabilities surged.”
Table 4. Sentiment analysis results example.
TweetsSentiment ScoreSentiment Class
“School closures failed Americas’ children”−0.5Negative
“Fabulous travel magazines groups created Microsoft Teams that allowed us to communicate work seamlessly whilst still adhering to restrictions and rules.”0.25Positive
“Abu Dhabi requires kids of age 12 and teachers to get PCR tested every 2 weeks in order to attend school. My daughters got their 11th test today and teachers are vaccinated weeks ago.”0Neutral
Table 5. Distribution of samples in the Emotion Training Dataset.
Class Total Number of Samples
Happy7067
Sadness6333
Anger3019
Fear2658
Love1630
Surprise877
Table 6. Emotion Analysis Dataset example.
TweetsHashtagsEmotion
Class
“I feel peaceful and unafraid certain that my god has my best interests at heart”PeaceHappy
“I watched his face contort in sadness I began to feel regretful of my actions”RegretSad
“I feel very stunned that people got it in a big way”StunSurprise
“I started to feel uncomfortable buzzy short of breath and very mildly panicky”PanicFear
“I was still looking out for good causes that I feel passionate about to volunteer and again last year when a friend introduced me to an organization that packs food rations for needy families”PassionLove
“I feel irritated to have missed out direct instruction from master lee is never to be passed up casually I have to admit my body just feels like it needs the rest”IrritateAngry
Table 7. Distribution of Emotional Triggers Training Dataset.
Class (Aspect)Total Number of Samples
Safety636
Educational Rights283
Financial Security 260
Table 8. Aspect analysis results example.
TweetsAspect
“Due to the current situation and health issues college students are given chance to complete final exams online. I doubt the efficacy of these exams!!”Education Quality and Educational Rights
“After one year I’ve learned from the pandemic that the world is fragile. It breaks easily and disease is affecting economy. We need cure developed faster to retain jobs and stop attending classes at home.”Financial Security
“Let’s teach our kids preventive measures to reduce the risk and getting stop spread virus.”Safety
Table 13. Online testing scenarios to validate the functionality of the proposed framework for the defined criteria.
Scenario No.Testing Criteria
Scenario 1Specified aspect: “all aspects”, Emirate: “across UAE”, Period of time: “from 3 October 2020 to 26 March 2021”
Scenario 2Specified aspect: “Safety”, Emirate: “Abu Dhabi”, Period of time: “from 18 October 2020 to 1 March 2021”
Scenario 3Specified aspect: “Financial Security”, Emirate: “Dubai”, Period of time: “from 3 October 2020 to 26 March 2021”
Scenario 4Compare the specified aspect in Scenario 3, with a different emirate, over the same period of the time period
Publisher’s Note: MDPI stays neutral with regard to jurisdictional claims in published maps and institutional affiliations.

