Chronic High-Fat Diet Induces Early Barrett’s Esophagus in Mice through Lipidome Remodeling

 , , , , and
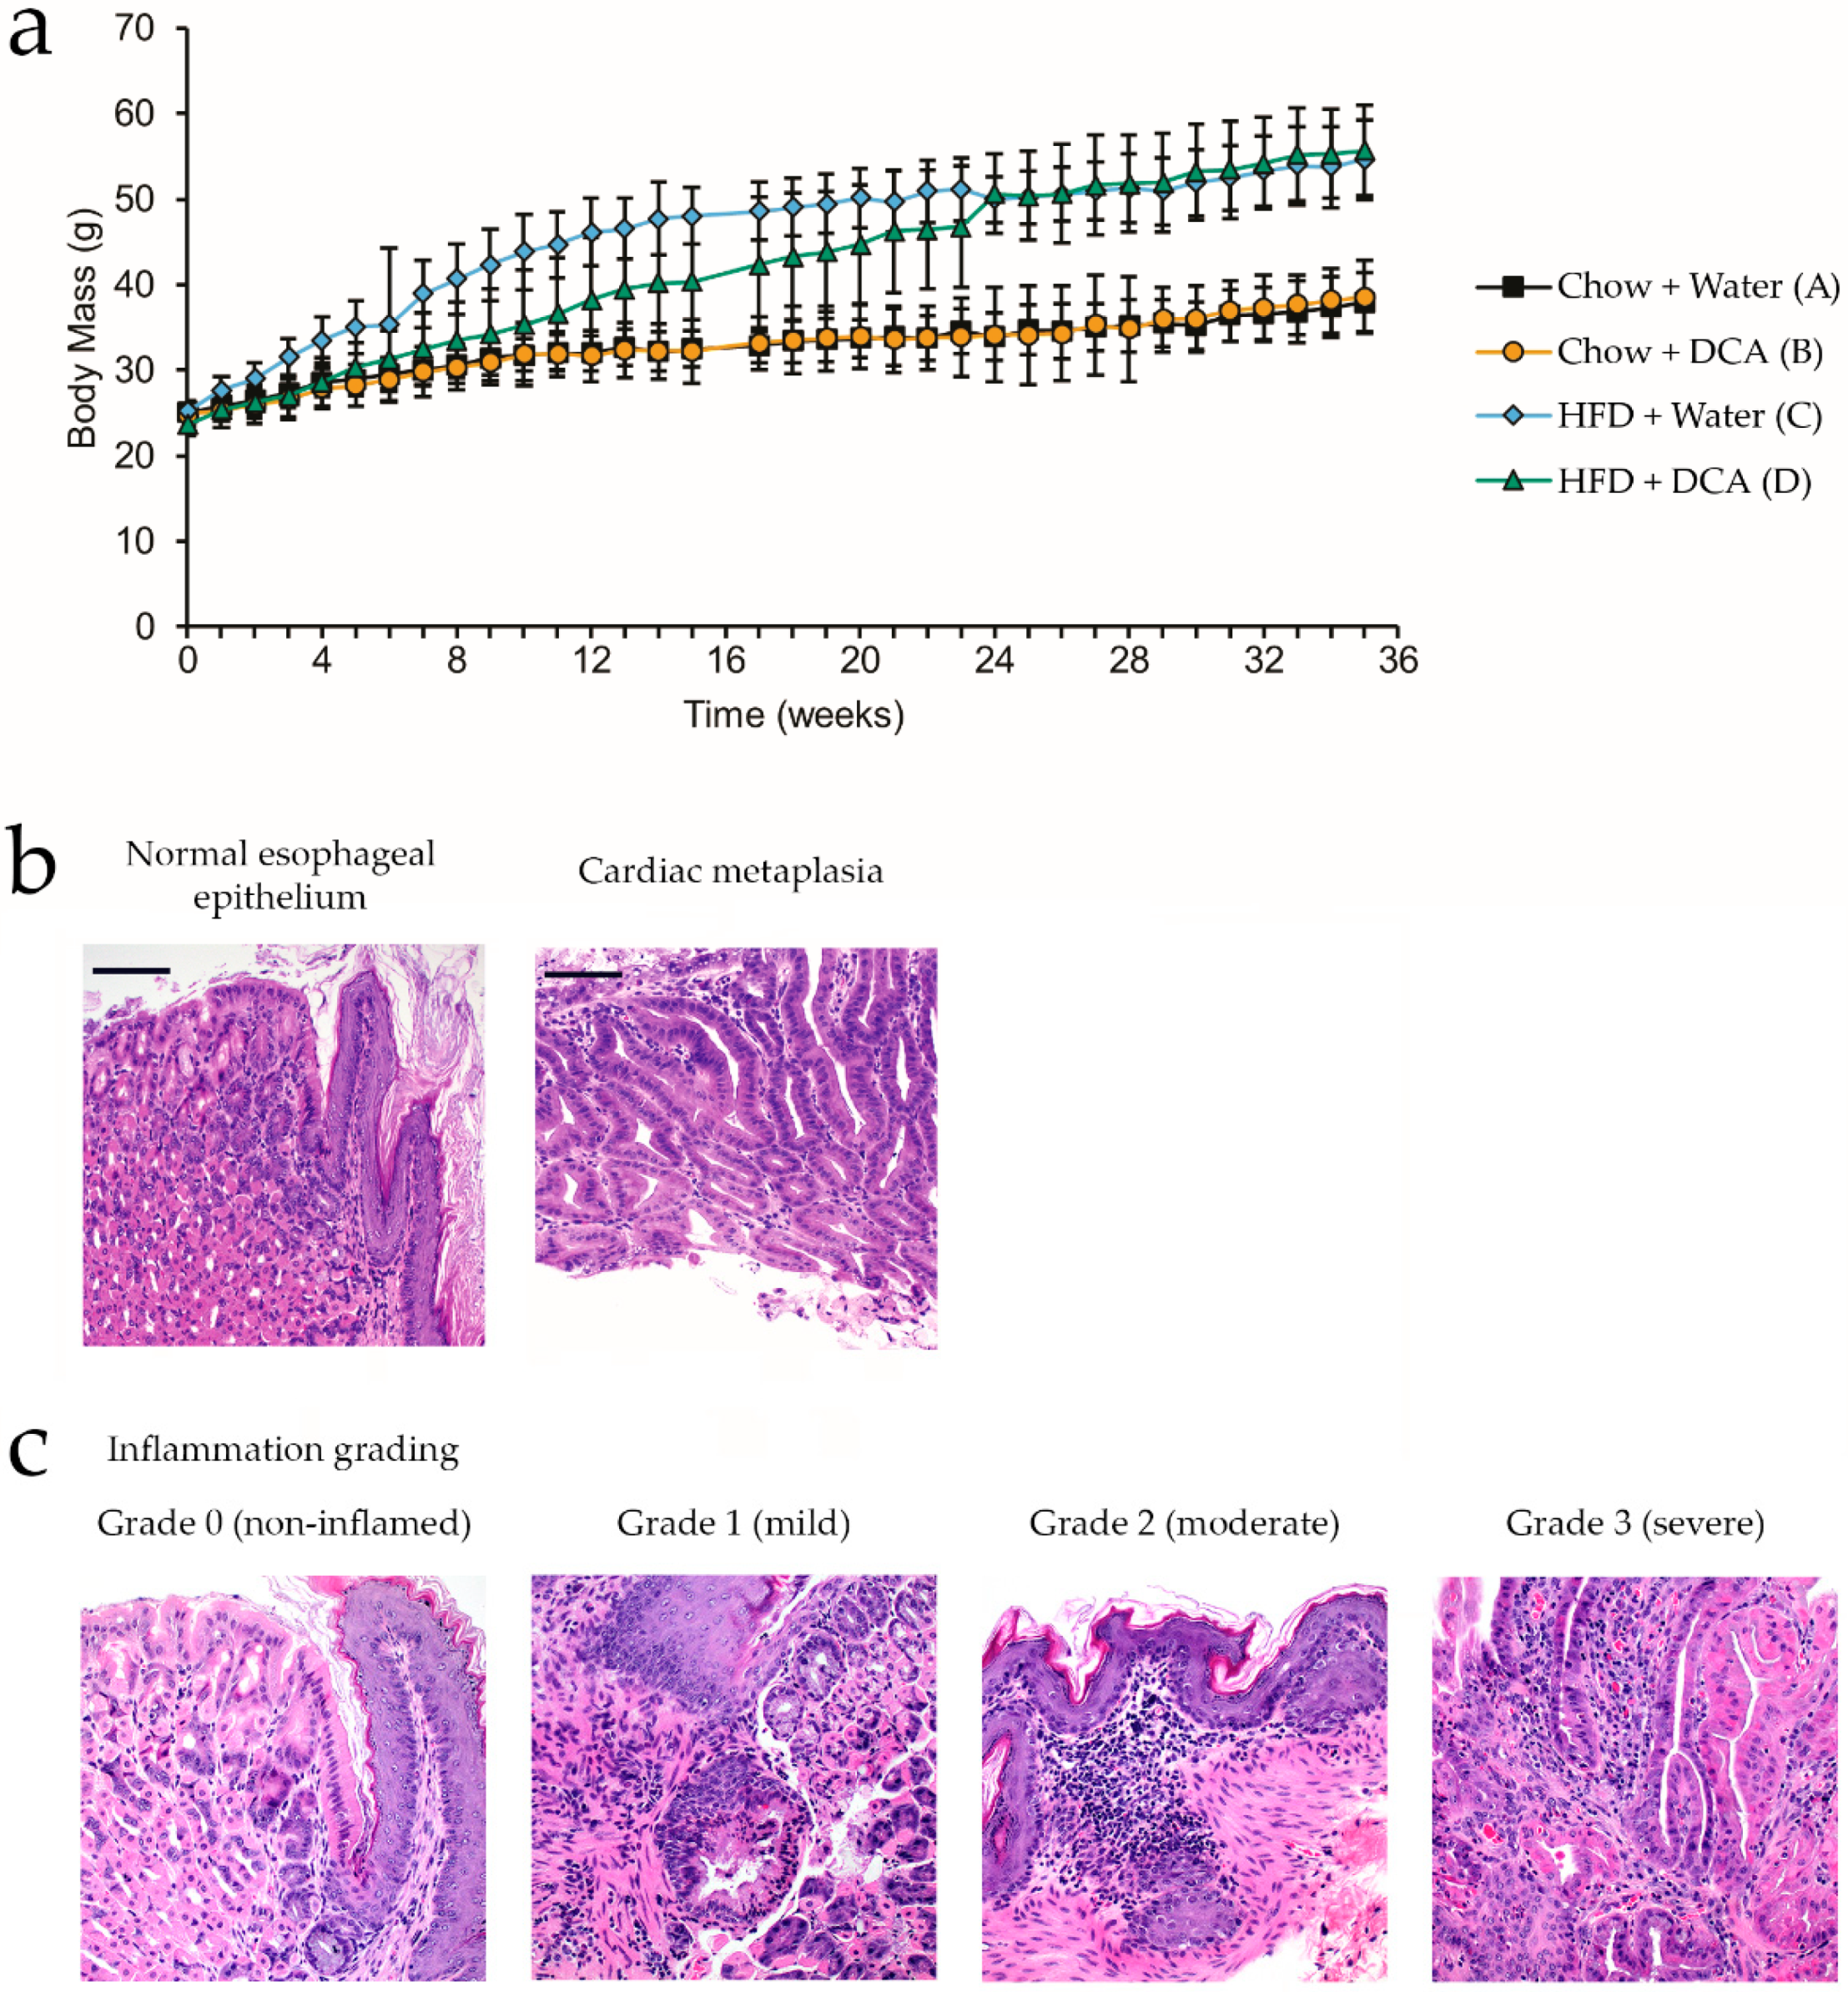
Abstract
:1. Introduction
2. Materials and Methods
2.1. Animal Experiments
2.1.1. Materials
2.1.2. Dietary Treatments
- ad libitum standard chow diet and drinking water
- ad libitum standard chow diet and 0.2% deoxycholic acid (unconjugated bile acid, pH 7) in drinking water [16]
- ad libitum HFD and drinking water
- ad libitum HFD and 0.2% deoxycholic acid in drinking water.
2.1.3. Tissue and Serum Collection
2.1.4. Histology
2.2. Lipidomics Experiments
2.2.1. Materials
2.2.2. Lipid Extraction
2.2.3. Untargeted Lipidomics
2.2.4. Targeted Lipidomics
2.2.5. Data Treatment and Analysis
2.3. Microbiome Profiling
2.3.1. DNA Extraction
2.3.2. Library Preparation and Sequencing
2.3.3. Bioinformatics and Statistical Analysis
3. Results
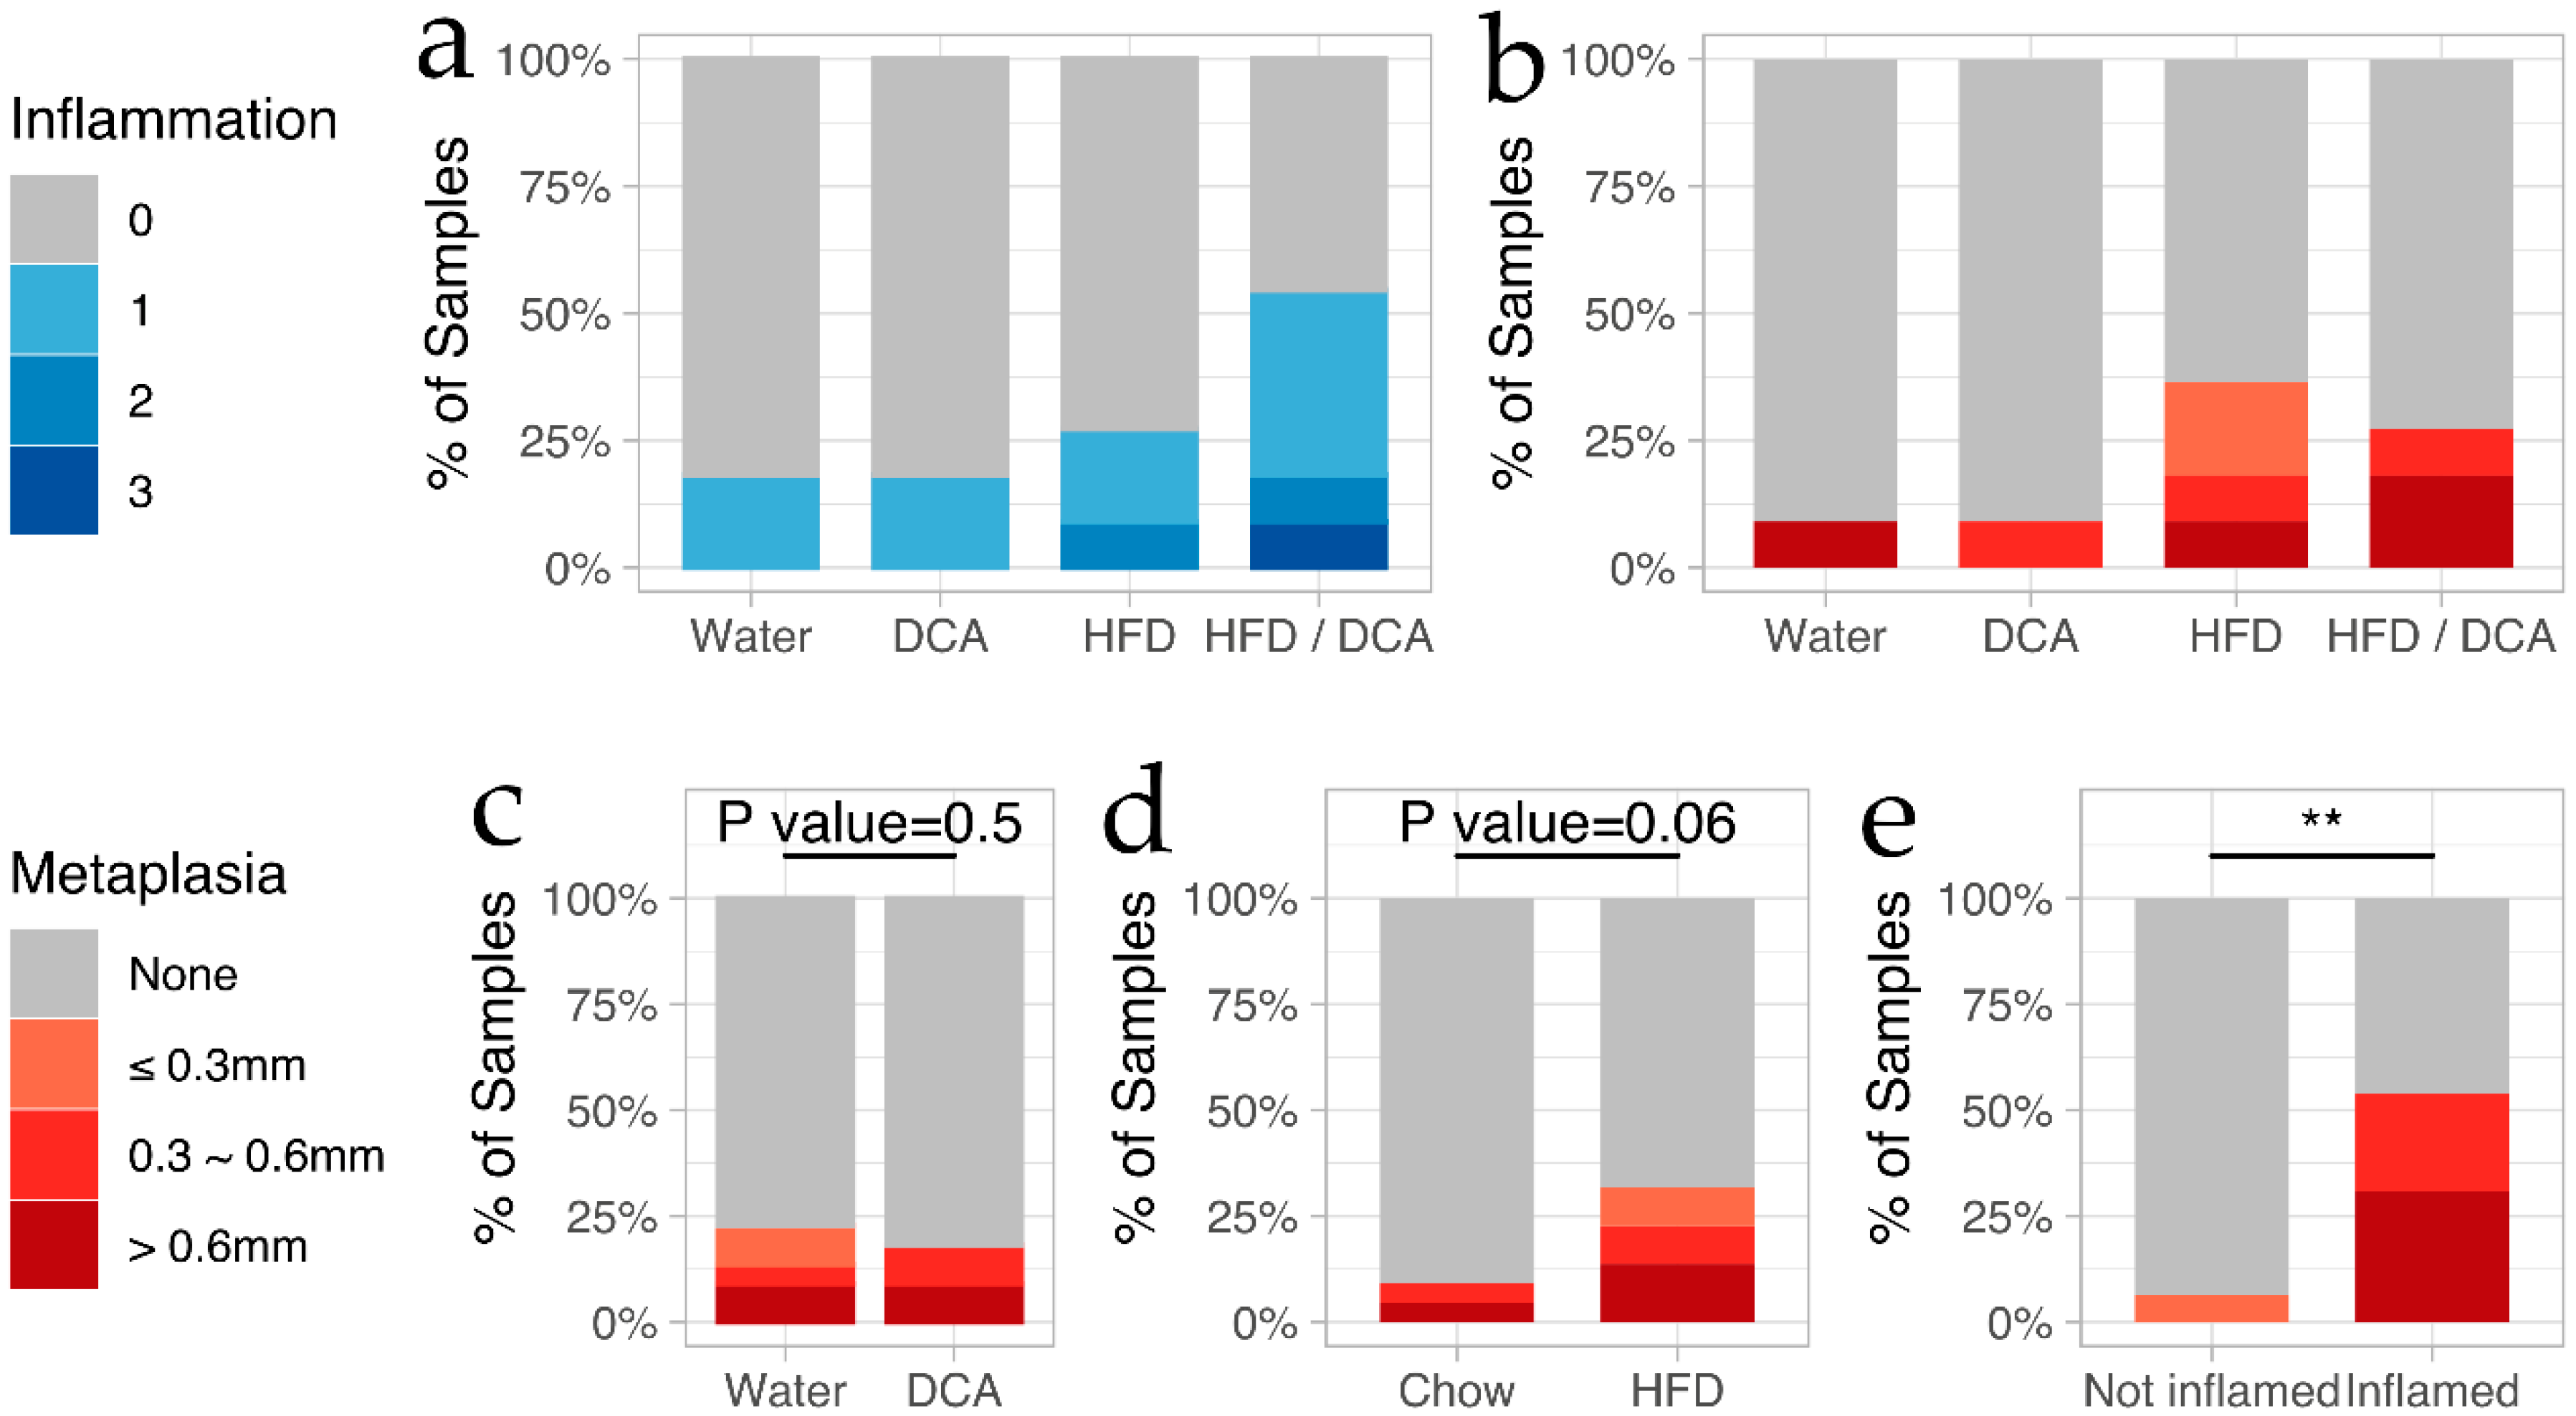
3.1. High-Fat Diet and Bile Acid Exposure as a Mouse Model for the Development of Esophageal Inflammation and Cardiac Metaplasia
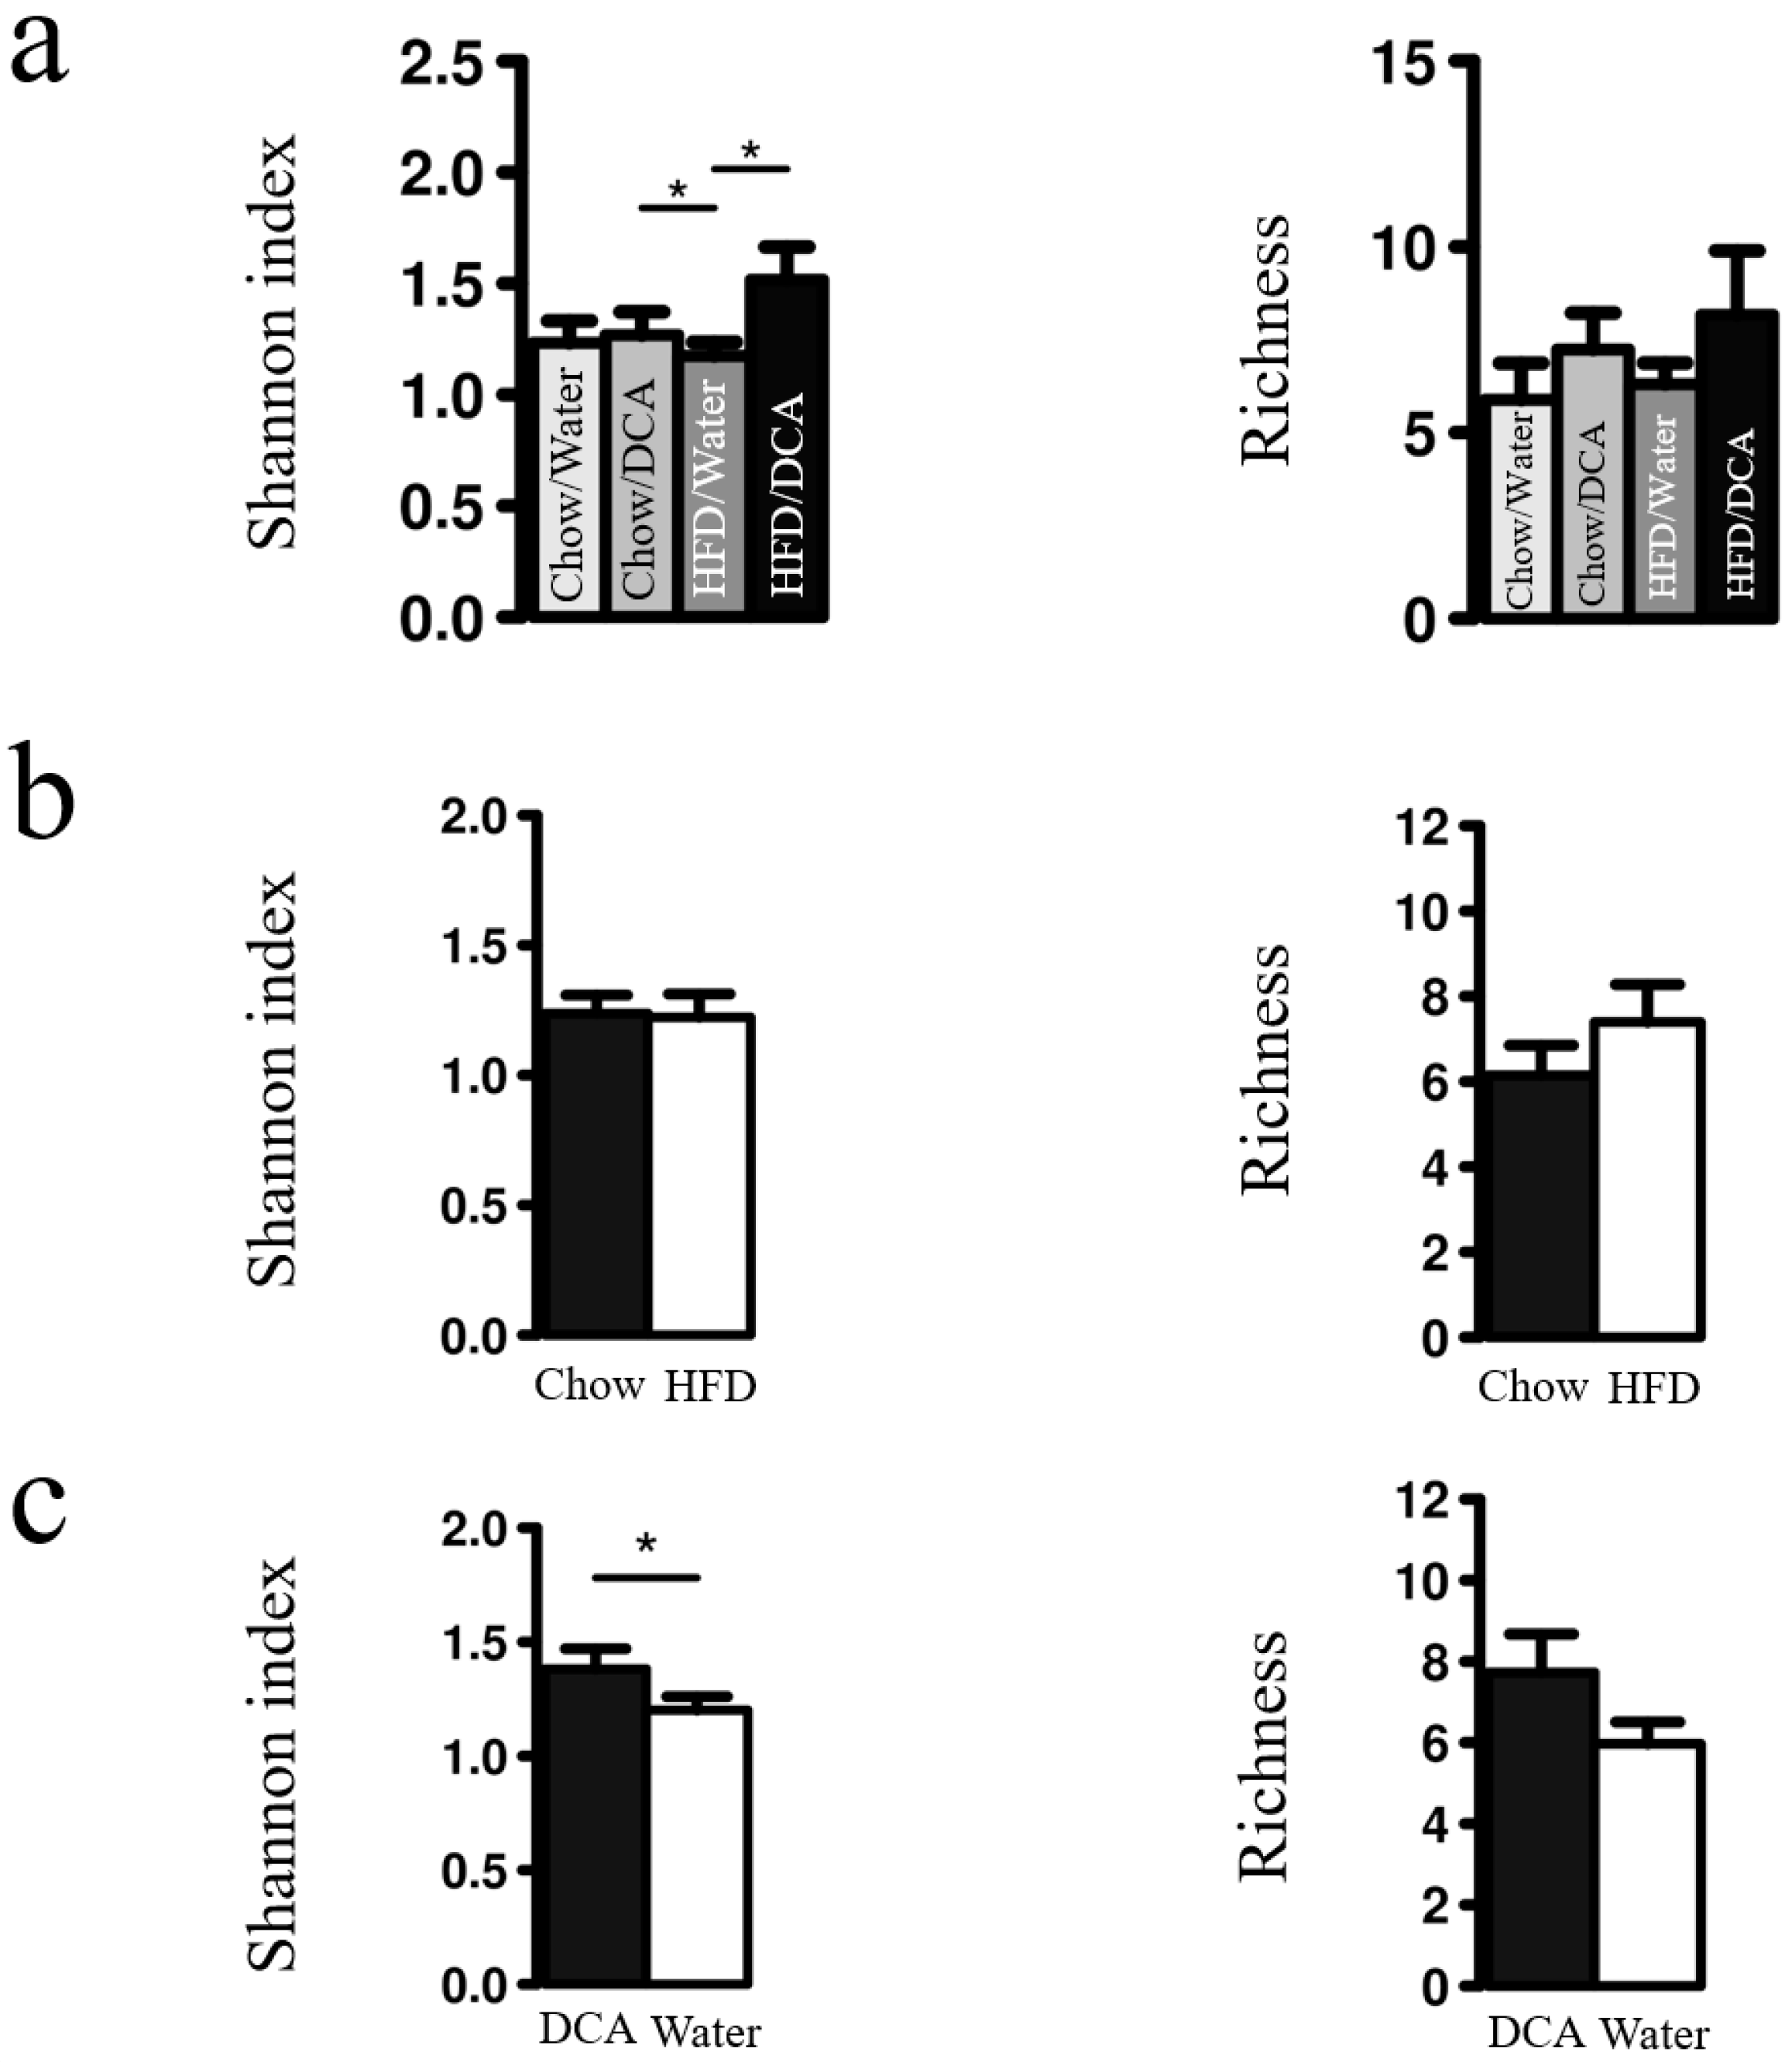
3.2. Esophageal Tissue Microbiome Diversity Increases with DCA
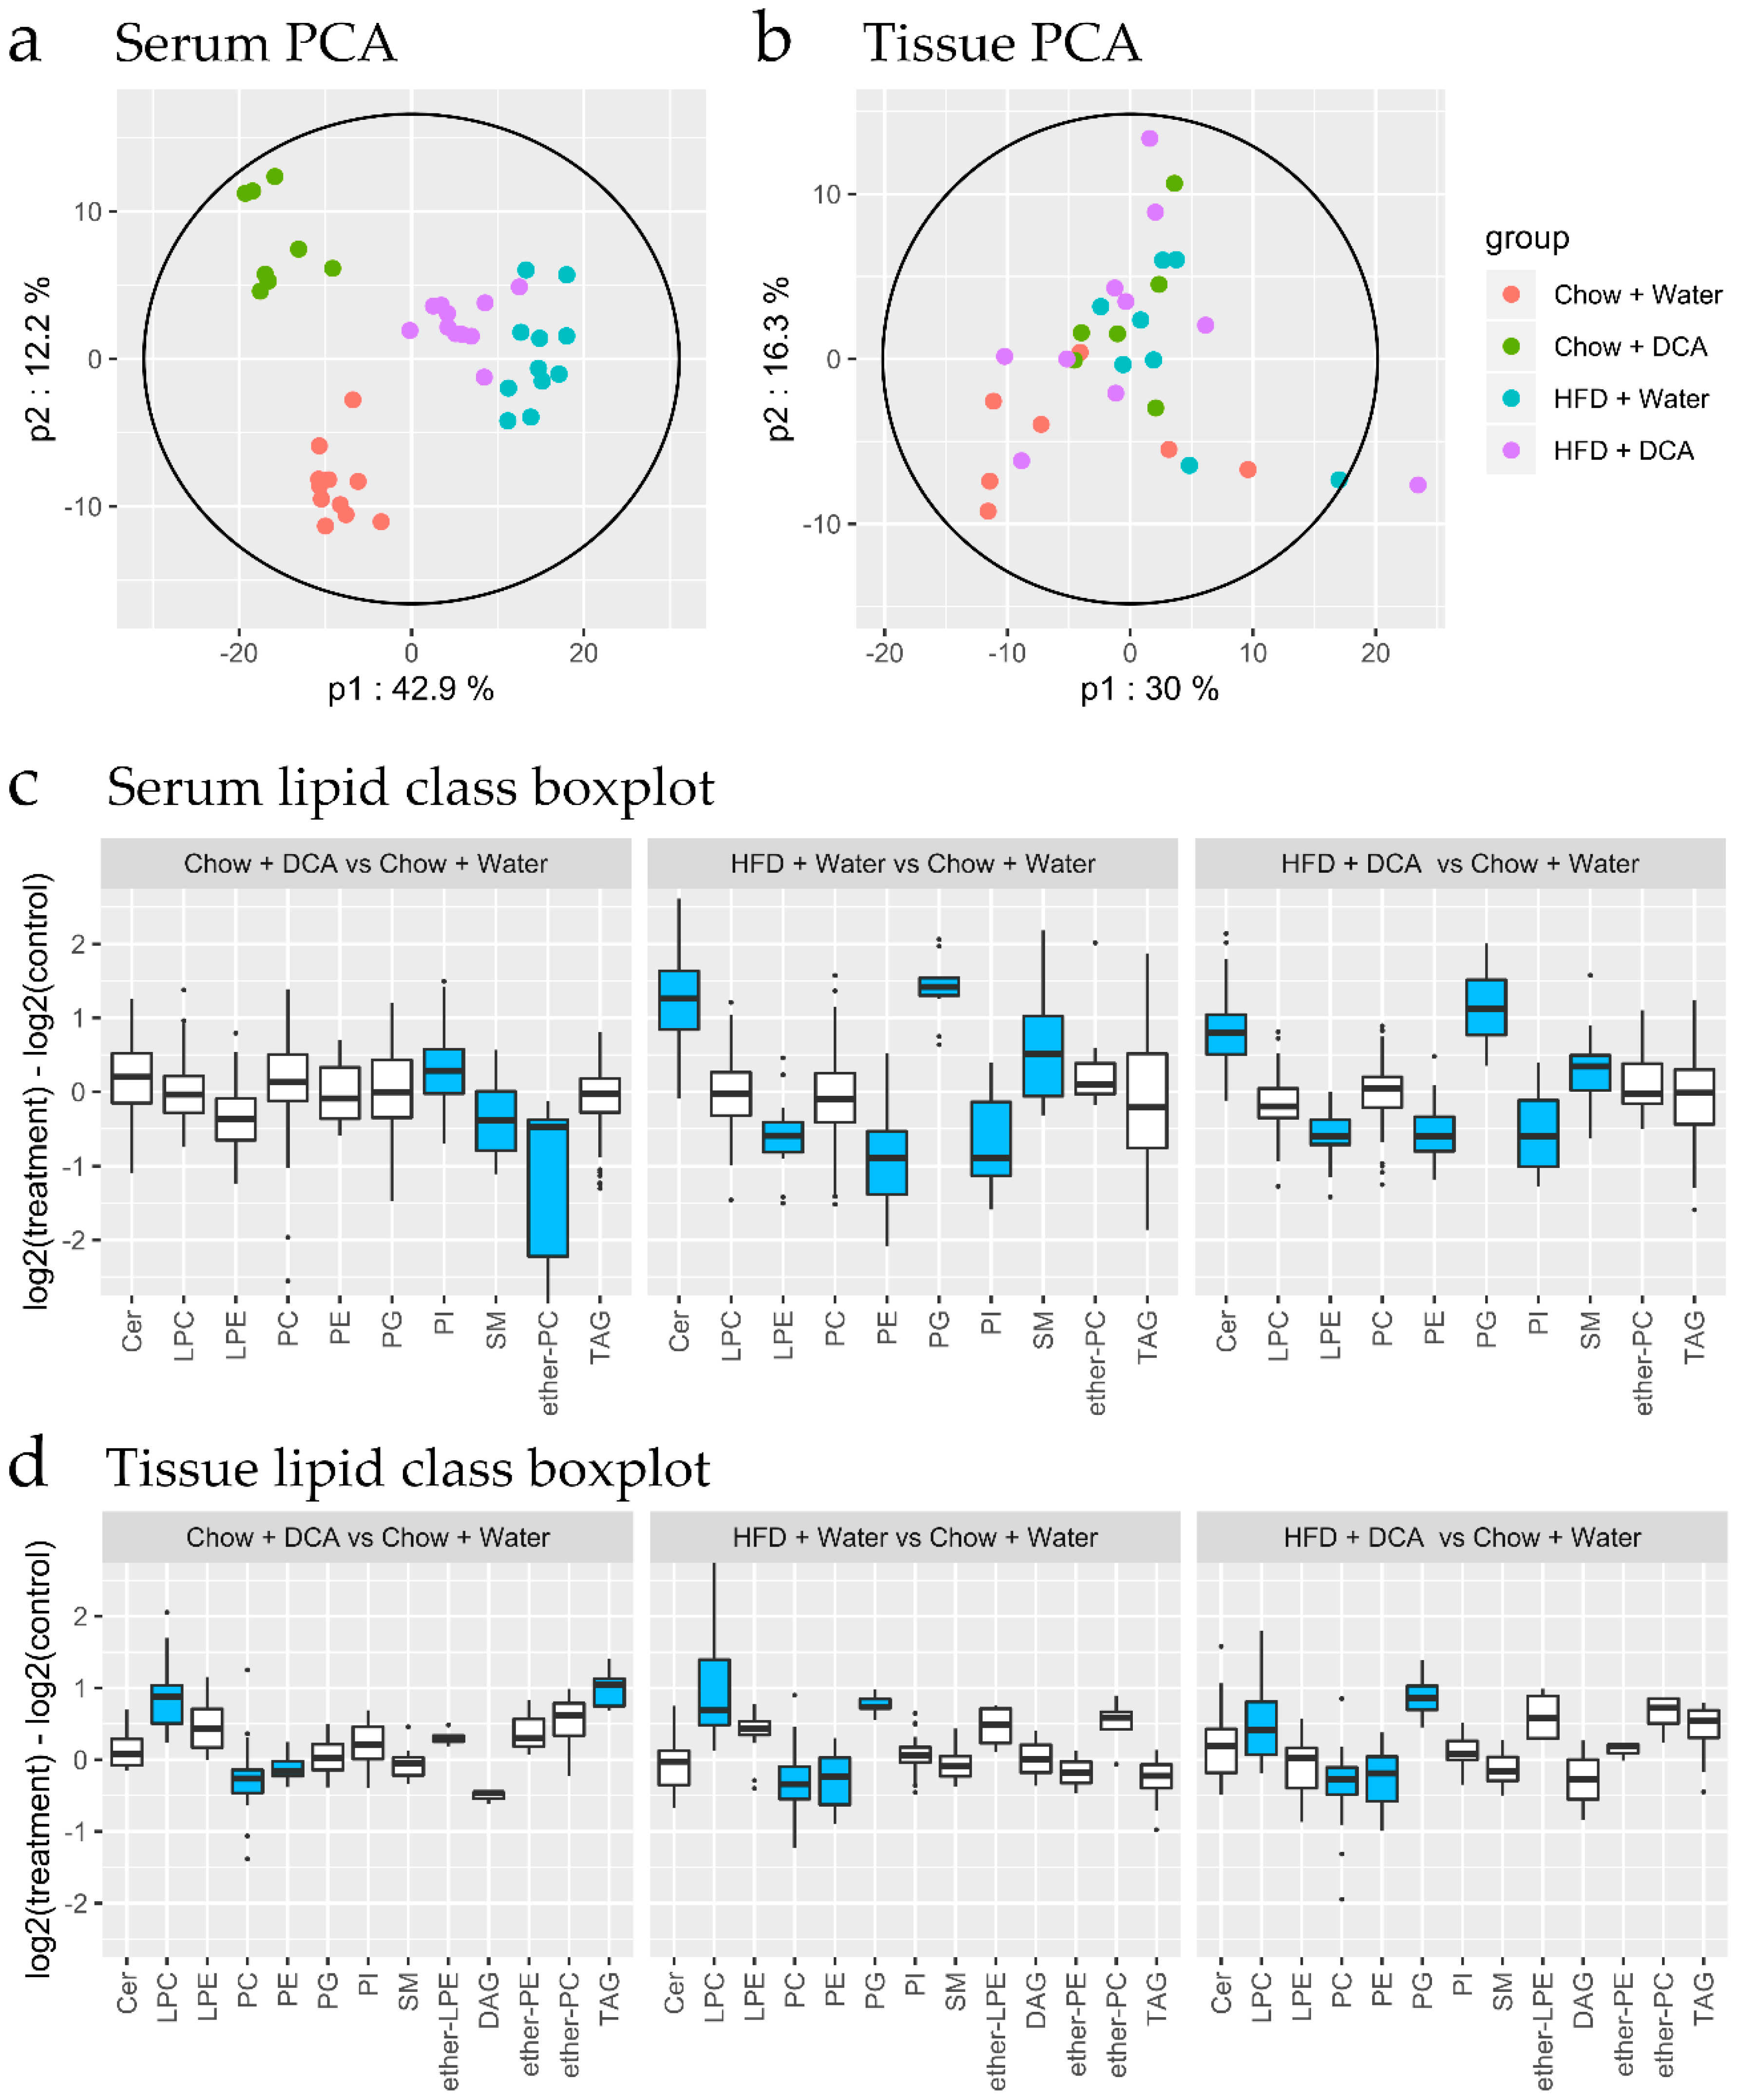
3.3. Lipidomic Changes Associated with Dietary Interventions
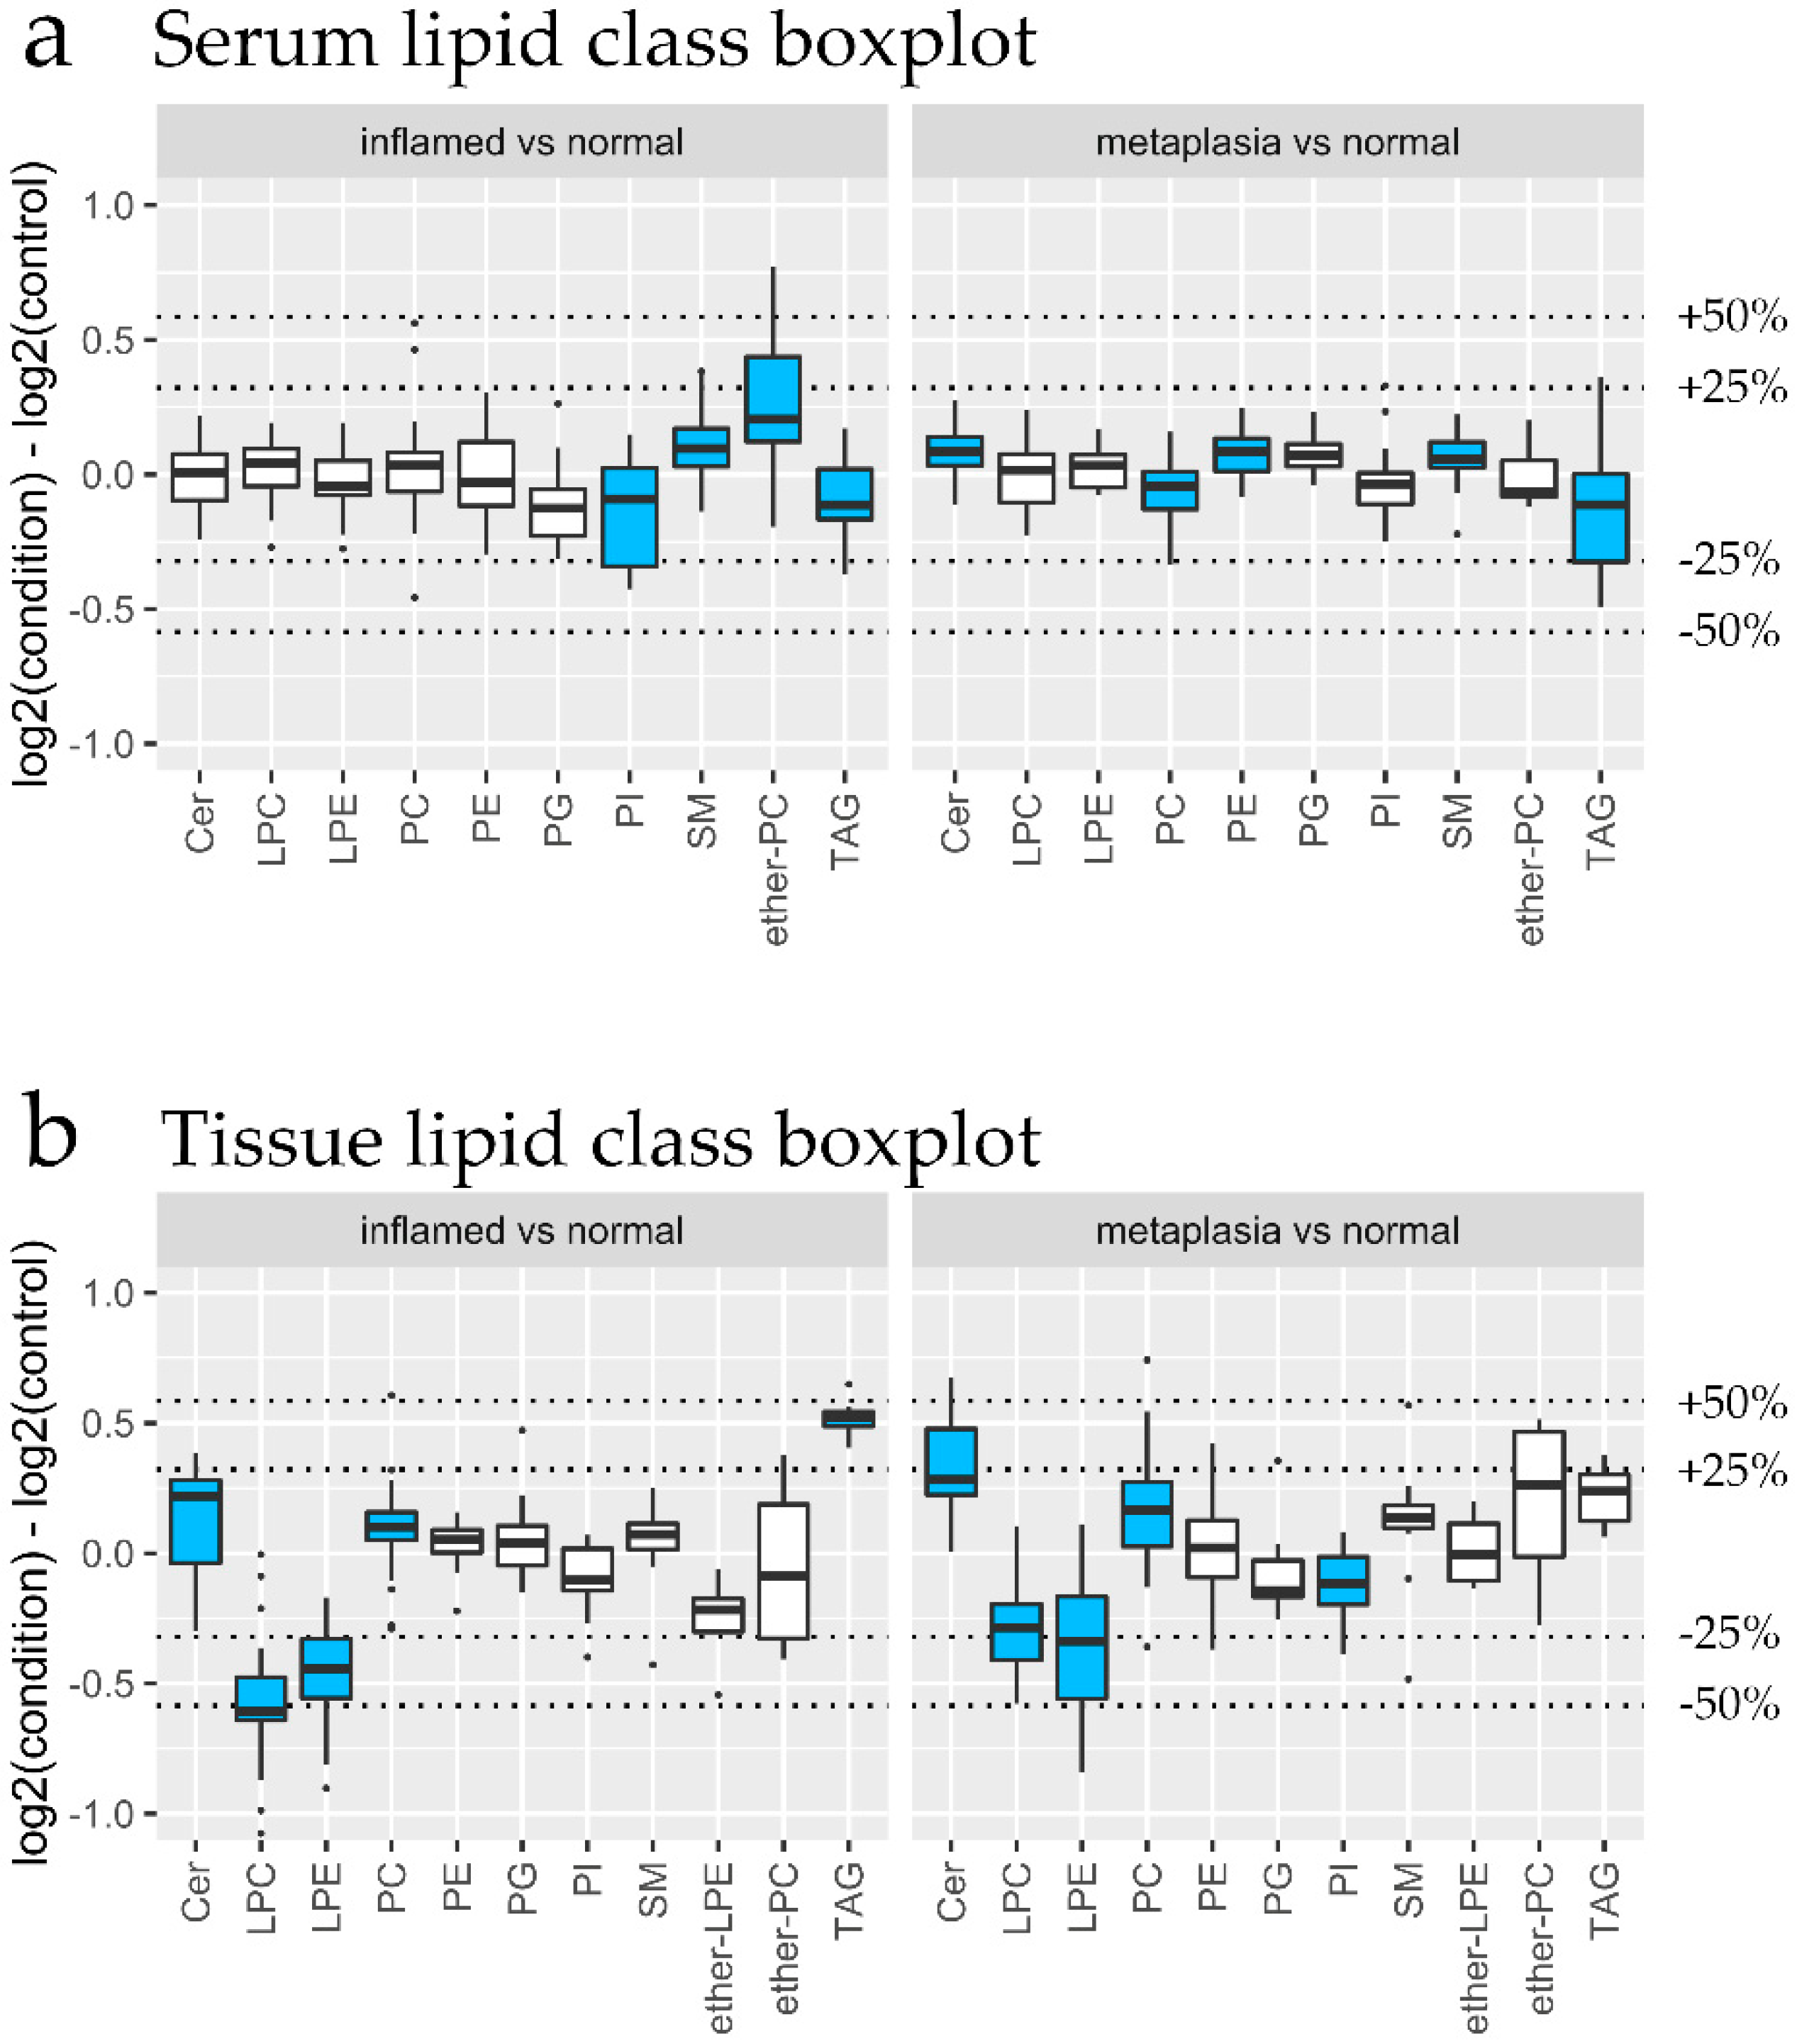
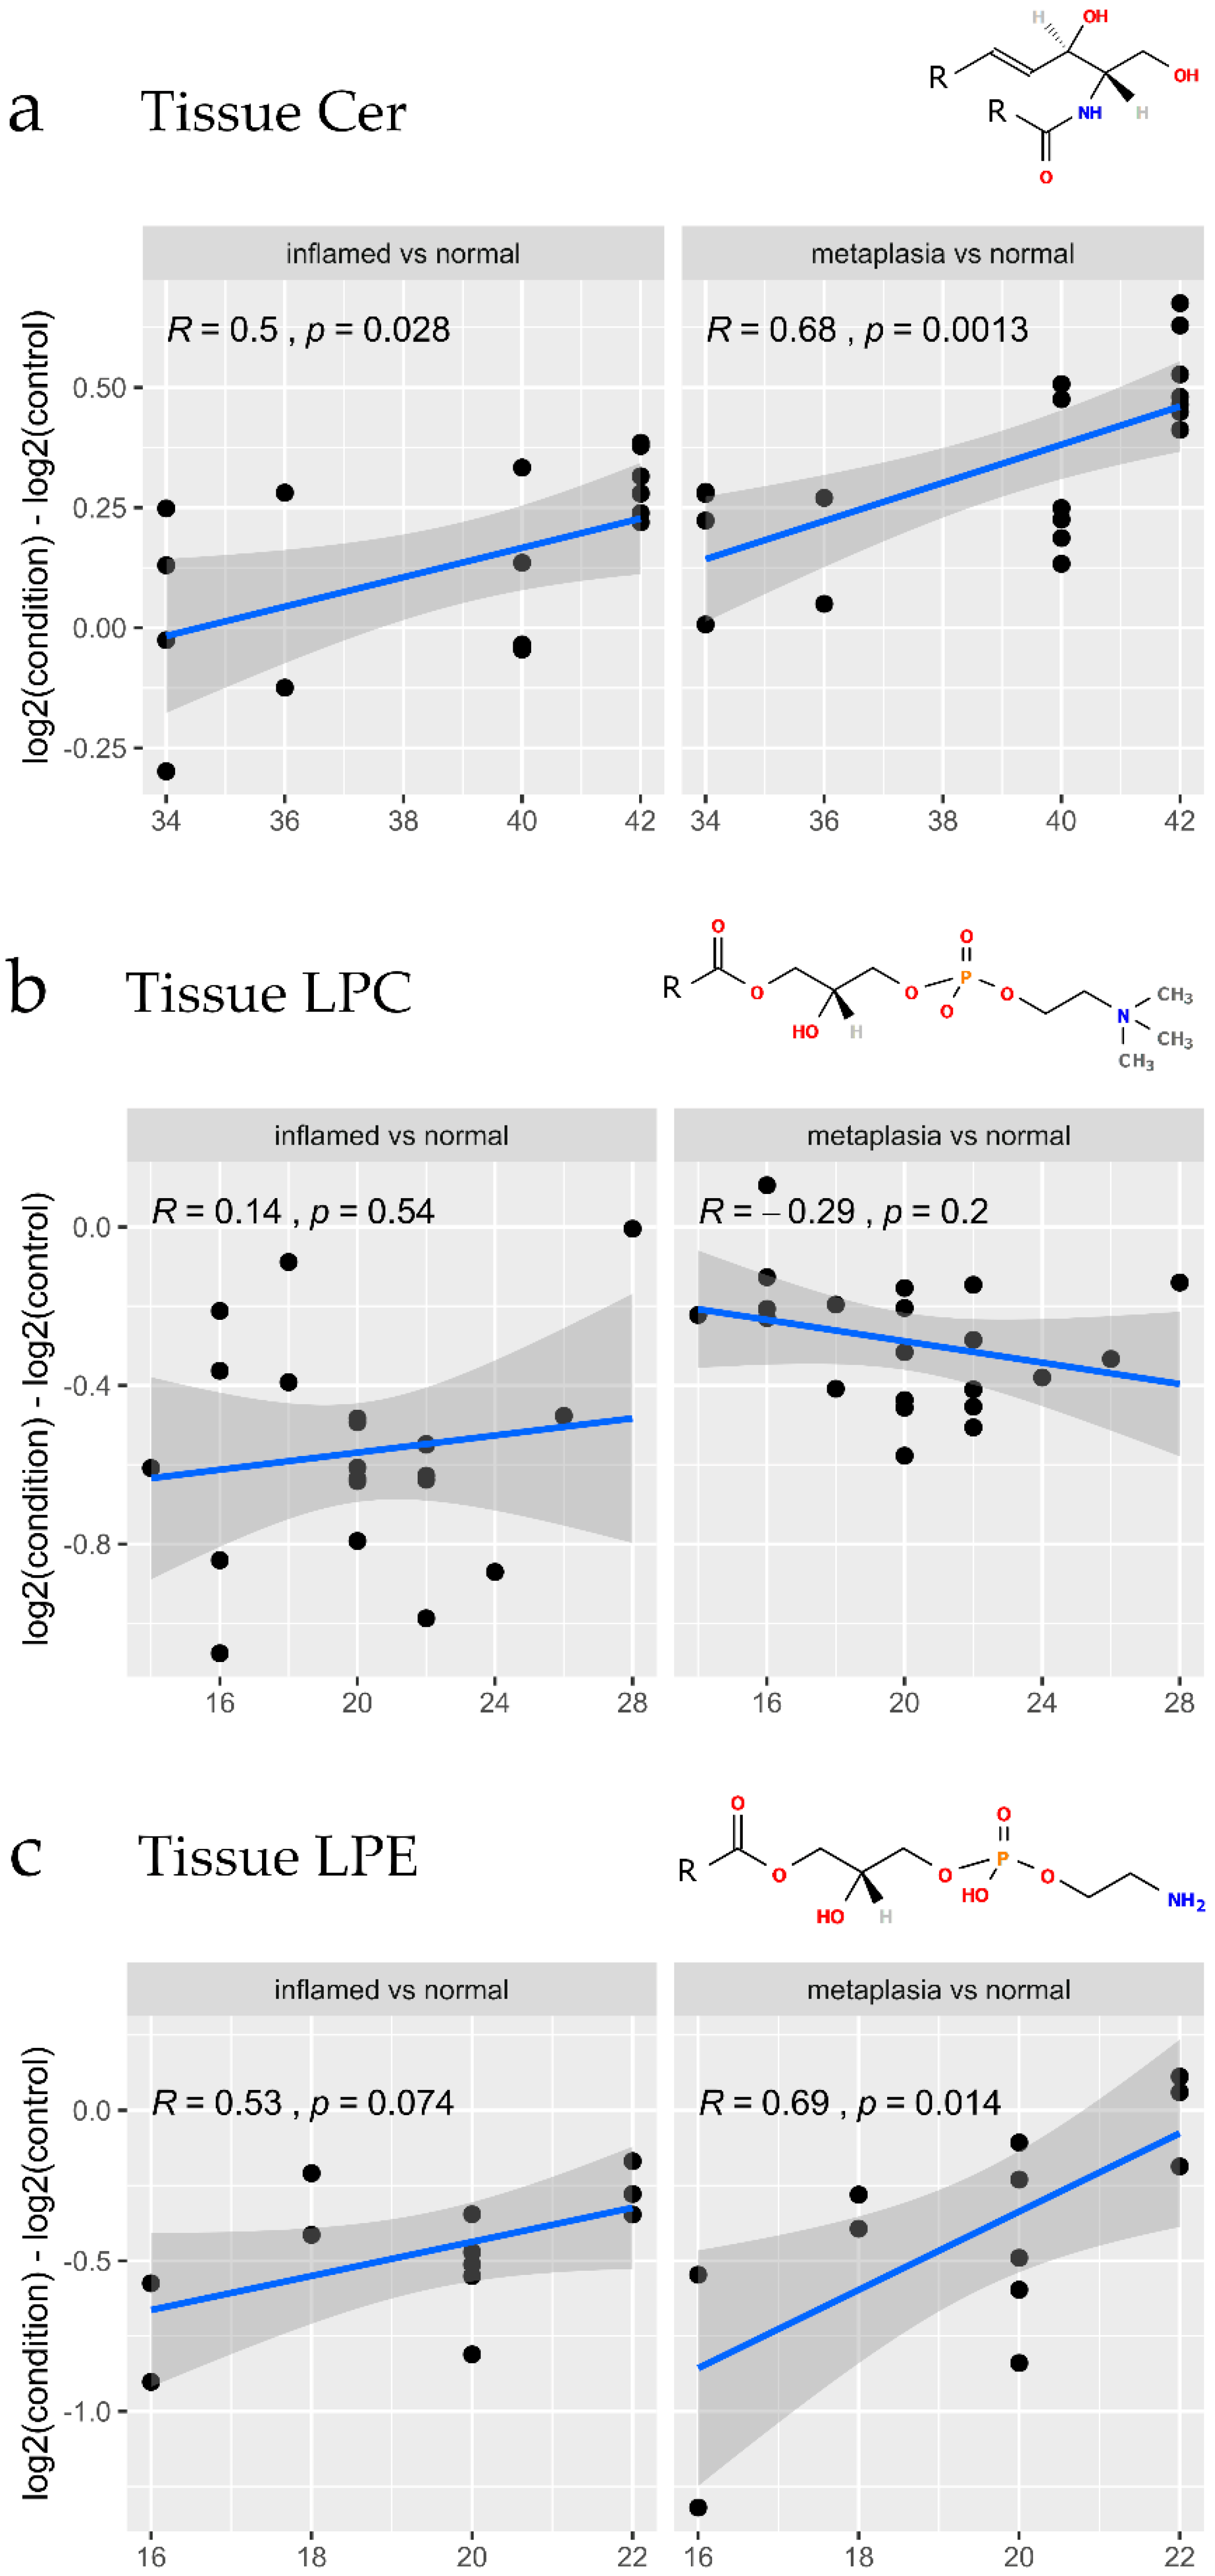
3.4. Lipidomic Changes Associated with Early Tissue Pathology
4. Discussion
5. Conclusions
Supplementary Materials
Author Contributions
Funding
Conflicts of Interest
References
- Daly, J.M.; Fry, W.A.; Little, A.G.; Winchester, D.P.; McKee, R.F.; Stewart, A.K.; Fremgen, A.M. Esophageal cancer: Results of an American College of Surgeons Patient Care Evaluation Study. J. Am. Coll. Surg. 2000, 190, 562–572. [Google Scholar] [CrossRef]
- Pohl, H.; Welch, H.G. The role of overdiagnosis and reclassification in the marked increase of esophageal adenocarcinoma incidence. J. Natl. Cancer Inst. 2005, 97, 142–146. [Google Scholar] [CrossRef] [PubMed]
- Powell, J.; McConkey, C.C.; Gillison, E.W.; Spychal, R.T. Continuing rising trend in oesophageal adenocarcinoma. Int J. Cancer 2002, 102, 422–427. [Google Scholar] [CrossRef] [PubMed]
- Hur, C.; Miller, M.; Kong, C.Y.; Dowling, E.C.; Nattinger, K.J.; Dunn, M.; Feuer, E.J. Trends in esophageal adenocarcinoma incidence and mortality. Cancer 2013, 119, 1149–1158. [Google Scholar] [CrossRef] [Green Version]
- Lagergren, J. Adenocarcinoma of oesophagus: What exactly is the size of the problem and who is at risk? Gut 2005, 54 (Suppl. 1), i1–i5. [Google Scholar] [CrossRef]
- Rubenstein, J.H.; Shaheen, N.J. Epidemiology, Diagnosis, and Management of Esophageal Adenocarcinoma. Gastroenterology 2015, 149, 302–317.e301. [Google Scholar] [CrossRef] [Green Version]
- Enzinger, P.C.; Mayer, R.J. Esophageal cancer. N. Engl. J. Med. 2003, 349, 2241–2252. [Google Scholar] [CrossRef] [Green Version]
- Vakil, N.; van Zanten, S.V.; Kahrilas, P.; Dent, J.; Jones, R.; Global Consensus, G. The Montreal definition and classification of gastroesophageal reflux disease: A global evidence-based consensus. Am. J. Gastroenterol. 2006, 101, 1900–1920; quiz 1943. [Google Scholar] [CrossRef]
- Schlottmann, F.; Patti, M.G.; Shaheen, N.J. From Heartburn to Barrett’s Esophagus, and Beyond. World J. Surg 2017, 41, 1698–1704. [Google Scholar] [CrossRef]
- Chandrasoma, P. Controversies of the cardiac mucosa and Barrett’s oesophagus. Histopathology 2005, 46, 361–373. [Google Scholar] [CrossRef]
- Cossentino, M.J.; Wong, R.K. Barrett’s esophagus and risk of esophageal adenocarcinoma. Semin. Gastrointest. Dis. 2003, 14, 128–135. [Google Scholar] [PubMed]
- Kroep, S.; Lansdorp-Vogelaar, I.; Rubenstein, J.H.; de Koning, H.J.; Meester, R.; Inadomi, J.M.; van Ballegooijen, M. An Accurate Cancer Incidence in Barrett’s Esophagus: A Best Estimate Using Published Data and Modeling. Gastroenterology 2015, 149, 577–585.e4. [Google Scholar] [CrossRef] [PubMed] [Green Version]
- Hvid-Jensen, F.; Pedersen, L.; Drewes, A.M.; Sorensen, H.T.; Funch-Jensen, P. Incidence of adenocarcinoma among patients with Barrett’s esophagus. N. Engl. J. Med. 2011, 365, 1375–1383. [Google Scholar] [CrossRef] [PubMed] [Green Version]
- Coleman, H.G.; Xie, S.H.; Lagergren, J. The Epidemiology of Esophageal Adenocarcinoma. Gastroenterology 2018, 154, 390–405. [Google Scholar] [CrossRef] [PubMed]
- Read, M.D.; Krishnadath, K.K.; Clemons, N.J.; Phillips, W.A. Preclinical models for the study of Barrett’s carcinogenesis. Ann. N. Y. Acad. Sci. 2018, 1434, 139–148. [Google Scholar] [CrossRef]
- Quante, M.; Bhagat, G.; Abrams, J.A.; Marache, F.; Good, P.; Lee, M.D.; Lee, Y.; Friedman, R.; Asfaha, S.; Dubeykovskaya, Z.; et al. Bile acid and inflammation activate gastric cardia stem cells in a mouse model of Barrett-like metaplasia. Cancer Cell 2012, 21, 36–51. [Google Scholar] [CrossRef] [Green Version]
- Munch, N.S.; Fang, H.Y.; Ingermann, J.; Maurer, H.C.; Anand, A.; Kellner, V.; Sahm, V.; Wiethaler, M.; Baumeister, T.; Wein, F.; et al. High-Fat Diet Accelerates Carcinogenesis in a Mouse Model of Barrett’s Esophagus via Interleukin 8 and Alterations to the Gut Microbiome. Gastroenterology 2019, 157, 492–506.e492. [Google Scholar] [CrossRef] [Green Version]
- Nguyen, T.; Khalaf, N.; Ramsey, D.; El-Serag, H.B. Statin use is associated with a decreased risk of Barrett’s esophagus. Gastroenterology 2014, 147, 314–323. [Google Scholar] [CrossRef] [PubMed]
- Beales, I.L.; Dearman, L.; Vardi, I.; Loke, Y. Reduced Risk of Barrett’s Esophagus in Statin Users: Case-Control Study and Meta-Analysis. Dig. Dis. Sci. 2016, 61, 238–246. [Google Scholar] [CrossRef] [PubMed] [Green Version]
- Beales, I.L.; Vardi, I.; Dearman, L. Regular statin and aspirin use in patients with Barrett’s oesophagus is associated with a reduced incidence of oesophageal adenocarcinoma. Eur. J. Gastroenterol. Hepatol. 2012, 24, 917–923. [Google Scholar] [CrossRef] [PubMed]
- Kantor, E.D.; Onstad, L.; Blount, P.L.; Reid, B.J.; Vaughan, T.L. Use of statin medications and risk of esophageal adenocarcinoma in persons with Barrett’s esophagus. Cancer Epidemiol. Biomark. Prev. A Publ. Am. Assoc. Cancer Res. Cosponsored Am. Soc. Prev. Oncol. 2012, 21, 456–461. [Google Scholar] [CrossRef] [PubMed] [Green Version]
- Beales, I.L.; Vardi, I.; Dearman, L.; Broughton, T. Statin use is associated with a reduction in the incidence of esophageal adenocarcinoma: A case control study. Dis. Esophagus 2013, 26, 838–846. [Google Scholar] [CrossRef] [PubMed]
- Nguyen, T.; Duan, Z.; Naik, A.D.; Kramer, J.R.; El-Serag, H.B. Statin Use Reduces Risk of Esophageal Adenocarcinoma in US Veterans With Barrett’s Esophagus: A Nested Case-Control Study. Gastroenterology 2015, 149, 1392–1398. [Google Scholar] [CrossRef] [PubMed] [Green Version]
- Elliott, D.R.F.; Walker, A.W.; O’Donovan, M.; Parkhill, J.; Fitzgerald, R.C. A non-endoscopic device to sample the oesophageal microbiota: A case-control study. Lancet Gastroenterol. Hepatol. 2017, 2, 32–42. [Google Scholar] [CrossRef] [Green Version]
- Yang, L.; Lu, X.; Nossa, C.W.; Francois, F.; Peek, R.M.; Pei, Z. Inflammation and intestinal metaplasia of the distal esophagus are associated with alterations in the microbiome. Gastroenterology 2009, 137, 588–597. [Google Scholar] [CrossRef] [Green Version]
- Kountouras, J.; Doulberis, M.; Papaefthymiou, A.; Polyzos, S.A.; Vardaka, E.; Tzivras, D.; Dardiotis, E.; Deretzi, G.; Giartza-Taxidou, E.; Grigoriadis, S.; et al. A perspective on risk factors for esophageal adenocarcinoma: Emphasis on Helicobacter pylori infection. Ann. N. Y. Acad. Sci. 2019, 1452, 12–17. [Google Scholar] [CrossRef]
- Wang, Z.; Shaheen, N.J.; Whiteman, D.C.; Anderson, L.A.; Vaughan, T.L.; Corley, D.A.; El-Serag, H.B.; Rubenstein, J.H.; Thrift, A.P. Helicobacter pylori Infection Is Associated With Reduced Risk of Barrett’s Esophagus: An Analysis of the Barrett’s and Esophageal Adenocarcinoma Consortium. Am. J. Gastroenterol. 2018, 113, 1148–1155. [Google Scholar] [CrossRef] [Green Version]
- Matyash, V.; Liebisch, G.; Kurzchalia, T.V.; Shevchenko, A.; Schwudke, D. Lipid extraction by methyl-tert-butyl ether for high-throughput lipidomics. J. Lipid Res. 2008, 49, 1137–1146. [Google Scholar] [CrossRef] [Green Version]
- Sangster, T.; Major, H.; Plumb, R.; Wilson, A.J.; Wilson, I.D. A pragmatic and readily implemented quality control strategy for HPLC-MS and GC-MS-based metabonomic analysis. Analyst 2006, 131, 1075–1078. [Google Scholar] [CrossRef]
- Broadhurst, D.; Goodacre, R.; Reinke, S.N.; Kuligowski, J.; Wilson, I.D.; Lewis, M.R.; Dunn, W.B. Guidelines and considerations for the use of system suitability and quality control samples in mass spectrometry assays applied in untargeted clinical metabolomic studies. Metabolomics 2018, 14, 72. [Google Scholar] [CrossRef] [Green Version]
- Tautenhahn, R.; Bottcher, C.; Neumann, S. Highly sensitive feature detection for high resolution LC/MS. Bmc Bioinform. 2008, 9, 504. [Google Scholar] [CrossRef] [PubMed] [Green Version]
- Tsugawa, H.; Cajka, T.; Kind, T.; Ma, Y.; Higgins, B.; Ikeda, K.; Kanazawa, M.; VanderGheynst, J.; Fiehn, O.; Arita, M. MS-DIAL: Data-independent MS/MS deconvolution for comprehensive metabolome analysis. Nat. Methods 2015, 12, 523–526. [Google Scholar] [CrossRef] [PubMed]
- Peng, B.; Ahrends, R. Adaptation of Skyline for Targeted Lipidomics. J. Proteome Res. 2016, 15, 291–301. [Google Scholar] [CrossRef]
- R Core Team. R: A Language and Environment for Statistical Computing; R Foundation for Statistical Computing: Vienna, Austria, 2017. [Google Scholar]
- Dieterle, F.; Ross, A.; Schlotterbeck, G.; Senn, H. Probabilistic quotient normalization as robust method to account for dilution of complex biological mixtures. Application in 1H NMR metabonomics. Anal. Chem. 2006, 78, 4281–4290. [Google Scholar] [CrossRef]
- Mohamed, A.; Molendijk, J.; Hill, M.M. lipidr: A Software Tool for Data Mining and Analysis of Lipidomics Datasets. J. Proteome Res. 2020. [Google Scholar] [CrossRef]
- Bolyen, E.; Rideout, J.R.; Dillon, M.R.; Bokulich, N.A.; Abnet, C.C.; Al-Ghalith, G.A.; Alexander, H.; Alm, E.J.; Arumugam, M.; Asnicar, F.; et al. Reproducible, interactive, scalable and extensible microbiome data science using QIIME 2. Nat. Biotechnol. 2019, 37, 852–857. [Google Scholar] [CrossRef] [PubMed]
- Zakrzewski, M.; Proietti, C.; Ellis, J.J.; Hasan, S.; Brion, M.J.; Berger, B.; Krause, L. Calypso: A user-friendly web-server for mining and visualizing microbiome-environment interactions. Bioinformatics 2016. [Google Scholar] [CrossRef] [PubMed] [Green Version]
- Molendijk, J.; Robinson, H.; Djuric, Z.; Hill, M.M. Lipid mechanisms in hallmarks of cancer. Mol. Omics 2020. [Google Scholar] [CrossRef] [PubMed]
- Zalewska, A.; Maciejczyk, M.; Szulimowska, J.; Imierska, M.; Blachnio-Zabielska, A. High-Fat Diet Affects Ceramide Content, Disturbs Mitochondrial Redox Balance, and Induces Apoptosis in the Submandibular Glands of Mice. Biomolecules 2019, 9, 877. [Google Scholar] [CrossRef] [Green Version]
- Wang, B.; Tontonoz, P. Phospholipid Remodeling in Physiology and Disease. Annu. Rev. Physiol. 2019, 81, 165–188. [Google Scholar] [CrossRef]
- Warnecke-Eberz, U.; Metzger, R.; Holscher, A.H.; Drebber, U.; Bollschweiler, E. Diagnostic marker signature for esophageal cancer from transcriptome analysis. Tumour Biol. 2016, 37, 6349–6358. [Google Scholar] [CrossRef]
- Mansilla, F.; da Costa, K.A.; Wang, S.; Kruhoffer, M.; Lewin, T.M.; Orntoft, T.F.; Coleman, R.A.; Birkenkamp-Demtroder, K. Lysophosphatidylcholine acyltransferase 1 (LPCAT1) overexpression in human colorectal cancer. J. Mol. Med. (Berl) 2009, 87, 85–97. [Google Scholar] [CrossRef] [Green Version]
- Morita, Y.; Sakaguchi, T.; Ikegami, K.; Goto-Inoue, N.; Hayasaka, T.; Hang, V.T.; Tanaka, H.; Harada, T.; Shibasaki, Y.; Suzuki, A.; et al. Lysophosphatidylcholine acyltransferase 1 altered phospholipid composition and regulated hepatoma progression. J. Hepatol. 2013, 59, 292–299. [Google Scholar] [CrossRef] [PubMed]
- Uehara, T.; Kikuchi, H.; Miyazaki, S.; Iino, I.; Setoguchi, T.; Hiramatsu, Y.; Ohta, M.; Kamiya, K.; Morita, Y.; Tanaka, H.; et al. Overexpression of Lysophosphatidylcholine Acyltransferase 1 and Concomitant Lipid Alterations in Gastric Cancer. Ann. Surg Oncol 2016, 23 (Suppl. 2), S206–S213. [Google Scholar] [CrossRef] [PubMed] [Green Version]
- Du, Y.; Wang, Q.; Zhang, X.; Wang, X.; Qin, C.; Sheng, Z.; Yin, H.; Jiang, C.; Li, J.; Xu, T. Lysophosphatidylcholine acyltransferase 1 upregulation and concomitant phospholipid alterations in clear cell renal cell carcinoma. J. Exp. Clin. Cancer Res. 2017, 36, 66. [Google Scholar] [CrossRef] [Green Version]
- Lauby-Secretan, B.; Scoccianti, C.; Loomis, D.; Grosse, Y.; Bianchini, F.; Straif, K. International Agency for Research on Cancer Handbook Working, G. Body Fatness and Cancer--Viewpoint of the IARC Working Group. N. Engl. J. Med. 2016, 375, 794–798. [Google Scholar] [CrossRef] [PubMed] [Green Version]
- Garcia-Jaramillo, M.; Spooner, M.H.; Lohr, C.V.; Wong, C.P.; Zhang, W.; Jump, D.B. Lipidomic and transcriptomic analysis of western diet-induced nonalcoholic steatohepatitis (NASH) in female Ldlr -/- mice. PLoS ONE 2019, 14, e0214387. [Google Scholar] [CrossRef] [Green Version]
- Ridlon, J.M.; Kang, D.J.; Hylemon, P.B.; Bajaj, J.S. Bile acids and the gut microbiome. Curr. Opin. Gastroenterol. 2014, 30, 332–338. [Google Scholar] [CrossRef] [Green Version]
- Gorkiewicz, G.; Moschen, A. Gut microbiome: A new player in gastrointestinal disease. Virchows Arch. 2018, 472, 159–172. [Google Scholar] [CrossRef] [Green Version]
- Liu, N.; Ando, T.; Ishiguro, K.; Maeda, O.; Watanabe, O.; Funasaka, K.; Nakamura, M.; Miyahara, R.; Ohmiya, N.; Goto, H. Characterization of bacterial biota in the distal esophagus of Japanese patients with reflux esophagitis and Barrett’s esophagus. BMC Infect. Dis 2013, 13, 130. [Google Scholar] [CrossRef] [Green Version]


© 2020 by the authors. Licensee MDPI, Basel, Switzerland. This article is an open access article distributed under the terms and conditions of the Creative Commons Attribution (CC BY) license (http://creativecommons.org/licenses/by/4.0/).
Share and Cite
Molendijk, J.; Nguyen, T.-M.-T.; Brown, I.; Mohamed, A.; Lim, Y.; Barclay, J.; Hodson, M.P.; Hennessy, T.P.; Krause, L.; Morrison, M.; et al. Chronic High-Fat Diet Induces Early Barrett’s Esophagus in Mice through Lipidome Remodeling. Biomolecules 2020, 10, 776. https://doi.org/10.3390/biom10050776
Molendijk J, Nguyen T-M-T, Brown I, Mohamed A, Lim Y, Barclay J, Hodson MP, Hennessy TP, Krause L, Morrison M, et al. Chronic High-Fat Diet Induces Early Barrett’s Esophagus in Mice through Lipidome Remodeling. Biomolecules. 2020; 10(5):776. https://doi.org/10.3390/biom10050776
Chicago/Turabian StyleMolendijk, Jeffrey, Thi-My-Tam Nguyen, Ian Brown, Ahmed Mohamed, Yenkai Lim, Johanna Barclay, Mark P. Hodson, Thomas P. Hennessy, Lutz Krause, Mark Morrison, and et al. 2020. "Chronic High-Fat Diet Induces Early Barrett’s Esophagus in Mice through Lipidome Remodeling" Biomolecules 10, no. 5: 776. https://doi.org/10.3390/biom10050776