Article

Translational Applications of Artificial Intelligence and Machine Learning for Diagnostic Pathology in Lymphoid Neoplasms: A Comprehensive and Evolutive Analysis

by
Julia Moran-Sanchez
1,2,
Antonio Santisteban-Espejo
3,4,*,
Miguel Angel Martin-Piedra
5,
Jose Perez-Requena
3 and
Marcial Garcia-Rojo
3,4
1
Division of Hematology and Hemotherapy, Puerta del Mar Hospital, 11009 Cadiz, Spain
2
Ph.D Program of Clinical Medicine and Surgery, University of Cadiz, 11009 Cadiz, Spain
3
Pathology Department, Puerta del Mar Hospital, 11009 Cadiz, Spain
4
Institute of Research and Innovation in Biomedical Sciences of the Province of Cadiz (INiBICA), University of Cadiz, 11009 Cadiz, Spain
5
Tissue Engineering Group, Department of Histology, University of Granada, 18016 Granada, Spain
*
Author to whom correspondence should be addressed.
Biomolecules 2021, 11(6), 793; https://doi.org/10.3390/biom11060793
Submission received: 16 April 2021 / Revised: 13 May 2021 / Accepted: 24 May 2021 / Published: 25 May 2021
(This article belongs to the Special Issue Digital Pathology)

Abstract

:
Genomic analysis and digitalization of medical records have led to a big data scenario within hematopathology. Artificial intelligence and machine learning tools are increasingly used to integrate clinical, histopathological, and genomic data in lymphoid neoplasms. In this study, we identified global trends, cognitive, and social framework of this field from 1990 to 2020. Metadata were obtained from the Clarivate Analytics Web of Science database in January 2021. A total of 525 documents were assessed by document type, research areas, source titles, organizations, and countries. SciMAT and VOSviewer package were used to perform scientific mapping analysis. Geographical distribution showed the USA and People’s Republic of China as the most productive countries, reporting up to 190 (36.19%) of all documents. A third-degree polynomic equation predicts that future global production in this area will be three-fold the current number, near 2031. Thematically, current research is focused on the integration of digital image analysis and genomic sequencing in Non-Hodgkin lymphomas, prediction of chemotherapy response and validation of new prognostic models. These findings can serve pathology departments to depict future clinical and research avenues, but also, public institutions and administrations to promote synergies and optimize funding allocation.

1. Introduction

The storage of clinical information in the electronic medical record and the incorporation of omics data (genomic, transcriptomic, and proteomic) into the patient’s history have led to a novel scenario within pathology departments. Currently, large volumes of information are available for investigators and clinicians, who need to process, integrate, and translate them into daily medical practice.
This data-driven paradigm of 4P medicine (predictive, personalized, preventive, and participative) [1] requires the implementation of computer systems able to process this huge amount of clinical information. In this setting, artificial intelligence (AI) and machine learning (ML) tools have the potential to meliorate diagnostic precision and improve prediction accuracy, and, thus, contribute to a better planification of personalized therapeutic strategies [2].
In recent years, several countries have made public their national research, development, and innovation (RDI) strategies in AI [3,4,5]. The European Union (EU) [6], the United States of America (USA) [7,8,9], and the United Kingdom (UK) [10,11] have communicated their plans for economic coordination in AI and, specifically, an investment increase of 20 billion euros per year is foreseen until 2027 in the EU to develop its coordinated strategy in AI [6].
Among medical disciplines, the field of hematopathology has been pioneering in the application of novel methodologies into the clinical setting, leading to milestones in translational cancer research, such as molecular targeted therapies in chronic myeloid leukemia and acute promyelocytic leukemia, which have rendered curable diseases once considered fatal [12,13].
Regarding this, several works have reported the crescent use of AI and ML tools in the diagnosis of hematological diseases [14,15]. Among hematological malignancies, lymphoid neoplasms (LN) constitute one of the most active foci of research in this area, and different AI algorithms have been developed to improve accuracy in lymphoma subtyping [16,17], validation of prognostic models [18], and prediction of chemotherapy response [19,20]. However, a global analysis of the major trends, leading producers, and scientific mapping of AI and ML applications to diagnostic pathology in LN has not yet been undertaken.
In this study, we evaluated AI and ML applications in LN through bibliometric techniques. Documental evolution, prediction on future production, and leading research centers and countries were identified. Furthermore, we performed scientific mapping analysis (SMA) by means of the packages SciMAT (Science Mapping Analysis Software Tool) [21] and VOS (Visualizing Of Science) viewer [22] to longitudinally assess the cognitive framework and social structure of this research field.

2. Materials and Methods

2.1. Sample

The metadata used in the study were obtained from the Clarivate Analytics Web of Science (WoS) core collection database of the Thomson Reuters Institute for Scientific Information (ISI) (Philadelphia, PA, USA). Documents were retrieved by searching ((“artificial intelligence” or “deep learning” or “machine learning” or “neural network” or “support vector” or “natural language”) and (“lymphoid neoplasm” or lymphoma or lymphoproliferative or lymphocytic or gammopathy or myeloma or histiocytic)) as topics in the SCI-Expanded Collection for a period range from 1990 to 2020. The dataset was extracted in January 2021 and downloaded in a tab delimited TXT format.
WoS provides information for more than 250 disciplines and, when performing bibliometric analysis, citation data availability is considered one of its main advantages in comparison with other scientific databases such as MedLine [23,24]. Additionally, because of its wide use among the biomedical community, and to evaluate the consistence of our query, we also tested it in PubMed, filtering by article type (journal articles and reviews), subject (cancer; neither AIDS nor complementary medicine), journal (MEDLINE; neither dental journals nor nursing journals), and for the same period (1990–2020). A total of 528 documents was obtained, and we could confirm homogeneity in the retrieved results.

2.2. Performance Analysis

Obtained results were classified by document type and then, analysis by research areas, source titles, organizations, and countries was performed on original articles, reviews, proceeding papers, and meeting abstracts, by excluding other minor types such as letters, book chapters, and editorial material.

2.3. Science Mapping Analysis (SMA)

SciMAT (Version 1.1.04., University of Granada, Granada, Spain, License GPLv3) and VOS Viewer (Version 1.6.16., Centre for Science and Technology Studies, Leiden University, Leiden, The Netherlands) software were used to perform SMA. In order to achieve a better comprehension of the development of the research field, the analysis was performed for the subperiods: (1) 1990–2005, (2) 2006–2014, and (3) 2015–2020, allowing for a homogeneous distribution of documents.

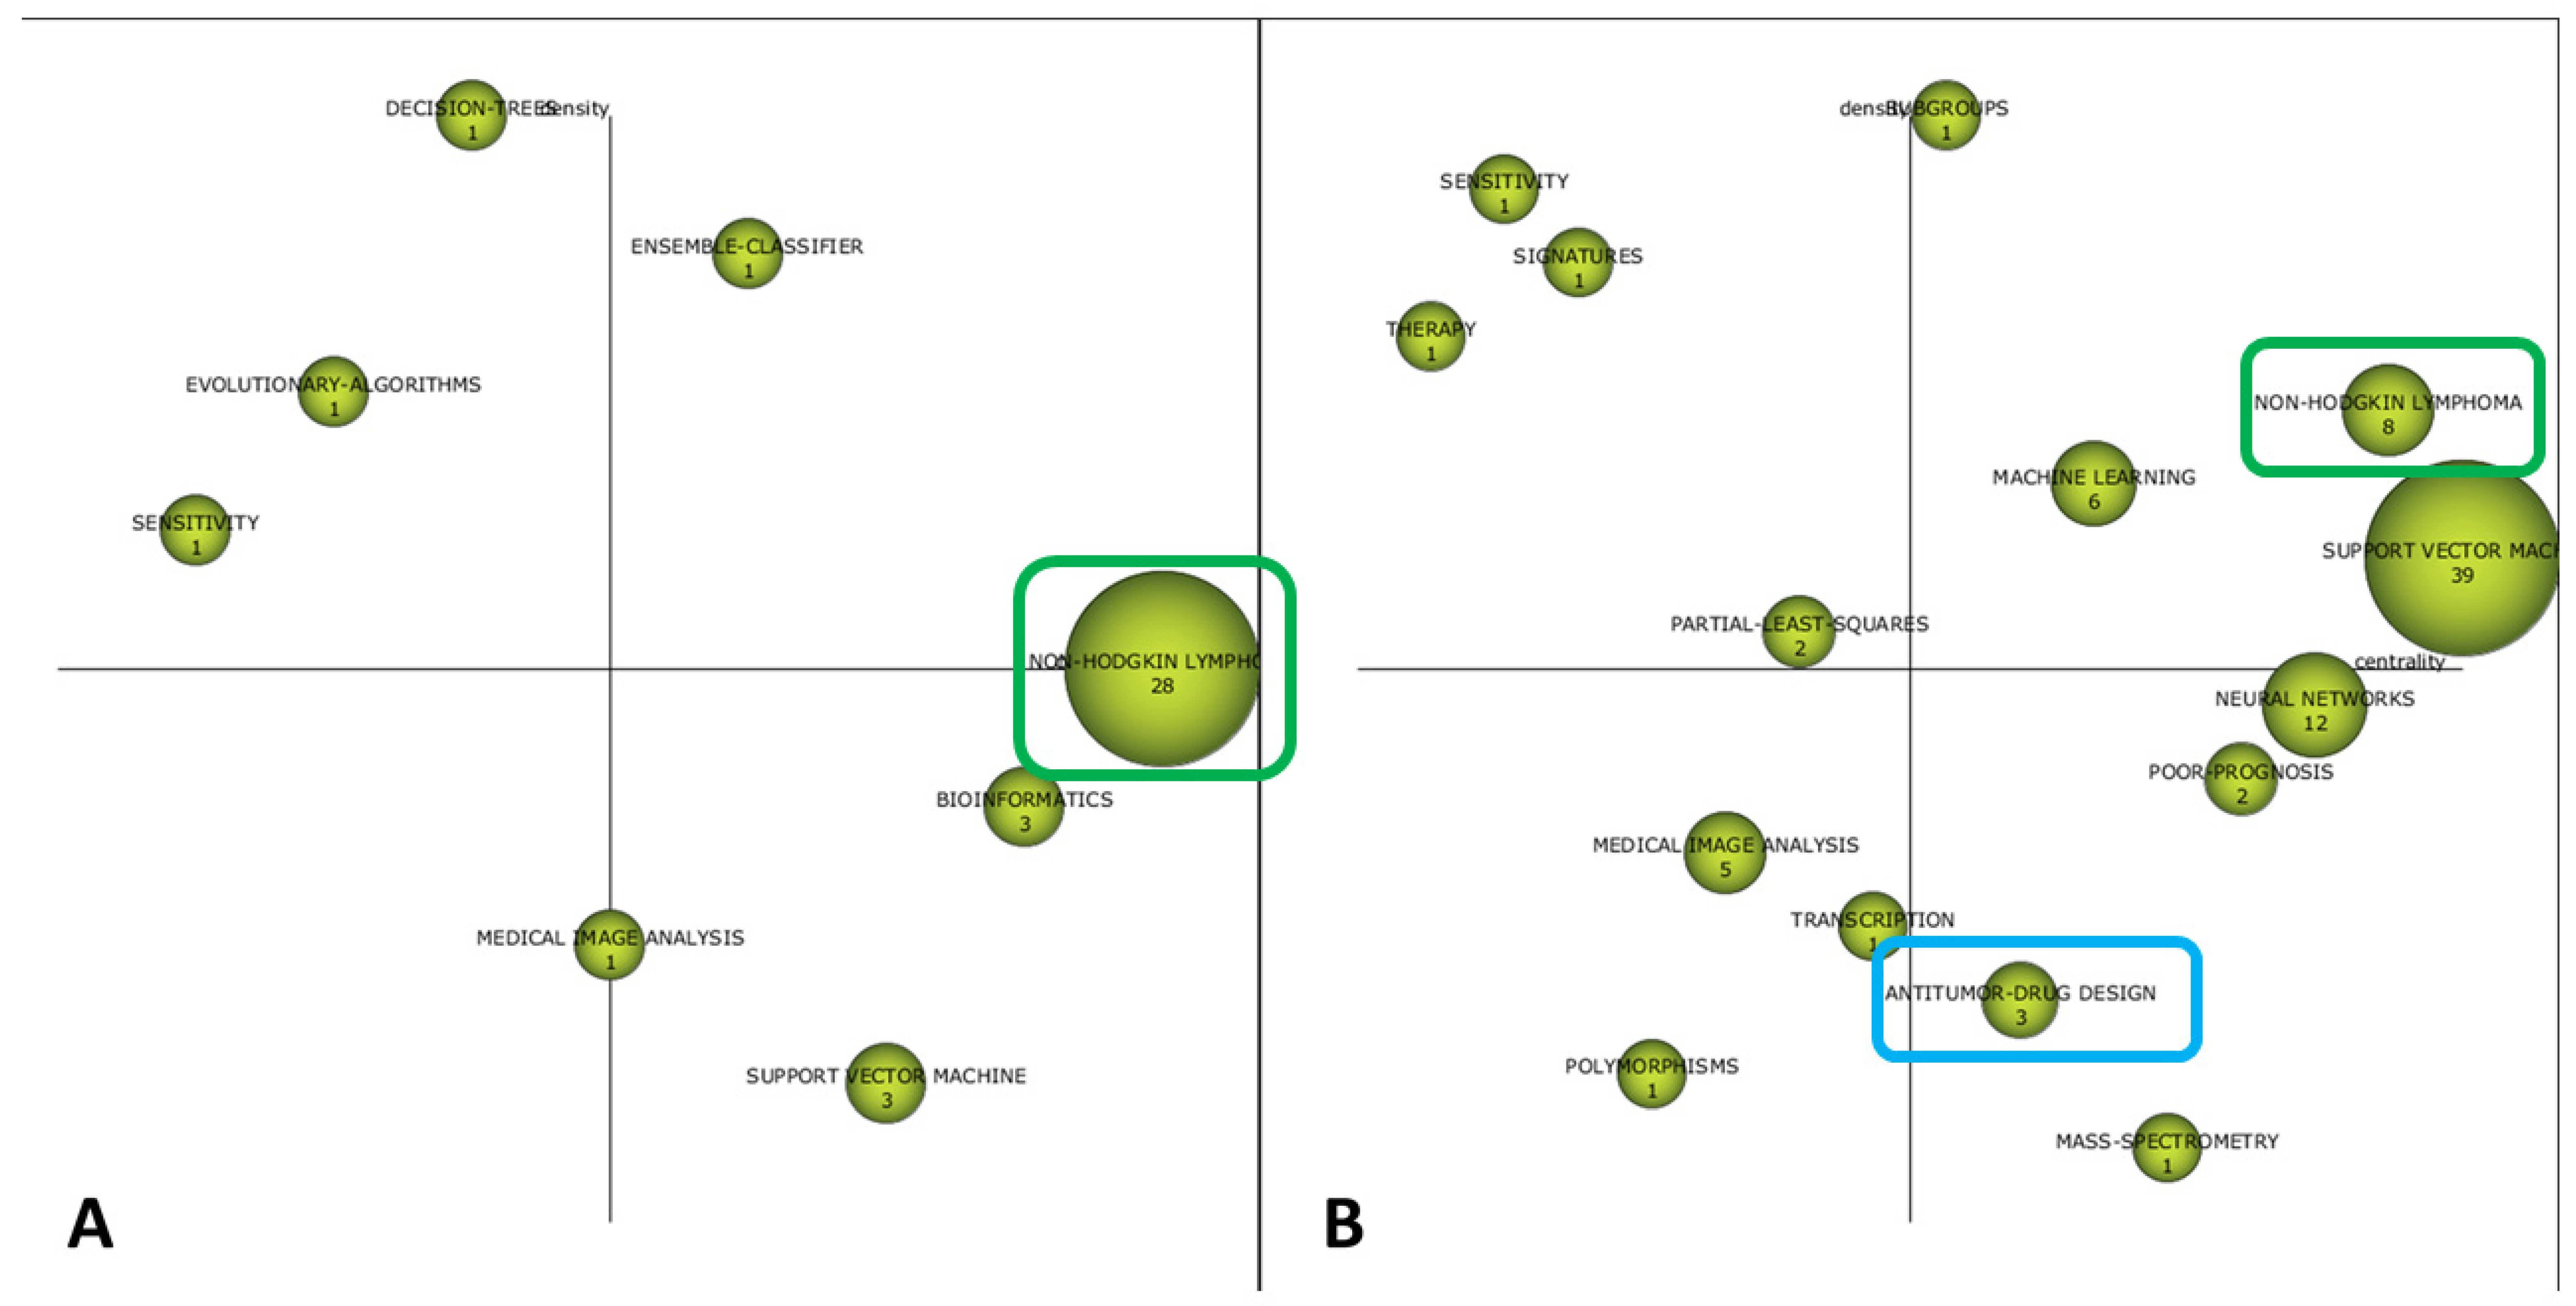
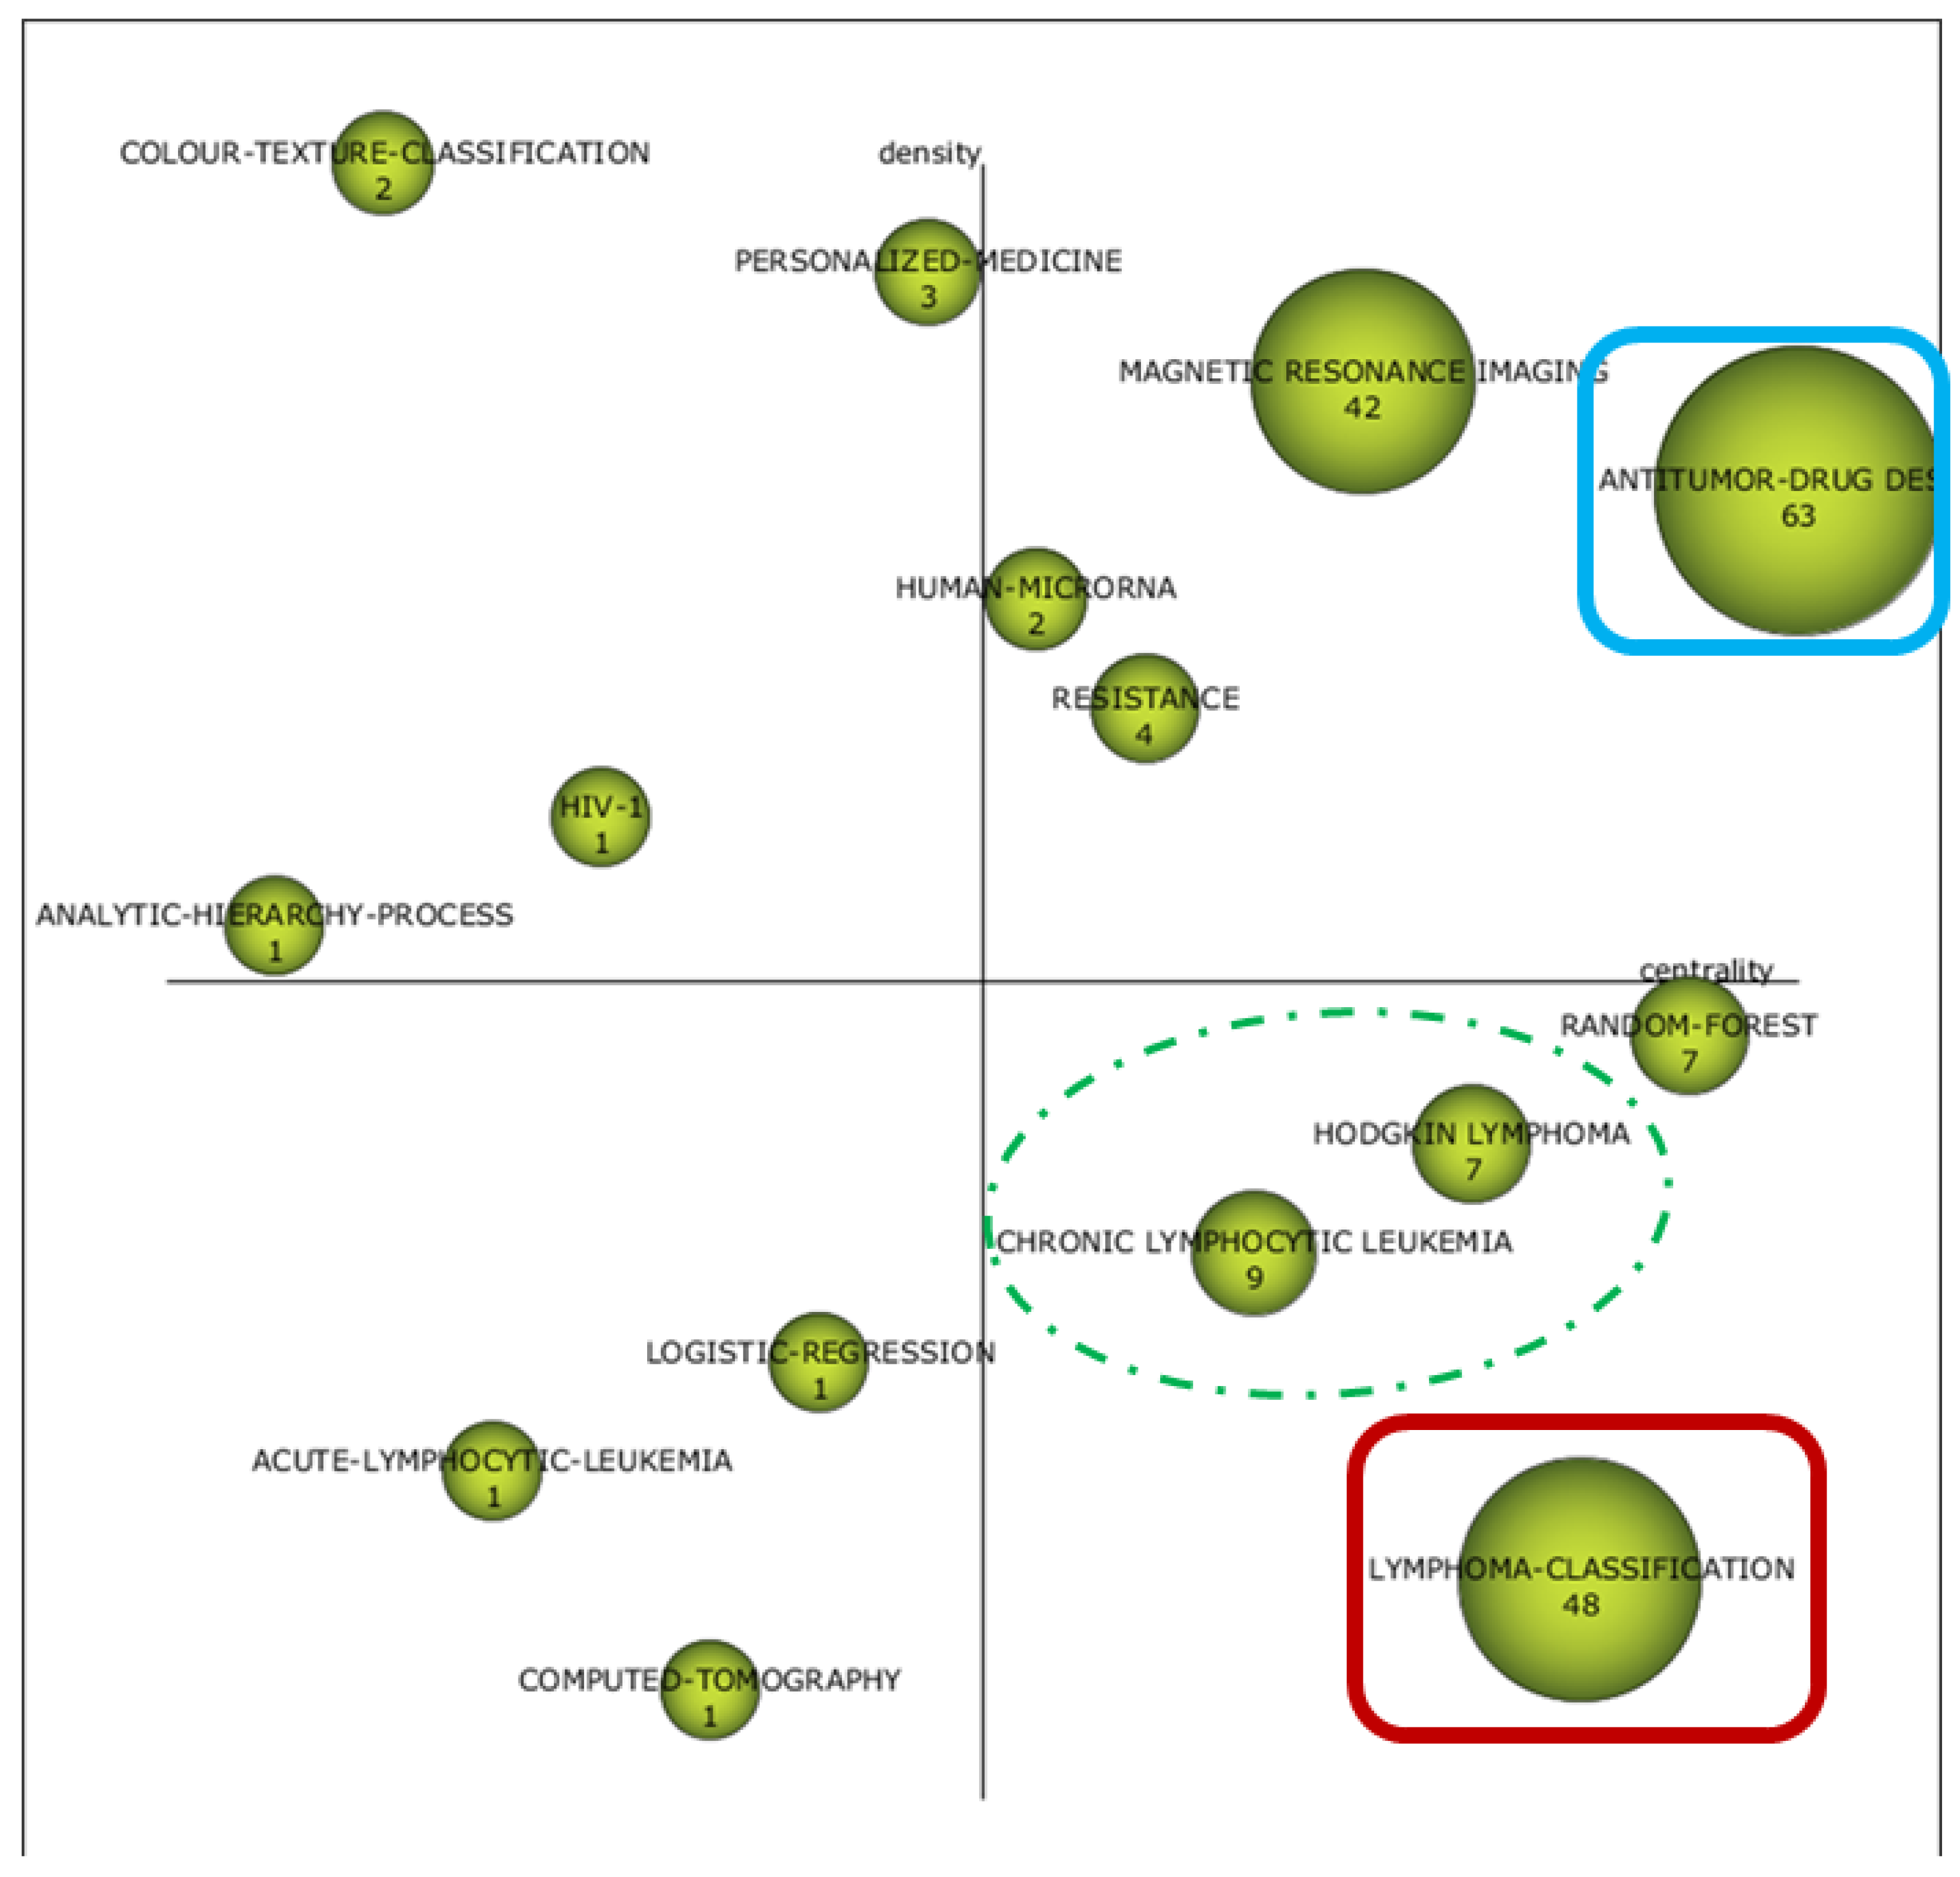
2.3.1. SMA for Cognitive Framework

SciMAT was employed to longitudinally evaluate the cognitive framework of the area, as previously reported [24]. Briefly, SciMAT uses the author’s keywords (AK) of each article to construct a co-occurrence matrix (CM). Each significant concept (or theme) is defined as the group of AK employed by different researchers during the period analyzed. At this point, the simple center algorithm is applied to construct a thematic network from the CM previously defined. Consequently, the volume of the spheres shown in the strategic diagram is proportional to the number of published articles that contain this specific notion.
Regarding the sources used to construct these strategic diagrams with SciMAT, the package employs the files containing the bibliometric information required, that is, the set of keywords included in each document within the dataset, as it is retrieved from WoS after performing the query term above mentioned. In this sense, a co-occurrence of two keywords during the process of analysis is defined as the joint appearance of two keywords in the same document, as originally conceived by Callon et al. in the seminal papers which laid the foundations of co-word analysis [25,26]. In this study, we employed the simple center algorithm to perform this task, but other approaches were also described such as the single-linkage or sum-linkage [27,28]. Nevertheless, the simple center algorithm has also been validated and employed to identify, characterize, and visualize the cognitive evolution of scientific research in other disciplines [23].
Once these concepts (themes) are obtained, a two-dimensional strategic diagram is depicted based on Callon´s centrality and Callon´s density [25]. These parameters allow a research field to be comprehended as a set of research themes, and SciMAT enabled us to map them into four groups:
(a)
Motor themes (MT): Present a high density and a strong centrality signifying the most developed themes for the research area studied (upper-right quadrant);
(b)
Basic and transversal themes (BT): Represent themes shared for several disciplines; thus, their foundations are well-established (lower-right quadrant);
(c)
Emerging or declining themes (ED): Have a weak density and a low centrality and, thus, represent marginal areas of knowledge (lower-left quadrant);
(d)
Highly developed or isolated themes (HDI): Show a high density, meaning a significant internal development. However, they are less connected with other themes in the research field because of their low centrality values (upper-left quadrant).

2.3.2. SMA for Social Framework

VOSviewer was used as previously described by Van Eck and Waltman [22]. VOSviewer allows users to create scientific maps based on network data and exploring them. Its workflow consists of three steps.
First, VOSviewer defines a CM based on the times that any pair of items appear together within the documental corpus. Second, the software applies an algorithm to display a distance-map where each point represents an item in a space. Herein, the VOSviewer uses the SMACOF algorithm to approximate actual Euclidean distances to an ideal model [29]. Third, the maps obtained need to be translated, rotated, and reflected to achieve consistent results.
In our analysis, institutions and countries were evaluated according to its bibliometric coupling relation, that is, the existence of a common cited reference in their reference list [30]. The number of documents published and the number of cites received for each institution or country were employed as weights. Consequently, the final result was a map where the distance between institutions and countries was proportional to its bibliometric coupling relation, and the size of each label in the map was proportional to the number of documents reported or citations received in the period evaluated.

3. Results

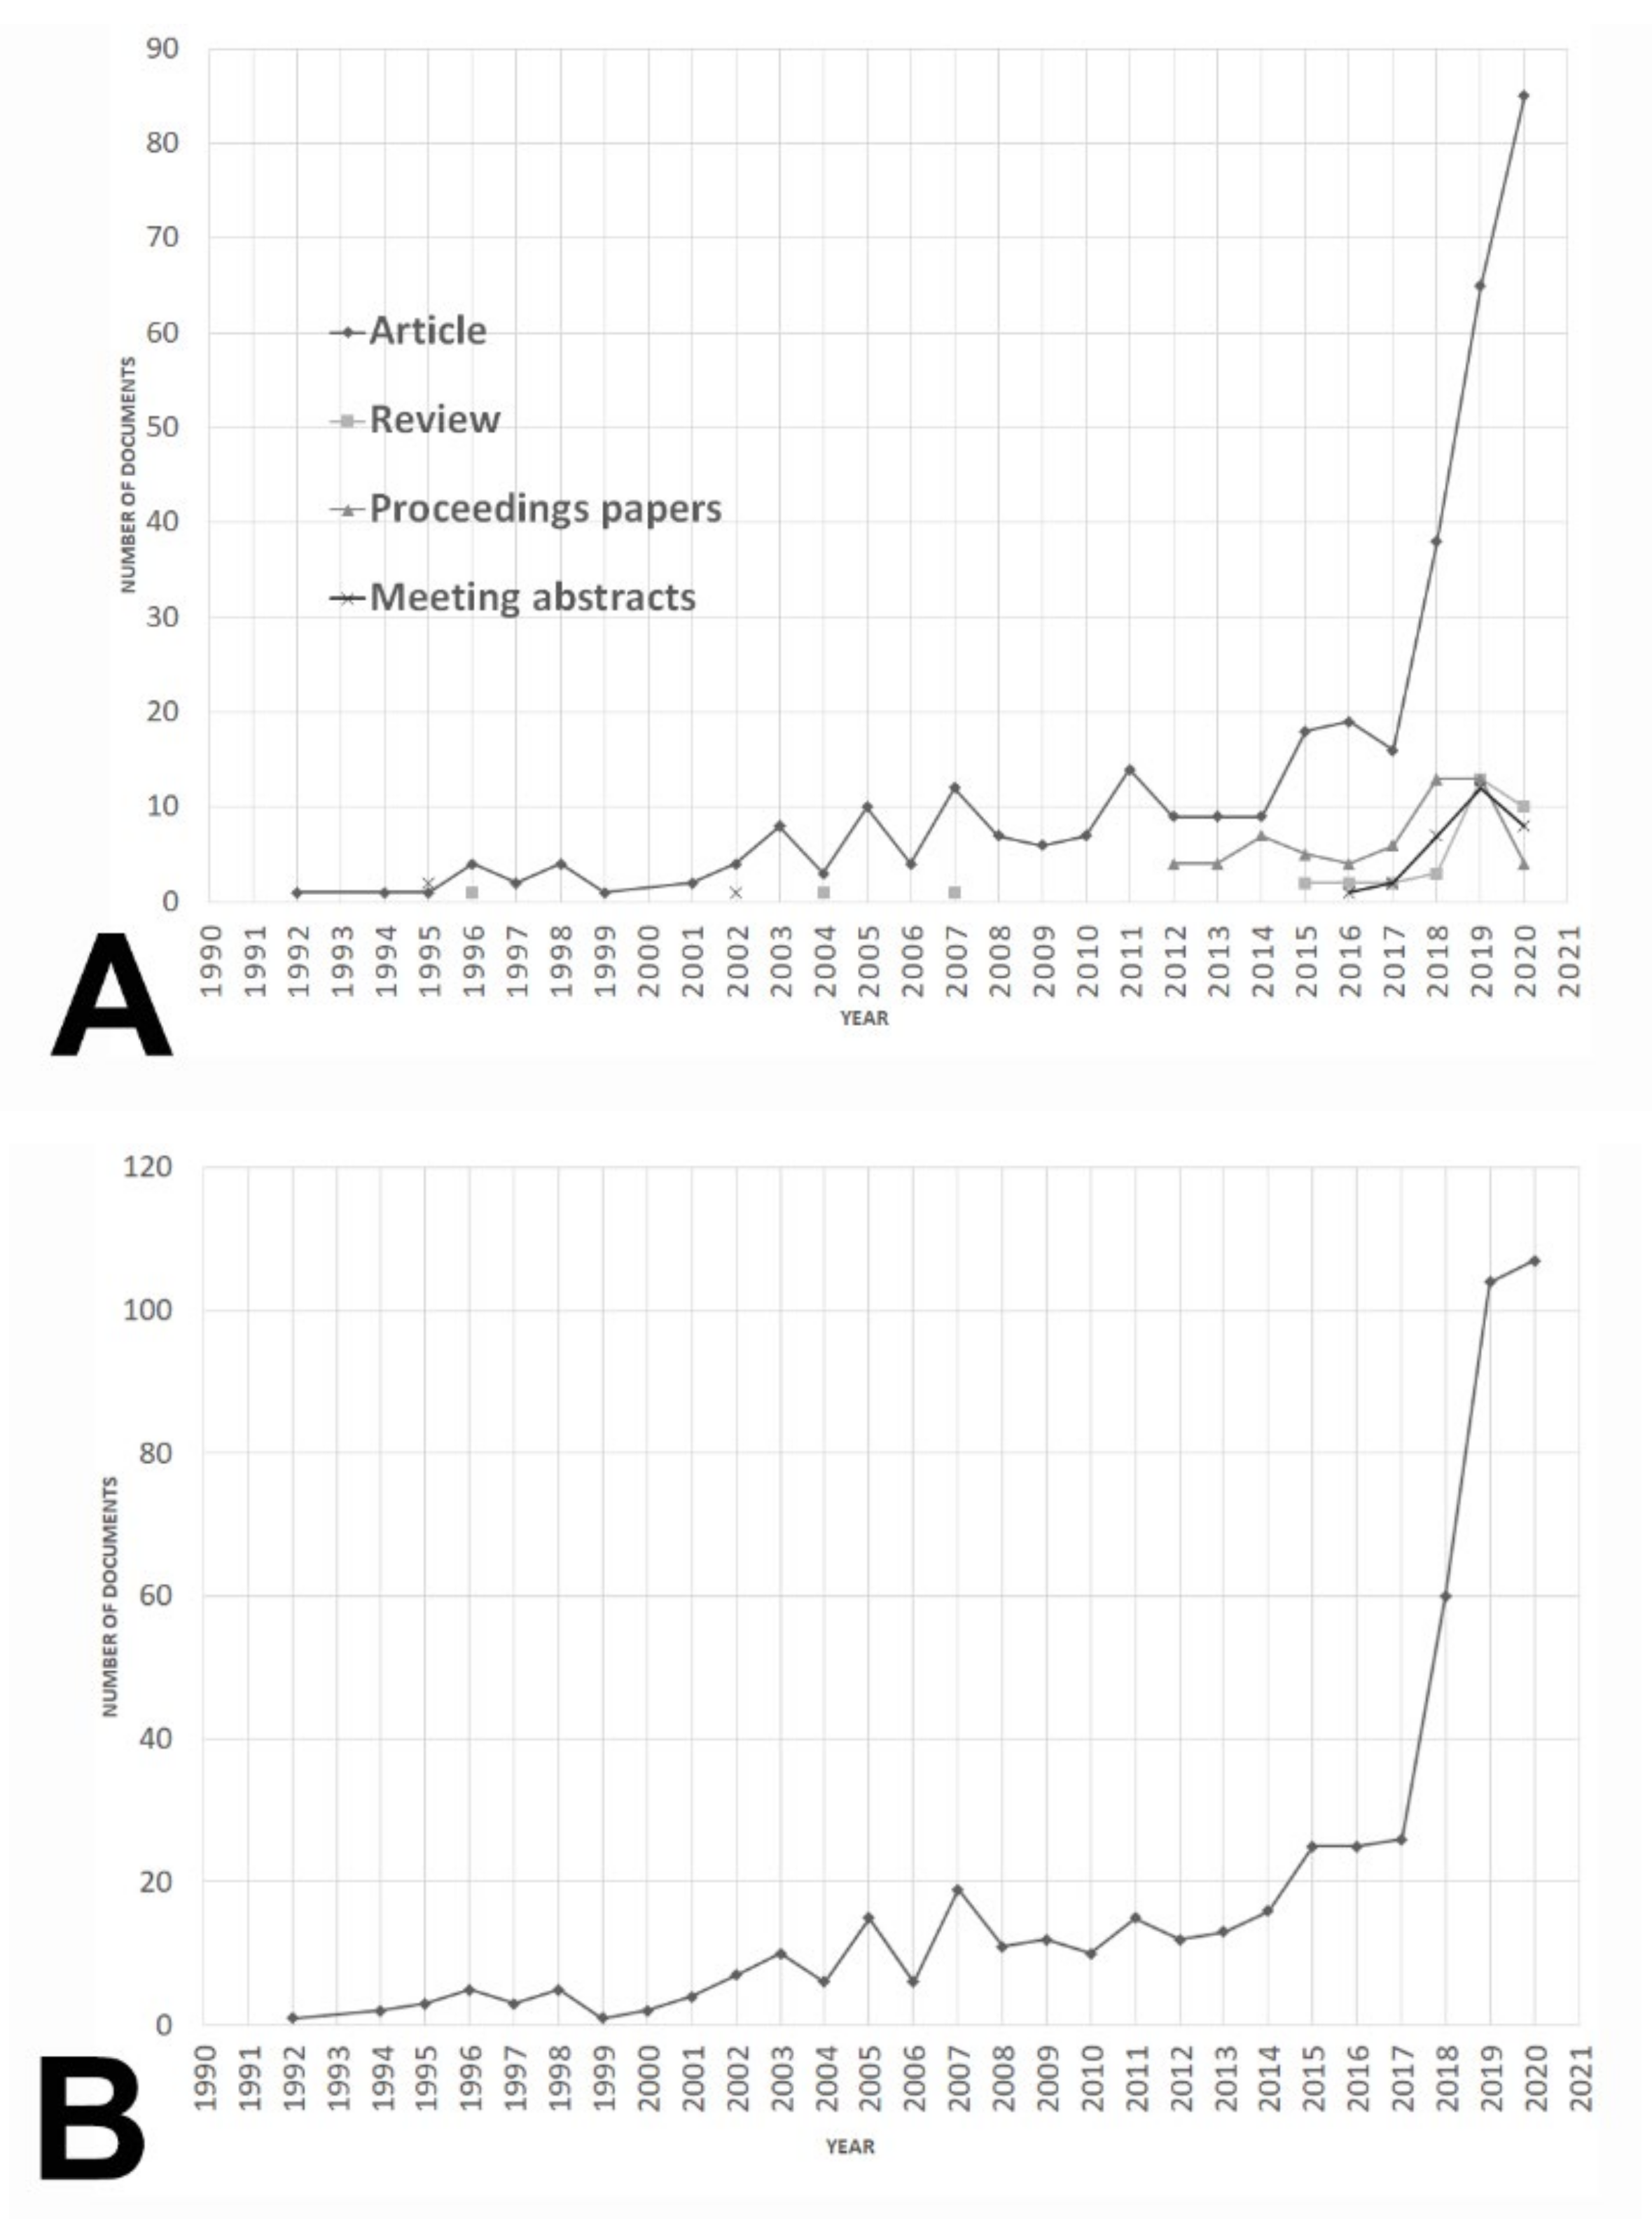
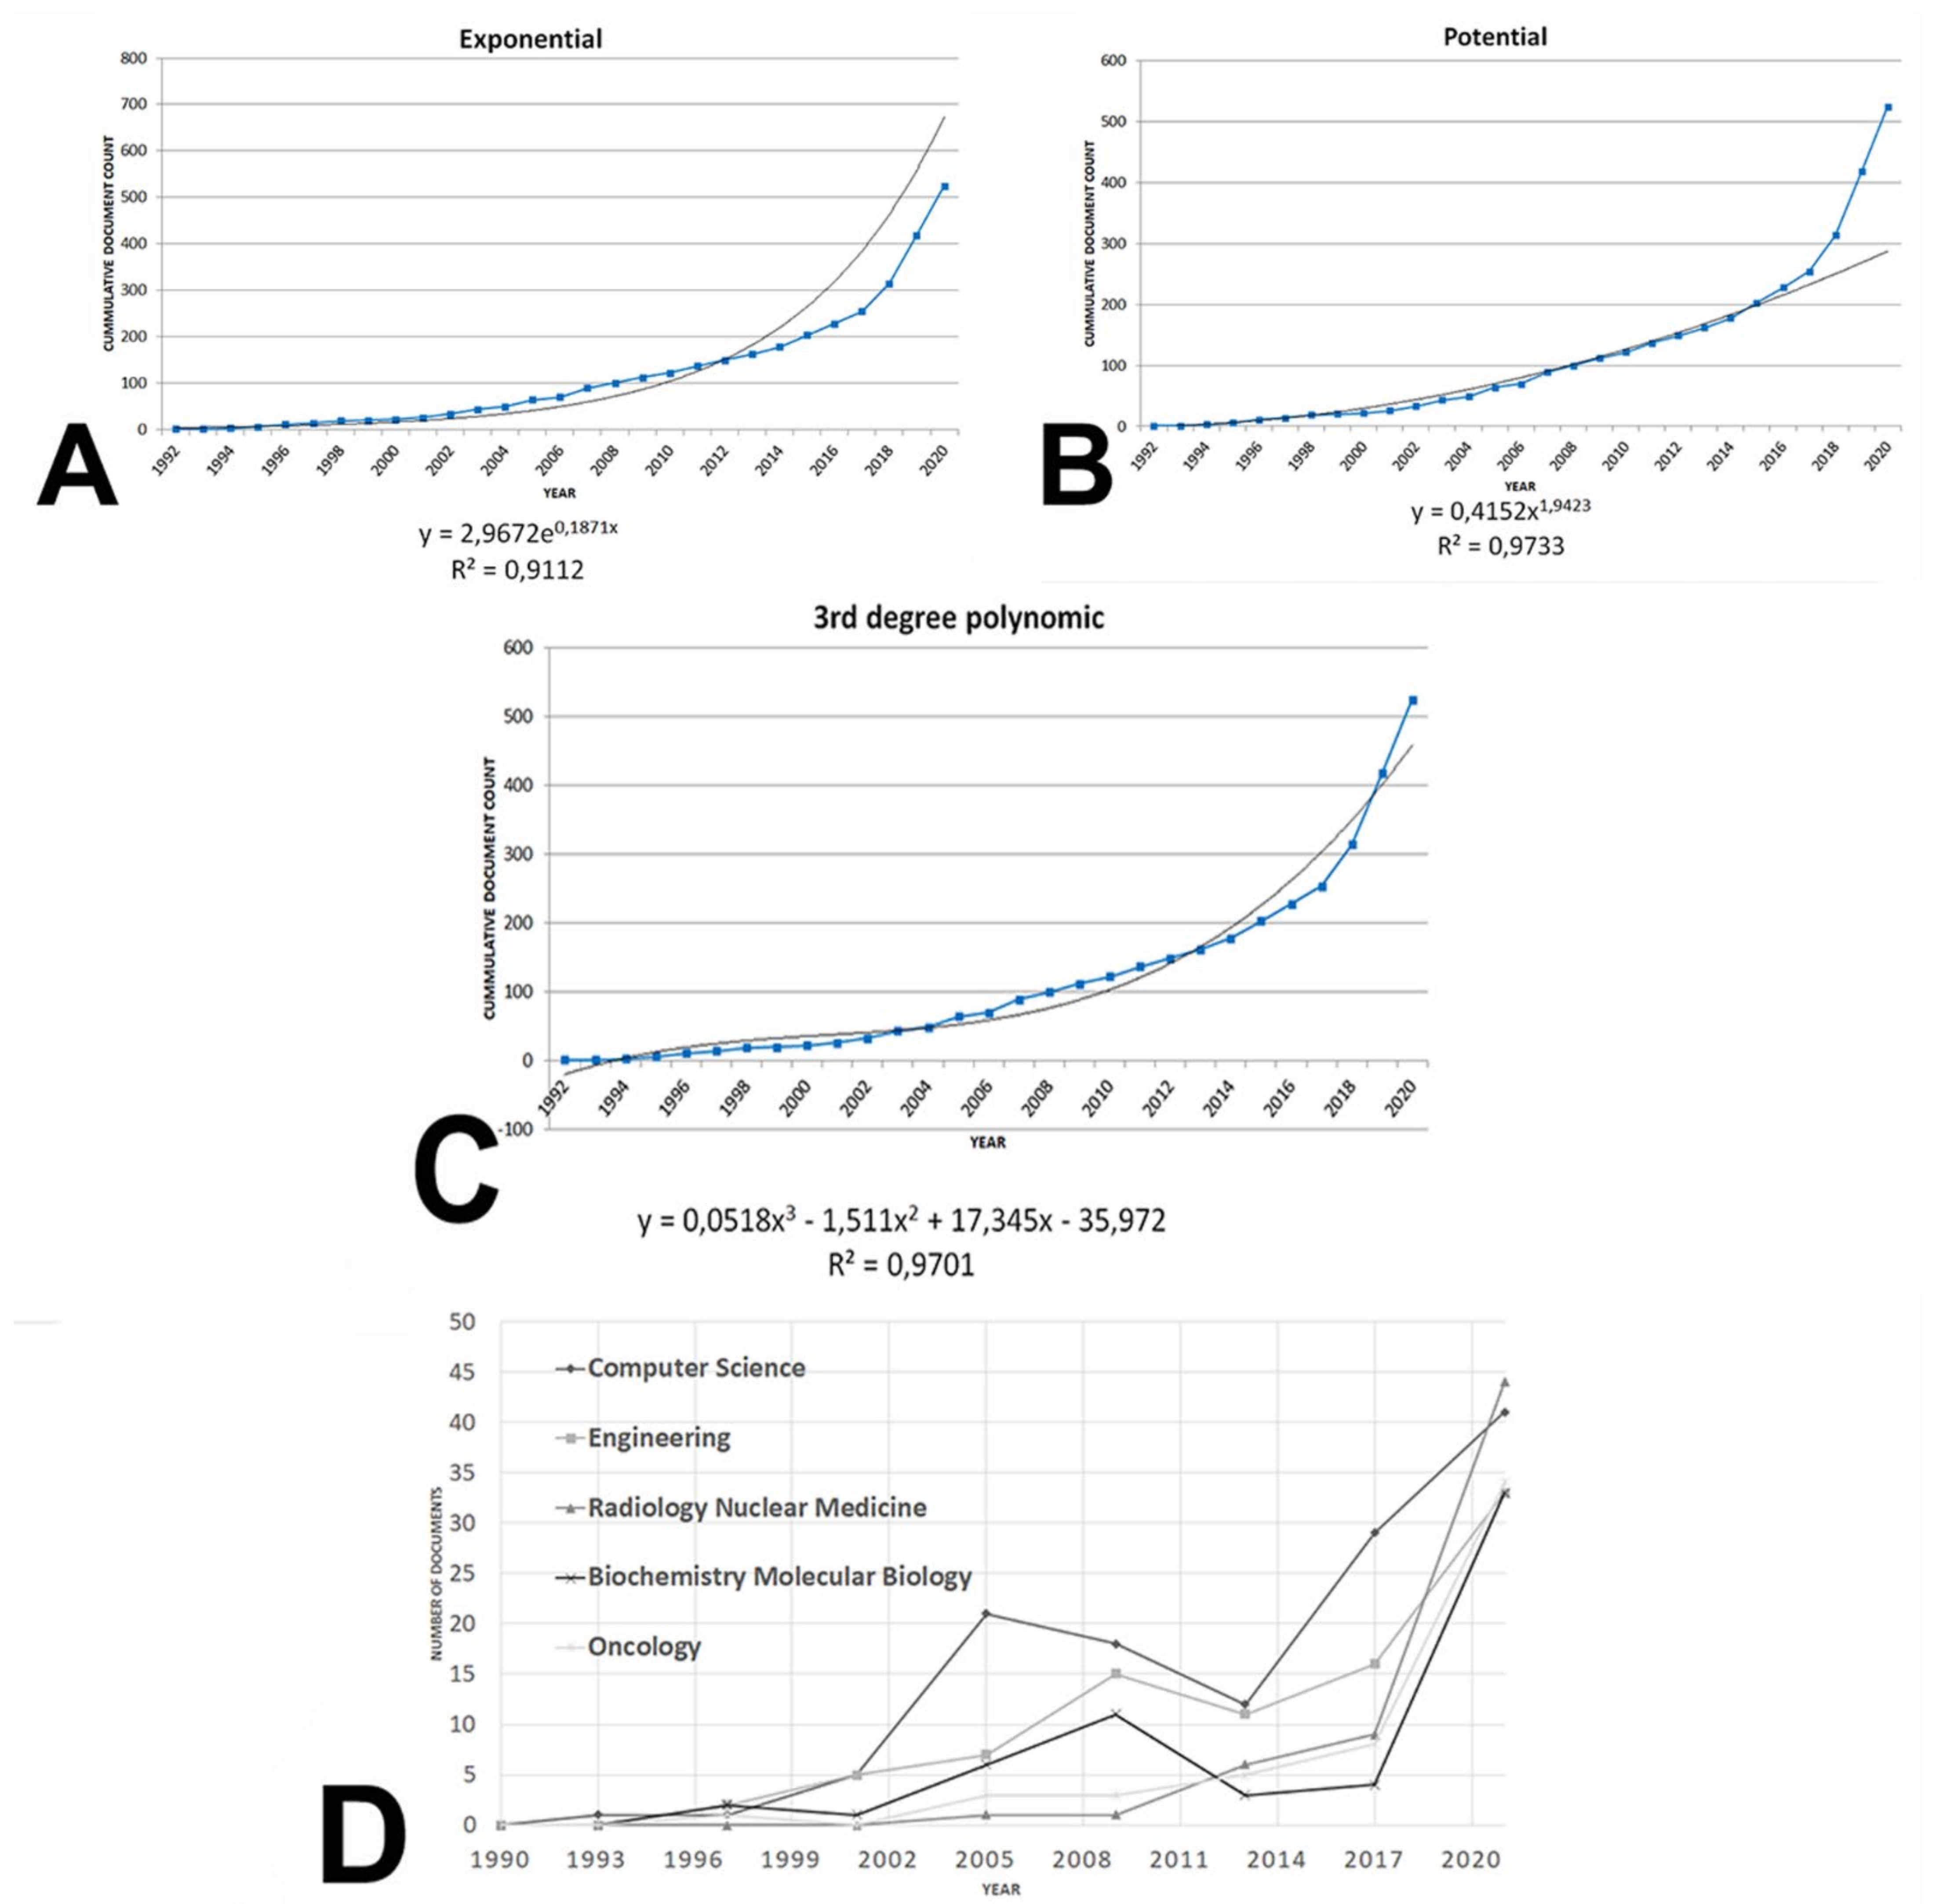
3.1. Performance Analysis

3.1.1. Document Type

A total of 525 documents were retrieved after performing the search strategy. The journal article was the predominant type as it appeared up to 359 documents (68.38% of the corpus), followed by 106 proceeding papers (20.19%), reviews (6.66%), and meeting abstracts (6.28%) (Figure 1A). Furthermore, the growth of the field was particularly remarkable from 2017 to present day (Figure 1B). Cumulative production can be adjusted to an exponential and potential model with a R2 = 0.9112 and 0.9733, respectively (Figure 2A,B). Furthermore, a third-degree polynomic model defined by the equation y = 0.0518x3 − 1.511x2 + 17.345x − 35.972 (R2 = 0.9701) predicted that literature would double in 2027, and it would be three-fold the current number near 2031 (Figure 2C).

3.1.2. Research Areas

During the period analyzed, the research area that gathered most of documents was computer science (CS) with up to 128 documents (24.38%), followed by engineering (EN) with 89 documents (16.95%), radiology nuclear medicine (RNM) with 61 documents (11.61%), biochemistry and molecular biology (BM) with 60 documents (11.43%), and oncology (ON) with 54 documents (10.29%).
Figure 2D shows the evolution of the top five research areas. From 2002 to 2020, CS was at the forefront of research, while ON and RNM increased their contribution to the area since 2008 to the present days. A general crescent trend was evident from 2014 to today both for biomedicine research areas (ON, RNM, and BM) and bioinformatics areas (CS and EN).

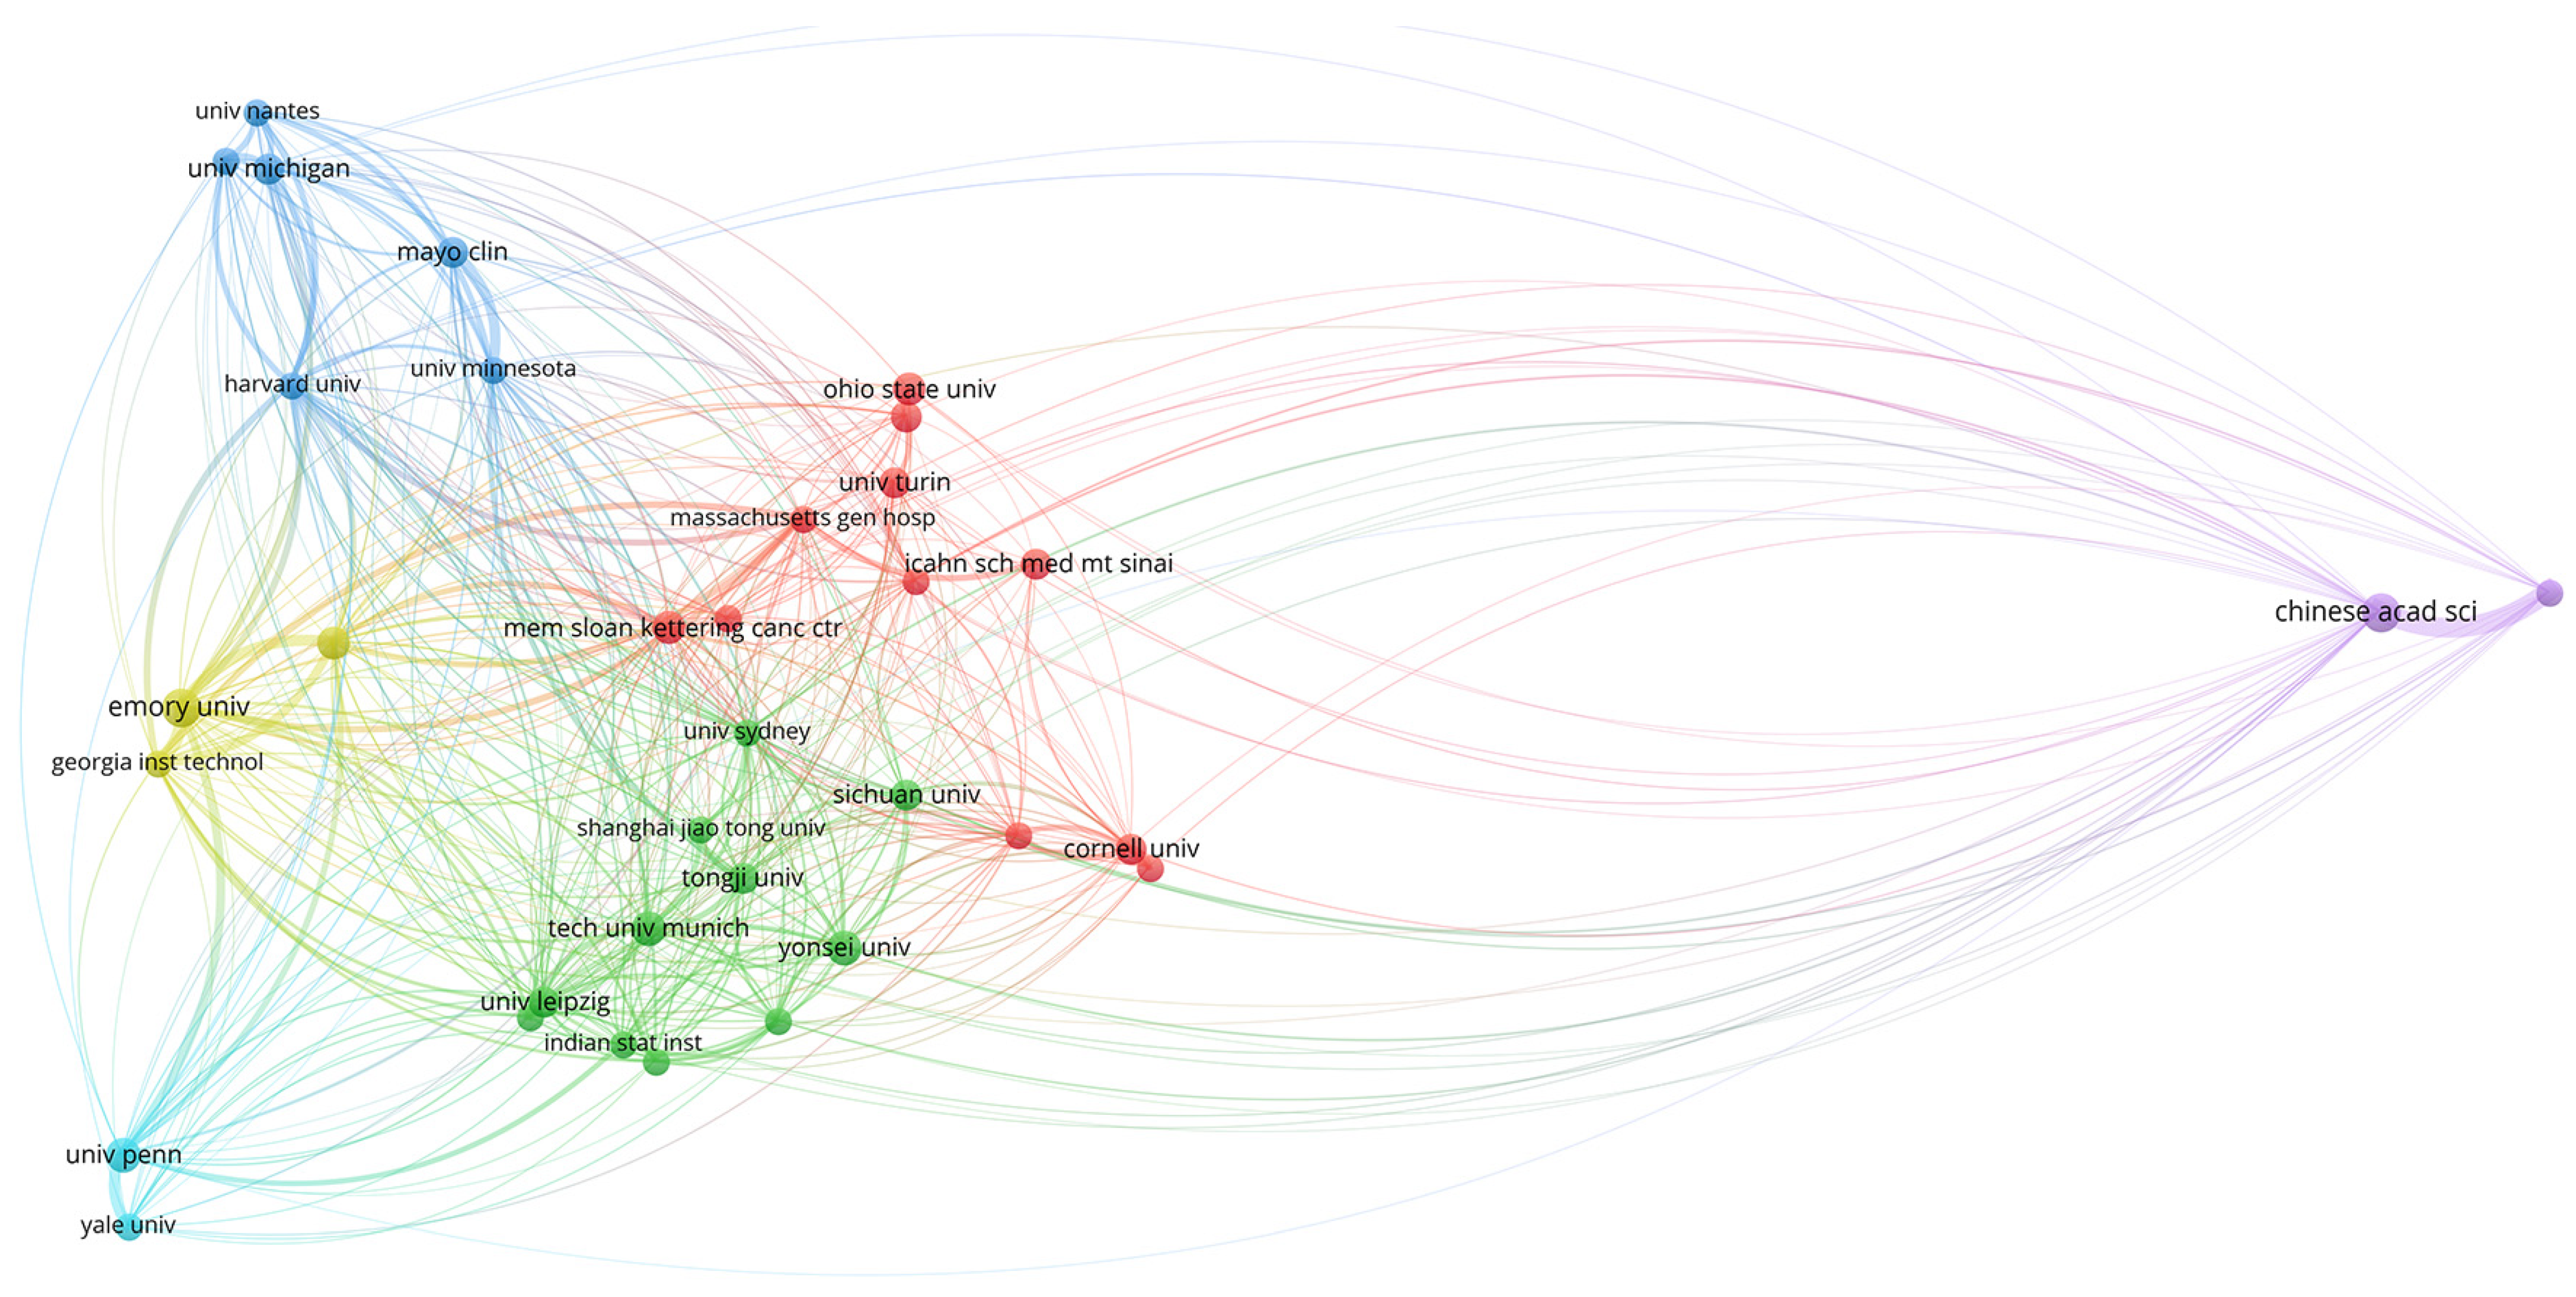
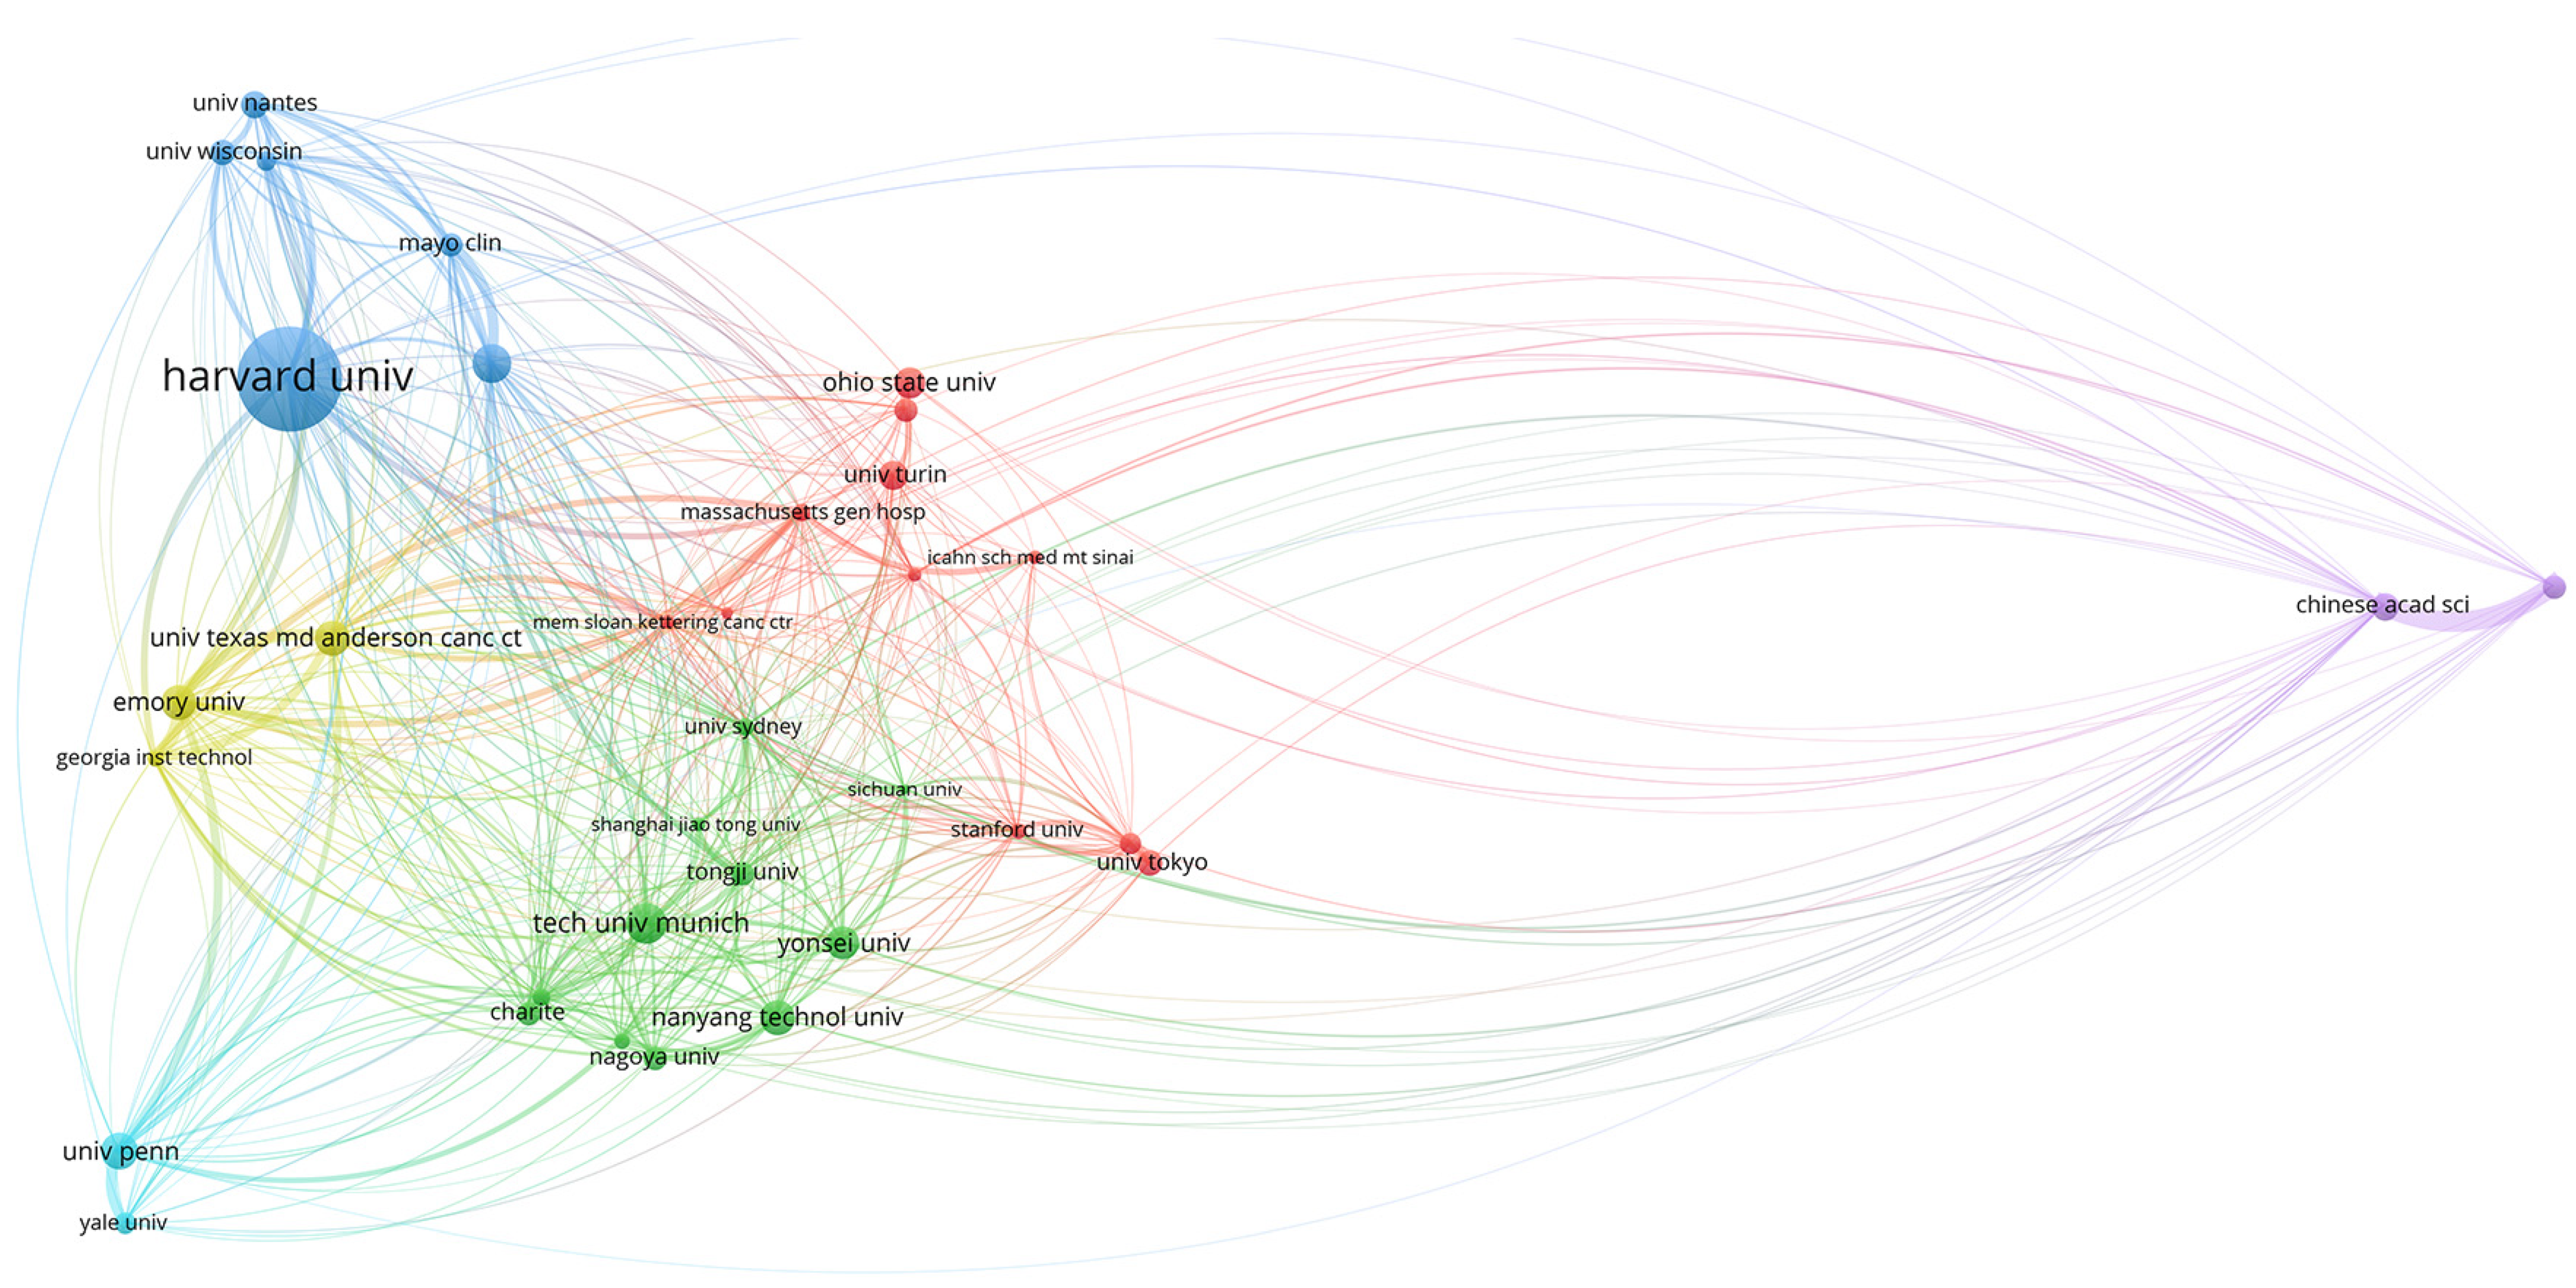
3.1.3. Organizations and Research Centers

Table 1 shows the classification of universities and research centers in terms of publications, divided for three subperiods: (1) 1990–2004, (2) 2005–2014, (3) 2015–2020, and globally. Of the 207 documents signed by the 20 most productive institutions, 119 were published in the last period. The University of Texas System (3.62%), the Institute National de la Santé et de la Recherche (INSERM) (2.86%), and Harvard University (2.48%) led global production. Thirteen of the twenty most productive institutions were located in the USA.
The Assistance Publique Hopitaux Paris (APHP) (1.71%), the Centre National de la Recherche Scientifique (CNRS) (1.71%), the Technical University of Munich (1.52%), and the Goethe University of Frankfurt (1.33%) were highlighted within European centers. Finally, the Asiatic contribution showed a crescent trend from the beginning of the study, the Chinese Academy of Science (2.29%) being among the five most relevant centers worldwide for the whole period evaluated.

3.1.4. Source Titles

A total of 397 scientific journals reported at least one of the 525 documents in the area. However, up to 388 journals (96.47%) have published less than five documents, signifying secondary sources. This pattern of scientific production was in accordance with Bradford’s law of bibliographic scattering, which determines that the most of documents belong to a reduced nuclei of core journals, being unproductive to extend literature search beyond it [31].
Table 2 shows the classification of source titles for the period studied. Globally, the most productive journals were Lectures Notes in Computer Science with up to 14 documents (2.67%), Blood with 12 documents (2.28%) and the European Journal of Nuclear Medicine and Molecular Imaging (EJNMMI) with 10 documents (1.90%).

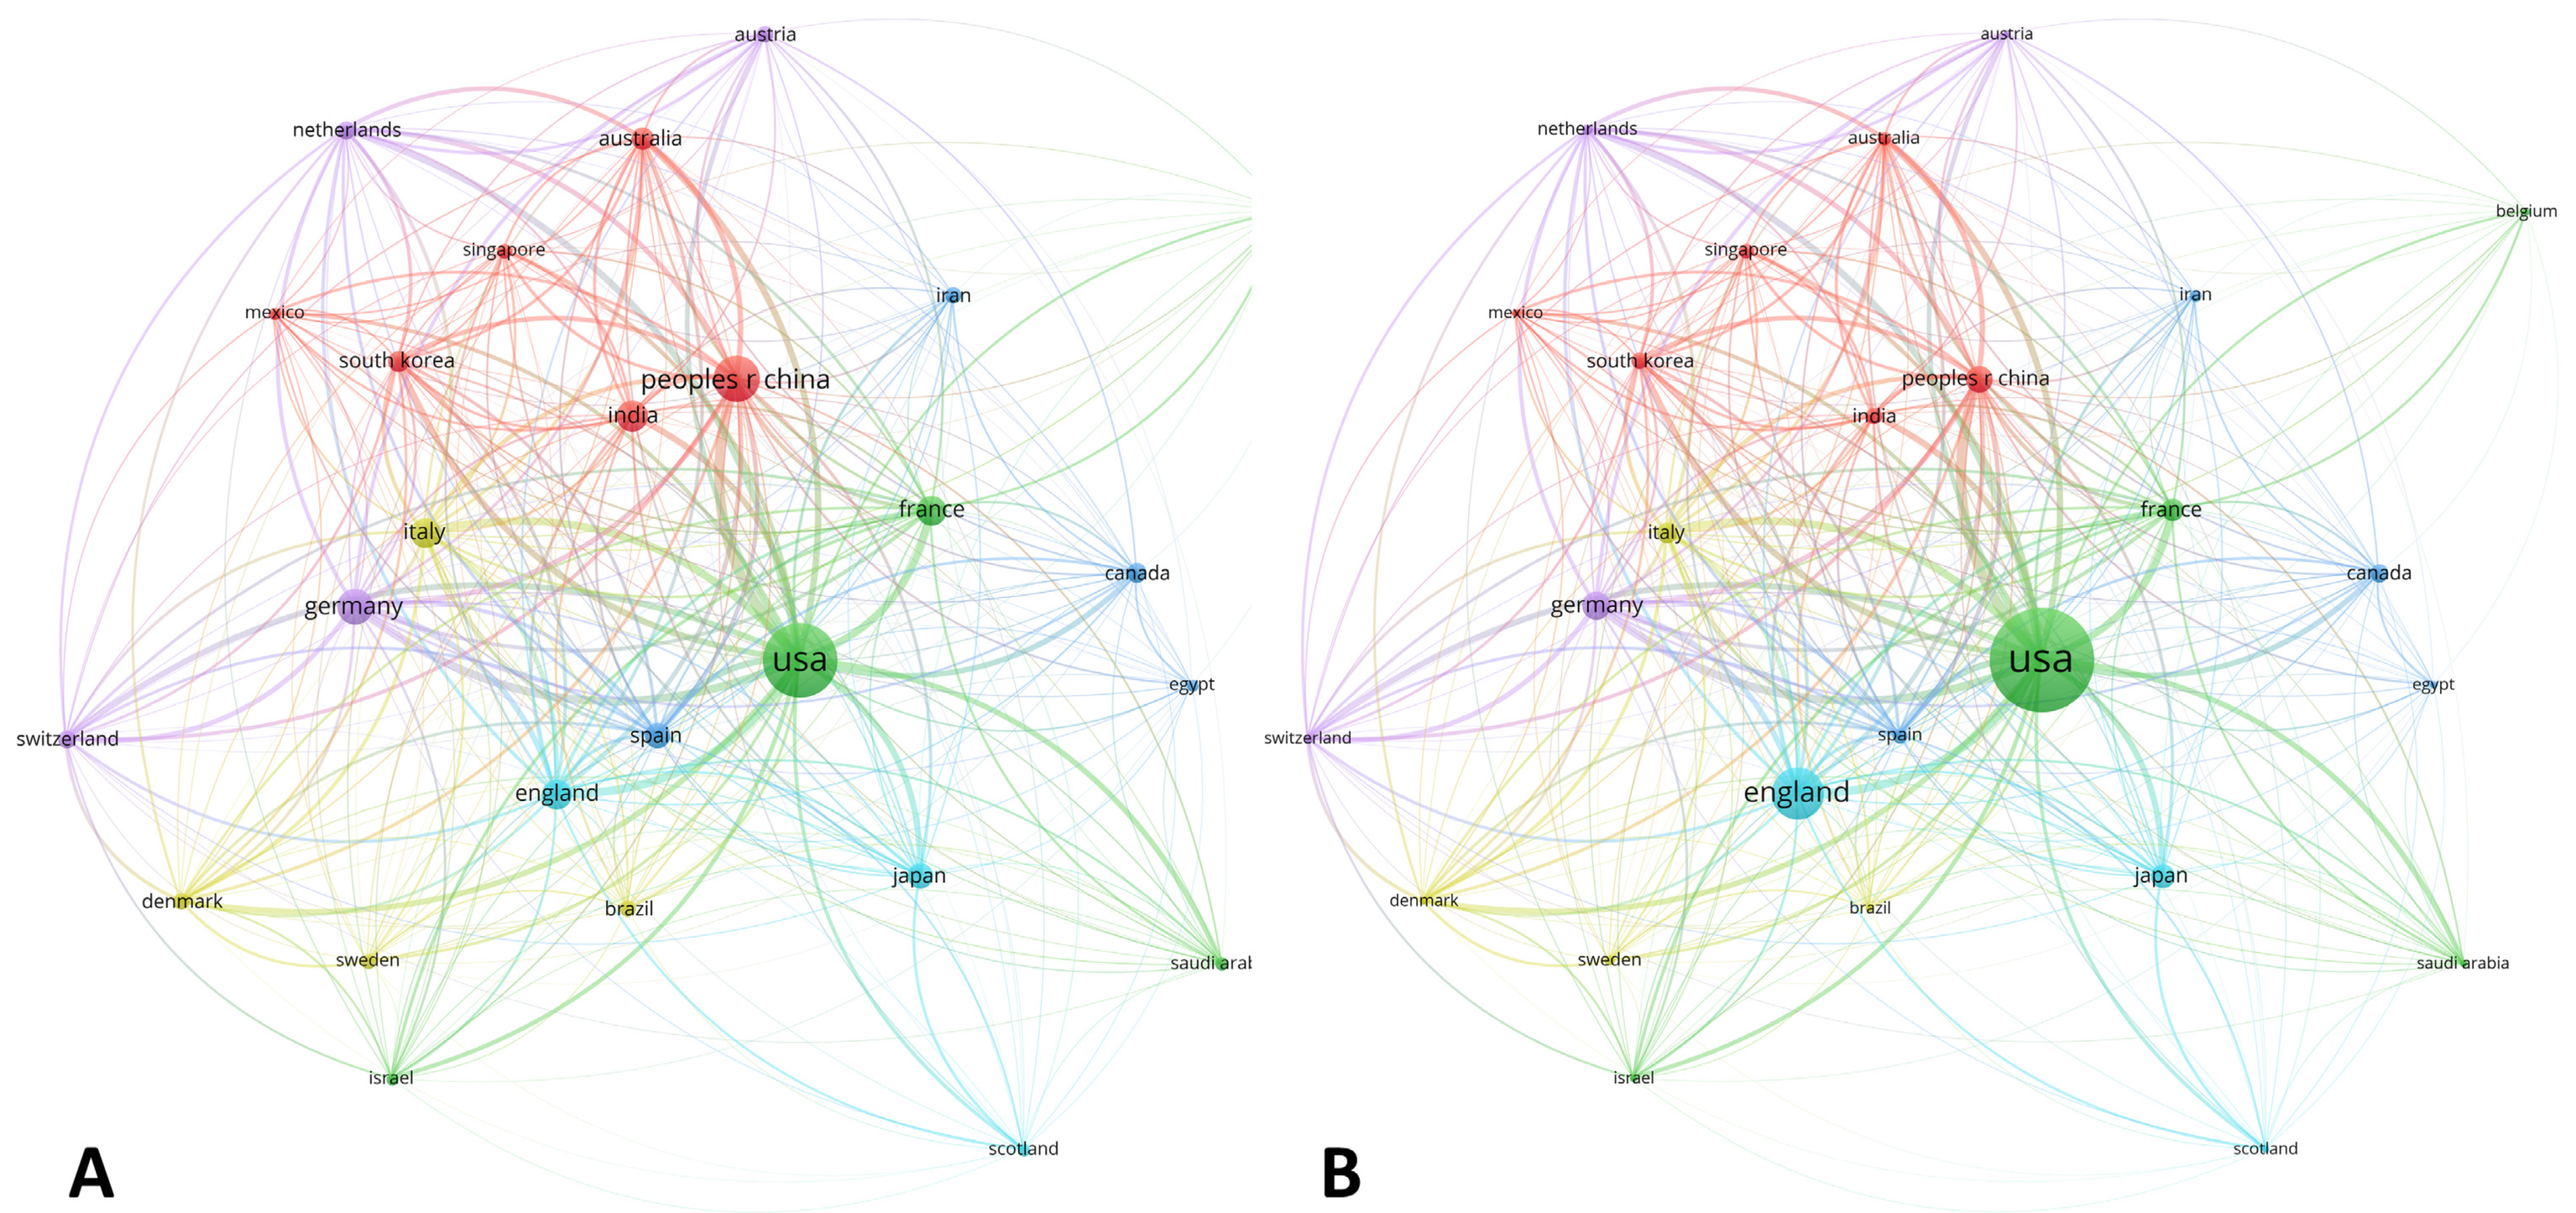
3.1.5. Country Distribution

For the whole period assessed, the USA was the leading producer, reporting up to 190 (36.19%) of all documents. Furthermore, People’s Republic of China with 72 documents (13.71%), Germany with 44 documents (8.38%), India with 35 documents (6.66%), and France with 31 documents (5.90%) were also highlighted as important countries in terms of scientific production (Table 3). Noteworthy, People’s Republic of China and India increased their contributions from 1.56% to 13.71%, and from 1.56% to 6.67%, respectively, during the whole period analyzed.
Worldwide heterogeneity increased as times became nearer to present day, which could be demonstrated by the fact that the number of nations producing more than five documents was 3 (4.84%) in the period 1990–2005, 7 (11.29%) in the period 2006–2014, and 19 (30.65%) in the period 2015–2020.

3.2. SMA

3.2.1. SMA for Cognitive Framework

The cognitive framework of the field is shown in Figure 3 and Figure 4. The strategic diagrams show the distribution of themes in MT, BT, HDI, and ED, according to Callon´s density and centrality. Furthermore, the numerical value inside each sphere indicates the number of documents that employ this concept as keyword.
As time approached the present, an increase in the number of terms linked to medical practice took place. First, the ensemble classifier was the only MT identified in the first period, while non-Hodgkin, machine learning, support vector machine, and subgroups were identified as MT in the second period. Moreover, notions such as antitumor drug design, resistance, and magnetic resonance were identified as MT in the last period.
In parallel, BT evolved from the notions of bioinformatics and support vector (period 1990–2005) to neural networks, mass spectrometry, antitumor drug design, and poor prognosis (period 2006–2014). Finally, lymphoma classification, chronic lymphocytic leukemia, Hodgkin lymphoma, and random forest were identified as BT in the period 2015–2020.

3.2.2. SMA for Social Framework

The relations among institutions are shown in Figure 5, Figure 6 and Figure 7. Two different regions can be observed: (1) a cluster of institutions sited in the USA, European centers, and some Asiatic organizations, and (2) an area represented by the Chinese Academy of Science (Figure 5). When citation counts were evaluated, the structure of the map did not change in terms of institutions location; however, the role of Harvard University notably increased (Figure 6).
The global distribution by countries is shown in Figure 7. On the one hand, the USA and People’s Republic of China stood out when documental production was assessed (Figure 7A). Moreover, England, Japan, and a network of European nations (Italy, Spain, Germany, and France) collaborated with the USA, which acted as the central node of the map. On the other hand, the analysis of citation impact revealed some variations, showing a decrease in Asiatic contributions and a maintenance of the USA and England as the major contributors of the area (Figure 7B).

4. Discussion

Human reasoning works by integrating new knowledge to previous experience. Thus, it is limited by the volume of information it is able to store and manage. AI, as a computer science aimed to design, develop, and validate devices capable of mimicking human intelligence, has the potential to overcome that barrier. By extension, clinical and diagnostic reasoning could be optimized through the incorporation of AI and ML tools to daily practice in pathology departments.
In the omics era [32], the volumes of data generated by sequencing techniques have led to new insights in the biology of hematological diseases [33], by revolutionizing how clinicians approach diagnosis, prognosis, and make therapeutic decisions. In this sense, research in hematopathology has been pioneering in the translation from bench to bedside [34], allowing for the clinical use of risk stratification models and targeted therapies, based on genetic and molecular data [35,36].
The field of AI and ML applications to diagnostic pathology in LN constitutes an active focus of research [14,15]. Specifically, digitalization of histopathological slides, and the integration of genomic analysis oriented to optimize diagnostic platforms in LN is at the forefront of research [37]. The development of AI/ML methods in other medical disciplines such as oncology is also remarkable. In this sense, in colorectal cancer, some AI algorithms have been developed to automatically discriminate between neoplastic regions and non-tumorous tissue [38]. Using scanned preparations, tumor areas of pancreatic neuroendocrine tumors can be delineated from the stroma using DL [38], which allows better quantification of Ki67 in tumor areas only (97.8% sensitivity, 88.8% specificity) [39]. In breast cancer, it is possible to automatically pinpoint areas of intraductal carcinoma or infiltrating carcinoma on hematoxylin-eosin and classify the digital preparations as benign or malignant, reaching an area under the curve (AUC) of 0.962 in digital preparations [38,39,40].
Of note, the first EU-approved DL system with CE-IVD marking (the official marking required for the European Community) was for the detection of prostate cancer [35]. In the literature, the efficacy in prostate cancer detection of DL systems is remarkably high (using tissue arrays or TMA, prostate biopsies, and prostatectomies), with AUC values of between 0.98 and 0.997 to classify prostate biopsies in benign or malignant [39,41].
However, the identification of the main global trends of AI applications to diagnostic pathology in LN, prediction of future research avenues and definition of its cognitive and social framework had not yet been performed. In this work, we analyzed the status of AI and ML applications to diagnostic pathology in LN by means of bibliometric techniques for a period between 1990 and 2020.
On the one hand, documental production experienced a marked increase, especially since 2017. Based on the behavior of the research field studied, future production can be predicted through a third-degree polynomic equation (y = 0.0518x3 − 1.511x2 + 17.345x − 35.972) which established that literature would double in 2027, and would be three-fold the current number near 2031. This prediction manifestly overwhelms Price´s law of the growth of science, which postulates that publications double each 10–15 years, approximately [42]. Biomedical literature usually does not fit in this model, because of its high consumption and obsolescence rates. Moreover, the use of this equation for monitoring future production should be interpreted cautiously. First, the mere fact of modeling the evolution of science constitutes a challenging activity, as revolutionary ideas usually disrupt the accumulative view of scientific evolution, leading to the emergence of new paradigms that change the way in which research activity is usually conducted, as demonstrated by Kuhn [43]. Furthermore, the mathematical model has certain limitations. In this sense, polynomial regression is a form of linear regression, and consequently the accuracy of predictions, that is, the power of the model to assign a precise value to the dependent variable (i.e., future research production), depends on the number of independent variables included. Subsequently, as new data will be available, there will be the need to update this model. In this sense, not only polynomic models, but ay regression model, will be affected by the availability of new data and, thus, by time. However, the greater the number of terms in the polynomial equation, the greater the accuracy of the model built to provide valuable information. Regarding this, an interesting paper by Ostertagová revised the strengths and drawbacks of the use of polynomial regression for modeling [44].
However, it can be affirmed that the optimization of subtyping in LN by exploding computational analysis of large amounts of genomic information and its integration within platforms of digital image will prominently increase in coming years. This novel scenario will probably put the pathology departments and related colleagues in an unprecedented setting, where basic concepts about bioinformatics and AI will be demanded to professionals in order to achieve an expertise level, both in clinics and research arenas.
Moreover, obtained results about the scientific production in this research field can also be inserted in a Gompertzian model, to better evaluate the current scientific scenario of AI and ML applications to diagnostic pathology in LN [45]. In this way, three stages of scientific evolution can be defined: (1) an initial phase where seminal papers of the area were published, (2) an intermediate phase where an exponential growth of literature occurs leading to the forefront of research, and (3) a last phase characterized by the storage of knowledge by means of reviews and, thus, the consolidation of the field.
Probably, as it can be deduced from Figure 1B, the area of AI and ML applications to diagnostic pathology in LN remains in a transition stage between the second and third phases. It is worthy to note that the rate of document production has been under an exponential model since 2012 (Figure 2A) and, interestingly, the publication of reviews (an early sign of information synthesis) is increasing since 2015 (Figure 1A). Thus, from a global bibliometric perspective, it can be hypothesized that this research field is not in an emerging phase, but rather, its consolidation constitutes an ongoing process.
Globally, most of the documents belong to the area of CS. Nevertheless, RNM has become a major focus of research in recent years. Of note, the integration of molecular imaging and AI algorithms will, probably, constitute an essential pillar in LN management in the near future, not only with diagnostic and staging purposes, but also as a prognostic marker. Regarding this, several AI algorithms have been tested for this purpose, such as deep learning (DL) for the reconstruction of positron emission tomography (PET) image in Hodgkin lymphoma (HL) [46], convolutional neural networks (CNNs) for the prediction of diffuse large B-cell lymphoma (DLBCL) total metabolic tumor based on PET/computed tomography (CT) [47] and support vector machine (SVM) to discriminate hypermetabolic lymphomatous lesions and noncancerous processes [48].
On the other hand, the analysis of source titles shows that three journals, Lecture Notes in Computer Science, Blood, and the EJNMMI, were the most productive journals in the area. In this sense, as there is not a unique bibliographic database covering the whole scientific production in any area, continuous monitoring and updating of the content included in the different available databases are of paramount importance to precisely characterize the scenario where scientific research takes place. In this study, we have used WoS as it constitutes the standard database in bibliometric studies for identifying and monitoring research trends [49]. WoS provides information for more than 250 disciplines, 21,000 scientific journals, and 1.6 billion of cited references from 1900 to the present [24]. However, the list of source titles showed in this work and, hence, the classification of journals could vary if a different bibliographic database is consulted. As a consequence, these results should be interpreted with caution and tacking into consideration the complex process of indexing journal information and bibliometric indicators into the different available bibliographic databases.
Furthermore, our results are in concordance with Bradford’s law of scattering as a minority of sources are responsible for the most of scientific production [28]; in fact, up to 388 journals (96.47%) published less than five documents during the whole period studied. Similar patterns have been demonstrated in other growing areas in biomedicine such as medical advanced therapies [50]. In our study, 103 from the 128 documents retrieved were published in the last period, proving the important editorial effort made in recent years. Regarding this, relevant journals in the area such as Leukemia, Frontiers in Oncology, and the American Journal of Clinical Pathology appeared in the top 20 of source titles.
In terms of contributions, the USA (36.90%), People’s Republic of China (13.71%), Germany (8.38%), India (6.67%), and France (5.91%) were at the front of the research. Among the top five centers worldwide, three of them are located in the USA (University of Texas System, Harvard University, and University of California System), and the INSERM and the Chinese Academy of Sciences were highlighted among European and Asiatic centers, respectively. In this context, the evolution of the People’s Republic of China is remarkable as it has increased its contributions from 1.56% in the first period to 13.71% in the last period, also suggesting an important increase in financial investment in the research area.
Furthermore, we also performed SMA of the field in order to elucidate its cognitive and social framework [51]. Regarding this, several SMA tools have been developed and validated to analyze collaboration patterns among institutions [24,52] , identify growing scientific areas of interest [53] and optimize funding allocation in scientific research [54]. Here, we have used the software SciMAT and VOSviewer, because of their proven quality to perform both conceptual and social evaluation on biomedicine related disciplines [21,22].
First, the cognitive framework of AI and ML applications to diagnostic pathology in LN showed a crescent clinical application of these tools. Interestingly, the ensemble classifier was the only MT identified in the first period. Briefly, EC methods compensate partial errors by introducing the output of one base model as the input for the next algorithm in the sequence, thus, improving the average prediction power [55]. Interestingly, a previous study used this approach to predict mortality after hematopoietic stem cell transplantation (HSCT) [56].
In recent years, most research has been focused on lymphoma subtyping by integrating different AI algorithms. On the one hand, ML, neural networks (NNs), and SVM appeared as MT and BT in the second and third periods, respectively. On the other hand, lymphoma classification was among the most developed concepts in the last period. Specifically, the integration of digital image analysis and genomic sequencing by means of different AI algorithms in non-Hodgkin lymphoma (NHL) constitutes a major topic of research in this area. In this way, logistic regression and Cox proportional hazards have been employed for building a cell-of-origin (COO) classifier in DLBCL based on targeted RNA sequencing (RNA-seq) data [20]. Gene expression profiling (GEP) of 414 DLBCL patients treated with CHOP/R-CHOP were used as inputs for a SVM model which accurately stratified them in two biologically distinct subgroups [57]. Furthermore, a random forest algorithm was trained and validated to discriminate the most frequent B-cell NHL categories among 510 cases of NHL, based on ligation-dependent RT-PCR and next-generation sequencing (NGS) [16].
Moreover, immunophenotyping, either by flow cytometry [58] or immunohistochemistry [59], has been also employed to train AI models for the diagnosis of B-cell NHL. A CNN algorithm was developed based on digital histopathological slides using Aperio ImageScope (Leica Biosystems, Buffalo Grove, IL) to discriminate between Burkitt lymphoma (BL) and DLBCL [60], and interesting approaches grounded on fuzzy logics have demonstrated high accuracy to subclassify DLBCL based on transcriptional profiling data obtained from “lymphochip” DNA microarrays [61].
Drug discovery and prediction of response were also identified as relevant topics in this area. Regarding this, the notion of sensitivity constituted an HDI during the first and second periods, likely accounting for a pre-clinical application of ML to drug evaluation, while antitumor drug design was the most developed concept in the last period. Interestingly, since the original description of DL in drug discovery [62], there have been considerable efforts to expand these kinds of AI applications within hematopathology research. In this setting, Turki et al. developed a transfer learning algorithm to predict sensitivity to Bortezomib in multiple myeloma [63], and a model based on Bayesian network and NNs, combined with RNA-seq, has identified novel mechanisms of resistance in 150 drugs evaluated in DLBCL [64]. Thus, the advent of powerful ML approaches also has the potential to open new horizons in drug evaluation and pharmacogenomic areas [65].
As mentioned, when analyzing research areas and source titles, functional imaging analysis and AI constitutes a growing area of interest. Regarding this, it could be defined a cognitive evolution from general concepts such as medical image analysis (first and second periods) to more specific tools such as magnetic resonance and CT. Herein, deep CNNs have been employed to discriminate patterns of tumor infiltration in PET/CT in 327 patients with NHL [66], and prediction of response to conventional chemotherapy by integrating AI and molecular techniques also constitutes a growing area of interest in recent years [47,67].
In addition, the cognitive evaluation of the field also leads to the identification of particular hematological disorders in which applications of AI and ML are being carried out, such as chronic lymphocytic leukemia (CLL) and Hodgkin lymphoma (HL). Although NHL accounts for the most of research conducted during the whole period, here we also reported ML approaches to identify CLL patients at high risk of infection [68] and to optimize CLL diagnosis through GEP and artificial NNs (ANNs) [69]. In relation to AI and ML applications to the diagnosis of HL, the complexity to adequately isolate Hodgkin and Reed–Stenberg (HRS) cells within a major non-tumoral microenvironment can be under the relative absence of AI applications for this entity. However, stimulating works have proved the potential of ML algorithms to predict prognosis in HL, both in adults [70] and pediatric patients [71].
To better comprehend the structure of this research field, we also evaluated its social framework by means of the software VOSviewer [22]. First, the role of the USA in the development of the area was highlighted both in terms of scientific contributions and citation impact. As depicted in Figure 5, two major nodes of production were identified. On the one hand, there was a cluster of organizations mainly located in the USA and Europe, which also collaborate with certain Asiatic centers (Shanghai Jiao Tong University, Tongji University, Yonsei University, Sichuan University). On the other hand, the Chinese Academy of Sciences appeared relatively isolated towards the periphery of the map.
Obtained results can be explained in terms of different patterns of collaboration, where European and USA institutions tend to a more collaborative trend, while Asiatic centers conduct a more unified research strategy. However, this hypothesis requires more in-depth studies to evaluate the particular structure of each country in terms of scientific investment and science promotion policies. Additionally, when citation impact was assessed, institutions cited in the USA, such as Harvard University, appeared as relevant centers within the map.
In summary, the results of this study show an important increase in scientific production and predict a more accelerated growth over the next 10 years in the field of AI and ML applications to diagnostic pathology in LN. Moreover, the integration of genomic and molecular data with digital image analysis through different AI algorithms will probably constitute an important pilar in the future practice within pathology departments, both to optimize diagnostic and prognostic procedures. In this sense, a better comprehension of the social and cognitive structure of the area can also serve to public institutions and administrations to optimize funding allocation, identify areas of growing interest, and promote synergies among clinical and research centers, which is an unavoidable condition for the right progress of hematopathology.

5. Conclusions

The use of AI and ML tools in diagnostic hematopathology is increasing over time, as demonstrated by the crescent trends reported in the literature. On the one hand, most of the research has been focused on the study of non-Hodgkin´s lymphomas in particular, in the analysis of genomic data for improving lymphoma classification, digitalization of histopathological slides, and medical image analysis. On the other hand, different research centers located mostly in Europe and USA highlighted in the social analysis of the research field. Finally, although the results of this work show a growing trend in research and publications on AI applications in the evaluation of LN, the full clinical implementation of these systems in the future will require the training and development of collaborative programs between pathologists, bioinformaticians and clinicians.

Author Contributions

Conceptualization, A.S.-E. and J.M.-S.; methodology, A.S.-E., J.M.-S., and M.A.M.-P.; software, A.S.-E., J.M.-S., and M.A.M.-P.; validation, M.G.-R. and J.P.-R.; formal analysis, A.S.-E. and J.M.-S.; investigation, J.M.-S. and J.P.-R.; resources, M.G.-R.; data curation, A.S-.E., J.M.-S., and M.A.M.-P.; writing—original draft preparation, A.S.-E., J.M.-S., M.A.M.-P., and J.P.-R.; writing—review and editing, M.G.-R. and J.P.-R.; visualization, A.S.-E., J.M.-S., and M.A.M.-P.; supervision, M.G.-R.; project administration, M.G.-R.; funding acquisition, M.G.-R. The present work is part of the PhD thesis dissertation of Julia Moran–Sanchez. All authors have read and agreed to the published version of the manuscript.

Funding

This research was funded by a postdoctoral grant (RH-0145-2020) from the Andalusia Health System, and with the EU FEDER ITI Grant for Cadiz Province PI-0032-2017.

Institutional Review Board Statement

Not applicable.

Informed Consent Statement

Not applicable.

Data Availability Statement

Not applicable.

Conflicts of Interest

The authors declare no conflict of interest.

References

  1. Flores, M.; Glusman, G.; Brogaard, K.; Price, N.D.; Hood, L. P4 medicine: How systems medicine will transform the healthcare sector and society. Pers. Med. 2013, 10, 565–576. [Google Scholar] [CrossRef] [PubMed] [Green Version]
  2. Beam, A.L.; Kohane, I.S. Big Data and Machine Learning in Health Care. JAMA 2018, 319, 1317–1318. [Google Scholar] [CrossRef] [PubMed]
  3. Die Bundesregierung. Eckpunkte der Bundesregierung für eine Strategie Künstliche Intelligenz; Die Bundesregierung: Berlin, Germany, 2018. [Google Scholar]
  4. Villani, C. For a Meaningful Artificial Intelligence towards a French and European Strategy; Conseil National du Numérique: Paris, France, 2018. [Google Scholar]
  5. Chinese State Council. Notice of the State Council on Issuing the Development Plan for the New Generation of Artificial Intelligence; Chinese State Council: Beijing, China, 2017. [Google Scholar]
  6. European Commission. Coordinated Plan on Artificial Intelligence; European Commission: Brussels, Belgium, 2018. [Google Scholar]
  7. Executive Office of the President of the United States. Artificial Intelligence, Automation, and the Economy; Executive Office of the President of the United States: Washington, DC, USA, 2016. [Google Scholar]
  8. Executive Office of the President of the United States. The National Artificial Intelligence Research And Development Strategic Plan; Executive Office of the President of the United States: Washington, DC, USA, 2016. [Google Scholar]
  9. Executive Office of the President of the United States. Preparing For The Future Of Artificial Intelligence; Executive Office of the President of the United States: Washington, DC, USA, 2016. [Google Scholar]
  10. Clark, G.; Hancock, M.; Hall, D.W.; Pesenti, J. AI Sector Deal; Department for Digital, Culture, Media & Sport: London, UK; Department for Business, Energy & Industrial Strategy: London, UK, 2019. [Google Scholar]
  11. Hall, D.W.; Pesenti, J. Growing the Artificial Intelligence Industry in the UK; Department for Digital, Culture, Media & Sport: London, UK; Department for Business, Energy & Industrial Strategy: London, UK, 2017. [Google Scholar]
  12. Gonon-Demoulian, R.; Goldman, J.M.; Nicolini, F.E. History of chronic myeloid leukemia: A paradigm in the treatment of cancer. Bull. Cancer 2014, 101, 56–67. [Google Scholar] [CrossRef] [PubMed]
  13. Thomas, X. Acute Promyelocytic Leukemia: A History over 60 Years-From the Most Malignant to the most Curable Form of Acute Leukemia. Oncol. Ther. 2019, 7, 33–65. [Google Scholar] [CrossRef] [Green Version]
  14. Radakovich, N.; Nagy, M.; Nazha, A. Artificial Intelligence in Hematology: Current Challenges and Opportunities. Curr. Hematol. Malig. Rep. 2020, 15, 203–210. [Google Scholar] [CrossRef]
  15. Shouval, R.; Fein, J.A.; Savani, B.; Mohty, M.; Nagler, A. Machine learning and artificial intelligence in haematology. Br. J. Haematol. 2021, 192, 239–250. [Google Scholar] [CrossRef]
  16. Bobee, V.; Drieux, F.; Marchand, V.; Sater, V.; Veresezan, L.; Picquenot, J.M.; Viailly, P.J.; Lanic, M.D.; Viennot, M.; Bohers, E.; et al. Combining gene expression profiling and machine learning to diagnose B-cell non-Hodgkin lymphoma. Blood Cancer J. 2020, 10, 59. [Google Scholar] [CrossRef]
  17. Zhao, M.; Mallesh, N.; Hollein, A.; Schabath, R.; Haferlach, C.; Haferlach, T.; Elsner, F.; Luling, H.; Krawitz, P.; Kern, W. Hematologist-Level Classification of Mature B-Cell Neoplasm Using Deep Learning on Multiparameter Flow Cytometry Data. Cytom. Part A 2020, 97, 1073–1080. [Google Scholar] [CrossRef]
  18. Bucinski, A.; Marszall, M.P.; Krysinski, J.; Lemieszek, A.; Zaluski, J. Contribution of artificial intelligence to the knowledge of prognostic factors in Hodgkin’s lymphoma. Eur. J. Cancer Prev. 2010, 19, 308–312. [Google Scholar] [CrossRef]
  19. deAndres-Galiana, E.J.; Fernandez-Martinez, J.L.; Luaces, O.; Del Coz, J.J.; Fernandez, R.; Solano, J.; Nogues, E.A.; Zanabilli, Y.; Alonso, J.M.; Payer, A.R.; et al. On the prediction of Hodgkin lymphoma treatment response. Clin. Transl. Oncol. 2015, 17, 612–619. [Google Scholar] [CrossRef]
  20. Xu-Monette, Z.Y.; Zhang, H.; Zhu, F.; Tzankov, A.; Bhagat, G.; Visco, C.; Dybkaer, K.; Chiu, A.; Tam, W.; Zu, Y.; et al. A refined cell-of-origin classifier with targeted NGS and artificial intelligence shows robust predictive value in DLBCL. Blood Adv. 2020, 4, 3391–3404. [Google Scholar] [CrossRef]
  21. Cobo, M.J.; Lopez-Herrera, A.G.; Herrera-Viedma, E.; Herrera, F. SciMAT: A new science mapping analysis software tool. J. Am. Soc. Inf. Sci. Technol. 2012, 63, 1609–1630. [Google Scholar] [CrossRef]
  22. Van Eck, N.J.; Waltman, L. Software survey: VOSviewer, a computer program for bibliometric mapping. Scientometrics 2010, 84, 523–538. [Google Scholar] [CrossRef] [Green Version]
  23. Cobo, M.J.; López-Herrera, A.G.; Herrera-Viedma, E.; Herrera, F. An approach for detecting, quantifying, and visualizing the evolution of a research field: A practical application to the Fuzzy Sets Theory field. J. Informetr. 2011, 5, 146–166. [Google Scholar] [CrossRef]
  24. Moral-Munoz, J.A.; Herrera-Viedma, E.; Santisteban-Espejo, A.; Cobo, M.J. Software tools for conducting bibliometric analysis in science: An up-to-date review. Prof. Inf. 2020, 29, e290103. [Google Scholar] [CrossRef] [Green Version]
  25. Callon, M.; Courtial, J.P.; Laville, F. Co-Word Analysis as a Tool for Describing the Network of Interactions between Basic and Technological Research—The Case of Polymer Chemistry. Scientometrics 1991, 22, 155–205. [Google Scholar] [CrossRef]
  26. Callon, M.; Courtial, J.-P.; Turner, W.A.; Bauin, S. From translations to problematic networks: An introduction to co-word analysis. Soc. Sci. Inf. 1983, 22, 191–235. [Google Scholar] [CrossRef]
  27. Coulter, N.; Monarch, I.; Konda, S. Software engineering as seen through its research literature: A study in co-word analysis. J. Am. Soc. Inf. Sci. 1998, 49, 1206–1223. [Google Scholar] [CrossRef]
  28. Muñoz-Leiva, F.; Viedma-del-Jesús, M.I.; Sánchez-Fernández, J.; López-Herrera, A.G. An application of co-word analysis and bibliometric maps for detecting the most highlighting themes in the consumer behaviour research from a longitudinal perspective. Qual. Quant. 2012, 46, 1077–1095. [Google Scholar] [CrossRef]
  29. Orts, F.; Filatovas, E.; Ortega, G.; Kurasova, O.; Garzón, E.M. Improving the energy efficiency of SMACOF for multidimensional scaling on modern architectures. J. Supercomput. 2019, 75, 1038–1050. [Google Scholar] [CrossRef]
  30. Kessler, M.M. Bibliographic coupling between scientific papers. Am. Doc. 1963, 14, 10–25. [Google Scholar] [CrossRef]
  31. Goffman, W.; Morris, T.G. Bradford’s law and library acquisitions. Nature 1970, 226, 922–923. [Google Scholar] [CrossRef] [PubMed]
  32. Kiechle, F.L.; Zhang, X.; Holland-Staley, C.A. The -omics era and its impact. Arch. Pathol. Lab. Med. 2004, 128, 1337–1345. [Google Scholar] [CrossRef]
  33. van Karnebeek, C.D.M.; Wortmann, S.B.; Tarailo-Graovac, M.; Langeveld, M.; Ferreira, C.R.; van de Kamp, J.M.; Hollak, C.E.; Wasserman, W.W.; Waterham, H.R.; Wevers, R.A.; et al. The role of the clinician in the multi-omics era: Are you ready? J. Inherit. Metab. Dis. 2018, 41, 571–582. [Google Scholar] [CrossRef] [PubMed] [Green Version]
  34. Ma, H.; Mallampati, S.; An, G.; Wang, J. Targeted Therapy in Hematological Malignancies: From Basic Research to Clinical Practice. Biomed. Res. Int. 2015, 2015, 157570. [Google Scholar] [CrossRef] [PubMed]
  35. DiNardo, C.D.; Wei, A.H. How I treat acute myeloid leukemia in the era of new drugs. Blood 2020, 135, 85–96. [Google Scholar] [CrossRef] [PubMed]
  36. Wang, L.; Qin, W.; Huo, Y.J.; Li, X.; Shi, Q.; Rasko, J.E.J.; Janin, A.; Zhao, W.L. Advances in targeted therapy for malignant lymphoma. Signal. Transduct. Target. Ther. 2020, 5, 15. [Google Scholar] [CrossRef] [Green Version]
  37. El Achi, H.; Khoury, J.D. Artificial Intelligence and Digital Microscopy Applications in Diagnostic Hematopathology. Cancers 2020, 12, 797. [Google Scholar] [CrossRef] [Green Version]
  38. Niazi, M.K.K.; Parwani, A.V.; Gurcan, M.N. Digital pathology and artificial intelligence. Lancet Oncol. 2019, 20, e253–e261. [Google Scholar] [CrossRef]
  39. Acs, B.; Rantalainen, M.; Hartman, J. Artificial intelligence as the next step towards precision pathology. J. Intern. Med. 2020, 288, 62–81. [Google Scholar] [CrossRef] [Green Version]
  40. Robertson, S.; Azizpour, H.; Smith, K.; Hartman, J. Digital image analysis in breast pathology-from image processing techniques to artificial intelligence. Transl. Res. 2018, 194, 19–35. [Google Scholar] [CrossRef] [Green Version]
  41. Chang, H.Y.; Jung, C.K.; Woo, J.I.; Lee, S.; Cho, J.; Kim, S.W.; Kwak, T.Y. Artificial Intelligence in Pathology. J. Pathol. Transl. Med. 2019, 53, 1–12. [Google Scholar] [CrossRef] [Green Version]
  42. Price, D.D.S. A general theory of bibliometric and other cumulative advantage processes. J. Am. Soc. Inform. Sci 1976, 27, 292–306. [Google Scholar] [CrossRef] [Green Version]
  43. Kuhn, T.S. The Structure of Scientific Revolutions; University of Chicago Press: Chicago, IL, USA, 1962. [Google Scholar]
  44. Ostertagová, E. Modelling using Polynomial Regression. Procedia Eng. 2012, 48, 500–506. [Google Scholar] [CrossRef] [Green Version]
  45. Roig-Tierno, N.; Gonzalez-Cruz, T.F.; Llopis-Martinez, J. An overview of qualitative comparative analysis: A bibliometric analysis. J. Innov. Knowl. 2017, 2, 15–23. [Google Scholar] [CrossRef]
  46. Weisman, A.J.; Kim, J.; Lee, I.; McCarten, K.M.; Kessel, S.; Schwartz, C.L.; Kelly, K.M.; Jeraj, R.; Cho, S.Y.; Bradshaw, T.J. Automated quantification of baseline imaging PET metrics on FDG PET/CT images of pediatric Hodgkin lymphoma patients. EJNMMI Phys. 2020, 7, 76. [Google Scholar] [CrossRef]
  47. Blanc-Durand, P.; Jegou, S.; Kanoun, S.; Berriolo-Riedinger, A.; Bodet-Milin, C.; Kraeber-Bodere, F.; Carlier, T.; Le Gouill, S.; Casasnovas, R.O.; Meignan, M.; et al. Fully automatic segmentation of diffuse large B cell lymphoma lesions on 3D FDG-PET/CT for total metabolic tumour volume prediction using a convolutional neural network. Eur. J. Nucl. Med. Mol. Imaging 2021, 48, 1362–1370. [Google Scholar] [CrossRef] [PubMed]
  48. Lartizien, C.; Rogez, M.; Niaf, E.; Ricard, F. Computer-aided staging of lymphoma patients with FDG PET/CT imaging based on textural information. IEEE J. Biomed. Health Inform. 2014, 18, 946–955. [Google Scholar] [CrossRef]
  49. Birkle, C.; Pendlebury, D.A.; Schnell, J.; Adams, J. Web of Science as a data source for research on scientific and scholarly activity. Quant. Sci. Stud. 2020, 1, 363–376. [Google Scholar] [CrossRef]
  50. Santisteban-Espejo, A.; Campos, F.; Martin-Piedra, L.; Durand-Herrera, D.; Moral-Munoz, J.A.; Campos, A.; Martin-Piedra, M.A. Global tissue engineering trends: A scientometric and evolutive study. Tissue Eng. Part A 2018, 24, 1504–1517. [Google Scholar] [CrossRef]
  51. Santisteban-Espejo, A.; Campos, F.; Chato-Astrain, J.; Durand-Herrera, D.; Garcia-Garcia, O.; Campos, A.; Martin-Piedra, M.A.; Moral-Munoz, J.A. Identification of cognitive and social framework of tissue engineering by science mapping analysis. Tissue Eng. Part C Methods 2019, 25, 37–48. [Google Scholar] [CrossRef] [PubMed]
  52. Lee, V.H.; Hew, J.J.; Loke, S.P. Evaluating and comparing ten-year (2006–2015) research performance between Malaysian public and private higher learning institutions: A bibliometric approach. Int. J. Innov. Learn. 2018, 23, 145–165. [Google Scholar] [CrossRef]
  53. Rosas, S.R.; Kagan, J.M.; Schouten, J.T.; Slack, P.A.; Trochim, W.M. Evaluating research and impact: A bibliometric analysis of research by the NIH/NIAID HIV/AIDS clinical trials networks. PLoS ONE 2011, 6, e17428. [Google Scholar] [CrossRef] [PubMed] [Green Version]
  54. Abramo, G.; D’Angelo, C.A.; Caprasecca, A. Allocative efficiency in public research funding: Can bibliometrics help? Res. Policy 2009, 38, 206–215. [Google Scholar] [CrossRef] [Green Version]
  55. Sagi, O.; Rokach, L. Ensemble learning: A survey. WIREs Data Min. Knowl. Discov. 2018, 8, e1249. [Google Scholar] [CrossRef]
  56. Shouval, R.; Labopin, M.; Unger, R.; Giebel, S.; Ciceri, F.; Schmid, C.; Esteve, J.; Baron, F.; Gorin, N.C.; Savani, B.; et al. Prediction of Hematopoietic Stem Cell Transplantation Related Mortality- Lessons Learned from the In-Silico Approach: A European Society for Blood and Marrow Transplantation Acute Leukemia Working Party Data Mining Study. PLoS ONE 2016, 11, e0150637. [Google Scholar] [CrossRef]
  57. Zhao, S.; Dong, X.; Shen, W.; Ye, Z.; Xiang, R. Machine learning-based classification of diffuse large B-cell lymphoma patients by eight gene expression profiles. Cancer Med. 2016, 5, 837–852. [Google Scholar] [CrossRef]
  58. Gaidano, V.; Tenace, V.; Santoro, N.; Varvello, S.; Cignetti, A.; Prato, G.; Saglio, G.; De Rosa, G.; Geuna, M. A Clinically Applicable Approach to the Classification of B-Cell Non-Hodgkin Lymphomas with Flow Cytometry and Machine Learning. Cancers 2020, 12, 1684. [Google Scholar] [CrossRef]
  59. Deeb, S.J.; Tyanova, S.; Hummel, M.; Schmidt-Supprian, M.; Cox, J.; Mann, M. Machine Learning-based Classification of Diffuse Large B-cell Lymphoma Patients by Their Protein Expression Profiles. Mol. Cell Proteom. 2015, 14, 2947–2960. [Google Scholar] [CrossRef] [Green Version]
  60. Mohlman, J.; Leventhal, S.; Venkat, A.; Gyulassy, A.; Pascucci, V.; Salama, M. Application of a Convolutional Neural Network to Distinguish Burkitt Lymphoma From Diffuse Large B-Cell Lymphoma. Am. J. Clin. Pathol. 2018, 150, S119. [Google Scholar] [CrossRef]
  61. Ando, T.; Suguro, M.; Kobayashi, T.; Seto, M.; Honda, H. Multiple fuzzy neural network system for outcome prediction and classification of 220 lymphoma patients on the basis of molecular profiling. Cancer Sci. 2003, 94, 906–913. [Google Scholar] [CrossRef] [Green Version]
  62. Chen, H.; Engkvist, O.; Wang, Y.; Olivecrona, M.; Blaschke, T. The rise of deep learning in drug discovery. Drug Discov. Today 2018, 23, 1241–1250. [Google Scholar] [CrossRef]
  63. Turki, T.; Wei, Z.; Wang, J.T.L. Transfer Learning Approaches to Improve Drug Sensitivity Prediction in Multiple Myeloma Patients. IEEE Access 2017, 5, 7381–7393. [Google Scholar] [CrossRef]
  64. Davis, N.; McKinney, M.S.; Reddy, A.; Love, C.; Smith, E.; Happ, L.; Dave, S. Novel Mechanisms for Resistance to Targeted Therapy Identified through Machine Learning Approaches in 1167 RNA-Seq Drug Exposure Profiles in Lymphoma. Blood 2018, 132, 1370. [Google Scholar] [CrossRef]
  65. Vamathevan, J.; Clark, D.; Czodrowski, P.; Dunham, I.; Ferran, E.; Lee, G.; Li, B.; Madabhushi, A.; Shah, P.; Spitzer, M.; et al. Applications of machine learning in drug discovery and development. Nat. Rev. Drug Discov. 2019, 18, 463–477. [Google Scholar] [CrossRef]
  66. Sibille, L.; Seifert, R.; Avramovic, N.; Vehren, T.; Spottiswoode, B.; Zuehlsdorff, S.; Schafers, M. (18)F-FDG PET/CT Uptake Classification in Lymphoma and Lung Cancer by Using Deep Convolutional Neural Networks. Radiology 2020, 294, 445–452. [Google Scholar] [CrossRef] [Green Version]
  67. Capobianco, N.; Meignan, M.; Cottereau, A.S.; Vercellino, L.; Sibille, L.; Spottiswoode, B.; Zuehlsdorff, S.; Casasnovas, O.; Thieblemont, C.; Buvat, I. Deep-Learning (18)F-FDG Uptake Classification Enables Total Metabolic Tumor Volume Estimation in Diffuse Large B-Cell Lymphoma. J. Nucl. Med. 2021, 62, 30–36. [Google Scholar] [CrossRef]
  68. Agius, R.; Brieghel, C.; Andersen, M.A.; Pearson, A.T.; Ledergerber, B.; Cozzi-Lepri, A.; Louzoun, Y.; Andersen, C.L.; Bergstedt, J.; von Stemann, J.H.; et al. Machine learning can identify newly diagnosed patients with CLL at high risk of infection. Nat. Commun. 2020, 11, 363. [Google Scholar] [CrossRef]
  69. Shaabanpour Aghamaleki, F.; Mollashahi, B.; Nosrati, M.; Moradi, A.; Sheikhpour, M.; Movafagh, A. Application of an Artificial Neural Network in the Diagnosis of Chronic Lymphocytic Leukemia. Cureus 2019, 11, e4004. [Google Scholar] [CrossRef] [Green Version]
  70. Parodi, S.; Manneschi, C.; Verda, D.; Ferrari, E.; Muselli, M. Logic Learning Machine and standard supervised methods for Hodgkin’s lymphoma prognosis using gene expression data and clinical variables. Health Inform. J. 2018, 24, 54–65. [Google Scholar] [CrossRef]
  71. Beaulac, C.; Rosenthal, J.S.; Pei, Q.; Friedman, D.; Wolden, S.; Hodgson, D. An evaluation of machine learning techniques to predict the outcome of children treated for Hodgkin-Lymphoma on the AHOD0031 trial. Appl. Artif. Intell. 2020, 34, 1100–1114. [Google Scholar] [CrossRef]
Figure 1. Evolution of documents referred to AI and ML applications to diagnostic pathology in lymphoid neoplasms from 1990 to 2020. (A) Document production trends referred to AI and ML applications to diagnostic pathology in lymphoid neoplasms according to document type (original article, review, proceeding papers, and meeting abstracts) from 1990 to 2020. (B) Global production trends of documents referred to AI and ML applications to the field of diagnostic pathology in lymphoid neoplasms from 1990 to 2020.
Biomolecules 11 00793 g001
Figure 2. Cumulative journal production by year in the area of AI and ML applications to diagnostic pathology in lymphoid neoplasms. (A) Adjustment to an exponential model. (B) Adjustment to a potential model. (C) Adjustment to a third degree polynomic model. (D) Evolution of the five most developed research areas in terms of article production (computer science, engineering, radiology nuclear medicine, biochemistry molecular biology, and oncology) from 1990 to 2020.
Biomolecules 11 00793 g002
Figure 3. Two-dimensional space layout of research themes on AI and ML applications to diagnostic pathology in lymphoid neoplasms according to Callon´s density (vertical axis) and Callon´s centrality (horizontal axis) as shown by the SciMAT software. Research themes are categorized in Motor themes, Basic and Transversal themes, Emerging or Declining themes, and Highly Developed themes. Some themes that recur over time have been marked in the same color (blue and green). (A) Strategic diagram of the cognitive framework for the period 1990 to 2005. (B) Strategic diagram of the cognitive framework for the period 2006 to 2014.
Biomolecules 11 00793 g003
Figure 4. Two-dimensional space layout of research themes on AI and ML applications to diagnostic pathology in lymphoid neoplasms according to Callon´s density (vertical axis) and Callon´s centrality (horizontal axis) as shown by the package SciMAT. Strategic diagram of the cognitive framework for the period 2015–2020. Themes that recur over time have been marked in the same color (blue). The dashed marks in green show clinical entities that have appeared in the last period, compared to non-Hodgkin’s lymphomas in the previous diagrams, also shown in green with continuous lines. The second topic that agglutinates a higher number of documents in the period 2015–2020 (lymphoma classification) has been highlighted in red.
Biomolecules 11 00793 g004
Figure 5. World map showing the structure of relations among research institutions as shown in the network visualization module of the VOSviewer software. The map shows the bibliometric coupling relation among institutions according to the number of documents published for each institution.
Biomolecules 11 00793 g005
Figure 6. World map showing the structure of relations among research institutions as shown in the network visualization module of the VOSviewer software. The map shows the bibliometric coupling relation among institutions according to the number of citations received for each institution.
Biomolecules 11 00793 g006
Figure 7. World map showing the structure of relations among countries as shown in the network visualization module of the VOSviewer software. (A) Map for the bibliometric coupling relation among countries according to the number of documents published for each country. (B) Map for the bibliometric coupling relation among countries according to the number of citations received for each country.
Biomolecules 11 00793 g007
Table 1. Analysis of documents referred to AI and ML applications to diagnostic pathology in lymphoid neoplasms by institutions from 1990 to 2020. Data are provided by subperiods (1990–2005; 2006–2014; 2015–2020) and globally. C: document count; %: percentage of documents.
Institution1990–2005Institution2006–2014Institution2015–2020InstitutionTOTAL
C%C%C%C%
NAGOYA
UNIVERSITY
57.81CORNELL UNIV43.50CHINESE ACAD SCI102.87UNIV OF TEXAS SYSTEM193.61
AICHI CANC CTR46.25INDIAN STAT INST43.50EMORY UNIV102.87INSERM152.85
ST JOHNS HOSP34.68JADAVPUR UNIV43.50UNIV TEXAS MD ANDERSON82.29HARVARD UNIV132.47
CENT MED LABS23.12NANYANG TECHNOL UNIV32.63MEM SLOAN KETTERING CANC CTR72.01UNIV
CALIFORNIA SYSTEM
132.47
FLORIDA INT UNIV23.12NCI32.63UNIV PENN72.01CHINESE ACAD SCI122.28
HARVARD UNIV23.12NIH32.63ICAHN SCH MED MT SINAI61.72CORNELL UNIV122.28
NANYANG TECHNOL UNIV23.12RUTGERS STATE UNIV32.63MAYO CLIN61.72UTMD
ANDERSON CANCER
CENTER
112.09
OHIO STATE UNIV23.12TONGJI UNIV32.63TECH UNIV
MUNICH
61.72EMORY UNIV101.90
THOMAS
JEFFERSON UNIV
23.12UNIV MICHIGAN32.63CHINA UNIV MIN TECHNOL51.43MEM SLOAN KATTERING CANC CTR101.90
UNIV
BIRMINGHAMN
23.12UNIV
OXFORD
32.63COLUMBIA UNIV51.43UNIV
PENNSYLVANIA
101.90
UNIV
MARYLAND
23.12UNIV
TOKYO
32.63GEORGIA INST TECHNOL51.43APHP PARIS91.71
UNIV ROMA LA SAPIENZA23.12UNIV TURIN32.63MASSACHUSETTS GEN HOSP51.43CENT NAT DE LA RECHER SCIENTIFIQUE91.71
UNIV ROMA TOR VERGATA23.12UNIV
ZAGREB
32.63NEW JERSEY INST TECHNOL51.43SCHOOL OF MED MOUNT SINAI91.71
UNIV SO CALIF23.12CHARITE21.75OHIO STATE UNIV51.43NIH91.71
UNIV TURIN23.12DANA FARBER CANC INST21.75SHANGAI JIAO TONG UNIV51.43MAYO CLINIC81.52
YONSEI UNIV23.12FLORIDA INT UNIV21.75SICHUAN UNIV51.43STATE UNIV SYSTEM OF FLORIDA81.52
BETHESDA HOSP11.56GOETHE UNIV FRANKFURT21.75UNIV LEIPZIG51.43TECH UNIV OF MUNICH81.52
CEDARS SINAI MED CTR11.56HARVARD UNIV21.75UNIV SYDNEY51.43YONSEI UNIV81.52
CENTROL NACL INVEST ONCOL11.56HOP LYON SUD21.75YONSEI UNIV51.43COLUMBIA UNIV71.33
CHINESE
PEOPLES
LIBERAT ARMY GEN HOPS
11.56INDIAN INST TECHNOL21.75CHB HOSP41.14GOETHE UNIV FRANKFURT71.33
Table 2. Analysis of documents referred to AI and ML applications to diagnostic pathology in lymphoid neoplasms by source titles from 1990 to 2020. Data are provided for three subperiods (1990–2005; 2006–2014; 2015–2020) and globally. Bold type indicates Bradford nuclei for the 25% of total production for each period. Source titles are abbreviated. C: document count; %: percentage of documents.
Source Title1990–2005Source Title2006–2014Source Title2015–2020Source TitleTOTAL
C%C%C%C%
ARTIFICIAL
INTELLIGENCE IN MEDICINE
34.68LECTURE NOTES IN COMPUTER SCIENCE54.38EUROP JOURN NUCL MED MOL IMAG102.87LECTURE NOTES IN COMPUTER SCIENCE142.66
HUMAN PATHOLOGY34.68BMC
BIOINFORMATICS
43.50BLOOD92.25BLOOD122.28
LECTURE NOTES IN COMPUTER SCIENCE34.68PLOS ONE32.63SCIENTIFIC
REPORTS
82.29EUROP JOURN NUCL MED MOL IMAG101.90
PROCEEDINGS OF ANNUAL ICIEE-EMBS34.68ANALYTICAL CELLULAR
PATHOLOGY
21.75PROCEEDINGS OF THE SPIE72.01PROCEEDINGS OF THE SPIE91.71
BLOOD23.12ARTIFICIAL
INTELLIGENCE IN MEDICINE
21.75JOURNAL OF NUCLEAR
MEDICINE
61.72SCIENTIFIC
REPORTS
81.52
COMPUTATIONAL
BIOLOGY AND
CHEMISTRY
23.12BMC GENOMICS21-75LECTURE NOTES IN COMPUTER SCIENCE61.72BMC
BIOINFORMATICS
71.33
CYTOMETRY23.12COMPUTERS IN BIOLOGY AND MEDICINE21.75COMPUTER METHODS AND PROGRAMS IN BIOMEDICINE51.43PLOS ONE71.33
JOURNAL OF
BIOSCIENCE AND
BIOENGINEERING
23.12HEMATOLOGY21.75FRONTIERS IN ONCOLOGY51.43ARTIFICIAL
INTELLIGENCE IN MEDICINE
61.14
NEUROCOMPUTING23.12IEEE
ENGINEERING
MBSCP
21.75IEEE ACCESS51.43JOURNAL OF NUCLEAR
MEDICINE
61.14
PROCEEDING OF THE 2005 IEE SCIBCB23.12LEUKEMIA21.75LABORATORY INVESTIGATION51.43COMPUTER METHODS AND PROGRAMS IN BIOMEDICINE50.95
2000 IEEE EMBS
ICITABMP
11.56PROCEEDING OF THE SPIE21.75AMERICAN JOURNAL OF CLINICAL
PATHOLOGY
41.14FRONTIERS IN ONCOLOY50.95
2001 IEE NUCLEAR SCIENCE SCR11.562006 IEEE IJCNNP10.87BLOOD
ADVANCES
41.14IEEE ACCESS50.95
2004 IEE SCBCP11.562008 IEEE
WORSHOP ON MLSP
10.87CANCERS41.14JOURNAL OF BIOMEDICAL INFORMATICS50.95
2005 27TH ANNUAL IC-IEE E-EMBS11.562008 INTERNATIONAL STCITAB10.87IEEE ICBB41.14LABORATORY INVESTIGATION50.95
2005 IEE CSBCP11.562009 ANNUAL IC-IEEE-EMBS10.87JOURNAL OF BIOMEDICAL INFORMATICS41.14AMERICAN JOURNAL OF CLINICAL
PATHOLOGY
40.76
2005 IEE NETWORKING SCP11.562009 IEEE
CONGRESS ON EC
10.87MEDICAL
PHYSICS
41.14BLOOD
ADVANCES
40.76
7TH WORLD
CULTICONFERENCE ON SCI.
11.562010 7TH IEEE ISBINM10.87PLOS ONE41.14CANCERS40.76
AMERICAN JOURNAL OF
DERMATOPATHOLOGY
11.562012 7TH ICCCT10.87CLINICAL
CANCER
RESEARCH
30.86COMPUTERS IN BIOLOGY AND MEDICINE40.76
AMERICAN JOURNAL OF HEMATOLOGY11.562012 9TH IEEE ISBI10.87GENOME
MEDICINE
30.86IEE ICBB40.76
AMIA 2002 SYMPOSIUM PROCEEDINGS11.562013 12TH ICMLA10.87INTERNATIONAL JOURNAL OF LABORATORY HEMATOLOGY30.86LEUKEMIA40.76
Table 3. Analysis of documents referred to AI and ML applications to diagnostic pathology in lymphoid neoplasms by countries from 1990 to 2020. Data are provided for three subperiods (1990–2005; 2006–2014; 2015–2020) and globally. C: document count; %: percentage of documents.
Country1990–2005Country2006–2014Country2015–2020CountryTOTAL
C%C%C%C%
USA2539.06USA3833.33USA12736.49USA19036.19
ENGLAND69.37PEOPLE’S R CHINA1412.28PEOPLE’S R CHINA5716.37PEOPLE’S R CHINA7213.71
GERMANY69.37INDIA1210.52GERMANY339.48GERMANY448.38
JAPAN57.81ENGLAND119.64FRANCE236.60INDIA356.66
ITALY46.25ITALY87.01INDIA226.32FRANCE315.90
CANADA34.68FRANCE76.14SPAIN195.46ENGLAND305.71
IRELAND34.68JAPAN65.26ITALY185.17ITALY305.71
SINGAPORE34.68GERMANY54.38AUSTRALIA144.02JAPAN234,38
AUSTRALIA23.12IRAN54.38ENGLAND133.73SPAIN234.38
NETHERLANDS23.12POLAND43.50JAPAN123.44AUSTRALIA173.23
NEW ZEALAND23.12SINGAPORE43.50SOUTH KOREA123.44SOUTH KOREA163.04
SOUTH KOREA23.12CROATIA32.63CANADA102.87CANADA142.66
WALES23.12SPAIN32.63SWITZERLAND102.87NETHERLANDS122.28
BARBADOS11.56AUSTRIA21.75NETHERLANDS92.58SWITZERLAND122,28
CROATIA11.56BRAZIL21.75AUSTRIA82.29AUSTRIA101.90
FRANCE11.56MEXICO21.75BRAZIL82.29BRAZIL101.90
INDIA11.56SLOVENIA21.75DENMARK82.29IRAN101.90
ISRAEL11.56SOUTH KOREA21.75SWEDEN72.01DENMARK91.71
PEOPLES R CHINA11.56AUSTRALIA19.87SAUDI ARABIA61.72SINGAPORE81.52
POLAND11.56BELGIUM10.87EGYPT51.43SWEDEN81.52
Publisher’s Note: MDPI stays neutral with regard to jurisdictional claims in published maps and institutional affiliations.

