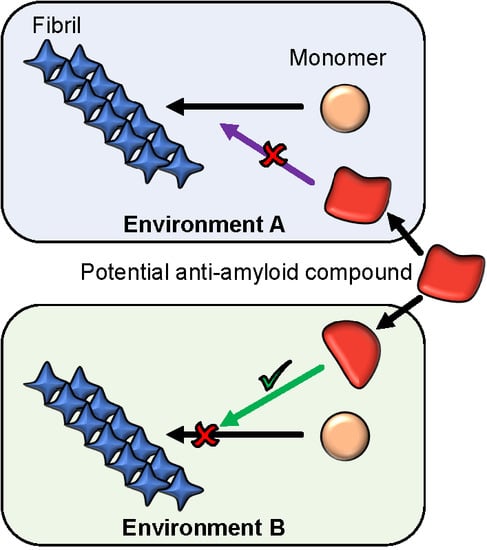
The Environment Is a Key Factor in Determining the Anti-Amyloid Efficacy of EGCG

 , , , , , and
Abstract
:
1. Introduction
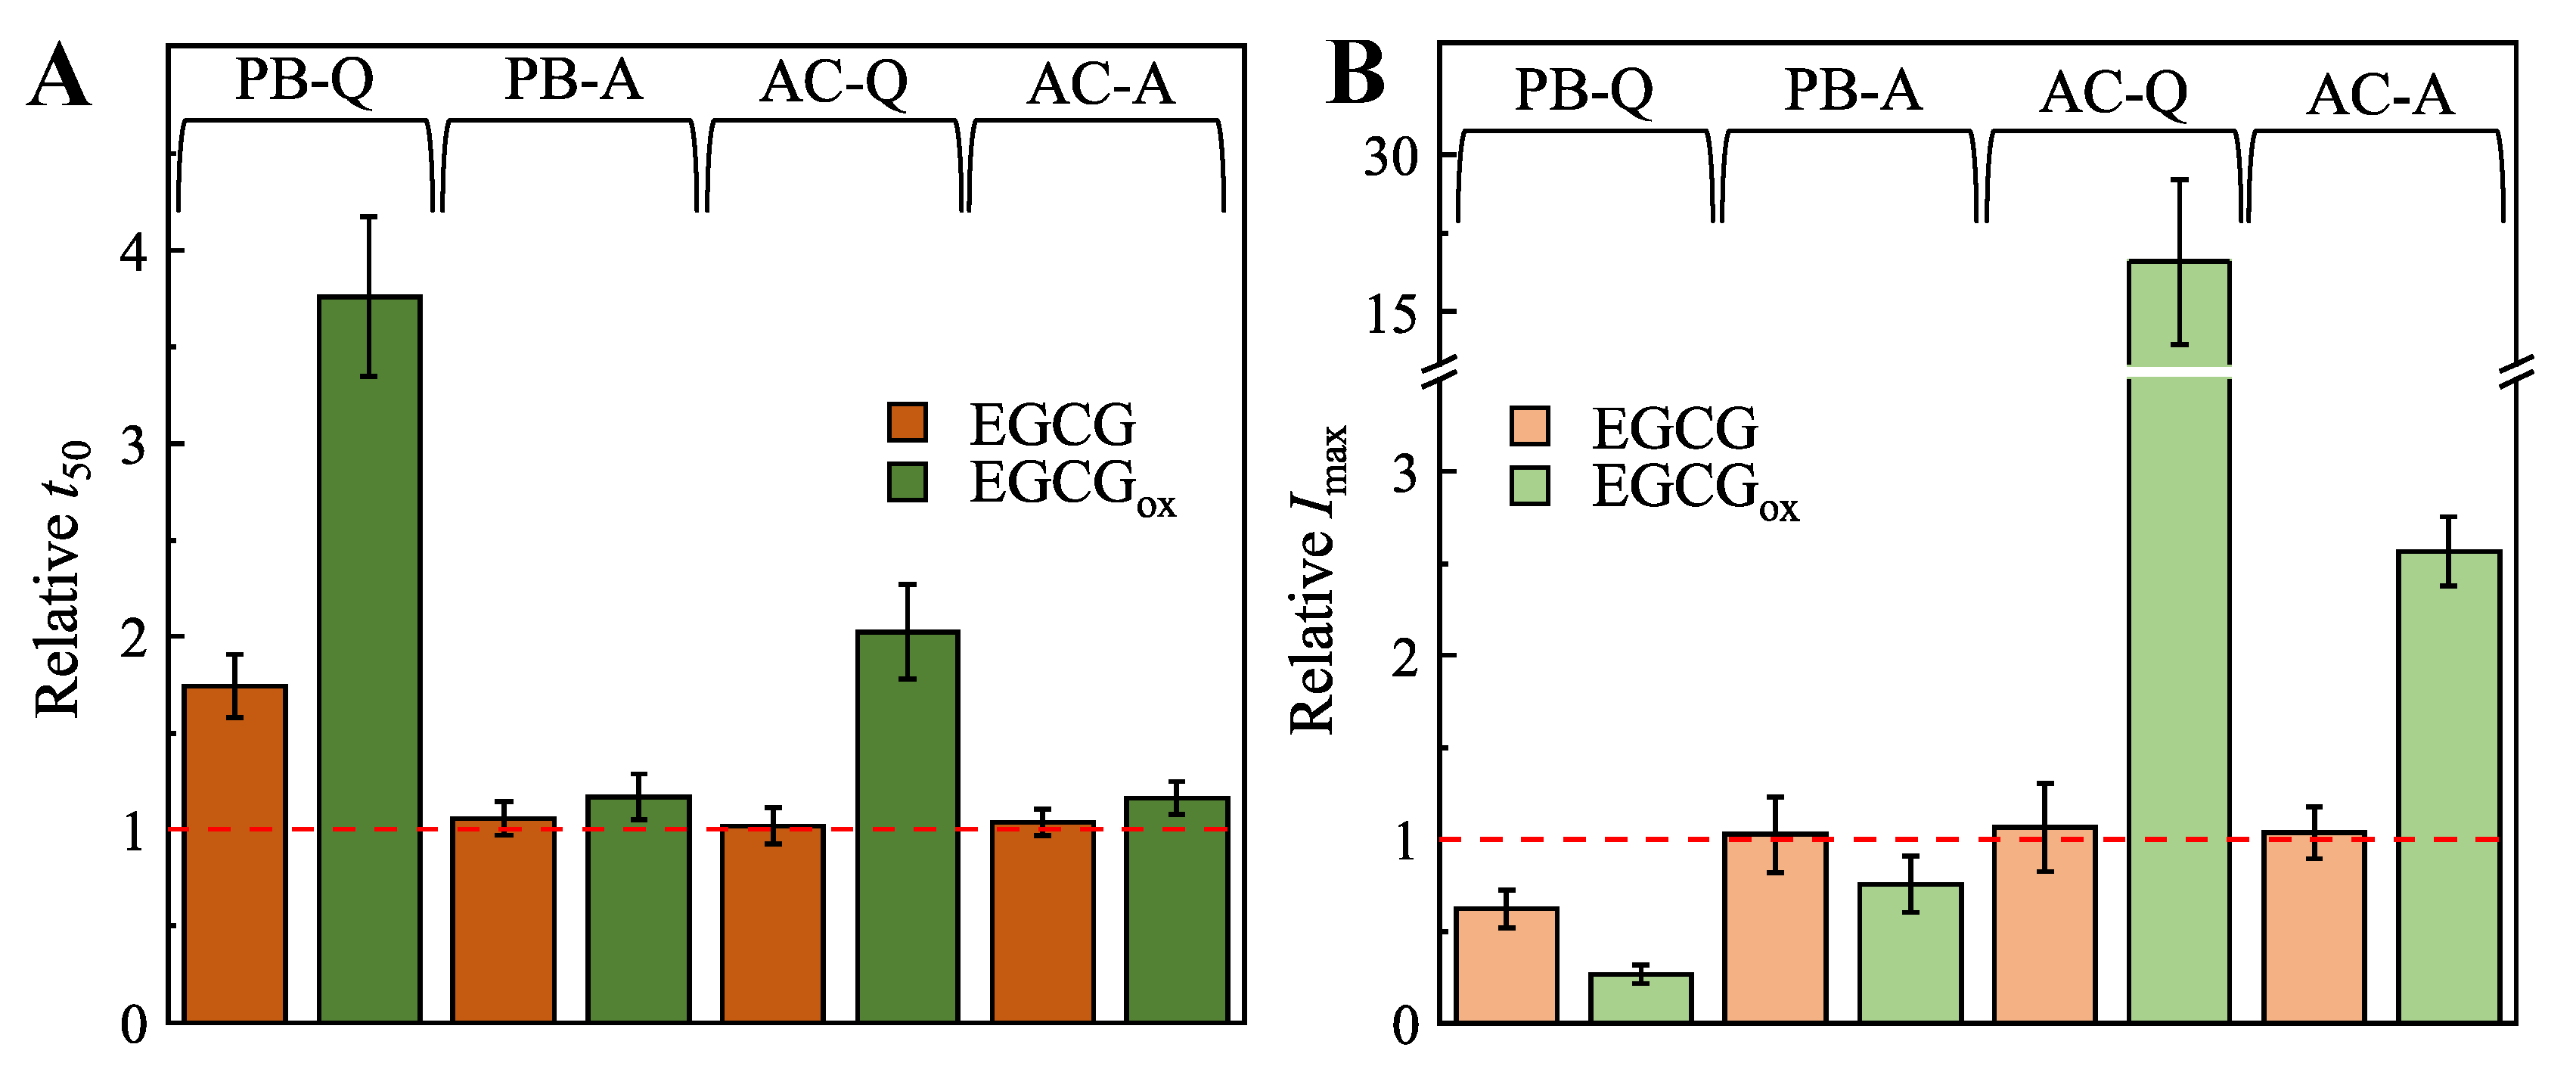
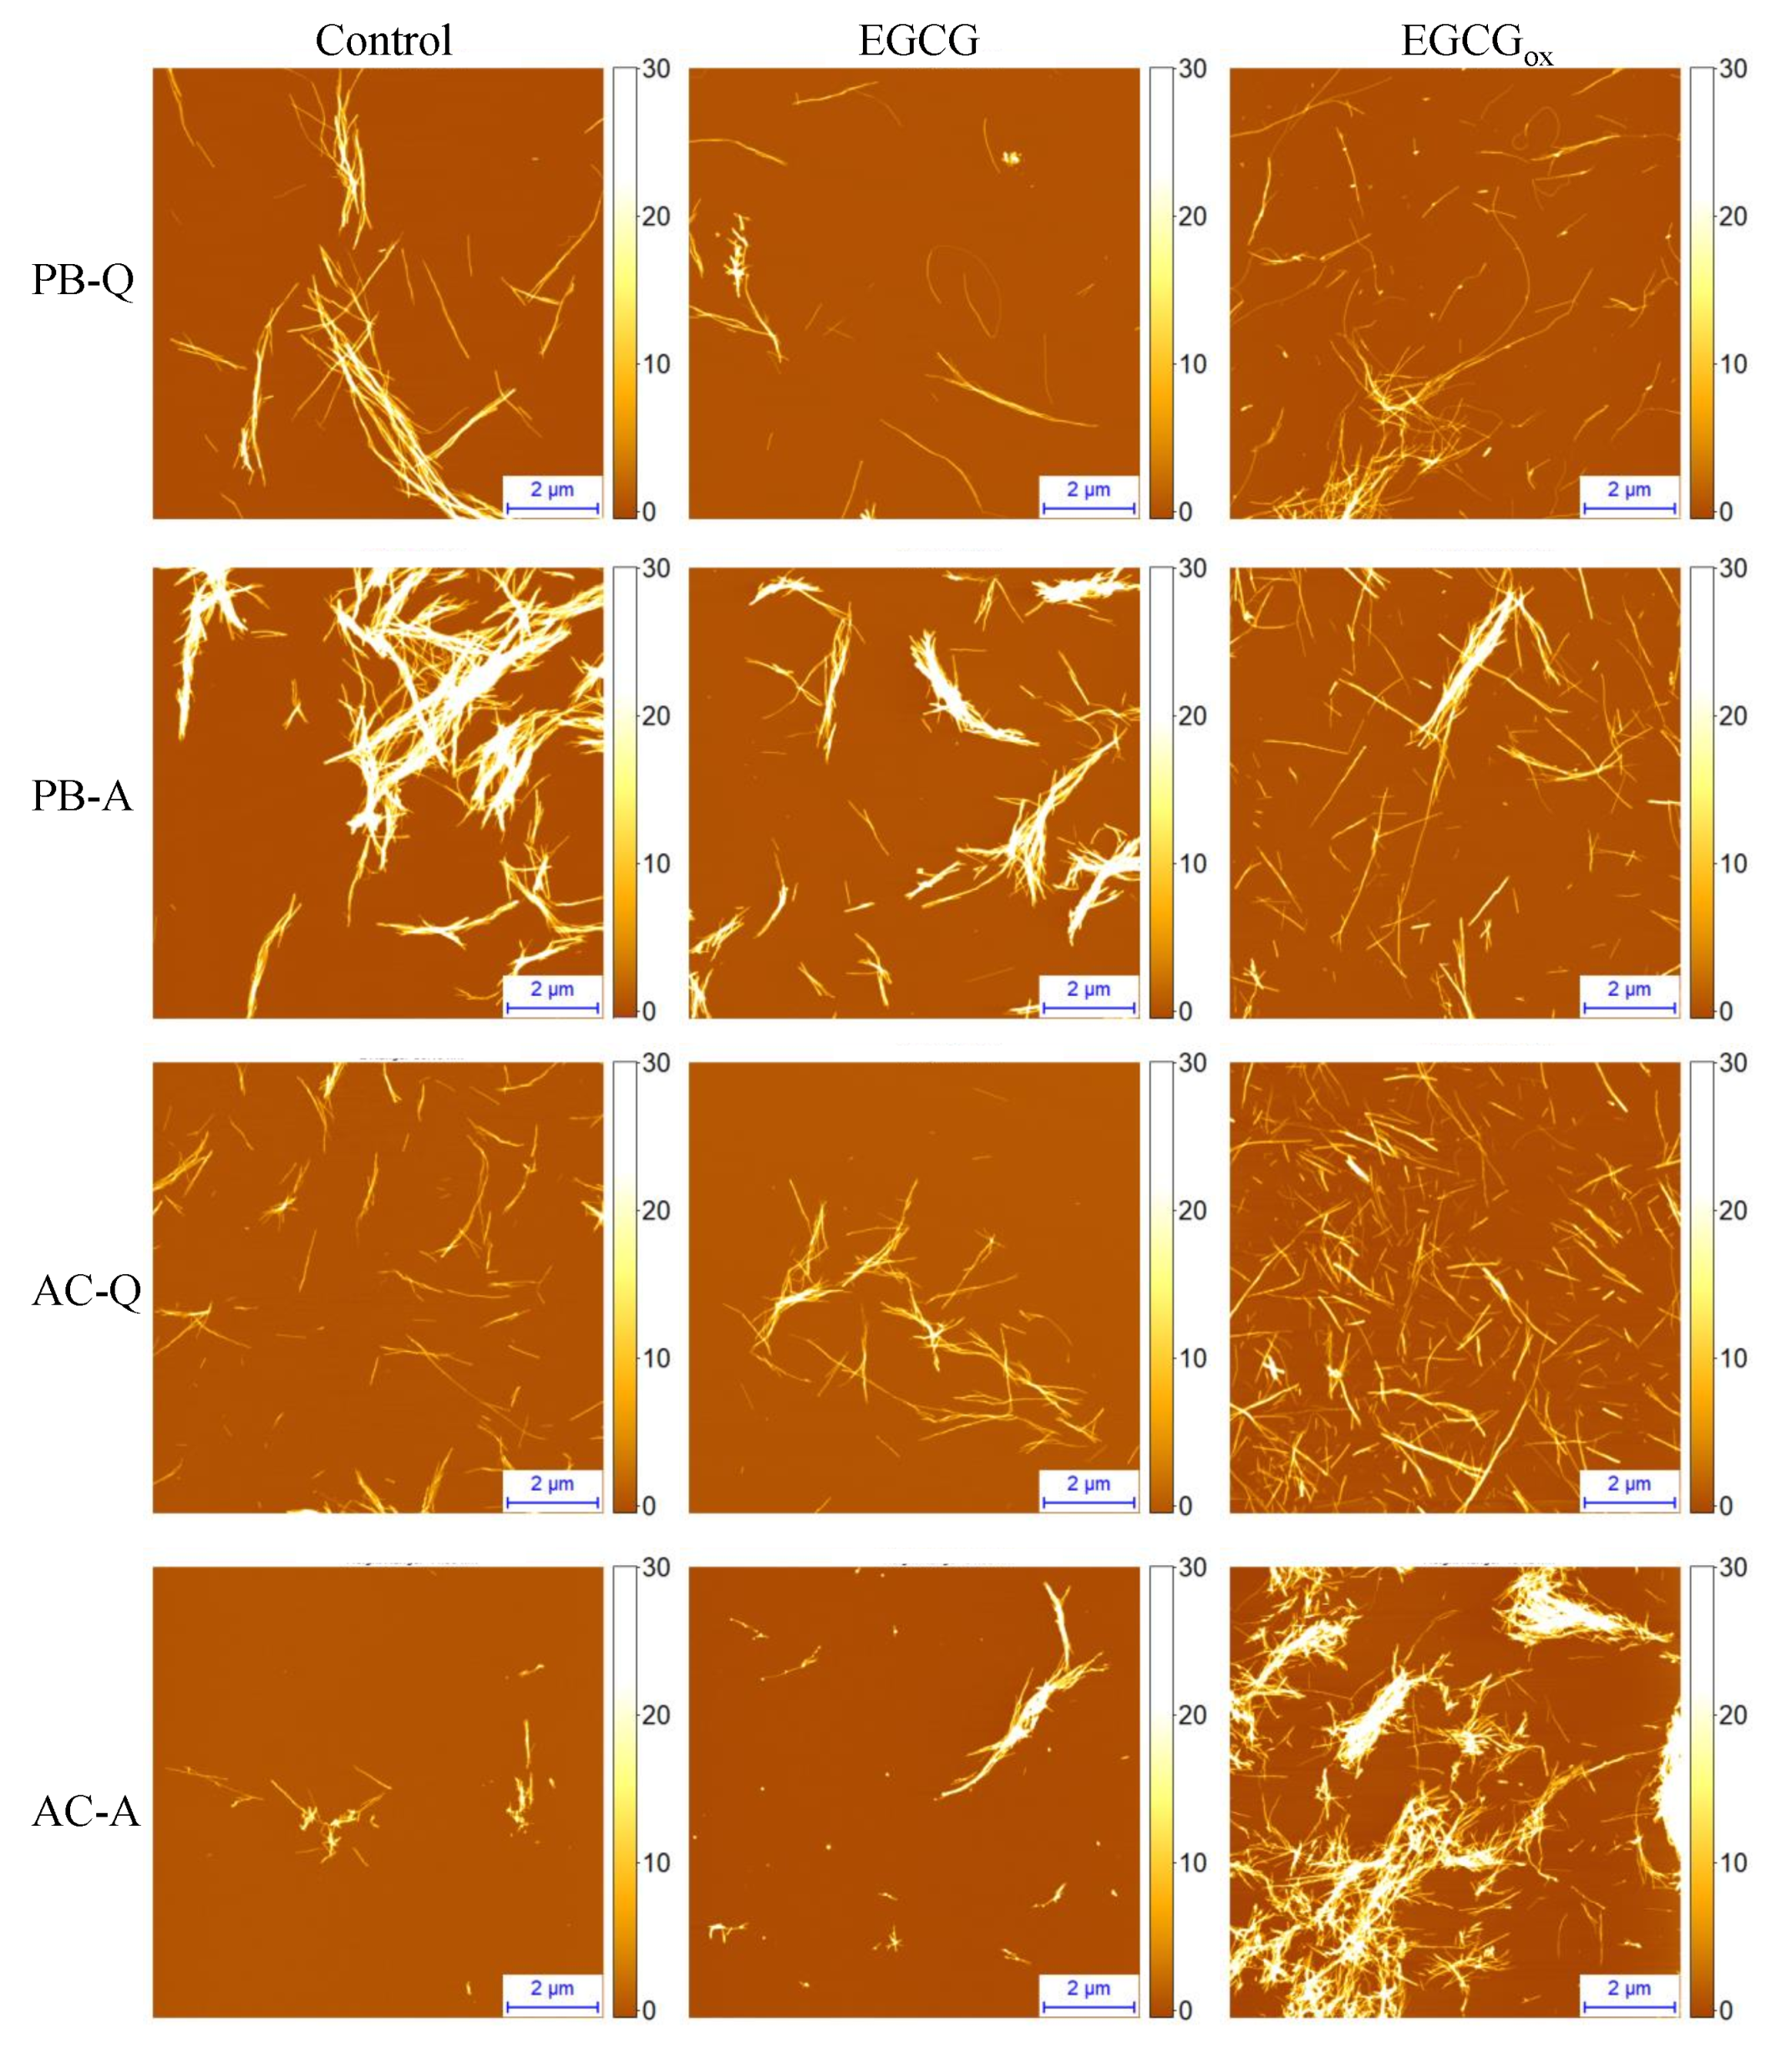
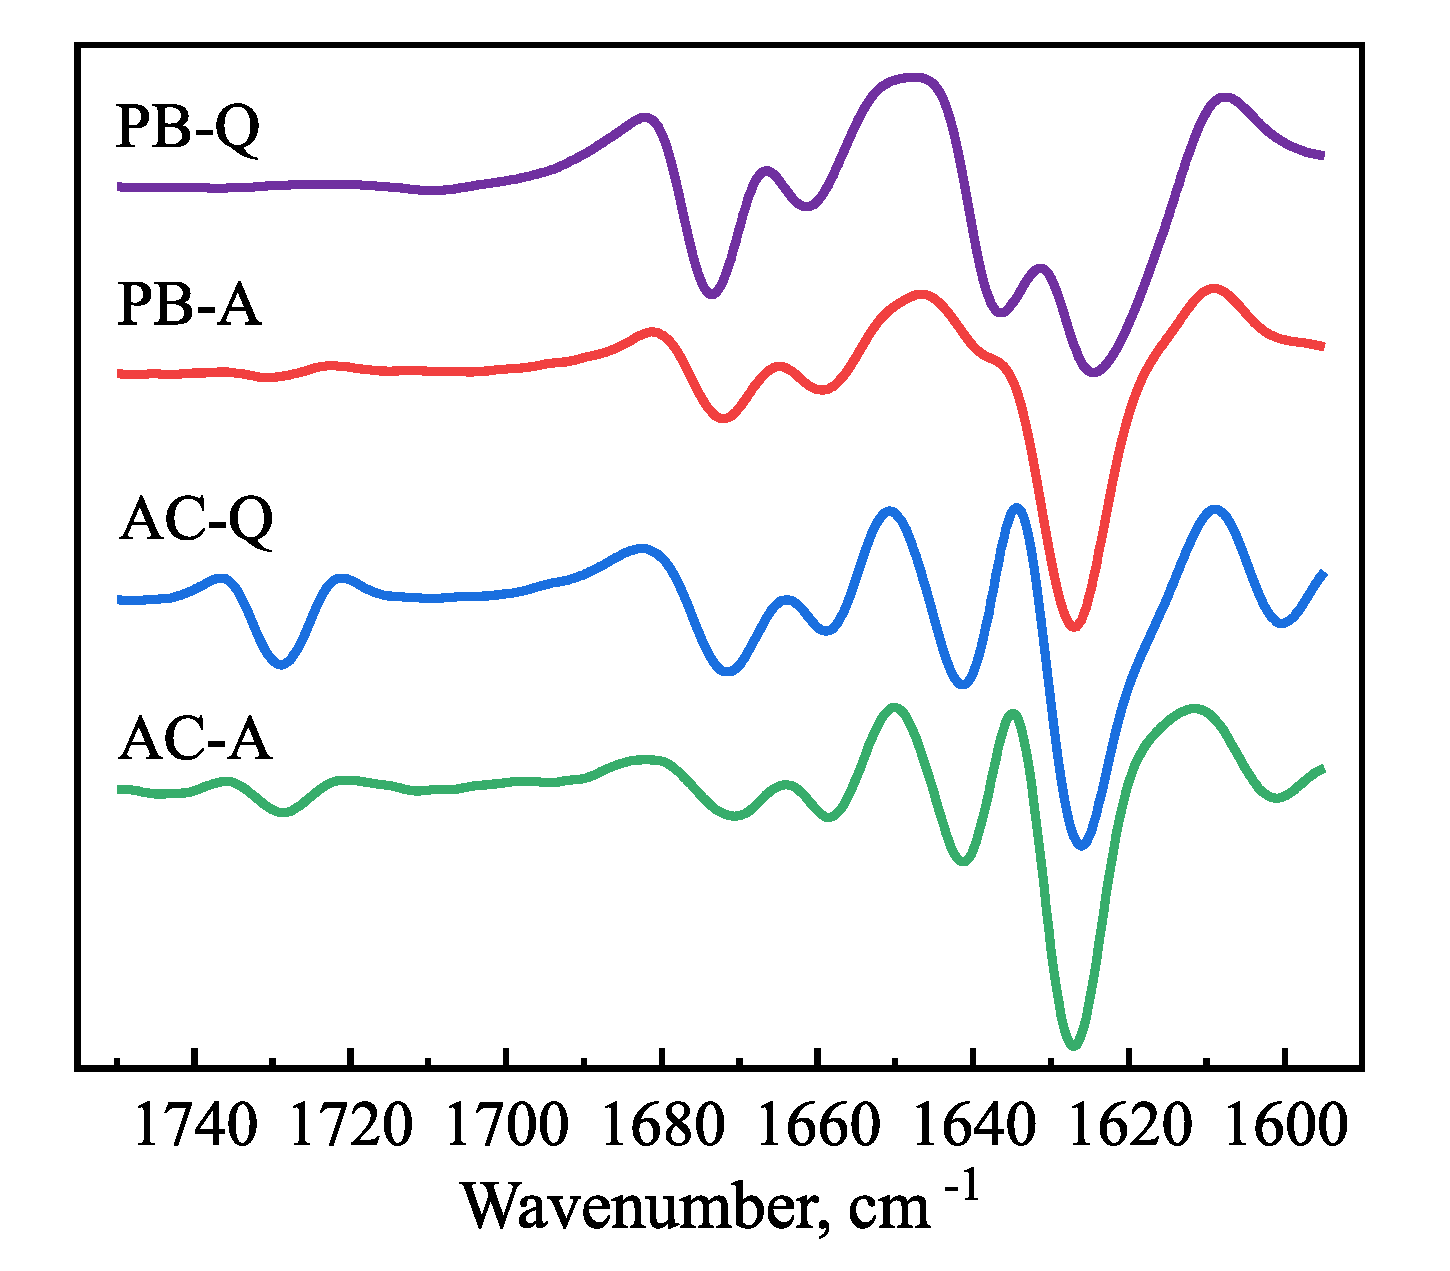
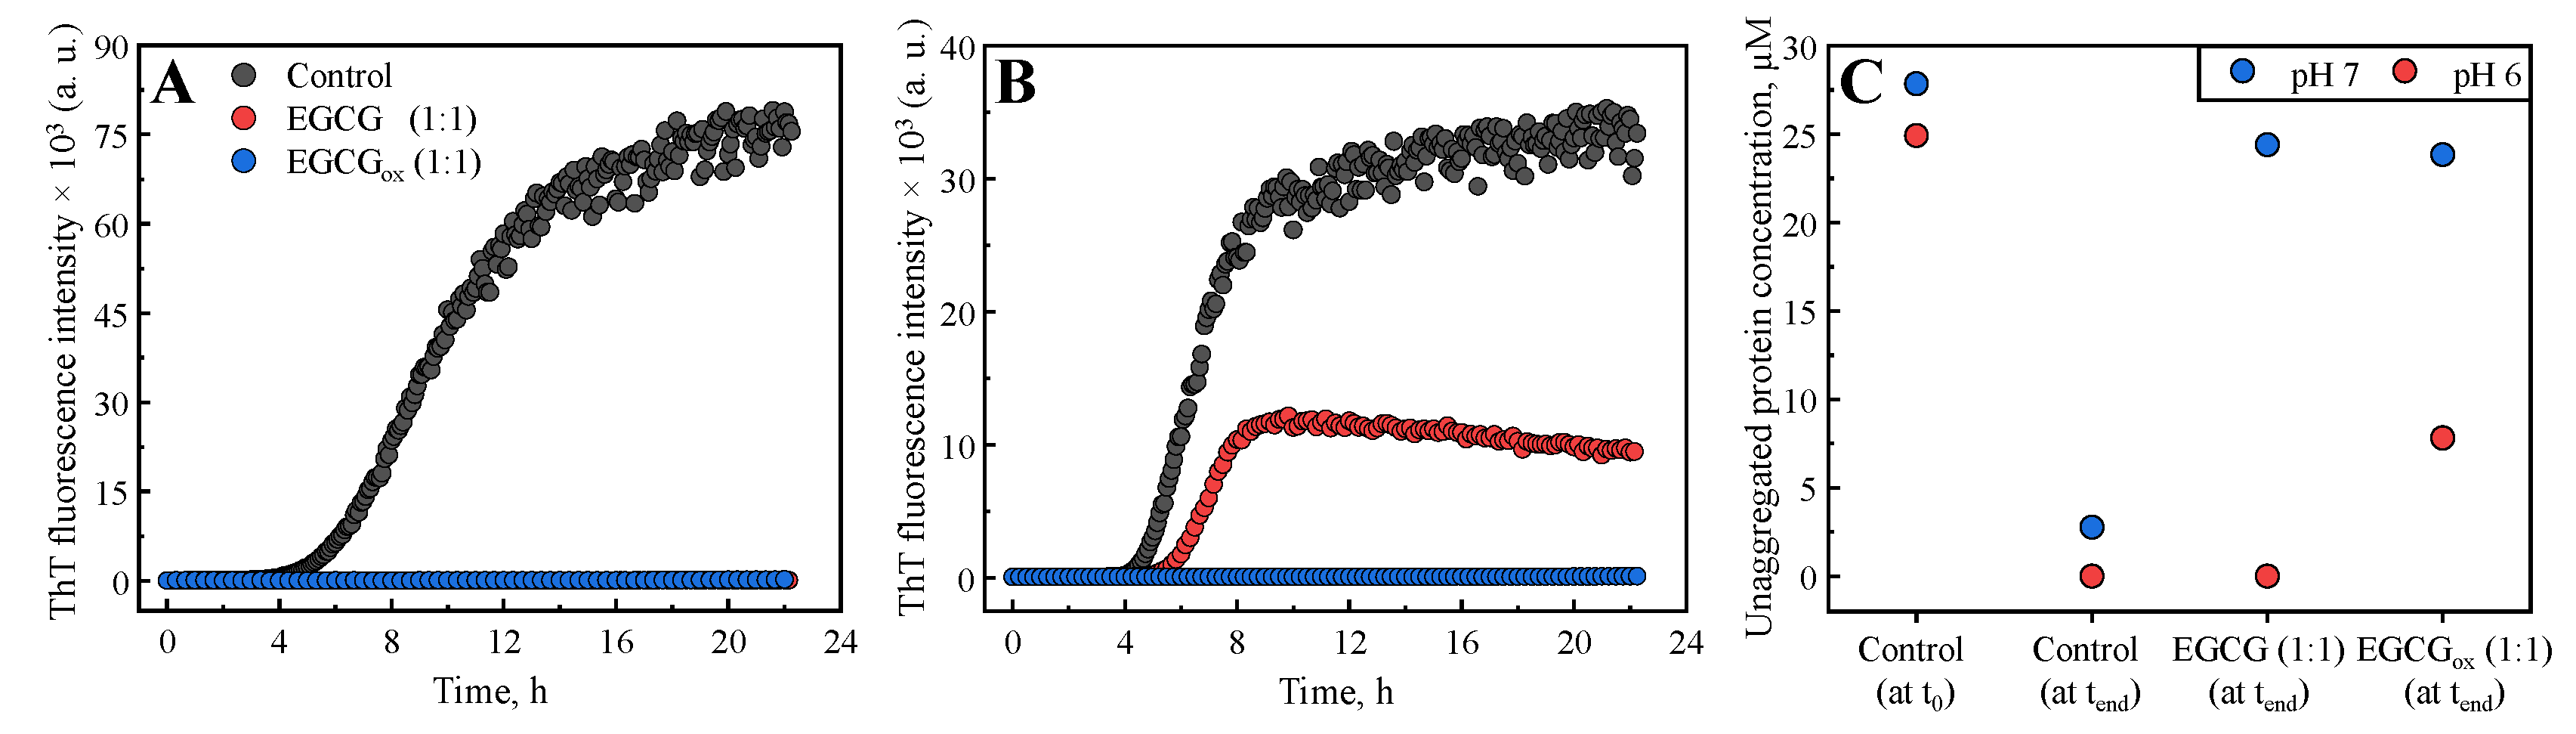
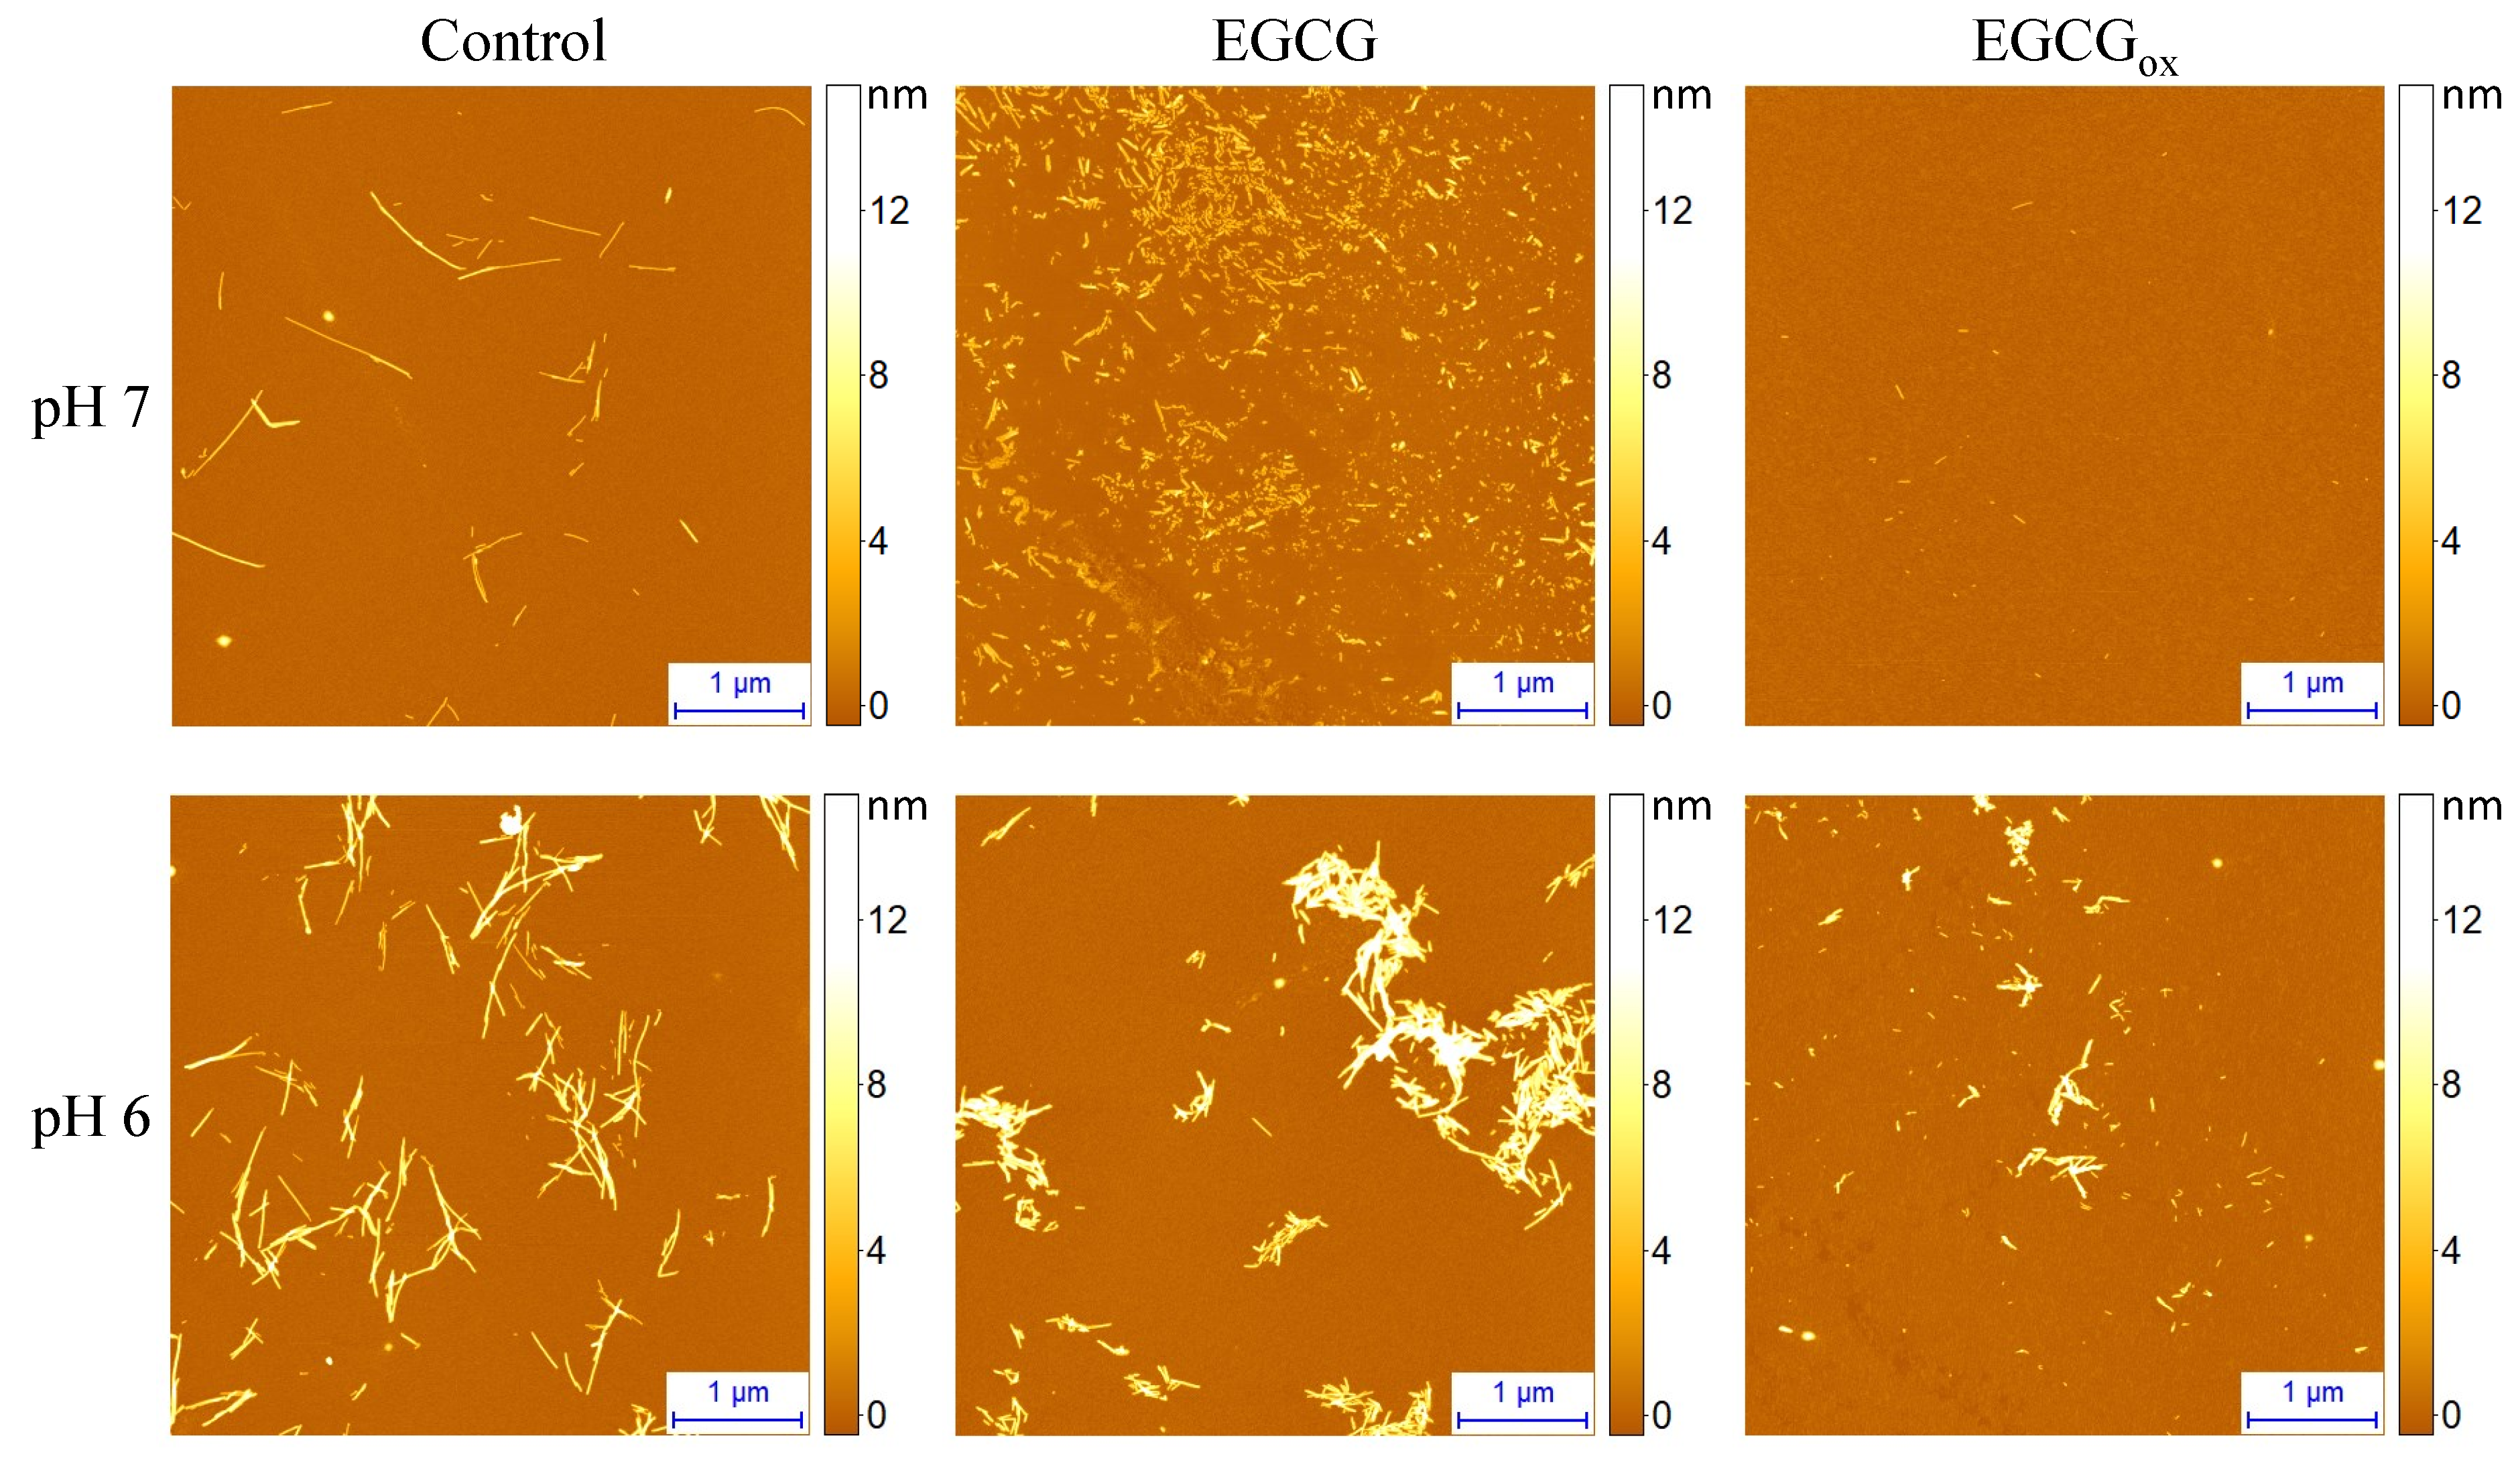
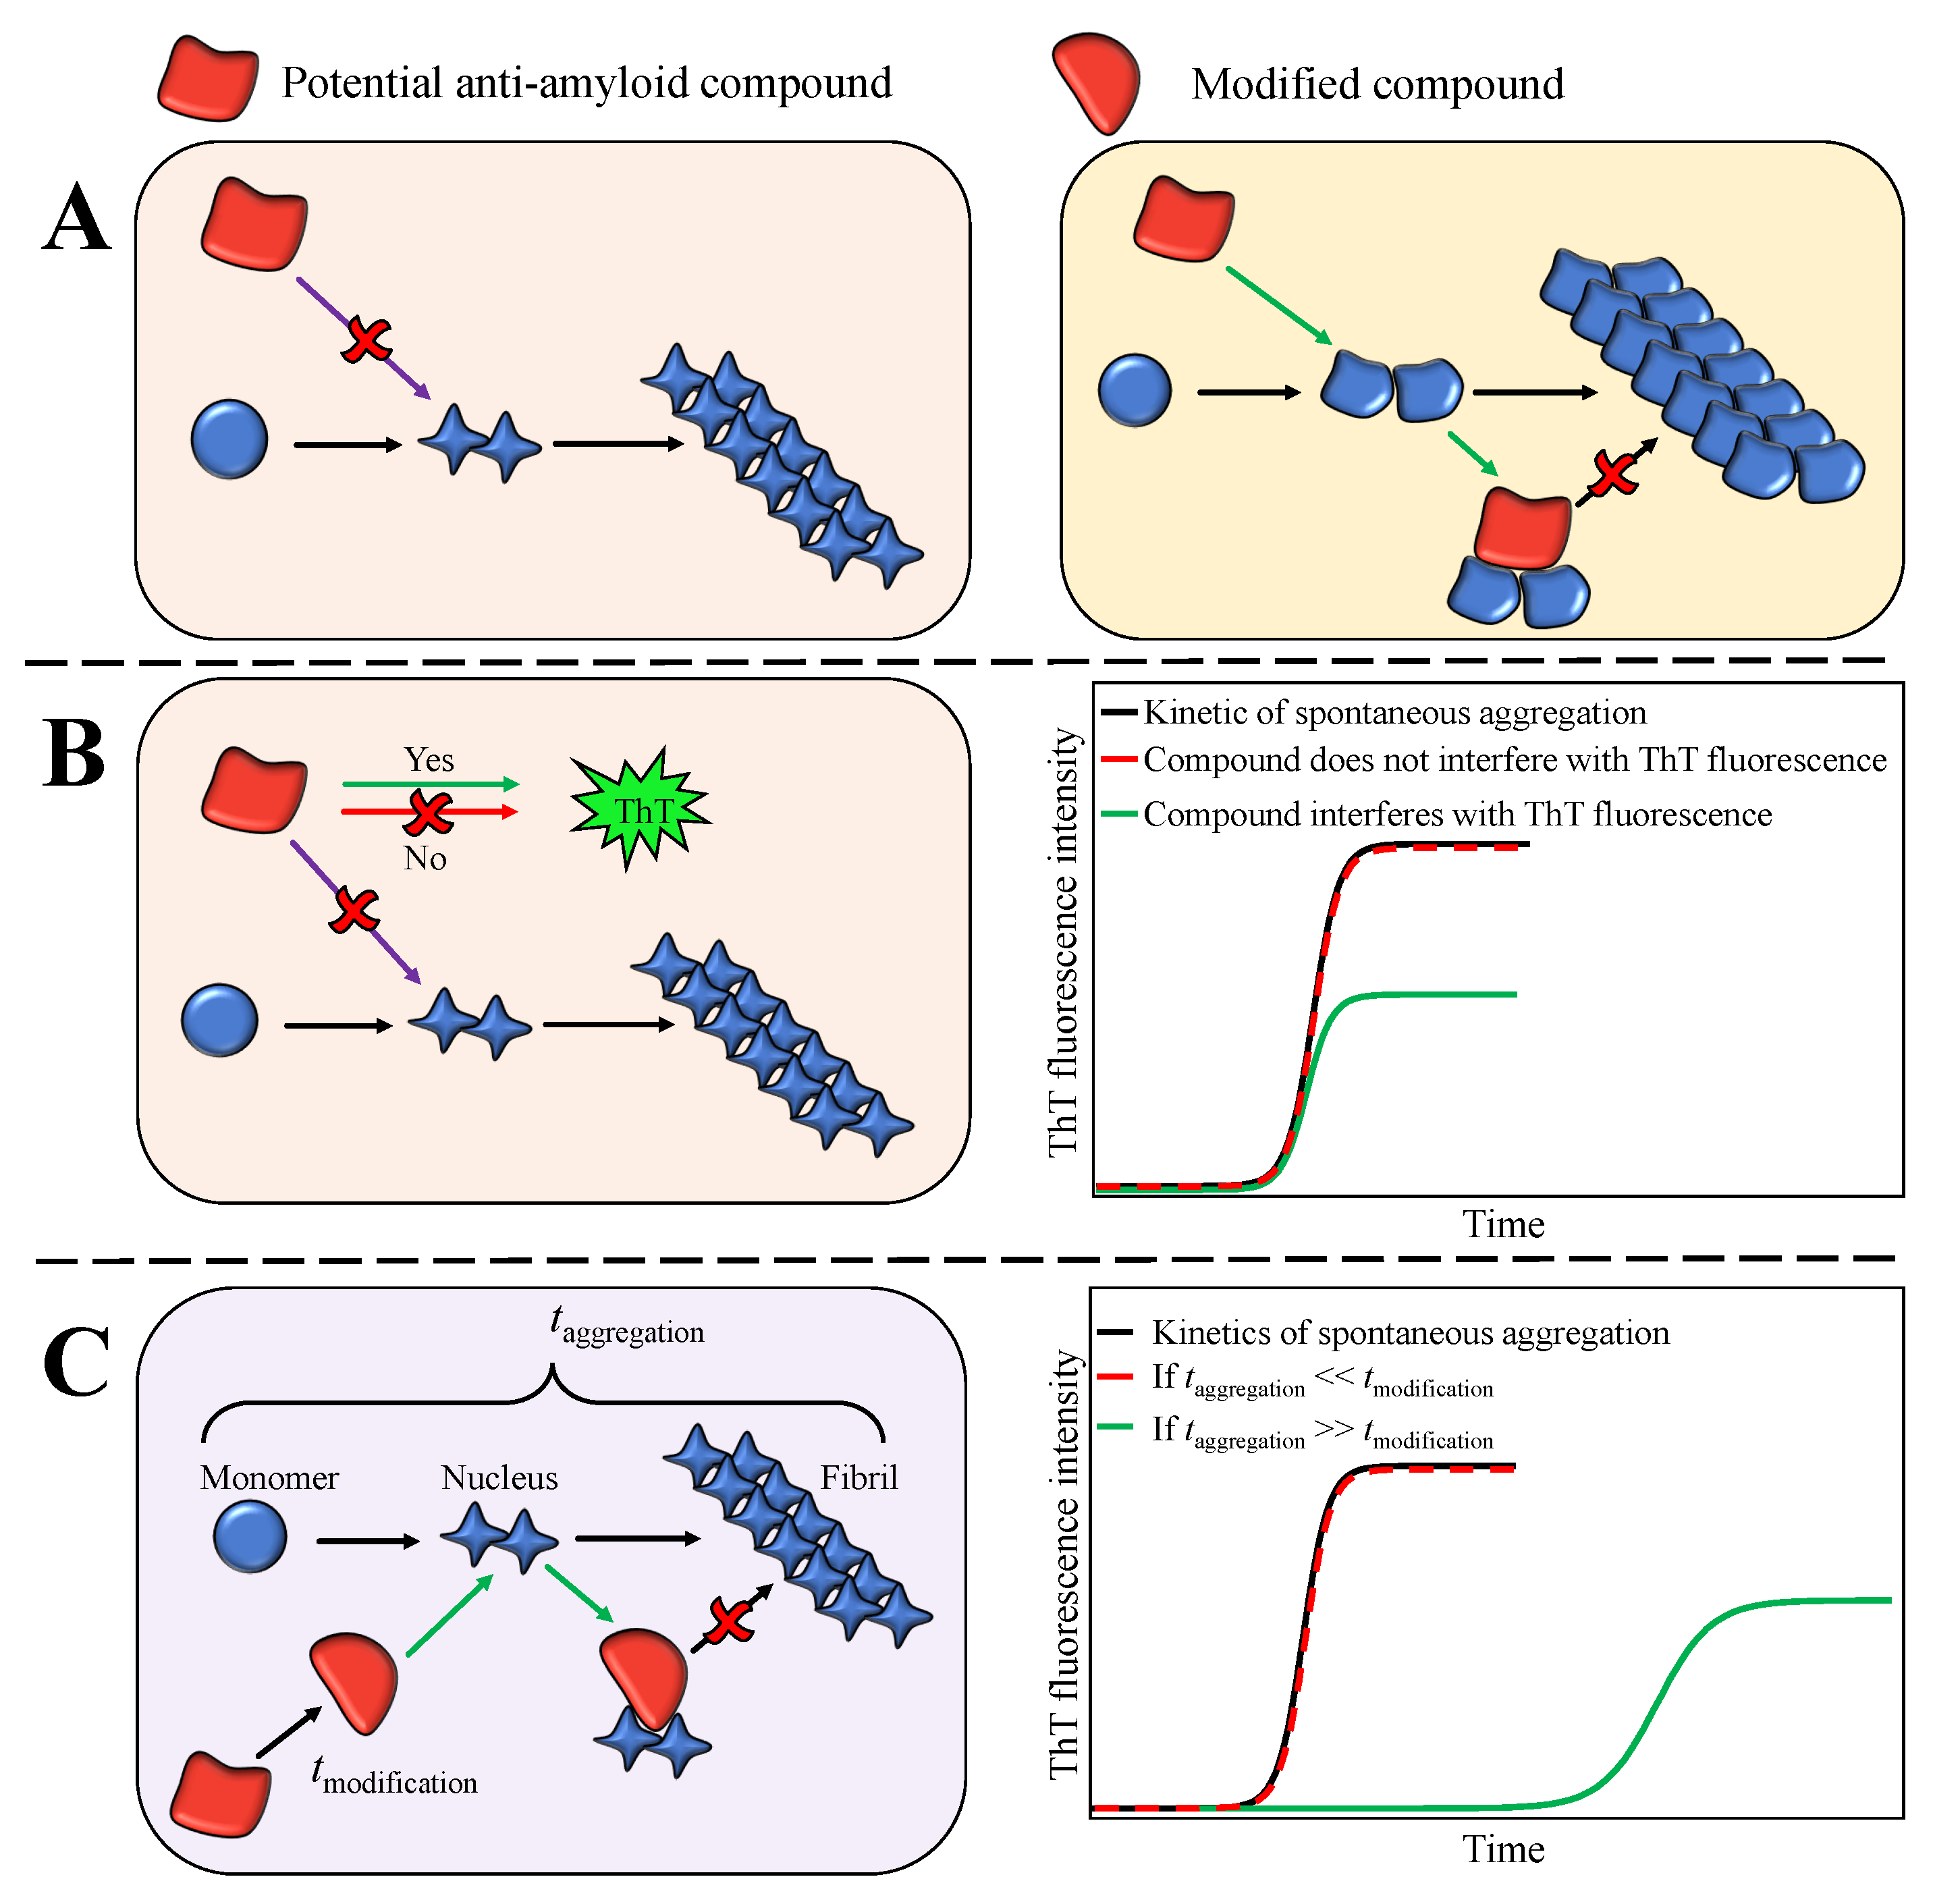
2. Results
3. Discussion and Conclusions
4. Materials and Methods
4.1. Materials and Solutions
4.2. Measurements of Aggregation Kinetics
4.3. Evaluation of EGCG and EGCG Effects on the Insulin Aggregation Process
4.4. Atomic Force Microscopy (AFM)
4.5. Fourier-Transform Infrared (FTIR) Spectroscopy
4.6. Microfluidic Diffusional Sizing and Concentration Measurements
4.7. Time Course of EGCG Oxidation
Supplementary Materials
Author Contributions
Funding
Acknowledgments
Conflicts of Interest
References
- Chiti, F.; Dobson, C.M. Protein misfolding, amyloid formation, and human disease: A summary of progress over the last decade. Annu. Rev. Biochem. 2017, 86, 27–68. [Google Scholar] [CrossRef] [PubMed]
- Knowles, T.P.J.; Vendruscolo, M.; Dobson, C.M. The amyloid state and its association with protein misfolding diseases. Nat. Rev. Mol. Cell Biol. 2014, 15, 384–396. [Google Scholar] [CrossRef] [PubMed]
- Selkoe, D.J.; Hardy, J. The amyloid hypothesis of Alzheimer’s disease at 25 years. EMBO Mol. Med. 2016, 8, 595–608. [Google Scholar] [CrossRef] [PubMed]
- Wisniewski, T.; Goñi, F. Immunotherapeutic approaches for Alzheimer’s disease. Neuron 2015, 85, 1162–1176. [Google Scholar] [CrossRef] [Green Version]
- Fitzpatrick, A.W.P.; Debelouchina, G.T.; Bayro, M.J.; Clare, D.K.; Caporini, M.A.; Bajaj, V.S.; Jaroniec, C.P.; Wang, L.; Ladizhansky, V.; Muller, S.A.; et al. Atomic structure and hierarchical assembly of a cross-beta amyloid fibril. Proc. Natl. Acad. Sci. USA 2013, 110, 5468–5473. [Google Scholar] [CrossRef] [Green Version]
- Porat, Y.; Abramowitz, A.; Gazit, E. Inhibition of amyloid fibril formation by polyphenols: Structural similarity and aromatic interactions as a common inhibition mechanism. Chem. Biol. Drug Des. 2006, 67, 27–37. [Google Scholar] [CrossRef]
- Doig, A.J.; Derreumaux, P. Inhibition of protein aggregation and amyloid formation by small molecules. Current Opin. Struct. Biol. 2015, 30, 50–56. [Google Scholar] [CrossRef]
- Mangialasche, F.; Solomon, A.; Winblad, B.; Mecocci, P.; Kivipelto, M. Alzheimer’s disease: Clinical trials and drug development. Lancet Neurol. 2010, 9, 702–716. [Google Scholar] [CrossRef]
- Castellani, R.J.; Plascencia-Villa, G.; Perry, G. The amyloid cascade and Alzheimer’s disease therapeutics: Theory versus observation. Lab. Investig. 2019, 99, 958–970. [Google Scholar] [CrossRef]
- Cheng, B.; Gong, H.; Xiao, H.; Petersen, R.B.; Zheng, L.; Huang, K. Inhibiting toxic aggregation of amyloidogenic proteins: A therapeutic strategy for protein misfolding diseases. Biochim. Biophys. Acta Gen. Subj. 2013, 1830, 4860–4871. [Google Scholar] [CrossRef]
- Lao, K.; Ji, N.; Zhang, X.; Qiao, W.; Tang, Z.; Gou, X. Drug development for Alzheimer’s disease: Review. J. Drug Target. 2019, 27, 164–173. [Google Scholar] [CrossRef]
- Stefani, M.; Rigacci, S. Protein folding and aggregation into amyloid: The interference by natural phenolic compounds. Int. J. Mol. Sci. 2013, 14, 12411–12457. [Google Scholar] [CrossRef] [Green Version]
- Molino, S.; Dossena, M.; Buonocore, D.; Ferrari, F.; Venturini, L.; Ricevuti, G.; Verri, M. Polyphenols in dementia: From molecular basis to clinical trials. Life Sci. 2016, 161, 69–77. [Google Scholar] [CrossRef]
- Goyal, D.; Shuaib, S.; Mann, S.; Goyal, B. Rationally designed peptides and peptidomimetics as inhibitors of amyloid-β (Aβ) aggregation: Potential therapeutics of Alzheimer’s disease. ACS Comb. Sci. 2017, 19, 55–80. [Google Scholar] [CrossRef] [PubMed]
- Agerschou, E.D.; Flagmeier, P.; Saridaki, T.; Galvagnion, C.; Komnig, D.; Nagpal, A.; Gasterich, N.; Heid, L.; Prasad, V.; Shaykhalishahi, H.; et al. An engineered monomer binding-protein for α-synuclein efficiently inhibits the proliferation of amyloid fibrils. eLife 2019, 8, e46112. [Google Scholar] [CrossRef] [PubMed]
- Mehta, D.; Jackson, R.; Paul, G.; Shi, J.; Sabbagh, M. Why do trials for Alzheimer’s disease drugs keep failing? A discontinued drug perspective for 2010–2015. Expert Opin. Investig. Drugs 2017, 26, 735–739. [Google Scholar] [CrossRef] [PubMed]
- Mathur, S.; Dewitte, S.; Robledo, I.; Isaacs, T.; Stamford, J. Rising to the challenges of clinical trial improvement in Parkinson’s disease. J. Parkinson’s Dis. 2015, 5, 263–268. [Google Scholar] [CrossRef] [PubMed] [Green Version]
- Athauda, D.; Foltynie, T. Challenges in detecting disease modification in Parkinson’s disease clinical trials. Parkinsonism Relat. Disord. 2016, 32, 1–11. [Google Scholar] [CrossRef]
- Al-Ansari, A.; Robertson, N.P. Creutzfeldt-Jacob disease: New directions in diagnosis and therapeutics. J. Neurol. 2017, 264, 1029–1031. [Google Scholar] [CrossRef] [Green Version]
- Yaari, R.; Hake, A. Alzheimer’s disease clinical trials: Past failures and future opportunities. Clin. Investig. 2015, 5, 297–309. [Google Scholar] [CrossRef]
- Cummings, J.L.; Morstorf, T.; Zhong, K. Alzheimer’s disease drug-development pipeline: Few candidates, frequent failures. Alzheimer’s Res. Ther. 2014, 6, 37. [Google Scholar] [CrossRef] [PubMed] [Green Version]
- Sneideris, T.; Darguzis, D.; Botyriute, A.; Grigaliunas, M.; Winter, R.; Smirnovas, V. pH-driven polymorphism of insulin amyloid-like fibrils. PLoS ONE 2015, 10, e0136602. [Google Scholar] [CrossRef] [PubMed]
- Ziaunys, M.; Sneideris, T.; Smirnovas, V. Self-inhibition of insulin amyloid-like aggregation. Phys. Chem. Chem. Phys. 2018, 20, 27638–27645. [Google Scholar] [CrossRef] [PubMed]
- Sneideris, T.; Milto, K.; Smirnovas, V. Polymorphism of amyloid-like fibrils can be defined by the concentration of seeds. PeerJ 2015, 3, e1207. [Google Scholar] [CrossRef] [PubMed] [Green Version]
- Buell, A.K.; Galvagnion, C.; Gaspar, R.; Sparr, E.; Vendruscolo, M.; Knowles, T.P.J.; Linse, S.; Dobson, C.M. Solution conditions determine the relative importance of nucleation and growth processes in α-synuclein aggregation. Proc. Natl. Acad. Sci. USA 2014, 111, 7671–7676. [Google Scholar] [CrossRef] [PubMed] [Green Version]
- Guo, J.L.; Lee, V.M.Y. Cell-to-cell transmission of pathogenic proteins in neurodegenerative diseases. Nat. Med. 2014, 20, 130–138. [Google Scholar] [CrossRef] [PubMed] [Green Version]
- Adamcik, J.; Mezzenga, R. Amyloid polymorphism in the protein folding and aggregation energy landscape. Angew. Chem. Int. Ed. 2018, 57, 8370–8382. [Google Scholar] [CrossRef]
- Wei, Y.; Chen, P.; Ling, T.; Wang, Y.; Dong, R.; Zhang, C.; Zhang, L.; Han, M.; Wang, D.; Wan, X.; et al. Certain (-)-epigallocatechin-3-gallate (EGCG) auto-oxidation products (EAOPs) retain the cytotoxic activities of EGCG. Food Chem. 2016, 204, 218–226. [Google Scholar] [CrossRef]
- An, T.T.; Feng, S.; Zeng, C.M. Oxidized epigallocatechin gallate inhibited lysozyme fibrillation more strongly than the native form. Redox Biol. 2017, 11, 315–321. [Google Scholar] [CrossRef]
- Palhano, F.L.; Lee, J.; Grimster, N.P.; Kelly, J.W. Toward the molecular mechanism(s) by which EGCG treatment remodels mature amyloid fibrils. J. Am. Chem. Soc. 2013, 135, 7503–7510. [Google Scholar] [CrossRef] [Green Version]
- Attar, A.; Rahimi, F.; Bitan, G. Modulators of amyloid protein aggregation and toxicity: EGCG and CLR01. Transl. Neurosci. 2013, 4, 385–409. [Google Scholar] [CrossRef] [Green Version]
- Liu, Y.; Liu, Y.; Wang, S.; Dong, S.; Chang, P.; Jiang, Z. Structural characteristics of (-)-epigallocatechin-3-gallate inhibiting amyloid Aβ42 aggregation and remodeling amyloid fibers. RSC Adv. 2015, 5, 62402–62413. [Google Scholar] [CrossRef]
- Bieschke, J.; Russ, J.; Friedrich, R.P.; Ehrnhoefer, D.E.; Wobst, H.; Neugebauer, K.; Wanker, E.E. EGCG remodels mature α-synuclein and amyloid-β fibrils and reduces cellular toxicity. Proc. Natl. Acad. Sci. USA 2010, 107, 7710–7715. [Google Scholar] [CrossRef] [PubMed] [Green Version]
- Zhao, J.; Liang, Q.; Sun, Q.; Chen, C.; Xu, L.; Ding, Y.; Zhou, P. (-)-Epigallocatechin-3-gallate (EGCG) inhibits fibrillation, disaggregates amyloid fibrils of α-synuclein, and protects PC12 cells against α-synuclein-induced toxicity. RSC Adv. 2017, 7, 32508–32517. [Google Scholar] [CrossRef] [Green Version]
- Qing, H.; McGeer, P.L.; Zhang, Y.; Yang, Q.; Dai, R.; Zhang, R.; Guo, J.; Wong, W.; Xu, Y.; Quan, Z. Epigallocatechin gallate (EGCG) inhibits alpha-synuclein aggregation: A potential agent for Parkinson’s disease. Neurochem. Res. 2016, 41, 2788–2796. [Google Scholar] [CrossRef]
- Roy, S.; Bhat, R. Suppression, disaggregation, and modulation of γ-Synuclein fibrillation pathway by green tea polyphenol EGCG. Protein Sci. 2019, 28, 382–402. [Google Scholar] [CrossRef] [Green Version]
- Lee, Y.H.; Lin, Y.; Cox, S.J.; Kinoshita, M.; Sahoo, B.R.; Ivanova, M.; Ramamoorthy, A. Zinc boosts EGCG’s hIAPP amyloid Inhibition both in solution and membrane. Biochim. Biophys. Acta (BBA) Proteins Proteom. 2019, 1867, 529–536. [Google Scholar] [CrossRef]
- Xu, Z.X.; Ma, G.L.; Zhang, Q.; Chen, C.H.; He, Y.M.; Xu, L.H.; Zhou, G.R.; Li, Z.H.; Yang, H.J.; Zhou, P. Inhibitory mechanism of epigallocatechin gallate on fibrillation and aggregation of amidated human islet amyloid polypeptide. ChemPhysChem 2017, 18, 1611–1619. [Google Scholar] [CrossRef]
- Ehrnhoefer, D.E.; Duennwald, M.; Markovic, P.; Wacker, J.L.; Engemann, S.; Roark, M.; Legleiter, J.; Marsh, J.L.; Thompson, L.M.; Lindquist, S.; et al. Green tea (-)-epigallocatechin-gallate modulates early events in huntingtin misfolding and reduces toxicity in Huntington’s disease models. Hum. Mol. Genet. 2006, 15, 2743–2751. [Google Scholar] [CrossRef]
- Wobst, H.J.; Sharma, A.; Diamond, M.I.; Wanker, E.E.; Bieschke, J. The green tea polyphenol (-)-epigallocatechin gallate prevents the aggregation of tau protein into toxic oligomers at substoichiometric ratios. FEBS Lett. 2015, 589, 77–83. [Google Scholar] [CrossRef] [Green Version]
- Srinivasan, E.; Rajasekaran, R. Probing the inhibitory activity of epigallocatechin-gallate on toxic aggregates of mutant (L84F) SOD1 protein through geometry based sampling and steered molecular dynamics. J. Mol. Graph. Model. 2017, 74, 288–295. [Google Scholar] [CrossRef] [PubMed]
- Roberts, B.E.; Duennwald, M.L.; Wang, H.; Chung, C.; Lopreiato, N.P.; Sweeny, E.A.; Knight, M.N.; Shorter, J. A synergistic small-molecule combination directly eradicates diverse prion strain structures. Nat. Chem. Biol. 2009, 5, 936–946. [Google Scholar] [CrossRef] [PubMed] [Green Version]
- Townsend, D.; Hughes, E.; Akien, G.; Stewart, K.L.; Radford, S.E.; Rochester, D.; Middleton, D.A. Epigallocatechin-3-gallate remodels apolipoprotein A-I amyloid fibrils into soluble oligomers in the presence of heparin. J. Biol. Chem. 2018, 293, 12877–12893. [Google Scholar] [CrossRef] [PubMed] [Green Version]
- Andrich, K.; Bieschke, J. The effect of (-)-epigallo-catechin-(3)-gallate on amyloidogenic proteins suggests a common mechanism. In Natural Compounds as Therapeutic Agents for Amyloidogenic Diseases; Vassallo, N., Ed.; Springer International Publishing: Cham, Switzerland, 2015; pp. 139–161. [Google Scholar] [CrossRef] [Green Version]
- Zhu, Q.Y.; Zhang, A.; Tsang, D.; Huang, Y.; Chen, Z.Y. Stability of green tea catechins. J. Agric. Food Chem. 1997, 45, 4624–4628. [Google Scholar] [CrossRef]
- Hatano, T.; Ohyabu, T.; Yoshida, T. The structural variation in the incubation products of (-)-epigallocatechin gallate in neutral solution suggests its breakdown pathways. Heterocycles 2005, 65. [Google Scholar] [CrossRef]
- Sang, S.; Lee, M.J.; Hou, Z.; Ho, C.T.; Yang, C.S. Stability of tea polyphenol (-)-epigallocatechin-3-gallate and formation of dimers and epimers under common experimental conditions. J. Agric. Food Chem. 2005, 53, 9478–9484. [Google Scholar] [CrossRef] [PubMed]
- Zeng, L.; Ma, M.; Li, C.; Luo, L. Stability of tea polyphenols solution with different pH at different temperatures. Int. J. Food Prop. 2017, 20, 1–18. [Google Scholar] [CrossRef] [Green Version]
- Hirohata, M.; Hasegawa, K.; Tsutsumi-Yasuhara, S.; Ohhashi, Y.; Ookoshi, T.; Ono, K.; Yamada, M.; Naiki, H. The anti-amyloidogenic effect is exerted against Alzheimer’s β-amyloid fibrils in vitro by preferential and reversible binding of flavonoids to the amyloid fibril structure. Biochemistry 2007, 46, 1888–1899. [Google Scholar] [CrossRef]
- Haas, J.; Vohringer-Martinez, E.; Bogehold, A.; Matthes, D.; Hensen, U.; Pelah, A.; Abel, B.; Grubmuller, H. Primary steps of pH-dependent insulin aggregation kinetics are governed by conformational flexibility. ChemBioChem 2009, 10, 1816–1822. [Google Scholar] [CrossRef] [Green Version]
- Dische, F.E.; Wernstedt, C.; Westermark, G.T.; Westermark, P.; Pepys, M.B.; Rennie, J.A.; Gilbey, S.G.; Watkins, P.J. Insulin as an amyloid-fibril protein at sites of repeated insulin injections in a diabetic patient. Diabetologia 1988, 31, 158–161. [Google Scholar] [CrossRef] [Green Version]
- Dzwolak, W.; Grudzielanek, S.; Smirnovas, V.; Ravindra, R.; Nicolini, C.; Jansen, R.; Loksztejn, A.; Porowski, S.; Winter, R. Ethanol-perturbed amyloidogenic self-assembly of insulin: Looking for origins of amyloid strains. Biochemistry 2005, 44, 8948–8958. [Google Scholar] [CrossRef] [PubMed]
- Dzwolak, W.; Smirnovas, V.; Jansen, R.; Winter, R. Insulin forms amyloid in a strain-dependent manner: An FT-IR spectroscopic study. Protein Sci. Publ. Protein Soc. 2004, 13, 1927–1932. [Google Scholar] [CrossRef] [PubMed] [Green Version]
- Dzwolak, W.; Jansen, R.; Smirnovas, V.; Loksztejn, A.; Porowski, S.; Winter, R. Template-controlled conformational patterns of insulin fibrillar self-assembly reflect history of solvation of the amyloid nuclei. Phys. Chem. Chem. Phys. PCCP 2005, 7, 1349–1351. [Google Scholar] [CrossRef] [PubMed]
- Nielsen, L.; Khurana, R.; Coats, A.; Frokjaer, S.; Brange, J.; Vyas, S.; Uversky, V.N.; Fink, A.L. Effect of environmental factors on the kinetics of insulin fibril formation: Elucidation of the molecular mechanism. Biochemistry 2001, 40, 6036–6046. [Google Scholar] [CrossRef]
- Nielsen, L.; Frokjaer, S.; Carpenter, J.F.; Brange, J. Studies of the structure of insulin fibrils by Fourier transform infrared (FTIR) spectroscopy and electron microscopy. J. Pharm. Sci. 2001, 90, 29–37. [Google Scholar] [CrossRef]
- Spillantini, M.G.; Schmidt, M.L.; Lee, V.M.; Trojanowski, J.Q.; Jakes, R.; Goedert, M. Alpha-synuclein in Lewy bodies. Nature 1997, 388, 839–840. [Google Scholar] [CrossRef]
- Surmacz-Chwedoruk, W.; Babenko, V.; Dzwolak, W. Master and slave relationship between two types of self-propagating insulin amyloid fibrils. J. Phy. Chem. B 2014, 118, 13582–13589. [Google Scholar] [CrossRef]
- Vácha, R.; Linse, S.; Lund, M. Surface effects on aggregation kinetics of amyloidogenic peptides. J. Am. Chem. Soc. 2014, 136, 11776–11782. [Google Scholar] [CrossRef]
- Arosio, P.; Müller, T.; Rajah, L.; Yates, E.V.; Aprile, F.A.; Zhang, Y.; Cohen, S.I.; White, D.A.; Herling, T.W.; De Genst, E.J.; et al. Microfluidic diffusion analysis of the sizes and interactions of proteins under native solution conditions. ACS Nano 2015, 10, 333–341. [Google Scholar] [CrossRef]
- Yates, E.V.; Müller, T.; Rajah, L.; De Genst, E.J.; Arosio, P.; Linse, S.; Vendruscolo, M.; Dobson, C.M.; Knowles, T.P.J. Latent analysis of unmodified biomolecules and their complexes in solution with attomole detection sensitivity. Nat. Chem. 2015, 7, 802–809. [Google Scholar] [CrossRef]
- Gang, H.; Galvagnion, C.; Meisl, G.; Müller, T.; Pfammatter, M.; Buell, A.K.; Levin, A.; Dobson, C.M.; Mu, B.; Knowles, T.P.J. Microfluidic Diffusion Platform for Characterizing the Sizes of Lipid Vesicles and the Thermodynamics of Protein-Lipid Interactions. Anal. Chem. 2018, 90, 3284–3290. [Google Scholar] [CrossRef]
- Arosio, P.; Vendruscolo, M.; Dobson, C.M.; Knowles, T.P.J. Chemical kinetics for drug discovery to combat protein aggregation diseases. Trends Pharmacol. Sci. 2014, 35, 127–135. [Google Scholar] [CrossRef]
- Arosio, P.; Michaels, T.C.T.; Linse, S.; Månsson, C.; Emanuelsson, C.; Presto, J.; Johansson, J.; Vendruscolo, M.; Dobson, C.M.; Knowles, T.P.J. Kinetic analysis reveals the diversity of microscopic mechanisms through which molecular chaperones suppress amyloid formation. Nat. Commun. 2016, 7, 10948. [Google Scholar] [CrossRef] [Green Version]
- Joshi, P.; Chia, S.; Habchi, J.; Knowles, T.P.; Dobson, C.M.; Vendruscolo, M. A fragment-based method of creating small-molecule libraries to target the aggregation of intrinsically disordered proteins. ACS Comb. Sci. 2016, 18, 144–153. [Google Scholar] [CrossRef]
- Andrich, K.; Hegenbart, U.; Kimmich, C.; Kedia, N.; Bergen, H.R.; Schönland, S.; Wanker, E.; Bieschke, J. Aggregation of full-length immunoglobulin light chains from systemic light chain amyloidosis (AL) patients is remodeled by epigallocatechin-3-gallate. J. Biol. Chem. 2017, 292, 2328–2344. [Google Scholar] [CrossRef] [Green Version]
- Sneideris, T.; Baranauskiene, L.; Cannon, J.G.; Rutkiene, R.; Meskys, R.; Smirnovas, V. Looking for a generic inhibitor of amyloid-like fibril formation among flavone derivatives. PeerJ 2015, 3, e1271. [Google Scholar] [CrossRef] [Green Version]
- Malisauskas, R.; Botyriute, A.; Cannon, J.G.; Smirnovas, V. Flavone Derivatives as Inhibitors of Insulin Amyloid-Like Fibril Formation. PLoS ONE 2015, 10, e0121231. [Google Scholar] [CrossRef]
- Aarabi, M.H. The role of two natural flavonoids on human amylin aggregation. Afr. J. Pharm. Pharmacol. 2012, 6, 2374–2379. [Google Scholar] [CrossRef]
- Chaudhury, S.; Dutta, A.; Bag, S.; Biswas, P.; Das, A.K.; Dasgupta, S. Probing the inhibitory potency of epigallocatechin gallate against human γB-crystallin aggregation: Spectroscopic, microscopic and simulation studies. Spectrochim. Acta Part A Mol. Biomol. Spectrosc. 2018, 192, 318–327. [Google Scholar] [CrossRef]
- Jayamani, J.; Shanmugam, G. Gallic acid, one of the components in many plant tissues, is a potential inhibitor for insulin amyloid fibril formation. Eur. J. Med. Chem. 2014, 85, 352–358. [Google Scholar] [CrossRef]
- Biancalana, M.; Koide, S. Molecular mechanism of Thioflavin-T binding to amyloid fibrils. Biochim. Biophys. Acta (BBA) Proteins Proteom. 2010, 1804, 1405–1412. [Google Scholar] [CrossRef] [PubMed] [Green Version]
- Sulatskaya, A.I.; Kuznetsova, I.M.; Belousov, M.V.; Bondarev, S.A.; Zhouravleva, G.A.; Turoverov, K.K. Stoichiometry and affinity of thioflavin T binding to Sup35p amyloid fibrils. PLoS ONE 2016, 11, e0156314. [Google Scholar] [CrossRef] [PubMed]
- Ziaunys, M.; Smirnovas, V. Additional thioflavin-T binding mode in insulin fibril inner core region. J. Phys. Chem. B 2019. [Google Scholar] [CrossRef] [PubMed]
- Buell, A.K.; Dobson, C.M.; Knowles, T.P.J.; Welland, M.E. Interactions between Amyloidophilic Dyes and Their Relevance to Studies of Amyloid Inhibitors. Biophys. J. 2010, 99, 3492–3497. [Google Scholar] [CrossRef] [PubMed] [Green Version]
- Campioni, S.; Carret, G.; Jordens, S.; Nicoud, L.; Mezzenga, R.; Riek, R. The presence of an air-water interface affects formation and elongation of α-synuclein fibrils. J. Am. Chem. Soc. 2014, 136, 2866–2875. [Google Scholar] [CrossRef] [PubMed]
- Linse, S. Mechanism of amyloid protein aggregation and the role of inhibitors. Pure Appl. Chem. 2019, 91, 211–229. [Google Scholar] [CrossRef]
- Murray, A.N.; Palhano, F.L.; Bieschke, J.; Kelly, J.W. Surface adsorption considerations when working with amyloid fibrils in multiwell plates and Eppendorf tubes. Protein Sci. 2013, 22, 1531–1541. [Google Scholar] [CrossRef] [Green Version]
- Risor, M.W.; Juhl, D.W.; Bjerring, M.; Mathiesen, J.; Enghild, J.J.; Nielsen, N.C.; Otzen, D.E. Critical influence of cosolutes and surfaces on the assembly of serpin-derived amyloid fibrils. Biophys. J. 2017, 113, 580–596. [Google Scholar] [CrossRef] [Green Version]
- Zhu, M.; Han, S.; Fink, A. Oxidized quercetin inhibits α-synuclein fibrillization. Biochim. Biophys. Acta 2013, 1830, 2872–2881. [Google Scholar] [CrossRef]
- Daniels, M.J.; Nourse, J.B.; Kim, H.; Sainati, V.; Schiavina, M.; Murrali, M.G.; Pan, B.; Ferrie, J.J.; Haney, C.M.; Moons, R.; et al. Cyclized NDGA modifies dynamic α-synuclein monomers preventing aggregation and toxicity. Sci. Rep. 2019, 9, 2937. [Google Scholar] [CrossRef] [Green Version]
- Mak, S.K.; McCormack, A.L.; Manning-Bog, A.B.; Cuervo, A.M.; Monte, D.A.D. Lysosomal degradation of alpha-synuclein in vivo. J. Biol. Chem. 2010, 285, 13621–13629. [Google Scholar] [CrossRef] [PubMed] [Green Version]
- Bourdenx, M.; Bezard, E.; Dehay, B. Lysosomes and α-synuclein form a dangerous duet leading to neuronal cell death. Front. Neuroanat. 2014, 8, 83. [Google Scholar] [CrossRef] [PubMed] [Green Version]


| Assessed by Change in | |||
| Protein | Conditions | EGCG | EGCG |
| Insulin | PB-Q | Inhibitory 1 | Inhibitory |
| PB-A | No Effect | Inhibitory | |
| AC-Q | No Effect | Inhibitory | |
| AC-A | No Effect | Inhibitory | |
| -synuclein | pH 7 | Inhibitory | Inhibitory |
| pH 6 | No Effect | Inhibitory | |
| Assessed by Change in | |||
| Protein | Conditions | EGCG | EGCG |
| Insulin | PB-Q | Inhibitory | Inhibitory |
| PB-A | No Effect | Inhibitory | |
| AC-Q | No Effect | Enhancing | |
| AC-A | No Effect | Enhancing | |
| -synuclein | pH 7 | Inhibitory | Inhibitory |
| pH 6 | Inhibitory | Inhibitory | |
© 2019 by the authors. Licensee MDPI, Basel, Switzerland. This article is an open access article distributed under the terms and conditions of the Creative Commons Attribution (CC BY) license (http://creativecommons.org/licenses/by/4.0/).
Share and Cite
Sneideris, T.; Sakalauskas, A.; Sternke-Hoffmann, R.; Peduzzo, A.; Ziaunys, M.; Buell, A.K.; Smirnovas, V. The Environment Is a Key Factor in Determining the Anti-Amyloid Efficacy of EGCG. Biomolecules 2019, 9, 855. https://doi.org/10.3390/biom9120855
Sneideris T, Sakalauskas A, Sternke-Hoffmann R, Peduzzo A, Ziaunys M, Buell AK, Smirnovas V. The Environment Is a Key Factor in Determining the Anti-Amyloid Efficacy of EGCG. Biomolecules. 2019; 9(12):855. https://doi.org/10.3390/biom9120855
Chicago/Turabian StyleSneideris, Tomas, Andrius Sakalauskas, Rebecca Sternke-Hoffmann, Alessia Peduzzo, Mantas Ziaunys, Alexander K. Buell, and Vytautas Smirnovas. 2019. "The Environment Is a Key Factor in Determining the Anti-Amyloid Efficacy of EGCG" Biomolecules 9, no. 12: 855. https://doi.org/10.3390/biom9120855