
Core Circadian Clock Proteins as Biomarkers of Progression in Colorectal Cancer

 , , ,
, , ,
Abstract
:1. Introduction
2. Materials and Methods
2.1. Patients and Samples
2.2. IHC Analysis
2.3. Evaluation of Staining
2.4. Statistical Analysis
3. Results
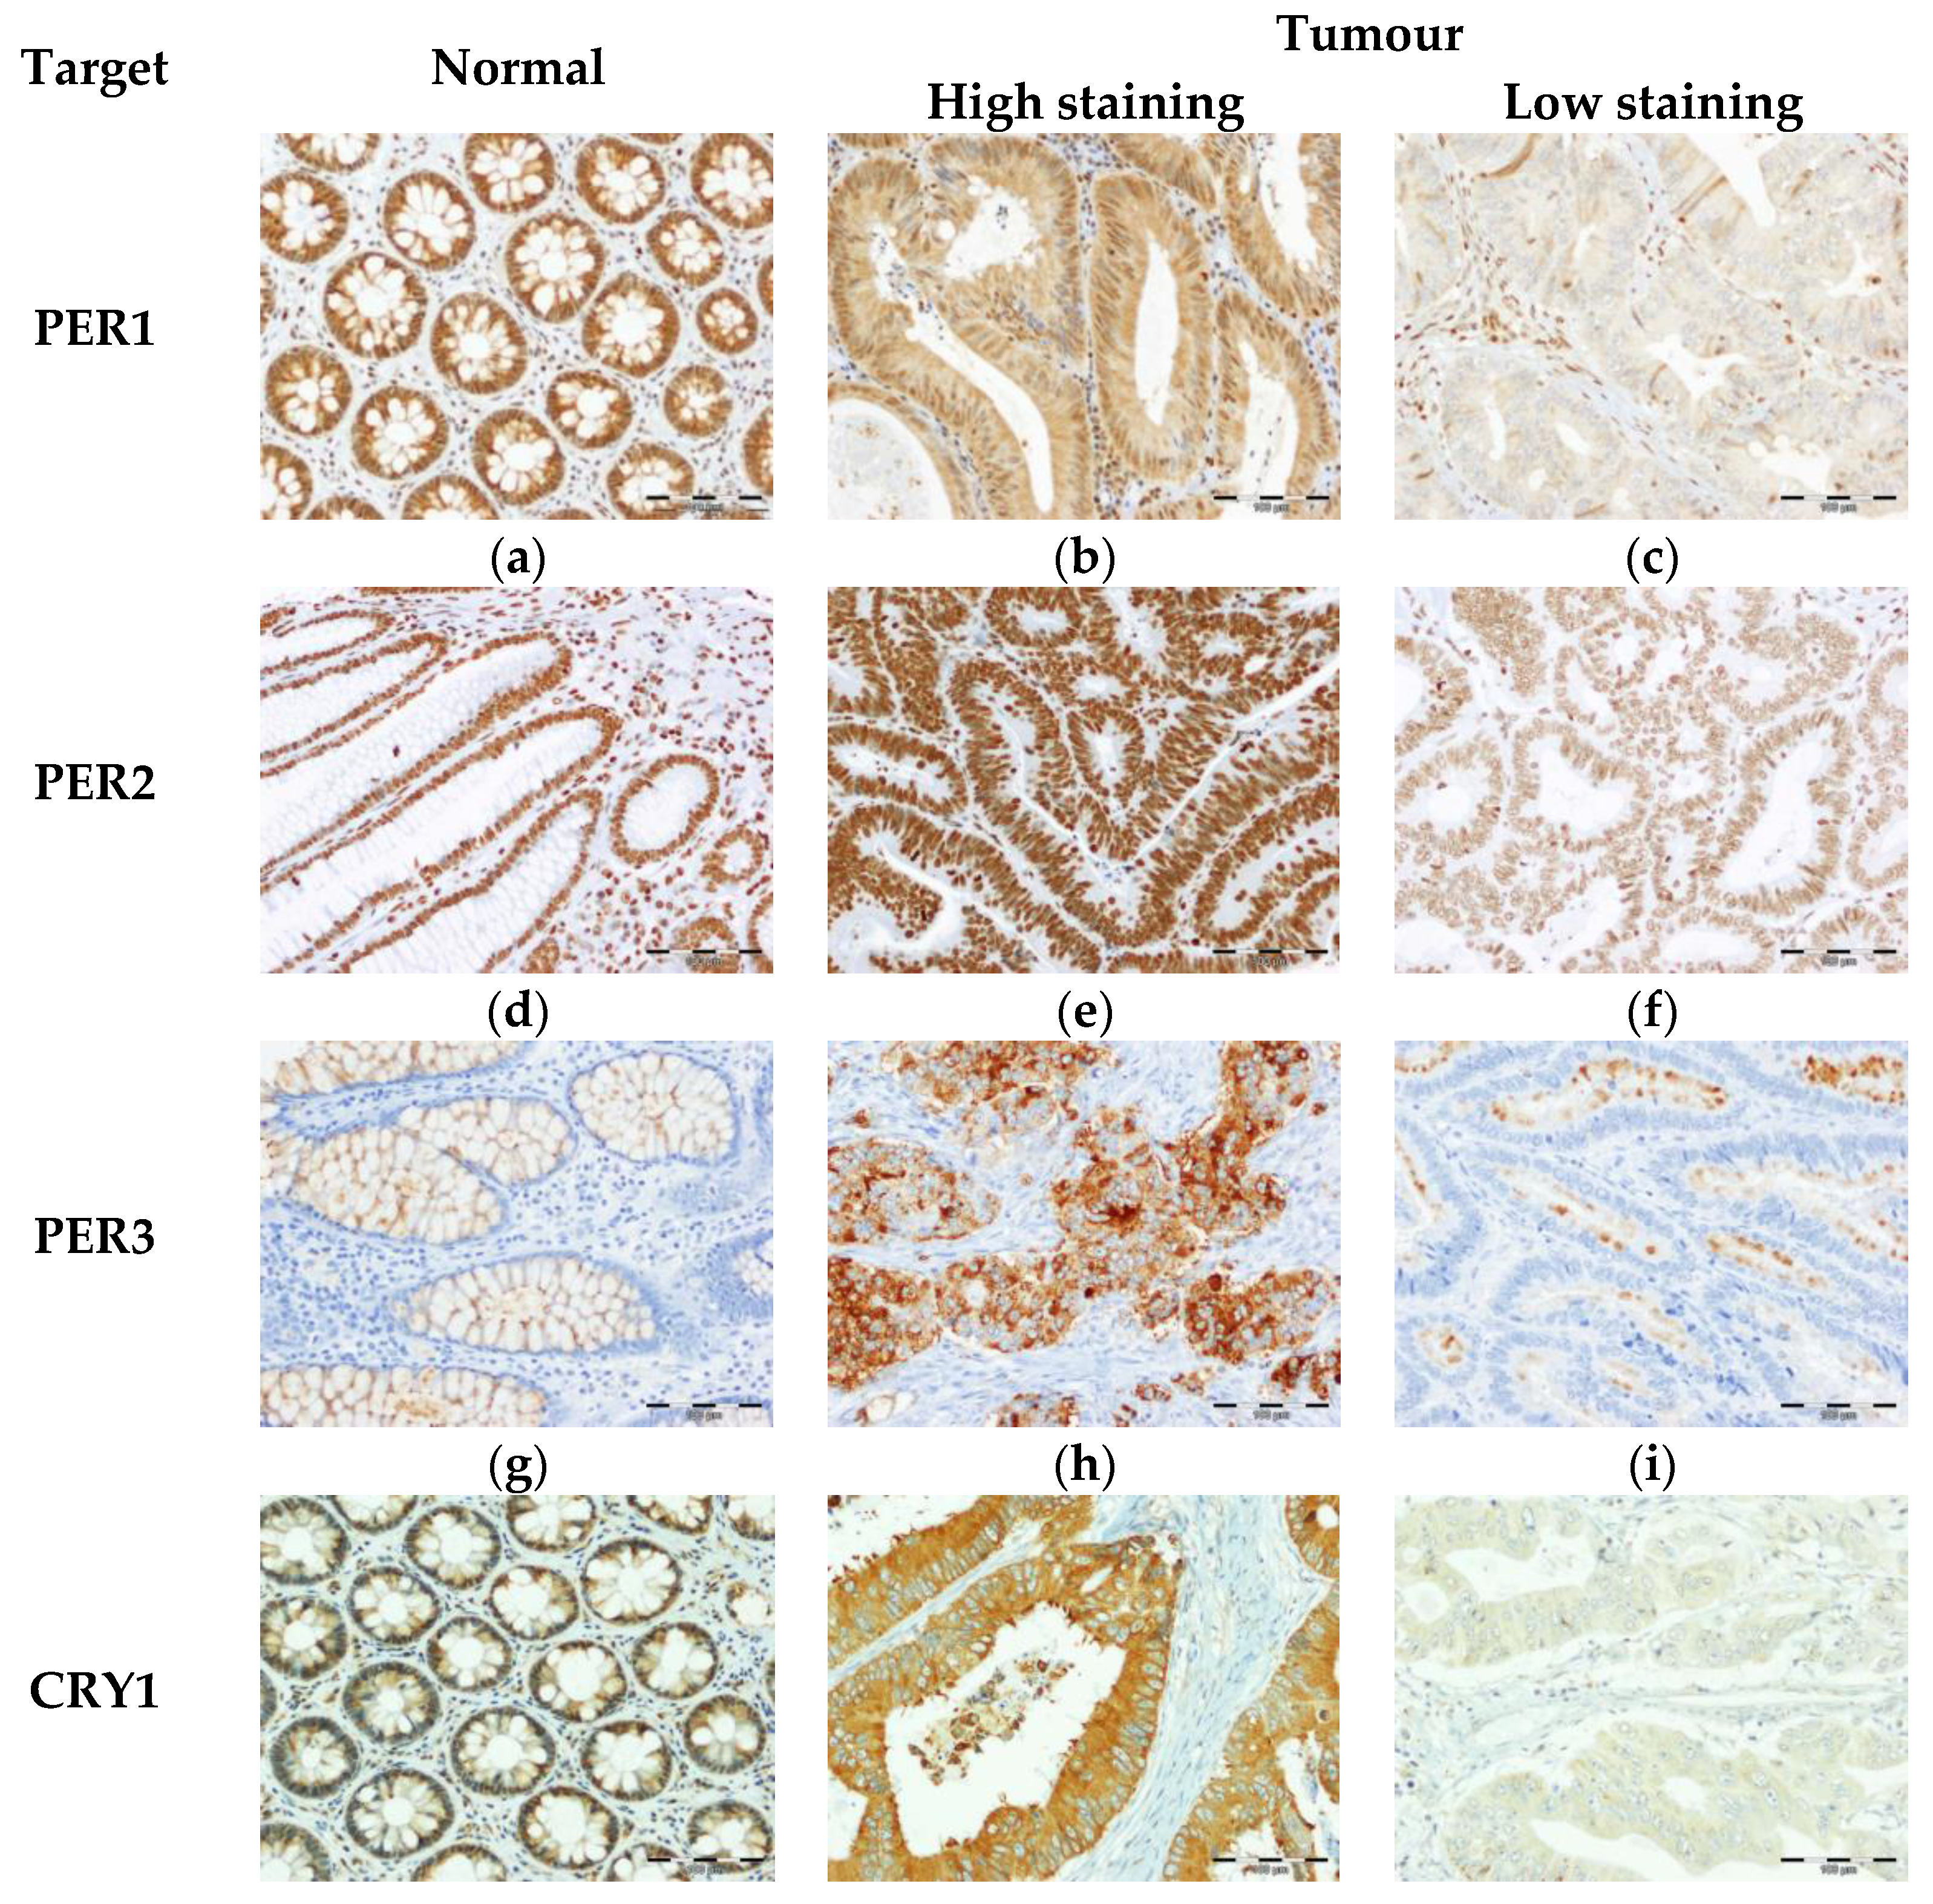
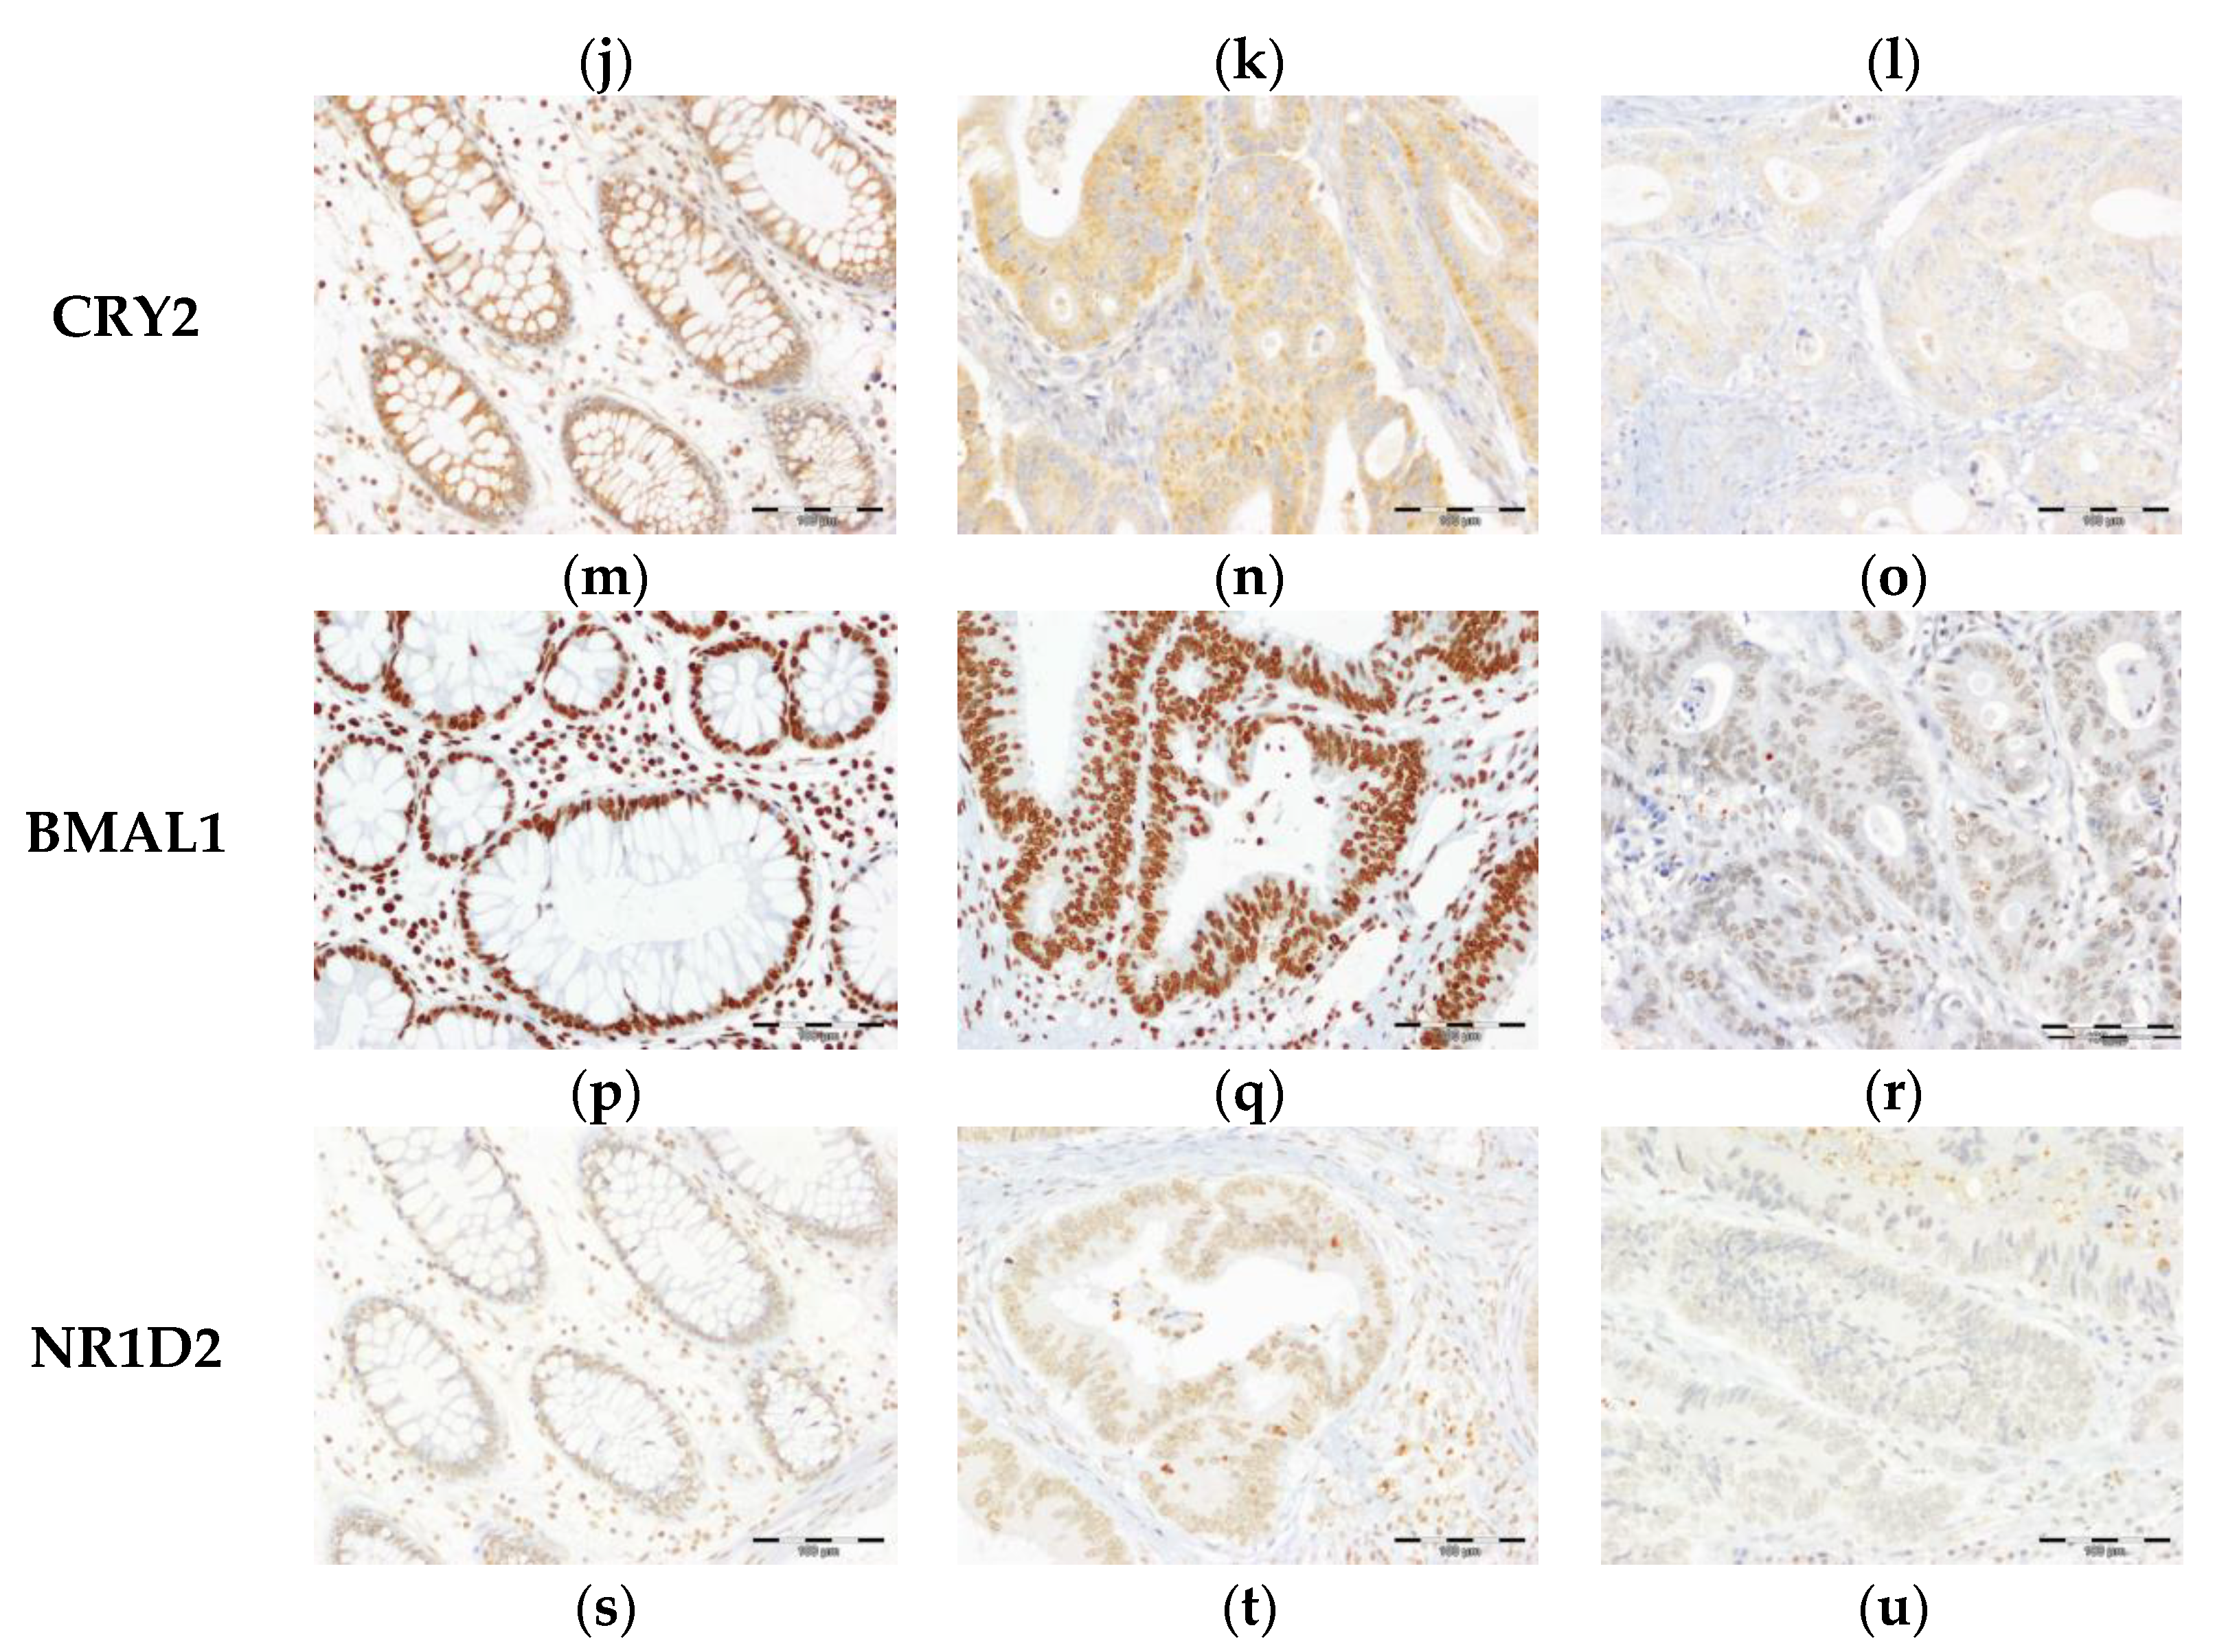
3.1. Expression of Core Circadian Clock Proteins in Tissues from Healty Subjects and CRC Patients
3.2. Association of the Core Circadian Clock Proteins with Clinico-Pathological Characteristics of CRC Patients
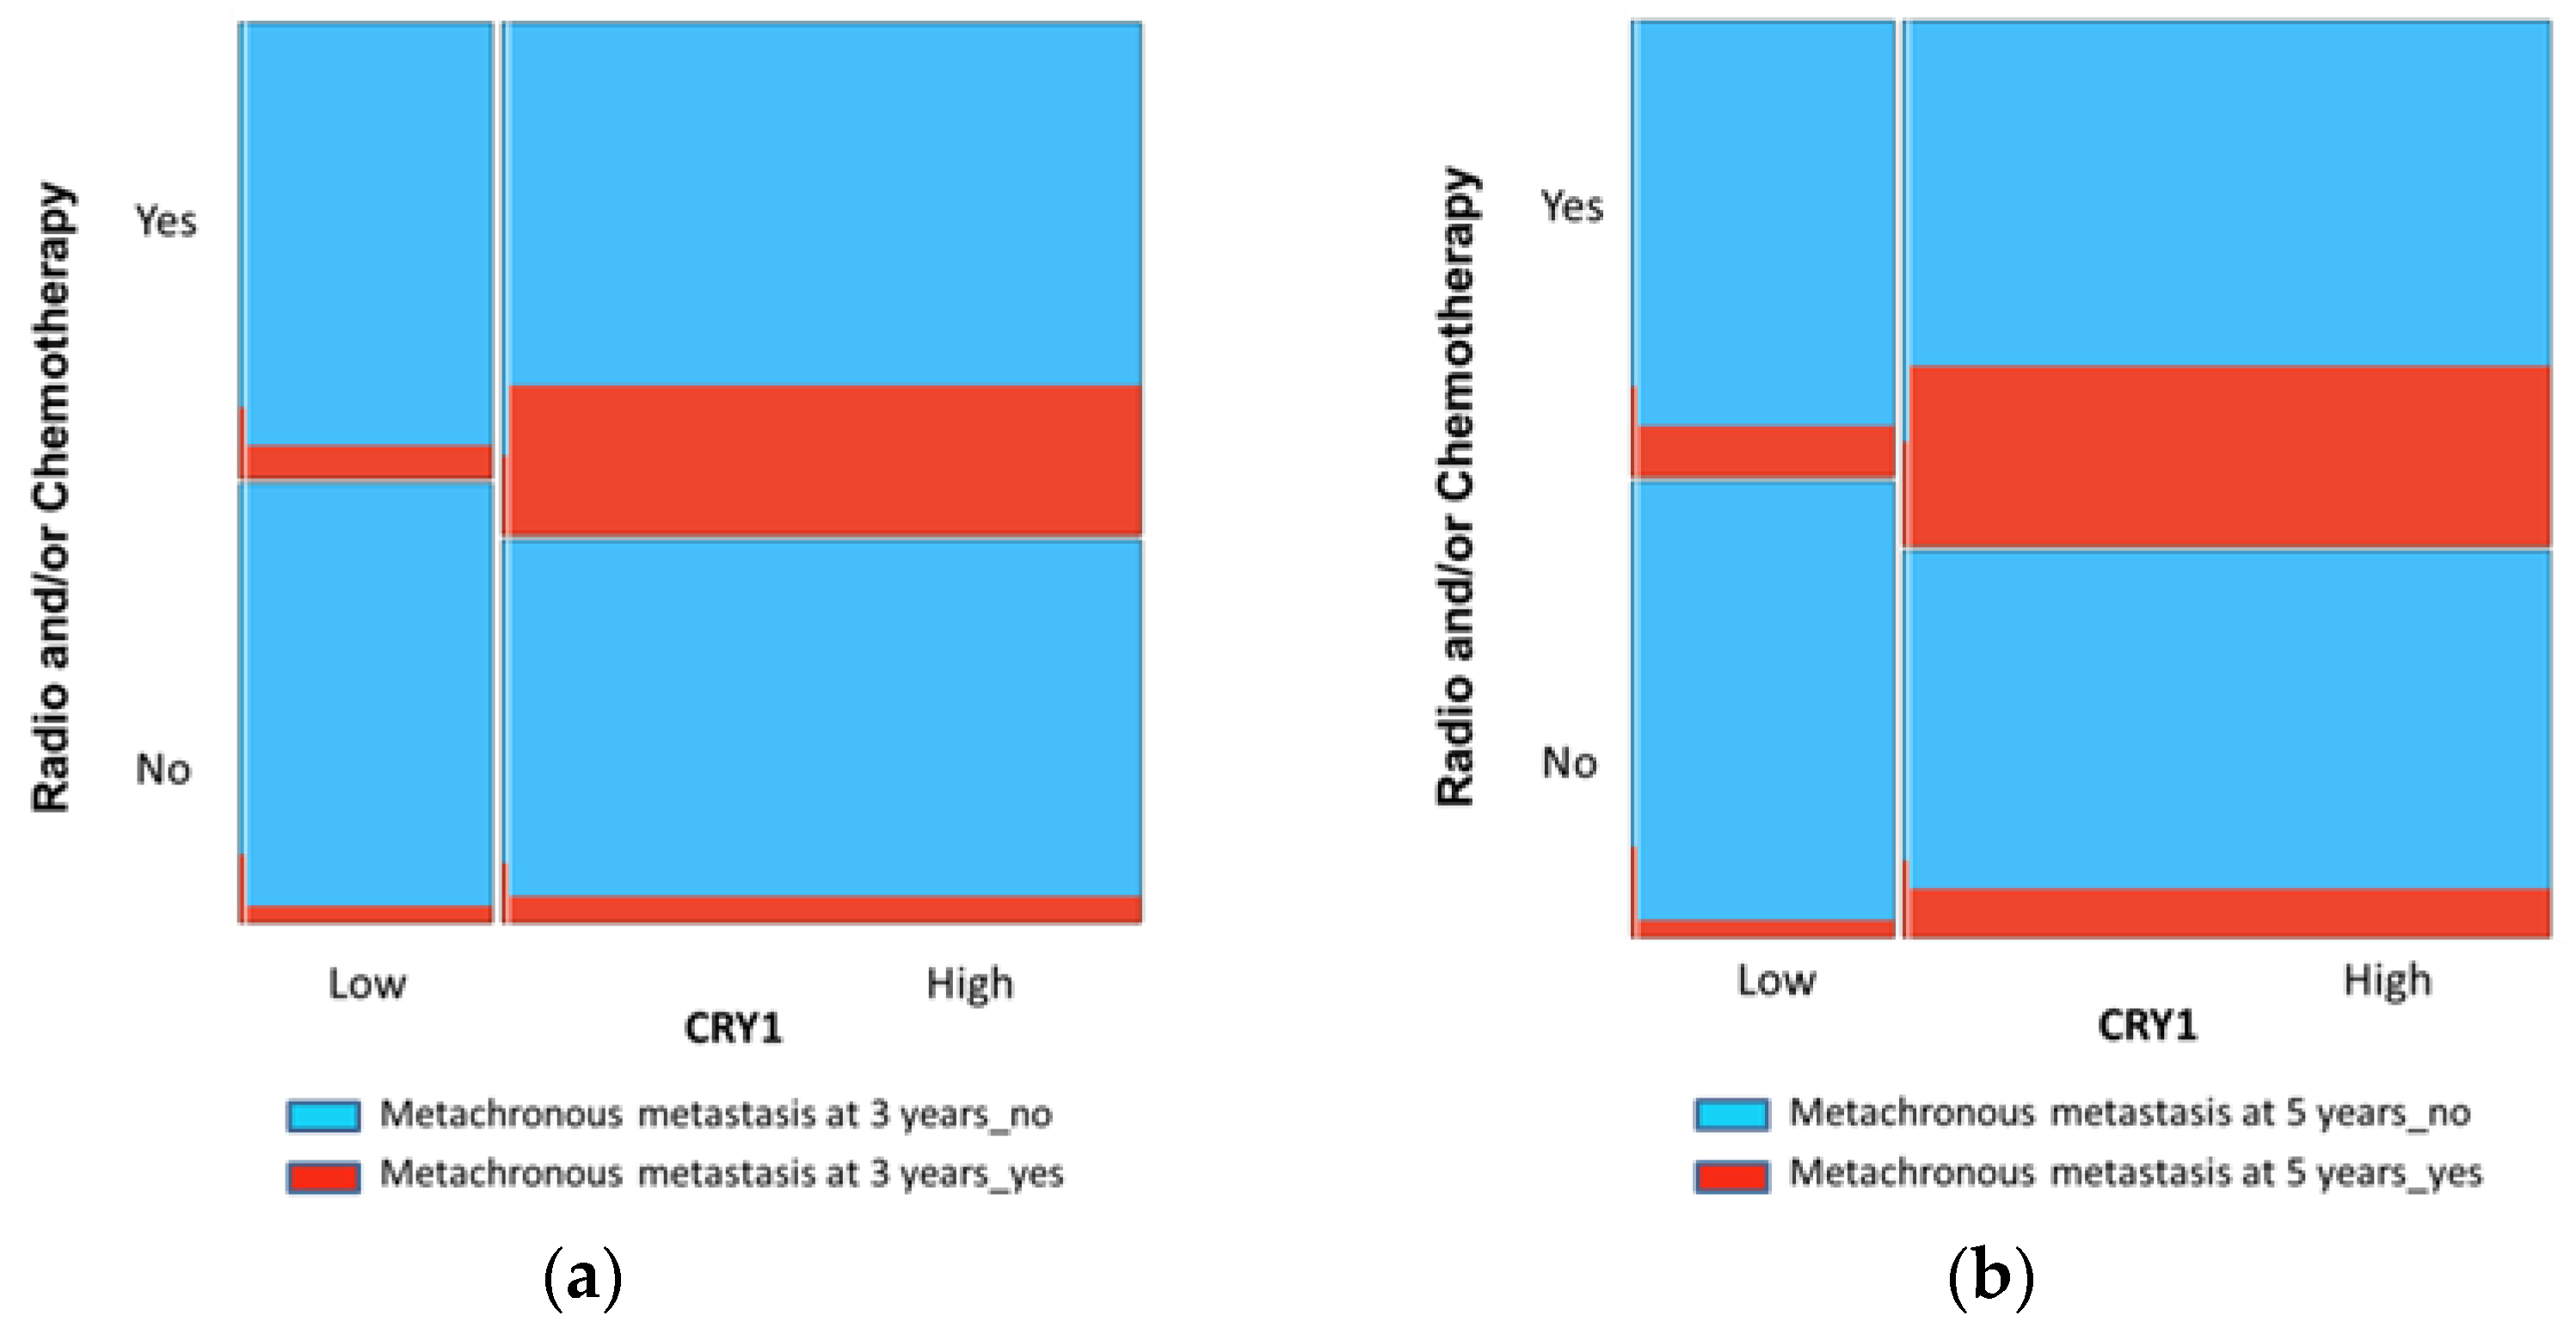
3.3. CRY1 as a Prognostic Factor of MM in CRC
3.4. Proteins of the Core Circadian Clock as Prognostic Factors of LR in CRC
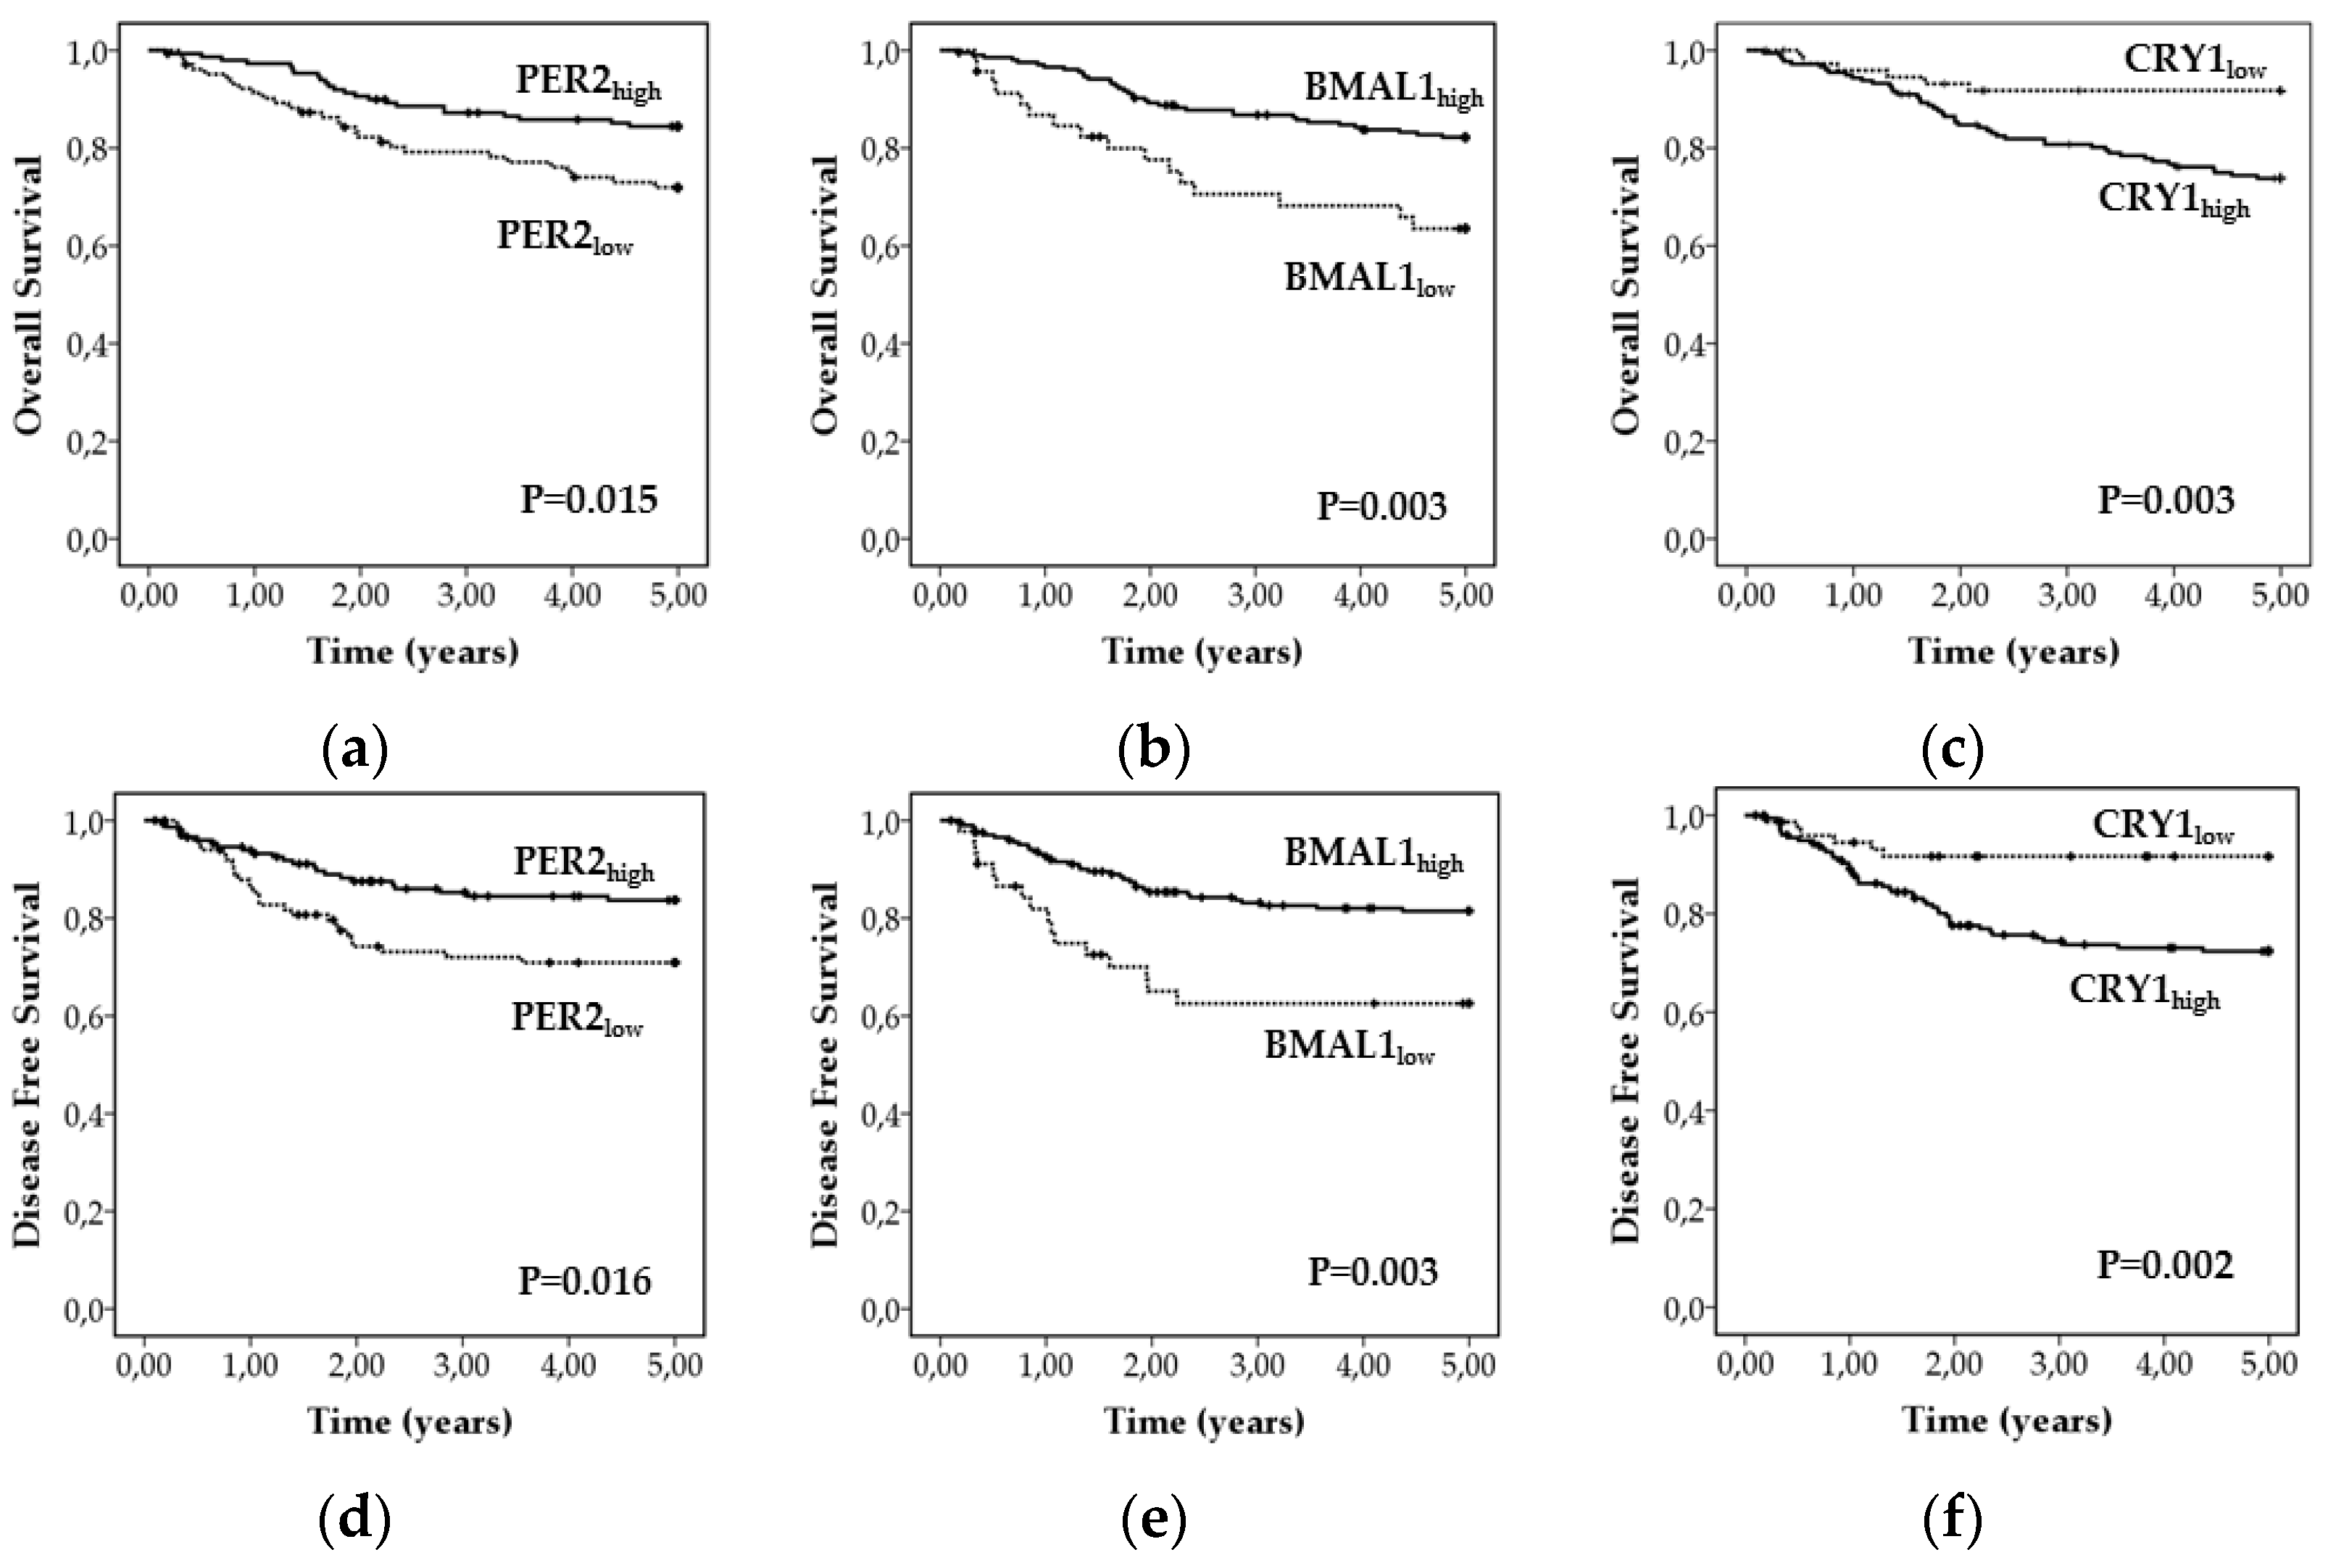
3.5. Proteins of the Core Circadian Clock as Prognostic Factors of Survival in CRC
4. Discussion
Supplementary Materials
Author Contributions
Funding
Institutional Review Board Statement
Informed Consent Statement
Conflicts of Interest
References
- Ferlay, J.; Colombet, M.; Soerjomataram, I.; Mathers, C.; Parkin, D.M.; Piñeros, M.; Znaor, A.; Bray, F. Estimating the global cancer incidence and mortality in 2018: GLOBOCAN sources and methods. Int. J. Cancer 2019, 144, 1941–1953. [Google Scholar] [CrossRef] [Green Version]
- Li, D. Recent advances in colorectal cancer screening. Chronic Dis. Transl. Med. 2018, 4, 139–147. [Google Scholar] [CrossRef]
- Lopez, G.; Boggio, F.; Ferrero, S.; Fusco, N.; Del Gobbo, A. Molecular and Immunohistochemical Markers with Prognostic and Predictive Significance in Liver Metastases from Colorectal Carcinoma. Int. J. Mol. Sci. 2018, 19, 3014. [Google Scholar] [CrossRef] [PubMed] [Green Version]
- Akgül, Ö.; Çetinkaya, E.; Ersöz, Ş.; Tez, M. Role of surgery in colorectal cancer liver metastases. World J. Gastroenterol. 2014, 20, 6113. [Google Scholar] [CrossRef] [PubMed]
- Read, T.E.; Mutch, M.G.; Chang, B.W.; McNevin, M.S.; Fleshman, J.W.; Birnbaum, E.H.; Fry, R.D.; Caushaj, P.F.; Kodner, I.J. Locoregional recurrence and survival after curative resection of adenocarcinoma of the colon. J. Am. Coll. Surg. 2002, 195, 33–40. [Google Scholar] [CrossRef]
- Weitz, J.; Koch, M.; Debus, J.; Höhler, T.; Galle, P.R.; Büchler, M.W. Colorectal cancer. Lancet 2005, 365, 153–165. [Google Scholar] [CrossRef]
- Dienstmann, R.; Vermeulen, L.; Guinney, J.; Kopetz, S.; Tejpar, S.; Tabernero, J. Consensus molecular subtypes and the evolution of precision medicine in colorectal cancer. Nat. Rev. Cancer 2017, 17, 79–92. [Google Scholar] [CrossRef]
- Alves Martins, B.A.; de Bulhões, G.F.; Cavalcanti, I.N.; Martins, M.M.; de Oliveira, P.G.; Martins, A.M.A. Biomarkers in Colorectal Cancer: The Role of Translational Proteomics Research. Front. Oncol. 2019, 9, 1284. [Google Scholar] [CrossRef]
- Guinney, J.; Dienstmann, R.; Wang, X.; De Reyniès, A.; Schlicker, A.; Soneson, C.; Marisa, L.; Roepman, P.; Nyamundanda, G.; Angelino, P.; et al. The consensus molecular subtypes of colorectal cancer. Nat. Med. 2015, 21, 1350–1356. [Google Scholar] [CrossRef]
- Ahluwalia, P.; Kolhe, R.; Gahlay, G.K. The clinical relevance of gene expression based prognostic signatures in colorectal cancer. Biochim. Biophys. Acta Bioenerg. 2021, 1875, 188513. [Google Scholar]
- Bruni, D.; Angell, H.K.; Galon, J. The immune contexture and Immunoscore in cancer prognosis and therapeutic efficacy. Nat. Rev. Cancer 2020, 20, 662–680. [Google Scholar] [CrossRef] [PubMed]
- Pagès, F.; Mlecnik, B.; Marliot, F.; Bindea, G.; Ou, F.-S.; Bifulco, C.; Lugli, A.; Zlobec, I.; Rau, T.T.; Berger, M.D.; et al. International validation of the consensus Immunoscore for the classification of colon cancer: A prognostic and accuracy study. Lancet 2018, 391, 2128–2139. [Google Scholar] [CrossRef]
- Zeestraten, E.C.M.; Maak, M.; Shibayama, M.; Schuster, T.; Nitsche, U.; Matsushima, T.; Nakayama, S.; Gohda, K.; Friess, H.; Van De Velde, C.J.H.; et al. Specific activity of cyclin-dependent kinase I is a new potential predictor of tumour recurrence in stage II colon cancer. Br. J. Cancer 2011, 106, 133–140. [Google Scholar] [CrossRef] [PubMed] [Green Version]
- Otto, T.; Sicinski, T.O.P. Cell cycle proteins as promising targets in cancer therapy. Nat. Rev. Cancer 2017, 17, 93–115. [Google Scholar] [CrossRef] [PubMed] [Green Version]
- Farshadi, E.; van der Horst, G.; Chaves, I. Molecular Links between the Circadian Clock and the Cell Cycle. J. Mol. Biol. 2020, 432, 3515–3524. [Google Scholar] [CrossRef]
- Sinturel, F.; Petrenko, V.; Dibner, C. Circadian Clocks Make Metabolism Run. J. Mol. Biol. 2020, 432, 3680–3699. [Google Scholar] [CrossRef] [PubMed]
- Welsh, D.K.; Takahashi, J.; Kay, S.A. Suprachiasmatic Nucleus: Cell Autonomy and Network Properties. Annu. Rev. Physiol. 2010, 72, 551–577. [Google Scholar] [CrossRef] [Green Version]
- Masri, S.; Sassone-Corsi, P. The emerging link between cancer, metabolism, and circadian rhythms. Nat. Med. 2018, 24, 1795–1803. [Google Scholar] [CrossRef]
- Zhang, S.; Dai, M.; Wang, X.; Jiang, S.-H.; Hu, L.-P.; Zhang, X.L.; Zhang, Z.G. Signalling entrains the peripheral circadian clock. Cell. Signal. 2020, 69, 109433. [Google Scholar] [CrossRef]
- Partch, C.L.; Green, C.B.; Takahashi, J.S. Molecular architecture of the mammalian circadian clock. Trends Cell Biol. 2014, 24, 90–99. [Google Scholar] [CrossRef] [PubMed] [Green Version]
- García-Costela, M.; Escudero-Feliú, J.; Puentes-Pardo, J.; Juán, S.M.S.; Morales-Santana, S.; Ríos-Arrabal, S.; Carazo, Á.; León, J. Circadian Genes as Therapeutic Targets in Pancreatic Cancer. Front. Endocrinol. 2020, 11, 11. [Google Scholar] [CrossRef] [PubMed]
- Zhang, J.; Lv, H.; Ji, M.; Wang, Z.; Wu, W. Low circadian clock genes expression in cancers: A meta-analysis of its association with clinicopathological features and prognosis. PLoS ONE 2020, 15, e0233508. [Google Scholar] [CrossRef] [PubMed]
- Li, H.-X. The role of circadian clock genes in tumors. OncoTargets Ther. 2019, 12, 3645–3660. [Google Scholar] [CrossRef] [Green Version]
- Sulli, G.; Lam, M.T.Y.; Panda, S. Interplay between Circadian Clock and Cancer: New Frontiers for Cancer Treatment. Trends Cancer 2019, 5, 475–494. [Google Scholar] [CrossRef] [PubMed]
- Ruan, W.; Yuan, X.; Eltzschig, H.K. Circadian rhythm as a therapeutic target. Nat. Rev. Drug Discov. 2021, 20, 287–307. [Google Scholar] [CrossRef]
- Rajendran, S.; Barbon, S.; Pucciarelli, S. Spotlight on Circadian Genes and Colorectal Cancer Crosstalk. Endocr. Metab. Immune Disord. Drug Targets 2021, 21, 4–11. [Google Scholar] [CrossRef]
- Della-Morte, D. Deregulation of the circadian clock machinery: A novel biomarker for anti-angiogenic drug resistance in colorectal cancer. EBioMedicine 2019, 46, 17–18. [Google Scholar] [CrossRef] [Green Version]
- Fuhr, L.; El-Athman, R.; Scrima, R.; Cela, O.; Carbone, A.; Knoop, H.; Li, Y.; Hoffmann, K.; Laukkanen, M.O.; Corcione, F.; et al. The Circadian Clock Regulates Metabolic Phenotype Rewiring Via HKDC1 and Modulates Tumor Progression and Drug Response in Colorectal Cancer. EBioMedicine 2018, 33, 105–121. [Google Scholar] [CrossRef] [Green Version]
- Hamilton, S.R.; Aaltonen, L.A. Pathology and Genetics of Tumours of the Digestive System; International Agency for Research on Cancer (IARC): Lyon, France, 2000; Volume 2, p. 253. [Google Scholar]
- Fleming, I.C.; Henson, J.S.; Hutter, D.E.; Kennedy, B.J. AJCC Cancer Staging Manual, 5th ed.; Fleming, I.C., Henson, J.S., Hutter, D.E., Kennedy, B.J., Eds.; Lippincott Raven: Philadelphia, PA, USA, 1997. [Google Scholar]
- Liska, D.; Stocchi, L.; Karagkounis, G.; Elagili, F.; Dietz, D.W.; Kalady, M.F.; Kessler, H.; Remzi, F.H.; Church, J. Incidence, Patterns, and Predictors of Locoregional Recurrence in Colon Cancer. Ann. Surg. Oncol. 2016, 24, 1093–1099. [Google Scholar] [CrossRef]
- Remmele, W.; Stegner, H.E. Recommendation for uniform definition of an immunoreactive score (IRS) for immunohistochemical estrogen receptor detection (ER-ICA) in breast cancer tissue. Der Pathol. 1987, 8, 138–140. [Google Scholar]
- De Herdt, M.J.; Koljenović, S.; Van Der Steen, B.; Willems, S.M.; Noorlag, R.; Nieboer, D.; Hardillo, J.A.; Gruver, A.M.; Zeng, W.; Liu, L.; et al. MET ectodomain shedding is associated with poor disease-free survival of patients diagnosed with oral squamous cell carcinoma. Mod. Pathol. 2019, 19, 019–0426. [Google Scholar] [CrossRef] [PubMed]
- Wang, S.; Wu, X.; Chen, Y.; Zhang, J.; Ding, J.; Zhou, Y.; He, S.; Tan, Y.; Qiang, F.; Bai, J.; et al. Prognostic and Predictive Role of JWA and XRCC1 Expressions in Gastric Cancer. Clin. Cancer Res. 2012, 18, 2987–2996. [Google Scholar] [CrossRef] [Green Version]
- McShane, L.M.; Altman, D.G.; Sauerbrei, W.; Taube, S.E.; Gion, M.; Clark, G.M. Reporting Recommendations for Tumor Marker Prognostic Studies (REMARK). J. Natl. Cancer Inst. 2005, 97, 1180–1184. [Google Scholar] [CrossRef] [PubMed] [Green Version]
- Demšar, J.; Curk, T.; Erjavec, A.; Gorup, Č.; Hočevar, T.; Milutinovič, M.; Možina, M.; Polajnar, M.; Toplak, M.; Starič, A.; et al. Orange: Data Mining Toolbox in Python. J. Mach. Learn. Res. 2013, 14, 2349–2353. [Google Scholar]
- Hartigan, J.A.; Kleiner, B. Mosaics for Contingency Tables. In Proceedings of the Computer Science and Statistics: Proceedings of the 13th Symposium on the Interface, New York, NY, USA; 1981; pp. 268–273. [Google Scholar]
- Friendly, M. Mosaic Displays for Multi-Way Contingency Tables. J. Am. Stat. Assoc. 1994, 89, 190–200. [Google Scholar] [CrossRef]
- Battaglin, F.; Chan, P.; Pan, Y.; Soni, S.; Qu, M.; Spiller, E.R.; Castanon, S.; Torres, E.T.R.; Mumenthaler, S.M.; Kay, S.A.; et al. Clocking cancer: The circadian clock as a target in cancer therapy. Oncogene 2021, 40, 3187–3200. [Google Scholar] [CrossRef]
- Zhang, Z.; Zeng, P.; Gao, W.; Zhou, Q.; Feng, T.; Tian, X. Circadian clock: A regulator of the immunity in cancer. Cell Commun. Signal. 2021, 19, 1–12. [Google Scholar] [CrossRef]
- Mazzoccoli, G.; Panza, A.; Valvano, M.R.; Palumbo, O.; Carella, M.; Pazienza, V.; Biscaglia, G.; Tavano, F.; Di Sebastiano, P.; Andriulli, A.; et al. Clock Gene Expression Levels and Relationship with Clinical and Pathological Features in Colorectal Cancer Patients. Chronobiol. Int. 2011, 28, 841–851. [Google Scholar] [CrossRef]
- Morales-Santana, S.; Morell, S.; Leon, J.; Carazo-Gallego, A.; Jimenez-Lopez, J.C.; Morell, M. An Overview of the Polymorphisms of Circadian Genes Associated with Endocrine Cancer. Front. Endocrinol. 2019, 10, 104. [Google Scholar] [CrossRef] [PubMed] [Green Version]
- Zhou, F.; He, X.; Liu, H.; Zhu, Y.; Jin, T.; Chen, C.; Qu, F.; Li, Y.; Bao, G.; Chen, Z.; et al. Functional polymorphisms of circadian positive feedback regulation genes and clinical outcome of Chinese patients with resected colorectal cancer. Cancer 2012, 118, 937–946. [Google Scholar] [CrossRef]
- Karantanos, T.; Theodoropoulos, G.; Gazouli, M.; Vaiopoulou, A.; Karantanou, C.; Stravopodis, D.; Bramis, K.; Lymperi, M.; Pektasidis, D. Association of the clock genes polymorphisms with colorectal cancer susceptibility. J. Surg. Oncol. 2013, 108, 563–567. [Google Scholar] [CrossRef]
- Garufi, C.; Giacomini, E.; Torsello, A.; Sperduti, I.; Melucci, E.; Mottolese, M.; Zeuli, M.; Ettorre, G.M.; Ricciardi, T.; Cognetti, F.; et al. Gender effects of single nucleotide polymorphisms and miRNAs targeting clock-genes in metastatic colorectal cancer patients (mCRC). Sci. Rep. 2016, 6, 34006. [Google Scholar] [CrossRef] [Green Version]
- Limagne, E.; Euvrard, R.; Thibaudin, M.; Rébé, C.; Derangère, V.; Chevriaux, A.; Boidot, R.; Vegran, F.; Bonnefoy, N.; Vincent, J.; et al. Accumulation of MDSC and Th17 Cells in Patients with Metastatic Colorectal Cancer Predicts the Efficacy of a FOLFOX–Bevacizumab Drug Treatment Regimen. Cancer Res. 2016, 76, 5241–5252. [Google Scholar] [CrossRef] [PubMed] [Green Version]
- Fuhr, L.; Abreu, M.; Carbone, A.; El-Athman, R.; Bianchi, F.; Laukkanen, M.O.; Mazzoccoli, G.; Relógio, A. The Interplay between Colon Cancer Cells and Tumour-Associated Stromal Cells Impacts the Biological Clock and Enhances Malignant Phenotypes. Cancers 2019, 11, 988. [Google Scholar] [CrossRef] [Green Version]
- Yu, H.; Meng, X.; Wu, J.; Pan, C.; Ying, X.; Zhou, Y.; Liu, R.; Huang, W. Cryptochrome 1 overexpression correlates with tumor progression and poor prognosis in patients with colorectal cancer. PLoS ONE 2013, 8, e61679. [Google Scholar]
- Mazzoccoli, G.; Rubino, R.; Tiberio, C.; Giuliani, F.; Vinciguerra, M.; Oben, J.; De Cata, A.; Tarquini, R.; De Cosmo, S.; Liu, S.; et al. Clock gene expression in human and mouse hepatic models shows similar periodicity but different dynamics of variation. Chronobiol. Int. 2016, 33, 181–190. [Google Scholar] [CrossRef]
- Hasakova, K.; Vician, M.; Reis, R.; Zeman, M.; Herichova, I. Sex-dependent correlation between survival and expression of genes related to the circadian oscillator in patients with colorectal cancer. Chronobiol. Int. 2018, 35, 1423–1434. [Google Scholar] [CrossRef] [PubMed]
- Mazzoccoli, G.; Colangelo, T.; Panza, A.; Rubino, R.; De Cata, A.; Tiberio, C.; Valvano, M.R.; Pazienza, V.; Merla, G.; Augello, B.; et al. Deregulated expression of cryptochrome genes in human colorectal cancer. Mol. Cancer 2016, 15, 1–20. [Google Scholar] [CrossRef] [Green Version]
- Liu, Z.; Selby, C.P.; Yang, Y.; Lindsey-Boltz, L.A.; Cao, X.; Eynullazada, K.; Sancar, A. Circadian regulation of c-MYC in mice. Proc. Natl. Acad. Sci. USA 2020, 117, 21609–21617. [Google Scholar] [CrossRef] [PubMed]
- Sansom, O.J.; Meniel, V.S.; Muncan, V.; Phesse, T.; Wilkins, J.A.; Reed, K.; Vass, J.K.; Athineos, D.; Clevers, H.; Clarke, A. Myc deletion rescues APC deficiency in the small intestine. Nat. Cell Biol. 2007, 446, 676–679. [Google Scholar] [CrossRef] [PubMed]
- Kang, T.-H.; Leem, S.-H. Modulation of ATR-mediated DNA damage checkpoint response by cryptochrome. Nucleic Acids Res. 2014, 42, 4427–4434. [Google Scholar] [CrossRef] [PubMed]
- Jeffery, M.; Hickey, B.E.; Hider, P.N. Follow-up strategies for patients treated for non-metastatic colorectal cancer. Cochrane Database Syst. Rev. 2019, 9, CD002200. [Google Scholar] [CrossRef] [PubMed]
- De Mei, C.; Ercolani, L.; Parodi, C.; Veronesi, M.; Vecchio, C.L.; Bottegoni, G.; Torrente, E.; Scarpelli, R.; Marotta, R.; Ruffili, R.; et al. Dual inhibition of REV-ERBβ and autophagy as a novel pharmacological approach to induce cytotoxicity in cancer cells. Oncogene 2015, 34, 2597–2608. [Google Scholar] [CrossRef] [PubMed]
- Yu, M.; Li, W.; Wang, Q.; Wang, Y.; Lu, F. Circadian regulator NR1D2 regulates glioblastoma cell proliferation and motility. Oncogene 2018, 37, 4838–4853. [Google Scholar] [CrossRef]
- Tong, H.; Liu, X.; Li, T.; Qiu, W.; Peng, C.; Shen, B.; Zhu, Z. NR1D2 Accelerates Hepatocellular Carcinoma Progression by Driving the Epithelial-to-Mesenchymal Transition. OncoTargets Ther. 2020, 13, 3931–3942. [Google Scholar] [CrossRef]
- He, M.X.; Cuoco, M.S.; Crowdis, J.; Bosma-Moody, A.; Zhang, Z.; Bi, K.; Kanodia, A.; Su, M.-J.; Ku, S.-Y.; Garcia, M.M.; et al. Transcriptional mediators of treatment resistance in lethal prostate cancer. Nat. Med. 2021, 27, 426–433. [Google Scholar] [CrossRef]
- Holohan, C.; Van Schaeybroeck, S.; Longley, D.B.; Johnston, P.G. Cancer drug resistance: An evolving paradigm. Nat. Rev. Cancer 2013, 13, 714–726. [Google Scholar] [CrossRef]
- Batlle, E.; Clevers, H. Cancer stem cells revisited. Nat. Med. 2017, 23, 1124–1134. [Google Scholar] [CrossRef]
- Li, Y.; Rogoff, H.A.; Keates, S.; Gao, Y.; Murikipudi, S.; Mikule, K.; Leggett, D.; Li, W.; Pardee, A.B.; Li, C.J. Suppression of cancer relapse and metastasis by inhibiting cancer stemness. Proc. Natl. Acad. Sci. USA 2015, 112, 1839–1844. [Google Scholar] [CrossRef] [Green Version]


| Frequency (N) | Percentage (%) | ||
|---|---|---|---|
| Gender | Man | 154 | 59.7 |
| Woman | 114 | 40.3 | |
| Age a | ≤71 | 144 | 55.8 |
| >71 | 114 | 44.2 | |
| Organ | Colon | 215 | 83.3 |
| Recto | 43 | 16.7 | |
| Grade of differentiation | Well differentiated | 88 | 34.0 |
| Moderately differentiated | 140 | 54.3 | |
| Poorly differentiated | 29 | 11.7 | |
| T stage | T1 | 4 | 1.6 |
| T2 | 29 | 11.2 | |
| T3 | 183 | 70.9 | |
| T4 | 42 | 16.3 | |
| N (TNM classification) | N0 | 135 | 52.3 |
| N1 | 77 | 29.8 | |
| N2 | 44 | 17.9 | |
| M (TNM classification) | M0 | 209 | 81.0 |
| M1 | 45 | 17.4 | |
| Mx | 4 | 1.6 | |
| Stage | Stage I | 26 | 11.7 |
| Stage II (IIA-IIB) | 97 | 36.0 | |
| Stage III (IIIA-IIIB-IIIC) | 87 | 33.7 | |
| Stage IV | 45 | 18.6 | |
| Metachronous metastasis | No | 170 | 75.5 |
| Yes | 56 | 25.5 | |
| Local recurrence | No | 190 | 75.2 |
| Yes | 27 | 24.8 | |
| Radiotherapy | No | 221 | 88.4 |
| Yes | 29 | 11.6 | |
| Chemotherapy | No | 101 | 41.9 |
| Yes | 140 | 58.1 | |
| OCP | Low | High | |
|---|---|---|---|
| PER1 | 3 | 0–3 | 4–12 |
| PER2 | 5 | 0–5 | 6–12 |
| PER3 | 1 | 0–1 | 2–12 |
| CRY1 | 3 | 0–3 | 4–12 |
| CRY2 | 2 | 0–2 | 3–12 |
| BMAL1 | 6 | 0–6 | 7–12 |
| NR1D2 | 1 | 0–1 | 2–12 |
| Normal a (N = 66) | Tumour a (N = 258) | p | |
|---|---|---|---|
| PER1 | 8.0 (7.0–10.0) | 3.0 (2.0–4.0) | <0.001 |
| PER2 | 12.0 (12.0–12.0) | 5.3 (4.0–7.9) | <0.001 |
| PER3 | 4.5 (3.4–7.0) | 0.0 (0.0–0.0) | <0.001 |
| CRY1 | 8.0 (6.0–8.0) | 4.0 (2.0–5.0) | <0.001 |
| CRY2 | 9.0 (8.0–11.0) | 5.3 (4.0–7.5) | <0.001 |
| BMAL1 | 8.0 (5.0–12.0) | 8.0 (6.7–10.7) | 0.663 |
| NR1D2 | 6.0 (4.0–8.0) | 0.3 (0.0–2.0) | <0.001 |
| PER1 | PER2 | PER3 | ||||||||
|---|---|---|---|---|---|---|---|---|---|---|
| Low | High | p a | Low | High | p a | Low | High | p a | ||
| Age | ≤71 | 63 (44.1) | 80 (55.8) | ns | 59 (41.1) | 84 (58.9) | ns | 132 (91.8) | 12 (8.2) | ns |
| >71 | 46 (40.0) | 69 (60.0) | 43 (38.7) | 72 (61.3) | 108 (93.3) | 7 (6.7) | ||||
| Gender | Men | 61 (39.2) | 95 (60.8) | ns | 52 (33.1) | 103 (66.9) | 0.016 | 142 (91.3) | 14 (8.7) | ns |
| Women | 48 (46.7) | 54 (53.3) | 50 (48.1) | 53 (50.9) | 98 (94.4) | 6 (5.6) | ||||
| GD b | WD | 41 (36.4) | 47 (63.6) | ns | 23 (27.3) | 64 (62.7) | 0.005 | 80 (90.9) | 8 (9.1) | ns |
| MD | 56 (34.3) | 84 (65.7) | 62 (45.1) | 78 (54.9) | 131 (91.5) | 10 (8.5) | ||||
| PD | 11 (42.9) | 17 (57.1) | 16 (53.3) | 13 (47.7) | 27 (86.2) | 2 (13.8) | ||||
| T Stage | T1-T2 | 11 (45.5) | 22 (54.5) | ns | 11 (36.4) | 22 (63.6) | ns | 32 (97.0) | 1 (3.0) | ns |
| T3-T4 | 97 (63.4) | 126 (36.6) | 90 (54.9) | 134 (45.1) | 207 (88.5) | 19 (11.5) | ||||
| N Stage | N0 | 50 (31.1) | 85 (68.9) | ns | 48 (34.4) | 88 (65.6) | ns | 125 (91.9) | 11 (8.1) | ns |
| N1-N2 | 58 (43.4) | 63 (56.6) | 53 (44.9) | 68 (55.1) | 110 (89.4) | 13 (10.6) | ||||
| M Stage | M0 | 81 (39.3) | 125 (60.7) | ns | 77 (35.3) | 132 (64.7) | 0.040 | 193 (91.5) | 17 (9.5) | ns |
| M1 | 24 (57.4) | 22 (42.6) | 24 (52.2) | 21 (47.8) | 42 (93.5) | 3 (6.5) | ||||
| TNM | I-II | 42 (34.4) | 81 (65.6) | 0.015 | 43 (34.7) | 81 (85.3) | ns | 115 (92.7) | 10 (7.3) | ns |
| III-IV | 65 (48.9) | 67 (51.1) | 57 (43.8) | 73 (56.2) | 121 (96.3) | 10 (3.7) | ||||
| CRY1 | CRY2 | BMAL1 | NR1D2 | ||||||||||
|---|---|---|---|---|---|---|---|---|---|---|---|---|---|
| Low | High | p a | Low | High | p a | Low | High | p a | Low | High | p a | ||
| Age | ≤71 | 44 (30.8) | 100 (69.2) | ns | 11 (7.5) | 133 (92.5) | ns | 30 (21.4) | 113 (78.6) | ns | 86 (60.3) | 57 (39.7) | ns |
| >71 | 28 (26.1) | 87 (73.9) | 5 (5.0) | 111 (95.0) | 17 (12.4) | 97 (88.6) | 63 (53.3) | 53 (47.7) | |||||
| Gender | Men | 40 (32.2) | 116 (76.8) | ns | 6 (3.8) | 150 (96.3) | ns | 23 (18.3) | 130 (87.1) | ns | 88 (84.5) | 67 (15.5) | ns |
| Women | 32 (30.1) | 71 (69.9) | 10 (10.3) | 94 (89.7) | 24 (29.1) | 80 (70.9) | 61 (81.6) | 43 (18.4) | |||||
| GD b | WD | 25 (37.5) | 63 (62.5) | ns | 3 (12.5) | 85 (87.5) | ns | 15 (46.5) | 71 (53.5) | ns | 44 (52.3) | 44 (47.7) | ns |
| MD | 37 (40.0) | 103 (60.0) | 11 (16.3) | 130 (83.7) | 23 (51.1) | 118 (48.9) | 87 (63.8) | 54 (36.2) | |||||
| PD | 11 (48.3) | 18 (51.7) | 2 (6.9) | 27 (93.1) | 8 (82.1) | 20 (17.9) | 17 (67.9) | 11 (32.1) | |||||
| T Stage | T1-T2 | 11 (54.5) | 22 (45.5) | ns | 1 (9.1) | 32 (90.9) | ns | 3 (12.1) | 30 (87.9) | ns | 17 (42.4) | 18 (57.6) | ns |
| T3-T4 | 61 (75.1) | 164 (24.9) | 15 (14.6) | 211 (85.4) | 43 (25.6) | 180 (74.4) | 131 (50.7) | 94 (49.3) | |||||
| N Stage | N0 | 127 (36.3) | 10 (63.7) | ns | 5 (3.3) | 131 (96.7) | ns | 20 (13.3) | 115 (86.7) | ns | 80 (61.0) | 57 (39.0) | ns |
| N1-N2 | 112 (45.5) | 10 (54.5) | 11 (6.9) | 112 (93.1) | 26 (16.9) | 95 (83.1) | 68 (57.4) | 53 (42.6) | |||||
| M Stage | M0 | 60(35.6) | 149 (64.4) | ns | 14 (6.2) | 196 (93.8) | ns | 31 (15.1) | 176 (85.9) | 0.005 | 121 (58.2) | 87 (41.8) | ns |
| M1 | 11 (47.8) | 34 (52.2) | 2 (4.1) | 43 (95.9) | 15 (30.4) | 30 (69.6) | 26 (56.5) | 20 (43.5) | |||||
| TNM | I-II | 33 (26.6) | 91 (63.4) | ns | 4 (3.2) | 120 (96.8) | ns | 17 (13.8) | 106 (86.2) | ns | 74 (59.7) | 50 (40.3) | ns |
| III-IV | 38 (29.0) | 93 (71.0) | 12 (9.1) | 121 (90.9) | 29 (22.3) | 101 (77.7) | 73 (55.7) | 58 (44.3) | |||||
| CRY1 | ||||
|---|---|---|---|---|
| Low | High | p a | ||
| All patients | No | 52 (33.3) | 104 (66.7) | 0.003 |
| Yes | 4 (9.8) | 37 (90.2) | ||
| 3 years after disease diagnosis | No | 51 (31.3) | 112 (68.7) | 0.017 |
| Yes | 3 (10.0) | 27 (90.0) | ||
| 5 years after disease diagnosis | No | 49 (32.9) | 100 (67.1) | 0.008 |
| Yes | 4 (10.8) | 33 (89.2) | ||
| 3 Years after Disease Diagnosis | |||
|---|---|---|---|
| Independent Variables | OR a [95% CI b] | p Value | |
| Intercept | |||
| Age | (>71 vs ≤71) | 1.12 [0.44, 2.90] | 0.811 |
| Gender | (man vs. woman) | 2.013 [0.78, 5.19] | 0.148 |
| T stage | (T3 + T4 vs. T1 + T2) | 1.69 [0.34, 8.34] | 0.520 |
| N stage | (N1 + N2 N0 vs) | 1.14 [0.49, 2.80] | 0.780 |
| Adjuvant Therapy | (Yes vs. No) | 4.30 [1.29, 14.29] | 0.017 |
| CRY1 | (High vs. Low) | 3.81 [1.07, 13.57] | 0.039 |
| 5 years after disease diagnosis | |||
| Independent variables | OR [95% CI] | pvalue | |
| Intercept | <0.0001 | ||
| Age | (>71 vs ≤71) | 1.37 [0.57, 3.27] | 0.479 |
| Gender | (man vs. woman) | 1.43 [0.63, 3.26] | 0.395 |
| T stage | (T3 + T4 vs. T1 + T2) | 0.97 [0.28, 3.39] | 0.965 |
| N stage | (N1 + N2 N0 vs) | 1.19 [0.51, 2.80] | 0.683 |
| Adjuvant Therapy | (Yes vs. No) | 3.72 [1.31, 10.60] | 0.014 |
| CRY1 | (High vs. Low) | 3.87 [1.26, 11.88] | 0.018 |
| NR1D2 | ||||
|---|---|---|---|---|
| Low | High | p a | ||
| All patients | No | 115 (60.8) | 74 (39.2) | 0.031 |
| Yes | 11 (39.3) | 17 (60.7) | ||
| 3 years after disease diagnosis | No | 117 (60.9) | 75 (39.1) | 0.015 |
| Yes | 7 (33.3) | 14 (66.7) | ||
| 5 years after disease diagnosis | No | 107 (61.5) | 67 (38.5) | 0.042 |
| Yes | 11 (40.7) | 16 (59.3) | ||
| 3 Years after Disease Diagnosis | |||
|---|---|---|---|
| Independent Variables | OR a [95% CI b] | p | |
| Intercept | <0.001 | ||
| Age | (>71 vs ≤71) | 1.48 [0.48, 4.59] | 0.500 |
| Gender | (man vs. woman) | 1.64 [0.58, 4.60] | 0.349 |
| T stage | (3 + 4 vs. 1 + 2) | 3.21 [0.38, 27.42] | 0.286 |
| N stage | (1 + 2 vs. 0) | 1.29 [0.45, 3.71] | 0.632 |
| Adjuvant Therapy | (Yes vs. No) | 3.59 [0.85, 15.01] | 0.081 |
| NR1D2 | (High vs. Low) | 3.04 [1.13, 8.15] | 0.021 |
| 5 years after disease diagnosis | |||
| Independent variables | OR [95% CI] | p | |
| Intercept | <0.005 | ||
| Age | (>71 vs ≤ 71) | 1.44 [0.52, 3.98] | 0.477 |
| Gender | (man vs. woman) | 1.12 [0.47, 2.69] | 0.794 |
| T stage | (3 + 4 vs. 1 + 2) | 4.16 [0.50, 34.36] | 0.186 |
| N stage | (1 + 2 vs. 0) | 1.01 [0.39, 2.64] | 0.980 |
| Adjuvant Therapy | (Yes vs. No) | 2.48 [0.45, 8.27] | 0.139 |
| NR1D2 | (High vs. Low) | 2.45 [1.03, 5.85] | 0.044 |
| OS | DFS | ||||
|---|---|---|---|---|---|
| Independent Variable | HR [95% CI] | p a | HR [95% CI] | p a | |
| Age | (>71 vs ≤71) | 1.023 [0.99, 1.06] | 0.174 | 1.019 [0.99, 1,05] | 0.248 |
| Gender | (man vs. woman) | 1.93 [1.02, 3.67] | 0.044 | 1.793 [0.95, 3.93] | 0.073 |
| TNM stage | (III + IV vs. I + II) | 2.35 [1.09, 5.07] | 0.029 | 2.30 [1.07, 4.97] | 0.033 |
| Adjuvant Therapy | (Yes vs. No) | 2.42 [0.94, 6.17] | 0.066 | 2.56 [1.00, 6.58] | 0.050 |
| CRY1 | (High vs. Low) | 3.15 [1.15, 6.45] | 0.023 | 2.90 [1.22, 6.85] | 0.015 |
| BMAL1 | (High vs. Low) | 0.52 [0.20, 0.97] | 0.039 | 0.54 [0.26, 0.99] | 0.048 |
Publisher’s Note: MDPI stays neutral with regard to jurisdictional claims in published maps and institutional affiliations. |
© 2021 by the authors. Licensee MDPI, Basel, Switzerland. This article is an open access article distributed under the terms and conditions of the Creative Commons Attribution (CC BY) license (https://creativecommons.org/licenses/by/4.0/).
Share and Cite
Aroca-Siendones, M.I.; Moreno-SanJuan, S.; Puentes-Pardo, J.D.; Verbeni, M.; Arnedo, J.; Escudero-Feliu, J.; García-Costela, M.; García-Robles, A.; Carazo, Á.; León, J. Core Circadian Clock Proteins as Biomarkers of Progression in Colorectal Cancer. Biomedicines 2021, 9, 967. https://doi.org/10.3390/biomedicines9080967
Aroca-Siendones MI, Moreno-SanJuan S, Puentes-Pardo JD, Verbeni M, Arnedo J, Escudero-Feliu J, García-Costela M, García-Robles A, Carazo Á, León J. Core Circadian Clock Proteins as Biomarkers of Progression in Colorectal Cancer. Biomedicines. 2021; 9(8):967. https://doi.org/10.3390/biomedicines9080967
Chicago/Turabian StyleAroca-Siendones, María I., Sara Moreno-SanJuan, Jose D. Puentes-Pardo, Michela Verbeni, Javier Arnedo, Julia Escudero-Feliu, María García-Costela, Adelina García-Robles, Ángel Carazo, and Josefa León. 2021. "Core Circadian Clock Proteins as Biomarkers of Progression in Colorectal Cancer" Biomedicines 9, no. 8: 967. https://doi.org/10.3390/biomedicines9080967