Article

Systems Analysis Reveals Ageing-Related Perturbations in Retinoids and Sex Hormones in Alzheimer’s and Parkinson’s Diseases

1
Faculty of Dentistry, Oral and Craniofacial Sciences, King’s College London, London SE1 9RT, UK
2
Leibniz Institute on Aging-Fritz Lipmann Institute, 07745 Jena, Germany
3
National Bioinformatics Infrastructure Sweden (NBIS), Science for Life Laboratory, Department of Biochemistry and Biophysics, Stockholm University, SE-17121 Stockholm, Sweden
4
Science for Life Laboratory, KTH—Royal Institute of Technology, SE-17121 Stockholm, Sweden
5
Department of Medical Biology, Faculty of Medicine, Atatürk University, 25240 Erzurum, Turkey
6
Institute of Biochemistry and Biophysics, Freidrich-Schiller-University Jena, 07745 Jena, Germany
*
Authors to whom correspondence should be addressed.
Present address: Institute for Pathology, University Medical Center, 55131 Mainz, Germany.
Biomedicines 2021, 9(10), 1310; https://doi.org/10.3390/biomedicines9101310
Submission received: 28 July 2021 / Revised: 22 September 2021 / Accepted: 22 September 2021 / Published: 24 September 2021

Abstract

:
Neurodegenerative diseases, including Alzheimer’s (AD) and Parkinson’s diseases (PD), are complex heterogeneous diseases with highly variable patient responses to treatment. Due to the growing evidence for ageing-related clinical and pathological commonalities between AD and PD, these diseases have recently been studied in tandem. In this study, we analysed transcriptomic data from AD and PD patients, and stratified these patients into three subclasses with distinct gene expression and metabolic profiles. Through integrating transcriptomic data with a genome-scale metabolic model and validating our findings by network exploration and co-analysis using a zebrafish ageing model, we identified retinoids as a key ageing-related feature in all subclasses of AD and PD. We also demonstrated that the dysregulation of androgen metabolism by three different independent mechanisms is a source of heterogeneity in AD and PD. Taken together, our work highlights the need for stratification of AD/PD patients and development of personalised and precision medicine approaches based on the detailed characterisation of these subclasses.

1. Introduction

Neurodegenerative diseases, including Alzheimer’s (AD) and Parkinson’s diseases (PD), cause years of a healthy life to be lost. Much previous AD and PD research has focused on the causative neurotoxicity agents, namely, amyloid β and α-synuclein, respectively. The current front-line therapies for AD and PD are cholinesterase inhibition and dopamine repletion, respectively, which are considered gold standards. Unfortunately, these therapies are not capable of reversing neurodegeneration [1,2], thus necessitating potentially lifelong dependence on the drug and risking drug-associated complications. Moreover, AD and PD are complex multifactorial diseases with heterogeneous underlying molecular mechanisms involved in their progression [3,4,5]. This variability can explain the differences in patient response to other treatments such as oestrogen replacement therapy [6,7] and statin treatment [8,9]. Hence, we observed that there are distinct disease classes affecting specific cellular processes. Therefore, there is a need for the development of personalised treatment regimens.
In this study, we propose a holistic view of the mechanisms underlying the development of AD and PD rather than focusing on amyloid β and α-synuclein [10]. To date, complex diseases including liver disorders and certain cancers have been well studied through the use of metabolic modelling. This enabled the integration of multiple omics data for stratification of patients, discovery of diagnostic markers, identification of drug targets, and proposing of personalised or class-specific treatment strategies [11,12,13,14]. A similar approach may be applied for AD and PD since there is already a wealth of data from AD and PD patients from post-mortem brain tissues and blood transcriptomics.
AD and PD share multiple clinical and pathological similarities, including comorbidities [15,16], inverse associations with cancer [17,18], and ageing as a risk factor [19,20]. One type of ageing is telomeric ageing, which is associated with the loss of telomeres, protein/nucleic acid structures that protect chromosome ends from degradation [21]. The enzyme telomerase is necessary for the maintenance of telomeres. In adults, telomerase activity is mostly limited to progenitor tissues such as in the ovaries, testes, and bone marrow. Loss of telomerase activity leads to telomere shortening, loss of sequences due to end-replication, and eventual degradation of sequences within coding regions, leading to telomeric ageing. Considering AD and PD as products of ageing, we can use an ageing model organism to study its effects on the brain. In our study, we used zebrafish (Danio rerio) as a model organism since it has been used extensively used to study vertebrate ageing [22]. For example, a zebrafish ageing model can harbour a nonsense mutation in the tert gene, which encodes the catalytic subunit of telomerase, and exhibit faster-than-normal ageing [23,24].
In our study, we first analysed post-mortem brain gene expression data and protein–protein interaction data from the Genotype-Tissue Expression (GTEx) database [25], Functional Annotation of the Mammalian Genome 5 (FANTOM5) database [26,27,28,29], Human Reference Protein Interactome (HuRI) database [30], and Human Protein Atlas (HPA) (http://www.proteinatlas.org, accessed on 9 March 2021) [31] for characterization of normal brain tissue (Figure 1A). Secondly, we analysed transcriptomic data from the Religious Orders Study and Rush Memory Aging Project (ROSMAP) [32,33,34] with published expression data from anterior cingulate cortices and dorsolateral prefrontal cortices of PD and Lewy body dementia patients, hereafter referred to as the Rajkumar dataset [35], and from putamina, substantiae nigrae, and prefrontal cortices from patients with PD, hereafter referred to as the Zhang/Zheng dataset [36,37]. On these data, we conducted differential gene expression and functional analysis, and then constructed biological networks to further explore coordinated patterns of gene expression. Next, we performed global metabolic analyses using genome-scale metabolic modelling. Alongside these analyses, we also leveraged zebrafish tert mutants to test the hypothesis that the identified changes may be associated with telomeric ageing. Finally, on the basis of our integrative systems analysis, we defined three distinct disease subclasses within AD and PD and identified retinoids as a common feature of all three subclasses, being likely to be perturbed through ageing. We revealed subclass-specific perturbations at three separate processes in the androgen biosynthesis and metabolism pathway, namely, oestradiol metabolism, cholesterol biosynthesis, and testosterone metabolism.

2. Materials and Methods

2.1. Data Acquisition and Processing

Gene expression values of protein-coding genes from the ROSMAP dataset were determined using kallisto (version 0.46.1, Pachter Lab, Berkeley, CA, USA) [38] by aligning raw RNA sequencing reads to the Homo sapiens genome in Ensembl release 96 [39]. Raw single-cell RNA sequencing reads from ROSMAP were converted to counts in Cell Ranger (version 4.0, 10x Genomics, Pleasanton, CA, USA, https://support.10xgenomics.com/single-cell-gene-expression/software/pipelines/latest/installation; accessed on 24 July 2020), and aligned to the Cell Ranger Homo sapiens reference transcriptome version 2020-A. Single-cell expression values were compiled into pseudo-bulk expression profiles for each sample.
Expression values of protein-coding genes from brain samples of the ROSMAP dataset [32,33,34], GTEx database version 8 [25], FANTOM5 database [26,27,28] via Regulatory Circuits Network Compendium 1.0 [29], HPA database [31], Rajkumar dataset [35], and Zhang/Zheng dataset [36,37] were then combined. Genes from GTEx and FANTOM5 brain samples were filtered such that only genes whose products are known to participate in a protein–protein interaction described in the HuRI database [30] were included. Expression values were scaled and TMM normalised per sample, Pareto scaled per gene, and batch effects removed with the removeBatchEffect function from the limma (version 3.42.0, The Walter and Eliza Hall Institute of Medical Research, Parkville, Australia) [40] R package. After quality control and normalisation, a total of 64,794 genes and 2055 samples resulted. As the data also included samples from patients with neurological conditions other than AD or PD, we then removed those samples and finally accepted 1572 samples corresponding to AD, PD, or control for further analysis.
Projections onto 2-D space by PCA, t-SNE [41], and UMAP [42] methods were generated on data after missing value imputation with data diffusion [43]. t-SNE projections were generated with perplexity 20 and 1000 iterations. All other parameters were kept default. PCA and UMAP projections were generated using all default parameters.

2.2. Transcriptome Analysis

Using normalised, imputed expression values, AD and PD samples were then arranged into clusters without supervision using ConsensusClusterPlus (version 1.50.0, University of North Carolina at Chapel Hill, Chapel Hill, NC, USA) [44] with maxK = 20 and rep = 1000. All other parameters were kept default. Clustering by k = 3 clusters was selected for downstream analysis. A fourth cluster containing only control samples was artificially added to the analysis.
For differential gene expression analysis, normalised, non-imputed counts were used. Genes were removed if expression values were missing in 40% or more of samples or were zero in all samples. Differential expression was then performed using DESeq2 (version 1.26.0, European Molecular Biology Laboratory, Heidelberg, Germany) [45] with uniform size factors and all other parameters set to default. Genes with a Benjamini–Hochberg adjusted p-value at or below a cut-off of 1 × 10⁻¹⁰ were determined significantly differentially expressed genes.
Gene set enrichment analysis was performed using piano (version 2.2.0, Chalmers University of Technology, Göteborg, Sweden) [46] using all default parameters. GO term lists were obtained from Ensembl Biomart (https://www.ensembl.org/biomart/martview, accessed on 9 March 2021) and were used as gene set collections. Enrichment of GO terms was determined by analysing GO terms of genes differentially expressed genes detected by DESeq2 as well as the parents of those GO terms. GO terms with an adjusted p-value at or below 0.05 for distinct-directional and/or mixed-directional methods were determined statistically significant.

2.3. Metabolic Analysis

For each cluster, consensus gene expression values were determined by taking the arithmetic mean of normalised expression counts across all samples within each cluster.
A reference GEM was created by modifying the gene associations of all reactions within the adipocyte-specific GEM iAdipocytes1850 [47] to match those within the generic human GEM HMR3 [48]. The resulting GEM was designated iBrain2845. Cluster-specific GEMs were reconstructed using the RAVEN Toolbox (version 2.0, Chalmers University of Technology, Göteborg, Sweden) [49] tINIT algorithm [50,51], with iBrain2845 as the reference GEM.
FBA was conducted on each cluster-specific GEM using the solveLP function from the RAVEN Toolbox with previously reported constraints [52] and defining ATP synthesis (iBrain2845: HMR_6916) as the objective function. All constraints were applied with the exception of the following reaction IDs, which were excluded: EX_ac[e] (iBrain2845: HMR_9086) and EX_etoh[e] (iBrain2845: HMR_9099).
Reporter metabolite analysis was conducted using the reporterMetabolites function [53] from the RAVEN Toolbox, using iBrain2845 as the reference model.

2.4. Network Analysis

To generate gene networks, we took normalised, non-imputed expression values from AD and PD samples. Control samples and samples from blood were excluded. One network was generated each for AD and PD. For the AD network, all male samples were included, and 171 female samples were chosen at random and included. For the PD network, all samples were included. Genes with any missing values were dropped. Genes with the 15% lowest expression or 15% lowest variance were disregarded from further analysis. Spearman correlations were calculated for each pair of genes, and the top 1% of significant correlations were used to generate gene co-expression networks. Random Erdős–Rényi models were created for the AD and PD networks, with the same numbers of nodes and edges to act as null networks, and compared against their respective networks in terms of centrality distributions. Community analyses were performed through the Leiden algorithm [54] by optimising CPMVertexPartition, after a resolution scan of 10,000 points between 10−3 and 10. The scan showed global maxima at resolutions = 0.077526 and 0.089074 for AD and PD networks, respectively, which were used for optimisation. Enrichment analysis was performed on modules with >30 nodes using enrichr (https://maayanlab.cloud/Enrichr, accessed on 5 March 2021) [55,56] using GO Biological Process, KEGG, and Online Mendelian Inheritance in Man libraries and was explored using Revigo (http://revigo.irb.hr, accessed on 5 March 2021) [57].

2.5. Zebrafish Data Acquisition and Analysis

The tert mutant zebrafish line (terthu3430) was obtained from Miguel Godhino Ferreira [24]. Fish maintenance, RNA isolation, processing, and sequencing were conducted as described previously [58].
From n = 5 wild-type (tert+/+), n = 5 heterozygous mutant (tert+/−), and n = 3 homozygous mutant (tert−/−), expression values were determined from RNA sequencing reads using kallisto by aligning to the Danio rerio genome in Ensembl release 96 [39]. Expression values were generated for each extracted tissue as well as ‘psuedo–whole animal’, containing combined values across all tissues.
A reference zebrafish GEM was manually curated by modifying the existing ZebraGEM2 model and was designated ZebraGEM2.1.
Differential expression analysis, gene set enrichment analysis, GEM reconstruction, FBA, and reporter metabolite analysis were conducted on tert−/− and tert+/− animals against a tert+/+ reference using DESeq2, piano, and RAVEN Toolbox 2.0 with default parameters. Reporter metabolite analysis was conducted with ZebraGEM2.1 as the reference GEM.
FBA was attempted as described for the human GEMs with the exception that the following metabolic constraints were excluded: r1391, HMR_0482 (ZebraGEM2.1: G3PDm), EX_ile_L[e] (ZebraGEM2.1: EX_ile_e), EX_val_L[e] (ZebraGEM2.1: EX_val_e), EX_lys_L[e] (ZebraGEM2.1: EX_lys_e), EX_phe_L[e] (ZebraGEM2.1: EX_phe_e), GLCt1r, EX_thr_L[e] (ZebraGEM2.1: EX_thr_e), EX_met_L[e] (ZebraGEM2.1: EX_met__L_e), EX_arg_L[e] (ZebraGEM2.1: EX_arg_e), EX_his_L[e] (ZebraGEM2.1: EX_his__L_e), EX_leu_L[e] (ZebraGEM2.1: EX_leu_e), and EX_o2[e] (ZebraGEM2.1: EX_o2_e). The objective function was defined as ATP synthesis (ZebraGEM2.1: ATPS4m). FBA results for zebrafish are not presented.

2.6. Data and Code Accessibility

All original computer code, models, and author-curated data files have been released under a Creative Commons Attribution ShareAlike 4.0 International Licence (https://creativecommons.org/licenses/by-sa/4.0/; accessed on 29 March 2021) and are freely available for download from <https://github.com/SimonLammmm/ad-pd-retinoid>; accessed on 29 March 2021.
Zebrafish tert mutant sequencing data have been deposited in the NCBI Gene Expression Omnibus (GEO) and are accessible through GEO Series accession numbers GSE102426, GSE102429, GSE102431, and GSE102434.

2.7. Ethics Statement

Zebrafish were housed in the fish facility of the Leibniz Institute on Aging—Fritz Lipmann Institute (FLI) under standard conditions and a 14 h light and 10 h dark cycle. All animal procedures were performed in accordance with the German animal welfare guidelines and approved by the Landesamt für Verbraucherschutz Thüringen (TLV), Germany.

3. Results

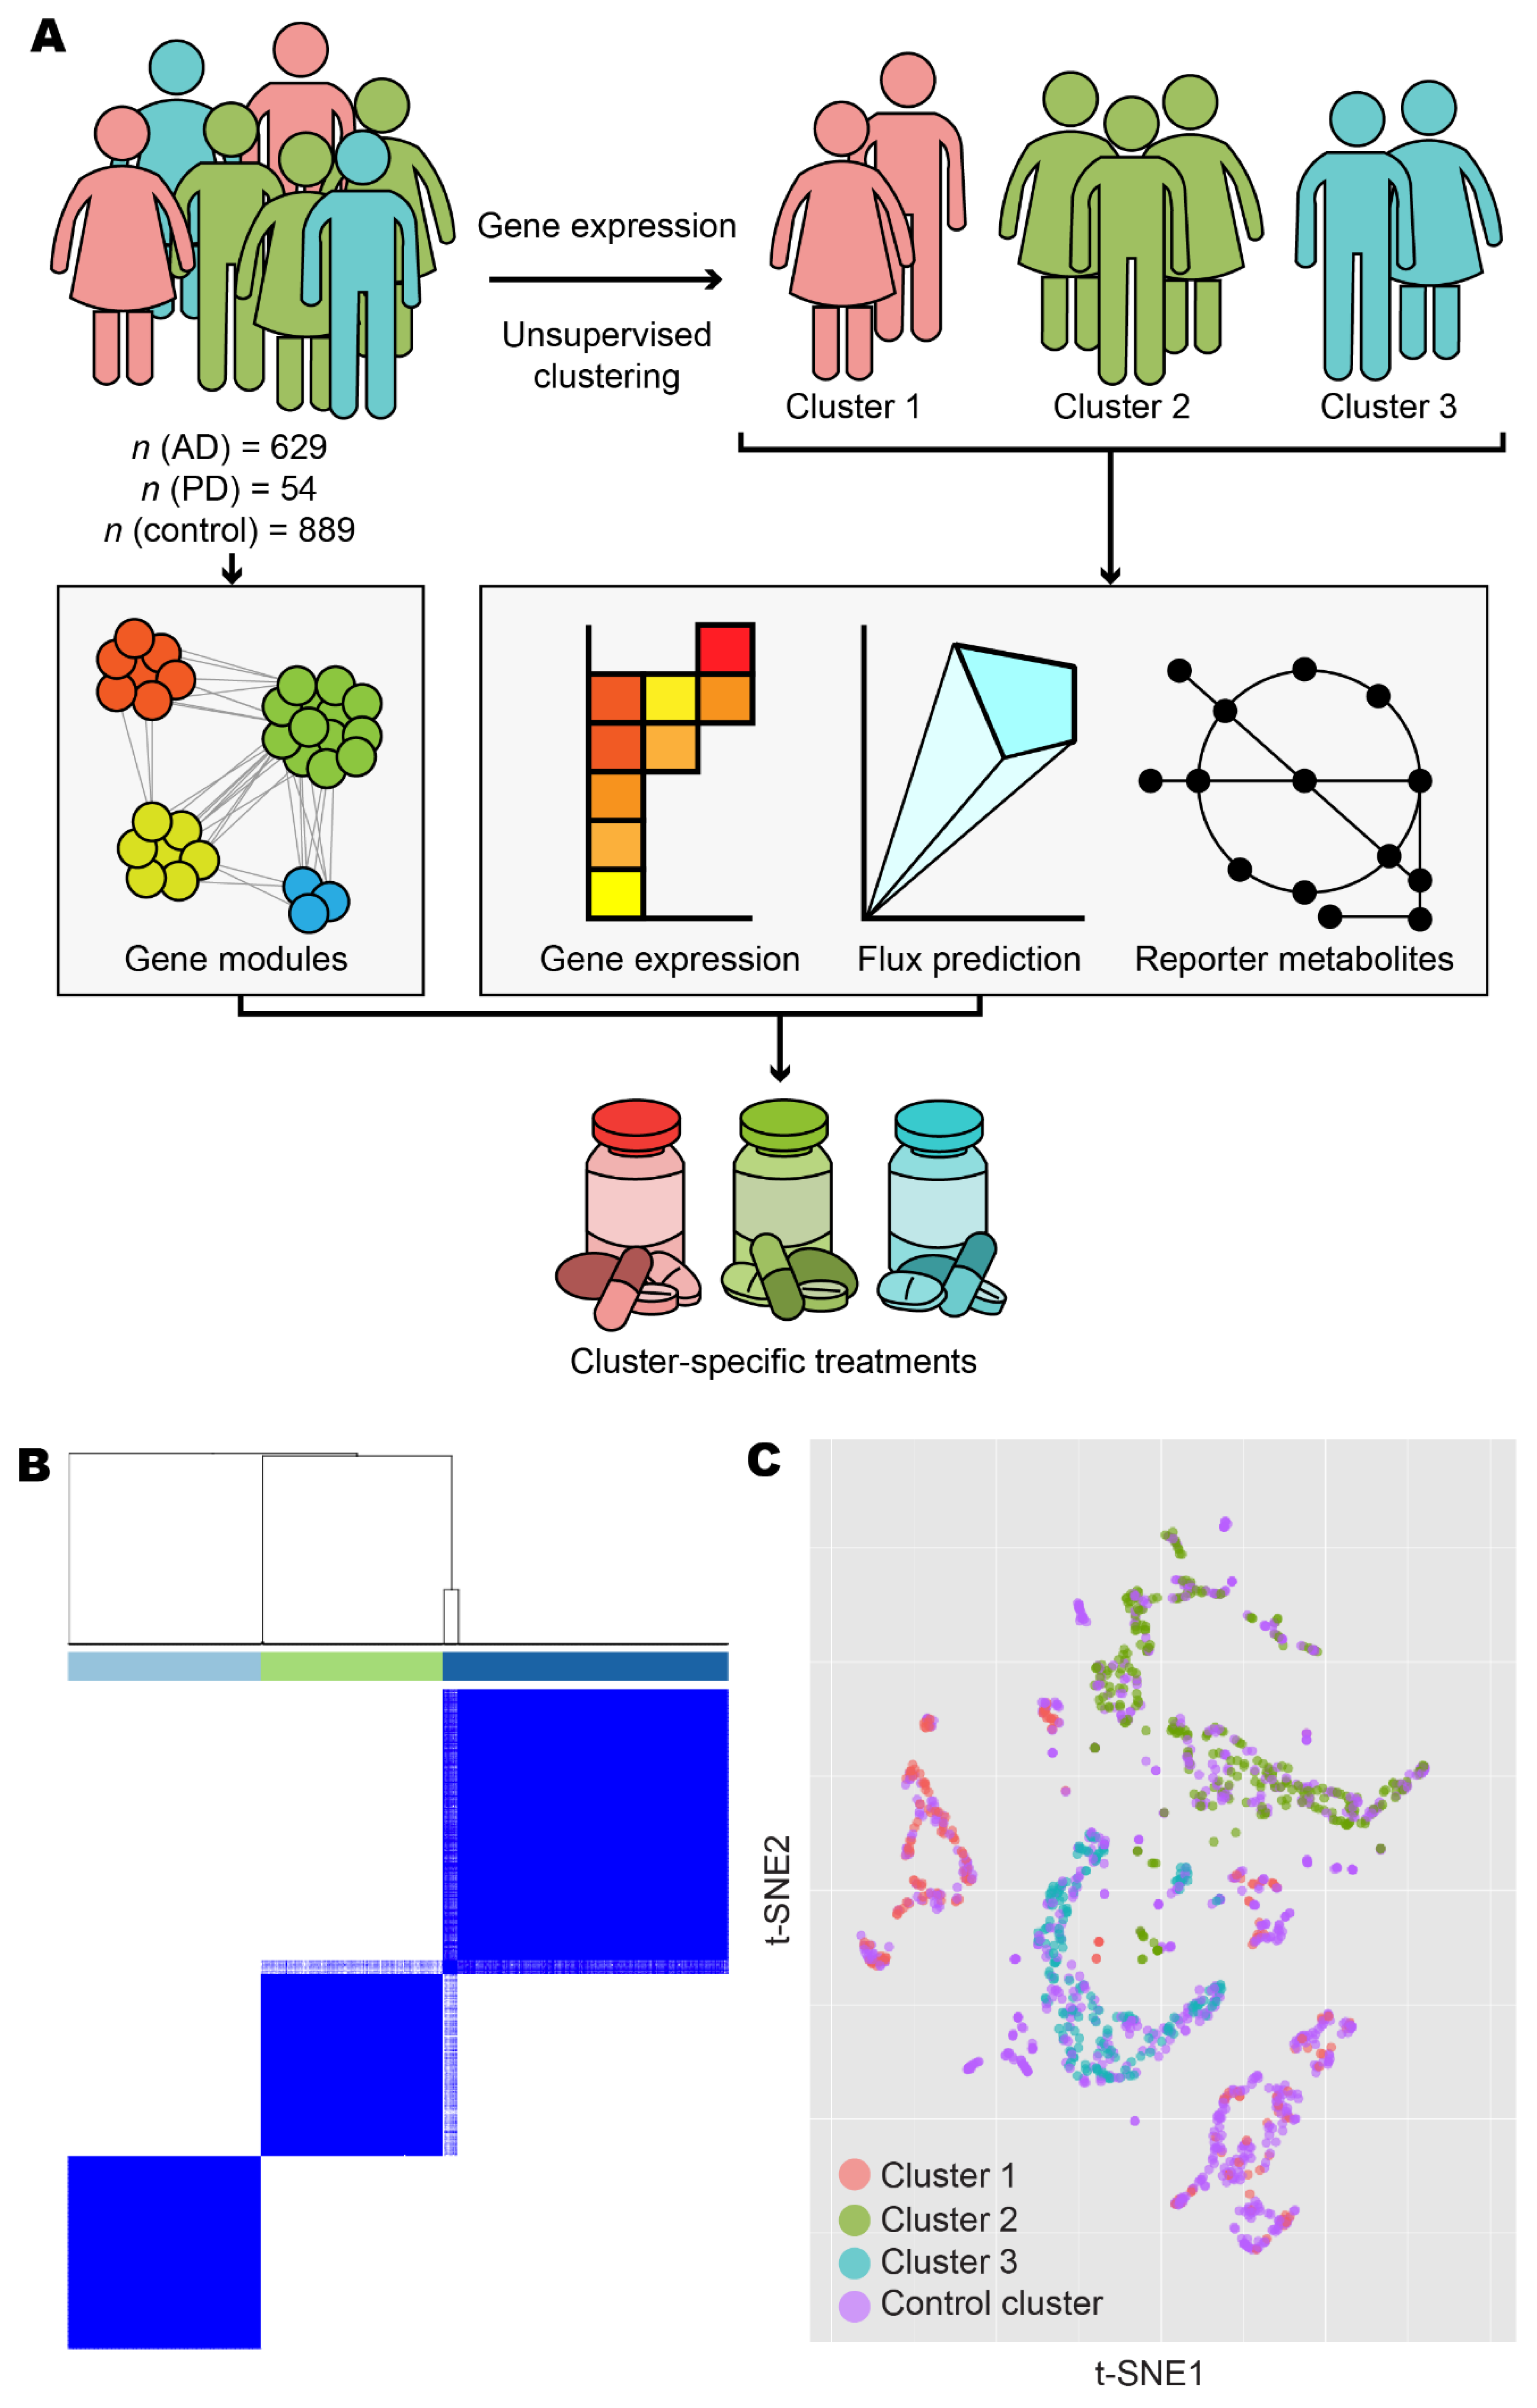
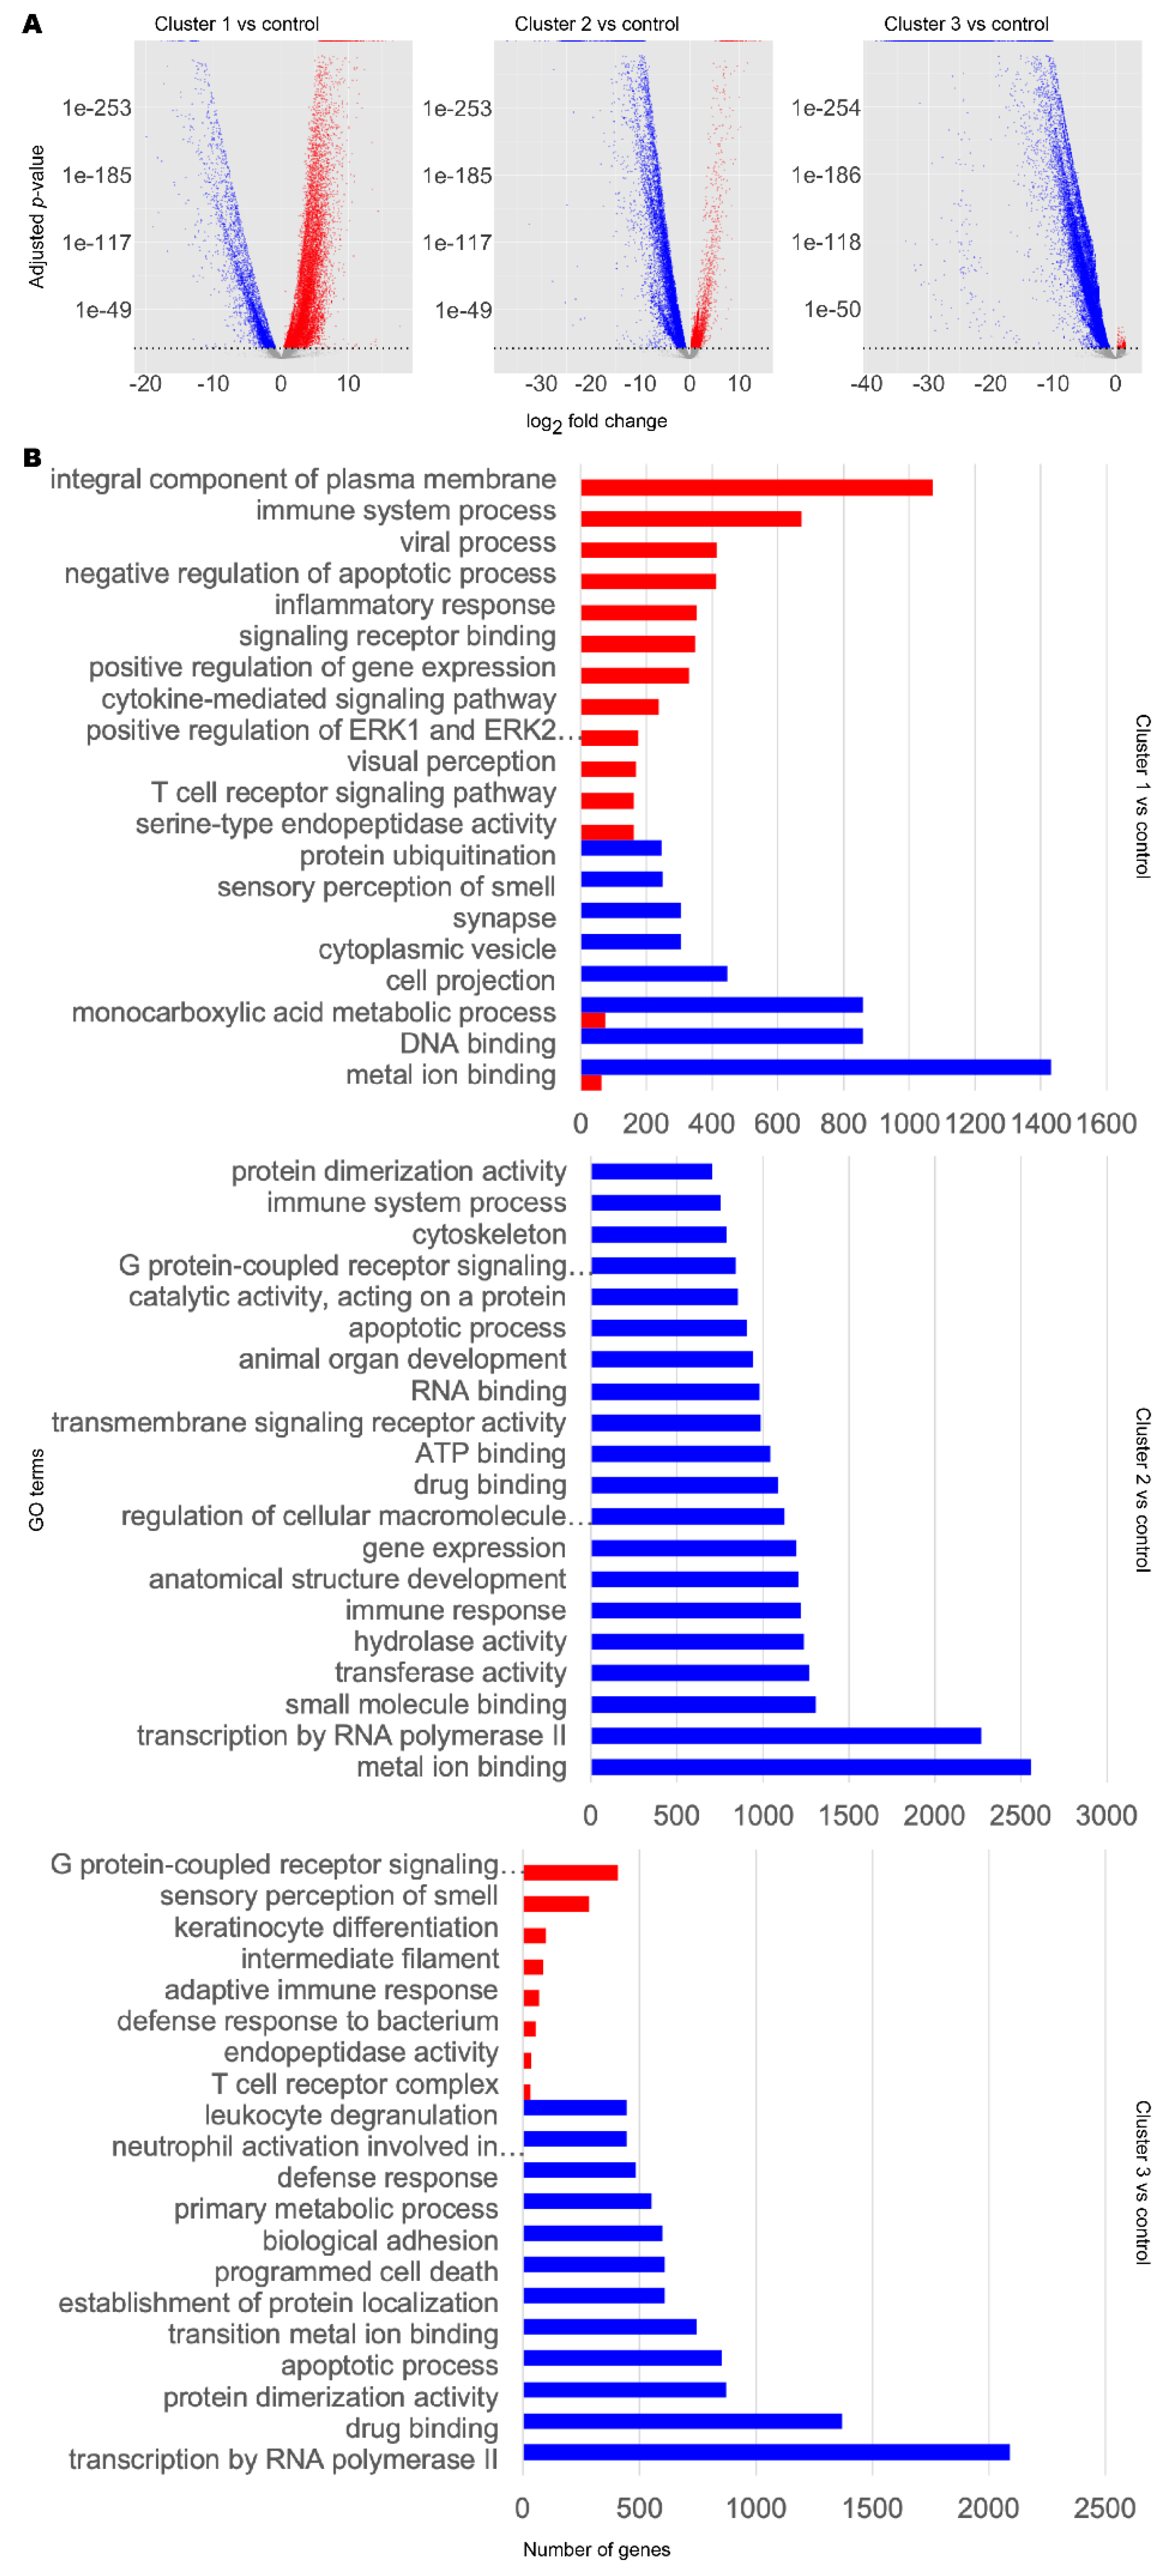
3.1. Stratification of Patients Revealed Three Distinct Disease Classes

We retrieved gene expression and protein–protein interaction data from GTEx, FANTOM5, HuRI, HPA, and ROSMAP databases and integrated these data with the published datasets by Rajkumar and Zhang/Zheng. After performing quality control and normalisation (as outlined in the Materials and Methods), we included a total of 629 AD samples, 54 PD samples, and 889 control samples in the analysis (Table 1). To reveal transcriptomic differences between AD/PD samples compared to healthy controls, we identified differentially expressed genes (DEGs) and performed gene set enrichment (GSE) analyses. However, since AD and PD are complex diseases with no single cure, it is likely that multiple gene expression profiling exist, manifesting in numerous disease classes requiring distinct treatment strategies. We therefore used unsupervised clustering to elucidate these expression profiles and stratify the AD and PD patients on the basis of the underlying molecular mechanisms involved in the disease occurrence.
Following unsupervised clustering with ConsensusClusterPlus [44], we separated AD and PD samples into three clusters (Figure 1B and Figure S1). Clusters 1 and 2 contained samples from Zhang/Zheng and Rajkumar datasets, respectively, in addition to samples in the ROSMAP dataset, and consisted of 127 and 186 samples from female donors, respectively, and 73 and 95 samples from male donors, respectively. Cluster 2 also contained 14 samples with sex not recorded. Cluster 3 contained only ROSMAP samples and consisted of 114 female and 74 male samples. Clusters did not form firmly along lines of sex, age, or brain tissues or brain subregion (Figure S2). Samples from non-diseased individuals were artificially added as a fourth, control cluster, consisting of 495 female samples, 262 male samples, 13 samples with sex not recorded, and 119 samples derived from aggregate sources.
By differential expression analysis using DESeq2 [45], we then characterised the distinct transcriptomic profiles within our disease clusters (Figure 2A). Cluster 1 showed mixed up- and downregulation of genes compared to control, whereas cluster 2 showed more downregulation and cluster 3 showed vast downregulation of genes compared to control.
To infer the functional differences between the subclasses, we performed GSE analysis using piano [46] (Figure 2B, Supplementary Data S1). Globally, DEGs in any cluster 1–3 were enriched in upregulated Gene Ontology (GO) terms for immune response, olfaction, retinoid function, and apoptosis, but downregulated for copper ion transport and telomere organisation, compared to the control cluster. Considering individual clusters, cluster 1 DEGs were enriched in upregulated GO terms associated with immune signalling, cell signalling, and visual perception. We also found downregulation of GO terms associated with olfactory signalling and cytoskeleton. DEGs in cluster 2 were found to be enriched in downregulated GO terms associated with the cytoskeleton, organ development, cell differentiation, retinoid metabolism and response, DNA damage repair, inflammatory response, telomere maintenance, unfolded protein response, and acetylcholine biosynthesis and binding. On the other hand, we did not find any significantly enriched upregulated GO terms. In cluster 3, we found that DEGs were enriched in upregulated GO terms associated with neuron function, olfaction, cell motility, and immune system. DEGs in cluster 3 were found to be enriched in downregulated GO terms associated with DNA damage response, ageing, and retinoid metabolism and response.
The difference in expression profiles illustrate highly heterogeneous transcriptomics in AD and PD and that there are notable commonalities and differences between the subclasses of AD or PD samples. Interestingly, we found retinoid metabolism or function to be a common altered GO term in all subclasses. This was upregulated in cluster 1 but downregulated in clusters 2 and 3. We therefore observed that retinoid dysregulation appears to be a common ageing-related hallmark in AD and PD.

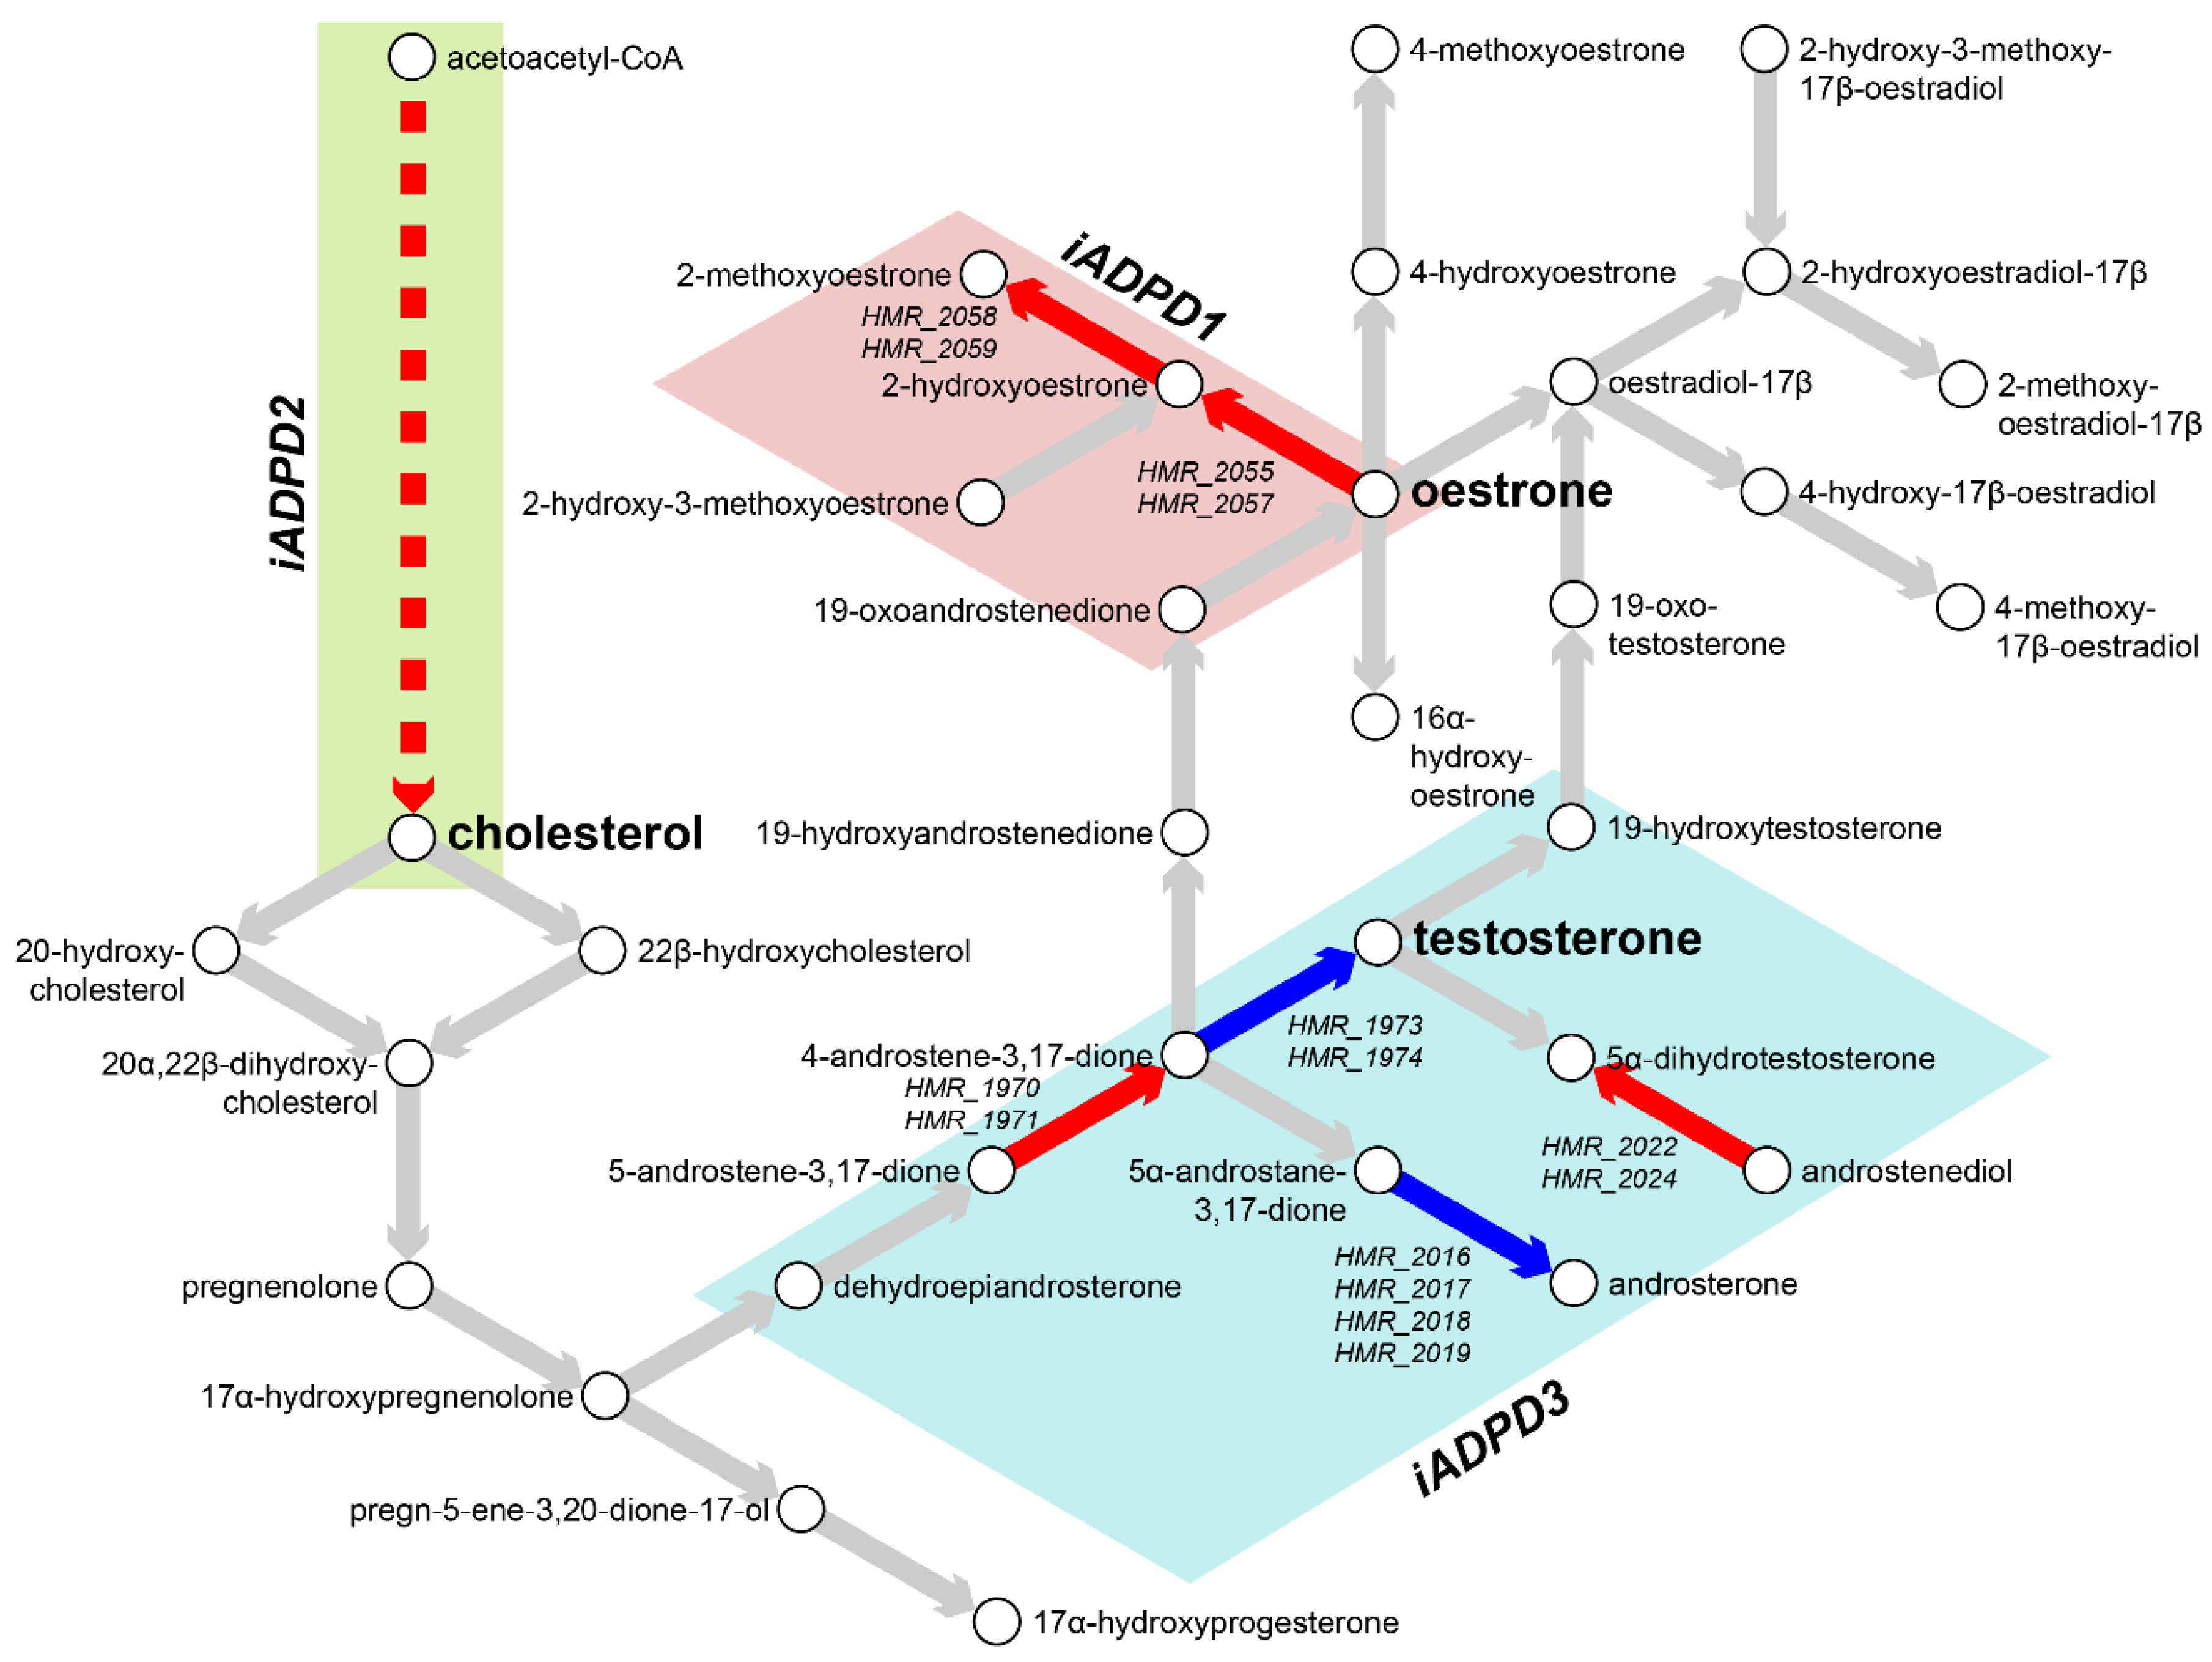
3.2. Metabolic Analysis Revealed Retinoids and Sex Hormones as Significantly Dysregulated in AD and PD

On the basis of clustering and GSE analysis, we identified distinct expression profiles, but these alone could not offer insights into metabolic activities of brain in AD and PD. To determine metabolic changes in the clusters compared to controls, we performed constraint-based genome-scale metabolic modelling. We reconstructed a brain-specific genome-scale metabolic model (GEM) based on the well-studied HMR2.0 [47] reference GEM by overlaying transcriptomic data from each cluster and applying brain-specific constraints as described previously [52] using the tINIT algorithm [50,51] within the RAVEN Toolbox 2.0 [49]. We generated a brain-specific GEM (iBrain2845) (Supplementary File S1) and used it as the reference GEM for reconstruction of cluster-specific GEMs in turn. We constructed the resulting context-specific iADPD series GEMs iADPD1, iADPD2, iADPD3, and iADPDControl, corresponding to cluster 1, cluster 2, cluster 3, and the control cluster, respectively (Supplementary File S2).
We conducted flux balance analysis (FBA) by defining maximisation of ATP synthesis as the objective function. iADPD1 and iADPD2 both showed upregulation of fluxes in reactions involved in cholesterol biosynthesis and downregulation in O-glycan metabolism, with reaction flux changes being more pronounced in iADPD2 than in iADPD1 (Table 2, Supplementary Data S2). We found that the fluxes in iADPD1 were uniquely upregulated in oestrogen metabolism and the Kandustch–Russell pathway. iADPD2 was uniquely upregulated in cholesterol metabolism, whereas iADPD3 uniquely displayed roughly equal parts upregulation and downregulation in several pathways, including aminoacyl-tRNA biosynthesis; androgen metabolism; arginine and proline metabolism; cholesterol biosynthesis; galactose metabolism; glycine, serine, and threonine metabolism; and N-glycan metabolism.
In particular, we observed increased positive fluxes through reactions HMR_2055 and HMR_2059 in iADPD1, which convert oestrone to 2-hydroxyoestrone and then to 2-methoxyoestrone (Figure 3). In iADPDControl, these reactions carried zero flux. In iADPD2, we observed increased positive fluxes through HMR_1457 and HMR_1533, which produce geranyl pyrophosphate and lathosterol, respectively. Both of these molecules are precursors to cholesterol, and while we did not see a proportionate increase in the production of other molecules along the pathway (namely, farnesyl pyrophosphate and squalene), we did observe a general increase in fluxes through the androgen biosynthesis and metabolism pathway. Finally, we observed that iADPD3 displayed a decreased production of testosterone from 4-androstene-3,17-dione via HMR_1974, despite an increase in production of 4-androstene-3,17-dione via HMR_1971.
Taken together, the obtained results indicate the existence of three distinct metabolic dysregulation profiles in AD and PD, with dysregulation being most pronounced in cluster 2 patients and least pronounced in cluster 3 patients. Furthermore, we found that all three clusters show dysregulations in or around sex hormone biosynthesis and metabolism, which might explain the heterogeneity in responses to sex hormone replacement therapy in AD and PD patients as extensively reported previously [6,59,60,61]. We also confirmed that dysregulations through sex hormone pathways in the iADPD series GEMs were not due to differences in relative frequencies between sexes in the main clusters 1-3 (Fisher’s exact test, p = 0.4700).
In addition to metabolic inference and FBA, we performed reporter metabolite analysis [53] by overlaying DEG analysis results onto the reference GEM to identify hotspots of metabolism (Table 3, Supplementary Data S3). In short, we uniquely identified oestrone as a reporter metabolite in cluster 1, and lipids such as acylglycerol and dolichol in cluster 2. No notable reporter metabolites were identified as significantly changed in cluster 3 only. In common to all clusters 1–3, retinoids, and sex hormones such as androsterone and pregnanediol were identified as significantly changed reporter metabolites, which are generally in line with GSE and FBA results.

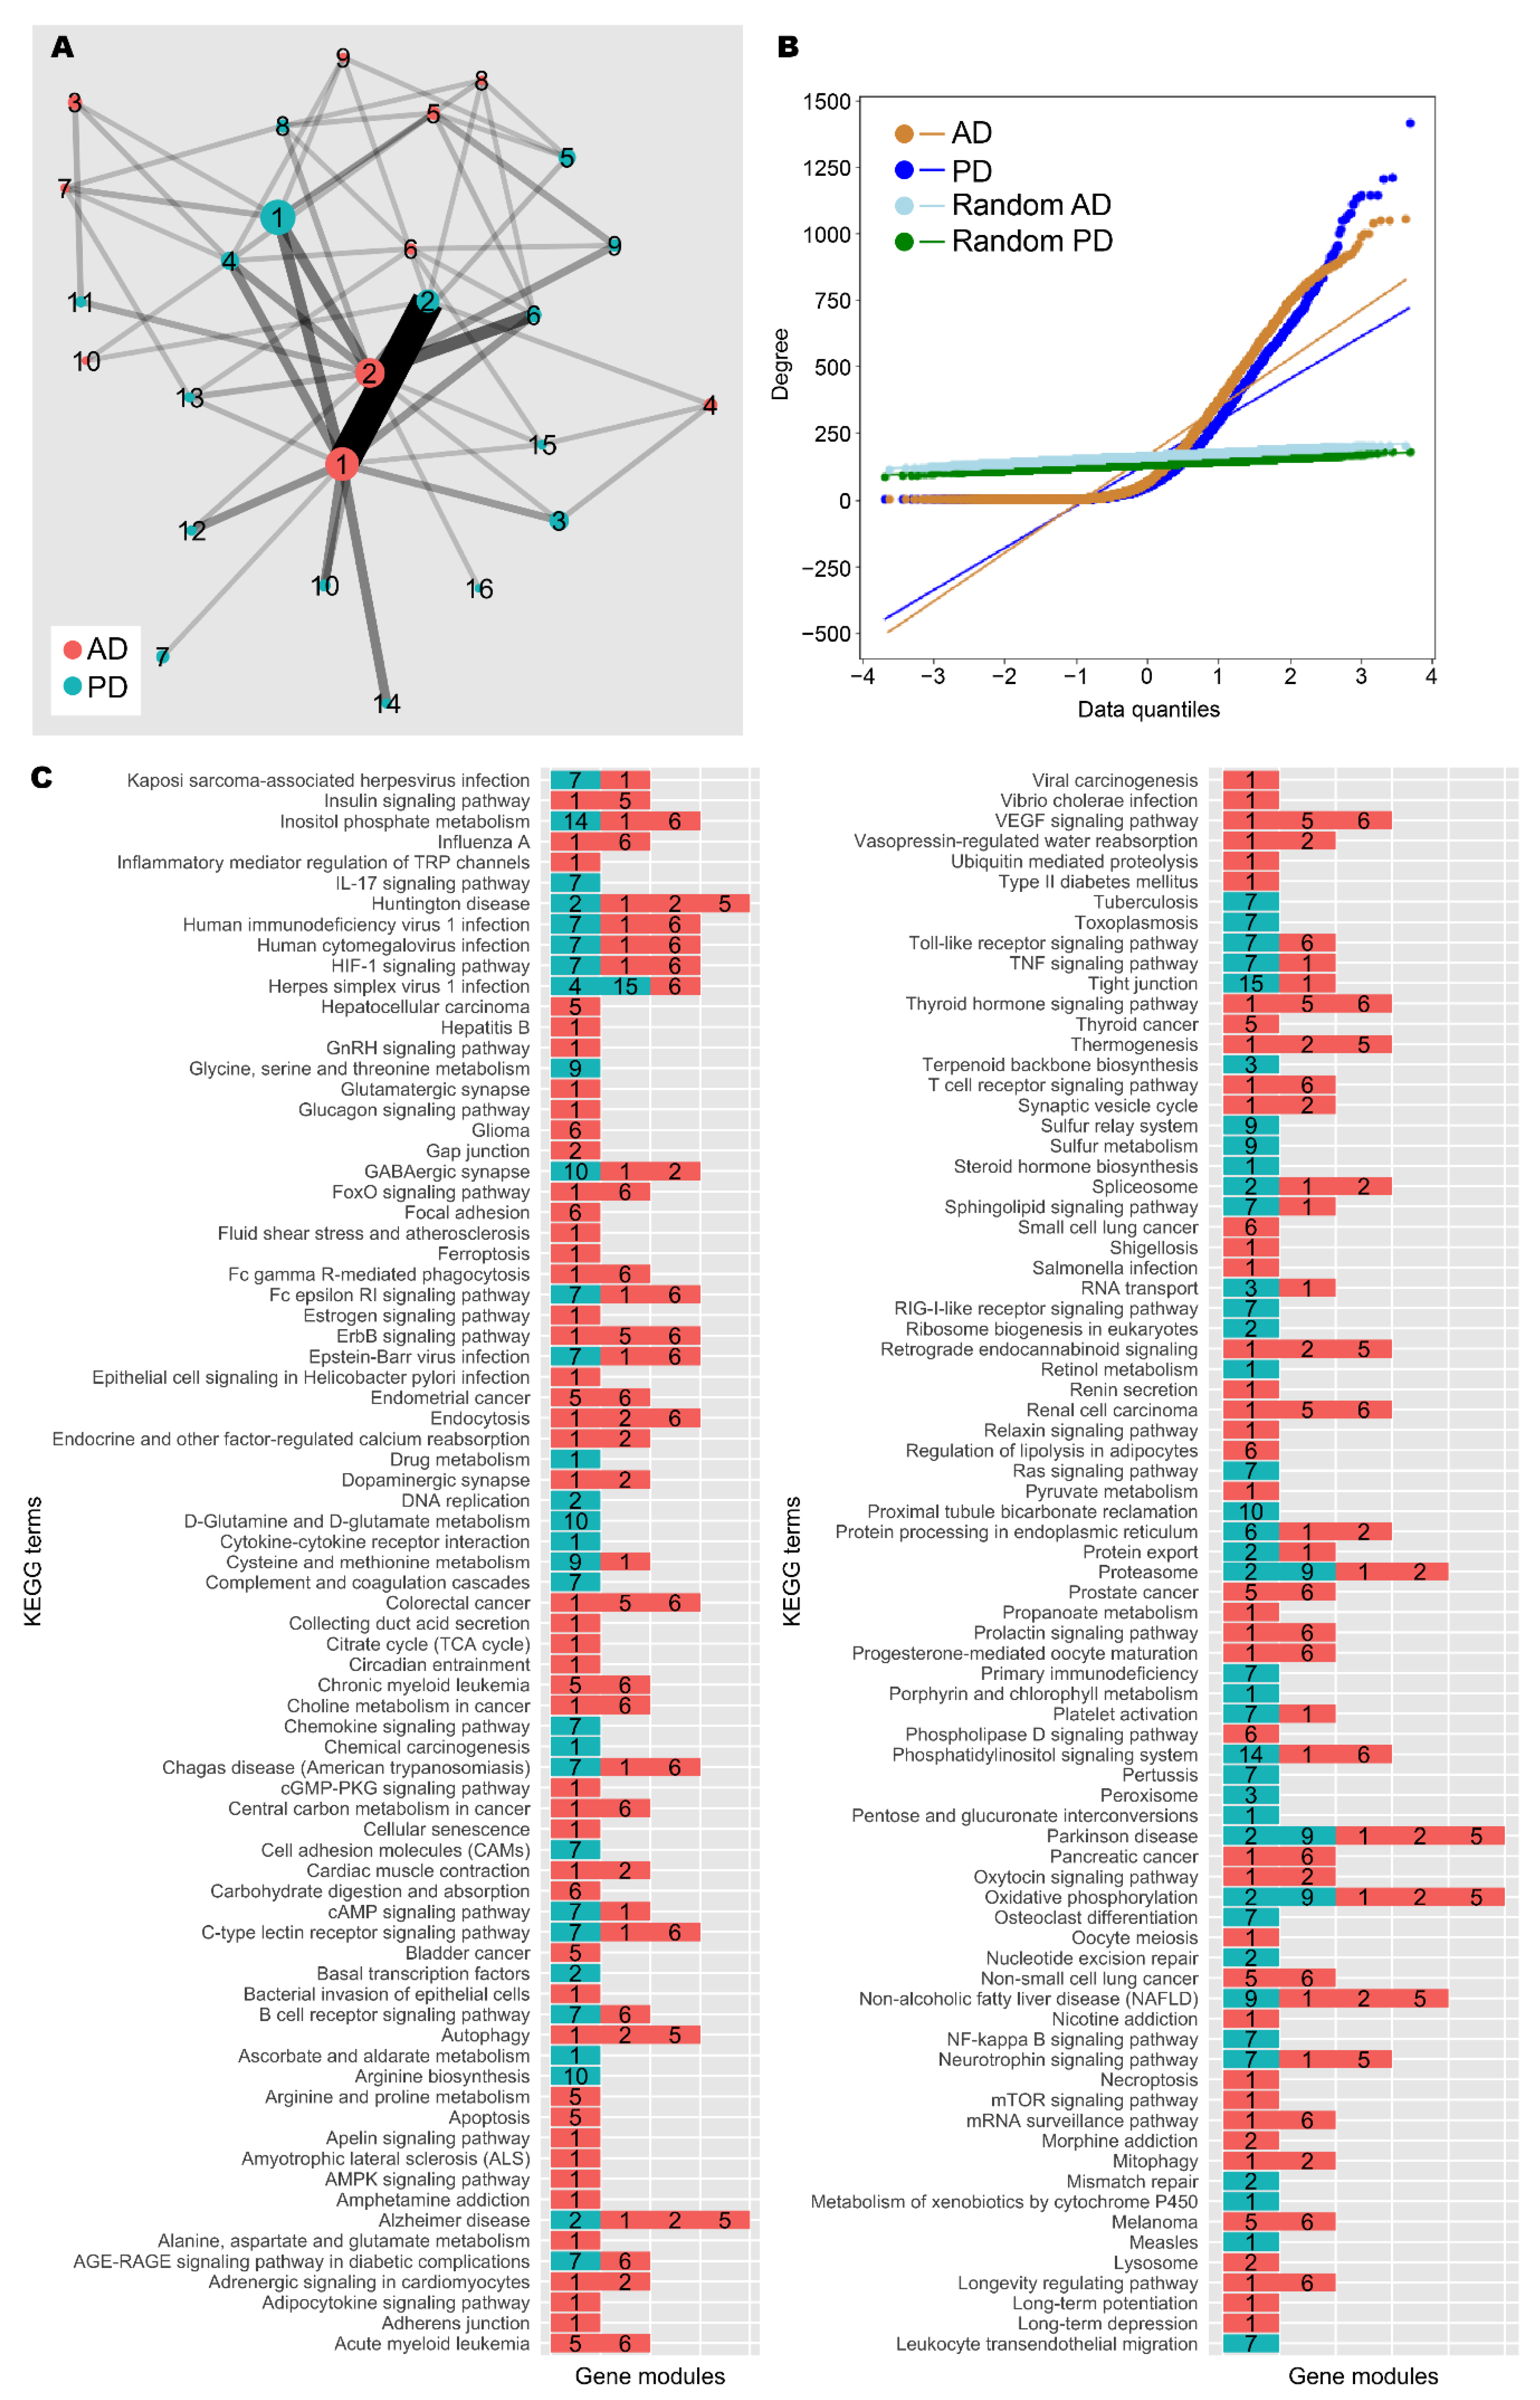
3.3. Network Analysis Supported Retinoid and Androgen Dysregulation and Suggests Transcriptomic Similarity between AD and PD

To further explore the gene expression patterns shown across AD and PD patients, we took expression data and constructed a weighted gene co-expression network for each group (Spearman ρ > 0.9, FDR < 10−9; see the Materials and Methods section). Each network was compared against equivalent randomly generated networks acting as null models. After quality control, the AD network contained 4861 nodes (genes) and ≈397,000 edges (significant correlations), and the PD network contained 5857 nodes and ≈394,000 edges (Figure 4A,B, Table 4). A community analysis to identify modules of highly co-expressed genes [54] highlighted 9 and 15 communities with significant functional enrichment in AD and PD, respectively.
In the AD network, gene module C3 was enriched for genes involved with neuron and synapse development, similar to patient cluster 3; C4 for genes involved with mRNA splicing, similar to patient cluster 2; and C5 for genes involved with the mitochondrial electron transport chain (Figure 4C, Supplementary Data S4). C1 and C2 were the gene modules with the largest number of genes. C1 was enriched for gene expression quality control genes and development and morphogenesis genes, mirroring patient cluster 2, whereas C2 contained cytoskeleton-related genes, similar to patient cluster 1.
In the PD network, C1 was enriched for genes involved with retinoid metabolism, glucuronidation, and cytokine signalling. Since androgens are major targets of glucuronidation [62], these results are in line with our main findings. Further, C2 contained DNA damage response and gene regulation genes, similar to patient cluster 2; C3 contained nuclear protein regulation genes; and C4 contained mRNA splicing genes, again similar to patient cluster 2.
Further, the two networks share a large number of enriched terms in common, and there is high similarity between the major gene modules, highlighting the similarity between AD and PD. In addition to this, enrichment analysis for KEGG terms was unable to assign “Alzheimer disease” and “Parkinson disease” to the correct gene modules from the respective networks, and additional neurological disease terms such as “Huntington disease” and “amyotrophic lateral sclerosis” were also identified by the analysis, further suggesting the transcriptomic similarity between neurological diseases. We found that AD C1 and PD C2 were frequently annotated with these disease terms, and these gene modules are also highly similar. Therefore, this gene module could constitute a core set of dysregulated genes in neurodegeneration.
Taken together, the network analysis supports our GSE findings. The functional consequences of differential expression in the patient clusters could be explained by differential modulation of gene modules identified in our network analysis together with dysregulation of a core set of genes implicated in both AD and PD.

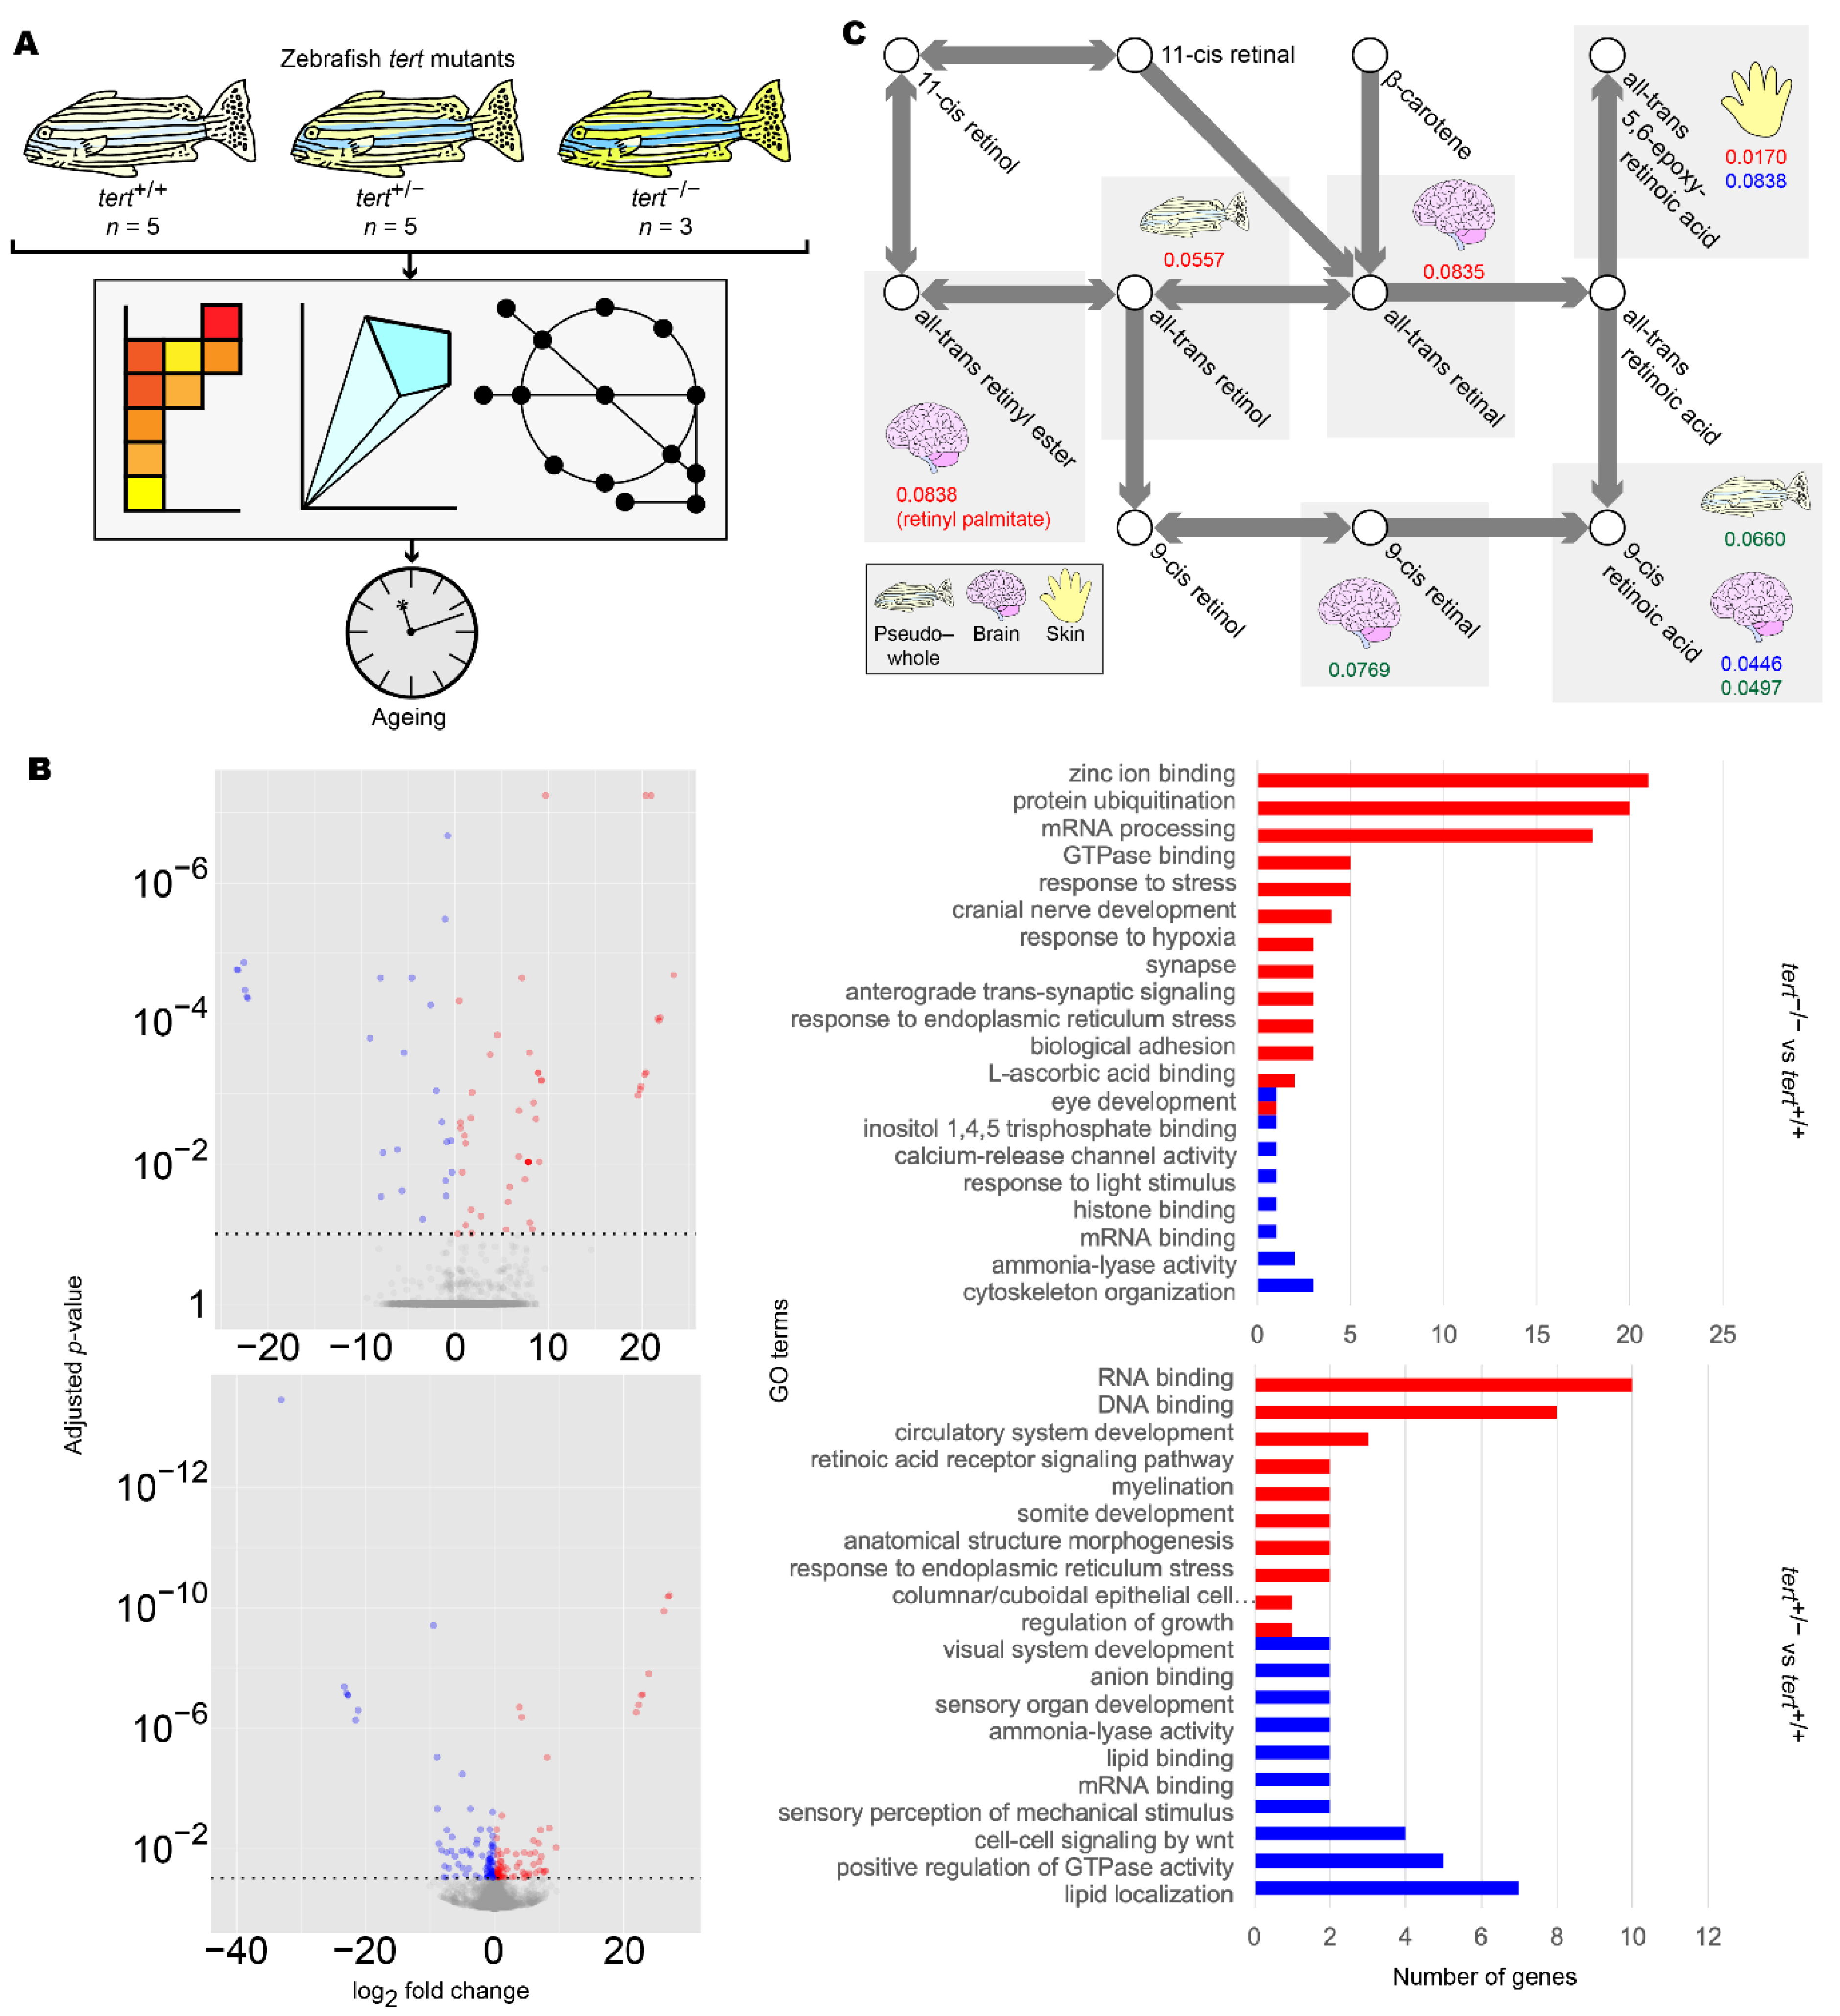
3.4. Zebrafish Transcriptomic and Metabolic Investigations Suggest an Association between Brain Ageing and Retinoid Dysregulation

To further validate our findings regarding the differences between clusters of human AD and PD samples, we analysed transcriptomic data from tert mutant zebrafish and reconstructed tissue-specific GEMs (Figure 5A). To ascertain that these effects of ageing were limited to the brain, we analysed the brain, liver, muscle, and skin of zebrafish as well as the whole animal.
We first repeated DEG and GSE analyses in the tert mutants using brain transcriptomic data. We found significant enrichment of GO terms associated with retinoid metabolism as well as eye development and light sensing, in which retinoids act as signalling molecules [63] (Figure 5B and Figure S3, Supplementary Data S5). To further support our findings, we then reconstructed mutant- and genotype-specific GEMs by overlaying zebrafish tert mutant transcriptomic data onto a modified generic ZebraGEM2 GEM [64]. We designated the modified GEM ZebraGEM2.1 (Supplementary File S3) and used it as the reference GEM. We also generated zebrafish organ-specific GEMs and provided them to the interested reader (Supplementary File S4).
We then repeated reporter metabolite analysis using the transcriptomic data from zebrafish tissue-specific GEMs and found that retinoids were identified as significant reporter metabolites in tert+/− zebrafish (p = 0.045) but not in tert−/−, where evidence was marginal (p = 0.084) (Figure 5C, Table 5, Supplementary Data S6). We also observed this result in the skin of tert-/- mutants, where evidence was significant (p = 0.017). This result can be explained due to the susceptibility of skin as an organ to photoageing, for which topical application of retinol is a widely used treatment [65]. However, we did not find evidence for significant changes in pregnanediol, and androsterone was significant only in the skin of tert−/− zebrafish (p = 0.017). This would suggest that either change in sex hormones are not ageing-related with regards AD and PD, or the changes were outside the scope of the zebrafish model that we used.
Taken together, these results indicated that ageing can largely explain alterations in retinoid metabolism in the brain but not alterations in sex hormone metabolism. These results also suggest that ageing has a differential effect on different organs, implying that metabolic changes due to ageing in the brain are associated with neurological disorders.

4. Discussion

In this work, we integrated gene expression data across diverse sources into context-specific GEMs and sought to identify and characterise disease subclasses of AD and PD. We used unsupervised clustering to identify AD/PD subclasses and employed DEG and GSE analysis to functionally characterise them. We used network exploration, constraint-based metabolic modelling, and reporter metabolite analysis to characterise flux and metabolic perturbations within basal metabolic functions and pathways. We then leveraged expression data from zebrafish ageing mutants to validate our findings that these perturbations might be explained by ageing. Our analysis concluded with the identification and characterisation of three AD/PD subclasses, each with distinct functional characteristics and metabolic profiles. All three subclasses showed depletion of retinoids by an ageing-related mechanism as a common characteristic.
We believe that a combined analysis that integrates AD and PD data is necessary to elucidate common attributes between the two diseases. However, we realised that such an analysis will likely obscure AD- and PD-specific factors, such as amyloid β and α-synuclein, but should aid the discovery of any factors in common. Since AD and PD share numerous risk factors and comorbidities such as old age, diabetes, and cancer risk, we believe that an AD/PD combined analysis can identify factors in common to both diseases and prove valuable for the identification of treatment strategies that might be effective in the treatment of both diseases.
GSE analysis highlighted significant changes related to retinoid function or visual system function, in which retinol and retinal act as signalling molecules [63], in all clusters (Figure 2, Supplementary Data S1). Together with the identification of multiple retinol derivatives as significant reporter metabolites in iBrain2845 (Table 3, Supplementary Data S3), we hypothesised that retinoids are a commonly dysregulated class of molecules in both AD and PD, and that this may be due to an ageing mechanism. Indeed, in our investigation with zebrafish telomerase mutants, we again found alterations in retinoid and visual system function in GSE analysis (Figure 5B and Figure S3, Supplementary Data S5) and reporter metabolite analysis (Figure 5C, Table 5, Supplementary Data S6).
Retinoids were identified as a reporter metabolite in all three clusters of patients in this study. Further, our zebrafish analysis highlighted the importance of retinoids in ageing of the brain and the skin (Figure 5C, Table 5, Supplementary Data S6). Retinol, its derivatives, and its analogues are already used as topical anti-ageing therapies for aged skin [65], and there is a growing body of evidence suggesting its efficacy for the treatment of AD [66,67,68,69]. We add to the body of evidence with this in silico investigation involving zebrafish telomerase mutants, suggesting that the source of retinoid depletion in AD and PD is ageing-related. Interestingly, regarding our finding for skin ageing in zebrafish, lipid biomarkers have been proposed in a recent skin sebum metabolomics study in PD patients [70]. This could be interpreted as co-ageing in brain and skin tissues, possibly allowing for cheap, non-invasive prognostic testing for PD.
In addition to retinoids, we found evidence for subclass-specific dysregulation within the androgen metabolism pathway in each of the three clusters in FBA (Table 2, Supplementary Data S2) and reporter metabolite analysis (Table 3, Supplementary Data S3). We found that iADPD1 displayed increased oestrone conversion to the less potent [71] 2-methoxyoestrone, iADPD2 displayed increased production of the cholesterol precursor molecules geranyl pyrophosphate and lathosterol and increased androgen biosynthesis, and iADPD3 displayed decreased conversion of 4-androstene-3,17-dione to testosterone. However, there was no definitive evidence to suggest an ageing-related basis for these observations on the basis of our zebrafish study, but this may be due to the diverse functional roles that sex hormones have, limitations within the ZebraGEM2.1 model, or absence of an actual biological link between sex hormones and ageing of the brain. Despite this, given the widely reported variability in responses to sex hormone replacement therapy in AD and PD [6,8,60,61], we believe that this observation represents a possible explanation for the heterogeneity. Our observation regarding the dysregulation of the androgen pathway at three separate points suggests that dysregulation at other points might also be linked to AD and PD, thus implying that androgen metabolism dysregulation in general might be important for the development of AD and PD. Our finding via network community analysis of a gene module associated with glucuronidation activity points to a possible therapeutic strategy to combat androgen dysregulation. In our study, the limitation of our dataset that some samples were aggregate samples or did not record the donor’s sex meant that we were unable to assess in detail the sex-dependency of our results. However, as has been extensively studied in the AD model mouse [72,73,74], this remains an important question, and more work is needed to elucidate the importance of sex hormones and glucuronidation regarding AD and PD.
Identification of subclasses is desirable to address the heterogeneity in disease with regards transcriptomic profile and treatment response, but patients must be stratified in order to be diagnosed with the correct disease subclass and therefore administer the appropriate treatment. To this end, we used GSE analysis to functionally characterise the AD/PD subclasses (Figure 2, Supplementary Data S1). Cluster 2, which was associated with a decreased immune and stress response, appeared to be most severe disease subclass, whereas cluster 3, which was associated with an increased sensory perception of smell, reduced haemostasis, and reduced immune and DNA damage response, seemed to be the least severe. Meanwhile, cluster 1 was associated with an increased immune and inflammatory responses and reduced sensory perception of smell. The functional terms are supported by community analysis of our AD and PD gene co-expression networks, which identified gene modules that roughly align with the GSE results (Figure 4, Supplementary Data S4). The proposed severity ratings are supported by FBA findings, which show iADPD2 as having the highest total flux dysregulation compared to control, and iADPD3 as having the least (Table 2, Supplementary Data S2). Although we did not attempt to characterise for stratifying and diagnosing patients in our study, our findings clearly show that such stratification is possible.
In this work, we leveraged samples from zebrafish telomerase mutants and insights from the ZebraGEM2.1 metabolic model. These models were utilised in order to test the hypothesis that the observations we made in the human subjects could be explained by telomeric ageing in a way where we could control the ‘dosage’ of ageing, i.e., tert+/− and tert−/− mutants. However, it is important to acknowledge the limitations of such models. Although zebrafish are a widely used model organism to study vertebrate ageing [22], most neurons of the brain do not divide and are therefore not likely to be subject to the direct effects of telomeric ageing. Therefore, we cannot conclude that the dysregulations we observed in AD and PD were caused by ageing of neurons per se, but rather correlations exist between telomeric ageing in zebrafish and AD and PD in humans, and these correlations may act via an indirect mechanism affecting multiple systems of the ageing organism. Due to these limitations, more data and more studies are required to support the link between ageing and neuronal degeneration in AD and PD. The basic requirement of such studies would be brain tissue from donors of a wide range of ages. In our study, we utilised datasets containing aggregated samples, where age cannot be assigned, and samples from age-matched donors, meaning that younger donors were poorly represented in our data, making it unsuitable for an ageing analysis.
In conclusion, we report three distinct subclasses of AD and PD. The first subclass was identified as being associated with increased immune response, inflammatory response, and reduced sensory perception of smell, according to GSE results. We observed that this subclass exhibited increased oestradiol turnover, according to FBA results. The second subclass was linked with increased cholesterol biosynthesis and general increased flux through the androgen biosynthesis and metabolism pathway. This subclass was characterised by reduced immune response. The third subclass was characterised by enrichment of GO terms indicating increased sensory perception of smell, reduced haemostasis, and reduced immune and DNA damage response. This subclass also exhibited reduced testosterone biosynthesis from androstenedione, as determined by FBA. All subclasses exhibited dysregulation within the retinoid metabolism pathway. For all subclasses of AD and PD, more investigation is required to verify the effectiveness of these stratification methods and to aid prediction of effective precision therapies. To our knowledge, this is the first meta-analysis at this scale highlighting the potential significance of retinoids, oestradiol, and testosterone in AD and PD by studying the two diseases in combination. We observed that the existence of disease subclasses demands precision or personalised medicine and explains the heterogeneity in AD and PD response to single-factor treatments.

Supplementary Materials

The following are available online at https://www.mdpi.com/article/10.3390/biomedicines9101310/s1, Figure S1: Unsupervised clustering of AD and PD samples, Figure S2: Visualisation of AD and PD samples, Figure S3: Transcriptomic and functional characterisation of zebrafish tert mutants, Supplementary File S1: iBrain2845 genome-scale metabolic model, Supplementary File S2: iADPD-series context-specific genome-scale metabolic models, Supplementary File S3: ZebraGEM2.1 genome-scale metabolic model, Supplementary File S4: Zebrafish context-specific genome-scale metabolic models, Supplementary Data S1: Gene set enrichment analysis results for AD and PD subclasses, Supplementary Data S2: Flux balance analysis results for iADPD-series genome-scale metabolic models, Supplementary Data S3: Reporter metabolite analysis results for AD and PD subclasses, Supplementary Data S4: Network analysis results for AD and PD samples, Supplementary Data S5: Gene set enrichment analysis results for zebrafish tert mutants, Supplementary Data S6: Reporter metabolite analysis results for zebrafish tert mutants.

Author Contributions

A.M. and M.U. supervised the study and designed the study on human data. R.K. and C.E. designed the study on zebrafish. N.H. performed the zebrafish RNA sequencing and generated the raw counts. With the exception of the network analysis, S.L. performed all in silico analysis and M.A., R.B. and C.Z. provided technical consultation. R.B. performed the network analysis. S.L. analysed all the results. S.L. wrote the manuscript with input from H.T. and the rest of the authors. All authors have read and agreed to the published version of the manuscript.

Funding

This work was supported by the German Ministry for Education and Research within the framework of the GerontoSys initiative (research core JenAge, funding code BMBF 0315581) to C.E.; and the Knut and Alice Wallenberg Foundation (grant number 2017.0303) to A.M.

Institutional Review Board Statement

All animal procedures were performed in accordance with the German animal welfare guidelines and approved by the Landesamt für Verbraucherschutz Thüringen (TLV), Germany.

Informed Consent Statement

Not applicable.

Data Availability Statement

All original computer code, models, and author-curated data files have been released under a Creative Commons Attribution ShareAlike 4.0 International Licence (https://creativecommons.org/licenses/by-sa/4.0/) and are freely available for download from <https://github.com/SimonLammmm/ad-pd-retinoid>. Zebrafish tert mutant sequencing data have been deposited in the NCBI Gene Expression Omnibus (GEO) and are accessible through GEO Series accession numbers GSE102426, GSE102429, GSE102431, and GSE102434.

Acknowledgments

We are grateful to Catarina Henriques and Miguel Godinho Ferreira for sharing the tert mutant zebrafish line. We also thank Ivonne Heinze, Ivonne Görlich, and Marco Groth from the FLI sequencing facility for sequencing the zebrafish samples. The authors acknowledge use of the research computing facility at King’s College London, Rosalind (https://rosalind.kcl.ac.uk; accessed on 17 July 2019). The Genotype-Tissue Expression (GTEx) Project was supported by the Common Fund of the Office of the Director of the National Institutes of Health, and by NCI, NHGRI, NHLBI, NIDA, NIMH, and NINDS. The data used for the analyses described in this manuscript were obtained from the GTEx Portal on 6 December 2019. The results published here are in part based on data obtained from the AD Knowledge Portal (https://adknowledgeportal.synapse.org; accessed on 1 October 2020). Study data were provided by the Rush Alzheimer’s Disease Center, Rush University Medical Center, Chicago. Data collection was supported through funding by NIA grants P30AG10161 (ROS), R01AG15819 (ROSMAP; genomics and RNAseq), R01AG17917 (MAP), R01AG30146, R01AG36042 (5hC methylation, ATACseq), RC2AG036547 (H3K9Ac), R01AG36836 (RNAseq), R01AG48015 (monocyte RNAseq), RF1AG57473 (single nucleus RNAseq), U01AG32984 (genomic and whole exome sequencing), U01AG46152 (ROSMAP AMP-AD, targeted proteomics), U01AG46161(TMT proteomics), U01AG61356 (whole genome sequencing, targeted proteomics, ROSMAP AMP-AD), the Illinois Department of Public Health (ROSMAP), and the Translational Genomics Research Institute (genomic). Additional phenotypic data can be requested at www.radc.rush.edu; accessed on 1 October 2020). We thank the patients and their families for their selfless donation to further understanding Alzheimer’s disease. This project was supported by funding from the National Institute on Aging (AG034504 and AG041232). Many data and biomaterials were collected from several National Institute on Aging (NIA) and National Alzheimer’s Coordinating Center (NACC, grant #U01 AG016976) funded sites. Amanda J. Myers, PhD (University of Miami, Department of Psychiatry), prepared the series. The directors, pathologist and technicians involved include Rush University Medical Center; Rush Alzheimer’s Disease Center (NIH #AG10161); David A. Bennett, M.D.; Julie A. Schneider, MD, MS; Karen Skish, MS, PA (ASCP) MT; Wayne T Longman. The Rush portion of this study was supported by National Institutes of Health grants P30AG10161, R01AG15819, R01AG17917, R01AG36042, R01AG36836, U01AG46152, R01AG34374, R01NS78009, U18NS82140, R01AG42210, and R01AG39478, and the Illinois Department of Public Health. Quality control checks and preparation of the gene expression data was provided by the National Institute on Aging Alzheimer’s Disease Data Storage Site (NIAGADS, U24AG041689) at the University of Pennsylvania.

Conflicts of Interest

The authors declare no competing financial interests.

Abbreviations

AD, Alzheimer’s disease; DEG, differentially expressed gene; FANTOM5, Functional Annotation of the Mammalian Genome 5; FBA, flux balance analysis; GEM, genome-scale metabolic model; GO, Gene Ontology; GSE, gene set enrichment; GTEx, Genotype-Tissue Expression; HuRI, Human Reference Protein Interactome; HPA, Human Protein Atlas; PD, Parkinson’s disease; ROSMAP, Religious Orders Study and Rush Memory Aging Project.

References

  1. Liberini, P.; Valerio, A.; Memo, M.; Spano, P.F. Lewy-Body Dementia and Responsiveness to Cholinesterase Inhibitors: A Paradigm for Heterogeneity of Alzheimer’s Disease? Trends Pharmacol. Sci. 1996, 17, 155–160. [Google Scholar] [CrossRef]
  2. Wijemanne, S.; Jankovic, J. Dopa-Responsive Dystonia—Clinical and Genetic Heterogeneity. Nat. Rev. Neurol. 2015, 11, 414–424. [Google Scholar] [CrossRef] [PubMed]
  3. Long, J.M.; Holtzman, D.M. Alzheimer Disease: An Update on Pathobiology and Treatment Strategies. Cell 2019, 179, 312–339. [Google Scholar] [CrossRef] [PubMed]
  4. Greenland, J.C.; Williams-Gray, C.H.; Barker, R.A. The Clinical Heterogeneity of Parkinson’s Disease and Its Therapeutic Implications. Eur. J. Neurosci. 2019, 49, 328–338. [Google Scholar] [CrossRef]
  5. Tanaka, M.; Toldi, J.; Vécsei, L. Exploring the Etiological Links behind Neurodegenerative Diseases: Inflammatory Cytokines and Bioactive Kynurenines. Int. J. Mol. Sci. 2020, 21, 2431. [Google Scholar] [CrossRef] [Green Version]
  6. Baum, L.W. Sex, Hormones, and Alzheimer’s Disease. J. Gerontol. Ser. A Biol. Sci. Med Sci. 2005, 60, 736–743. [Google Scholar] [CrossRef] [PubMed] [Green Version]
  7. Meoni, S.; Macerollo, A.; Moro, E. Sex Differences in Movement Disorders. Nat. Rev. Neurol. 2020, 16, 84–96. [Google Scholar] [CrossRef]
  8. Shepardson, N.E.; Shankar, G.M.; Selkoe, D.J. Cholesterol Level and Statin Use in Alzheimer Disease: I. Review of Epidemiological and Preclinical Studies. Arch. Neurol. 2011, 68, 1239–1244. [Google Scholar] [CrossRef] [Green Version]
  9. Jeong, S.M.; Jang, W.; Shin, D.W. Association of Statin Use with Parkinson’s Disease: Dose–Response Relationship. Mov. Disord. 2019, 34, 1014–1021. [Google Scholar] [CrossRef]
  10. Lam, S.; Bayraktar, A.; Zhang, C.; Turkez, H.; Nielsen, J.; Boren, J.; Shoaie, S.; Uhlen, M.; Mardinoglu, A. A Systems Biology Approach for Studying Neurodegenerative Diseases. Drug Discov. Today 2020, 25, 1146–1159. [Google Scholar] [CrossRef]
  11. Mardinoglu, A.; Boren, J.; Smith, U.; Uhlen, M.; Nielsen, J. Systems Biology in Hepatology: Approaches and Applications. Nat. Rev. Gastroenterol. Hepatol. 2018, 15, 365–377. [Google Scholar] [CrossRef]
  12. Lam, S.; Doran, S.; Yuksel, H.H.; Altay, O.; Turkez, H.; Nielsen, J.; Boren, J.; Uhlen, M.; Mardinoglu, A. Addressing the Heterogeneity in Liver Diseases Using Biological Networks. Brief. Bioinform. 2021, 22, 1751–1766. [Google Scholar] [CrossRef]
  13. Altay, O.; Nielsen, J.; Uhlen, M.; Boren, J.; Mardinoglu, A. Systems Biology Perspective for Studying the Gut Microbiota in Human Physiology and Liver Diseases. EBioMedicine 2019, 49, 364–373. [Google Scholar] [CrossRef] [Green Version]
  14. Joshi, A.; Rienks, M.; Theofilatos, K.; Mayr, M. Systems Biology in Cardiovascular Disease: A Multiomics Approach. Nat. Rev. Cardiol. 2020, 18, 313–330. [Google Scholar] [CrossRef]
  15. De La Monte, S.M.; Wands, J.R. Alzheimer’s Disease Is Type 3 Diabetes-Evidence Reviewed. J. Diabetes Sci. Technol. 2008, 2, 1101–1113. [Google Scholar] [CrossRef] [Green Version]
  16. Stampfer, M.J. Cardiovascular Disease and Alzheimer’s Disease: Common Links. J. Intern. Med. 2006, 260, 211–223. [Google Scholar] [CrossRef]
  17. Driver, J.A.; Beiser, A.; Au, R.; Kreger, B.E.; Splansky, G.L.; Kurth, T.; Kiel, D.P.; Lu, K.P.; Seshadri, S.; Wolf, P.A. Inverse Association between Cancer and Alzheimer’s Disease: Results from the Framingham Heart Study. BMJ (Online) 2012, 344, e1442. [Google Scholar] [CrossRef] [Green Version]
  18. Bajaj, A.; Driver, J.A.; Schernhammer, E.S. Parkinson’s Disease and Cancer Risk: A Systematic Review and Meta-Analysis. Cancer Causes Control 2010, 21, 697–707. [Google Scholar] [CrossRef]
  19. Sengoku, R. Aging and Alzheimer’s Disease Pathology. Neuropathology 2020, 40, 22–29. [Google Scholar] [CrossRef]
  20. Hindle, J.V. Ageing, Neurodegeneration and Parkinson’s Disease. Age Ageing 2010, 39, 156–161. [Google Scholar] [CrossRef] [Green Version]
  21. Chakravarti, D.; LaBella, K.A.; DePinho, R.A. Telomeres: History, Health, and Hallmarks of Aging. Cell 2021, 184, 306–322. [Google Scholar] [CrossRef]
  22. Carneiro, M.C.; De Castro, I.P.; Ferreira, M.G. Telomeres in Aging and Disease: Lessons from Zebrafish. DMM Dis. Models Mech. 2016, 9, 737–748. [Google Scholar] [CrossRef] [Green Version]
  23. Anchelin, M.; Alcaraz-Pérez, F.; Martínez, C.M.; Bernabé-García, M.; Mulero, V.; Cayuela, M.L. Premature Aging in Telomerase-Deficient Zebrafish. DMM Dis. Models Mech. 2013, 6, 1101–1112. [Google Scholar] [CrossRef] [PubMed] [Green Version]
  24. Henriques, C.M.; Carneiro, M.C.; Tenente, I.M.; Jacinto, A.; Ferreira, M.G. Telomerase Is Required for Zebrafish Lifespan. PLoS Genet. 2013, 9, 1003214. [Google Scholar] [CrossRef] [Green Version]
  25. Lonsdale, J.; Thomas, J.; Salvatore, M.; Phillips, R.; Lo, E.; Shad, S.; Hasz, R.; Walters, G.; Garcia, F.; Young, N.; et al. GTEx Consortium The Genotype-Tissue Expression (GTEx) Project. Nat. Genet. 2013, 45, 580–585. [Google Scholar] [CrossRef] [PubMed]
  26. Forrest, A.R.R.; Kawaji, H.; Rehli, M.; Baillie, J.K.; De Hoon, M.J.L.; Haberle, V.; Lassmann, T.; Kulakovskiy, I.V.; Lizio, M.; Itoh, M.; et al. A Promoter-Level Mammalian Expression Atlas. Nature 2014, 507, 462–470. [Google Scholar] [CrossRef] [PubMed] [Green Version]
  27. Lizio, M.; Harshbarger, J.; Shimoji, H.; Severin, J.; Kasukawa, T.; Sahin, S.; Abugessaisa, I.; Fukuda, S.; Hori, F.; Ishikawa-Kato, S.; et al. Gateways to the FANTOM5 Promoter Level Mammalian Expression Atlas. Genome Biol. 2015, 16, 22. [Google Scholar] [CrossRef] [Green Version]
  28. Lizio, M.; Abugessaisa, I.; Noguchi, S.; Kondo, A.; Hasegawa, A.; Hon, C.C.; De Hoon, M.; Severin, J.; Oki, S.; Hayashizaki, Y.; et al. Update of the FANTOM Web Resource: Expansion to Provide Additional Transcriptome Atlases. Nucleic Acids Res. 2019, 47, D752–D758. [Google Scholar] [CrossRef] [Green Version]
  29. Marbach, D.; Lamparter, D.; Quon, G.; Kellis, M.; Kutalik, Z.; Bergmann, S. Tissue-Specific Regulatory Circuits Reveal Variable Modular Perturbations across Complex Diseases. Nat. Methods 2016, 13, 366–370. [Google Scholar] [CrossRef] [Green Version]
  30. Luck, K.; Kim, D.-K.; Lambourne, L.; Spirohn, K.; Begg, B.E.; Bian, W.; Brignall, R.; Cafarelli, T.; Campos-Laborie, F.J.; Charloteaux, B.; et al. A Reference Map of the Human Protein Interactome. bioRxiv 2019. [Google Scholar] [CrossRef]
  31. Uhlén, M.; Fagerberg, L.; Hallström, B.M.; Lindskog, C.; Oksvold, P.; Mardinoglu, A.; Sivertsson, Å.; Kampf, C.; Sjöstedt, E.; Asplund, A.; et al. Tissue-Based Map of the Human Proteome. Science 2015, 347, 1260419. [Google Scholar] [CrossRef]
  32. Mostafavi, S.; Gaiteri, C.; Sullivan, S.E.; White, C.C.; Tasaki, S.; Xu, J.; Taga, M.; Klein, H.U.; Patrick, E.; Komashko, V.; et al. A Molecular Network of the Aging Human Brain Provides Insights into the Pathology and Cognitive Decline of Alzheimer’s Disease. Nat. Neurosci. 2018, 21, 811–819. [Google Scholar] [CrossRef]
  33. Myers, A.J.; Gibbs, J.R.; Webster, J.A.; Rohrer, K.; Zhao, A.; Marlowe, L.; Kaleem, M.; Leung, D.; Bryden, L.; Nath, P.; et al. A Survey of Genetic Human Cortical Gene Expression. Nat. Genet. 2007, 39, 1494–1499. [Google Scholar] [CrossRef] [PubMed]
  34. Webster, J.A.; Gibbs, J.R.; Clarke, J.; Ray, M.; Zhang, W.; Holmans, P.; Rohrer, K.; Zhao, A.; Marlowe, L.; Kaleem, M.; et al. Genetic Control of Human Brain Transcript Expression in Alzheimer Disease. Am. J. Hum. Genet. 2009, 84, 445–458. [Google Scholar] [CrossRef] [PubMed] [Green Version]
  35. Rajkumar, A.P.; Bidkhori, G.; Shoaie, S.; Clarke, E.; Morrin, H.; Hye, A.; Williams, G.; Ballard, C.; Francis, P.; Aarsland, D. Postmortem Cortical Transcriptomics of Lewy Body Dementia Reveal Mitochondrial Dysfunction and Lack of Neuroinflammation. Am. J. Geriatr. Psychiatry 2020, 28, 75–86. [Google Scholar] [CrossRef]
  36. Zhang, Y.; James, M.; Middleton, F.A.; Davis, R.L. Transcriptional Analysis of Multiple Brain Regions in Parkinson’s Disease Supports the Involvement of Specific Protein Processing, Energy Metabolism, and Signaling Pathways, and Suggests Novel Disease Mechanisms. Am. J. Med. Genet. Neuropsychiatr. Genet. 2005, 137 B, 5–16. [Google Scholar] [CrossRef]
  37. Zheng, B.; Liao, Z.; Locascio, J.J.; Lesniak, K.A.; Roderick, S.S.; Watt, M.L.; Eklund, A.C.; Zhang-James, Y.; Kim, P.D.; Hauser, M.A.; et al. PGC-1α, a Potential Therapeutic Target for Early Intervention in Parkinson’s Disease. Sci. Transl. Med. 2010, 2, 52ra73. [Google Scholar] [CrossRef] [Green Version]
  38. Bray, N.L.; Pimentel, H.; Melsted, P.; Pachter, L. Near-Optimal Probabilistic RNA-Seq Quantification. Nat. Biotechnol. 2016, 34, 525–527. [Google Scholar] [CrossRef]
  39. Yates, A.D.; Achuthan, P.; Akanni, W.; Allen, J.; Allen, J.; Alvarez-Jarreta, J.; Amode, M.R.; Armean, I.M.; Azov, A.G.; Bennett, R.; et al. Ensembl 2020. Nucleic Acids Res. 2020, 48, D682–D688. [Google Scholar] [CrossRef]
  40. Ritchie, M.E.; Phipson, B.; Wu, D.; Hu, Y.; Law, C.W.; Shi, W.; Smyth, G.K. Limma Powers Differential Expression Analyses for RNA-Sequencing and Microarray Studies. Nucleic Acids Res. 2015, 43, e47. [Google Scholar] [CrossRef]
  41. Van Der Maaten, L.; Hinton, G. Visualizing Data Using T-SNE. J. Mach. Learn. Res. 2008, 9, 2579–2625. [Google Scholar]
  42. McInnes, L.; Healy, J.; Saul, N.; Großberger, L. UMAP: Uniform Manifold Approximation and Projection. J. Open Source Softw. 2018, 3, 861. [Google Scholar] [CrossRef]
  43. van Dijk, D.; Sharma, R.; Nainys, J.; Yim, K.; Kathail, P.; Carr, A.J.; Burdziak, C.; Moon, K.R.; Chaffer, C.L.; Pattabiraman, D.; et al. Recovering Gene Interactions from Single-Cell Data Using Data Diffusion. Cell 2018, 174, 716–729.e27. [Google Scholar] [CrossRef] [PubMed] [Green Version]
  44. Wilkerson, M.D.; Hayes, D.N. ConsensusClusterPlus: A Class Discovery Tool with Confidence Assessments and Item Tracking. Bioinformatics 2010, 26, 1572–1573. [Google Scholar] [CrossRef] [Green Version]
  45. Love, M.I.; Huber, W.; Anders, S. Moderated Estimation of Fold Change and Dispersion for RNA-Seq Data with DESeq2. Genome Biol. 2014, 15, 550. [Google Scholar] [CrossRef] [PubMed] [Green Version]
  46. Väremo, L.; Nielsen, J.; Nookaew, I. Enriching the Gene Set Analysis of Genome-Wide Data by Incorporating Directionality of Gene Expression and Combining Statistical Hypotheses and Methods. Nucleic Acids Res. 2013, 41, 4378–4391. [Google Scholar] [CrossRef] [PubMed]
  47. Mardinoglu, A.; Agren, R.; Kampf, C.; Asplund, A.; Nookaew, I.; Jacobson, P.; Walley, A.J.; Froguel, P.; Carlsson, L.M.; Uhlen, M.; et al. Integration of Clinical Data with a Genome-Scale Metabolic Model of the Human Adipocyte. Mol. Syst. Biol. 2013, 9, 649. [Google Scholar] [CrossRef]
  48. Mardinoglu, A.; Agren, R.; Kampf, C.; Asplund, A.; Uhlen, M.; Nielsen, J. Genome-Scale Metabolic Modelling of Hepatocytes Reveals Serine Deficiency in Patients with Non-Alcoholic Fatty Liver Disease. Nat. Commun. 2014, 5, 3083. [Google Scholar] [CrossRef] [Green Version]
  49. Wang, H.; Marcišauskas, S.; Sánchez, B.J.; Domenzain, I.; Hermansson, D.; Agren, R.; Nielsen, J.; Kerkhoven, E.J. RAVEN 2.0: A Versatile Toolbox for Metabolic Network Reconstruction and a Case Study on Streptomyces Coelicolor. PLoS Comput. Biol. 2018, 14, e1006541. [Google Scholar] [CrossRef] [PubMed] [Green Version]
  50. Agren, R.; Bordel, S.; Mardinoglu, A.; Pornputtapong, N.; Nookaew, I.; Nielsen, J. Reconstruction of Genome-Scale Active Metabolic Networks for 69 Human Cell Types and 16 Cancer Types Using INIT. PLoS Comput. Biol. 2012, 8, e1002518. [Google Scholar] [CrossRef]
  51. Agren, R.; Mardinoglu, A.; Asplund, A.; Kampf, C.; Uhlen, M.; Nielsen, J. Identification of Anticancer Drugs for Hepatocellular Carcinoma through Personalized Genome-Scale Metabolic Modeling. Mol. Syst. Biol. 2014, 10, 721. [Google Scholar] [CrossRef]
  52. Baloni, P.; Funk, C.C.; Yan, J.; Yurkovich, J.T.; Kueider-Paisley, A.; Nho, K.; Heinken, A.; Jia, W.; Mahmoudiandehkordi, S.; Louie, G.; et al. Metabolic Network Analysis Reveals Altered Bile Acid Synthesis and Metabolism in Alzheimer’s Disease. Cell Rep. Med. 2020, 1, 100138. [Google Scholar] [CrossRef]
  53. Patil, K.R.; Nielsen, J. Uncovering Transcriptional Regulation of Metabolism by Using Metabolic Network Topology. Proc. Natl. Acad. Sci. USA 2005, 102, 2685–2689. [Google Scholar] [CrossRef] [PubMed] [Green Version]
  54. Traag, V.A.; Waltman, L.; van Eck, N.J. From Louvain to Leiden: Guaranteeing Well-Connected Communities. Sci. Rep. 2019, 9, 1–12. [Google Scholar] [CrossRef]
  55. Chen, E.Y.; Tan, C.M.; Kou, Y.; Duan, Q.; Wang, Z.; Meirelles, G.V.; Clark, N.R.; Ma’ayan, A. Enrichr: Interactive and Collaborative HTML5 Gene List Enrichment Analysis Tool. BMC Bioinform. 2013, 14, 128. [Google Scholar] [CrossRef] [PubMed] [Green Version]
  56. Kuleshov, M.V.; Jones, M.R.; Rouillard, A.D.; Fernandez, N.F.; Duan, Q.; Wang, Z.; Koplev, S.; Jenkins, S.L.; Jagodnik, K.M.; Lachmann, A.; et al. Enrichr: A Comprehensive Gene Set Enrichment Analysis Web Server 2016 Update. Nucleic Acids Res. 2016, 44, W90–W97. [Google Scholar] [CrossRef] [PubMed] [Green Version]
  57. Supek, F.; Bošnjak, M.; Škunca, N.; Šmuc, T. Revigo Summarizes and Visualizes Long Lists of Gene Ontology Terms. PLoS ONE 2011, 6, e21800. [Google Scholar] [CrossRef] [Green Version]
  58. Aramillo Irizar, P.; Schäuble, S.; Esser, D.; Groth, M.; Frahm, C.; Priebe, S.; Baumgart, M.; Hartmann, N.; Marthandan, S.; Menzel, U.; et al. Transcriptomic Alterations during Ageing Reflect the Shift from Cancer to Degenerative Diseases in the Elderly. Nat. Commun. 2018, 9, 327. [Google Scholar] [CrossRef] [Green Version]
  59. Rajsombath, M.M.; Nam, A.Y.; Ericsson, M.; Nuber, S. Female Sex and Brain-Selective Estrogen Benefit α-Synuclein Tetramerization and the PD-like Motor Syndrome in 3K Transgenic Mice. J. Neurosci. Off. J. Soc. Neurosci. 2019, 39, 7628–7640. [Google Scholar] [CrossRef] [PubMed]
  60. Resnick, S.M.; Matsumoto, A.M.; Stephens-Shields, A.J.; Ellenberg, S.S.; Gill, T.M.; Shumaker, S.A.; Pleasants, D.D.; Barrett-Connor, E.; Bhasin, S.; Cauley, J.A.; et al. Testosterone Treatment and Cognitive Function in Older Men with Low Testosterone and Age-Associated Memory Impairment. JAMA J. Am. Med. Assoc. 2017, 317, 717–727. [Google Scholar] [CrossRef]
  61. Wahjoepramono, E.J.; Asih, P.R.; Aniwiyanti, V.; Taddei, K.; Dhaliwal, S.S.; Fuller, S.J.; Foster, J.; Carruthers, M.; Verdile, G.; Sohrabi, H.R.; et al. The Effects of Testosterone Supplementation on Cognitive Functioning in Older Men. CNS Neurol. Disord. Drug Targets 2016, 15, 337–343. [Google Scholar] [CrossRef] [PubMed]
  62. Grosse, L.; Pâquet, S.; Caron, P.; Fazli, L.; Rennie, P.S.; Bélanger, A.; Barbier, O. Androgen Glucuronidation: An Unexpected Target for Androgen Deprivation Therapy, with Prognosis and Diagnostic Implications. Cancer Res. 2013, 73, 6963–6971. [Google Scholar] [CrossRef] [PubMed] [Green Version]
  63. Blomhoff, R.; Blomhoff, H.K. Overview of Retinoid Metabolism and Function. J. Neurobiol. 2006, 66, 606–630. [Google Scholar] [CrossRef] [PubMed]
  64. Van Steijn, L.; Verbeek, F.J.; Spaink, H.P.; Merks, R.M.H. Predicting Metabolism from Gene Expression in an Improved Whole-Genome Metabolic Network Model of Danio Rerio. Zebrafish 2019, 16, 348–362. [Google Scholar] [CrossRef] [Green Version]
  65. Riahi, R.R.; Bush, A.E.; Cohen, P.R. Topical Retinoids: Therapeutic Mechanisms in the Treatment of Photodamaged Skin. Am. J. Clin. Dermatol. 2016, 17, 265–276. [Google Scholar] [CrossRef] [PubMed]
  66. Das, B.; Dasgupta, S.; Ray, S. Potential Therapeutic Roles of Retinoids for Prevention of Neuroinflammation and Neurodegeneration in Alzheimer’s Disease. Neural Regen. Res. 2019, 14, 1880–1892. [Google Scholar] [PubMed]
  67. Shudo, K.; Fukasawa, H.; Nakagomi, M.; Yamagata, N. Towards Retinoid Therapy for Alzheimers Disease. Curr. Alzheimer Res. 2009, 6, 302–311. [Google Scholar] [CrossRef] [Green Version]
  68. Fukasawa, H.; Nakagomi, M.; Yamagata, N.; Katsuki, H.; Kawahara, K.; Kitaoka, K.; Miki, T.; Shudo, K. Tamibarotene: A Candidate Retinoid Drug for Alzheimer’s Disease. Biol. Pharm. Bull. 2012, 35, 1206–1212. [Google Scholar] [CrossRef] [Green Version]
  69. Fitz, N.F.; Nam, K.N.; Koldamova, R.; Lefterov, I. Therapeutic Targeting of Nuclear Receptors, Liver X and Retinoid X Receptors, for Alzheimer’s Disease. Br. J. Pharmacol. 2019, 176, 3599–3610. [Google Scholar] [CrossRef]
  70. Sinclair, E.; Trivedi, D.K.; Sarkar, D.; Walton-Doyle, C.; Milne, J.; Kunath, T.; Rijs, A.M.; de Bie, R.M.A.; Goodacre, R.; Silverdale, M.; et al. Metabolomics of Sebum Reveals Lipid Dysregulation in Parkinson’s Disease. Nat. Commun. 2021, 12, 1–9. [Google Scholar] [CrossRef]
  71. Martucci, C.P. The Role of 2-Methoxyestrone in Estrogen Action. J. Steroid Biochem. 1983, 19, 635–638. [Google Scholar] [CrossRef]
  72. Santana-Santana, M.; Bayascas, J.-R.; Giménez-Llort, L. Fine-Tuning the PI3K/Akt Signaling Pathway Intensity by Sex and Genotype-Load: Sex-Dependent Homozygotic Threshold for Somatic Growth but Feminization of Anxious Phenotype in Middle-Aged PDK1 K465E Knock-In and Heterozygous Mice. Biomedicines 2021, 9, 747. [Google Scholar] [CrossRef] [PubMed]
  73. Santana-Santana, M.; Bayascas, J.-R.; Giménez-Llort, L. Sex-Dependent Signatures, Time Frames and Longitudinal Fine-Tuning of the Marble Burying Test in Normal and AD-Pathological Aging Mice. Biomedicines 2021, 9, 994. [Google Scholar] [CrossRef] [PubMed]
  74. Muntsant, A.; Jiménez-Altayó, F.; Puertas-Umbert, L.; Jiménez-Xarrie, E.; Vila, E.; Giménez-Llort, L. Sex-Dependent End-of-Life Mental and Vascular Scenarios for Compensatory Mechanisms in Mice with Normal and AD-Neurodegenerative Aging. Biomedicines 2021, 9, 111. [Google Scholar] [CrossRef] [PubMed]
Figure 1. Overview and exploratory data analysis. (A) Workflow for the analysis of human AD and PD samples. (B) AD and PD samples were clustered into k clusters without supervision on the basis of normalised expression counts. Results are shown for k = 3 and 1000 bootstrap replicates. Colour bars indicate cluster identity for each sample. For 2 ≤ k ≤ 7, refer to Figure S1. (C) Normalised expression data from AD, PD, and control samples were projected onto 2-D space using t-distributed stochastic neighbour embedding (t-SNE). Points are coloured according to cluster assignment by unsupervised clustering. For further data visualisation, refer to Figure S2.
Biomedicines 09 01310 g001
Figure 2. Transcriptomic and functional characterisation of AD and PD subclasses. Differentially expressed gene (DEG) analysis and gene set enrichment (GSE) analysis were performed for AD and PD and control samples for each disease cluster, using the control cluster as reference. (A) DEG results. Significant DEGs were determined as those with a Benjamini–Hochberg adjusted p-value at or below a cut-off of 1 × 10⁻¹⁰. Upregulated significant DEGs are coloured red. Downregulated significant DEGs are coloured blue. Non-significant DEGs are coloured grey. (B) Selected significantly enriched GO terms by number of genes as determined by GSE analysis. Red bars indicate upregulated GO terms. Blue bars indicate downregulated GO terms. For full data, refer to Supplementary Data S1.
Biomedicines 09 01310 g002
Figure 3. Metabolic characterisation of AD and PD subclasses. Flux balance analysis (FBA) was performed on iADPD1-3 genome-scale metabolic models (GEMs), and flux values were compared with those of iADPDControl. Key metabolites and reactions within the androgen metabolism pathway are shown and key dysregulations are displayed as coloured arrows: red indicates increased flux compared to iADPDControl; blue indicates decreased flux compared to iADPDControl. Dysregulations associated to each GEM are shown in coloured boxes. The dashed line indicates multiple reactions are involved. Human Metabolic Reactions (HMR) identifiers are shown for androgen metabolism reactions with dysregulated fluxes. For full data, refer to Supplementary Data S2.
Biomedicines 09 01310 g003
Figure 4. Network analysis of AD and PD gene co-expression modules. (A) Gene co-expression networks were constructed from transcriptomic data from AD and PD samples. Community analysis was used to identify gene modules (see the Materials and Methods section). Modules with at least 30 genes are shown as nodes. Node size indicates number of genes. Nodes are coloured by network of origin and numbered in descending order of module size. Shared genes between modules are shown as edges. Edge weight indicates number of shared genes. (B) Degree distribution of AD, PD, and random networks. (C) Enrichment analysis was performed on gene modules containing at least 30 genes using the KEGG database (see the Materials and Methods section). Significantly enriched gene modules are shown as coloured, numbered blocks. Colour and number keys are as in (A).
Biomedicines 09 01310 g004
Figure 5. Summary of zebrafish tert mutant analysis. (A) Workflow for the analysis of zebrafish tert mutants. (B) Differentially expressed gene (DEG) (left panels) and gene set enrichment (GSE) analysis (right panels) of zebrafish brain samples. DEG and GSE analyses were performed on zebrafish tert mutant brain expression data for tert−/− (upper panels) and tert+/− (lower panels), using tert+/+ as a reference. Methods and colour keys are as in Figure 2. For muscle, liver, skin, and pseudo-whole animal analyses, refer to Figure S3. For full data, refer to Supplementary Data S5. (C) Reporter metabolite analysis of zebrafish samples. DEG data were overlaid on ZebraGEM2.1 to determine reporter metabolites. Shown are reporter metabolites with p < 0.1 within the retinoic acid metabolic pathway. Red numbers indicate p-values in tert−/− compared to tert+/+. Blue numbers indicate p-values in tert+/− compared to tert+/+. Green numbers indicate p-values in tert−/− compared to tert+/−. Tissues are indicated with icons. For full data, refer to Supplementary Data S6.
Biomedicines 09 01310 g005
Table 1. Summary of expression data sources.
SourceAD SamplesPD SamplesControl Samples
GTEx/FANTOM50067
HPA0052
Rajkumar01413
ROSMAP6290704
Zhang/Zheng04053
Total62954889
Expression data from AD and PD samples were obtained from the Genotype-Tissue Expression (GTEx) database, Functional Annotation of the Mammalian Genome 5 (FANTOM5) database, Human Protein Atlas (HPA), Religious Orders Study and Rush Memory Aging Project (ROSMAP), Rajkumar dataset, and Zhang/Zheng dataset.
Table 2. Flux balance analysis of iADPD1, iADPD2, and iADPD3 versus iADPDControl.
SubsystemiADPD1iADPD2iADPD3
Acyl-CoA hydrolysis−0.0010.0010.000
Alanine, aspartate, and glutamate metabolism−0.1480.0140.000
Aminoacyl-tRNA biosynthesis4.6984.6980.000
Androgen metabolism−1.426−0.399−0.001
Arachidonic acid metabolism−0.0980.0100.000
Arginine and proline metabolism−0.182−0.3270.000
Beta oxidation of branched-chain fatty acids (mitochondrial)−0.049−0.049−0.049
Beta oxidation of di-unsaturated fatty acids (n-6) (mitochondrial)−0.6360.002−0.001
Beta oxidation of odd-chain fatty acids (mitochondrial)0.001−0.002−0.002
Beta oxidation of poly-unsaturated fatty acids (mitochondrial)0.7090.0240.000
Beta oxidation of unsaturated fatty acids (n-7) (mitochondrial)−0.0160.001−0.003
Beta oxidation of unsaturated fatty acids (n-9) (mitochondrial)0.0110.0000.007
Carnitine shuttle (cytosolic)0.0120.000−0.001
Carnitine shuttle (mitochondrial)0.0030.0000.002
Cholesterol biosynthesis 1 (Bloch pathway) 0.076−0.9830.001
Cholesterol biosynthesis 22.5014.4720.000
Cholesterol biosynthesis 3 (Kandustch–Russell pathway)1.6990.0000.000
Cholesterol metabolism0.0674.4820.000
Estrogen metabolism2.0850.0000.000
Fatty acid activation (endoplasmic reticular)0.0000.0000.000
Fatty acid biosynthesis (even-chain)0.0000.0000.000
Fatty acid desaturation (even-chain)0.7850.0000.000
Fatty acid elongation (odd-chain)−0.042−0.0240.000
Formation and hydrolysis of cholesterol esters−0.3820.0040.000
Fructose and mannose metabolism−0.211−0.0070.000
Galactose metabolism−0.0080.0350.000
Glycine, serine, and threonine metabolism0.2760.5570.000
Glycolysis/gluconeogenesis−0.2130.0220.033
Histidine metabolism0.0000.0000.000
Leukotriene metabolism−0.0320.0000.000
Lysine metabolism0.0000.0000.000
N-glycan metabolism−0.7840.0160.000
Nitrogen metabolism0.0000.0000.000
Nucleotide metabolism0.027−0.0280.000
O-glycan metabolism−2.346−4.7380.000
Pentose phosphate pathway0.1270.0000.000
Propanoate metabolism−0.1160.0200.091
Protein degradation0.0000.0000.000
Purine metabolism0.112−0.0130.000
Pyrimidine metabolism−0.071−0.010−0.001
Pyruvate metabolism−0.183−0.004−0.077
Starch and sucrose metabolism0.0000.0000.000
Steroid metabolism−0.097−0.2950.003
Terpenoid backbone biosynthesis0.3980.1870.020
Valine, leucine, and isoleucine degradation0.1270.0000.000
Flux balance analysis was performed for each iADPD-series GEM, and the predicted fluxes for the three disease cluster GEMs were compared against the predicted fluxes for the control cluster GEM. Reactions are grouped by subsystem and flux difference values are expressed as mean flux difference between disease clusters and the control cluster across all changed reactions within a subsystem. For full results, refer to Supplementary Data S2.
Table 3. Reporter metabolite analysis of AD and PD subclasses.
Reporter MetaboliteZ-Scorep-Value
Cluster 1
O26.1114.95 × 1010
Estrone5.45572.44 × 108
Retinoate5.39433.44 × 108
NADP+5.36674.01 × 108
Arachidonate5.28226.38 × 108
2-Hydroxyestradiol-17beta5.09991.70 × 107
Linoleate5.06222.07 × 107
10-HETE5.04542.26 × 107
11,12,15-THETA5.04542.26 × 107
11,14,15-Theta5.04542.26 × 107
Cluster 2
1-Acylglycerol-3P-LD-PC pool4.33227.38 × 106
Acyl-CoA-LD-PI pool4.1431.71 × 105
Phosphatidate-CL pool4.09732.09 × 105
Thymidine3.58520.00016843
Uridine3.58520.00016843
Prostaglandin D23.21440.00065348
G105963.13540.0008581
G105973.13540.0008581
D-Myo-inositol-1,4,5-trisphosphate2.99880.0013552
Dolichyl-phosphate2.96550.001511
Cluster 3
D-Myo-inositol-1,4,5-trisphosphate2.65430.0039734
13-cis-Retinal2.65370.0039806
Heparan sulfate, precursor 92.59150.0047772
sn-Glycerol-3-phosphate2.5780.0049682
DHAP2.53530.0056173
Porphobilinogen2.49870.0062333
ATP2.48380.0064998
L-Glutamate 5-semialdehyde2.45760.006994
Prostaglandin D22.4510.0071221
ribose2.41330.0079045
Reporter metabolite analysis was performed for each AD/PD subclass by overlaying differential expression results onto iBrain2845. Top 10 unique reporter metabolites by p-value for each cluster compared to the control cluster are shown. For full results, refer to Supplementary Data S3.
Table 4. AD and PD network properties.
NodesEdgesDiameterAverage Path LengthDensityClustering CoefficientConnected Network?Minimum Cut
AD4861396,985113.0040.0340.443No-
PD5857394,405183.5980.0230.397No-
Random AD4861396,98531.9700.0340.034Yes114
Random PD5857394,40532.0210.0230.023Yes89
Gene co-expression networks were generated for AD and PD samples. AD, PD, and random networks are shown.
Table 5. Reporter metabolite analysis of zebrafish tert mutants.
Reporter MetaboliteZ-Scorep-Value
tert−/−
H+3.9114.60 × 105
H2O3.06720.0010804
L-Lysine2.85640.0021424
Biocyt c2.85640.0021424
Ubiquinone2.57420.0050241
Nicotinamide adenine dinucleotide—reduced2.39460.0083183
Phosphate2.05620.019883
Superoxide anion2.03650.020851
Sodium1.92280.027254
TRNA (Glu)1.87520.030381
Thiosulfate1.76840.038493
Selenate1.76840.038493
Reduced glutathione1.71840.042862
ADP1.67160.047305
L-Lysine1.66250.04821
Benzo[a]pyrene-4,5-oxide1.60420.054333
Formaldehyde1.59550.055302
L-Glutamate1.46220.071837
(1R,2S)-Naphthalene epoxide1.45180.073276
Aflatoxin B1 exo-8,9-epozide1.45180.073276
tert+/−
H+4.95853.55 × 107
Ubiquinol3.99383.25 × 105
H2O3.20780.00066883
Nicotinamide adenine dinucleotide—reduced3.0290.0012268
Superoxide anion2.09080.018274
L-Lactate2.07520.018983
O21.99580.022976
Lnlncgcoa c1.96280.024834
Succinate1.94490.025895
Ferricytochrome c1.83520.033237
Phosphatidylinositol-3,4,5-trisphosphate1.74940.040109
9-cis-Retinoic acid1.70.044567
[(Gal)2 (GlcNAc)4 (LFuc)1 (Man)3 (Asn)1’]1.66720.047739
O-Phospho-L-serine1.66010.048451
[(Glc)3 (GlcNAc)2 (Man)9 (Asn)1’]1.62760.051802
Protein serine1.60780.053937
[(GlcNAc)1 (Ser/Thr)1’]1.60780.053937
Geranyl diphosphate1.59120.055785
CTP1.56250.059088
[(Gal)2 (GlcNAc)4 (LFuc)1 (Man)3 (Neu5Ac)2 (Asn)1’]1.53670.062179
Reporter metabolite analysis was performed for the brains of zebrafish tert mutant by overlaying differential expression results onto ZebraGEM2.1. Top 20 unique reporter metabolites by p-value for each cluster compared to wild-type tert+/+ zebrafish are shown. For full results, refer to Supplementary Data S6.
Publisher’s Note: MDPI stays neutral with regard to jurisdictional claims in published maps and institutional affiliations.

