Next Article in Journal
Immunomodulatory Effects of a Concoction of Natural Bioactive Compounds—Mechanistic Insights
Next Article in Special Issue
Blood Copper Levels and the Occurrence of Colorectal Cancer in Poland
Previous Article in Journal
Topical Administration of Heat-Killed Enterococcus faecalis Strain KH2 Promotes Re-Epithelialization and Granulation Tissue Formation during Skin Wound-Healing
Previous Article in Special Issue
Zinc Signaling in the Mammary Gland: For Better and for Worse
 
 
biomedicines-logo
Article Menu

Article Menu

Article

Prediagnostic Blood Selenium Status and Mortality among Patients with Colorectal Cancer in Western European Populations

by
Jacqueline Roshelli Baker
1,
Sushma Umesh
1,
Mazda Jenab
2,
Lutz Schomburg
3,
Anne Tjønneland
4,
Anja Olsen
4,
Marie-Christine Boutron-Ruault
5,
Joseph A. Rothwell
5,
Gianluca Severi
5,6,
Verena Katzke
7,
Theron Johnson
7,
Matthias B. Schulze
8,9,
Giovanna Masala
10,
Claudia Agnoli
11,
Vittorio Simeon
12,
Rosario Tumino
13,
H. Bas Bueno-de-Mesquita
14,
Inger Torhild Gram
15,
Guri Skeie
15,
Catalina Bonet
16,
Miguel Rodriguez-Barranco
17,18,
José María Houerta
18,19,
Björn Gylling
20,
Bethany Van Guelpen
21,
Aurora Perez-Cornago
22,
Elom Aglago
2,
Heinz Freisling
2,
Elisabete Weiderpass
2,
Amanda J. Cross
23,
Alicia K. Heath
23,
David J. Hughes
24,* and
Veronika Fedirko
1,25,*
add Show full author list remove Hide full author list
1
Department of Epidemiology, Rollins School of Public Health, Emory University, Atlanta, GA 30322, USA
2
International Agency for Research on Cancer, 69372 Lyon, France
3
Institut für Experimentelle Endokrinologie, Charité—Universitätsmedizin Berlin, CVK, Südring 10, 13353 Berlin, Germany
4
Danish Cancer Society Research Center, Diet, Genes and Environment, Strandboulevarden 49, DK-2100 Copenhagen, Denmark
5
CESP (UMR1018), Faculté de Médecine, Université Paris-Saclay, Inserm, Gustave Roussy, 94805 Villejuif, France
6
Department of Statistics, Computer Science and Applications (DISIA), University of Florence, 50123 Florence, Italy
7
Division of Cancer Epidemiology, German Cancer Research Center (DKFZ), 69120 Heidelberg, Germany
8
Department of Molecular Epidemiology, German Institute of Human Nutrition Potsdam-Rehbruecke, 14558 Nuthetal, Germany
9
Institute of Nutrition Science, University of Potsdam, 14558 Nuthetal, Germany
10
Cancer Risk Factors and Lifestyle Epidemiology Unit, Institute for Cancer Research, Prevention and Clinical Network-ISPRO, 50141 Florence, Italy
11
Epidemiology and Prevention Unit, Fondazione IRCCS Istituto Nazionale dei Tumori di Milano, 20133 Milan, Italy
12
Dipartimento di Salute Mentale e Fisica e Medicina Preventiva, Università degli Studi della Campania ‘Luigi Vanvitelli’, 80121 Naples, Italy
13
Cancer Registry and Histopathology Department, Provincial Health Authority (ASP 7), 97100 Ragusa, Italy
14
Center for Nutrition and Health, National Institute for Public Health and the Environment, 3720 Bilthoven, The Netherlands
15
Department of Community Medicine, The Arctic University of Norway, N-9037 Tromsø, Norway
16
Unitat de Nutrició i Càncer, 29010 Malaga, Spain
17
Escuela Andaluza de Salud Pública (EASP), Instituto de Investigación Biosanitaria ibs. Granada, 18014 Granada, Spain
18
Centro de Investigación Biomédica en Red de Epidemiología y Salud Pública (CIBERESP), 28029 Madrid, Spain
19
Department of Epidemiology, Murcia Regional Health Council, IMIB-Arrixaca, 30008 Murcia, Spain
20
Department of Medical Biosciences, Umea University, 901 87 Umea, Sweden
21
Department of Radiation Sciences, Umea University, 901 87 Umea, Sweden
22
Cancer Epidemiology Unit, Nuffield Department of Population Health, University of Oxford, Oxford OX3 7LF, UK
23
School of Public Health, Imperial College London, London SW7 2AZ, UK
24
Cancer Biology and Therapeutics Group, School of Biomolecular and Biomedical Science, UCD Conway Institute, University College Dublin, D04 V1W8 Dublin, Ireland
25
Department of Epidemiology, The University of Texas MD Anderson Cancer Center, Houston, TX 77030, USA
*
Authors to whom correspondence should be addressed.
Biomedicines 2021, 9(11), 1521; https://doi.org/10.3390/biomedicines9111521
Submission received: 26 September 2021 / Revised: 12 October 2021 / Accepted: 15 October 2021 / Published: 22 October 2021
(This article belongs to the Special Issue Role of Trace Elements in Chemoprevention and Cancer Therapy)

Abstract

:
A higher selenium (Se) status has been shown to be associated with lower risk for colorectal cancer (CRC), but the importance of Se in survival after CRC diagnosis is not well studied. The associations of prediagnostic circulating Se status (as indicated by serum Se and selenoprotein P (SELENOP) measurements) with overall and CRC-specific mortality were estimated using multivariable Cox proportional hazards regression among 995 CRC cases (515 deaths, 396 from CRC) in the European Prospective Investigation into Cancer and Nutrition (EPIC) cohort. Se and SELENOP serum concentrations were measured on average 46 months before CRC diagnosis. Median follow-up time was 113 months. Participants with Se concentrations in the highest quintile (≥100 µg/L) had a multivariable-adjusted hazard ratio (HR) of 0.73 (95% CI: 0.52–1.02; Ptrend = 0.06) for CRC-specific mortality and 0.77 (95% CI: 0.57–1.03; Ptrend = 0.04) for overall mortality, compared with the lowest quintile (≤67.5 µg/L). Similarly, participants with SELENOP concentrations in the highest (≥5.07 mg/L) compared with the lowest quintile (≤3.53 mg/L) had HRs of 0.89 (95% CI: 0.64–1.24; Ptrend = 0.39) for CRC-specific mortality and 0.83 (95% CI: 0.62–1.11; Ptrend = 0.17) for overall mortality. Higher prediagnostic exposure to Se within an optimal concentration (100–150 µg/L) might be associated with improved survival among CRC patients, although our results were not statistically significant and additional studies are needed to confirm this potential association. Our findings may stimulate further research on selenium’s role in survival among CRC patients especially among those residing in geographic regions with suboptimal Se availability.

Graphical Abstract

1. Introduction

Despite advances in prevention, screening, and treatment, colorectal cancer (CRC) remains the second most common cause of cancer death in Europe [1]. Currently, little is known about the effects of pre- and postdiagnostic dietary or lifestyle factors in CRC survival, with the only recognized prognostic factors of survival being tumor stage and grade. Several potentially modifiable factors related to diet and lifestyle have been suggested to be associated with survival among CRC patients [2,3]. However, research is limited especially on dietary micronutrients, including selenium.
Selenium (Se), an essential micronutrient, is a trace element that is involved in several major metabolic pathways and is thought to have anticarcinogenic properties [4]. The effects of Se are primarily mediated by selenoproteins, which have a variety of biological roles including modulation of redox homeostasis, antioxidant activity, thyroid metabolism, immune function, and inhibition of cell proliferation and angiogenesis [5,6,7]. Selenoprotein P (SELENOP) is a secreted glycoprotein that is predominantly produced by the liver and is considered the best biomarker of functional Se status [8]. SELENOP is a major transporter of hepatic Se in the blood, an indicator of longer-term Se intake [9], and may have local Se storage functions [10].
Observational and intervention studies suggest that blood Se status is associated with colorectal neoplasm risk, particularly in geographical regions with suboptimal Se availability due to low Se content in soils as in many European regions [11,12]. Furthermore, several -omics studies showed that Se status may influence the expression of genes and proteins implicated in antioxidant response, immune function, inflammatory pathways, cell growth and death, and cellular movement [13,14,15,16,17]. Additionally, emerging evidence from animal and cell culture studies supports the role of selenoproteins in improved CRC survival through their role in the regulation of programmed cell death and ability to inhibit angiogenesis [13,18]. These abilities have suggested the potential utility of Se compounds for cancer therapy [19,20]. However, several experimental studies showed that some selenoproteins (e.g., three important cellular redox-regulators: TXNRD1, SELENOF, and GPx2) may also promote malignant cell transformation and progression [5,21,22,23,24]. Hypoxic and oxidative stresses in proliferating tumors may decouple the normal hierarchy of selenoprotein expression [13,25].
The intake of Se and blood concentrations of Se and SELENOP vary significantly worldwide, with lower concentrations observed in the European population [26]. European and some Asian populations often exhibit a suboptimal blood Se status compared to North American populations where Se is more abundant in the soil and food system/diet [27]. The two large Se supplementation trials (the Selenium and Vitamin E Cancer Trial (SELECT) [28] and the Nutritional Prevention of Cancer (NPC) trial [29]) were conducted in the U.S., where 52% of the population take dietary supplements and have sufficient Se concentrations that could result in maximal selenoprotein activities or concentrations at baseline [30]. This, in part, could potentially explain why these trials demonstrated lower or no treatment efficacy of Se supplementation on primary outcomes of non-melanoma skin cancer incidence and prostate cancer risk [31]. Thus, it is important to understand the role of Se and its association with survival after cancer diagnosis in a population with relatively low exposure to Se.
Within this study, we investigated whether higher prediagnostic Se concentrations (within optimal range), as ascertained by circulating concentrations of Se and SELENOP, are associated with lower overall and CRC-specific mortality in patients diagnosed with CRC within the context of a large Western European prospective cohort study.

2. Materials and Methods

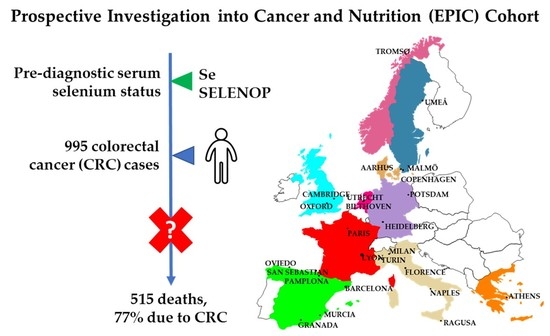
2.1. Study Population and Data Collection

The European Prospective Investigation into Cancer and Nutrition (EPIC) is a multicenter prospective cohort study designed to investigate the associations between diet, lifestyle, genetic and environmental factors, and various types of cancer. The rationale and methods of the EPIC design have been published previously [32,33]. Participating countries include France, Germany, Greece, Italy, The Netherlands, Spain, the UK, Sweden, Denmark, and Norway. Between 1992 and 1998, standardized dietary and lifestyle/personal history questionnaires, anthropometric data, and blood samples were collected from most participants at recruitment, before disease onset or diagnosis. Diet over the previous one year was measured at baseline by validated country-specific dietary questionnaires developed to ensure high compliance and better measures of local dietary habits. Serum samples were stored at the International Agency for Research on Cancer (IARC) at −196 °C in liquid nitrogen for all countries except Denmark (−150 °C, nitrogen vapor). Individuals who were eligible for the study were selected from the general population of a specific geographical area, town, or province. Exceptions included the French subcohort, which is based on members of the health insurance system or state-school employees; the Utrecht (The Netherlands) subcohort, which is based on women who underwent screening for breast cancer; and a portion of the Spanish and Italian subcohorts that included blood donors. The present analysis is based on participant data from all centers except for Norway (blood samples only recently collected; few CRCs diagnosed after blood donation), Sweden (no available serum samples), and Greece (excluded due to unforeseen data restriction issues). Written informed consent was provided by all study participants. Ethical approval for the EPIC study was obtained from the review boards of the IARC and local participating centers.

2.2. Cancer Incidence Follow-Up

Incident cancer cases were determined through record linkage with regional cancer registries (Denmark, Italy, The Netherlands, Spain, and the UK) or through a combination of methods including the use of health insurance records, contacts with cancer and pathology registries, and active follow-up through study subjects and their next-of-kin (France and Germany; complete up to June 2010).

2.3. Vital Status Follow-Up

Vital status follow-up was determined through record linkage with regional and/or national mortality registries (Denmark, Italy, The Netherlands, Spain, and the UK) or active follow-up (France and Germany). Censoring dates for complete follow-up varied amongst countries but were between December 2006 and October 2013 for France and Germany and between December 2006 and August 2013 for the remaining countries. Mortality was coded using the 10th Revision of the International Classification of Diseases, Injuries, and Causes of Death (ICD-10), and the outcome was assigned based on underlying cause of death. Twenty-four study participants had missing cause of death and were excluded only from the analysis of CRC-specific mortality. Exclusion of these 24 participants from the analysis of overall mortality did not change the results.

2.4. Case Ascertainment and Selection

Cancer data were coded using ICD-10 and the second revision of the International Classification of Disease for Oncology. CRC cases were selected from participants who developed colon (C18.0-C18.7), rectum (C19-C20), and overlapping or unspecified-origin colorectal tumors (C18.8-C18.9). CRC is defined as colon and rectal cancer cases. Of 1001 CRC cases with measurements of Se and SELENOP [12], 1 was excluded due to stage coded as in situ, and 5 cases were removed for having a follow-up time of 0, resulting in 995 CRC cases.

2.5. Selenium and Selenoprotein P Measurements

Information regarding prior collection and measurement of serum Se and SELENOP as part of a previously conducted nested case–control study on CRC has been published [12]. Briefly, total Se concentrations were measured from 20 µL samples of blood serum using X-ray fluorescence spectrometer (PicofoxTM S2, Bruker Nano GmbH, Berlin, Germany). SELENOP concentrations were measured from 20 µL blood serum samples and quantified by conducting an immunoluminometric sandwich assay (SelenotestTM, ICI GmbH, Berlin, Germany). All sample measurements were done in duplicate, and mean concentration values were used in the analysis. Se measurements were controlled with a commercial standard serum (Seronorm, Billingstad, Norway) and an atomic absorption standard (1000 mg/mL, Sigma, Taufkirchen, Germany). The coefficients of variation (CVs) were 7.3% and 7.2% for SELENOP controls of 1.5 and 8.6 mg/L, respectively.

2.6. Covariates

The following a-priori-identified covariates were collected at baseline and assessed as potential confounders: age at diagnosis, sex, tumor stage, grade of tumor differentiation (well, moderately, poorly, unknown), location of primary tumor (colon or rectum), smoking status (never smoker, former smoker, current smoker, unknown), body mass index (BMI, kg/m2), physical activity (combined recreational and household activity as measured by the Cambridge index; expressed as sex-specific categories of metabolic equivalents), year of diagnosis, several dietary components (intakes of red and processed meats, alcohol, fish and shellfish, nuts and seeds, fruits and vegetables, and total energy), Healthy Lifestyle Index score [34], Mediterranean diet score [35], and baseline self-reported diabetes status. Healthy Lifestyle Index score and Mediterranean diet score were adjusted for in separate models. These variables were chosen based on previous published evidence showing their associations with CRC incidence or survival and/or blood Se concentrations. Information regarding categorization and harmonization of tumor stage data has been previously published [36]. Confounding assessment was conducted by evaluating whether there was a >10% change in hazard ratios (HRs) after including the variable in the model. Age at diagnosis, sex, stage, location of primary tumor, smoking status, BMI (kg/m2), year of diagnosis, and baseline diabetes status were included in the final analysis.

2.7. Statistical Analyses

Death from CRC was the primary endpoint, and death from any cause was used as a secondary endpoint. Age at first tumor diagnosis and age at death or censorship were used as the two time interval points for patient follow-up time. Participants were counted as censored if they immigrated or were lost to follow-up. Separate categories were created for categorical variables with missing values. Adjusted cumulative incidence curves were used to assess the association of Se and SELENOP concentrations on CRC-specific mortality accounting for competing risks (deaths from other causes) [37]. To evaluate the association between Se and SELENOP concentrations and CRC-death and overall mortality, Cox proportional hazards models stratified by country and adjusted for sex, stage of tumor, BMI, smoking status, location of tumor, year of diagnosis, age of diagnosis, and baseline diabetes were used to calculate hazard ratios (HRs) and 95% confidence intervals (CIs). The proportional hazards assumption was graphically assessed by estimating “log–log” survival curves and checked for parallelism. In addition, the proportional hazards assumption was verified using goodness of fit test methods. Correlations between Schoenfeld residuals and time-dependent variables in the Cox model were evaluated to test for any violations of the proportional hazard assumptions. The exposure was examined as follows: Se and SELENOP quintiles, per 21.99 µg/L (one standard deviation) increase of Se and per 0.96 mg/L (one standard deviation) increase of SELENOP. We also considered sex-specific quintiles but do not show them here, as the results were very similar to those reported. p-value for trend was calculated with the median value of each Se and SELENOP quintile included as a continuous variable in the corresponding models.
We explored whether the association between Se or SELENOP and risk for CRC-specific and overall mortality is non-linear using non-parametric restricted cubic splines [38,39] fitted to a Cox proportional hazards model using the SAS macro “lgtphcurv9” [40]. Tests for non-linearity used the likelihood ratio test, comparing the model with only the linear term to the model with the linear and cubic spline terms [40]. p-values of non-linearity tests from these models were consistent with a linear response (Supplementary Figures S1–S4).
The effect of missing tumor stage information on effect estimates was assessed using several approaches. The first approach reclassified missing tumor stage values into a separate missing category and adjusted for the stage variable in the final model (included in the primary analysis). Second, a sensitivity analysis was conducted by excluding participants with missing stage information and subsequently by assessing how the results were affected by the missing stage information. Finally, an imputation of missing tumor stage values was conducted using the SAS PROC MI procedure [41]. The multiple imputation method was based on available data for the other covariates in the model and assumed that the stage data were missing at random.
Subgroup analyses by categories of potentially biologically relevant effect modifiers (length of follow-up, sex, age at diagnosis, tumor site, tumor grade, tumor stage, year of diagnosis, smoking status, and BMI) were conducted. We also stratified by geographic region categorized as Northern (Denmark), Central (UK, The Netherlands, Germany, North of France), and Southern (South of France, Italy, Spain). Stratified multivariable-adjusted HRs and 95% CIs were reported per one SD increase in Se or SELENOP. A cross-product of Se or SELENOP as a continuous variable and the covariate of interest as a continuous or categorical variable was included in the model to test for multiplicative statistical interaction; and the likelihood ratios based on the models with and without the interaction terms were used to test for statistical significance.
All statistical tests were conducted using SAS version 9.2 (SAS Institute), and p-values of <0.05 were considered statistically significant.

3. Results

3.1. Characteristics of Study Participants

The distribution of selected baseline characteristics of CRC cases according to quintiles of serum Se are shown in Table 1 (similar distributions were observed according to quintiles of SELENOP and, thus, were not shown). Among 995 eligible CRC cases, there were 515 deaths (including deaths from CRC = 396, other malignant neoplasms = 43, cardiovascular disorders = 23, several other causes with low frequency in each category = 29, and missing cause of death = 24). Two participants were excluded from Se analysis (N = 993) and five participants were excluded from SELENOP analysis (N = 990) due to missing values. Median follow-up time was 113 months (standard deviation, SD = 70, 25th percentile = 22, 75th percentile = 159), and Se and SELENOP were measured on average 46 months (SD = 29, 25th percentile = 25, 75th percentile = 65) before CRC diagnosis. The Se concentration range was 29 to 142 µg/L, below concentrations associated with acute toxicity (>400 μg/L).

3.2. Selenium and Mortality among CRC Patients

The results of age, sex, stage-adjusted, and multivariable-adjusted Cox proportional hazard models for the association of Se with CRC-specific and overall mortality are shown in Table 2. Higher concentrations of Se were associated with lower CRC-specific mortality and overall mortality, although these observations were not statistically significant. For CRC-specific mortality, the multivariable adjusted HR for the fifth quintile versus the first quintile of Se concentration was 0.73 (95% CI: 0.52–1.02, Ptrend = 0.06). The HR per one SD increase in Se concentration was 0.90 (95% CI: 0.81–1.00). There also was a suggestive inverse association between Se concentrations and overall mortality, where the HR for the fifth quintile versus the first quintile was 0.77 (95% CI: 0.57–1.03, Ptrend = 0.04). The HR per one SD increase in Se concentration was 0.91 (95% CI: 0.83–1.00). In a sensitivity analysis, restricting to cases with complete stage data resulted in HRs of 0.92 (95% CI: 0.82–1.03) and 0.91 (95% CI: 0.82–1.00) for CRC-specific and overall mortality, respectively (Table 3). Similar results were obtained with imputed CRC stage data analyses for CRC-specific (HR = 0.91, 95% CI: 0.82–1.02) and overall mortality (HR = 0.92, 95% CI: 0.84–1.01; Table 3) and accounting for competing risks of death for CRC-specific mortality (Supplementary Figure S5).

3.3. Selenoprotein P and Mortality among CRC Patients

The results of age, sex, stage-adjusted, and multivariable-adjusted Cox proportional hazard models for the associations of SELENOP and CRC-specific and overall mortality are shown in Table 2. SELENOP concentration was inversely but not statistically significantly associated with CRC-specific mortality: HR for the fifth quintile versus the first quintile was 0.89 (95% CI: 0.64–1.24, Ptrend = 0.39). Higher concentrations of SELENOP were also not associated with a statistically significant reduction in overall mortality: HR for the fifth quintile versus the first quintile was 0.83 (95% CI: 0.62–1.11, Ptrend = 0.17). In a sensitivity analysis, restricting to cases with complete stage data resulted in HRs of 0.95 (95% CI: 0.86–1.06) and 0.94 (95% CI: 0.84–1.04) for CRC-specific and overall mortality, respectively (Table 3). Similar results were obtained with imputed CRC stage data analyses for CRC-specific (HR = 0.97, 95% CI: 0.87–1.08) and overall mortality (HR = 0.94, 95% CI: 0.86–1.04; Table 3) and accounting for competing risks of death for CRC-specific mortality (Supplementary Figure S6).

3.4. Stratified Analyses

There were no substantial differences in associations between Se or SELENOP and CRC-specific or overall mortality across select subcategories of potential a-priori-defined biologically plausible effect modifiers (Table 3). However, regional groupings showed stronger significant protective associations between serum Se and overall and CRC-specific mortality in the Northern European region compared to the Central and Southern European regions (Pinteraction = 0.03 and Pinteraction = 0.01, respectively). There was a suggestion of a stronger protective association between serum Se concentrations and overall and CRC-specific mortality among CRC cases with advanced disease (stage III–IV; Pinteraction = 0.11 and Pinteraction = 0.10, respectively). Furthermore, there was a suggestion of a stronger protective association between serum Se concentrations and overall and CRC-specific mortality among CRC cases diagnosed with CRC within five years of blood collection (Pinteraction = 0.01 and Pinteraction = 0.03, respectively).

4. Discussion

This study is the first prospective analysis of the association of prediagnostic serum Se status biomarkers with mortality among CRC patients. The results of this study suggest that higher prediagnostic total serum Se and SELENOP concentrations may be associated with lower mortality among patients with CRC in Western Europe; however, the effect estimates were statistically non-significant. This indicates that prediagnostic Se status might be a potential factor affecting survival in CRC patients, particularly from a population with low Se status, such as in Europe [31], but larger studies including those in other settings are needed to confirm these results.
Strong basic science experimental evidence and data from epidemiologic studies of Se status and CRC risk support a possible association between the micronutrient and survival after CRC diagnosis [5]. However, there were no previous observational studies investigating this association. A recent Cochrane systematic review [42] reported that Se supplementation did not reduce overall cancer incidence (relative risk [RR] = 0.99, 95% CI: 0.86–1.14) or mortality (RR = 0.81, 95% CI: 0.49–1.32) among individuals included in five randomized controlled trials (RCTs). However, compared with the lowest category, the highest category of Se exposure, as measured by Se blood concentrations or dietary intake, was associated with lower cancer incidence (summary odds ratio [OR] = 0.72, 95% CI: 0.55–0.93) and lower cancer mortality; OR = 0.76, 95% CI: 0.59–0.97) in 14 observational studies [42]. The discrepancy between the findings of the RCTs and the observational studies could be due to differences in study populations with regard to their baseline Se status, type of study population, and the chemical form and/or source of Se (high-dose supplementation [43] versus dietary intake). Furthermore, the review did not focus on cancer survivors.
Interestingly, findings from observational studies on several other tumor types support an association of higher Se intake/status with better survival outcomes. A study of 3146 women diagnosed with invasive breast cancer in the Swedish Mammography Cohort reported an inverse association between dietary Se intake and breast cancer mortality (Q4 vs. Q1: HR = 0.64, 95% CI: 0.48–0.84) [44]. Another study showed that low Se blood concentrations were associated with higher risk of death in 546 women with breast cancer (<64.4 vs. >81 μg/L: HR = 2.49, 95% CI: 1.53–4.04) [45]. A small study of 41 renal cancer patients in Germany suggested that lower SELENOP serum concentrations may be associated with poor survival [46]. Another study among 302 lung cancer patients in Poland also found that low serum Se concentrations were associated with a higher risk of death, particularly among patients with stage I disease (<57.9 vs. >69.3 μg/L: HR = 2.73, 95% CI: 1.21–6.11) [47]. Similarly, low serum Se concentrations were associated with worse outcomes among 296 laryngeal cancer patients in a prospective study in Poland (<50 vs. >67 μg/L: HR = 3.07, 95% CI: 1.59–5.94) [48]. In the above studies [45,46,47,48], Se status was assessed at the time of diagnosis, whereas no previous studies considered prediagnostic exposure to Se, which may contribute to lower tumor aggressiveness and its metastatic potential. Our results for CRC are in line with these previously published reports for other cancers [45,46,47,48] and suggest a potential inverse association, with high Se status before CRC diagnosis associated with improved survival in CRC patients from Western European populations with relatively low exposure to Se. Our results also suggested that this association might be stronger in the Northern European region compared to the Central and Southern regions. Although only one country—Denmark—was included in the Northern region, limiting the interpretability of this finding, it was characterized by statistically significantly higher Se concentrations (age- and sex-adjusted mean = 90.6, 95% CI: 88.3–93.0 µg/L) compared to the Central (age- and sex-adjusted mean = 79.5, 95% CI: 77.4–81.5 µg/L) and Southern (age- and sex-adjusted mean = 84.8, 95% CI: 81.9–87.6 µg/L) regions (all p-values <0.002).
Selenoproteins have been implicated in the regulation of multiple cell signaling pathways, many of which have been linked to colorectal neoplasm development and progression [13]. Several selenoproteins expressed in colorectal tissue have well-established functions in redox control and response to oxidative stress and inflammation, which are hallmark processes in colorectal carcinogenesis [13]. Selenoproteins may also prevent cancer progression due to their role in the regulation of programmed cell death and the cell cycle, and inhibition of cellular proliferation [13,18,44]. Furthermore, Se supplementation was shown to inhibit microvascular development [49], and affect the vascular endothelial growth factor (VEGF), and thereby inhibit angiogenesis [50]. Se can also downregulate the expression of several genes including those involved in osteopontin and collagen metabolism. This downregulation may have antimetastatic effects [51,52]. Se has also been reported to suppress glutaminolysis, a biochemical reaction responsible for energy production in tumor cells [53]. It has been proposed that altered selenoprotein expression in the colorectal tract due to limited Se supply could increase cancer risk by weakening the gut epithelial cell response to harmful oxidative and inflammatory challenges [54]. However, several studies also indicated that some selenoproteins, namely important cellular redox regulators TXNRD1, SELENOF, and GPx2, may both prevent and promote cancer [5,55]. Since these oxidoreductase functions are needed by both normal and cancer cells, they could also result in anti- and pro-tumorigenic effects at a tissue-specific cellular level and be dependent on the tumor stage/grade and Se availability [5,25,54]. Hypoxic and oxidative stresses in proliferating tumors may modify selenoprotein expression during carcinogenesis [13,25].
Strengths of this study include the large prospective design and the measurement of both serum Se and SELENOP concentrations, the latter likely being the most informative parameter of Se status. In addition, the European population has shown a range of Se status concentrations [12] from suboptimal (majority of the subjects) to replete, making this population a suitable population for this analysis. Specifically, 96% of the EPIC subjects had serum Se concentrations below 124 µg/L, and, therefore, they can be deemed to have a suboptimal Se intake, as Se intake ideally should provide a circulating Se concentration of ≥124 ug/L for maximal expression of the SELENOP and glutathione peroxidase 3 (GPx3) selenoproteins, as a measure of Se sufficiency [11]. Selenoprotein expression is affected by Se availability and other factors such as genetics, sex, health status, and disease-related conditions [56,57,58,59]. Furthermore, we were able to control for multiple potential confounders and accounted for missing information on CRC stage through various techniques including sensitivity analyses and imputation techniques.
However, there were several limitations in this study. First, we did not have information on CRC treatment received by the participants, which may influence CRC outcome. To address this issue, we conducted our analyses by stratifying on the basis of the country of CRC diagnosis, while adjusting for year of diagnosis and tumor stage as a proxy for treatment. Second, we were only able to measure Se concentrations once. Prior research, however, supports a strong correlation between blood Se concentrations and long-term Se intake [60]. As with other observational studies, there is the possibility for residual confounding despite controlling for relevant covariates. However, in our multivariable models, many potentially important confounding variables for CRC survival were considered. It is also important to note that cancer survivors are very likely to make lifestyle changes including initiation of vitamin and mineral supplement use after cancer diagnosis. Therefore, the prediagnostic measurements are more reflective of the environment in which tumors develop, and it might be possible that cancer in Se-deficient individuals is more aggressive/lethal [61]. In our data, there was a suggestion of a stronger protective association between Se concentrations and overall and CRC-specific mortality among CRC cases with advanced disease (stage III/IV), supporting the possible influence of Se on tumor molecular phenotype at later stages. It is also possible that higher Se/SELENOP concentrations are acting as a proxy for a healthy lifestyle (e.g., healthier diet), which may independently influence CRC survival. However, our results were adjusted for prediagnostic BMI, and adjustments for dietary intakes did not change the study results. In the stratified analyses, the inverse associations of Se and SELENOP with mortality were limited to CRC cases diagnosed within five years of blood collection. This could indicate that either the tumor influences Se concentrations or that Se-deficient individuals have more aggressive tumors or a poorer overall health. Finally, due to geographical differences in Se soil content and hence in the food system, results from this type of study may be difficult to generalize to a population with sufficient Se concentrations. However, it allowed us to have a wide range of Se concentrations in our study.

5. Conclusions

In summary, the findings from this study suggest a statistically non-significant inverse association between prediagnostic Se status and overall and CRC-specific mortality among CRC patients in a population that largely has suboptimal Se status. Further research is necessary to replicate these findings in different populations and to understand the mechanisms of action of Se metabolism in relation to tumor development and progression.

Supplementary Materials

The following are available online at https://www.mdpi.com/article/10.3390/biomedicines9111521/s1, Figure S1: Spline analysis showing the association between log-transformed blood Se concentrations and risk for overall mortality, Figure S2: Spline analysis showing the association between log-transformed blood SELENOP concentrations and risk for overall mortality, Figure S3: Spline analysis showing the association between log-transformed blood Se concentrations and risk for CRC-specific mortality, Figure S4: Spline analysis showing the association between log-transformed blood SELENOP concentrations and risk for CRC-specific mortality, Figure S5: Cumulative incidence curves of CRC-specific mortality by tertiles of prediagnostic blood Se concentrations among CRC cases in the EPIC study, Figure S6: Cumulative incidence curves of CRC-specific mortality by tertiles of prediagnostic blood SELENOP concentrations among CRC cases in the EPIC study.

Author Contributions

Conceptualization, D.J.H. and V.F.; methodology, V.F. and M.J.; formal analysis, J.R.B. and V.F.; resources, all co-authors; data curation, all co-authors; measurements of Se and SELENOP, L.S.; writing—original draft preparation, J.R.B., S.U., D.J.H., M.J. and V.F.; writing—review and editing, all co-authors; visualization, J.R.B.; supervision, V.F.; project administration, D.J.H. and V.F.; funding acquisition, D.J.H. All authors have read and agreed to the published version of the manuscript.

Funding

This work was supported by: The Health Research Board of Ireland project grant (HRA-POR/2013/397) to D.J.H. Support for this study was also provided by the COST Action CA17118 supported by COST (European Cooperation in Science and Technology, www.cost.eu) to D.J.H. and M.J. Moreover, V.F. is supported by the Cancer Prevention and Research Institute of Texas (CPRIT) Rising Stars Award (Grant ID RR200056). The EPIC study was supported by “Europe Against Cancer” Program of the European Commission (SANCO); Ligue contre le Cancer; Institut Gustave Roussy; Mutuelle Générale de l’Education Nationale; Institut National de la Santé et de la Recherche Médicale (INSERM); German Cancer Aid; German Cancer Research Center; German Federal Ministry of Education and Research; Danish Cancer Society; Health Research Fund (FIS) of the Spanish Ministry of Health; the CIBER en Epidemiología y Salud Pública (CIBERESP), Spain; ISCIII RETIC (RD06/0020); Spanish Regional Governments of Andalusia, Asturias, Basque Country, Murcia (No. 6236) and Navarra and the Catalan Institute of Oncology; Cancer Research UK; Medical Research Council, UK; The Hellenic Health Foundation; Italian Association for Research on Cancer; Italian National Research Council; Compagnia di San Paolo; Dutch Ministry of Public Health, Welfare, and Sports (VWS), Netherlands Cancer Registry (NKR), LK Research Funds, Dutch Prevention Funds, Dutch ZON (Zorg Onderzoek Nederland), World Cancer Research Fund (WCRF), Statistics Netherlands (The Netherlands); Swedish Cancer Society; Swedish Scientific Council; Regional Governments of Skane and Vasterbotten, Sweden; and NordForsk Center of Excellence program HELGA. Cancer Research UK (14136 to EPIC-Norfolk; C570/A16491 for EPIC-Oxford), Medical Research Council (1000143 to EPIC-Norfolk, MR/M012190/1 to EPIC-Oxford) (UK). D.J.H. was supported by the Health Research Board of Ireland health research award HRA-PHS-2015-1142. L.S. was supported by the DFG Research Unit 2558 TraceAge, Scho 849/6-1. We would like to thank the following EPIC subcohorts for their data and contributions: (1) Dirección General de Salud Pública, Consejería de Sanidad del Principado de Asturias, Oviedo, Spain; (2) Subdirección de Salud Pública de Gipuzkoa, Instituto de Investigación BIODONOSTIA, Gobierno Vasco, CIBER de Epidemiología y Salud Públicam, San Sebastian, Spain; (3) AOU Città della Salute e della, Scienza di Torino and CPO-Piemonte, Turin, Italy; (4) Julius Center for Health Sciences and Primary Care of the University Medical Center Utrecht (UMCU), Utrecht, The Netherlands, Prospect-EPIC; (5) Dirección General de Salud Pública, Consejería de Sanidad del Principado de Asturias, Oviedo, Spain; (6) Instituto de Salud Pública, Gobierno de Navarra, Pamplona, Spain; (7) MRC Epidemiology Unit, Institute of Metabolic Science, University of Cambridge: The EPIC-Norfolk study (DOI 10.22025/2019.10.105.00004) has received funding from the Medical Research Council (MR/N003284/1 and MC-UU_12015/1) and Cancer Research UK (C864/A14136).

Institutional Review Board Statement

The study was conducted according to the guidelines of the Declaration of Helsinki and approved by the Institutional Review Board (or Ethics Committee) of International Agency for Research on Cancer (IARC).

Informed Consent Statement

Informed consent was obtained from all subjects involved in the study.

Data Availability Statement

The data that support the findings of this study are available on request from the corresponding authors. The data are not publicly available due to privacy or ethical restrictions.

Acknowledgments

We are grateful to all the participants who have been part of the project and to the many members of the study teams at the University of Cambridge who have enabled this research.

Conflicts of Interest

L.S. holds shares in selenOmed GmbH, a company involved in Se status assessment and supplementation.

References

  1. Bray, F.; Ferlay, J.; Soerjomataram, I.; Siegel, R.L.; Torre, L.A.; Jemal, A. Global cancer statistics 2018: GLOBOCAN estimates of incidence and mortality worldwide for 36 cancers in 185 countries. CA Cancer J. Clin. 2018, 68, 394–424. [Google Scholar] [CrossRef] [PubMed] [Green Version]
  2. Romaguera, D.; Ward, H.; Wark, P.A.; Vergnaud, A.-C.; Peeters, P.H.; van Gils, C.H.; Ferrari, P.; Fedirko, V.; Jenab, M.; Boutron-Ruault, M.-C.; et al. Pre-diagnostic concordance with the WCRF/AICR guidelines and survival in European colorectal cancer patients: A cohort study. BMC Med. 2015, 13, 107. [Google Scholar] [CrossRef]
  3. Haggar, F.A.; Boushey, R.P. Colorectal Cancer Epidemiology: Incidence, Mortality, Survival, and Risk Factors. Clin. Colon Rectal Surg. 2009, 22, 191–197. [Google Scholar] [CrossRef] [Green Version]
  4. Kornitzer, M.; Valente, F.; De Bacquer, D.; Neve, J.; De Backer, G. Serum selenium and cancer mortality: A nested case-control study within an age- and sex-stratified sample of the Belgian adult population. Eur. J. Clin. Nutr. 2004, 58, 98–104. [Google Scholar] [CrossRef] [PubMed] [Green Version]
  5. Hatfield, D.L.; Tsuji, P.A.; Carlson, B.A.; Gladyshev, V.N. Selenium and selenocysteine: Roles in cancer, health, and development. Trends Biochem. Sci. 2014, 39, 112–120. [Google Scholar] [CrossRef] [PubMed] [Green Version]
  6. Kurokawa, S.; Berry, M.J. Selenium. Role of the Essential Metalloid in Health. Metal. Ions Life Sci. 2013, 13, 499–534. [Google Scholar] [CrossRef] [Green Version]
  7. Zeng, H.; Combs, G.F., Jr. Selenium as an anticancer nutrient: Roles in cell proliferation and tumor cell invasion. J. Nutr. Biochem. 2008, 19, 1–7. [Google Scholar] [CrossRef]
  8. Schomburg, L.; Hughes, D.J. The missing link? The potential role of selenium in the development of liver cancer and significance for the general population. Expert Rev. Gastroenterol. Hepatol. 2017, 11, 707–709. [Google Scholar] [CrossRef]
  9. Burk, R.F.; Hill, K.E. Regulation of Selenium Metabolism and Transport. Annu. Rev. Nutr. 2015, 35, 109–113. [Google Scholar] [CrossRef] [PubMed]
  10. Richardson, D.R. More roles for selenoprotein P: Local selenium storage and recycling protein in the brain. Biochem. J. 2005, 386, E5. [Google Scholar] [CrossRef] [Green Version]
  11. Meplan, C. Selenium and chronic diseases: A nutritional genomics perspective. Nutrients 2015, 7, 3621–3651. [Google Scholar] [CrossRef]
  12. Hughes, D.J.; Fedirko, V.; Jenab, M.; Schomburg, L.; Meplan, C.; Freisling, H.; Bueno-de-Mesquita, H.B.; Hybsier, S.; Becker, N.P.; Czuban, M.; et al. Selenium status is associated with colorectal cancer risk in the European prospective investigation of cancer and nutrition cohort. Int. J. Cancer 2015, 136, 1149–1161. [Google Scholar] [CrossRef]
  13. Peters, K.M.; Carlson, B.A.; Gladyshev, V.N.; Tsuji, P.A. Selenoproteins in colon cancer. Free. Radic. Biol. Med. 2018, 127, 14–25. [Google Scholar] [CrossRef] [PubMed]
  14. Speckmann, B.; Steinbrenner, H. Selenium and selenoproteins in inflammatory bowel diseases and experimental colitis. Inflamm. Bowel Dis. 2014, 20, 1110–1119. [Google Scholar] [CrossRef] [PubMed]
  15. Meplan, C.; Hesketh, J. The influence of selenium and selenoprotein gene variants on colorectal cancer risk. Mutagenesis 2012, 27, 177–186. [Google Scholar] [CrossRef] [Green Version]
  16. Kipp, A.; Banning, A.; van Schothorst, E.M.; Meplan, C.; Schomburg, L.; Evelo, C.; Coort, S.; Gaj, S.; Keijer, J.; Hesketh, J.; et al. Four selenoproteins, protein biosynthesis, and Wnt signalling are particularly sensitive to limited selenium intake in mouse colon. Mol. Nutr. Food Res. 2009, 53, 1561–1572. [Google Scholar] [CrossRef] [PubMed]
  17. Meplan, C.; Johnson, I.T.; Polley, A.C.; Cockell, S.; Bradburn, D.M.; Commane, D.M.; Arasaradnam, R.P.; Mulholland, F.; Zupanic, A.; Mathers, J.C.; et al. Transcriptomics and proteomics show that selenium affects inflammation, cytoskeleton, and cancer pathways in human rectal biopsies. FASEB J. 2016, 30, 2812–2825. [Google Scholar] [CrossRef] [Green Version]
  18. McKenzie, R.C.; Arthur, J.R.; Beckett, G.J. Selenium and the regulation of cell signaling, growth, and survival: Molecular and mechanistic aspects. Antioxid. Redox Signal. 2002, 4, 339–351. [Google Scholar] [CrossRef] [PubMed]
  19. Bhattacharjee, A.; Basu, A.; Biswas, J.; Sen, T.; Bhattacharya, S. Chemoprotective and chemosensitizing properties of selenium nanoparticle (Nano-Se) during adjuvant therapy with cyclophosphamide in tumor-bearing mice. Mol. Cell. Biochem. 2017, 424, 13–33. [Google Scholar] [CrossRef]
  20. Chen, Y.C.; Prabhu, K.S.; Mastro, A.M. Is selenium a potential treatment for cancer metastasis? Nutrients 2013, 5, 1149–1168. [Google Scholar] [CrossRef] [Green Version]
  21. Kandas, N.O.; Randolph, C.; Bosland, M.C. Differential effects of selenium on benign and malignant prostate epithelial cells: Stimulation of LNCaP cell growth by noncytotoxic, low selenite concentrations. Nutr. Cancer 2009, 61, 251–264. [Google Scholar] [CrossRef] [PubMed] [Green Version]
  22. Kasaikina, M.V.; Turanov, A.A.; Avanesov, A.; Schweizer, U.; Seeher, S.; Bronson, R.T.; Novoselov, S.N.; Carlson, B.A.; Hatfield, D.L.; Gladyshev, V.N. Contrasting roles of dietary selenium and selenoproteins in chemically induced hepatocarcinogenesis. Carcinogenesis 2013, 34, 1089–1095. [Google Scholar] [CrossRef] [PubMed] [Green Version]
  23. Rose, A.H.; Bertino, P.; Hoffmann, F.W.; Gaudino, G.; Carbone, M.; Hoffmann, P.R. Increasing dietary selenium elevates reducing capacity and ERK activation associated with accelerated progression of select mesothelioma tumors. Am. J. Pathol. 2014, 184, 1041–1049. [Google Scholar] [CrossRef] [PubMed] [Green Version]
  24. Su, Y.P.; Tang, J.M.; Tang, Y.; Gao, H.Y. Histological and ultrastructural changes induced by selenium in early experimental gastric carcinogenesis. World J. Gastroenterol. 2005, 11, 4457–4460. [Google Scholar] [CrossRef]
  25. Hughes, D.J.; Kunicka, T.; Schomburg, L.; Liska, V.; Swan, N.; Soucek, P. Expression of Selenoprotein Genes and Association with Selenium Status in Colorectal Adenoma and Colorectal Cancer. Nutrients 2018, 10, 1812. [Google Scholar] [CrossRef] [Green Version]
  26. Johnson, C.C.; Fordyce, F.M.; Rayman, M.P. Symposium on ‘Geographical and geological influences on nutrition’: Factors controlling the distribution of selenium in the environment and their impact on health and nutrition. Proc. Nutr. Soc. 2010, 69, 119–132. [Google Scholar] [CrossRef] [Green Version]
  27. Combs, G.F., Jr. Selenium in global food systems. Br. J. Nutr. 2001, 85, 517–547. [Google Scholar] [CrossRef] [Green Version]
  28. Lippman, S.M.; Klein, E.A.; Goodman, P.J.; Lucia, M.S.; Thompson, I.M.; Ford, L.G.; Parnes, H.L.; Minasian, L.M.; Gaziano, J.M.; Hartline, J.A.; et al. Effect of selenium and vitamin E on risk of prostate cancer and other cancers: The Selenium and Vitamin E Cancer Prevention Trial (SELECT). JAMA 2009, 301, 39–51. [Google Scholar] [CrossRef] [Green Version]
  29. Duffield-Lillico, A.J.; Reid, M.E.; Turnbull, B.W.; Combs, G.F., Jr.; Slate, E.H.; Fischbach, L.A.; Marshall, J.R.; Clark, L.C. Baseline characteristics and the effect of selenium supplementation on cancer incidence in a randomized clinical trial: A summary report of the Nutritional Prevention of Cancer Trial. Cancer Epidemiol. Biomark. Prev. 2002, 11, 630–639. [Google Scholar]
  30. Kantor, E.D.; Rehm, C.D.; Du, M.; White, E.; Giovannucci, E.L. Trends in Dietary Supplement Use Among US Adults From 1999–2012. JAMA 2016, 316, 1464–1474. [Google Scholar] [CrossRef]
  31. Rayman, M.P. Selenium and human health. Lancet 2012, 379, 1256–1268. [Google Scholar] [CrossRef]
  32. Riboli, E.; Hunt, K.J.; Slimani, N.; Ferrari, P.; Norat, T.; Fahey, M.; Charrondiere, U.R.; Hemon, B.; Casagrande, C.; Vignat, J.; et al. European Prospective Investigation into Cancer and Nutrition (EPIC): Study populations and data collection. Public Health Nutr. 2002, 5, 1113–1124. [Google Scholar] [CrossRef]
  33. Bingham, S.; Riboli, E. Diet and cancer—The European Prospective Investigation into Cancer and Nutrition. Nat. Rev. Cancer 2004, 4, 206–215. [Google Scholar] [CrossRef]
  34. Aleksandrova, K.; Pischon, T.; Jenab, M.; Bueno-de-Mesquita, H.B.; Fedirko, V.; Norat, T.; Romaguera, D.; Knüppel, S.; Boutron-Ruault, M.-C.; Dossus, L.; et al. Combined impact of healthy lifestyle factors on colorectal cancer: A large European cohort study. BMC Med. 2014, 12, 168. [Google Scholar] [CrossRef] [PubMed] [Green Version]
  35. Couto, E.; Boffetta, P.; Lagiou, P.; Ferrari, P.; Buckland, G.; Overvad, K.; Dahm, C.C.; Tjonneland, A.; Olsen, A.; Clavel-Chapelon, F.; et al. Mediterranean dietary pattern and cancer risk in the EPIC cohort. Br. J. Cancer 2011, 104, 1493–1499. [Google Scholar] [CrossRef] [PubMed] [Green Version]
  36. Fedirko, V.; Riboli, E.; Tjonneland, A.; Ferrari, P.; Olsen, A.; Bueno-de-Mesquita, H.B.; van Duijnhoven, F.J.; Norat, T.; Jansen, E.H.; Dahm, C.C.; et al. Prediagnostic 25-hydroxyvitamin D, VDR and CASR polymorphisms, and survival in patients with colorectal cancer in western European ppulations. Cancer Epidemiol. Biomark. Prev. 2012, 21, 582–593. [Google Scholar] [CrossRef] [PubMed] [Green Version]
  37. Rosthoj, S.; Andersen, P.K.; Abildstrom, S.Z. SAS macros for estimation of the cumulative incidence functions based on a Cox regression model for competing risks survival data. Comput. Methods Programs Biomed. 2004, 74, 69–75. [Google Scholar] [CrossRef]
  38. Durrleman, S.; Simon, R. Flexible regression models with cubic splines. Stat. Med. 1989, 8, 551–561. [Google Scholar] [CrossRef]
  39. Govindarajulu, U.S.; Spiegelman, D.; Thurston, S.W.; Ganguli, B.; Eisen, E.A. Comparing smoothing techniques in Cox models for exposure-response relationships. Stat. Med. 2007, 26, 3735–3752. [Google Scholar] [CrossRef]
  40. Shah, Y.M.; Al-Dhaheri, M.; Dong, Y.; Ip, C.; Jones, F.E.; Rowan, B.G. Selenium disrupts estrogen receptor (alpha) signaling and potentiates tamoxifen antagonism in endometrial cancer cells and tamoxifen-resistant breast cancer cells. Mol. Cancer Ther. 2005, 4, 1239–1249. [Google Scholar] [CrossRef] [PubMed] [Green Version]
  41. Zhang, S.; Li, F.; Younes, M.; Liu, H.; Chen, C.; Yao, Q. Reduced selenium-binding protein 1 in breast cancer correlates with poor survival and resistance to the anti-proliferative effects of selenium. PLoS ONE 2013, 8, e63702. [Google Scholar] [CrossRef] [PubMed] [Green Version]
  42. Vinceti, M.; Filippini, T.; Del Giovane, C.; Dennert, G.; Zwahlen, M.; Brinkman, M.; Zeegers, M.P.; Horneber, M.; D’Amico, R.; Crespi, C.M. Selenium for preventing cancer. Cochrane Database Syst. Rev. 2018, 1, Cd005195. [Google Scholar] [CrossRef] [PubMed]
  43. Rayman, M.P.; Winther, K.H.; Pastor-Barriuso, R.; Cold, F.; Thvilum, M.; Stranges, S.; Guallar, E.; Cold, S. Effect of long-term selenium supplementation on mortality: Results from a multiple-dose, randomised controlled trial. Free. Radic. Biol. Med. 2018, 127, 46–54. [Google Scholar] [CrossRef] [PubMed]
  44. Harris, H.R.; Bergkvist, L.; Wolk, A. Selenium intake and breast cancer mortality in a cohort of Swedish women. Breast Cancer Res. Treat. 2012, 134, 1269–1277. [Google Scholar] [CrossRef]
  45. Lubinski, J.; Marciniak, W.; Muszynska, M.; Huzarski, T.; Gronwald, J.; Cybulski, C.; Jakubowska, A.; Debniak, T.; Falco, M.; Kladny, J.; et al. Serum selenium levels predict survival after breast cancer. Breast Cancer Res. Treat. 2018, 167, 591–598. [Google Scholar] [CrossRef] [PubMed]
  46. Meyer, H.A.; Endermann, T.; Stephan, C.; Stoedter, M.; Behrends, T.; Wolff, I.; Jung, K.; Schomburg, L. Selenoprotein P Status Correlates to Cancer-Specific Mortality in Renal Cancer Patients. PLoS ONE 2012, 7, e46644. [Google Scholar] [CrossRef] [Green Version]
  47. Pietrzak, S.; Wojcik, J.; Scott, R.J.; Kashyap, A.; Grodzki, T.; Baszuk, P.; Bielewicz, M.; Marciniak, W.; Wojcik, N.; Debniak, T.; et al. Influence of the selenium level on overall survival in lung cancer. J. Trace Elem. Med. Biol. Organ Soc. Miner. Trace Elem. (GMS) 2019, 56, 46–51. [Google Scholar] [CrossRef]
  48. Lubinski, J.; Marciniak, W.; Muszynska, M.; Jaworowska, E.; Sulikowski, M.; Jakubowska, A.; Kaczmarek, K.; Sukiennicki, G.; Falco, M.; Baszuk, P.; et al. Serum selenium levels and the risk of progression of laryngeal cancer. PLoS ONE 2018, 13, e0184873. [Google Scholar] [CrossRef] [Green Version]
  49. Yan, L.; Yee, J.A.; McGuire, M.H.; Graef, G.L. Effect of dietary supplementation of selenite on pulmonary metastasis of melanoma cells in mice. Nutr. Cancer 1997, 28, 165–169. [Google Scholar] [CrossRef]
  50. Jiang, C.; Ganther, H.; Lu, J. Monomethyl selenium—Specific inhibition of MMP-2 and VEGF expression: Implications for angiogenic switch regulation. Mol. Carcinog 2000, 29, 236–250. [Google Scholar] [CrossRef]
  51. Unni, E.; Kittrell, F.S.; Singh, U.; Sinha, R. Osteopontin is a potential target gene in mouse mammary cancer chemoprevention by Se-methylselenocysteine. Breast Cancer Res. 2004, 6, R586. [Google Scholar] [CrossRef] [Green Version]
  52. Yoon, S.O.; Kim, M.M.; Chung, A.S. Inhibitory effect of selenite on invasion of HT1080 tumor cells. J. Biol. Chem. 2001, 276, 20085–20092. [Google Scholar] [CrossRef] [Green Version]
  53. Zhao, J.; Zhou, R.; Hui, K.; Yang, Y.; Zhang, Q.; Ci, Y.; Shi, L.; Xu, C.; Huang, F.; Hu, Y. Selenite inhibits glutamine metabolism and induces apoptosis by regulating GLS1 protein degradation via APC/C-CDH1 pathway in colorectal cancer cells. Oncotarget 2017, 8, 18832–18847. [Google Scholar] [CrossRef] [PubMed] [Green Version]
  54. Meplan, C.; Hesketh, J. Selenium and cancer: A story that should not be forgotten-insights from genomics. Cancer Treat. Res. 2014, 159, 145–166. [Google Scholar] [CrossRef] [PubMed]
  55. Short, S.P.; Williams, C.S. Selenoproteins in Tumorigenesis and Cancer Progression. Adv. Cancer Res. 2017, 136, 49–83. [Google Scholar] [CrossRef] [PubMed] [Green Version]
  56. Hurst, R.; Armah, C.N.; Dainty, J.R.; Hart, D.J.; Teucher, B.; Goldson, A.J.; Broadley, M.R.; Motley, A.K.; Fairweather-Tait, S.J. Establishing optimal selenium status: Results of a randomized, double-blind, placebo-controlled trial. Am. J. Clin. Nutr. 2010, 91, 923–931. [Google Scholar] [CrossRef] [Green Version]
  57. Xia, Y.; Hill, K.E.; Li, P.; Xu, J.; Zhou, D.; Motley, A.K.; Wang, L.; Byrne, D.W.; Burk, R.F. Optimization of selenoprotein P and other plasma selenium biomarkers for the assessment of the selenium nutritional requirement: A placebo-controlled, double-blind study of selenomethionine supplementation in selenium-deficient Chinese subjects. Am. J. Clin. Nutr. 2010, 92, 525–531. [Google Scholar] [CrossRef] [Green Version]
  58. Combs, G.F., Jr.; Jackson, M.I.; Watts, J.C.; Johnson, L.K.; Zeng, H.; Idso, J.; Schomburg, L.; Hoeg, A.; Hoefig, C.S.; Chiang, E.C.; et al. Differential responses to selenomethionine supplementation by sex and genotype in healthy adults. Br. J. Nutr. 2012, 107, 1514–1525. [Google Scholar] [CrossRef] [PubMed] [Green Version]
  59. Ashton, K.; Hooper, L.; Harvey, L.J.; Hurst, R.; Casgrain, A.; Fairweather-Tait, S.J. Methods of assessment of selenium status in humans: A systematic review. Am. J. Clin. Nutr. 2009, 89, 2025s–2039s. [Google Scholar] [CrossRef] [Green Version]
  60. Longnecker, M.P.; Stram, D.O.; Taylor, P.R.; Levander, O.A.; Howe, M.; Veillon, C.; McAdam, P.A.; Patterson, K.Y.; Holden, J.M.; Morris, J.S.; et al. Use of selenium concentration in whole blood, serum, toenails, or urine as a surrogate measure of selenium intake. Epidemiology 1996, 7, 384–390. [Google Scholar] [CrossRef] [PubMed]
  61. Allen, N.E.; Travis, R.C.; Appsleby, P.N.; Albanes, D.; Barnett, M.J.; Black, A.; Bueno-de-Mesquita, H.B.; Deschasaux, M.; Galan, P.; Goodman, G.E.; et al. Selenium and Prostate Cancer: Analysis of Individual Participant Data From Fifteen Prospective Studies. J. Natl. Cancer Inst. 2016, 108. [Google Scholar] [CrossRef] [PubMed] [Green Version]
Table 1. Selected baseline characteristics of CRC cases according to quintile of prediagnostic serum Se in the EPIC study.
Selenium, µg/L
Characteristic aQuintile 1Quintile 2Quintile 3Quintile 4Quintile 5
≤67.567.6–77.477.5–88.088.1–99.9≥100.0
(N = 197)(N = 201)(N = 198)(N = 199)(N = 198)
Selenium (µg/L), mean (SD)56.7 (9.0)72.6 (2.9)82.6 (2.8)94.2 (3.4)115.6 (18.4)
Selenoprotein P (mg/L), mean (SD)3.5 (0.8)4.1 (0.8)4.3 (0.7)4.6 (0.7)5.1 (0.9)
Age at diagnosis (years), mean (SD)62.6 (7.8)61.7 (7.1)62.5 (7.1)62.0 (7.6)62.7 (7.0)
BMI (kg/m2), mean (SD)26.4 (4.4)26.5 (4.3)26.8 (4.4)26.8 (4.6)26.9 (4.2)
Women, N (%)117 (59.4)114 (56.7)100 (50.5)94 (47.2)91 (46.0)
Location of primary tumor, N (%)
Colon139 (70.6)134 (66.7)123 (62.1)103 (51.8)127 (64.1)
Rectum58 (29.4)67 (33.3)75 (37.9)96 (48.2)71 (35.9)
Stage of tumor, N (%)
I28 (14.2)53 (26.4)38 (19.2)39 (19.6)35 (17.7)
II52 (26.4)37 (18.4)43 (21.7)45 (22.6)43 (21.7)
III62 (31.5)52 (25.9)67 (33.8)63 (31.7)77 (38.9)
IV24 (12.2)31 (15.4)24 (12.1)25 (12.6)19 (9.6)
Tumor grade, N (%)
Well differentiated11 (5.6)8 (4.0)15 (7.6)9 (4.5)7 (3.5)
Moderately differentiated69 (35.0)73 (36.3)57 (28.8)51 (25.6)34 (17.2)
Poorly differentiated18 (9.1)12 (6.0)13 (6.6)17 (8.5)10 (5.1)
Unknown99 (50.3)108 (53.7)113 (57.1)122 (61.3)147 (74.3)
Smoking status, N (%)
Never smoker80 (40.6)83 (41.3)79 (39.9)80 (40.2)72 (36.4)
Former smoker60 (30.5)56 (27.9)69 (34.9)66 (33.2)72 (36.4)
Current smoker56 (28.4)60 (29.9)49 (24.8)52 (26.1)54 (27.3)
Physical activity, N (%)
Inactive27 (13.7)35 (17.4)34 (17.2)29 (14.6)34 (17.2)
Moderately inactive59 (30.0)52 (25.9)58 (29.3)61 (30.7)64 (32.3)
Moderately active92 (46.7)87 (43.3)84 (42.4)89 (44.7)83 (41.9)
Active17 (8.6)24 (11.9)22 (11.1)20 (10.1)17 (8.6)
Self-reported diabetes, N (%)
No148 (75.1)156 (77.6)167 (84.3)151 (75.9)146 (73.7)
Yes13 (6.6)6 (3.0)6 (3.0)9 (4.5)15 (7.6)
Alcohol (grams/day), mean (SD)17.2 (24.5)15.8 (19.7)20.3 (23.3)17.9 (21.1)19.5 (21.9)
Overall mortality, N (%)103 (52.3)104 (51.7)104 (52.5)102 (51.3)101 (51.0)
CRC-specific mortality, N (%)83 (42.1)82 (40.8)79 (39.9)76 (38.2)75 (37.9)
a Unknown/missing values of categorical variables were classified as a separate category: smoking status (N = 5), diabetes (N = 176), physical activity (N = 5), stage of tumor (N = 136). Percentages may not add up to 100% in each category since unknown values were not excluded from the frequency calculations.
Table 2. HRs and 95% CIs for overall and CRC-specific mortality according to quintiles of prediagnostic serum Se and SELENOP among CRC cases in the EPIC study.
SeleniumSelenoprotein P
Deaths/Totalµg/LHR (95% CI)Deaths/Totalmg/LHR (95% CI)
Overall mortality
Age-, Sex-, Stage-adjusted a
Quintile 1103/197≤67.51.00 (ref)109/197≤3.531.00 (ref)
Quintile 2104/20167.6–77.41.07 (0.80–1.42)104/1993.54–4.060.96 (0.72–1.28)
Quintile 3104/19877.5–88.00.91 (0.68–1.22)95/1994.07–4.500.77 (0.57–1.02)
Quintile 4102/19988.1–99.90.91 (0.68–1.22)91/1974.51–5.060.75 (0.56–1.00)
Quintile 5101/198≥100.00.76 (0.56–1.02)114/198≥5.070.87 (0.65–1.15)
Ptrend b 0.04 0.27
per one SD c514/993 0.91 (0.83–1.00)513/990 0.95 (0.86–1.04)
Multivariable-adjusted d
Quintile 1103/197≤67.51.00 (ref)109/197≤3.531.00 (ref)
Quintile 2104/20167.6–77.41.05 (0.79–1.41)104/1993.54–4.061.00 (0.75–1.33)
Quintile 3104/19877.5–88.00.95 (0.71–1.27)95/1994.07–4.500.80 (0.59–1.07)
Quintile 4102/19988.1–99.90.93 (0.69–1.25)91/1974.51–5.060.74 (0.55–1.00)
Quintile 5101/198≥100.00.77 (0.57–1.03)114/198≥5.070.83 (0.62–1.11)
Ptrend b 0.04 0.17
per one SD c514/993 0.91 (0.83–1.00)513/990 0.94 (0.85–1.03)
CRC-specific mortality e
Age-, Sex-, Stage-adjusted a
Quintile 183/192≤67.51.00 (ref)87/193≤3.531.00 (ref)
Quintile 282/19867.6–77.41.06 (0.76–1.47)78/1913.54–4.060.99 (0.71–1.37)
Quintile 379/19277.5–88.00.93 (0.67–1.30)70/1944.07–4.500.73 (0.52–1.03)
Quintile 476/19488.1–99.90.88 (0.63–1.23)69/1964.51–5.060.70 (0.50–0.99)
Quintile 575/193≥100.00.73 (0.52–1.03)91/192≥5.070.92 (0.66–1.27)
Ptrend b 0.07 0.48
per one SD c395/969 0.91 (0.81–1.01)395/966 0.96 (0.86–1.07)
Multivariable-adjusted d
Quintile 183/192≤67.51.00 (ref)87/193≤3.531.00 (ref)
Quintile 282/19867.6–77.41.05 (0.76–1.46)78/1913.54–4.061.04 (0.74–1.44)
Quintile 379/19277.5–88.00.95 (0.68–1.32)70/1944.07–4.500.76 (0.54–1.07)
Quintile 476/19488.1–99.90.88 (0.63–1.24)69/1964.51–5.060.71 (0.50–1.00)
Quintile 575/193≥100.00.73 (0.52–1.02)91/192≥5.070.89 (0.64–1.24)
Ptrend b 0.06 0.39
per one SD c395/969 0.90 (0.81–1.00)395/966 0.95 (0.86–1.06)
a Adjusted for age, sex, and stage; stratified by country. b Ptrend was calculated using the median value of each Se or SELENOP quintile included as a continuous variable, adjusted for variables in the corresponding models. c One SD = 21.99 µg/L Se; one SD = 0.96 mg/L of SELENOP. d Adjusted for age, sex, stage, smoking status, BMI, site of primary tumor, year of diagnosis, and baseline diabetes; stratified by country. e Excluded 24 cases with missing cause of death.
Table 3. Multivariable-adjusted HRs and 95% CIs for an increment of one SD of Se or SELENOP for overall and CRC-specific mortality in sensitivity analyses and across strata of potential effect modifiers among CRC cases in the EPIC study.
Overall MortalityCRC-Specific Mortality a
Risk FactorDeaths/TotalHR (95% CI) bPtrend d or interaction cDeaths/TotalHR (95% CI) bPtrend d or interaction c
Selenium
All participants514/9930.91 (0.83–1.00)0.04 d395/9690.90 (0.81–1.00)0.06 d
Sensitivity analyses
Complete CRC stage data e450/8570.91 (0.82–1.00)0.05 d355/8390.92 (0.82–1.03)0.14 d
Imputed CRC stage data514/9930.92 (0.84–1.01)0.07 d395/9690.91 (0.82–1.02)0.09 d
Follow-up (years)
≥2257/7320.94 (0.83–1.07)0.37 d165/7110.94 (0.80–1.10)0.42 d
≥4158/6311.02(0.87–1.19)0.83 d77/6111.03 (0.84–1.28)0.76 d
Time between blood collection and diagnosis (years)
<2.6 176/3300.93 (0.78–1.12)0.03138/3250.89 (0.73–1.10)0.01
[2.6–4.8)175/3320.86 (0.73–1.01) 133/3210.84 (0.70–1.02)
≥4.8163/3311.00 (0.83–1.21) 124/3231.00 (0.80–1.25)
Stratified Analyses
Sex
Women252/5160.92 (0.80–1.06)0.52202/5050.93 (0.79–1.08)0.48
Men262/4770.87 (0.77–1.00) 193/4640.86 (0.73–1.01)
Age at diagnosis (years)
<62.4215/4970.94 (0.80–1.11)0.51184/4930.95 (0.80–1.13)0.38
≥62.4299/4960.89 (0.79–1.00) 211/4760.86 (0.75–0.99)
Cancer site
Colon333/6260.89(0.80–1.00)0.56255/6110.89 (0.78–1.01)0.87
Rectum181/3670.92 (0.77–1.09) 140/3580.90 (0.74–1.09)
Stage e
I–II128/4131.03 (0.84–1.25)0.1179/3991.08 (0.85–1.37)0.10
III–IV322/4440.90 (0.80–1.01) 276/4400.89 (0.78–1.01)
Region f
Northern194/3300.79 (0.68–0.91)0.03158/3250.75 (0.64–0.89)0.01
Central227/4360.97 (0.83–1.13) 163/4180.94 (0.79–1.13)
Southern93/2271.03 (0.81–1.30) 74/2261.21 (0.92–1.58)
Selenoprotein P
All participants513/9900.94 (0.85, 1.03)0.17 d395/9660.95 (0.86–1.06)0.39 d
Sensitivity analyses
Complete CRC stage data e450/8560.94 (0.84, 1.04)0.22 d355/8380.95 (0.86–1.06)0.39 d
Imputed CRC stage data513/9900.94 (0.86, 1.04)0.24 d395/9660.97 (0.87–1.08)0.58 d
Follow-up (years)
≥2257/7300.93 (0.82, 1.07)0.31 d165/7090.97 (0.82–1.15)0.74 d
≥4158/6290.99 (0.83, 1.17)0.88 d77/6091.10 (0.86–1.40)0.45 d
Time between blood collection and diagnosis (years)
<2.6176/3290.88 (0.74–1.05)0.15138/3240.88 (0.72–1.07)0.45
[2.6–4.8)175/3310.87(0.74–1.04) 133/3200.90 (0.74–1.10)
≥4.8162/3301.06(0.88–1.28) 124/3221.16 (0.93–1.44)
Stratified Analyses
Sex
Women252/5140.91(0.79–1.06)0.74202/5030.97 (0.82–1.15)0.76
Men261/4760.92(0.81–1.05) 193/4630.92 (0.79–1.08)
Age at diagnosis (years)
<62.4216/4970.91(0.78–1.07)0.66185/4930.91 (0.76–1.08)0.83
≥62.4297/4930.93(0.82–1.05) 210/4730.97 (0.84–1.12)
Cancer site
Colon332/6260.94(0.84–1.06)0.80255/6110.97 (0.85–1.10)0.84
Rectum181/3640.86(0.71–1.04) 140/3550.94 (0.76–1.17)
Stage e
I–II127/4100.95(0.78–1.15)0.9078/3961.09 (0.85–1.38)0.37
III–IV323/4460.95(0.84–1.08) 277/4420.96 (0.84–1.11)
Region f
Northern194/3300.88(0.77–1.01)0.49158/3250.90 (0.77–1.05)0.31
Central226/4320.96(0.82–1.13) 163/4140.94 (0.78–1.14)
Southern93/2281.03(0.79–1.34) 74/2271.20 (0.88–1.62)
a Excluded 24 cases with missing cause of death. b Adjusted for age, sex, stage, smoking status, BMI, site of primary tumor, year of diagnosis, and baseline diabetes. Stratified by country. c P for trend or interaction (as estimated by the likelihood ratio test). d P for trend. e Participants with missing data were not included in the analysis. f Geographic regions: Northern = Denmark; Central = UK, The Netherlands, Germany, North of France; Southern = South of France, Italy, Spain.
Publisher’s Note: MDPI stays neutral with regard to jurisdictional claims in published maps and institutional affiliations.

