Article

Flexural Performance of Prefabricated Ultra-High-Strength Textile Reinforced Concrete (UHSTRC): An Experimental and Analytical Investigation

by
Egodawaththa Ralalage Kanishka Chandrathilaka
,
Shanaka Kristombu Baduge
*,
Priyan Mendis
and
Petikirige Sadeep Madhushan Thilakarathna
Department of Infrastructure Engineering, The University of Melbourne, Melbourne 3052, VIC, Australia
*
Author to whom correspondence should be addressed.
Buildings 2020, 10(4), 68; https://doi.org/10.3390/buildings10040068
Submission received: 17 February 2020 / Revised: 30 March 2020 / Accepted: 31 March 2020 / Published: 2 April 2020
(This article belongs to the Collection Advanced Concrete Materials in Construction)

Abstract

:
Textile Reinforced Concrete (TRC) is a prefabricated novel lightweight high-performance composite material that can be used as a load-bearing or non-load-bearing component of prefabricated buildings. Making TRC with Ultra-High-Strength Concrete (UHSC) (≥100 MPa) can be considered as a potential improvement method to further enhance its properties. This paper investigated the performance of Ultra-High-Strength Textile Reinforced Concrete (UHSTRC) under flexural loading. A detailed experimental program was conducted to investigate the behavior of UHSC on TRC. In the experimental program, a sudden drop in load was observed when the first crack appeared in the UHSTRC. A detailed analytical program was developed to describe and understand such behavior of UHSTRC found in experiments. The analytical program was found to be in good agreement with the experimental results and it was used to carry out an extensive parametric study covering the effects of the number of textile layers, textile material, textile mesh density, and UHSTRC thickness on the performance of UHSTRC. Using a high number of textile layers in thin UHSTRC was found to be more effective than using high-thickness UHSTRC. The high modulus textile layers effectively increase the performance of UHSTRC.

1. Introduction

The use of Textile Reinforced Concrete (TRC) is increasing in recent years due to its superior properties, such as its excellent load-bearing capacity, high durability, fire-resistant nature, high corrosion resistance, and its various applications in construction [1,2,3,4,5,6]. A variety of materials can be used as textiles, including more common materials, such as carbon fiber, basalt fiber, and glass fiber [1,7]. As concrete cover required for the TRC is low due to the high corrosion resistance of the textile, TRC members can be fabricated with thinner sections compared to the conventional steel-reinforced sections [8,9]. This specific property of TRC is much more important in the context of using the TRC panels as facades in buildings [10,11]. Due to the thinner section of the TRC panels, they can be fabricated with larger dimensions and with less weight compared to the steel-reinforced concrete panels. Therefore, TRC can be considered as a potential composite material for the prefabricated building industry considering its higher strength-to-weight ratio so that it can be transported, handled on-site, and assembled easily.
Hegger et al. [12] compared the use of carbon and Alkali Resistance (AR) glass textiles as reinforcements in Normal Strength Concrete (NSC) structural elements to use as light-weight structural members. Carbon textile has shown to be more efficient over AR Glass textile in load-bearing capacity under both tensile and flexural loads. A significant linear correlation was also observed between the reinforcement percentage of TRC and ultimate tensile and flexural strengths in the range of 0.5%–2% reinforcement percentages. Du et al. [7] performed a four-point bending test to investigate the effect of the number of basalt textile layers, the percentage of steel short fibers, and the pre-stress level of the basalt textile layer on the flexural strength of the TRC. With increasing the number of textile layers from one to five, the flexural strength and toughness of the TRC have improved. Murgul et al. [13] investigated the effects of warp carbon rovings in glass fiber textile with warp glass rovings on the flexural strength of TRC. The ultimate flexural strength of TRC improved by 17% when using warp carbon rovings to replace the warp glass rovings in the textile. However, a 58% increment in ultimate flexural strength was observed in AR glass TRC compared to non-reinforced concrete section. Zhu et al. [14] studied the low-velocity flexural behavior of AR glass fabric textile reinforced cement composites with regard to the unchanged drop heights of the load, the stiffer beams had a higher load carrying capacity and a low ultimate deflection compared to the plate type specimens. Moreover, the maximum flexural stress and absorbed energy of the TRC increased with the drop height of the load. The plate type TRC specimens were observed to have an interlaminar shear failure at the ultimate loads.
The limited thickness and high slenderness of TRC lead to higher deflections with lower stiffness and a lower load-bearing capacity. Thus, using Ultra-High-Strength Concrete (UHSC) concrete can contribute to have stiff TRC with a higher load carrying capacity and a lower deflection due to the high modulus and high compressive strength of UHSC [15,16,17,18]. Achieving such a load carrying capacity can enhance the performance of TRC to use in lead-bearing components. Increased stiffness can contribute to improving the serviceability performance of TRC, which is the governing factor in façade elements.
However, the use of UHSC in TRC was not thoroughly investigated [19,20]. UHSC was found to have a higher performance level in confined concrete columns and concrete beams [21,22]. The use of UHSC as the matrix to bind the textile can lead to have much thinner TRC sections compared to normal strength concrete TRC. The high stiffness of UHSC can contribute to having a better load-deflection performance in Ultra-High-Strength Textile Reinforced Concrete (UHSTRC).
Conducting experiments to evaluate the performance of a structural system was found to be expensive and time-consuming. Proper analytical models were found to be more effective in describing the behavior of structural elements [23,24]. An analytical model, which was prepared to capture the flexural behavior of UHSTRC can be used to conduct parametric studies to identify the parameters that affect the performance of UHSTRC and optimized the UHSTRC without performing multiple experiments.
This paper aims to investigate the flexural behavior including failure mechanisms of UHSTRC. Four-point bending tests were carried out to investigate the flexural performance of UHSTRC. An analytical model will be developed to predict the moment–curvature behavior of UHSTRC under flexure. Parametric studies will be carried out to investigate the performance of UHSTRC under varying parameters.

2. Experimental Program

A detailed test program was conducted to determine the flexural behavior of UHSTRC samples.

2.1. Material Properties

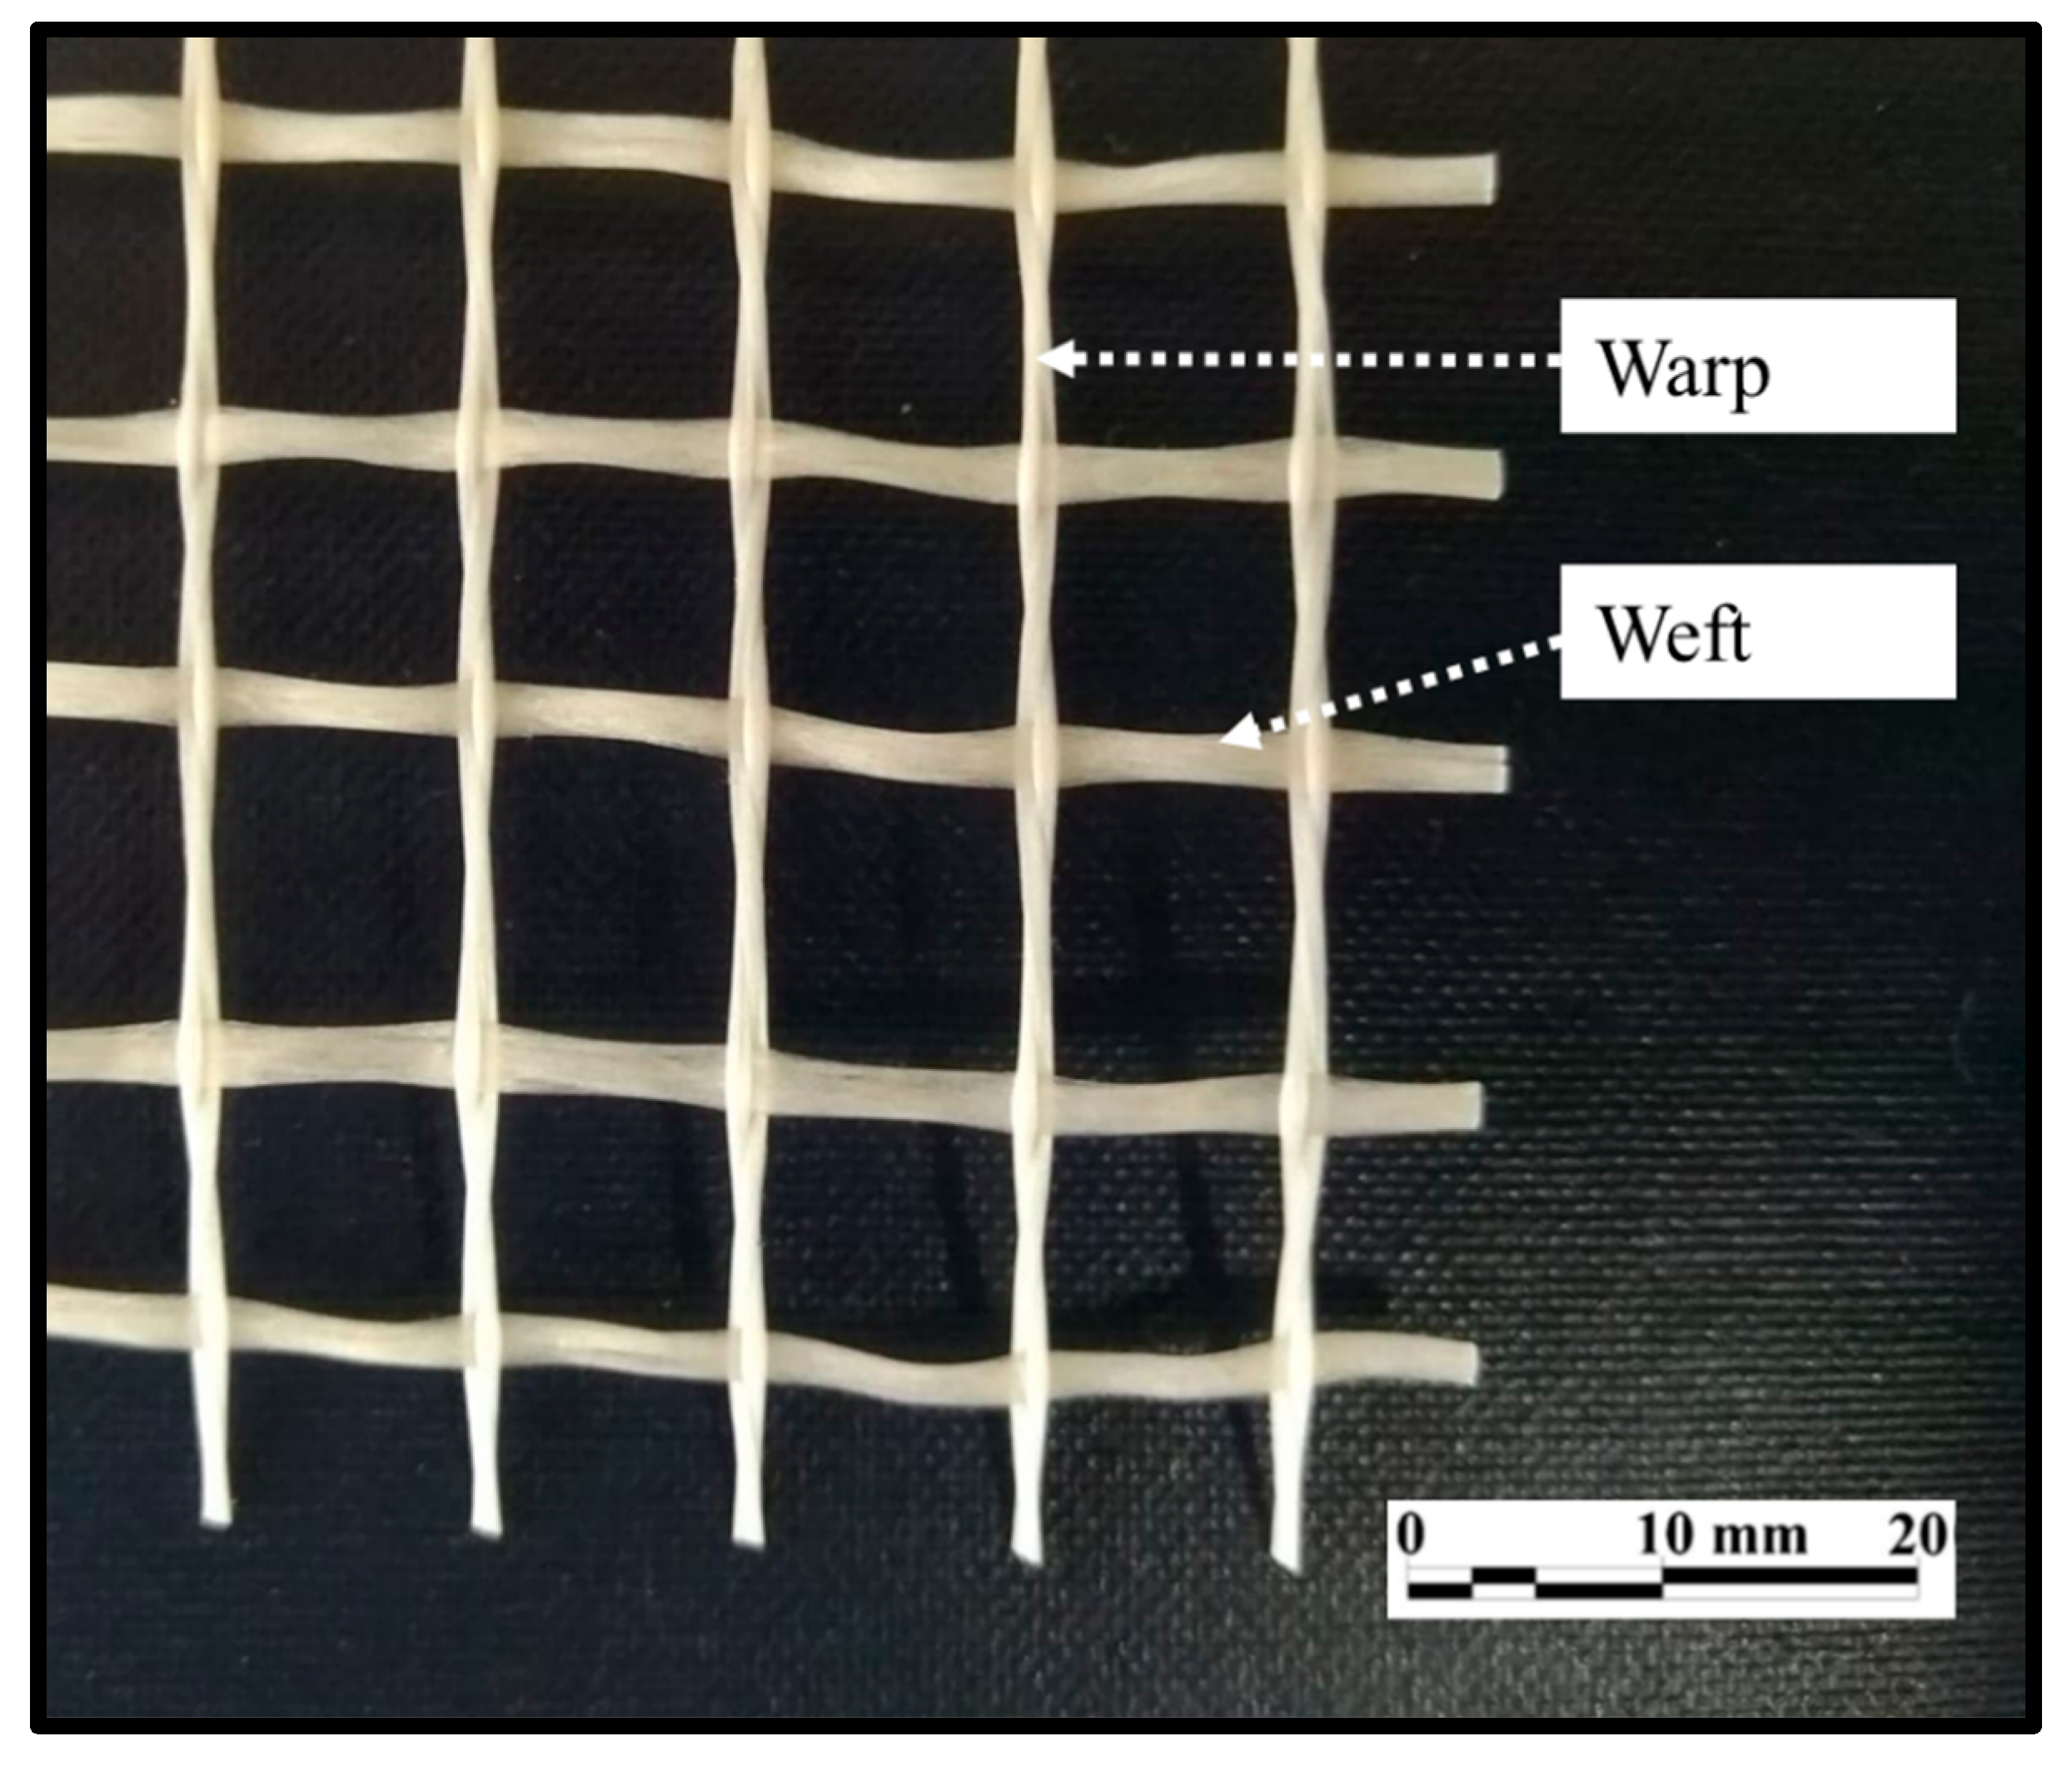
2.1.1. Glass Fiber Textile

Two-dimensional Alkali Resistance glass (AR glass) fiber textile mesh was used in the experiment. As shown in Figure 1, the warp and weft of the textile mesh was woven to be perpendicular to each other to maintain a mesh size of 10 mm × 10 mm. The glass fiber textiles were placed in the TRC specimens as internal reinforcements to coincide with the two principal directions of the specimen. The warp roving of textile was placed in the longitudinal direction of beam-type TRC samples.

2.1.2. Mortar Mix

A fine-grained UHSC mortar with high workability and a self-compacting property was used in the experiment program. The maximum size of fine aggregate was selected to be 1 mm to allow the concrete matrix to easily flow through the grids of the textile. Coarse aggregates were not used in the mortar mix as it is required to flow through the grids of the textile with an aperture of 10 mm, and the overall thickness of the sample is 16 mm. Commercially available superplasticizer (high-range water-reducing) was used to reduce the water-to-binder ratio to a lower value of 0.22, thus increasing the 28-days compressive strength of concrete while retaining the high workability of the concrete. A commercially available viscosity modifying admixture was used to increase the viscosity of fresh concrete for reducing the segregation and bleeding occurring in the concrete. The mix design for the UHSC is shown in Table 1. Compressive tests were carried out on 7 days and 28 days to find the compressive strength of UHSC mortar as per ASTM C39/C39M – 18 [25]. It was found that the compressive strengths of UHSC concrete of 7 and 28 days were 74.5 MPa and 100 MPa, respectively.

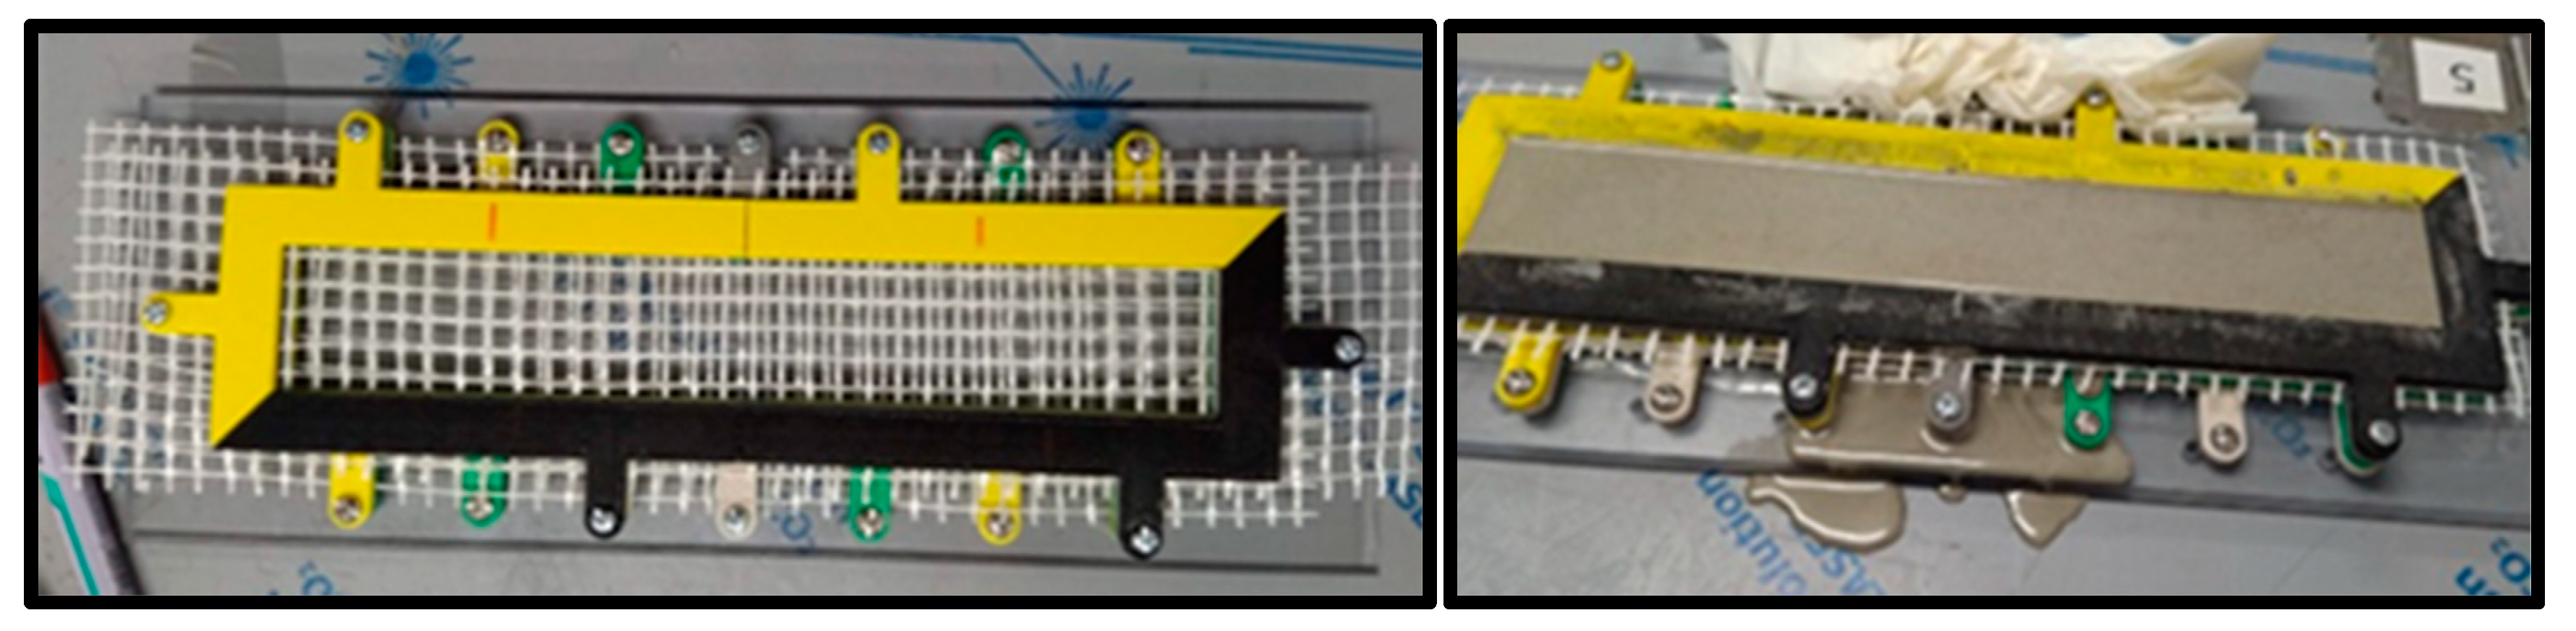
2.2. Preparation of Specimens

In this study, UHSTRC samples were prepared with dimensions of 320 mm length, 50 mm width, and 16 mm thickness in accordance with ASTM D 7264/7264M [26]. Two identical samples were prepared to be tested in the same experimental case.
Plastic molds were used to prepare the UHSTRC samples, and steel bolts were used to set the mold and hold the textile without sagging, as shown in Figure 2. The textile was cut into pieces larger than the actual specimen size to properly fit it into the mold. UHSTRC samples were prepared with one to three textile layers embedded in the UHSC matrix through the thickness and along the longitudinal direction of the sample. Concrete mix, which was made in accordance with the mix design shown in Table 2, was poured into the mold. The fresh TRC sample was subjected to mechanical vibration until all the air bubbles trapped inside the concrete was released. Then, the sample was placed on a level surface for 24 hours at room temperature (20 °C) for hardening. After the hardening, the sample was removed from the molds and placed in a curing tank filled with water at 20 ± 1 °C until the test date. The samples were named as the following format: TRC-L2-s1. The first term-TRC-stands for Textile Reinforced Concrete, the second term-L2-stands for the number of textile layers, and the last term-s1-stands for the sample number.

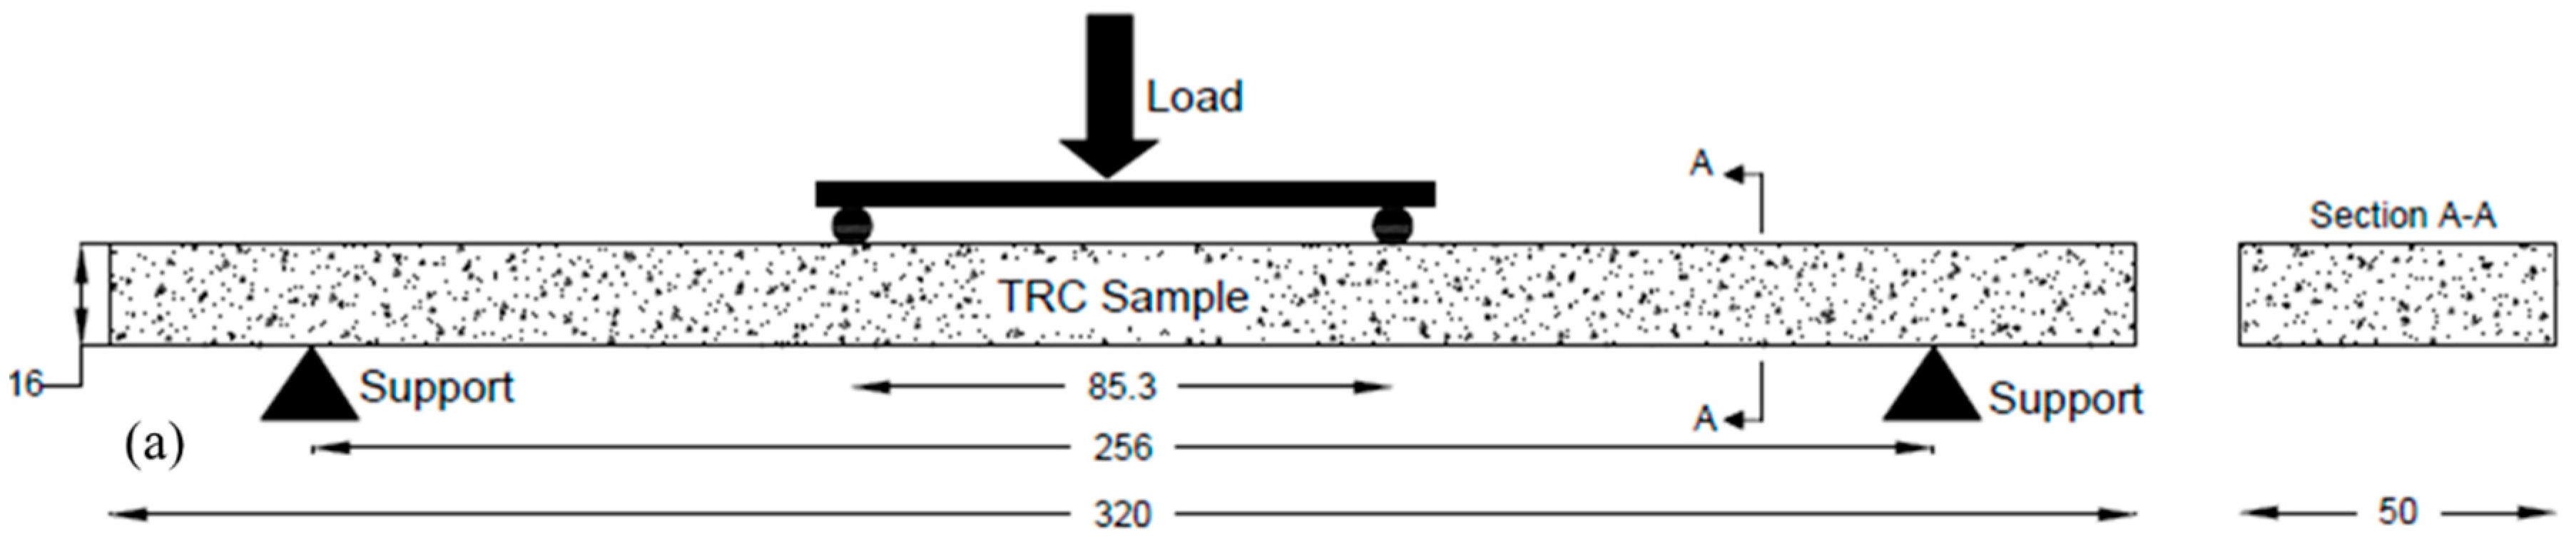
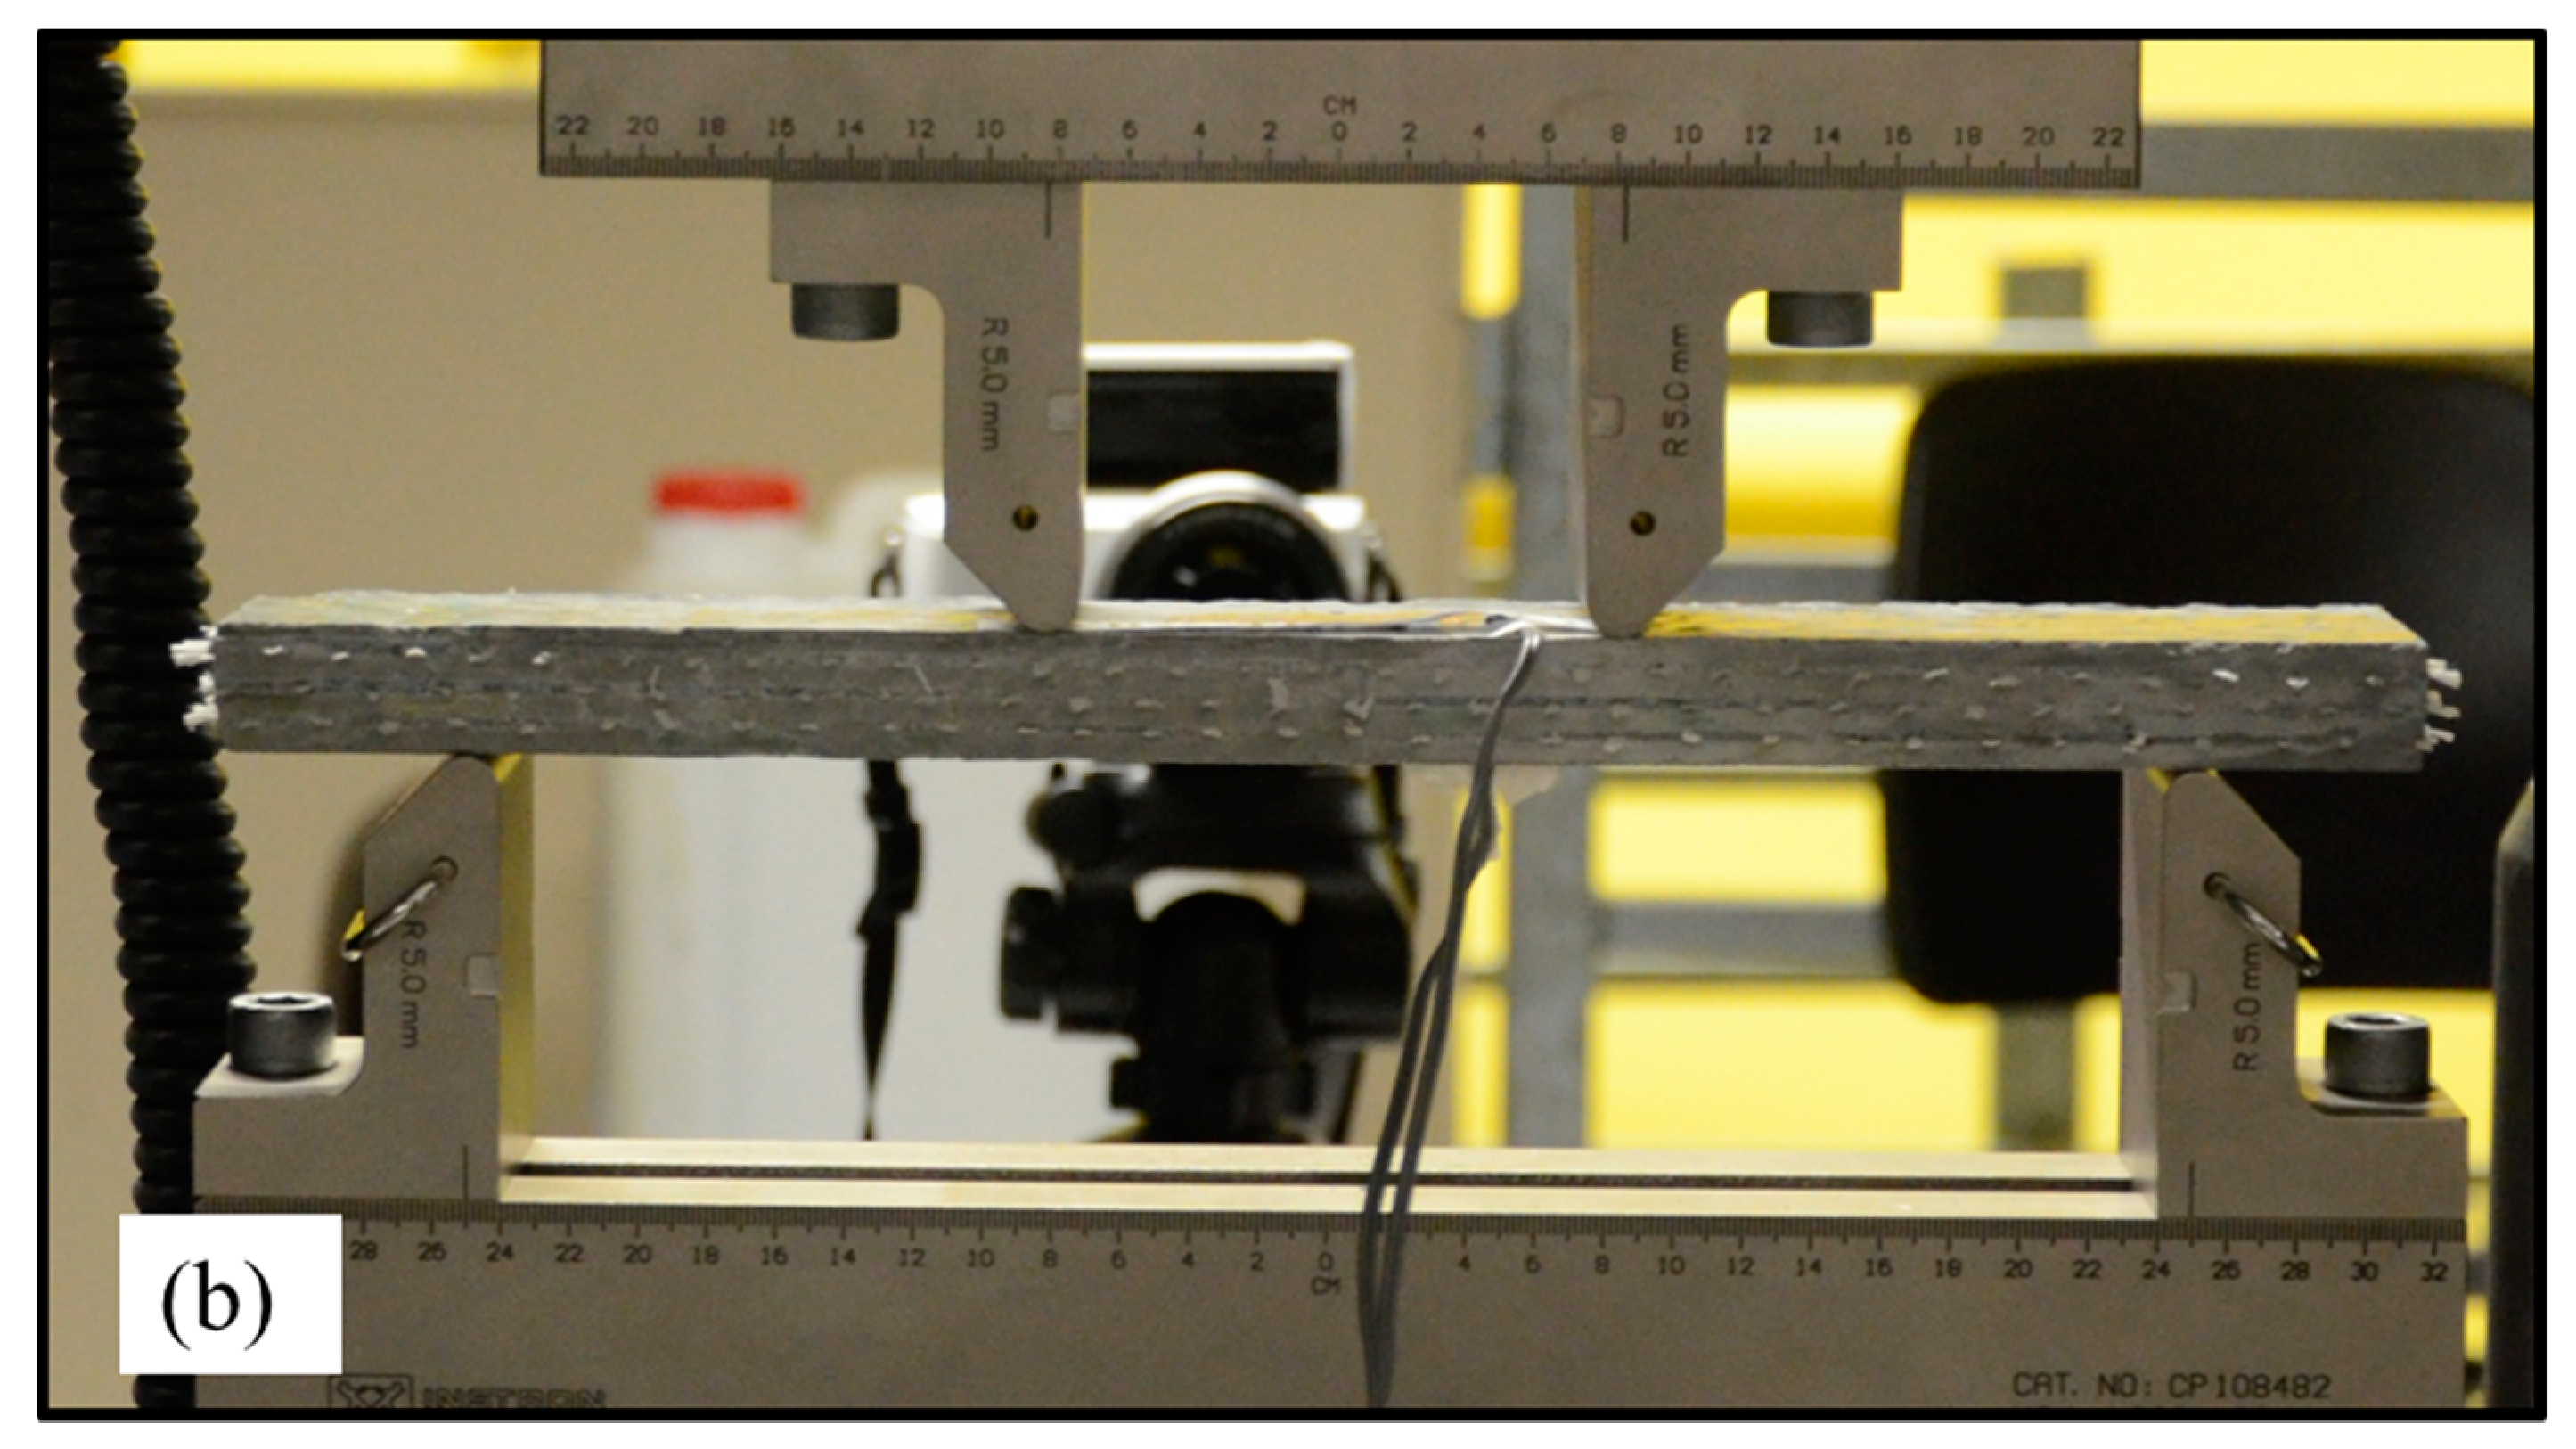
2.3. Flexural Test Set-Up

The four-point bending test was conducted to determine the flexural behavior of the UHSTRC samples. A constant displacement rate of 1 mm/min was applied per the ASTM D 7264/7264M [26]. The Instron testing machine was used to load the HSTRC samples with a load cell of 50 kN capacity. The load and flexural deflection of the specimen was recorded at one second intervals until the failure of the specimen. The schematic diagram of the loading arrangement and snapshot of the loading setup is shown in Figure 3.

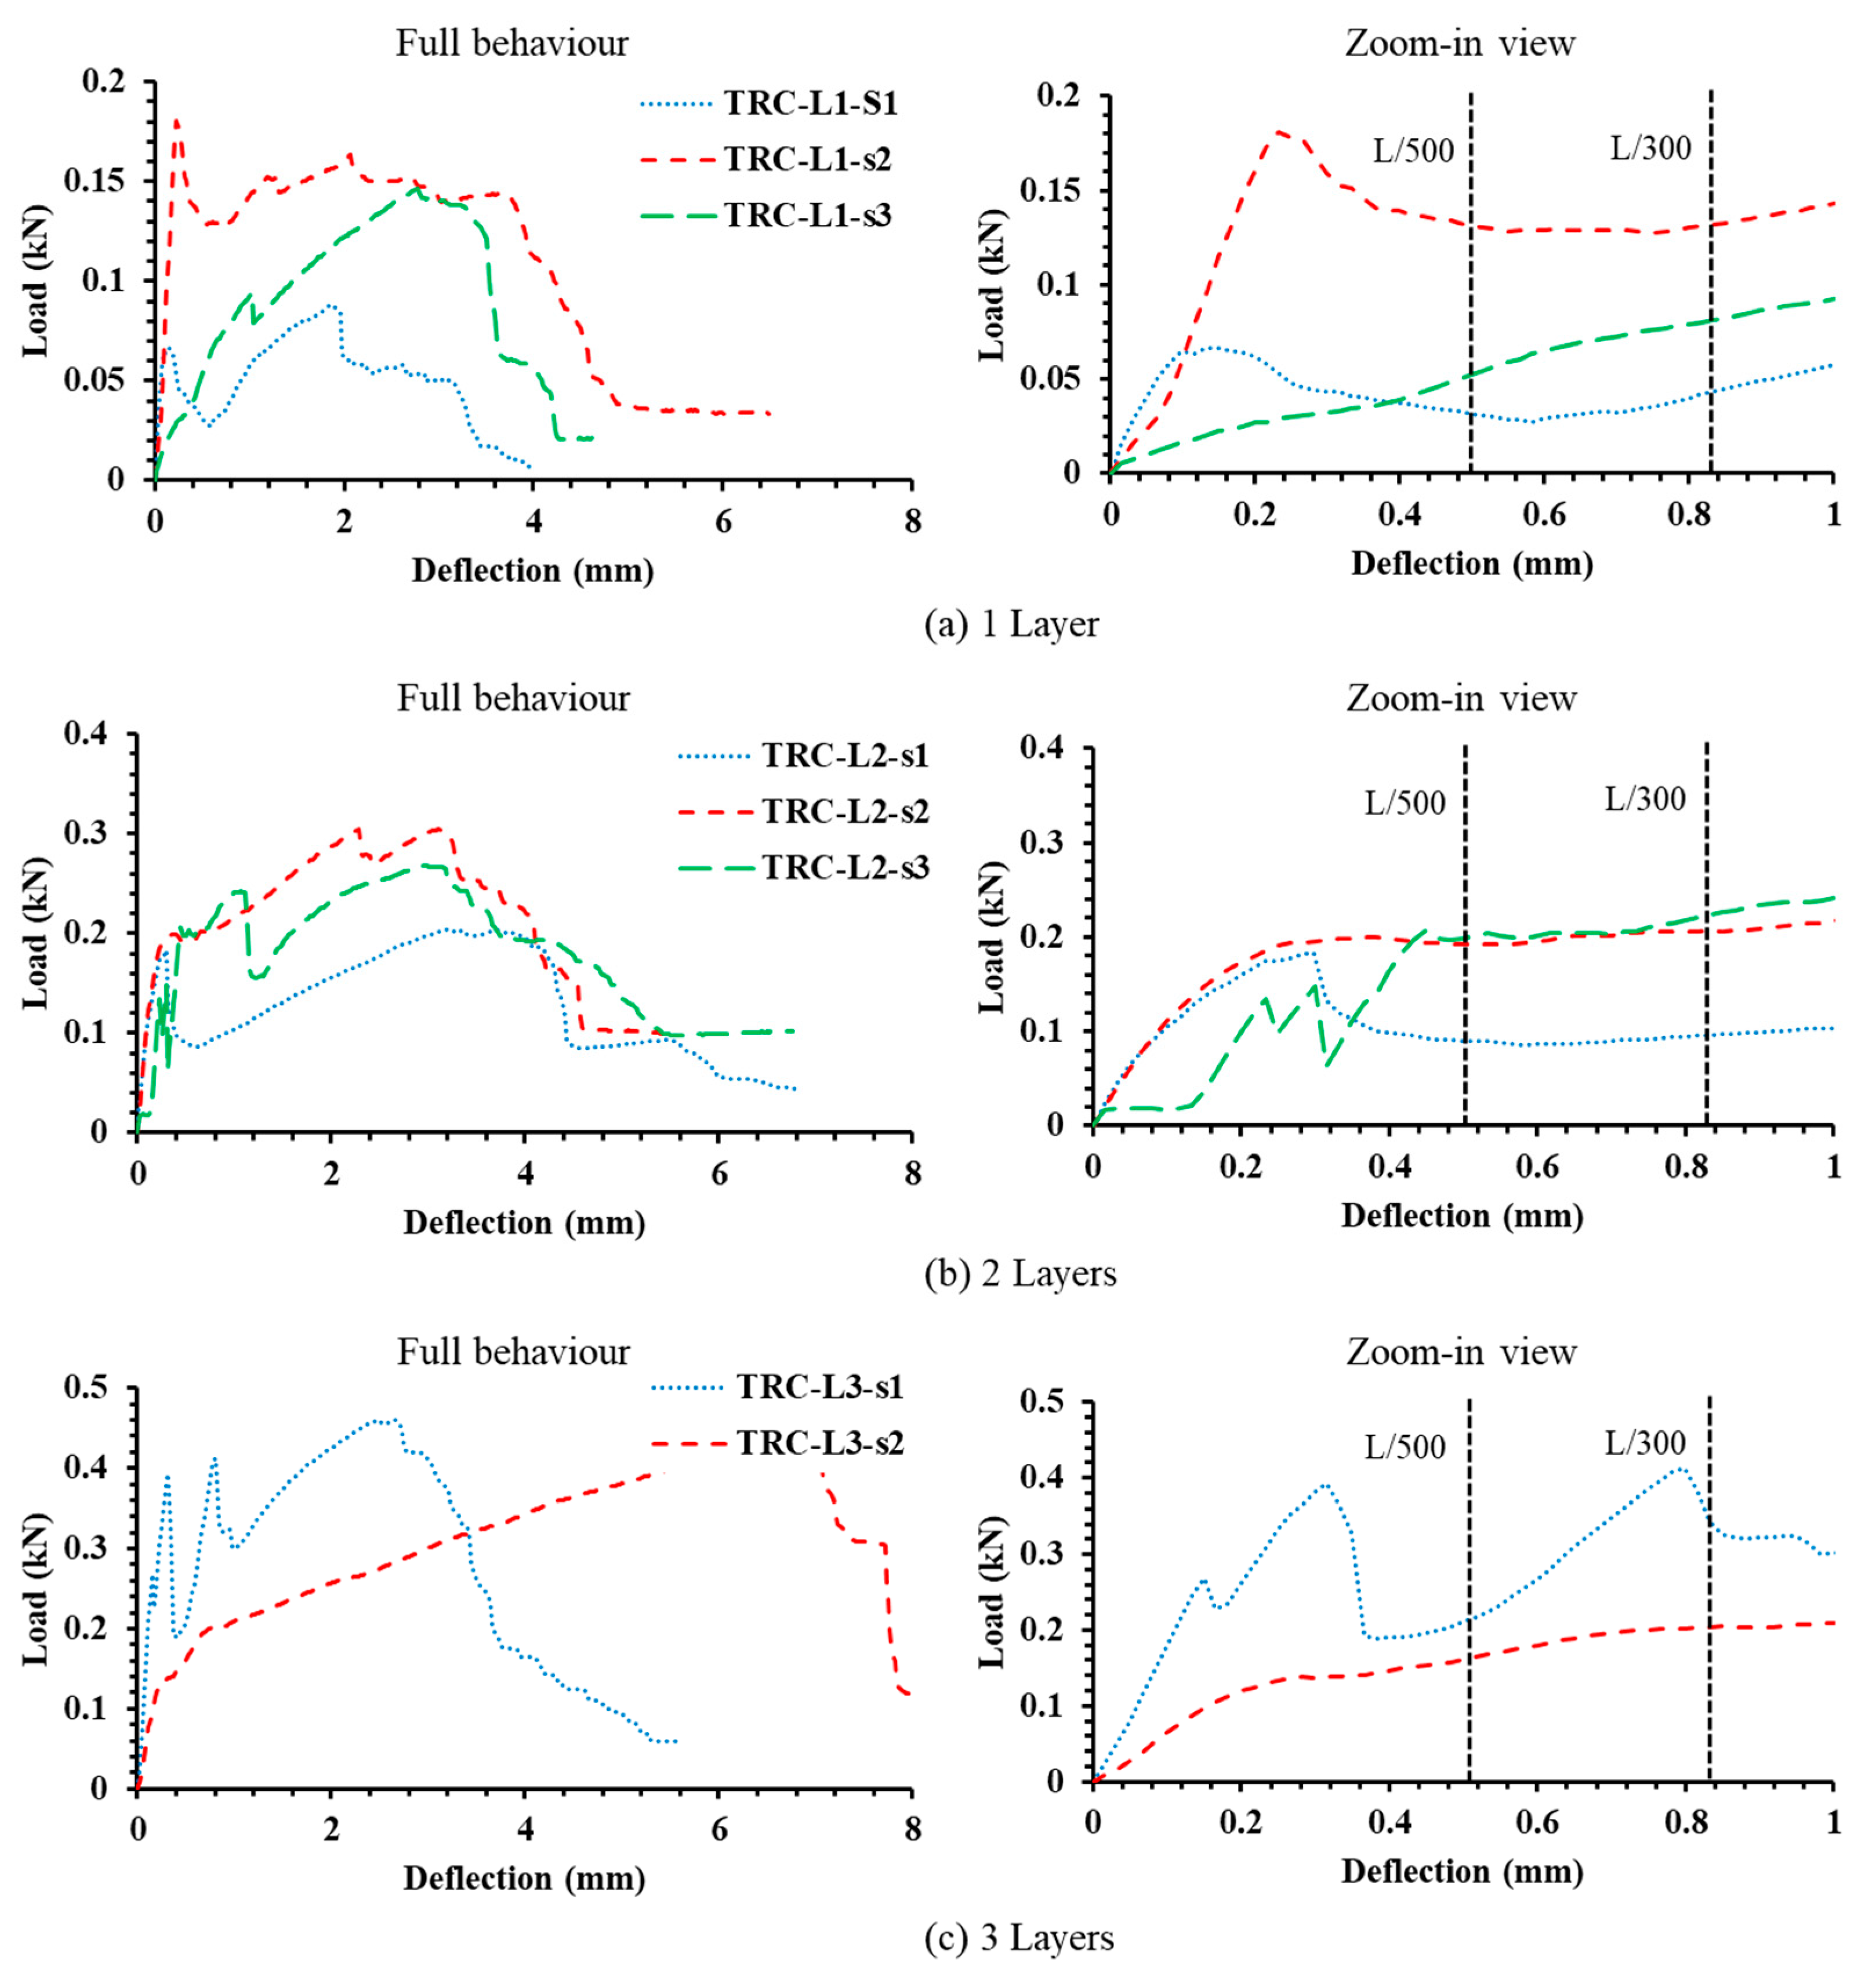
3. Experimental Results

The flexural testing results of TRC samples at ambient conditions were listed in Table 3. The ultimate and first crack flexural stress of the TRC samples was calculated using the following Equation (1) [7]. The ultimate flexural load was observed when the bottom-most textile layer was subjected to rupture. All UHSTRC samples were found to be failed after the rupture of the bottom textile layer. Load vs. deflection curves and the corresponding moment vs. curvature curves are given in Figure 4.
σ = P l b h 2
where P is the ultimate or first crack load, σ is the ultimate load or first crack load depending on P, b is the width of the sample, and h is the height of the sample.
The number of textile layers per specimen had a significant effect on both the ultimate flexural strength and the peak deflection. Average increase of 117% and 280% in ultimate flexural strength was observed when the number of textile layers increased from 1 layer to 2 and 3 layers, respectively. The UHSTRC has shown linear stress–strain behavior in the initial loading conditions. After the first crack appearance in UHSC, a sudden drop was observed in load. Then, the load started to increase and reached its ultimate value. The sudden drop was due to the load-bearing mechanism changing from UHSC to textile layer after the cracking of the mortar. The sudden drop of load was more visible in TRC-L1 samples compared to TRC-L3 samples. The use of a higher number of textile layers has decreased the time taken to shift the load-bearing mechanism from HSC to textile after the first crack. The two sudden drops in TRC-L3-s1 can be caused by the initiation of two separate cracks at a small time interval. The two-point loading mechanism used in the experiment can cause a uniform moment distribution between two loading points, which can lead to multiple crack formation due to the inconsistency in the UHSTRC sample. After it reached the ultimate load, the cracks in all specimens started to widen, while the load decreased rapidly. The behavior of all UHSTRC samples was the same with having a higher number of cracks in TRC-L3 samples compared to TRC-L2 and TRC-L1 samples. It was observed that the peak flexural stress to yield flexural stress ratio was increasing with inclusion of each textile layer in average 1, 1.5, and 1.7. However, significant change in the deflection corresponding to the peak stress and yield stress was not observed in any sample. The increased area enclosed in the load–deflection curve with the number of textile layers of the UHPTRC sample showed the high-energy dissipation of UHSTRC. The load–deflection curve variation observed in the TRC-L3-s2 sample might be caused by a continuous slip in textile layer after TRC reaches the yield point.
Figure 5 illustrates the load–deflection behavior of UHSTRC with the corresponding zoom-in view with the serviceability limit conditions of L/300 and L/500 (where L is the span of UHSTRC element) [27]. It was observed that the deflection of UHSTRC reaches the theoretical serviceability condition of L/300 and L/500 after the sudden drops observed in load for all samples. Therefore, the actual serviceability deflection was lower than the anticipated serviceability conditions of L/300 and L/500. Therefore, the yield load observed in UHSTRC should be considered as the serviceability load and the deflection corresponding to the yield load should be considered as the serviceability limit for the UHSTRC. Although an increase in the number of textile layers was found to increase the ultimate load and ultimate deflection, the serviceability deflection did not change. However, the increase in serviceability load was observed since the cracking load was found to be increasing with the addition of textile layers. The use of three textile layers was found to have a 130% and 110% increase in serviceability load in UHSTRC compared to one- and two-textile-layer UHSTRC, respectively

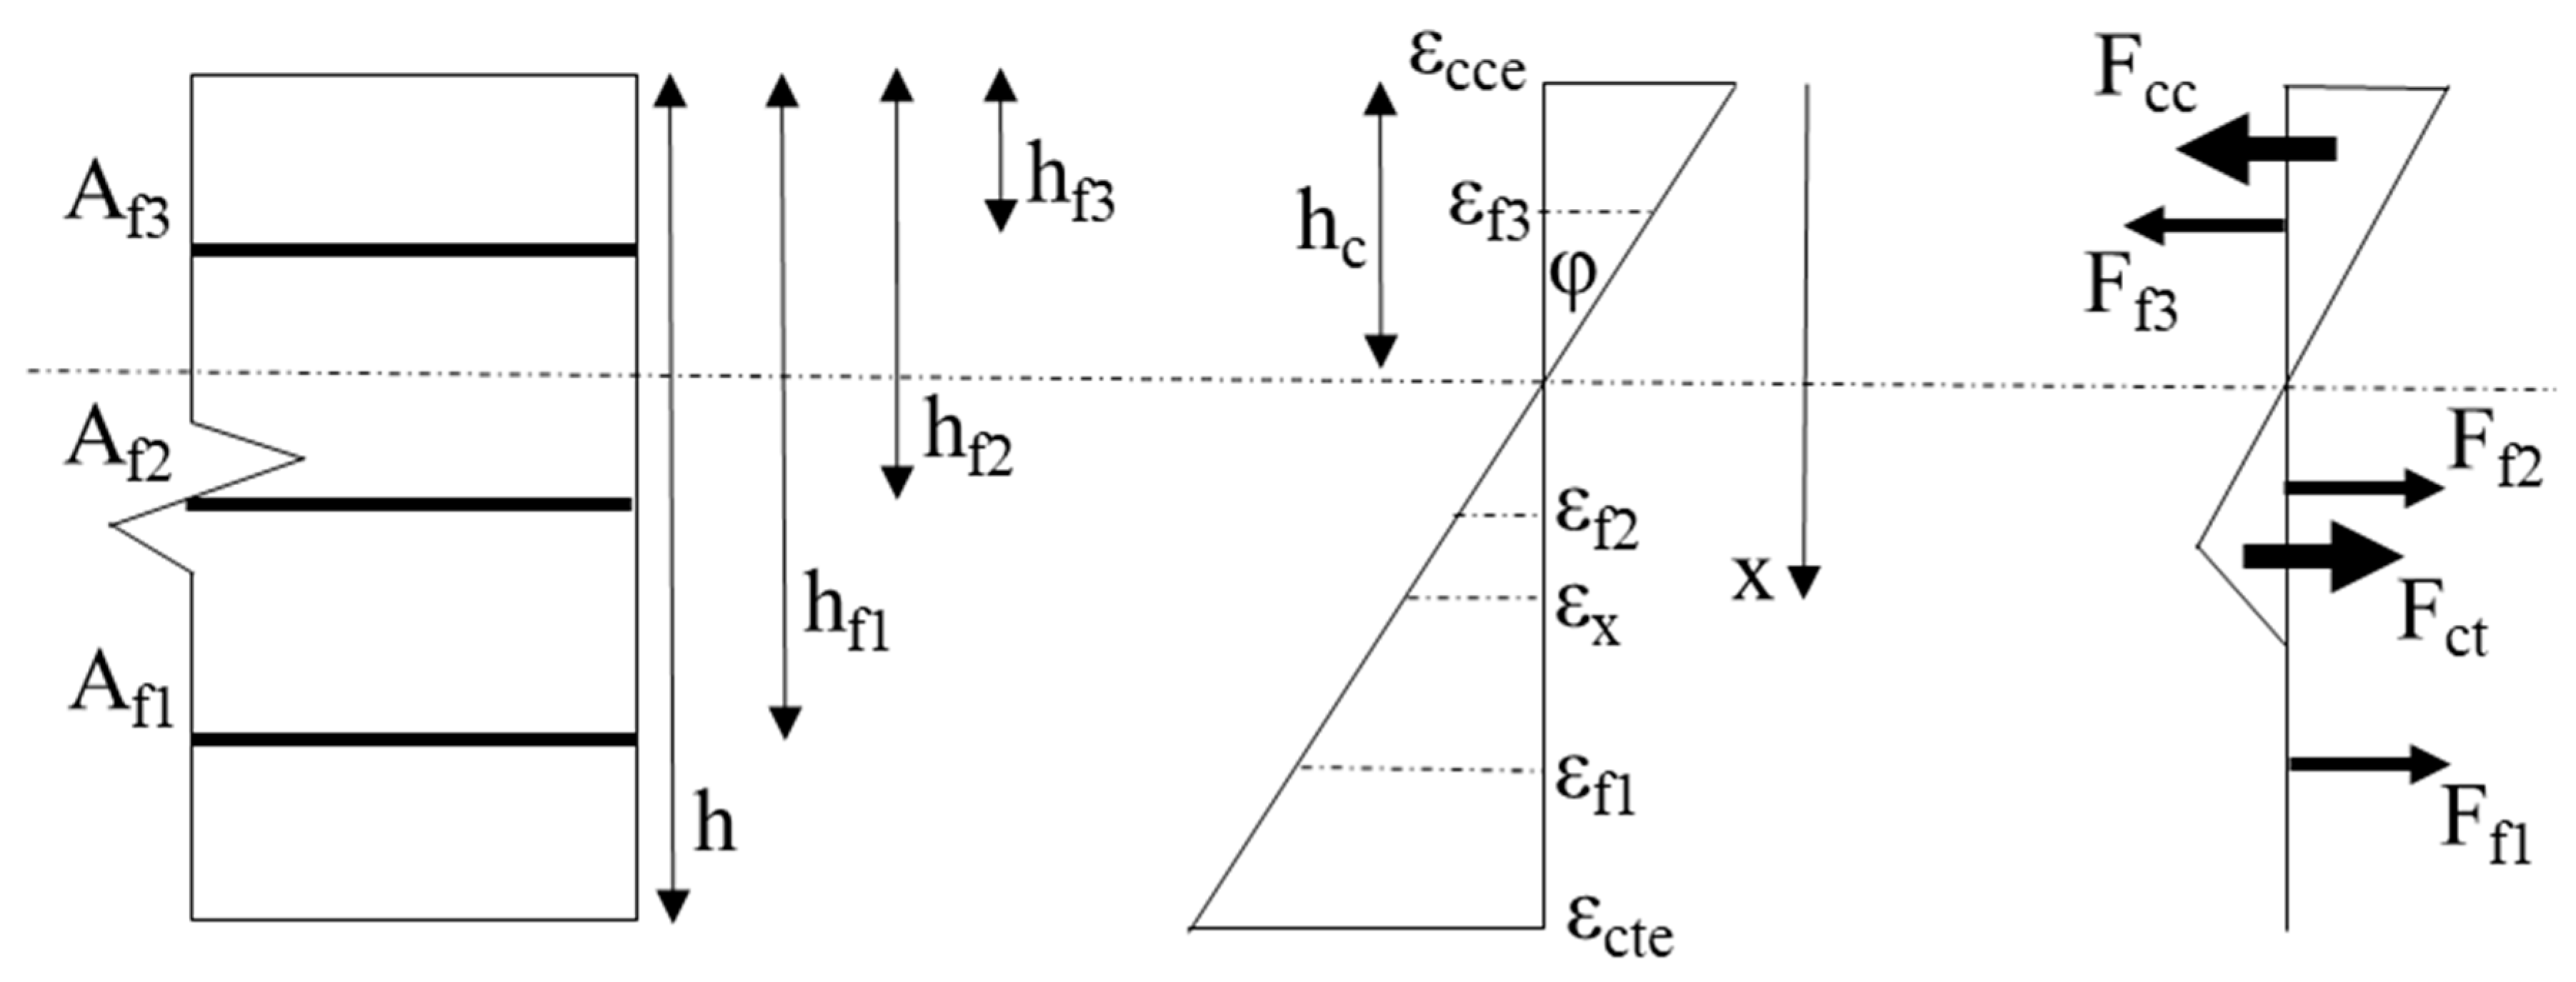
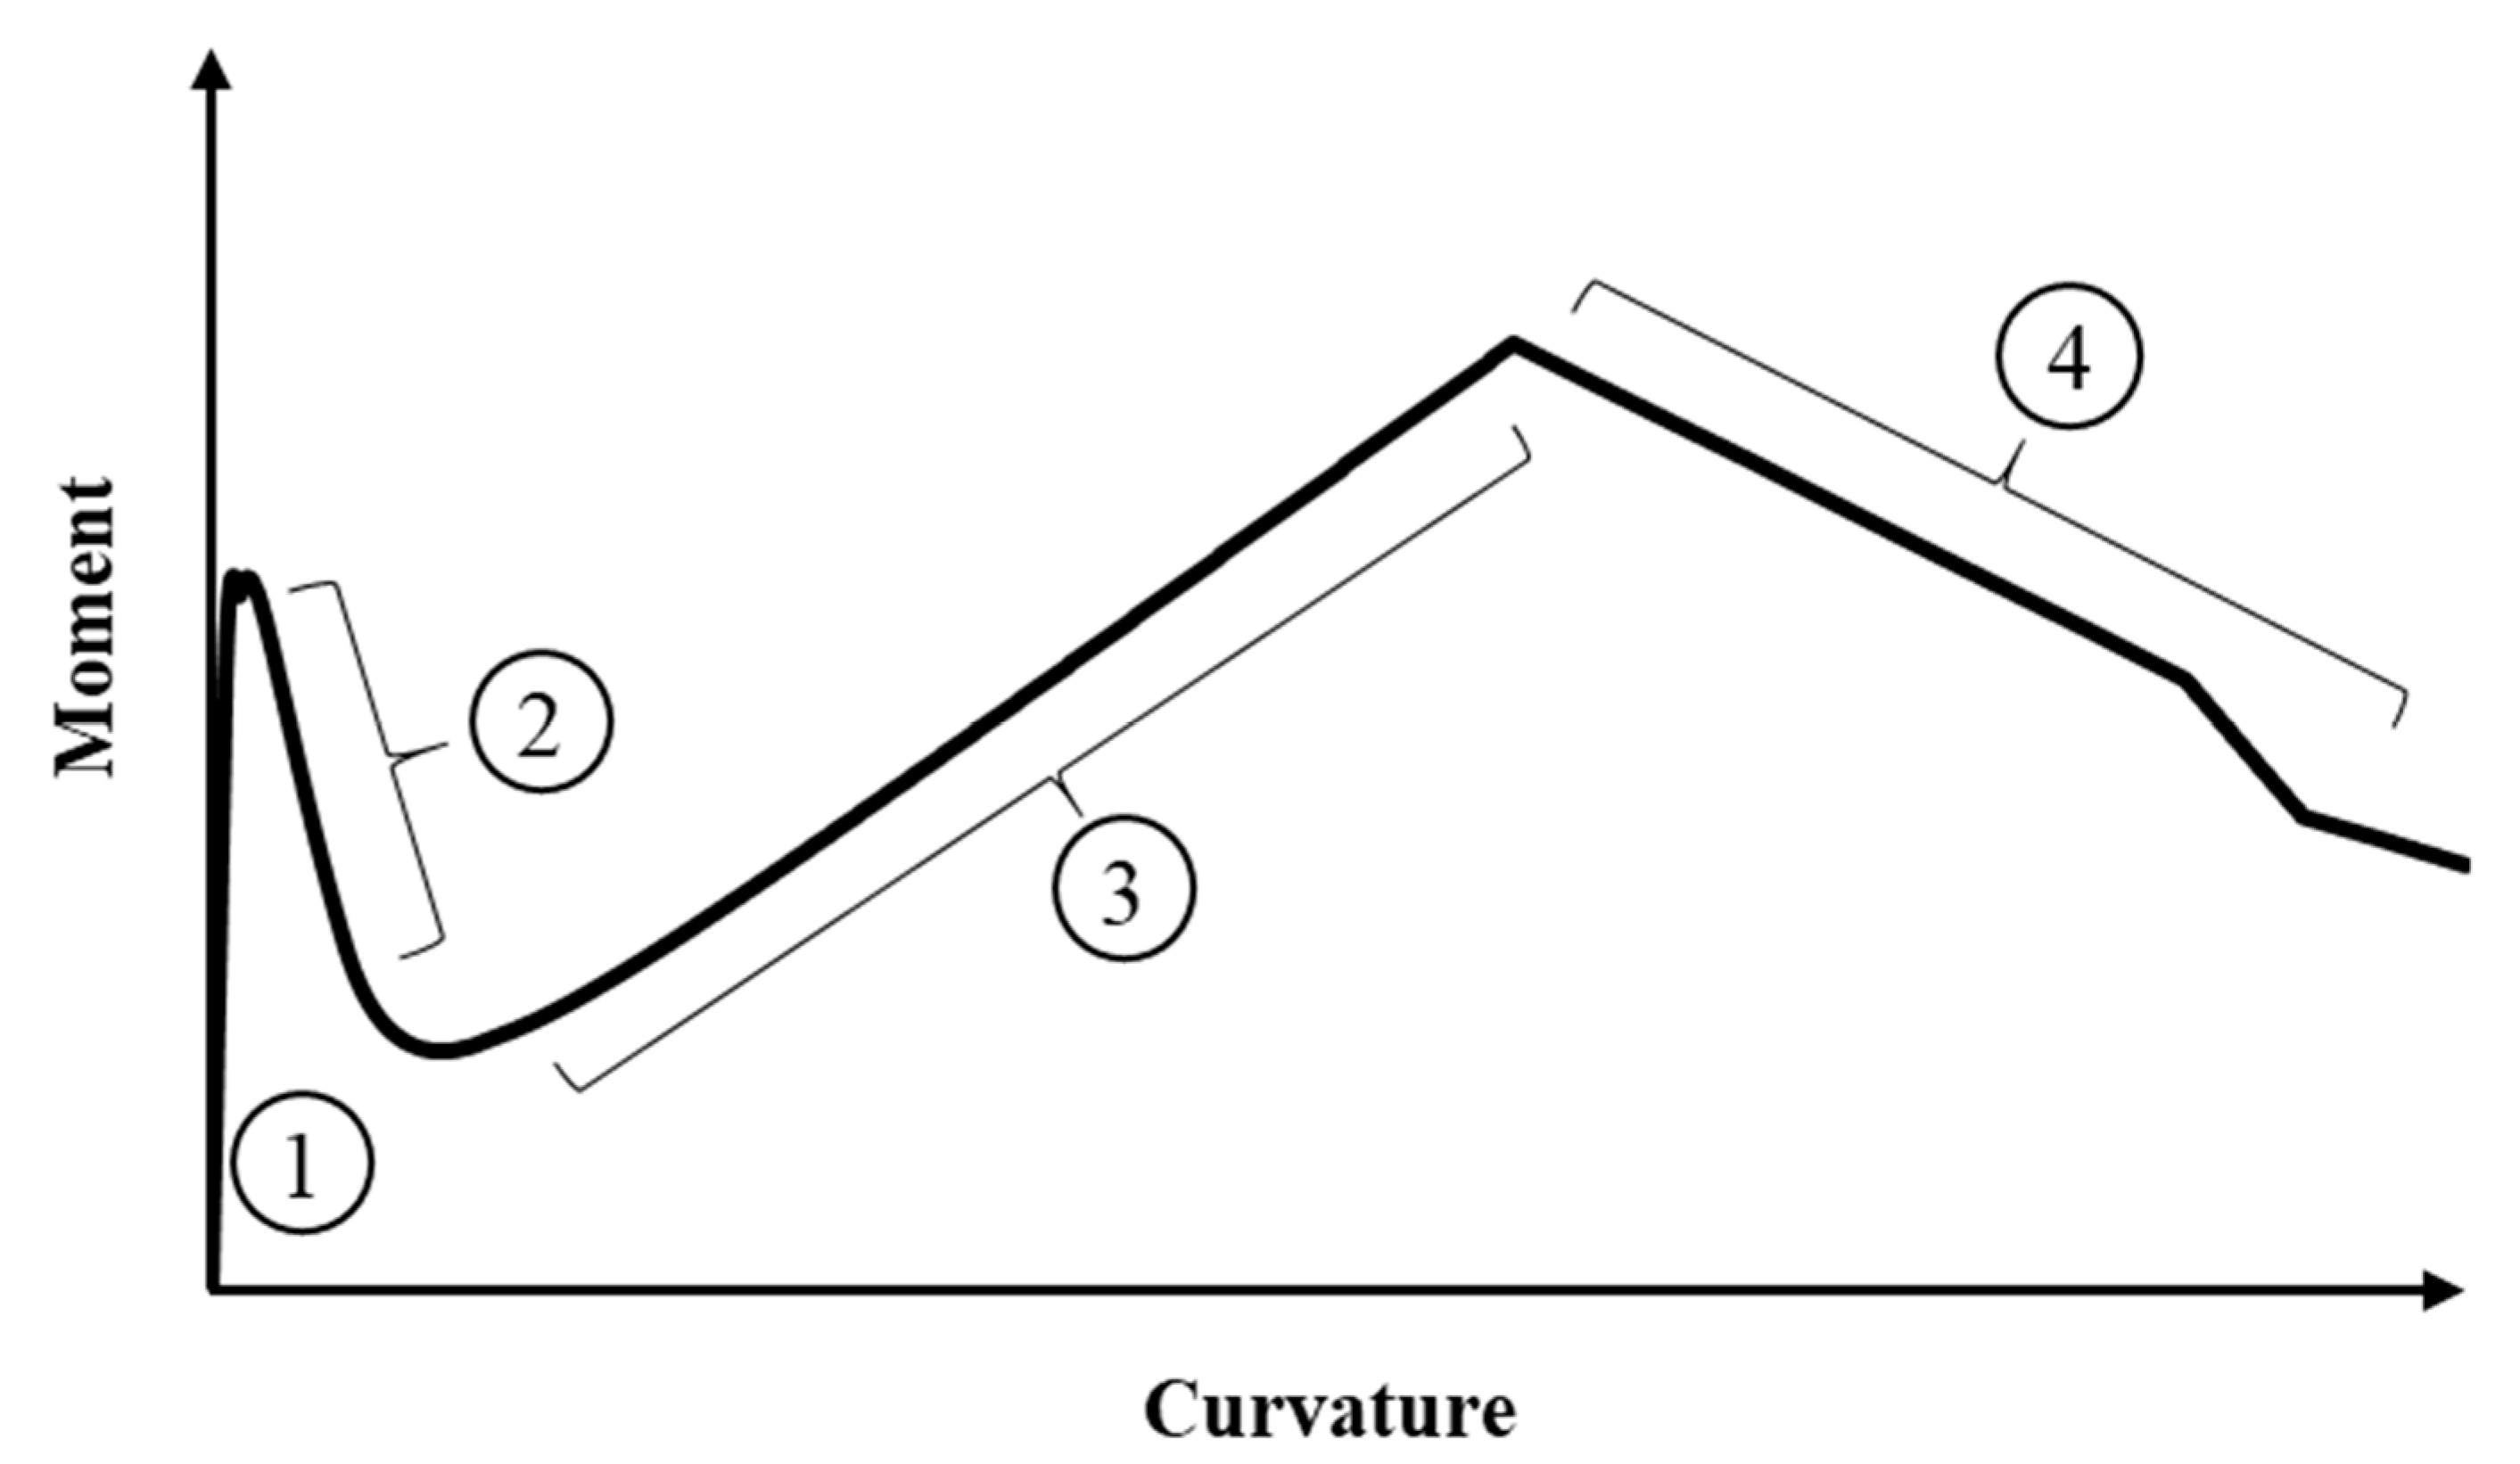
4. Analytical Model to Predict the Moment–Curvature Behavior of TRC Under Flexure

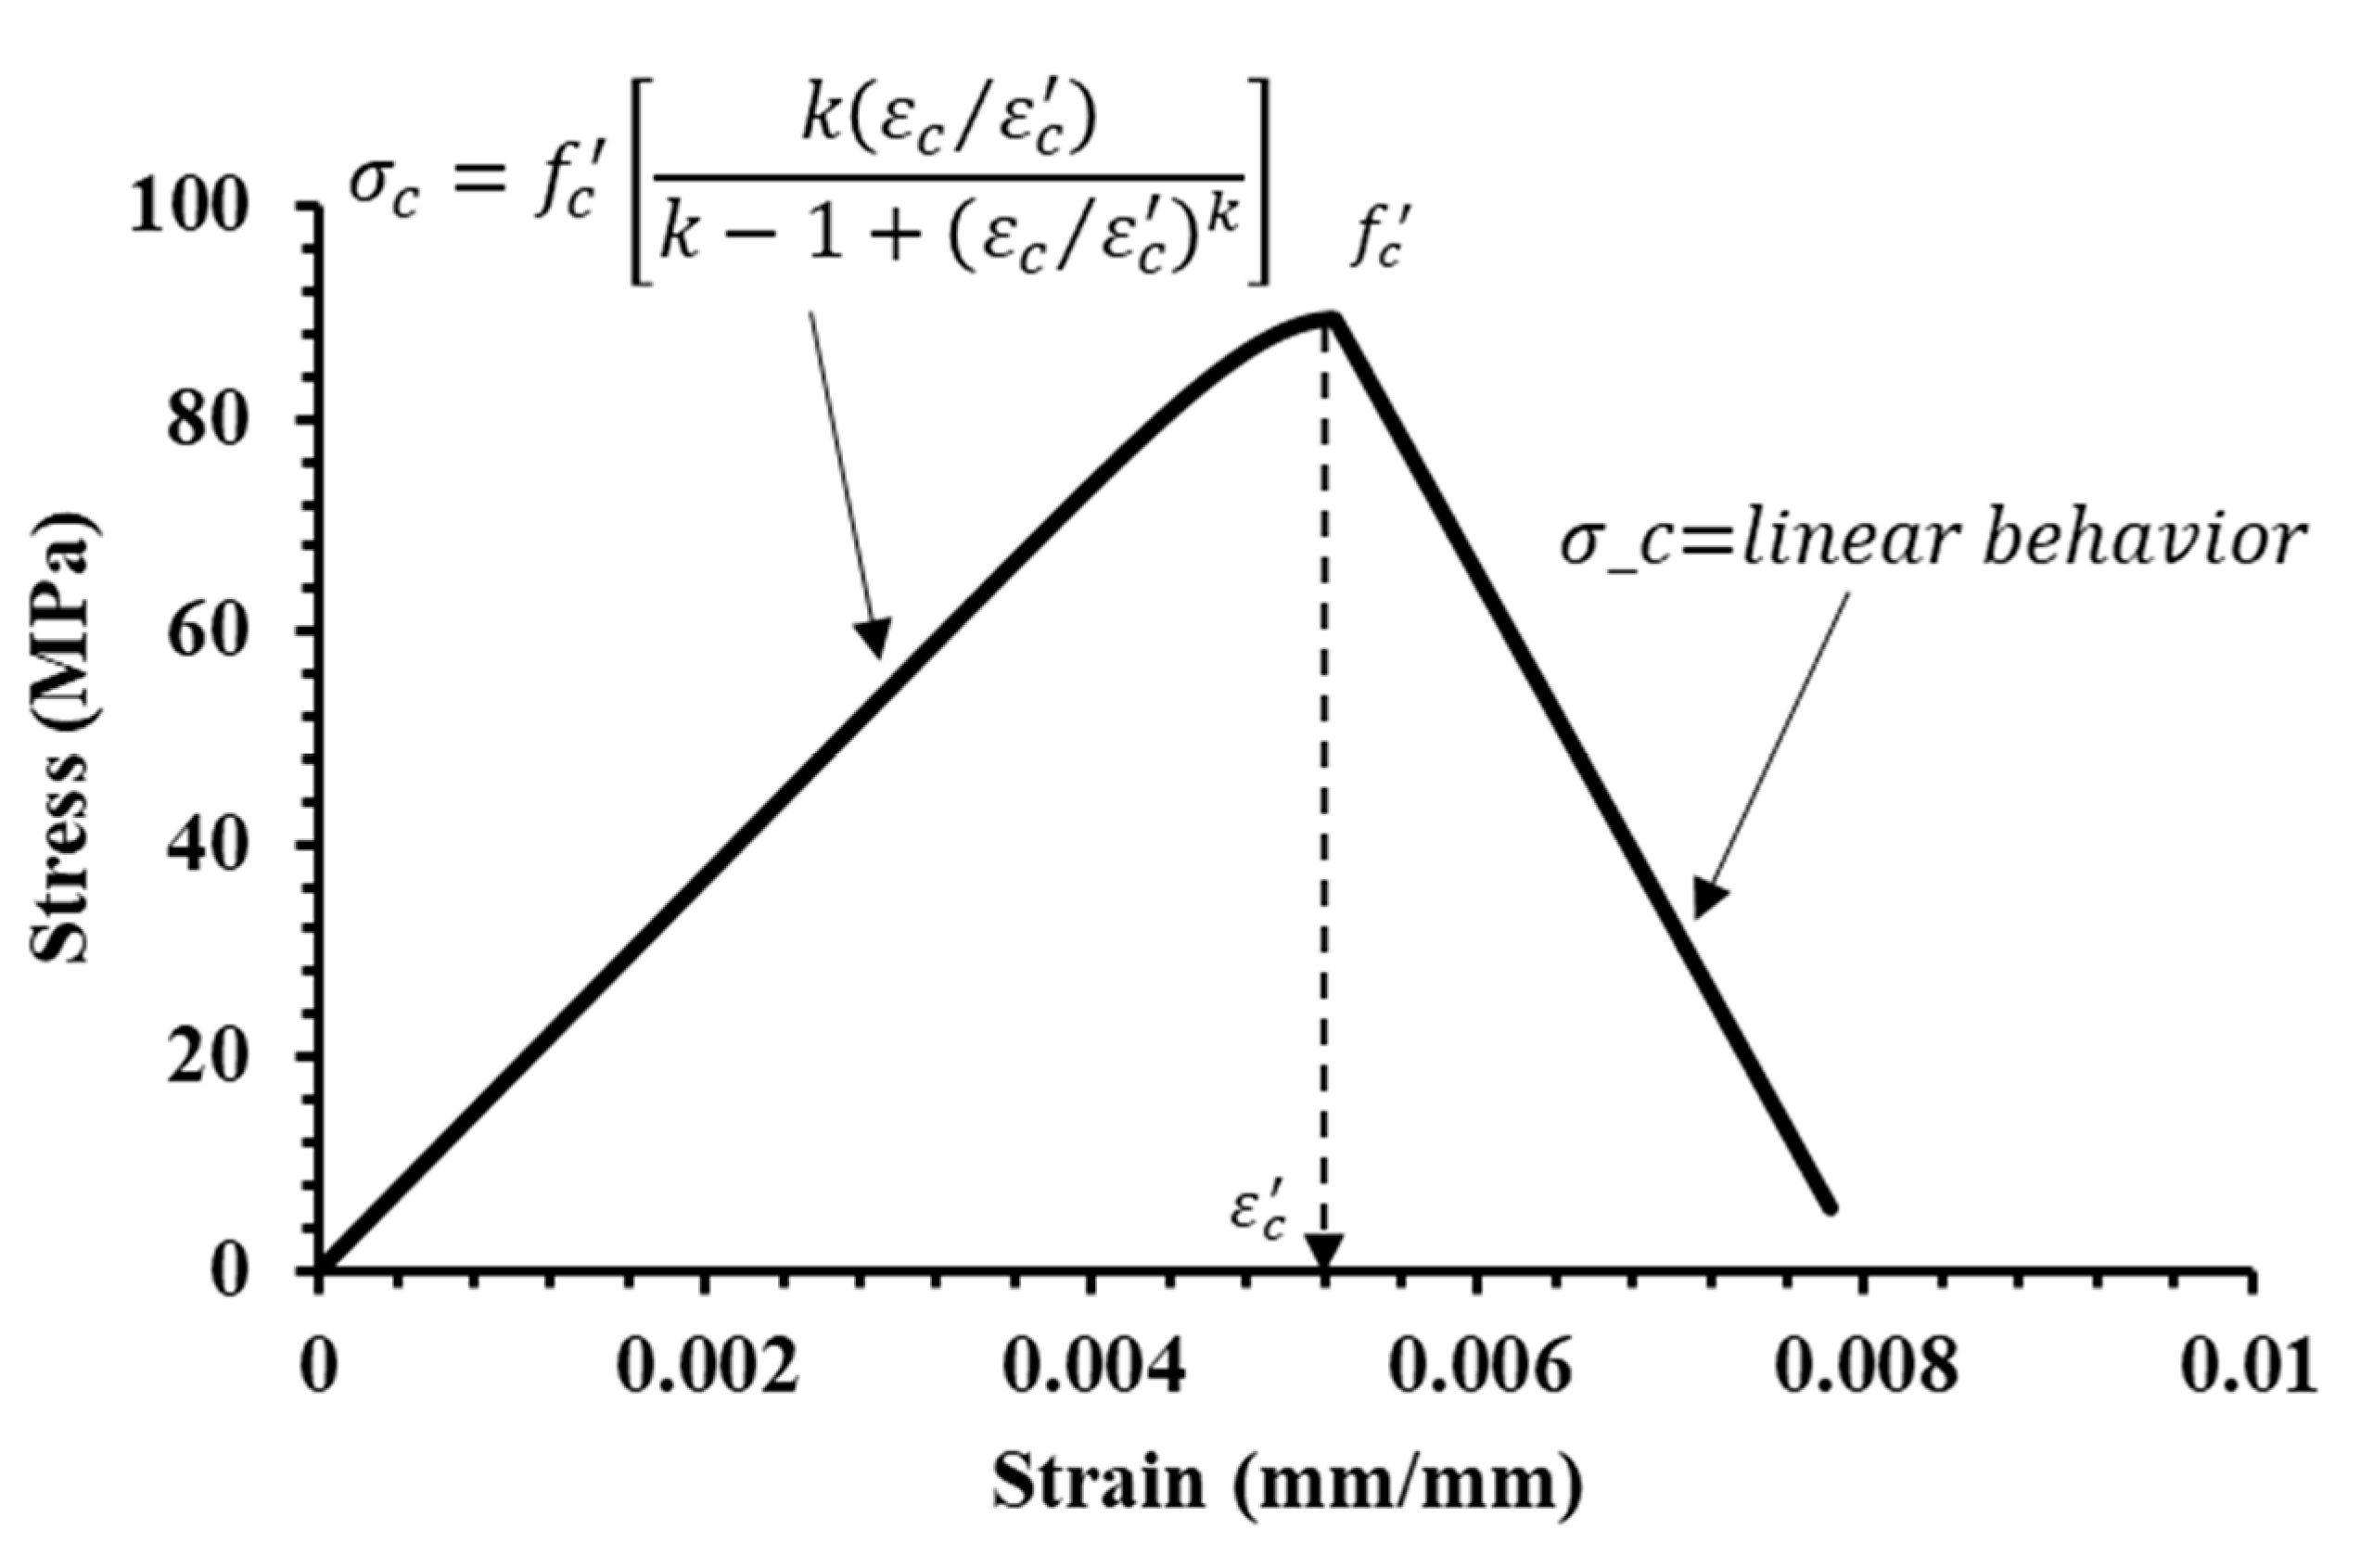
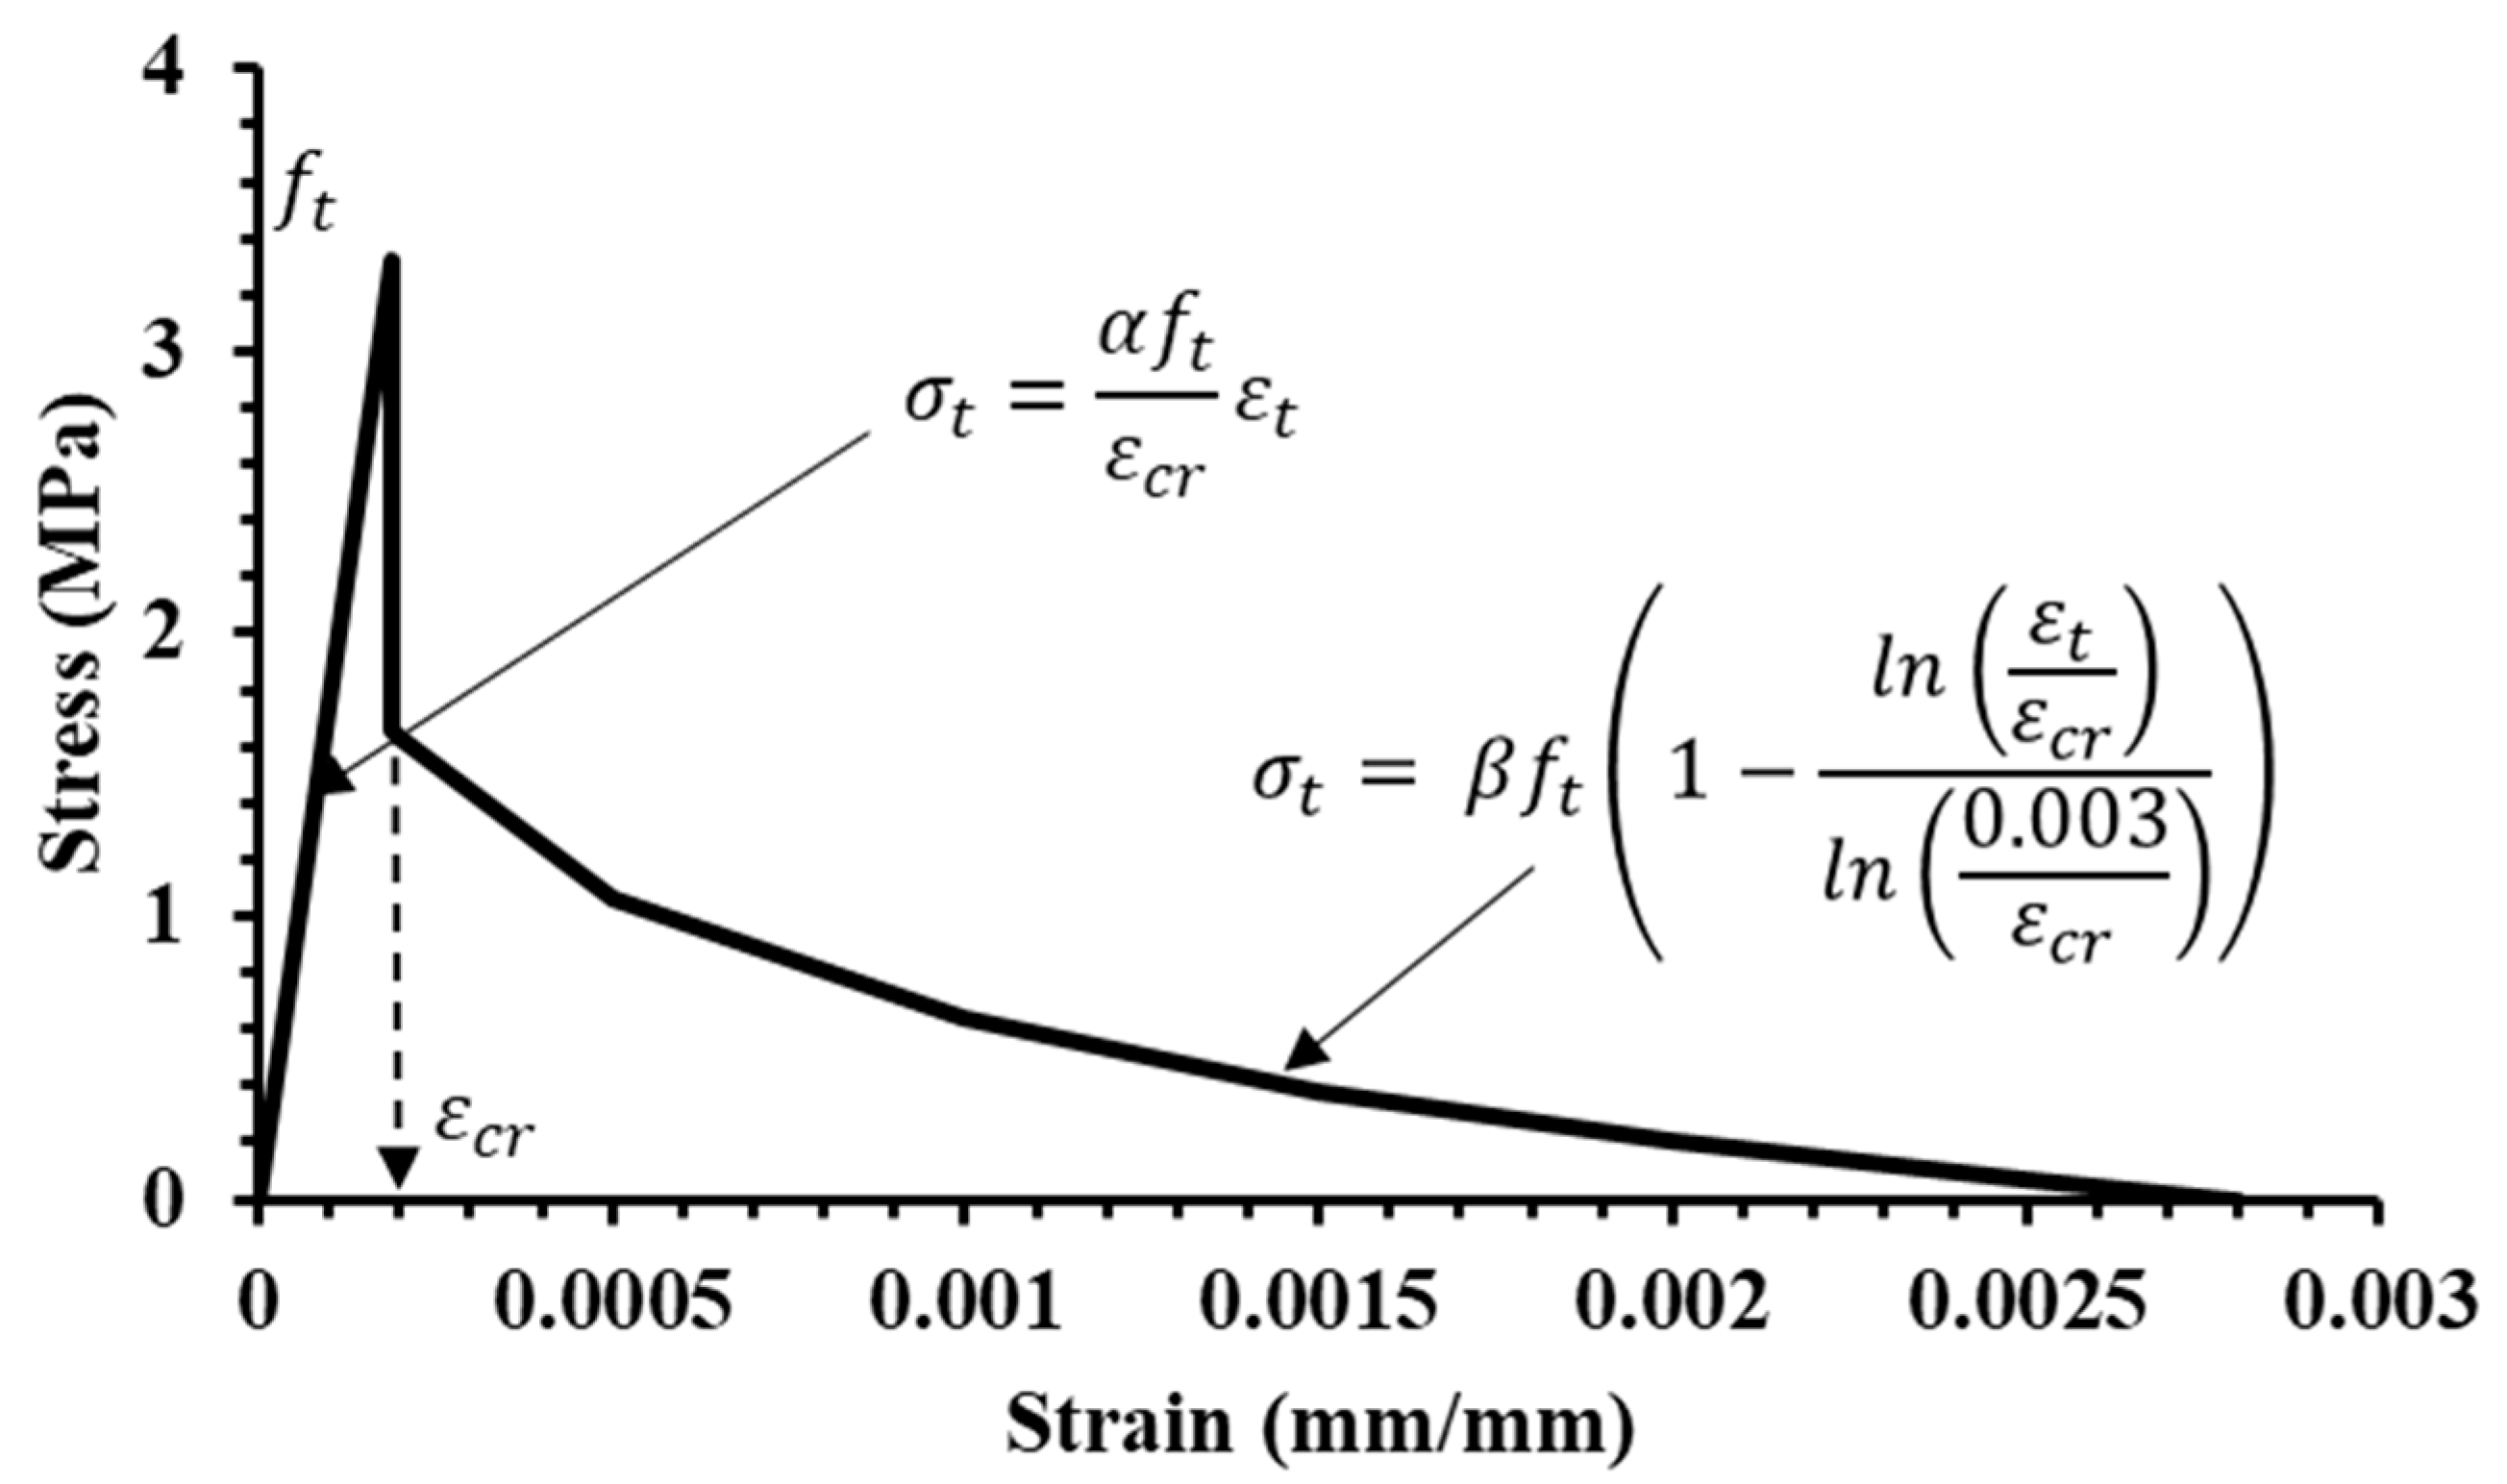
4.1. Material Models

4.1.1. Concrete

A compressive stress–strain constitutive model for the concrete matrix was adopted from Cusson and Paultre [28]. The model consists of an ascending branch and a linear descending branch. The model is capable of predicting the stress–strain behavior of both confined and unconfined concrete with a compressive strength of between 30 MPa - 120 MPa. Shin et al. [29] have successfully used the Cusson and Paultre’s model to predict the stress–strain behavior of unconfined ultra-high-performance concrete by modifying the descending branch of stress–strain behavior. Therefore, the unconfined concrete model used in Shin et al. [29] was used in this analysis to predict the stress–strain behavior of UHSC. Equations (2)–(4) and Figure 6 express the ascending and descending branches of the compressive stress model vs. the strain model.
a s c e n d i n g   b r a n c h , σ c = f c [ k ( ε c / ε c ) k 1 + ( ε c / ε c ) k ]   ,   f o r   ε c     ε c  
  d e s c e n d i n g   b r a n c h , σ c = l i n e a r   b e h a v i o r   ,   f o r   ε c     ε c     ε c u
k = E t E t ( f c / ε c )
where σ c is the unconfined concrete compressive stress, f c is the maximum unconfined compressive stress of concrete, ε c is the compressive strain of concrete, ε c is the strain corresponding to the maximum unconfined concrete stress, ε c u is the ultimate strain of unconfined concrete, and E t is the tangent modulus of unconfined concrete.
Linear behavior was assumed for the tensile stress vs. strain of concrete before the cracking. It was assumed that stiffening occurred, as in the proposed model by Abouelleil and Rasheed [24]. The original model was presented to follow the softening behavior of cracked reinforced concrete. The modifications were made to have an acceptable model to express the tensile stress–strain behavior of concrete in UHSTRC, as shown in Equations (5) and (6) and Figure 7.
σ t = α f t ε c r ε t ,   f o r   0     ε t     ε c r
σ t = β f t ( 1 l n ( ε t ε c r ) l n ( 0.003 ε c r ) ) ,   ε c r     ε t     0.003
where σ t is the concrete compressive stress, f t is the tensile strength of concrete (cracking stress), ε t is the tensile strain of concrete, ε c r is the cracking strain of concrete (the strain corresponding to the maximum tensile stress), and α and β are factors governed by the number of textile layers. Factor α , the factor for the ultimate tensile strength of concrete was taken as 0.5, 0.67, and 1 for the number of textile layers of 1, 2, and 3, respectively. Factor β , the factor for the residual tensile strength of concrete was taken as 0.3, 0.5, and 1 for the number of textile layers of 1, 2 and 3, respectively. The α and β factors provide the changes in tensile stiffening and softening behaviour with a different number of textile layers. Abouelleil and Rasheed [24] set 1 and 0.5 as the numerical values for factors, α and β , respectively, considering the behaviour of steel-reinforced concrete shallow beams. The tension stiffening and softening proposed by Hillerborg et al. [30] was used in the initial model with required modifications. The concrete tension stiffened. However, the authors observed that the effect of tension stiffening depends on the number of textile layers, as it introduces a better softening effect with the increased number of textile layers. The factors were introduced with reverse engineering the analytical moment–curvature behavior of UHSTRC. The first cracking load and initial stiffness in the moment–curvature behavior were observed to be depended on the tensile behavior of concrete due to the low thickness of the UHSTRC samples.

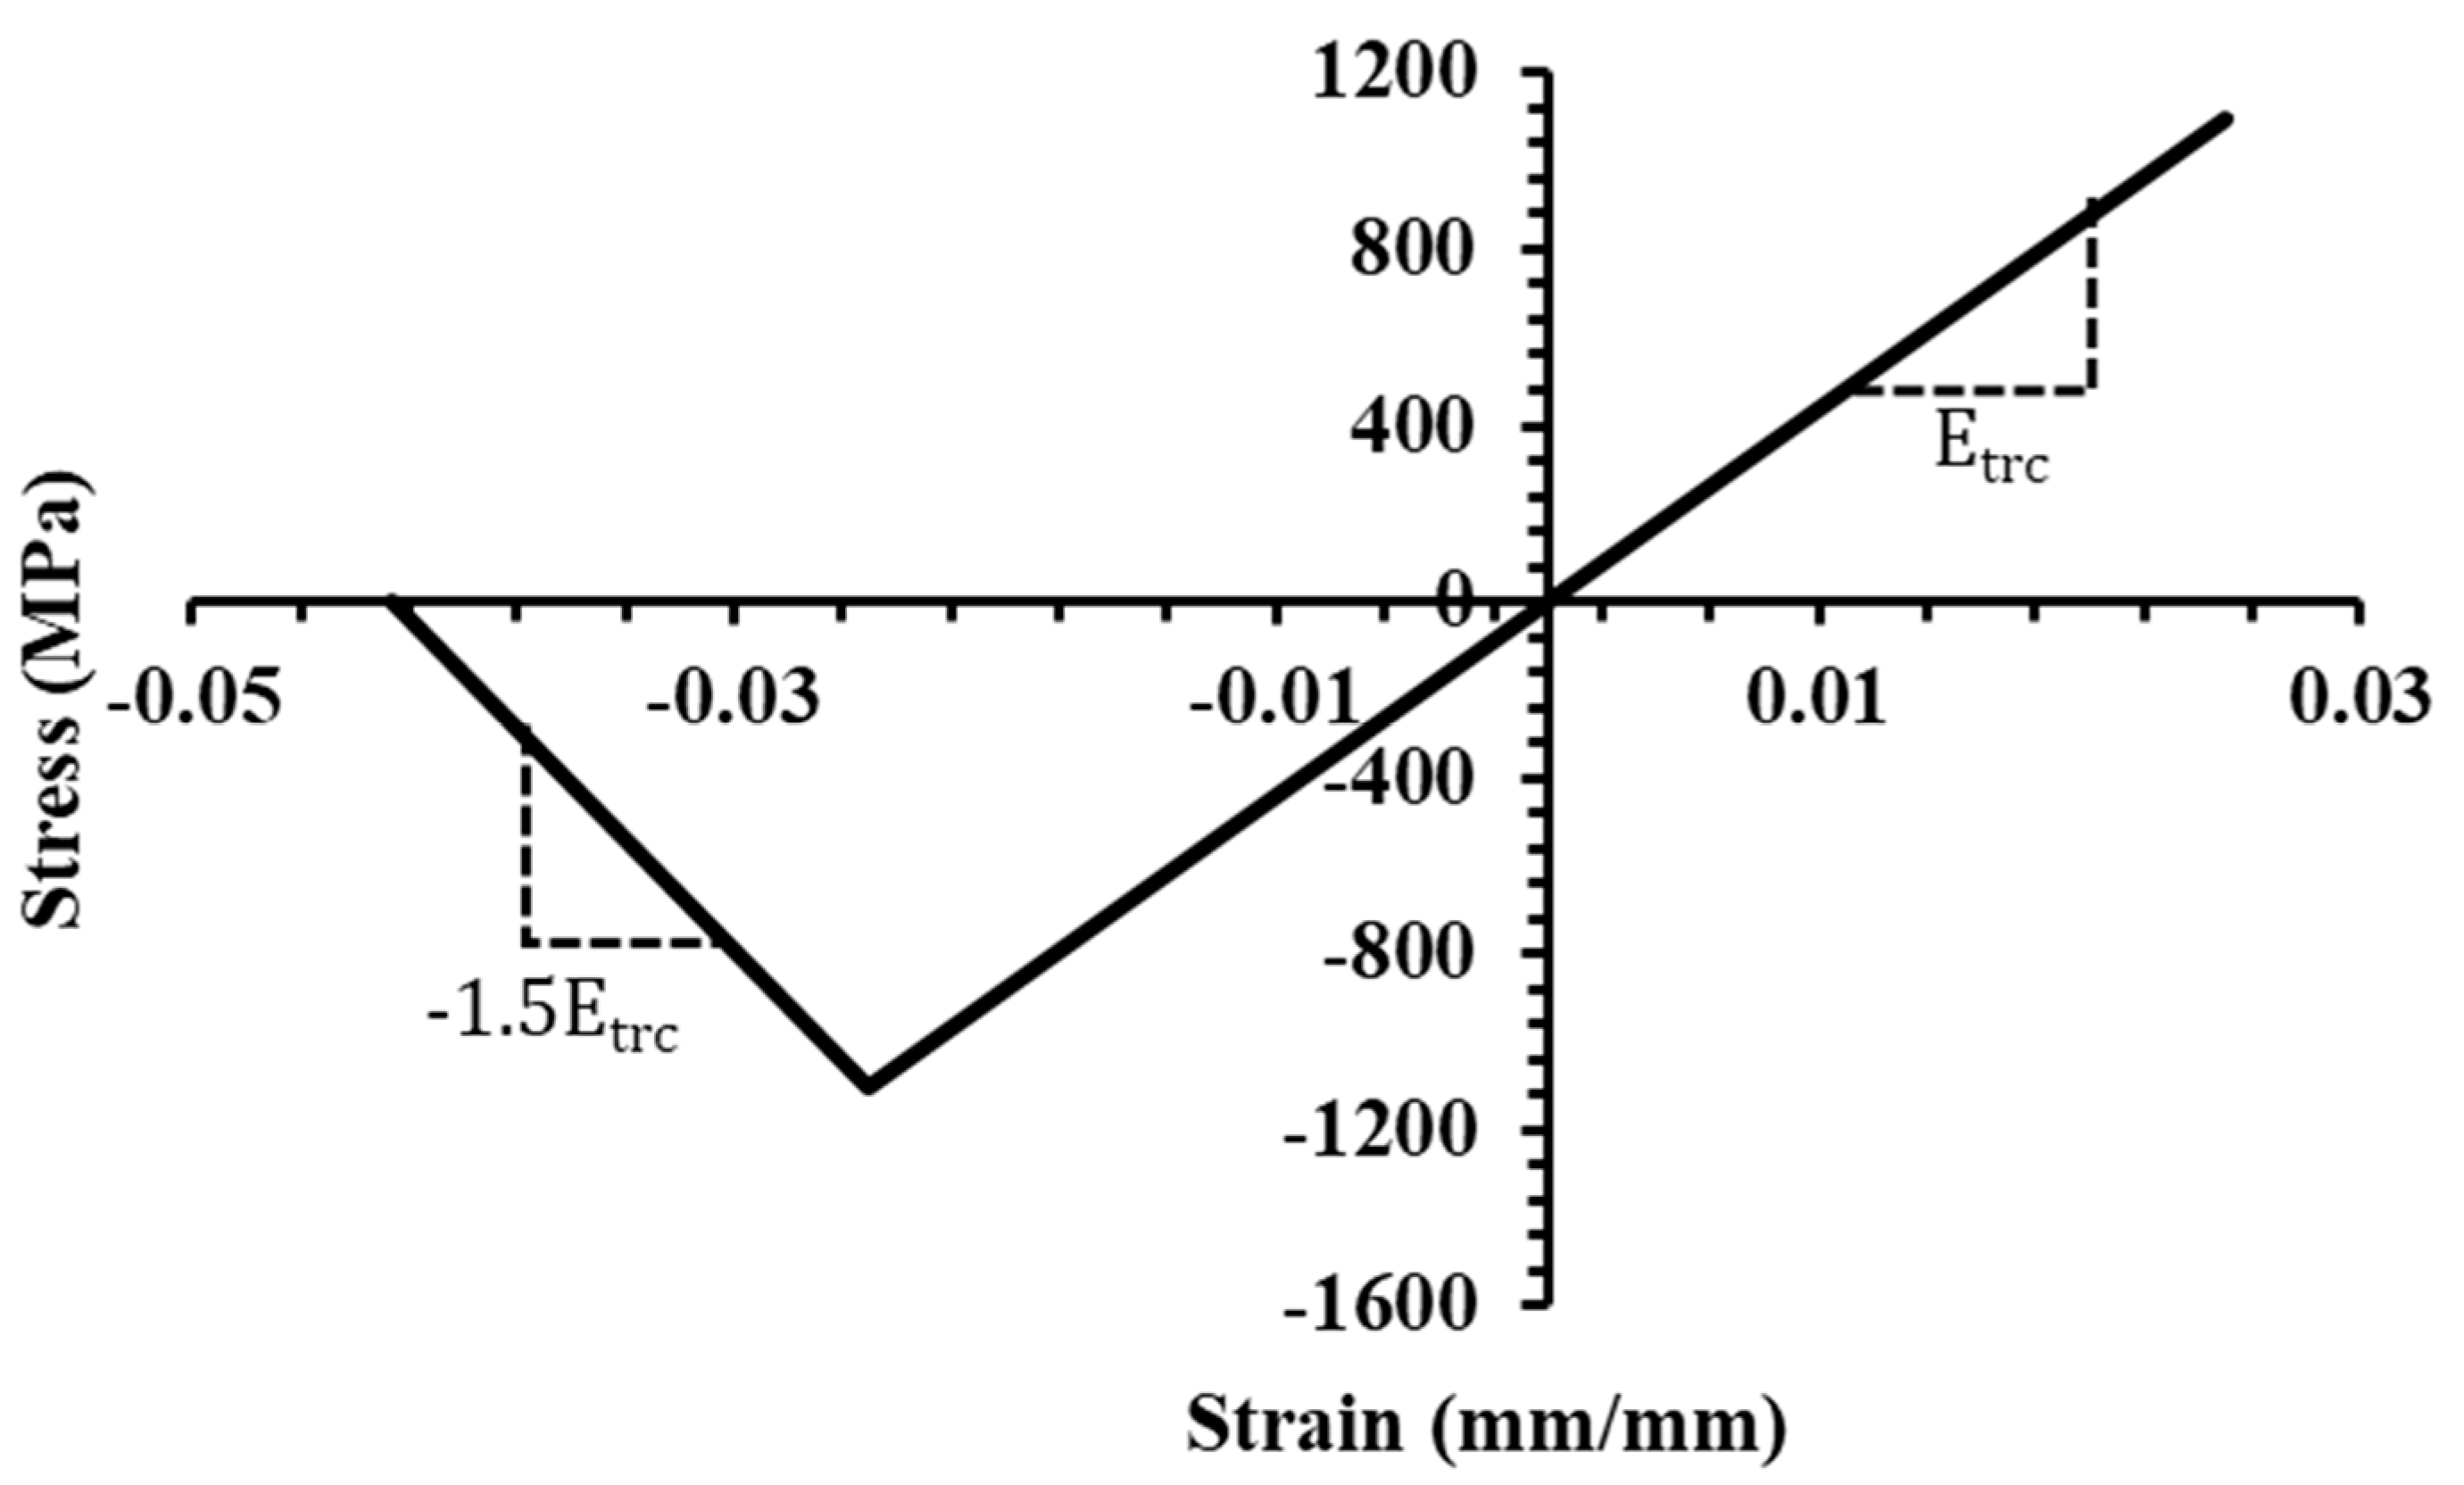
4.1.2. Glass Fiber Textile

A linear elastic material model was used to predict the stress–strain behavior of glass fiber textile in compression and tension, as shown in Figure 8. However, the authors proposed a softening curve for the textile layer in tension considering the confinement provided on the textile layer by concrete. The softening of the textile layer under tension was assumed to be going at a linear rate of 1.5Etrc (where Etrc is elastic modulus of textile).

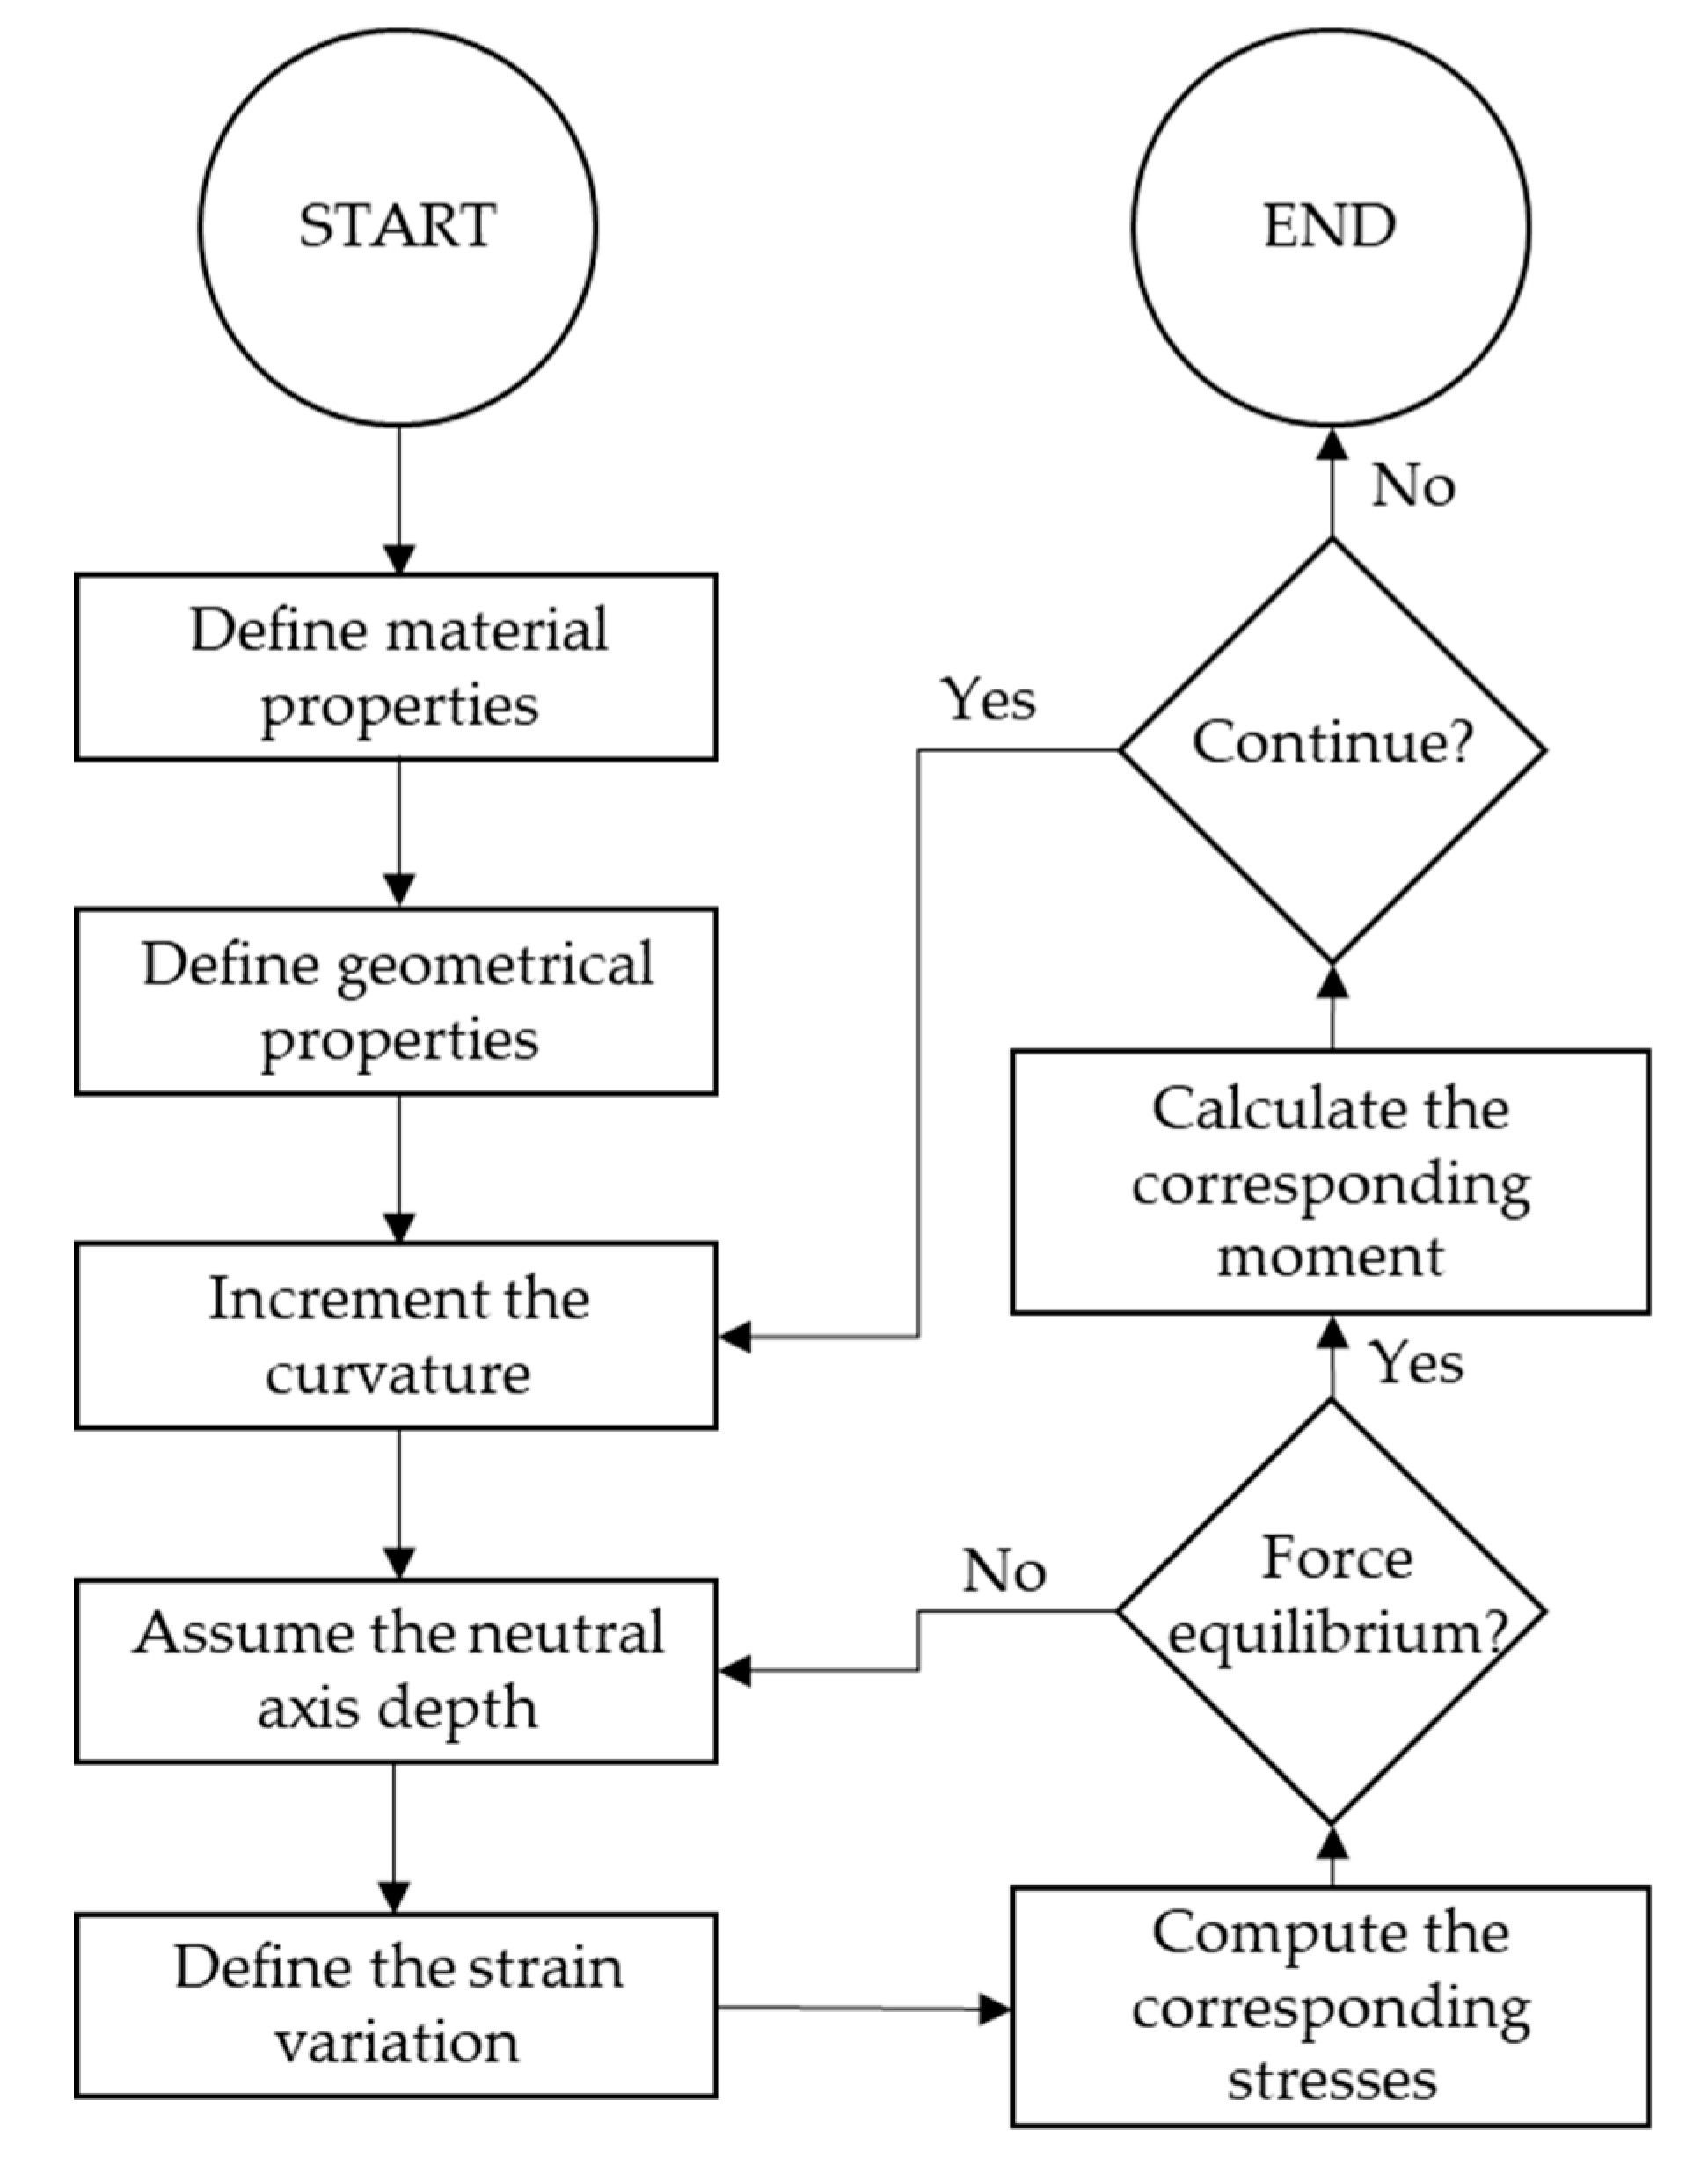
4.2. Algorithm to Predict the Moment Curvature

The three-layer TRC sample was considered as an example to explain the analytical method. Different stages of the strain and stress distributions of the TRC section were identified and the moment–curvature relationship was predicted accordingly. The following basic assumptions were made in the analytical program:
  • The whole TRC sample behaves as a Bernoulli region throughout loading (plane section remains plane).
  • The bond-slip between the textile and concrete matrix was negligible.
  • The effect of weft of textile (transverse direction rovings) was considered negligible, and the warp of the textile was considered a continuous longitudinal reinforcement.
Figure 9 illustrates a typical three-textile-layer TRC section with a thickness of h and textile layers at hfi (i = 1, 2 and 3) from extreme concrete compression fiber. The breadth of the TRC sample is b and each textile layer is having a total cross-sectional area of Afi (i = 1, 2 and 3). The depth of the neutral axis (hc) was measured from extreme concrete compression fiber.
To analyze the moment–curvature behavior of the TRC samples, the incremental curvature value (φ) was assumed to start from zero. The moment capacity (M) was predicted for the given curvature value. An arbitrary value was assumed for neutral depth (hc) for a given curvature value. As shown in Figure 9, strain variation in the TRC section was assumed. The strain value of any arbitrary fiber can be calculated as a function of φ, hc, and the distance between the considered fiber and extreme compression fiber (x).
ε x = φ ( h c x )
The above equation can be used to calculate the strain values of different materials in the section. For instance, compressive strain at the extreme compression fiber of concrete ( ε c c e ), tensile strain at the extreme tensile fiber of concrete ( ε c t e ), and the compressive and/or tensile strains of textile reinforcement layers ( ε f i , i = 1, 2 and 3) can be calculated as shown in Equations (8)–(10), respectively. The sign convention governs the nature of the strain, with positive being compressive strain and negative being tensile strain.
ε c c e = φ h c
ε c t e = φ ( h c h )
ε f i = φ ( h c h f i )
The respective material stress–strain behaviors were used to calculate the stress distribution of compression concrete, tensile concrete, and textile using the strain values calculated previously. The stress distribution of compressive concrete ( σ c c ), tensile concrete ( σ c t ) and textile layers ( σ f i , i = 1, 2 and 3) were calculated to form the total concrete compressive force ( F c c ) , total concrete tensile force ( F c t ) and total force on textile layers ( i = 1 3 F f i ). The total force acting of the section can be represented as shown in Equations (11) and (12).
P = F c c + F c t + i = 1 3 F f i
P = 0 h c σ c ( x ) b d x + h c h σ t ( x ) b d x + i = 1 3 A f i σ f i = 0
The force equilibrium is considered with the total force (P) equal to zero as the TRC sample was assumed to be subjected to pure bending under two-point loading. An iterative solving method was used to find the most accurate neutral depth (hc) value to have a resultant force (P) close to zero. After calculating the correct neutral axis depth (hc), the moment capacity (M) of the section for the given curvature (φ) can be calculated using Equation (13).
M = 0 h c σ c ( x ) b ( h c x ) d x + h c h σ t ( x ) b ( h c x ) d x + i = 1 3 A f i σ f i ( h c h f i )
The analytical moment–curvature prediction steps described in above sections were illustrated as a flow chart in Figure 10. The end curvature value was set as 4 radm−1 considering the experimental end curvature values. However, the end curvature values were changed in the parametric studies in required locations.

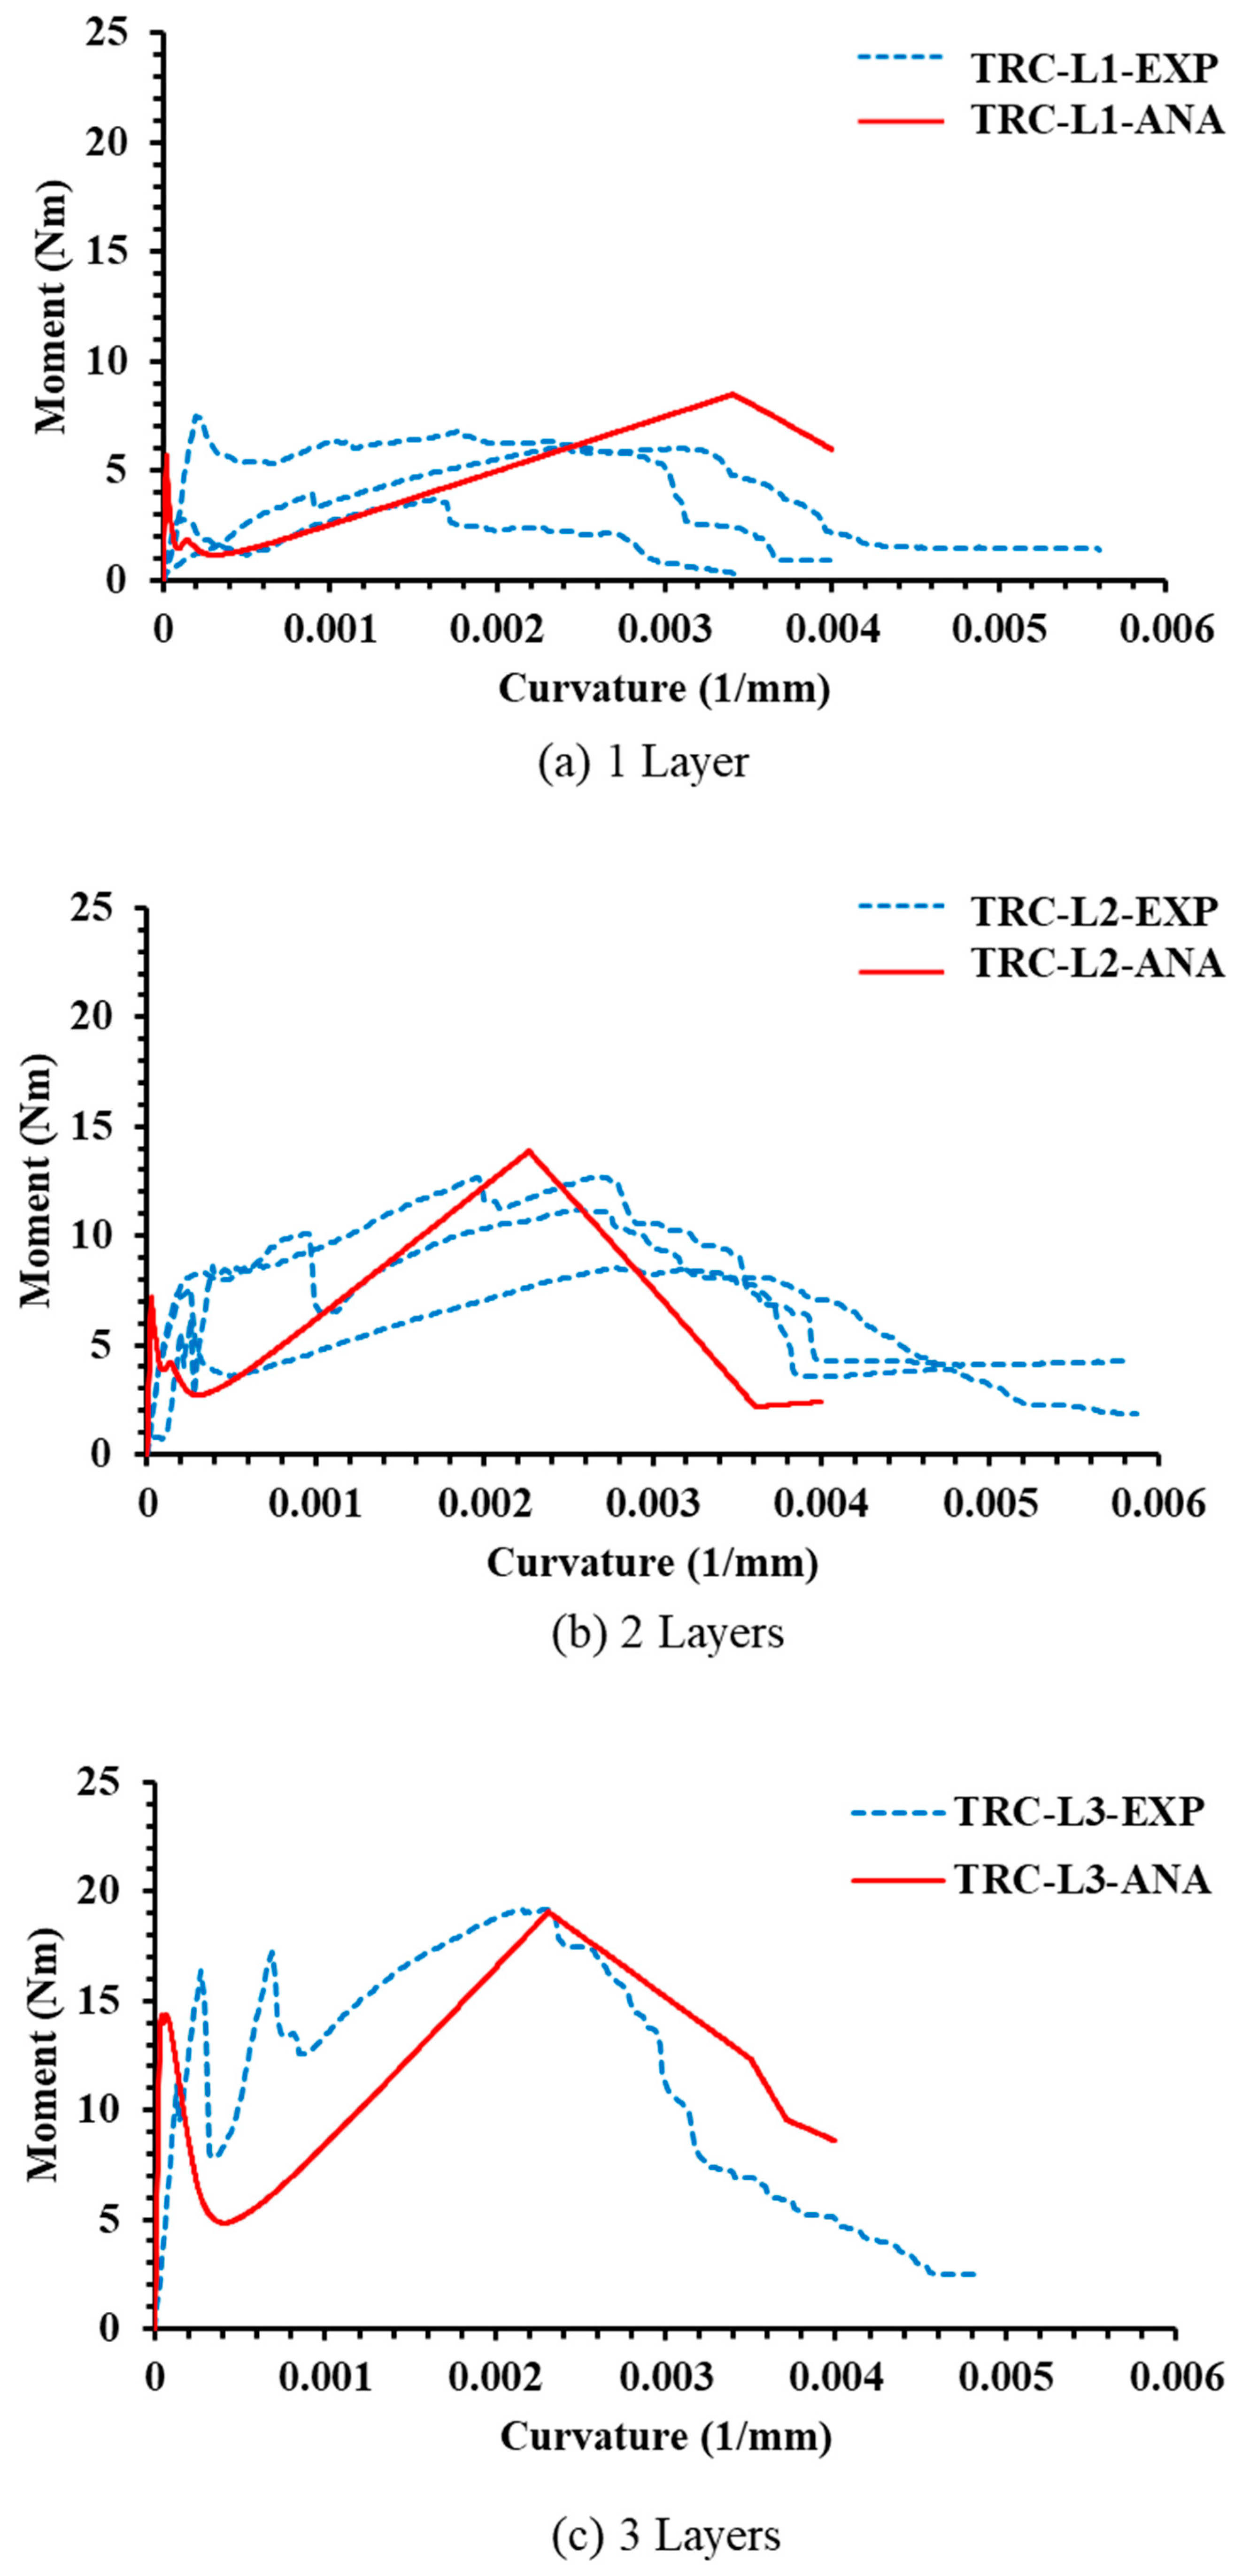
4.3. Validation of Analytical Model

Analytically predicted moment–curvature relationships can be divided into multiple sections, as shown in Figure 11. In the first section, the moment–curvature of UHSTRC can be seen displaying high constant stiffness. Throughout the section, the majority of flexural load was carried by UHSC. At the end of the linear section, the extreme tensile fiber utilized the maximum tensile stress by displaying a maximum moment value at the end. In the second section, the tension zone of UHSTRC started to crack with transferring to tensile softening while reducing the moment. However, at the end of Section 2, the textile itself started to bear the tensile load with reducing the reduction rate of the moment. When the moment–curvature curve moves to Section 3, the entire tensile force was carried by textile layer(s) while the UHSC cracks were widening. When it comes to the end of Section 3, the bottom-most textile layer reached the ultimate tensile strain with increasing the moment to its maximum value. Then, the bottom textile layer entered its tensile-softening phase, while the remaining textile layer(s) was continuing to bear the load. However, the moment capacity provided by the remaining textile layers(s) was limited due to the shorter lever arm compared to the bottom textile later. Thus, a gradual reduction can be seen, as shown in Section 4. Most probably, the serviceability limit state condition led to limit the maximum serviceability moment to a value within Section 1. In ultimate conditions, the higher moment at the end of Section 3 can be considered as the ultimate moment. Additionally, the higher ductility of UHSTRC in both the hardening (Section 1, Section 2 and Section 3) and softening (Section 4) phases contributes to increasing the energy dissipation of UHSTRC in seismic events. Authors used the section division of the moment–curvature curve in parametric studies’ paragraphs and discussions to describe the behavior of TRC in detail.
The load vs. deformation data collected from the experiments were used to validate the analytical model. The deflection was converted into curvature at mid-span, while the corresponding load was converted into the moment at mid-span. The experimental moment vs. the curvature curve was compared with the proposed analytical solution. Figure 12 shows the comparison made between the experimental and analytical moment vs. curvature curves. The sudden drop at the end of the first section can be seen in all three models. However, the moment reduction was 80%, 61%, and 65% when the number of layers increased from one to three. Ultimate moments of 8.47, 13.86, and 19.07 Nm were recorded for UHSTRC with one, two, and three textile layers, respectively. On average, a 5.3% and 7.4% difference were found between the experimental and analytical ultimate moment and curvature, respectively, for two- and three-layer UHSTRC. The difference in the initial serviceability moment between analytical and experimental was an average of 10.3%. However, the analytical moment–curvature found to be more linear compared to the experimental one. The assumption of taking the UHSTRC as a Bernoulli section throughout the loading cause for such a difference. The actual behavior of UHSTRC found to have differed from Bernoulli section after the initial cracking of the sample. However, major points such as serviceability moment, ultimate moment and curvature were not affected by making such assumptions.

5. Parametric Studies

Parametric studies were conducted with varying the number of textile layers, textile material (basalt and carbon), textile mesh density and UHSTRC thickness. The effects of each parameter on flexural behavior of UHSTRC was evaluated based on the moment–curvature relationships derived from the analytical model.

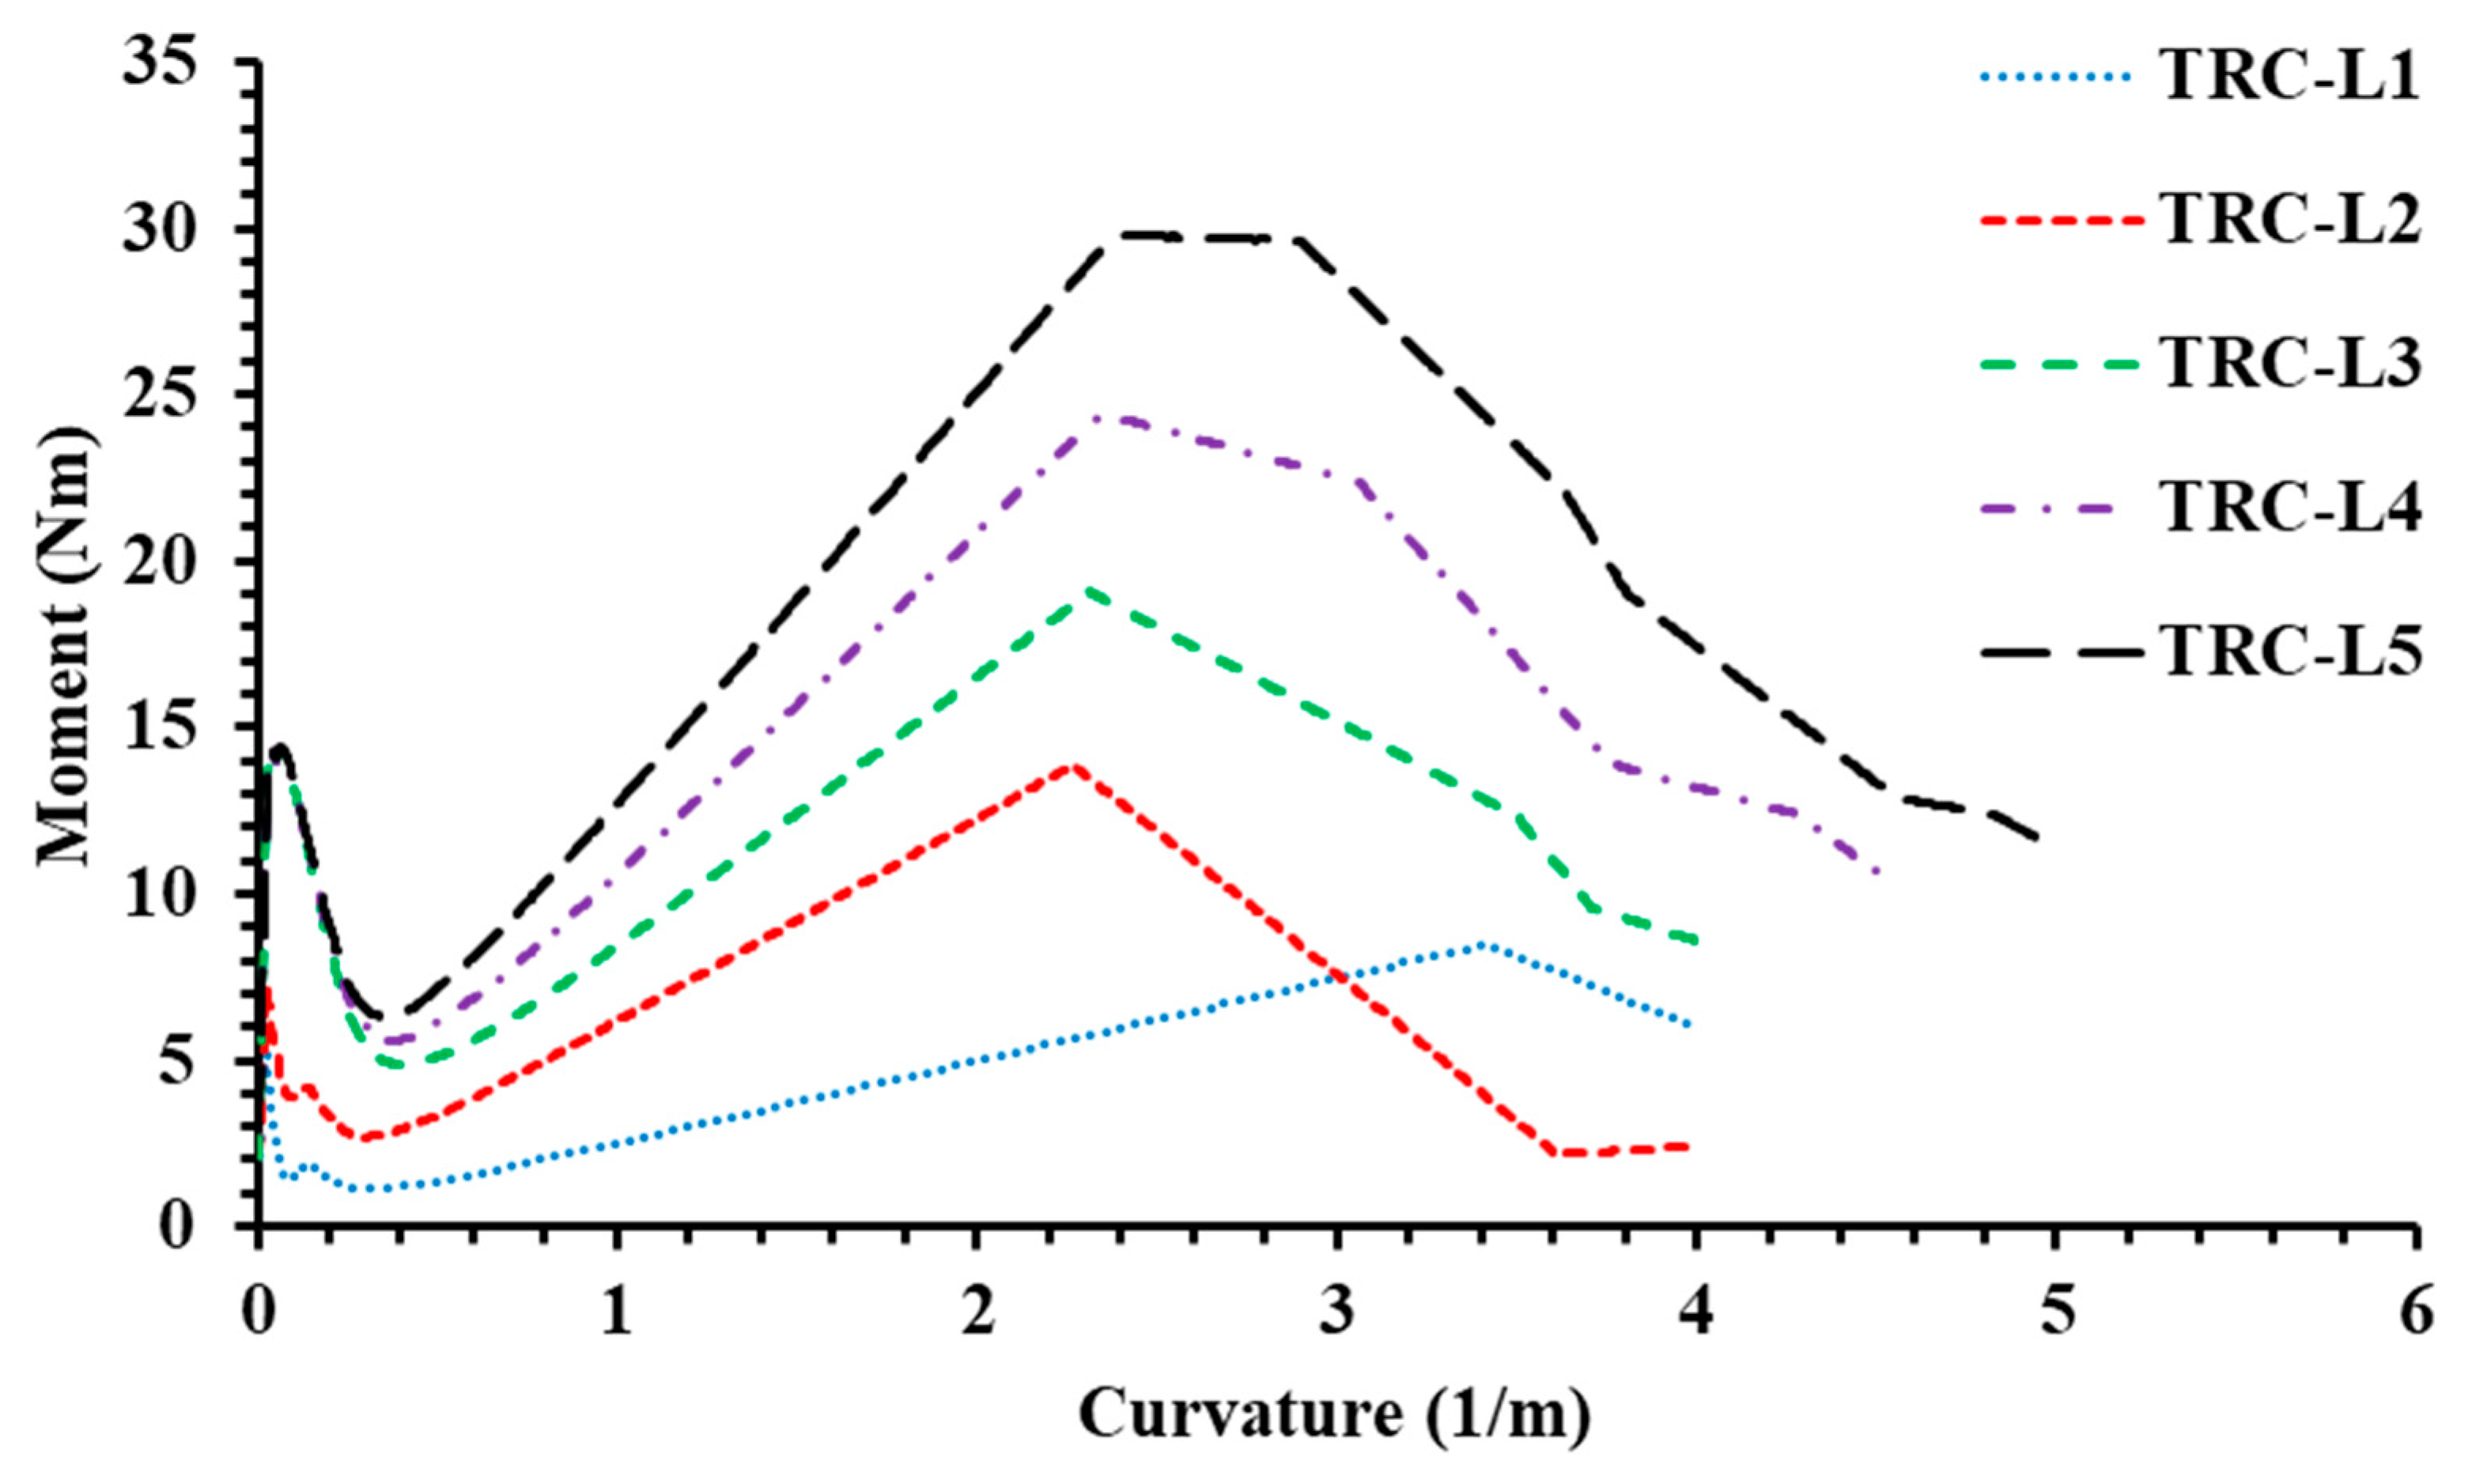
5.1. Effects of Number of Textile Layers

Up to three textile layers were used in experiments and analytical model was developed to predict the results as shown in previous sections. Authors modified the analytical model to predict the flexural behavior of UHSTRC with four and five textile layers. In all models, the textile cover was maintained as 4 mm with distributing the remaining textile evenly through the top and bottom textile layers. Figure 13 shows the variation in moment–curvature of TRC with different number of textile layers. On average, 5.33 Nm increase in ultimate moment was recoded for each inclusion of textile layer. However, the curvature corresponding to the ultimate moment did not show such high correlation with the number of textile layers. On average, 1.6% increase was recorded when the number of textile layers increased from two to five. The number of textile layers had a clear relationship with the stiffness of the TRC sample at Section 3 of the moment–curvature curve. The addition of a single textile layer increased the stiffness of a UHSTRC at Section 3 of the moment–curvature curve by average 8%. With the increase of number of textile layers, tensile load carrying capacity of cracked UHSTRC increased. However, stiffness of Section 1 had no effect by the number of textile layers, and it was dominated by the elastic modulus of UHSC. The maximum moment at the end of Section 1 of moment–curvature found to be increased with the number of textile layers since congested textile layers maximize tensile strength and tensile softening of concrete as described in Section 4.1.1.

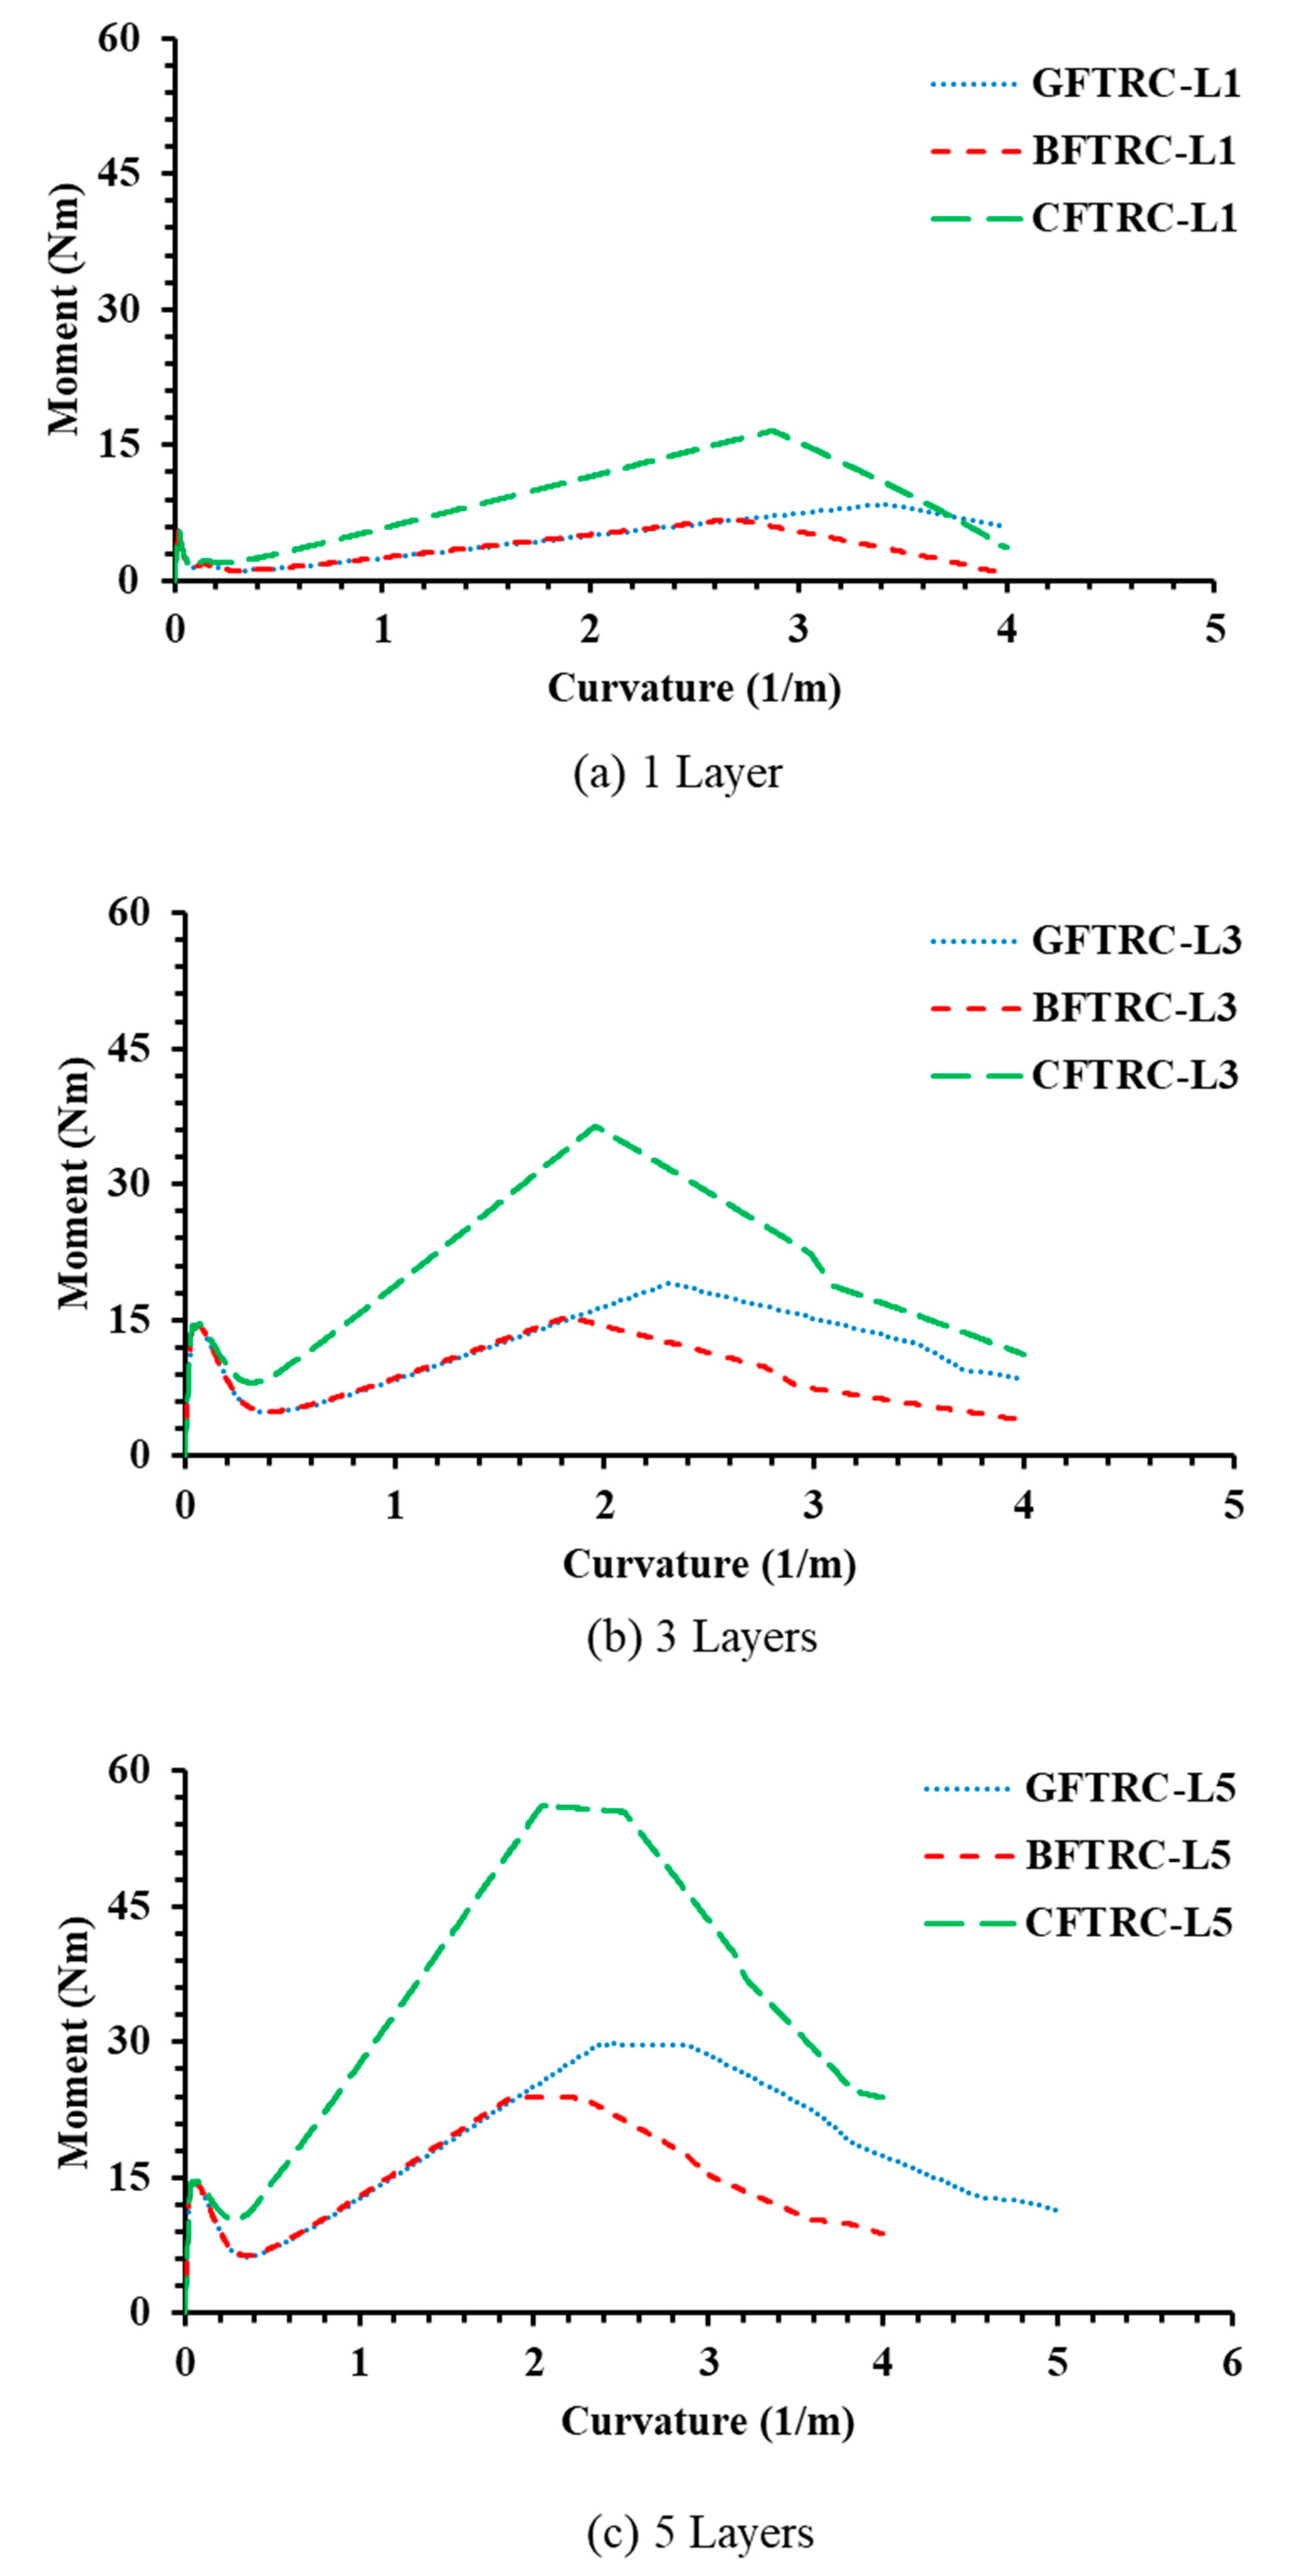
5.2. Effects of Different Textile Materials

Basalt fiber textile and carbon fiber textile were used aside from glass fiber textile used in experiments and analytical simulation. The mechanical properties of basalt fiber textile and carbon fiber textile are listed in Table 4 for a textile with same mesh dimensions as glass fiber textiles used in experiments. The variation of moment–curvature relationship is shown in Figure 14. Softening of carbon and basalt textiles were also assumed as described in Section 4.1.2 .
Carbon Fiber TRC (CFTRC) outperformed the Glass Fiber TRC (GFTRC) and Basalt Fiber TRC (BFTRC) considering the ultimate moment and initial moment reduction when TRC cracks. BFTRC and CFTRC have shown a 20% reduction and 90% increase in ultimate moment compared to GFTRC, respectively. Though considerable improvement in initial moment reduction was not observed in any material with one-layer textile, CFTRC managed to reduce the reduction of the moment by average 26% compared to BFTRC and GFTRC when number of textile layers were three and five. However, the curvature corresponding to ultimate curvature decreased by an average of 20% and 15% on BFTRC and CFTRC, respectively, compared to GFTRC. It demonstrates the correlation between ultimate curvature of TRC and ultimate tensile strain of textile material. Increase in ductility was observed in CFTRC with the contribution of higher ultimate moment and high stiffness in the third section of moment–curvature compared to BFTRC and GFTRC. The use of high-performance textile material such as carbon fiber shown the effects of textile properties on high ultimate moment capacity of UHSTRC. The high elastic modulus and strength of textile improve the ultimate strength performance of UHSTRC though the serviceability performance of UHSTRC was not significantly affected.

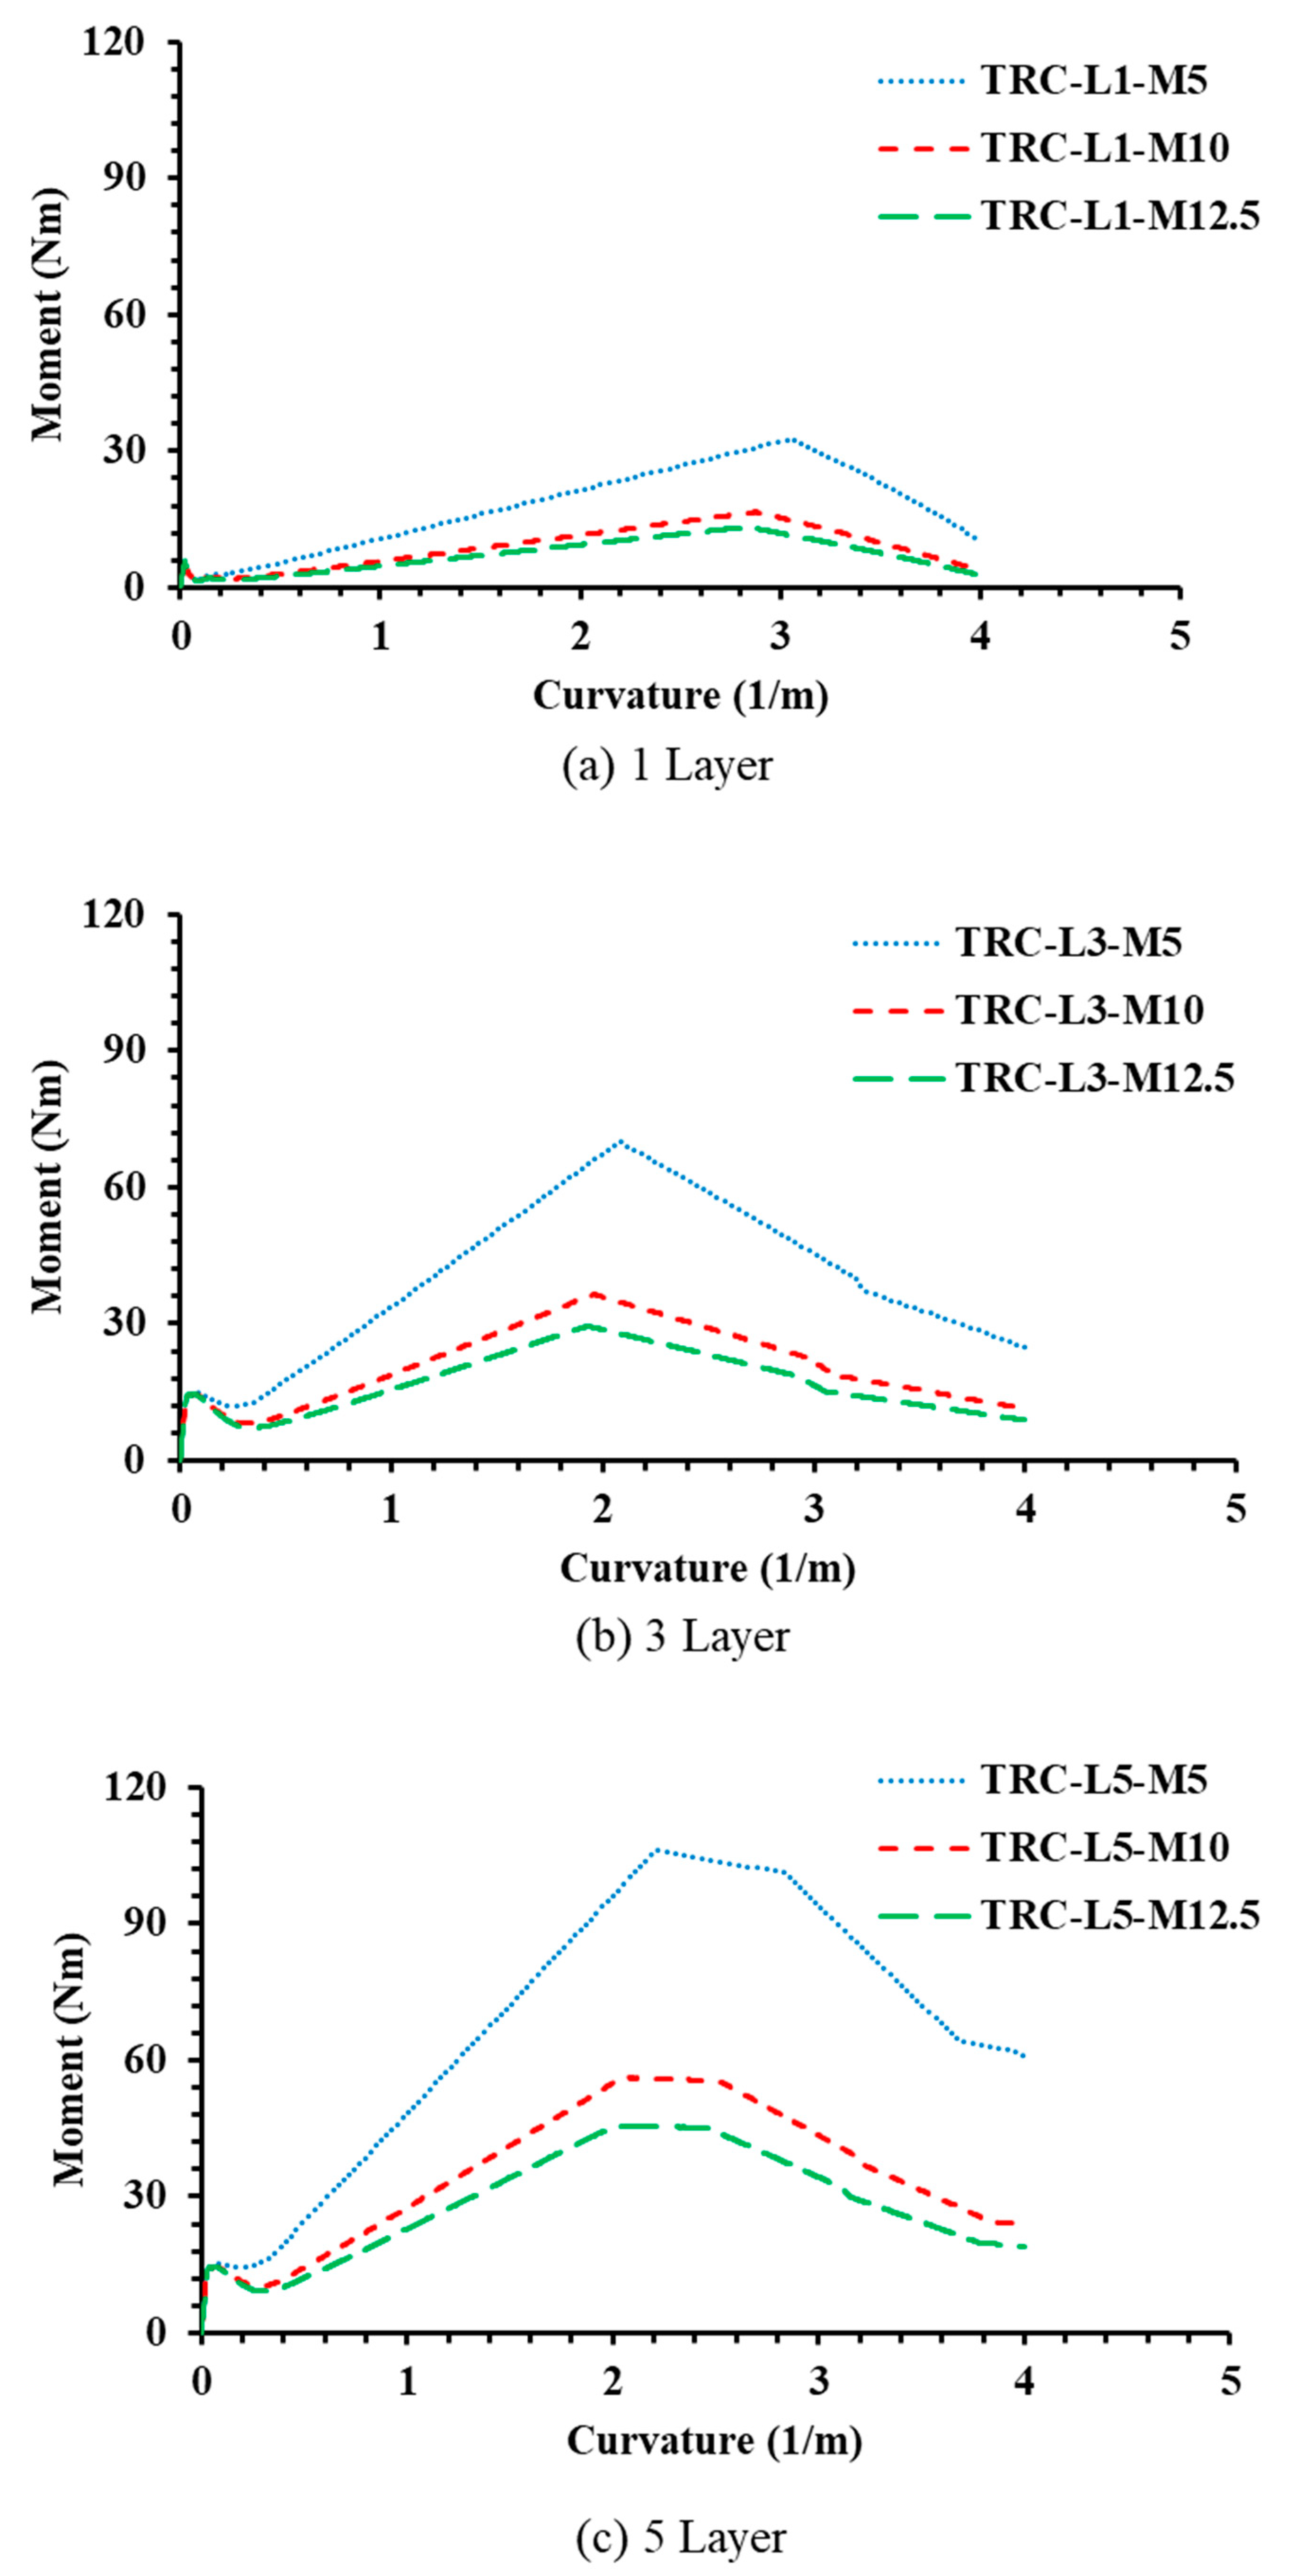
5.3. Effects of Textile Mesh Density

5 mm (M5) and 12.5 mm (M12.5) mesh sizes were selected as the variant mesh densities of moment–curvature analysis, addition to the 10 mm (M10) mesh size used in as shown in Figure 15. Though mesh density had no effect on initial stiffening and ultimate curvature of UHSTRC, the initial moment drop and ultimate moment found to be affected significantly. On average, a 20% reduction and 90% increase was respectively recorded for the ultimate moment of 12.5 mm and 5 mm textile mesh UHSTRC samples compared to control 10 mm mesh. The initial moment reduction was observed to be significantly reduced by increased mesh density. No initial moment reduction was observed in TRC with 5 mm mesh size with five textile layers while 10 mm and 12.5 mm mesh UHSTRC were undergoing an average of 40% moment reduction. The increased mesh densities increased the reinforcement area of UHSTRC which contribute to carry a higher tensile load at lower strain value after the cracking of UHSTRC. Thus, a swift change in load-bearing mechanisms leads to a low reduction in the moment after the cracking of concrete. However, the mesh density had no effect on the initial stiffness of UHSTRC. The increased ultimate moment of 5 mm textile mesh UHSTRC, resulted in higher energy dissipation level compared to other mesh sizes. However, with the increase of the mesh density the spacing between the longitudinal reinforcements were reduced to have poor load transferring between concrete matric and textile. Thus, the bond between textile and concrete matrix

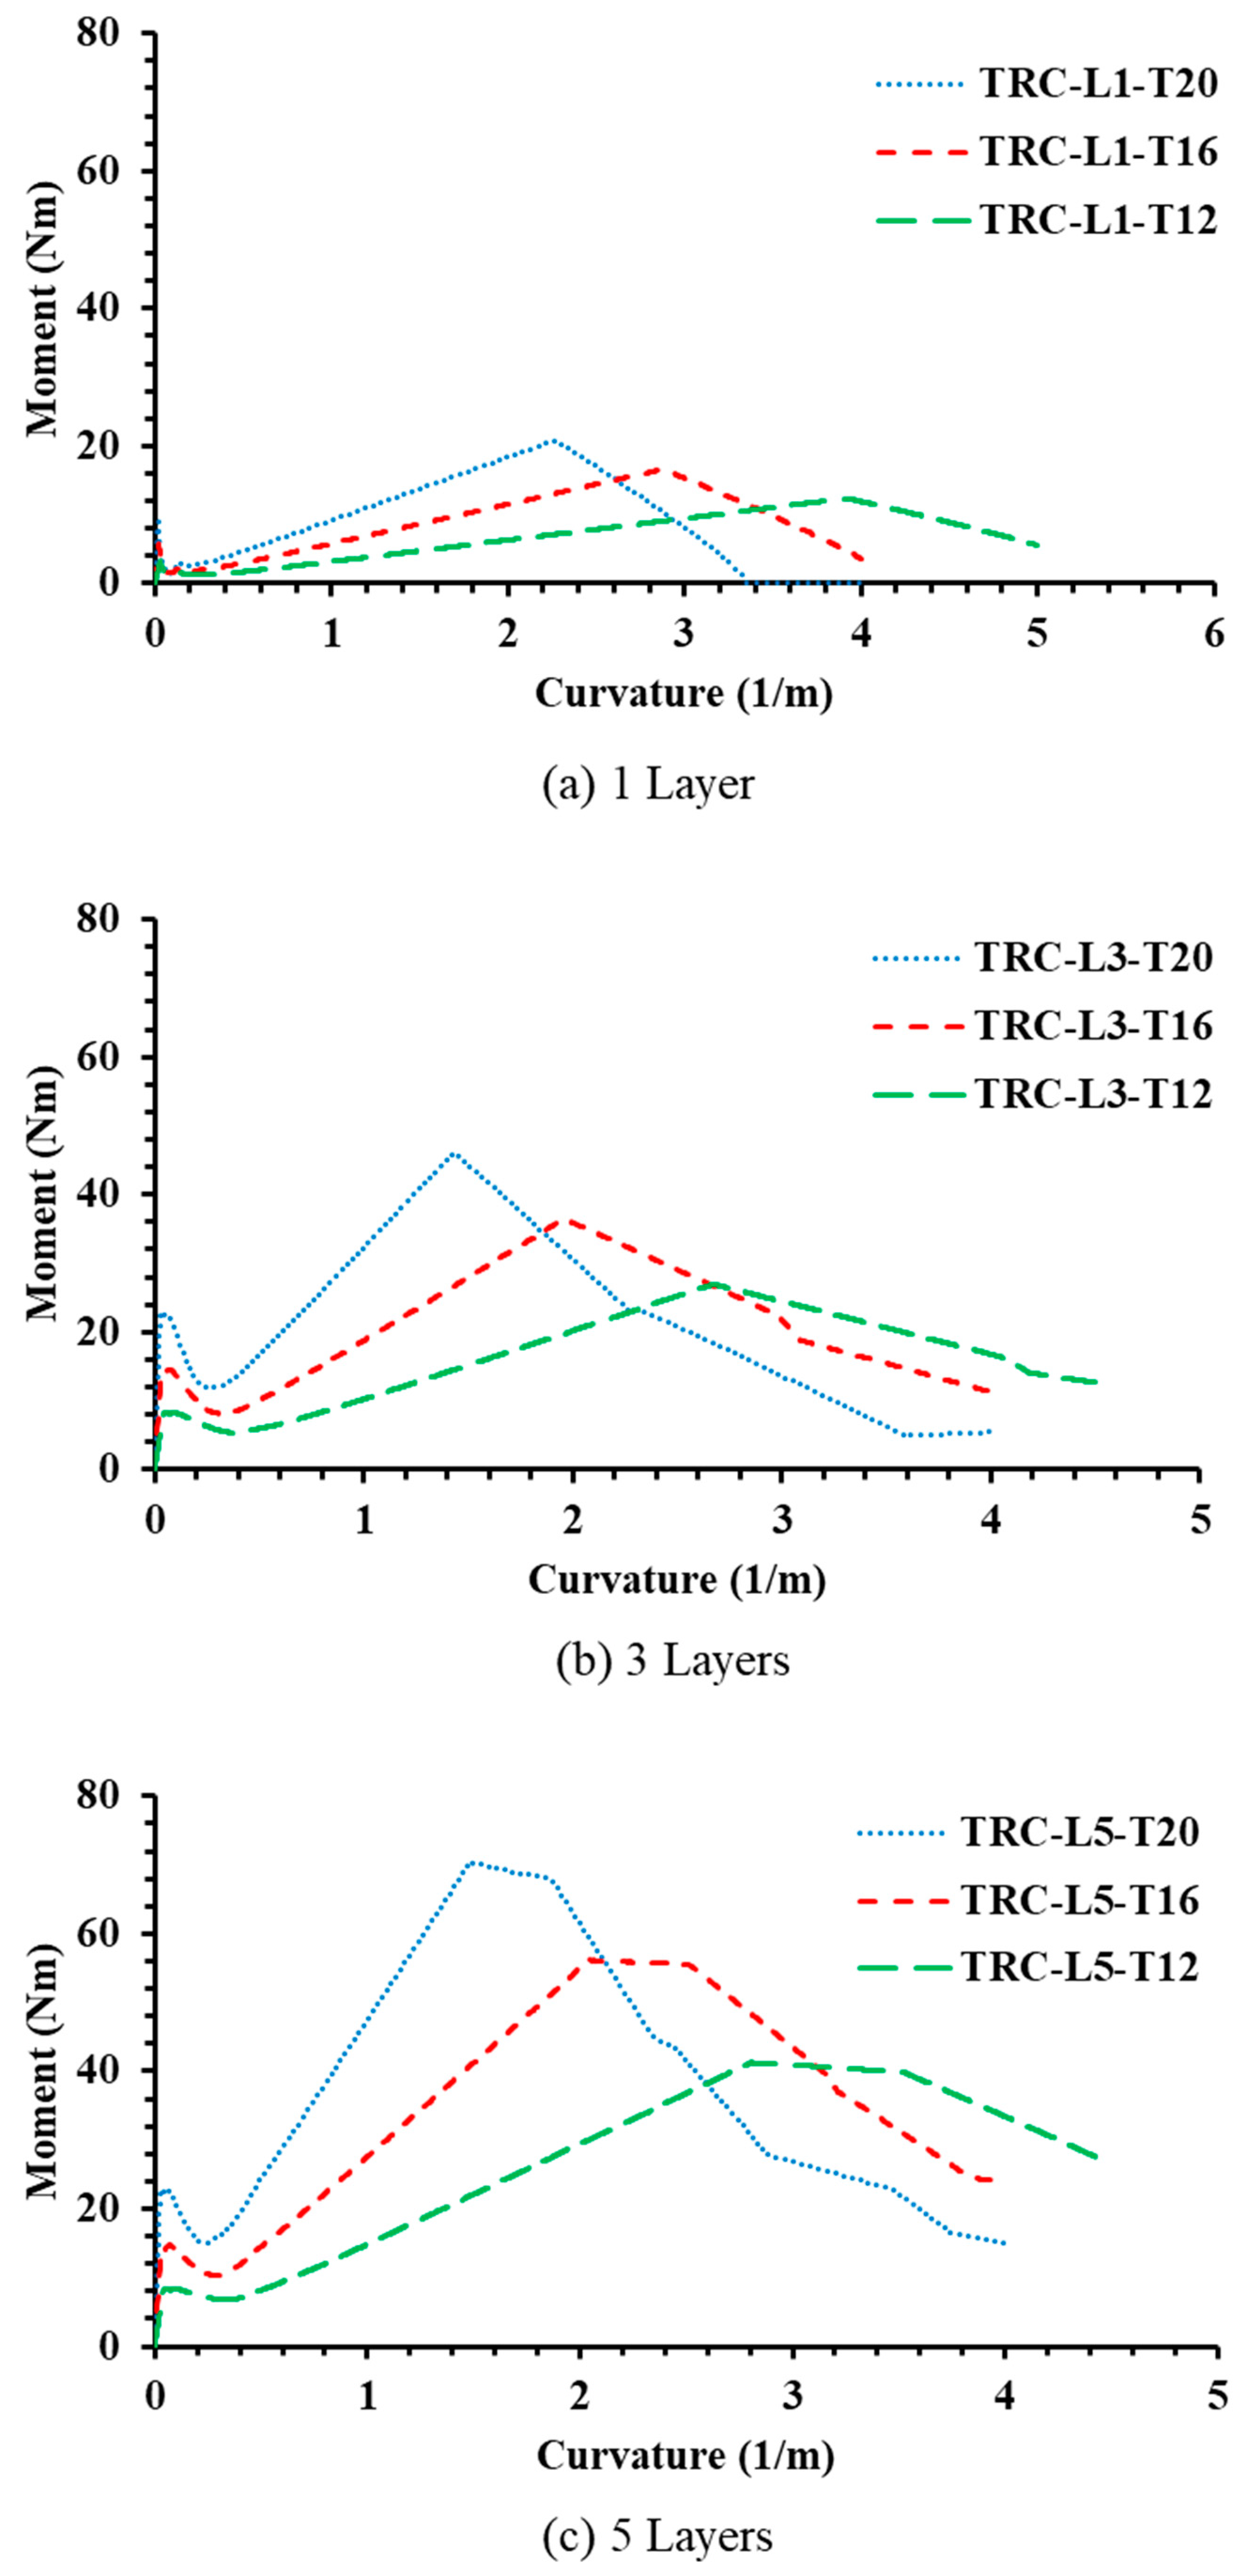
5.4. Effects of TRC Thickness

The UHSTRC thickness was varied as 12 mm, 16 mm and 20 mm to investigate the effects of UHSTRC thickness on moment–curvature behavior of UHSTRC as shown in Figure 16. Though textile cover was maintained as 4 mm in 20 mm thick UHSTRC sample, 3 mm cover was used in 12 mm textile layer samples considering the congestion of textile layers in small thickness. A significant increase was observed in maximum moment at the end of Section 1 of moment–curvature with increased UHSTRC thickness. On average, 170% and 70% increase was observed in initial maximum moment in 20 mm and 16 mm UHSTRC compared to 12 mm UHSTRC. The increased layer thickness improved the tensile load capacity carried by UHSC to increase the maximum initial moment. The moment drop-in Section 2 of moment–curvature found to be increasing with larger UHSTRC thickness. On average, 46%, 42% and 33% drop in serviceability moment was observed for UHSTRC with 20 mm, 16 mm and 12 mm, respectively. However, the dropped moment value found to be increased by an average of 3 Nm in each 4 mm increase in thickness. The increased layer thickness contributes to optimize the moment carrying capacity of textile layers with increased lever arm to maximize the ultimate moment capacity. On average, 38% and 23% increase in ultimate moment was observed when thickness of UHSTRC was increased in 4 mm steps from 12 mm thickness value. However, the increased thickness causes the bottom-most textile to reach its maximum strain value in lower curvature value to cause a reduction in the ultimate curvature. Respective, 26% and 46% reduction in ultimate curvature was recorded for 16 mm and 20 mm UHSTRC compared to 12 mm UHSTRC.

6. Discussion

An experimental program was completed following a detailed analytical model to predict the moment–curvature behavior of UHSTRC with parametric studies. The moment–curvature behavior was used to describe the performance and behavior of UHSTRC. The moment–curvature behavior of UHSTRC samples with different parameter changes was found to follow the same pattern as shown and described in Figure 11 and Section 4.3. The sudden drop in the second section of moment–curvature relationship directly affects the structural use of UHSTRC. It restricted the use of UHSTRC in structural elements as it limited the serviceability moment to the maximum moment at the end of Section 1 of moment–curvature where the cracks appear. The ratio between ultimate and serviceability conditions was found to be ranged from 1.45 to 7.5 in UHSTRC samples. The highest was found in UHSTRC with glass fiber textile mesh with 5 mm mesh dimensions. However, the parametric studies showed that use of high strength textile mesh (Carbon fiber) with high mesh densities can increase the ratio between serviceability and ultimate conditions to reduce the efficiency in UHSTRC. However, when high mesh densities and high strength materials were used the reduction of initial maximum moment was limited. The use of glass fiber textile with 5 mm mesh had no reduction in initial maximum moment which the serviceability conditions can be extended beyond the point previously considered. However, the reduced mesh size lead to poor bonding between concrete matrix and textile reinforcements which can affect the accuracy of the analytical predictions.
Though high ultimate to serviceability moment ratio limit the serviceability design, the large ultimate curvature values can increase the curvature ductility of the section, which is the ratio between curvatures at failure and yield [31]. The use of high mesh densities of 10 mm and 5 mm increased the ductility of UHSTRC by marginal 1% and 6%, respectively compared to 12.5 mm mesh. The GFTRC samples found to be having an increase of average by 18% and 28% in curvature ductility compared to CFTRC and BFTRC, respectively. The UHSTRC with high thickness can adversely affect the curvature ductility UHSTRC. Though the high thicknesses increased the ultimate moment of UHSTRC, a considerable reduction of ultimate curvature was also observed. Therefore, a reduction in curvature ductility of 26% was observed when thickness of UHSTRC increases by 4 mm. Thus, limited ductility of UHSTRC with high thickness, limited the energy dissipation performance of UHSTRC. However, the thin UHSTRC is not feasible to use in structural elements alone due to the low ultimate moment capacity. Therefore, the hybrid wall systems can be adapted to enhance structural performance through optimizing UHSTRC behavior.
Good agreement between analytical and experimental results could be seen, especially in key points of moment–curvature relationship such as initial maximum moment, ultimate moment and ultimate curvature etc. However, the analytically predicted moment–curvature behavior found to have more linear portions compared to experimental moment-curvature. The assumptions made in an analytical program, such as considering the UHSTRC behavior as a Bernoulli region throughout the loading, are the causes of such deviation. Considering the UHSTRC as a Bernoulli region after the cracking makes the analytical results linear compared to the experimental results. Moreover, the material properties and assumed constitutive material behavior can differ from the actual material properties and behavior. The assumption of considering the perfect bond between textile and UHSC can lead to the variation in moment curvature between the yield moment and ultimate moment. However, such an assumption does not heavily affect the key parameters, such as the ultimate moment and ultimate curvature. The assumption of the perfect bond between the concrete matrix and the textile yarns can induce outliers between experimental and analytical curvature values. Since the UHSTRC failed in the experiments due to the rupture of bottom textile layer, the assumption of perfect bond does not affect the failure prediction of UHSTRC.

7. Conclusions

The following conclusions were made after evaluating the experimental results, analytical results, and thorough discussion:
  • The experimental results show that the increase in the number of textile layers improved the performance of UHSTRC considering the ultimate load capacity and serviceability load capacity. The ratio between ultimate and serviceability stress increased with the number of textile layers. However, serviceability conditions will govern the design aspects of UHSTRC, considering the stiffness and high ultimate deflections of UHSTRC.
  • It was observed that increasing the number of textile layers can increase the performance of UHSC in tension as well. In particular, the tension softening of UHSC improved due to the bonding between textile and concrete.
  • Assumptions such as considering the UHSTRC behavior as the Bernoulli region and no-slip between textile and UHSC can be the cause behind the deviation between analytical and experimental moment–curvature behavior after cracking. However, such assumptions do not interrupt the key outcomes, such as ultimate moment and curvature.
  • At the higher mesh densities, the bond performance between the concrete matrix and textile reduces due to the congestion of textile reinforcements. The assumption of considering the perfect bond between the textile and concrete matrix affect the accuracy of the analytical model when the mesh density has higher values. Thus, further investigations are required to assess the effect of bond slip behavior on the flexural behavior of UHSTRC.
  • Carbon fiber textiles were found to be performed better compared to glass and basalt fiber textiles in UHSTRC. The higher ultimate load and high energy dissipation were observed in CFTRC.
  • The mesh density of textile was found to be heavily affected the moment–curvature behavior of UHSTRC. The 90% increase in ultimate moment was observed when reducing the mesh size by half. The most significant improvement was eliminating the initial moment reduction in UHSTRC after the cracking.
  • The increased thickness of UHSTRC was found to be productive in increasing the ultimate moment capacity of UHSTRC. However, the reduction in ultimate curvature with increased thickness adversely affects the performance of UHSTRC by reducing the ductility of UHSTRC.
  • The use of UHSTRC as both non-load-bearing and load-bearing elements was feasible due to the high ultimate load-carrying capacity. The UHSTRC in hybrid wall systems can be feasible as it would support the structure to dissipate energy in high loading events, such as seismic events. However, further investigations should be carried out to evaluate the seismic performance of UHSTRC using cyclic loading conditions.

Author Contributions

Conceptualization, S.K.B. and E.R.K.C.; methodology, E.R.K.C., S.K.B. and P.M.; software, E.R.K.C. and S.K.B.; validation, E.R.K.C.; formal analysis, E.R.K.C. and S.K.B.; investigation, E.R.K.C. and P.S.M.T.; resources, S.K.B. and P.M.; data curation, S.K.B. and E.R.K.C.; writing—original draft preparation, E.R.K.C.; writing—review and editing, S.K.B., P.S.M.T. and P.M.; visualization, E.R.K.C.; supervision, S.K.B. and P.M.; project administration, S.K.B. and P.M.; funding acquisition, P.M. All authors have read and agreed to the published version of the manuscript.

Funding

This research was funded by Australian Research Council (ARC) grant through Industrial Transformation Training Centers grant IC150100023.

Conflicts of Interest

The authors declare no conflict of interest.

References

  1. Escrig, C.; Gil, L.; Bernat-Maso, E.; Puigvert, F. Experimental and analytical study of reinforced concrete beams shear strengthened with different types of textile-reinforced mortar. Constr. Build. Mater. 2015, 83, 248–260. [Google Scholar] [CrossRef] [Green Version]
  2. Mesticou, Z.; Bui, L.; Junes, A.; Si Larbi, A. Experimental investigation of tensile fatigue behaviour of Textile-Reinforced Concrete (TRC): Effect of fatigue load and strain rate. Compos. Struct. 2017, 160, 1136–1146. [Google Scholar] [CrossRef]
  3. Colombo, I.G.; Magri, A.; Zani, G.; Colombo, M.; di Prisco, M. Textile Reinforced Concrete: Experimental investigation on design parameters. Mater. Struct. 2013, 46, 1933–1951. [Google Scholar] [CrossRef]
  4. Tlaiji, T.; Vu, X.H.; Ferrier, E.; Si Larbi, A. Thermomechanical behaviour and residual properties of textile reinforced concrete (TRC) subjected to elevated and high temperature loading: Experimental and comparative study. Compos. Part B Eng. 2018, 144, 99–110. [Google Scholar] [CrossRef]
  5. Hempel, R.; Butler, M.; Hempel, S.; Schorn, H.J.S.P. Durability of textile reinforced concrete. ACI Symposium Publ. 2007, 244, 87–108. [Google Scholar]
  6. Butler, M.; Mechtcherine, V.; Hempel, S.J.M. Durability of textile reinforced concrete made with AR glass fibre: Effect of the matrix composition. Mater. Struct. 2010, 43, 1351–1368. [Google Scholar] [CrossRef]
  7. Du, Y.; Zhang, X.; Zhou, F.; Zhu, D.; Zhang, M.; Pan, W.J.C.; Materials, B. Flexural behavior of basalt textile-reinforced concrete. Constr. Build. Mater. 2018, 183, 7–21. [Google Scholar] [CrossRef]
  8. Hegger, J.; Zell, M.; Horstmann, M. Textile reinforced concrete–realization in applications. In Proceedings of the International Fib Symposium Tailor Made Concrete Structures: New Solutions for Our Society, Amsterdam, Netherlands,, 19–22 May 2008. [Google Scholar]
  9. Kulas, C.J.G. Actual Applications and Potential of Textile-Reinforced Concrete. Available online: https://www.semanticscholar.org/paper/Actual-applications-and-potential-of-concrete-Kulas-Solidian/0cafa4b696994d68afdc17604f69f236a8cb4137 (accessed on 1 May 2019).
  10. Hegger, J.; Kulas, C.; Horstmann, M. Realization of TRC Façades with Impregnated AR-Glass Textiles. Key Eng. Mater. 2011, 466, 121–130. [Google Scholar] [CrossRef]
  11. Hegger, J.; Schneider, M.; Kulas, C. Dimensioning of TRC with application to ventilated facade systems. In Proceedings of the International RILEM Conference on Material Science, Aachen, Germany, 6–8 September 2010. [Google Scholar]
  12. Hegger, J.; Voss, S. Investigations on the bearing behaviour and application potential of textile reinforced concrete. Eng. Struct. 2008, 30, 2050–2056. [Google Scholar] [CrossRef]
  13. Murgul, V.; Volkova, A.; Paykov, A.; Semenov, S.; Stolyarov, O.; Melnikov, B. Flexural Behavior of Textile-Reinforced Concrete. MATEC Web Conf. 2016, 53. [Google Scholar] [CrossRef] [Green Version]
  14. Zhu, D.; Gencoglu, M.; Mobasher, B. Low velocity flexural impact behavior of AR glass fabric reinforced cement composites. Cem. Concr. Compos. 2009, 31, 379–387. [Google Scholar] [CrossRef]
  15. Baduge, S.K.; Mendis, P.; Ngo, T.; Portella, J.; Nguyen, K.J.C.; Materials, B. Understanding failure and stress-strain behavior of very-high strength concrete (>100 MPa) confined by lateral reinforcement. Constr. Build. Mater. 2018, 189, 62–77. [Google Scholar] [CrossRef]
  16. Baduge, S.K.; Mendis, P.; Ngo, T. Stress-strain relationship for very-high strength concrete (>100 MPa) confined by lateral reinforcement. Eng. Struct. 2018, 177, 795–808. [Google Scholar] [CrossRef]
  17. Graybeal, B. Ultra-High Performance Concrete; Federal Highway Administration: McLean, VA, USA, 2011. [Google Scholar]
  18. Kristombu Baduge, S.; Mendis, P.; San Nicolas, R.; Rupasinghe, M.; Portella, J. Aggregate-Dependent Approach to Formulate and Predict Properties of High-Strength and Very-High-Strength Concrete. J. Mater. Civ. Eng. 2020, 32, 04020053. [Google Scholar] [CrossRef]
  19. Mendis, P.; Nguyen, K.; Baduge, S.; Chandrathilaka, E. Textile reinforced concrete composite for advanced construction applications. In Proceedings of the international conference on composites materials (ICCM22), Melbourne, Australia, 11–16 August 2019. [Google Scholar]
  20. Nguyen, K.; Navaratnam, S.; Mendis, P.; Zhang, K.; Barnett, J.; Wang, H.J. Fire safety of composites in prefabricated buildings: From fibre reinforced polymer to textile reinforced concrete. Compos. Part B Eng. 2020, 187, 107815. [Google Scholar] [CrossRef]
  21. Kristombu Baduge, S.; Mendis, P.; Ngo, T.D.; Sofi, M. Ductility Design of Reinforced Very-High Strength Concrete Columns (100–150 MPa) Using Curvature and Energy-Based Ductility Indices. Int. J. Concr. Struct. Mater. 2019, 13. [Google Scholar] [CrossRef]
  22. Ashour, S.A. Effect of compressive strength and tensile reinforcement ratio on flexural behavior of high-strength concrete beams. Eng. Struct. 2000, 22, 413–423. [Google Scholar] [CrossRef]
  23. Kristombu Baduge, S.; Mendis, P. Novel energy-based rational for nominal ductility design of very-high strength concrete columns (>100 MPa). Eng. Struct. 2019, 198. [Google Scholar] [CrossRef]
  24. Abouelleil, A.; Rasheed, H.A. Shear Crack Prediction in Shallow Reinforced Concrete Beams Using a Nonlinear Approach. ACI Struct. J. 2019, 116. [Google Scholar] [CrossRef]
  25. ASTM, A.J.A.I., West Conshohocken, PA. AI" ASTM C. ASTM C39/C39M-18: Standard Test Method for Compressive Strength of Cylindrical Concrete Specimens. Available online: https://www.astm.org/Standards/C39 (accessed on 1 May 2019).
  26. ASTM. D 7264/D 7264M – 07- Standard Test Method for Flexural Properties of Polymer Matrix Composite Materials ASTM International: ASTM International, 100 Barr Harbor Drive, PO Box C700, West Conshohocken, PA 19428-2959, United States. 2007. Available online: https://www.researchgate.net/publication/339947727_Designation_D_7264D_7264M_-07_Standard_Test_Method_for_Flexural_Properties_of_Polymer_Matrix_Composite_Materials_1 (accessed on 1 May 2019).
  27. Oktavianus, Y.; Kristombu Baduge, K.S.; Orlowski, K.; Mendis, P. Structural behaviour of prefabricated load bearing braced composite timber wall system. Eng. Struct. 2018, 176, 555–568. [Google Scholar] [CrossRef]
  28. Cusson, D.; Paultre, P. Stress-strain model for confined high-strength concrete. J. Struct. Eng. 1995, 121, 468–477. [Google Scholar] [CrossRef]
  29. Shin, H.-O.; Min, K.-H.; Mitchell, D. Confinement of ultra-high-performance fiber reinforced concrete columns. Compos. Struct. 2017, 176, 124–142. [Google Scholar] [CrossRef]
  30. Hillerborg, A.; Modéer, M.; Petersson, P.E. Analysis of crack formation and crack growth in concrete by means of fracture mechanics and finite elements. Cem. Concr. Res. 1976, 6, 773–781. [Google Scholar] [CrossRef]
  31. Elmenshawi, A.A.A. Ductility of Ultra-High Strength Concrete Flexural Elements Subjected to Seismic Shear; University of Calgary: Calgary, AB, Canada, 2008. [Google Scholar]
Figure 1. Glass textile used in the experiments.
Buildings 10 00068 g001
Figure 2. Preparation of Ultra-High-Strength Textile Reinforced Concrete (UHSTRC) samples.
Buildings 10 00068 g002
Figure 3. (a) Schematic diagram of loading arrangement (units: mm); (b) the test setup.
Buildings 10 00068 g003aBuildings 10 00068 g003b
Figure 4. Load vs. the deflection curve of UHSTRC for a different number of textile layers: (a) full behavior and (b) zoom- in behavior up to 1 mm of deflection.
Buildings 10 00068 g004
Figure 5. Load vs. deflection curves of UHSTRC with corresponding zoom-in views: (a) 1 layer, (b) 2 layers and (c) 3 layers.
Buildings 10 00068 g005
Figure 6. Compressive stress–strain behavior of unconfined concrete.
Buildings 10 00068 g006
Figure 7. Tensile stress–strain behavior of unconfined concrete.
Buildings 10 00068 g007
Figure 8. Stress vs. strain behavior of glass fiber textile.
Buildings 10 00068 g008
Figure 9. Section stress, strain diagram for moment–curvature analysis.
Buildings 10 00068 g009
Figure 10. Moment–curvature analysis flowchart.
Buildings 10 00068 g010
Figure 11. Multiple sections in typical analytical moment–curvature diagram.
Buildings 10 00068 g011
Figure 12. Comparison between analytical and experimental moment–curvature behavior: (a) 1 layer, (b) 2 layers and (c) 3 layers.
Buildings 10 00068 g012
Figure 13. Variation of moment–curvature with number of textile layers.
Buildings 10 00068 g013
Figure 14. Variation of moment–curvature with textile material: (a) 1 layer, (b) 3 layers and (c) 5 layers.
Buildings 10 00068 g014
Figure 15. Variation of moment–curvature with mesh density of textile: (a) 1 layer, (b) 3 layers and (c) 5 layers.
Buildings 10 00068 g015
Figure 16. Variation of moment–curvature with textile layer thickness: (a) 1 layer, (b) 3 layers and (c) 5 layers.
Buildings 10 00068 g016
Table 1. Composition of concrete matrix.
MaterialCement (GP)SandFly AshSilica FumeSlagWaterSuperplasticizerViscosity ModifierRetarder
Content (kg/m3)783705258782822871124
Table 2. Properties of glass fiber textile.
Mesh Size (mm × mm)Tensile Load Bearing Capacity of 50 mm Strip (N)Tensile Strength (MPa)Elastic Modulus (GPa)Ultimate Strain (mm/mm)
10 × 1010781100410.025
Table 3. Summary of experiment results.
Specimen IDNo. of TRC LayersUltimate Load (N)Ultimate Flexural Stress (MPa)Peak DeflectionFirst Crack Load (N)First Crack Deflection (mm)
TRC-L1-s1188.21.721.9666.50.15
TRC-L1-s21159.23.112.08180.50.23
TRC-L1-s31146.72.872.939.90.048
TRC-L2-s12205.14.013.40183.10.299
TRC-L2-s22304.85.953.10193.50.265
TRC-L2-s32268.15.243.20134.80.232
TRC-L3-s13461.19.012.71268.50.149
TRC-L3-s23431.18.426.53149.90.415
Table 4. Properties of carbon and basalt fiber textile.
MaterialTensile strength (MPa)Elastic modulus (GPa)Ultimate strain (mm/mm)
Basal fiber textile884450.022
Carbon fiber textile21801090.02

