
Digital Protection and Utilization of Architectural Heritage Using Knowledge Visualization

College of Art, Taiyuan University of Technology, Jinzhong 030600, China
*
Author to whom correspondence should be addressed.
Buildings 2022, 12(10), 1604; https://doi.org/10.3390/buildings12101604
Submission received: 30 August 2022
/
Revised: 21 September 2022
/
Accepted: 26 September 2022
/
Published: 4 October 2022
(This article belongs to the Section Construction Management, and Computers & Digitization)
Abstract
:Architectural heritage is a lively carrier of historical development, as well as providing a valuable resource for human society. Recently, however, the longevity of architectural heritage has been influenced and even threatened by natural and human factors. Furthermore, the future remains uncertain. Therefore, this study aimed to develop a comprehensive method, namely, digital protection and utilization based on knowledge visualization (DPUKV), to protect and utilize architectural heritage. The most important problem to solve involves transforming digital protection data into a digital inheritance culture. We constructed a technical framework of knowledge acquisition, knowledge reconstruction, knowledge innovation, and knowledge management using qualitative and vertical methods to form hierarchical digital resources of architectural heritage. In particular, the knowledge reconstruction converted tacit knowledge of architectural heritage into explicit knowledge via visualization technology, providing research materials for more scholars. In knowledge innovation, architectural heritage culture was excavated and inherited through knowledge graphs, digital displays, and cultural creation with virtual reality, augmented reality, etc. Furthermore, this method was validated over four years via architectural heritage in China as case studies. In this paper, the buildings of Qinglian Temple in Shanxi, China, are discussed in detail as a case study. The results indicated that this method was effective for preserving architectural heritage and is suitable for other cultural heritage. It is also helpful to improve the public’s protection of and interest in cultural heritage, especially architectural heritage.
1. Introduction
Architectural heritage, which is an important carrier of local cultural identity, is not only the material assets conferred by history but also the cultural resources needed for future development [1]. Alongside natural changes and sociocultural development, many architectural heritages have suffered serious damage and face the threat of disappearance [2]. The causes of this decline were natural environmental erosion and man-made intentional or unintentional damage [3]. In particular, the devastation caused by major disasters reinforces the necessity to prevent risks and protect heritages. Fortunately, the rapid development of digital technology, such as remote sensing, terrestrial laser scanning (TLS), cloud computing, and virtual reality (VR), provided opportunities to protect cultural heritage [4] and brought about a new wave of technological revolution [5,6]. Three-dimensional scanning combined with photogrammetry efficiently obtained geometric and texture information of architectural heritage sites to protect them precisely and flexibly [7,8].
In this study, digital protection was used to record architectural heritage in detail using digital technology, and digital utilization was used to inherit culture using digital protection data. Over the past 10 years, this has become a research hotspot. In the historical Castle of Turin, Italy, information was saved using BIM modeling and developed through a VR application to promote the protection and use of architectural heritage [9]. In the ancient watchtowers of the Chinese Tibetan areas, unmanned aerial vehicle (UAV) photogrammetry integrated with TLS was used to digitally model and restore the watchtowers in these harsh environments [10]. A 3D scanning methodology was developed in an intensive tourism environment and exemplified by the group of monuments called Timurid architecture in Kazakhstan and Uzbekistan [11]. Furthermore, other methods were proposed that used automatic digital modeling of buildings [12], the excavation of the simulated environment of endangered sites based on virtual reality [13], the digital restoration of ancient buildings, the creation of interactive systems [14], etc.
Recently, digital-protection-related research has developed rapidly, and research avenues have become more diversified. For instance, risk assessment and prevention were carried out by the European Union (EU) in order to safeguard cultural heritage from the effects of natural disasters and man-made threats [15]. The Royal Alcazar of Seville in Spain, which is a world heritage site, was preventively maintained through an innovative fuzzy inference system that quantified the vulnerabilities and risks [16]. The artistic assets of a museum in Italy were maintained and protected by integrating a historical digital twin and informative system [17]. In China, a new digital protection method was proposed that built a web-based digital protection platform using an improved four-layer architecture design pattern [18]. In brief, digital technology breathes new life into architectural heritage and makes it possible to live on forever.
Knowledge visualization is a new discipline that developed from data visualization and information visualization [19]. In 2004, Eppler first proposed knowledge visualization and defined it as the application of visual representation to improve the dissemination and innovation of group knowledge [20]. It aimed to transfer opinions, experiences, values, etc., in a way that helps others to correctly reconstruct, remember, and apply knowledge [21]. At first, the research of knowledge visualization was mainly in information science. At present, it has been applied to many fields, such as computer science, pedagogy, geography, and cultural heritage. In cultural heritage, the urban culture of Yanglim-Dong, South Korea, was analyzed and designed as the city’s important historical knowledge nodes [22]. The Medieval Wall of Avila 4D integrates heterogeneous information and professional knowledge to build a virtual three-dimensional space using modeling and visualization technology [23]. In Spain, the knowledge of Europe’s silk heritage was displayed in an interactive map using a multipurpose knowledge-assisted visualization tool for spatiotemporal data [24]. In China, ancient Shanxi opera stages were digitally represented using knowledge visualization technology [25]. The interactive mobile panoramic virtual museum was designed based on knowledge visualization [26]. In addition, there were other typical applications of knowledge visualization, such as the construction of a cultural-heritage-specific process knowledge model [27], the application of 3D visual interaction technology [28], and the knowledge discovery method of cultural relic information resources based on theme recognition [29], which had become the cutting-edge research and promoted innovation in the protection and utilization of cultural heritage. To some extent, knowledge visualization breaks the traditional cognition of cultural heritage, perfectly displays their cultural connotation, and realizes cross-time and cross-space communication.
In view of previous research, this study developed a comprehensive method to protect and use the architectural heritages with knowledge visualization and digital technology. It consisted of knowledge acquisition, knowledge reconstruction, knowledge innovation, and knowledge management by utilizing knowledge visualization, TLS, VR/AR, etc. This paper is organized as follows. Section 2 describes the method developed in detail. In Section 3, the results of this method are discussed, with a real case study of historic buildings in Qinglian Temple, China, investigated by our team. Finally, Section 4 reports the conclusions.
2. Methods
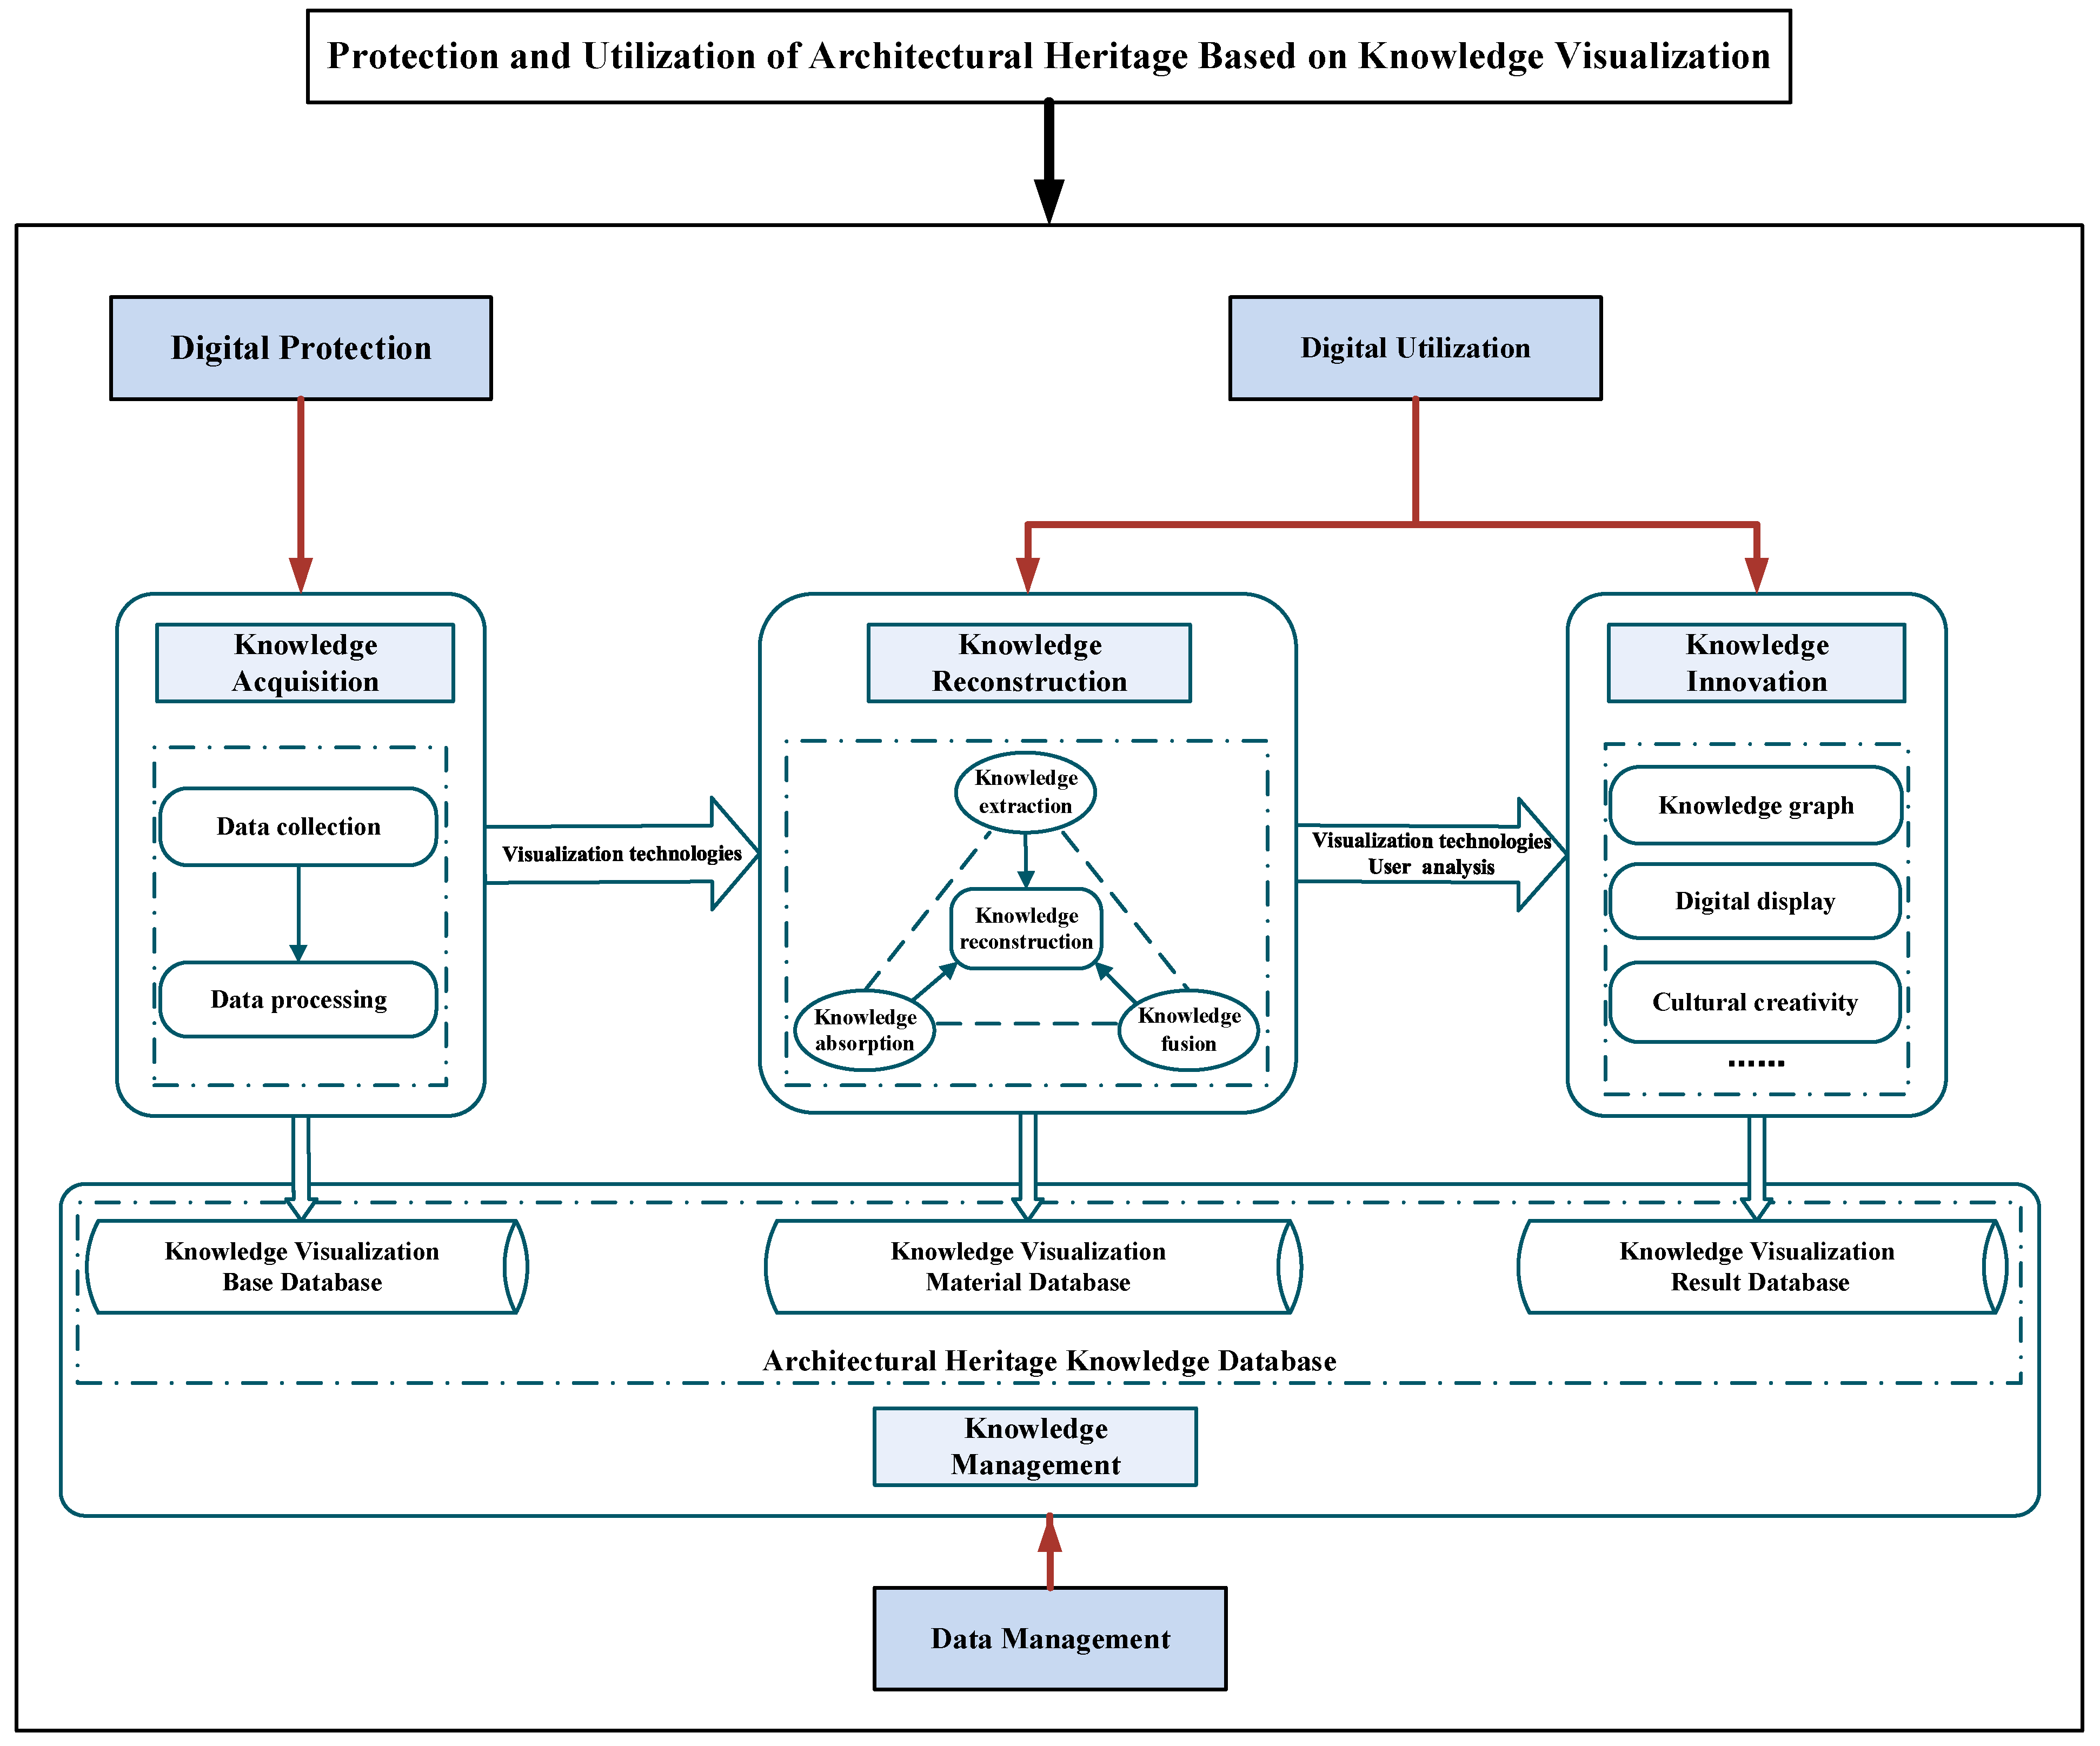
This section reports the method used, namely, digital protection and utilization based on knowledge visualization (DPUKV), in this study for architectural heritage. This method used knowledge visualization theory and digital technology, including knowledge acquisition, knowledge reconstruction, knowledge innovation, and knowledge management. Knowledge acquisition was used for digital protection. Knowledge reconstruction and innovation were used for digital utilization. Knowledge management was used for data management.
The case study investigated the architectural heritage of Qinglian Temple, Jincheng, Shanxi, China. This was selected since it involves diverse and complex forms and has high symbolic and cultural value. These features made it a relevant case study for the interpretation of the analysis results and the future implementation of knowledge visualization.
This general technical framework is shown in Figure 1.
2.1. Knowledge Acquisition
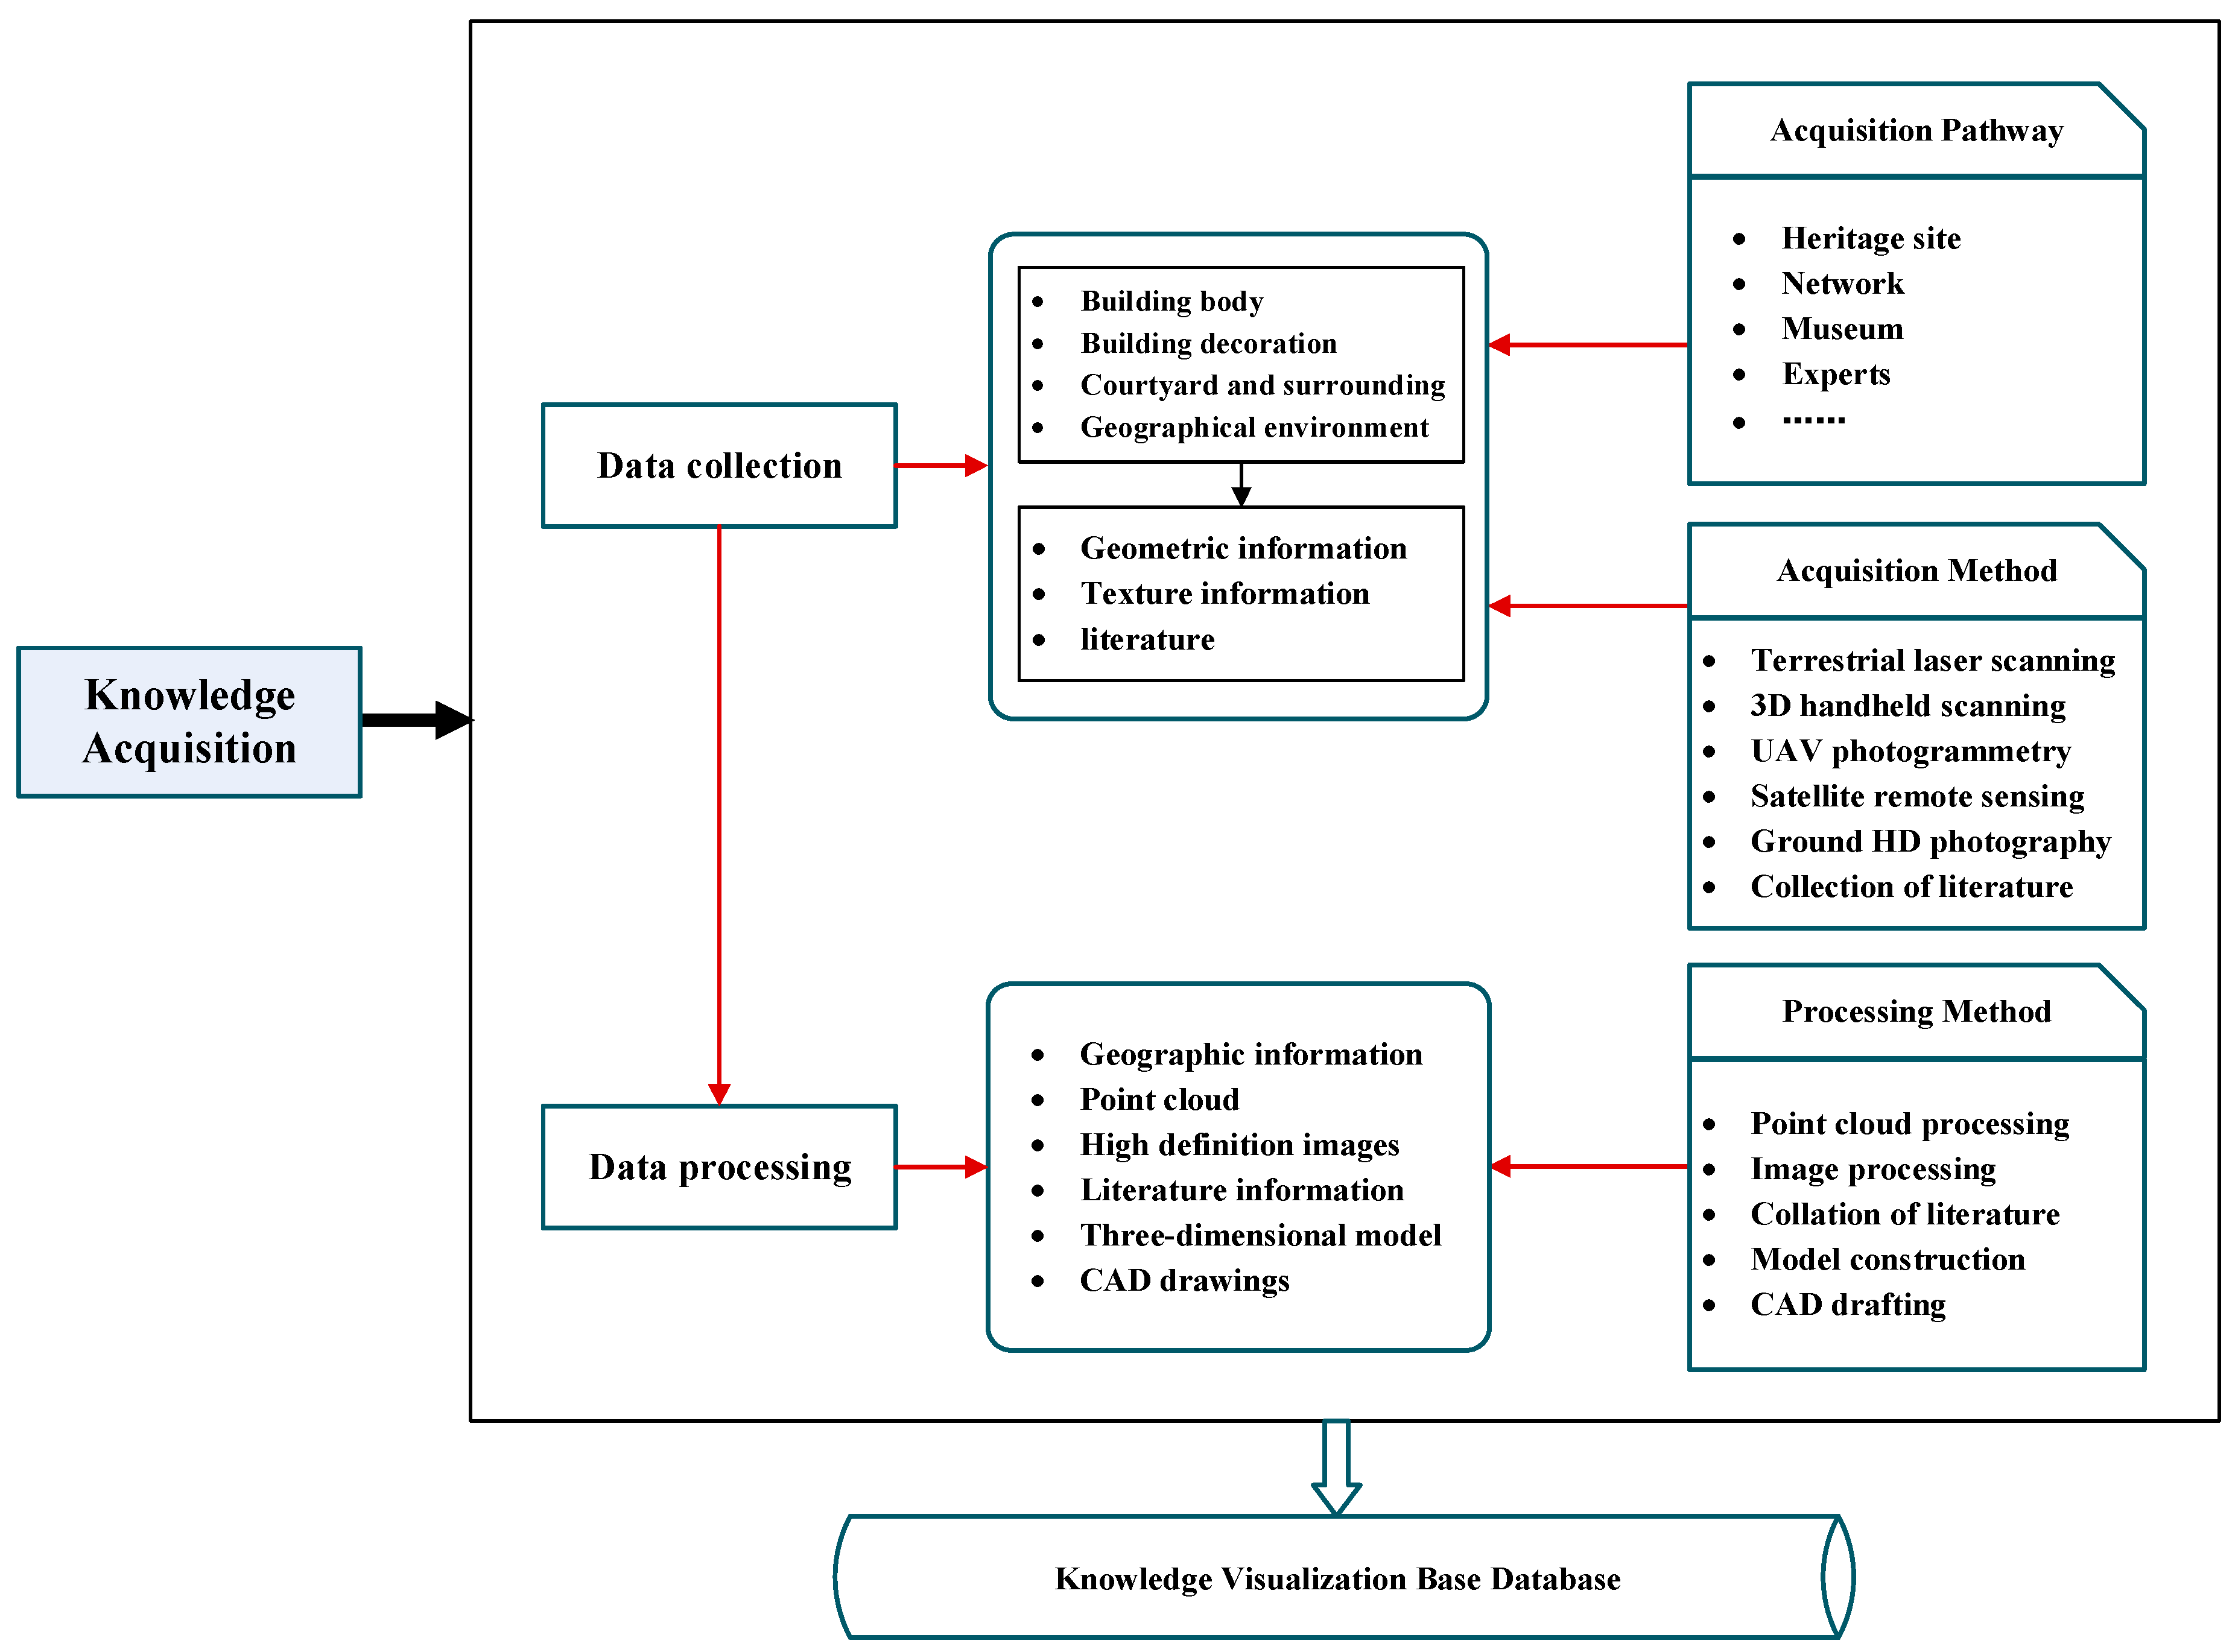
The knowledge acquisition was divided into data collection and data processing. Different materials have different collection methods, and the current methods are aerospace remote sensing, airborne lidar, tilt photogrammetry, three-dimensional (3D) laser scanning, etc. [30]. In our study, the original data, including the point clouds, images, literature, etc., were mainly obtained using TLS, UAV photogrammetry, and high-definition (HD) photography. After the data processing, the data was supplemented with CAD drawings, 3D models, etc.
Figure 2 shows the technical framework of the knowledge acquisition.
- (1)
- Data Collection
The information required for buildings can be divided into information about the building body, architectural decoration, courtyard and surroundings, geographical environment, and so on.
The geometric information of the building body was obtained using point clouds from the indoor and outdoor surfaces of the building using TLS. The point cloud information of any target point included its 3D coordinates, color information, and echo intensity, which were respectively expressed as (x, y, z), (R, G, B), and (intensity). In our study, the 3D laser scanners used were the Leica C10 (Wetzlar, Germany) and the Focus S350 (Lake Mary, FL, USA).
The architectural decorations, such as carvings, colorful paintings, and plaques, were usually small in scale but exquisite and complex in shape. Therefore, a 3D handheld scanner was used for the scanning. In our study, when the scale was less than 500 mm, an Artec Spider scanner (Luxembourg) was used, whose accuracy was 0.05 mm. When the scale was between 500 mm and 2000 mm, an Artec EVA and Artec LEO were used, whose accuracy was 0.1 mm.
The geometric and textural information of the courtyard and surroundings were obtained using UAV photogrammetry. The DJI UAV (Shenzhen, China) obtained the images of the building top, courtyard, and surroundings from one vertical and four inclined directions. These images were used to directly generate a textured 3D model through photo modeling, which sharply expressed the spatial location and geographical environment of the buildings. Furthermore, the UAV images also clearly recorded the textural properties of the building top.
The 3D geographical environment of the heritage site, such as the topography, geomorphology, and vegetative cover, was obtained using satellite remote sensing images. The basic geographical data mainly included the digital line graphic, digital raster graphic, digital elevation model, and digital orthophoto map.
The textural information of the building body and decorations was obtained through high-definition images, which included building surface textural images, as well as the global and local building images. The image resolution was usually 6720 × 4480 pixels.
- (2)
- Data Processing
Point clouds were processed by registering multisite original point clouds, extracting point cloud contours and slices, eliminating the noise of surrounding buildings and trees, etc. Each image was processed using color correction, distortion correction, stain elimination, image stitching, etc. to form a high-definition and complete image.
CAD drawings and the building information model (BIM) accurately recorded the architectural structures and dimensions. However, the BIM was easily managed as an independent system, though it was difficult to connect it with other links in this system. Hence, the CAD drawings were drawn by measuring point clouds, which usually included the plans, elevations, and sections of buildings.
The 3D models were constructed using 3D modeling and texture mapping. The 3D modeling was undertaken to build the 3D prime model of the whole building and building elements according to the CAD drawing. The textural mapping was undertaken to map the texture images into a 3D prime model, which was turned into a 3D color model.
Furthermore, all digital data were saved in the knowledge visualization base database.
2.2. Knowledge Reconstruction
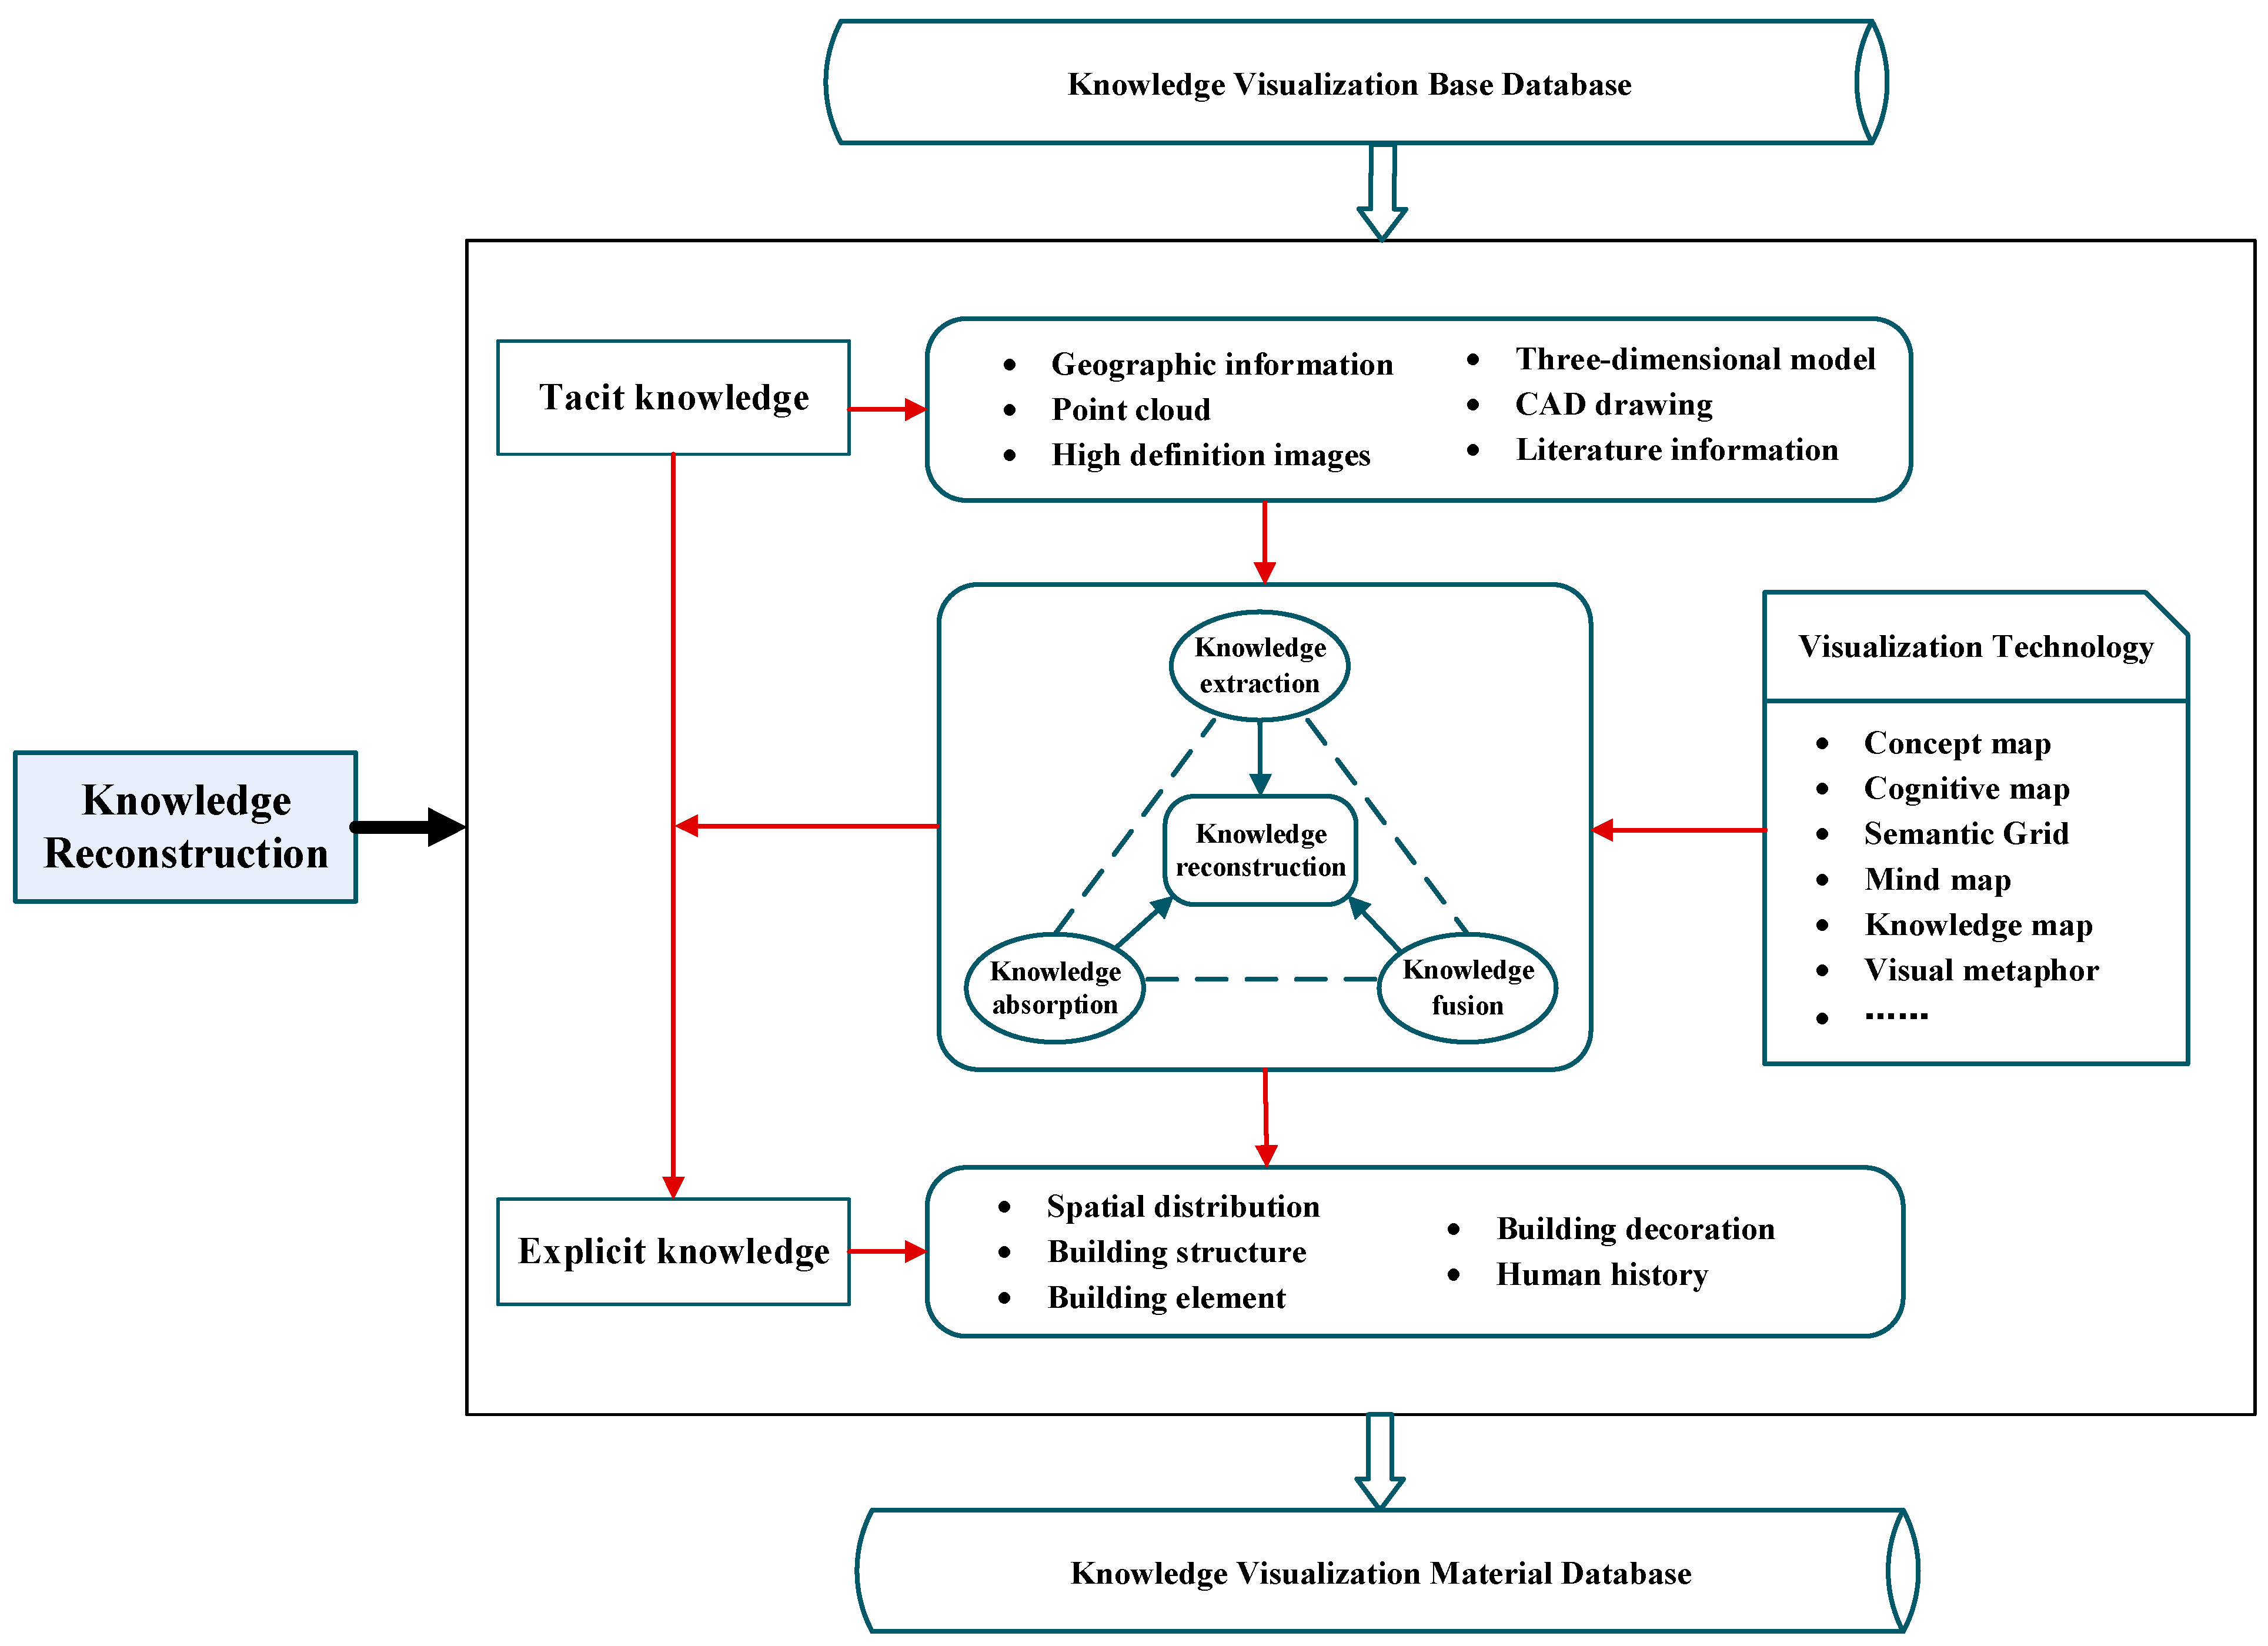
Knowledge reconstruction was undertaken to transform the profound culture contained in architectural heritage into comprehensible knowledge, making it easier for the public to understand the complicated architectural heritage culture. Therefore, we reconstructed the architectural heritage knowledge, referring to the theoretical framework of knowledge transformation [31] and combining the data gathered from the knowledge acquisition and the characteristics of architectural heritage, as shown in Figure 3.
We reconstructed the tacit and explicit knowledge, which were concepts that were originally proposed by Michael Polanyi in the field of philosophy in 1958. In Polanyi’s concepts, tacit knowledge is undescribed knowledge and explicit knowledge is expressed knowledge [32].
In this method, the tacit knowledge represents digital protection data, including point clouds, images, 3D models, CAD drawings, and literature information about the architectural heritage. The information contained almost all the contents of architectural heritage, but many of them were obscure and difficult to understand for most scholars or the public. For example, from the point clouds, we extracted geometric information and even judged its material information using the echo strength, which needed remote sensing professionals to complete. Therefore, we reconstructed the above knowledge of the architectural heritage through visualization technologies, such as a mind map, concept map, cognitive map, and semantic grid, to form explicit knowledge, which made it easier to understand.
Knowledge reconstruction was mainly formed through knowledge extraction, knowledge absorption, and knowledge fusion. Knowledge extraction was undertaken to extract the tacit knowledge contained in the point clouds, images, models, documents, etc., from the architectural heritage knowledge base database. Knowledge absorption was the process where knowledge workers selected and used various resources in the knowledge base database to complete knowledge construction according to the task situation. Knowledge fusion was undertaken to combine all kinds of scattered knowledge in the knowledge base database and systematically produce new knowledge.
For example, the building 3D model contained the tacit knowledge of the material, shape, size, and craft of each building component. Several components also formed a bucket arch. Through knowledge reconstruction, the bucket arch of each building was recombined to produce the bucket arch knowledge. Using this new knowledge, we could analyze and interpret the characteristics of various bucket arches in detail.
Through the above method, the implicit heritage knowledge hidden in the 3D model was reconstituted into explicit knowledge. The knowledge was expressed in academic language and displayed using words and charts, which were more suitable for researchers to use. Furthermore, the digital reconstruction data were saved in the knowledge visualization material database of architectural heritage.
2.3. Knowledge Innovation
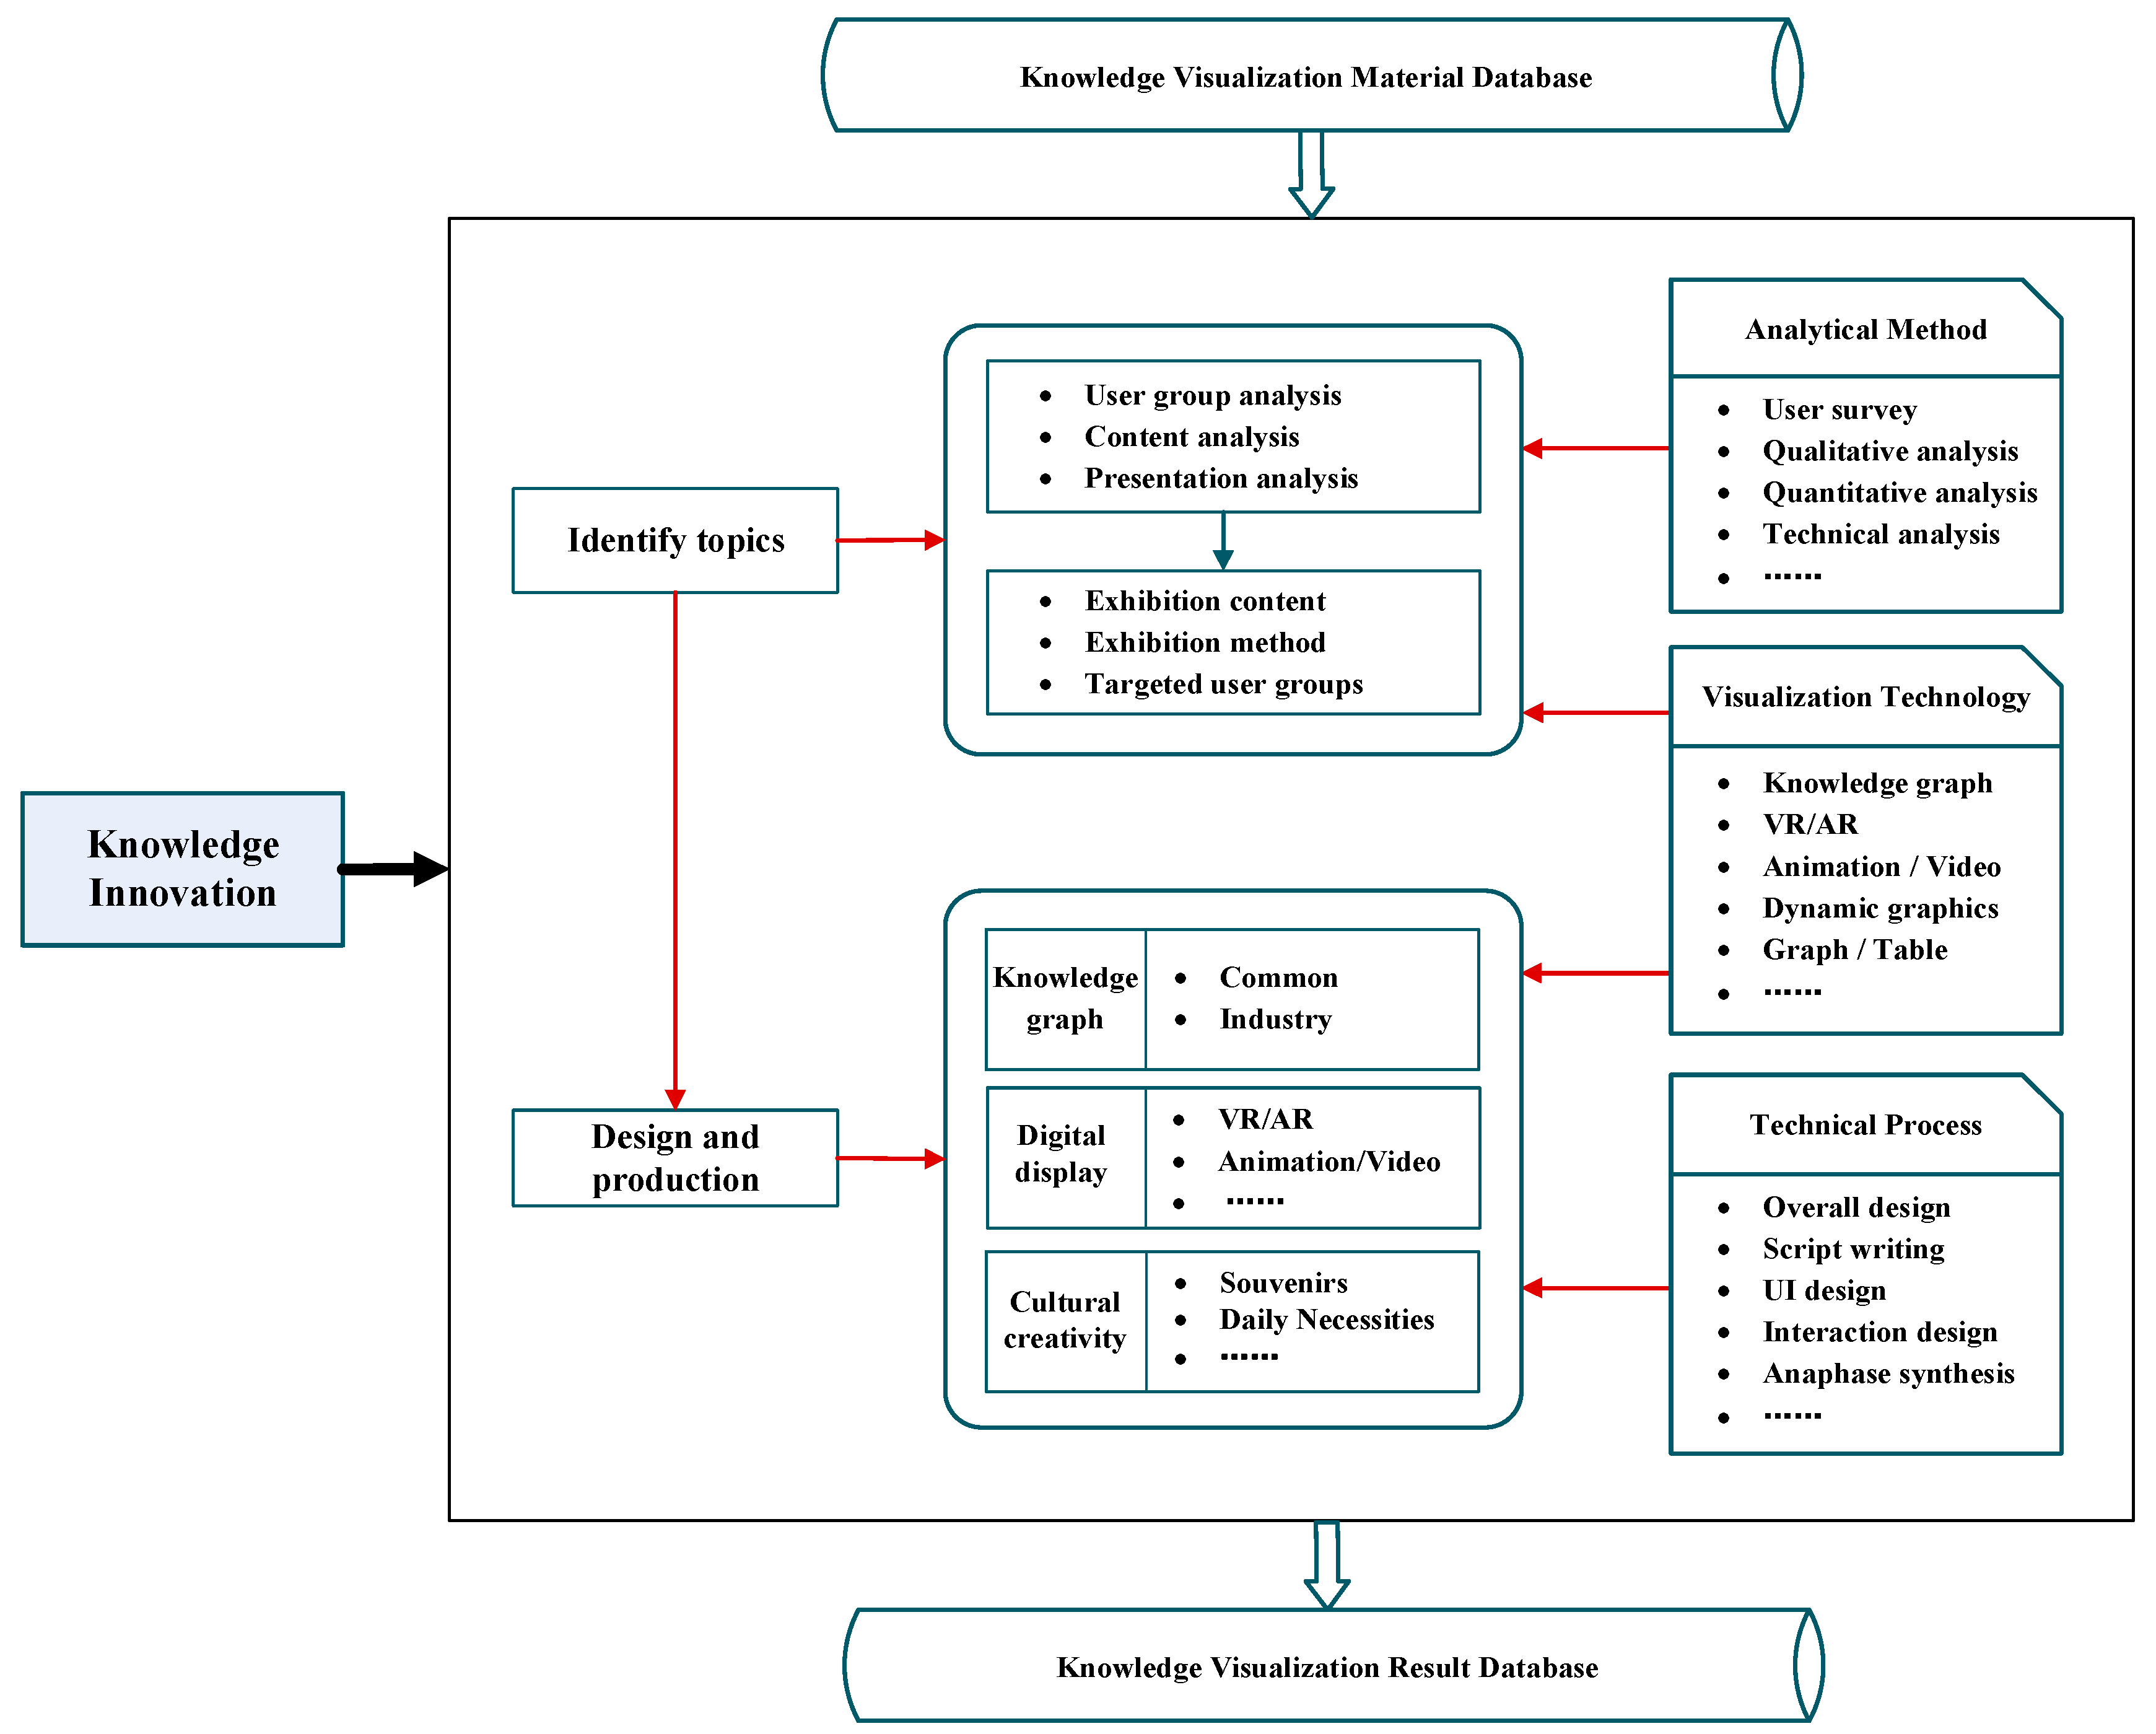
Knowledge innovation was undertaken to disseminate the architectural heritage knowledge using visualization technologies, such as knowledge graphs, VR/AR, and animations. The architectural heritage culture was transferred to the public through seeing, hearing, touching, etc., and allowed people to experience the architectural heritage’s charm more systematically and comprehensively.
In our study, we inherited the architectural heritage culture from knowledge graphs, digital displays, and cultural creations to better represent the value of history, science, and art. Among them, the most important work was to excavate professional knowledge regarding the architectural heritage and present it in a well-known way.
The knowledge innovation of architectural heritage is shown in Figure 4. It is realized in two steps, as described below.
- (1)
- Identify Topics
For the architectural heritage knowledge to be explained, first, we analyzed the user groups, such as the cognitive characteristics of users, the degree of accepting knowledge, and the ability to accept knowledge. Second, we analyzed the visualization methods that can be used, such as animation and VR/AR. Finally, we determined the design topic, such as AR interaction for teenagers.
- (2)
- Design and Production
This was undertaken to realize the topics using visualization technology, such as knowledge graphs, digital displays, and cultural creativity, to express the deep-rooted culture. In the digital displays, there were animations, VR/AR, graphics, images, etc. Due to the different display methods, the design and production processes were different. For example, VR/AR design was realized through the overall design, script writing, material and lighting production, UI design, VR/AR interactive design, post-effect production, etc. They were disseminated online and offline. Moreover, the innovation works were saved in the knowledge visualization results database.
2.4. Knowledge Management
Knowledge management was undertaken to manage and use the multi-source heterogeneous data generated above. The architectural heritage information was large in quantity and widely distributed. Therefore, the digital protection and utilization produced large amounts of data, which was difficult to manage and use effectively. This required scientific methods to accurately organize it to form a robust management structure.
Therefore, the architectural heritage knowledge visualization management system was developed to effectively integrate the data from all databases to form an intelligent and open management platform. In this study, this management system was developed using Visual Studio. The web was developed with Visual Studio Code, C#, etc., and the databases used were SQL and NOSQL.
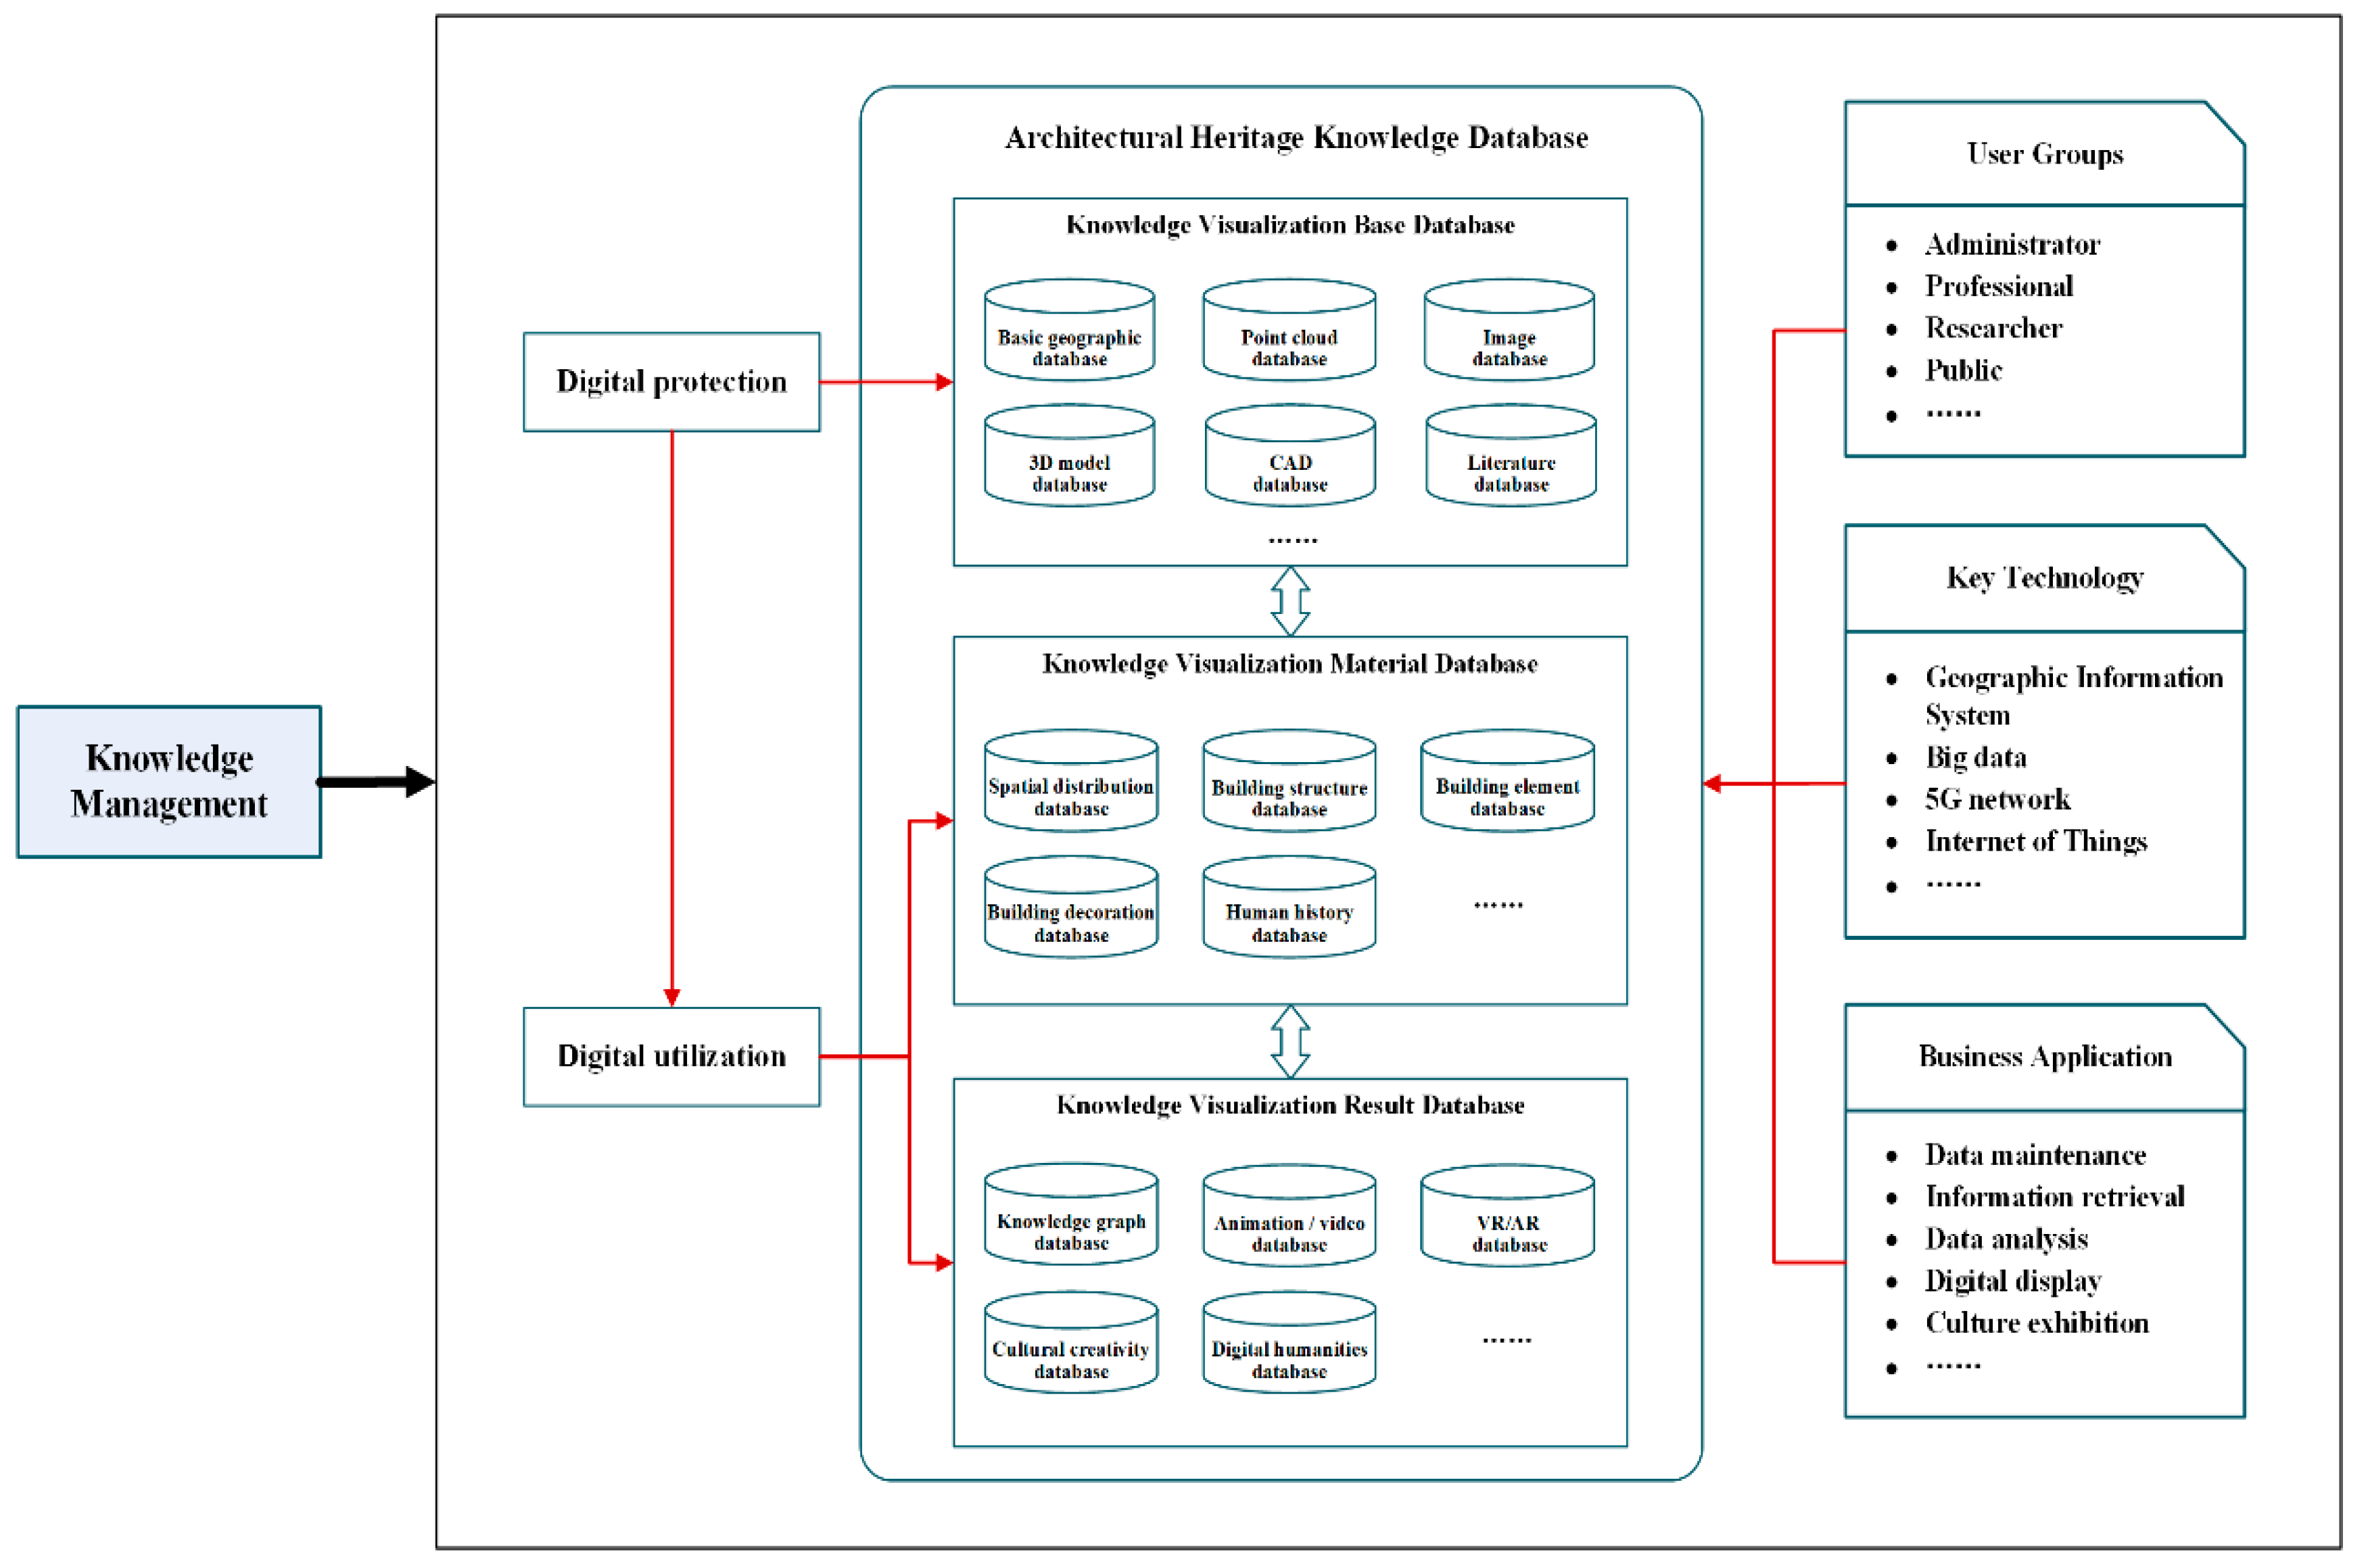
The system was divided into two subsystems, namely, digital protection and digital utilization, as shown in Figure 5. The digital protection mainly managed the knowledge visualization base database for administrators and professionals. The digital utilization mainly managed the knowledge visualization material database and the knowledge visualization results database for researchers and the public.
The contents of the architectural heritage knowledge database were as follows.
- (1)
- Knowledge Visualization Base Database
In this database, the data were stored after the data collection and data processing, including the basic geographic database, point cloud database, image database, 3D model database, CAD database, and literature database. Each database was divided into multiple databases according to different functions. For example, the point cloud database included the original point cloud database and the processed point cloud database.
- (2)
- Knowledge Visualization Material Database
This database was used to store the data after the knowledge reconstruction, including the spatial distribution database, building structure database, building element database, building decoration database, and human history database. Each database was composed of multiple databases. For example, the building element database included the roof database, caisson database, and bucket arch database.
- (3)
- Knowledge Visualization Result Database
This database was used to store the data after the knowledge innovation, including the knowledge graph database, animation/video database, VR/AR database, cultural creation database, and digital humanities database. Each database was also composed of multiple databases. For example, the VR/AR database included the VR database and AR database.
3. Case Study
Based on the above methods, we began the experiment in 2019. Our team carried out research regarding the digital protection and utilization of ancient Chinese architecture, such as Qinglian Temple, Nanchan Temple, and Hongfu Temple. In this study, the case study chosen was the Qinglian Temple in Shanxi, China, in order to better illustrate the method.
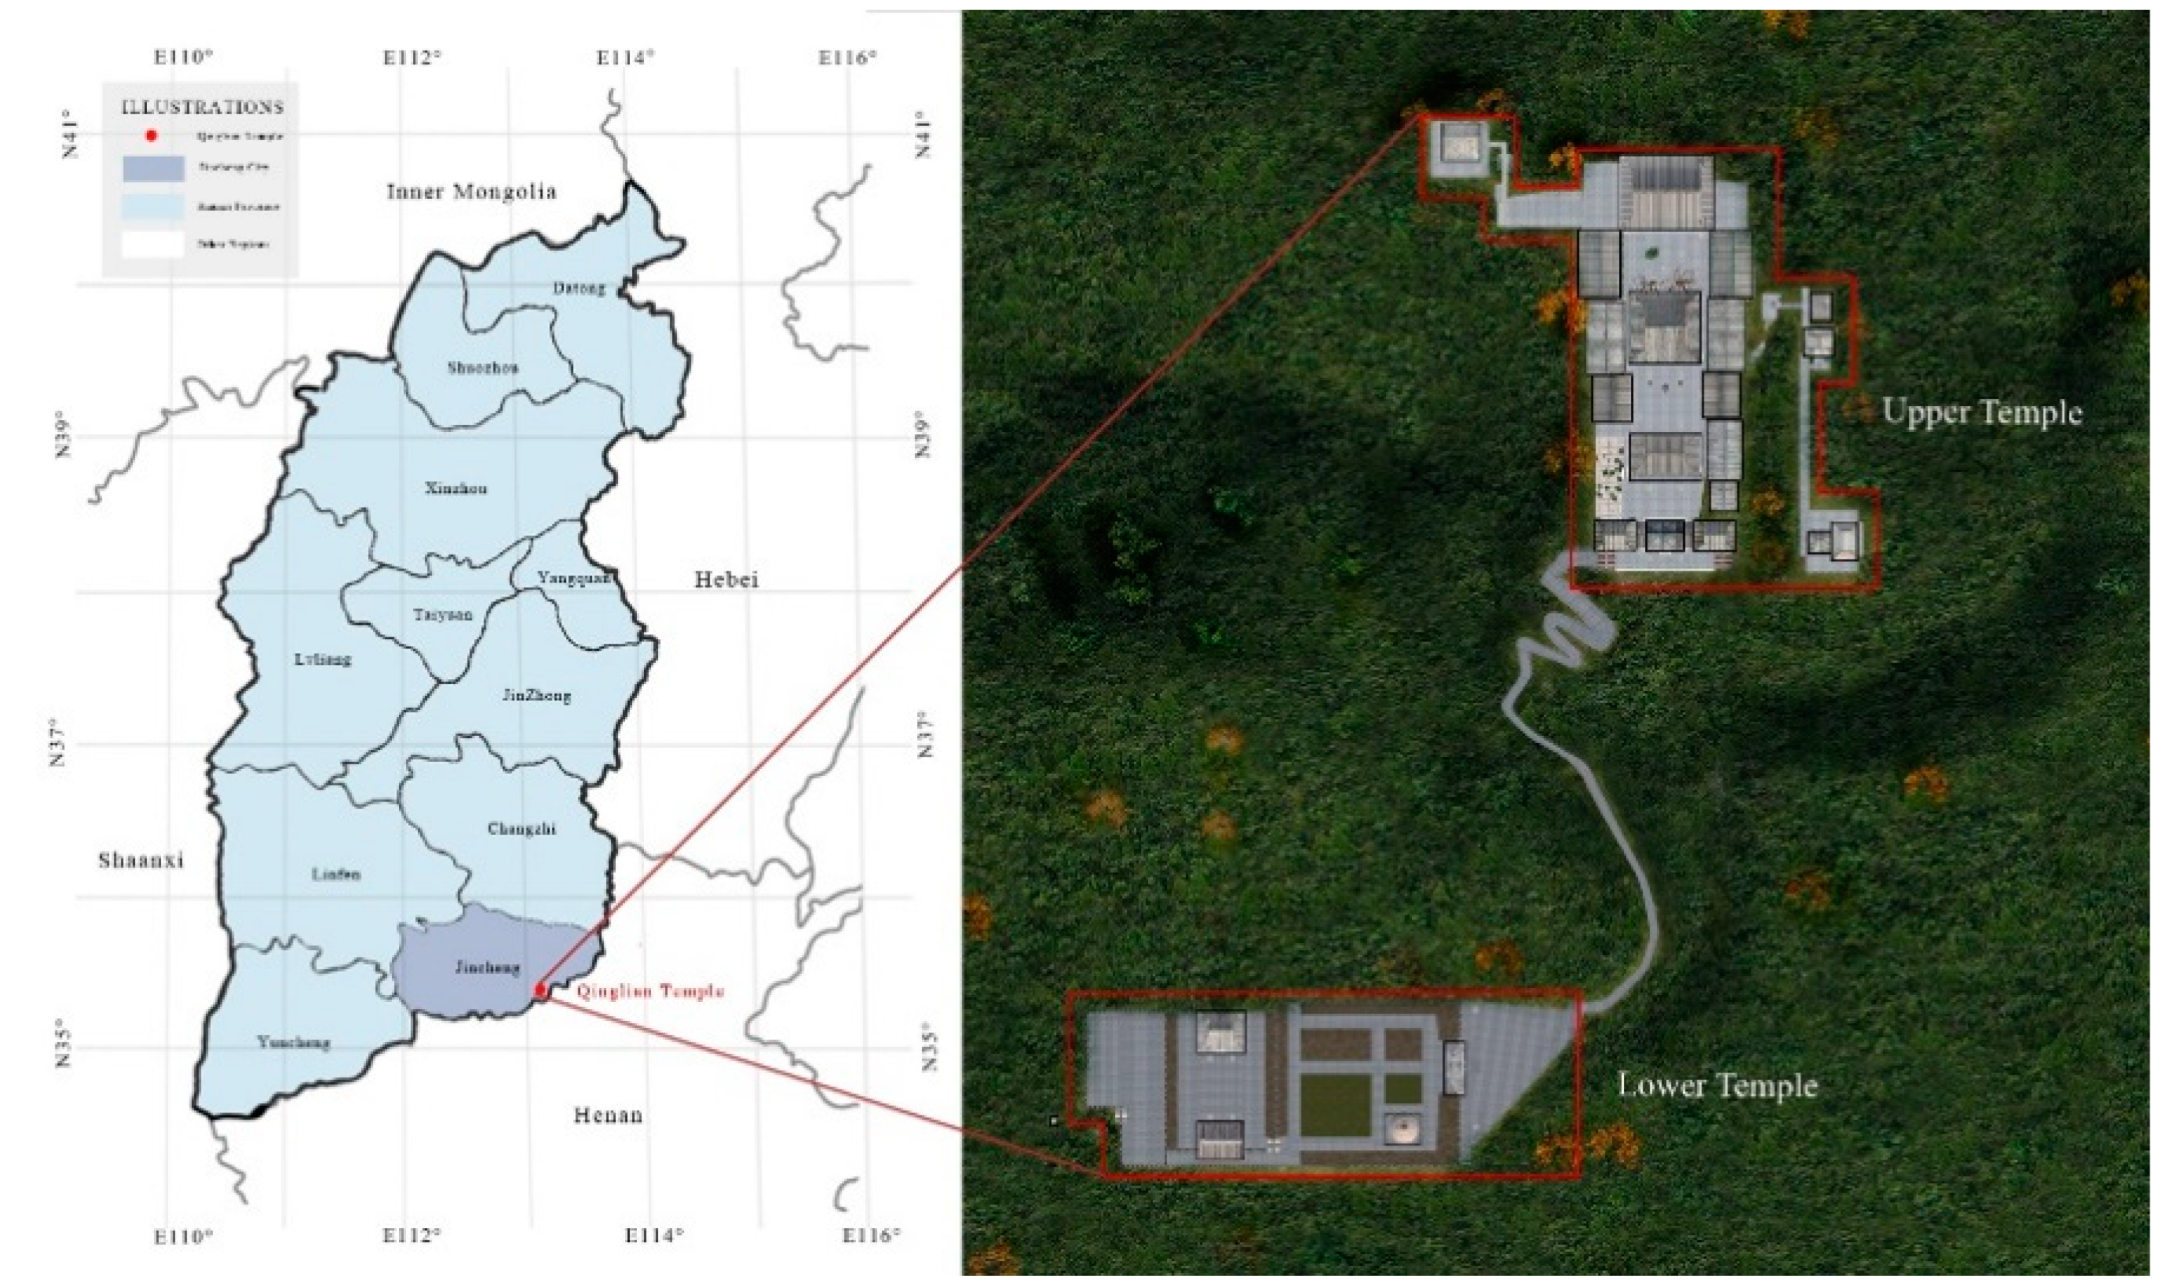
Qinglian Temple is located on Xiashi Mountain in the southeast of Shanxi Province, China. The temple is divided into the Upper Temple and Lower Temple, which are 500 m apart, with a total area of 16,000 square meters, as shown in Figure 6. The temple was first built between 550 and 559 A.D. and was one of the earliest Buddhist temples in China, known as the “Capital of Buddhism” [33]. There are cultural heritages, such as buildings, painted sculptures, stone tablets, and murals, along with 25 ancient buildings. In particular, many buildings are mixed buildings that were built at different times and whose combined style provides valuable material for architectural research.
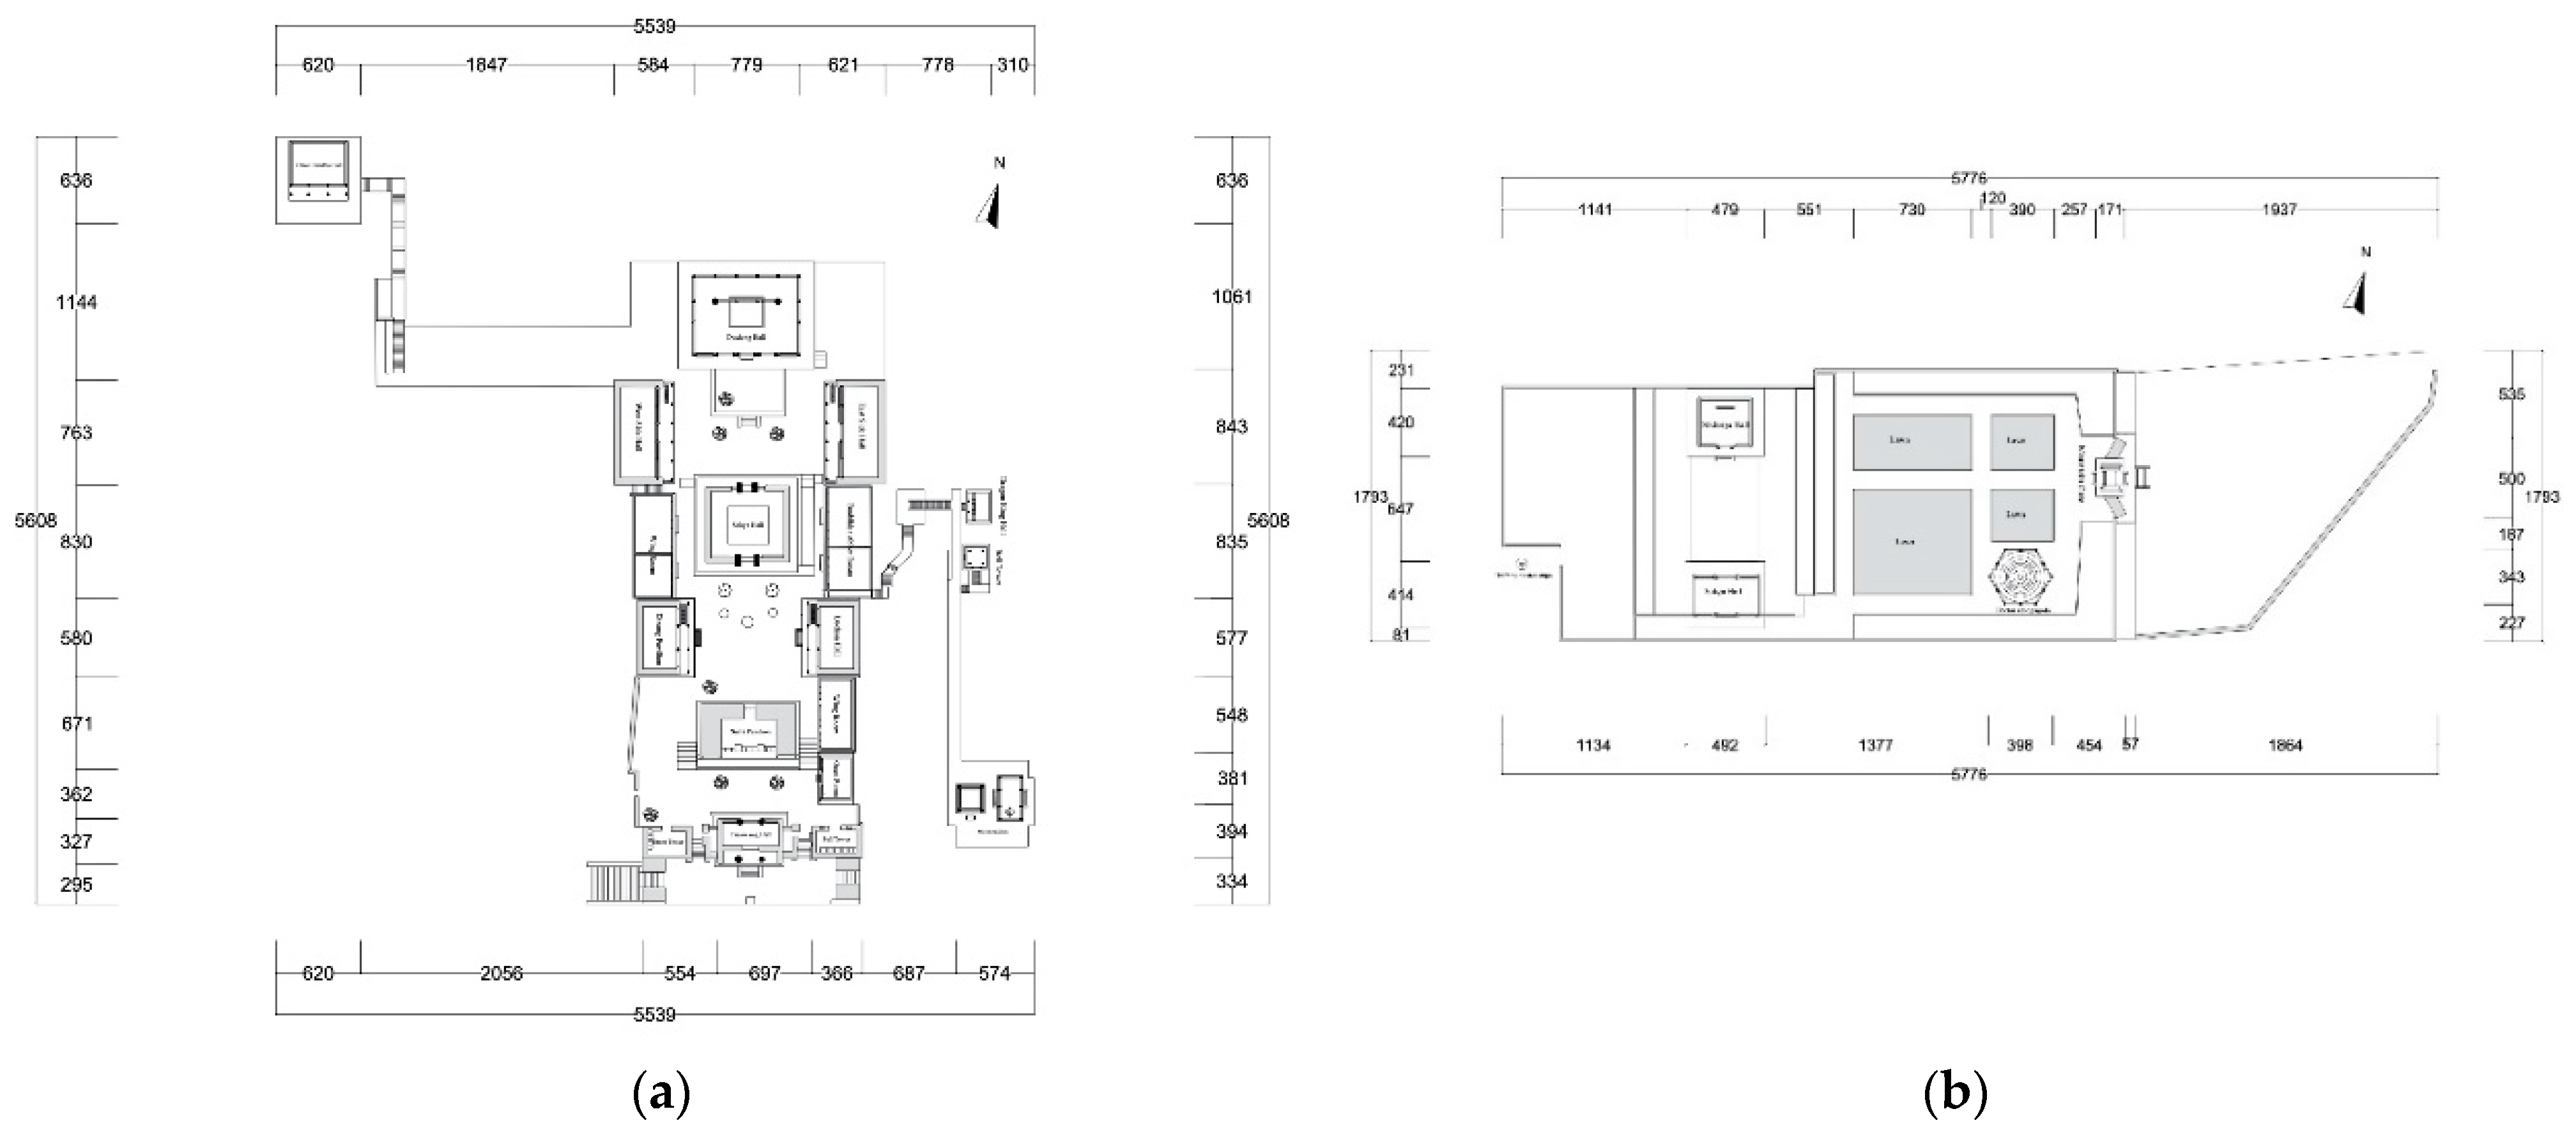
The Upper Temple is located on the hillside of Xiashi Mountain, facing south and having three courtyards, as shown in Figure 7a. The courtyard layout has primary and secondary structures, which are symmetrical left and right, showing the holy land of the Buddhist altar. The main buildings, such as the Tianwang Hall, Sutra Pavilion, Sakya Hall, and Daxiong Hall, are on the central axis and are flanked by Luohan Hall and Dizang Pavilion on both sides. There are the Three Buddha Hall in the west side courtyard and the Dragon King Hall and Moon Pavilion in the east side courtyard. The Lower Temple is located at the foot of the mountain; it is smaller than the Upper Temple and runs from west to east, as shown in Figure 7b. There is only the Sakya Hall and Maitreya Hall here. The two pagodas in the temple, which are the Tibetan Relic Pagoda on the east side and the Huifeng Master Stupa on the west side, are also located in the Lower Temple.
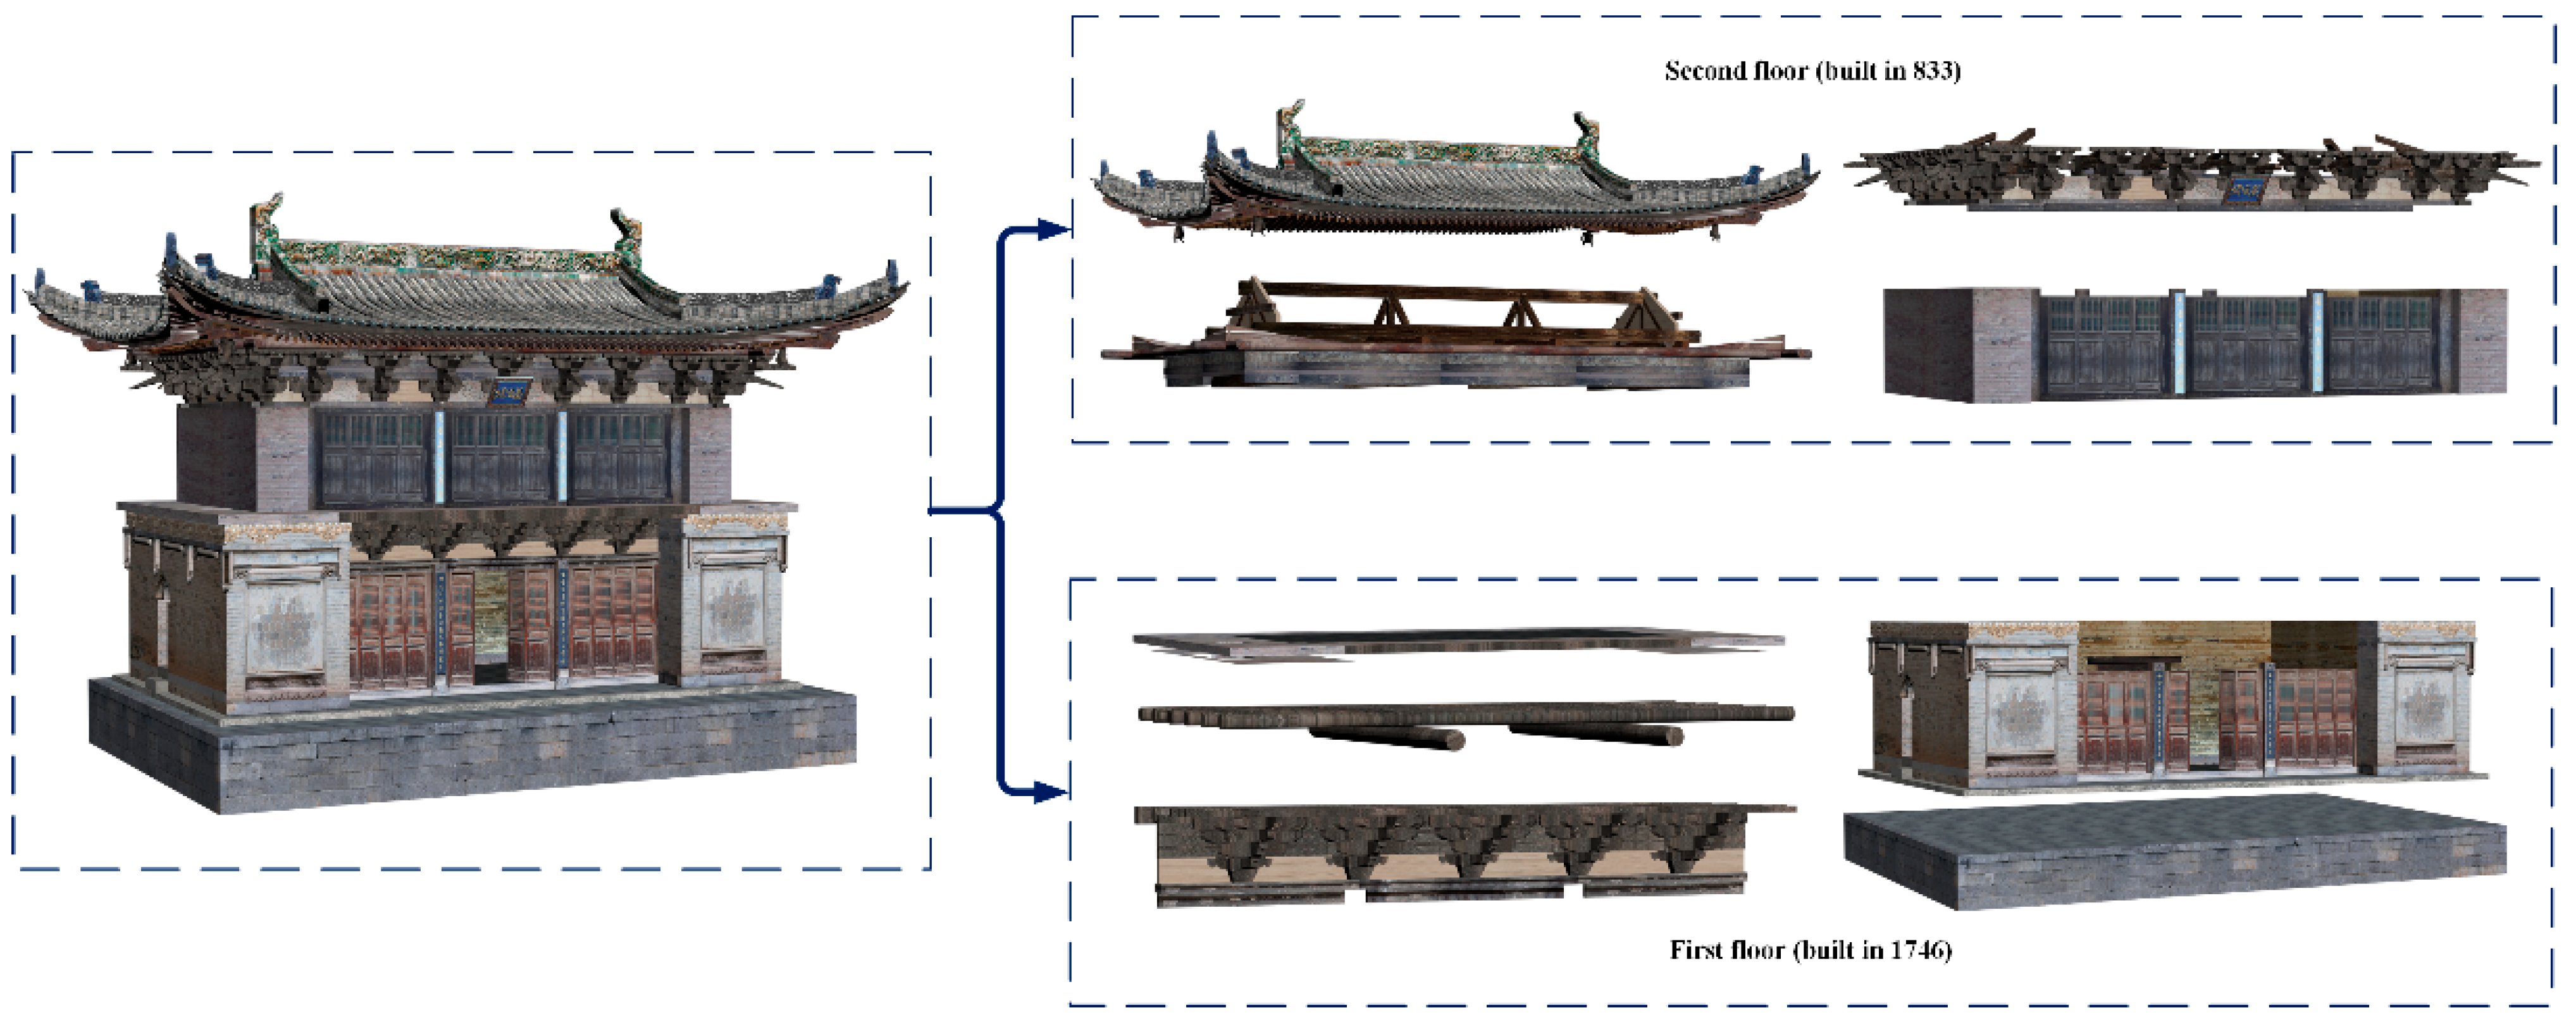
Many buildings in the temple are mixed buildings, such as the Sutra Pavilion, Luohan Hall, and Dizang Pavilion. The Sutra Pavilion, first built in 833, was a one-story building. It was rebuilt in 1336. In 1746, it was renovated again, and the original building was raised to the second floor and an additional floor was added [34]. Therefore, the Sutra Pavilion is now a two-story hybrid building with three architectural styles. The second floor is in the architectural style of the 800s and the first floor is in the style of the 1700s. The flat beam and the lower bracket of the bucket arch have the style of the 1300s.
On the whole, Qinglian Temple has high historical, technical, and artistic value. Many buildings were built more than 1000 years ago. The building styles of different periods were perfectly combined to form unique shapes that are elegant in appearance. This also reflects the outstanding construction technology level of Shanxi in China and has high historical and scientific value. Moreover, the combination of the building with colored sculptures, brick carvings, and stone carvings makes the building harmonious and vivid, showing special artistic features. In 1988, the Qinglian Temple was recognized as a national heritage conservation unit in China. Nowadays, it is named a national 4A scenic spot. However, due to its location in a remote mountainous area, the poor natural environment, and the complex building structures, these architectural heritages still face the threat of disappearance and their underlying culture cannot be understood by the public. Hence, the protection and utilization of the associated architectural heritage information are ongoing.
From 2020, our team carried out digital protection research on Qinglian Temple. On this basis and according to the above methods, we investigated the architecture of Qinglian Temple.
4. Results
4.1. Knowledge Acquisition
The knowledge acquisition was divided into data acquisition and data processing, belonging to digital protection. The data included point clouds, images, CAD drawings, and 3D models. In this case study, we obtained data from all 25 buildings in Qinglian Temple.
4.1.1. Data Collection
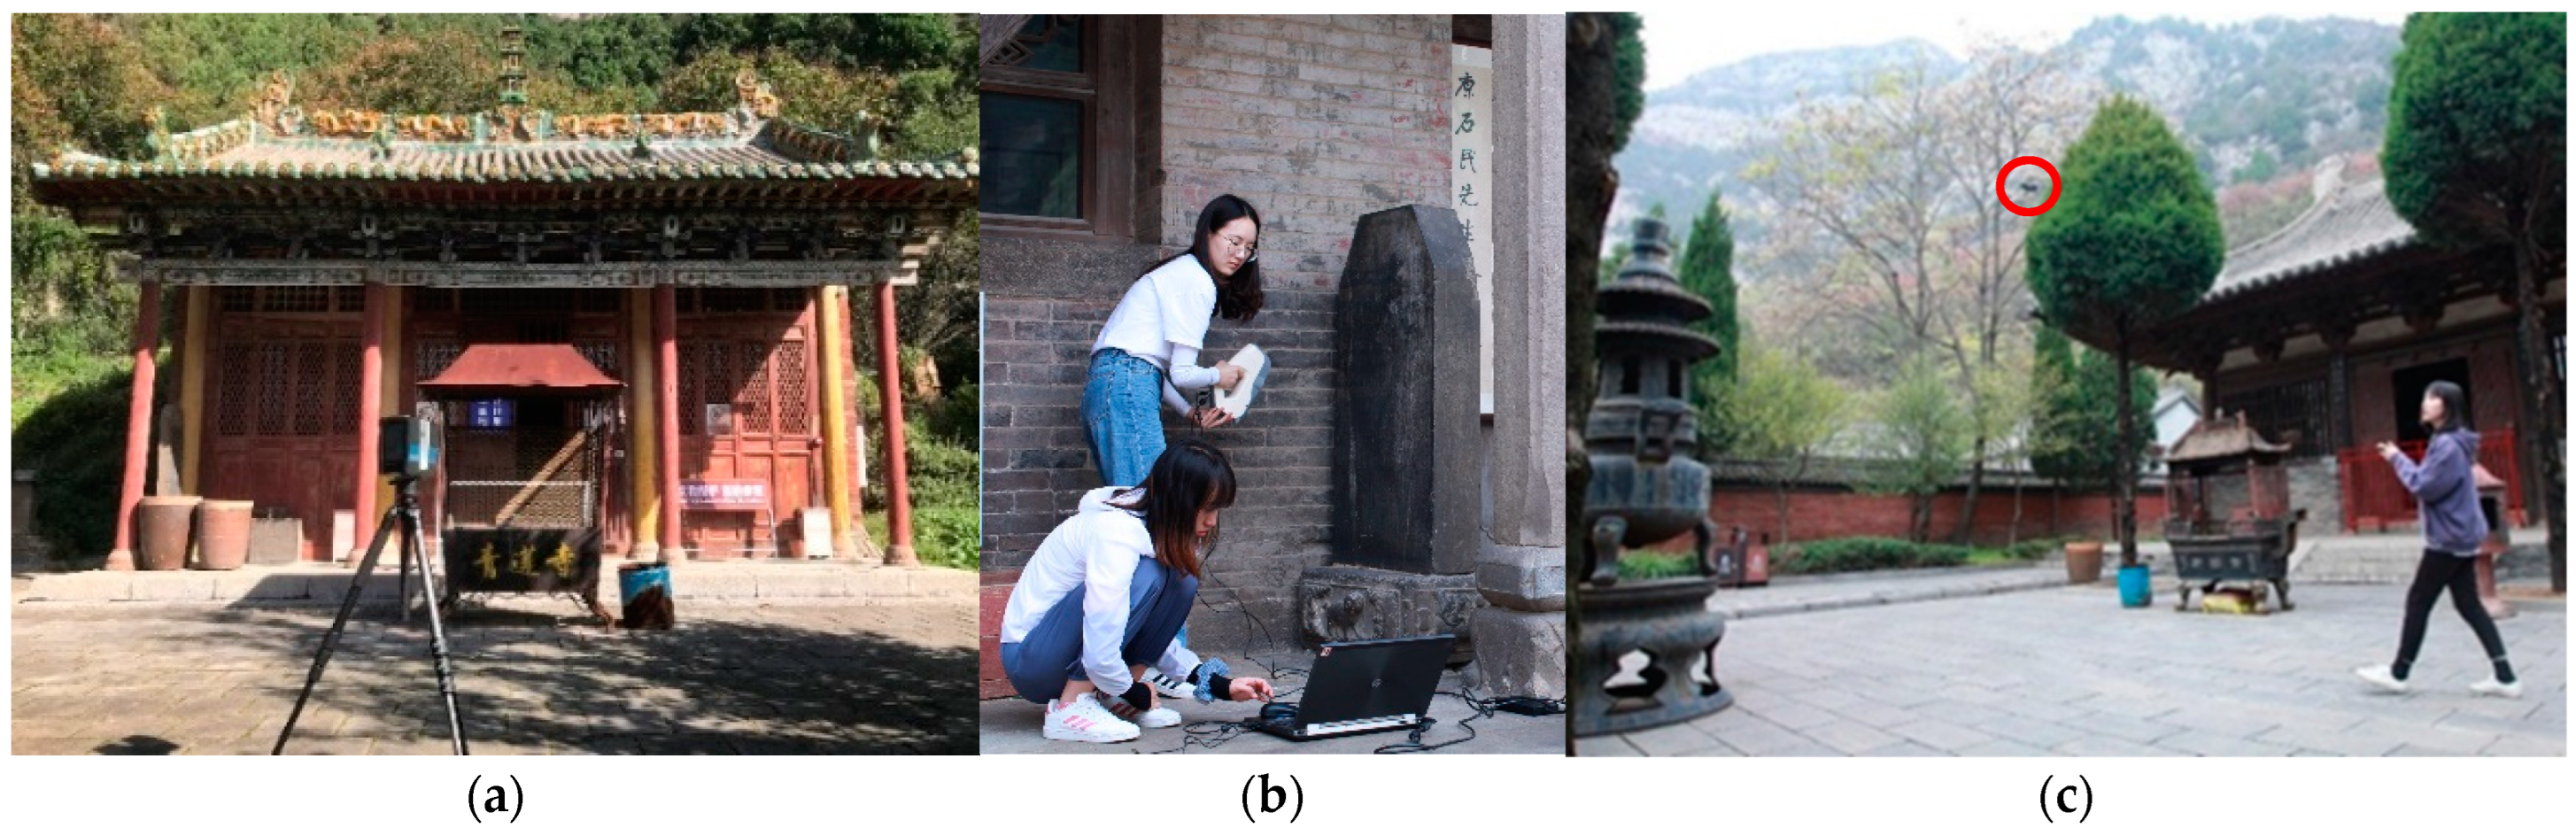
In our study, a Focus S350 scanner, whose ranging accuracy was 1 mm and angular accuracy was 19 arcseconds, was used to acquire point clouds from the indoor and outdoor areas of the buildings, as shown in Figure 8a. The Artec handheld scanners were used to collect data about architectural decorations, such as stone tablets and carvings, as seen in Figure 8b. According to the different scales, the scanner included an EVA, LEO, and Spider. A DJI Inspire2 UAV with a camera was used to gain UAV images, including images of the building top and the surroundings from one vertical and four inclined directions, as shown in Figure 8c. A Canon 5D4 camera with EF 24–70 mm (Tokyo, Japan) was used for ground photography, which acquired the panoramic images, local images, and textural images of the buildings. The resolution of the photographs was 6720 × 4480 pixels.
The data collection obtained a large amount of data. For example, the Focus S350 scanner was used at 211 scanning stations, which involved 83 stations in the Upper Temple, 99 stations in the Lower Temple, and 29 stations in the surrounding. Table 1 shows some information about the scanning data of several sites in the Upper Temple.
4.1.2. Data Processing
The data processing mainly included point cloud processing, image processing, document sorting, CAD drawing, and 3D model construction.
- (1)
- Point Clouds and Images
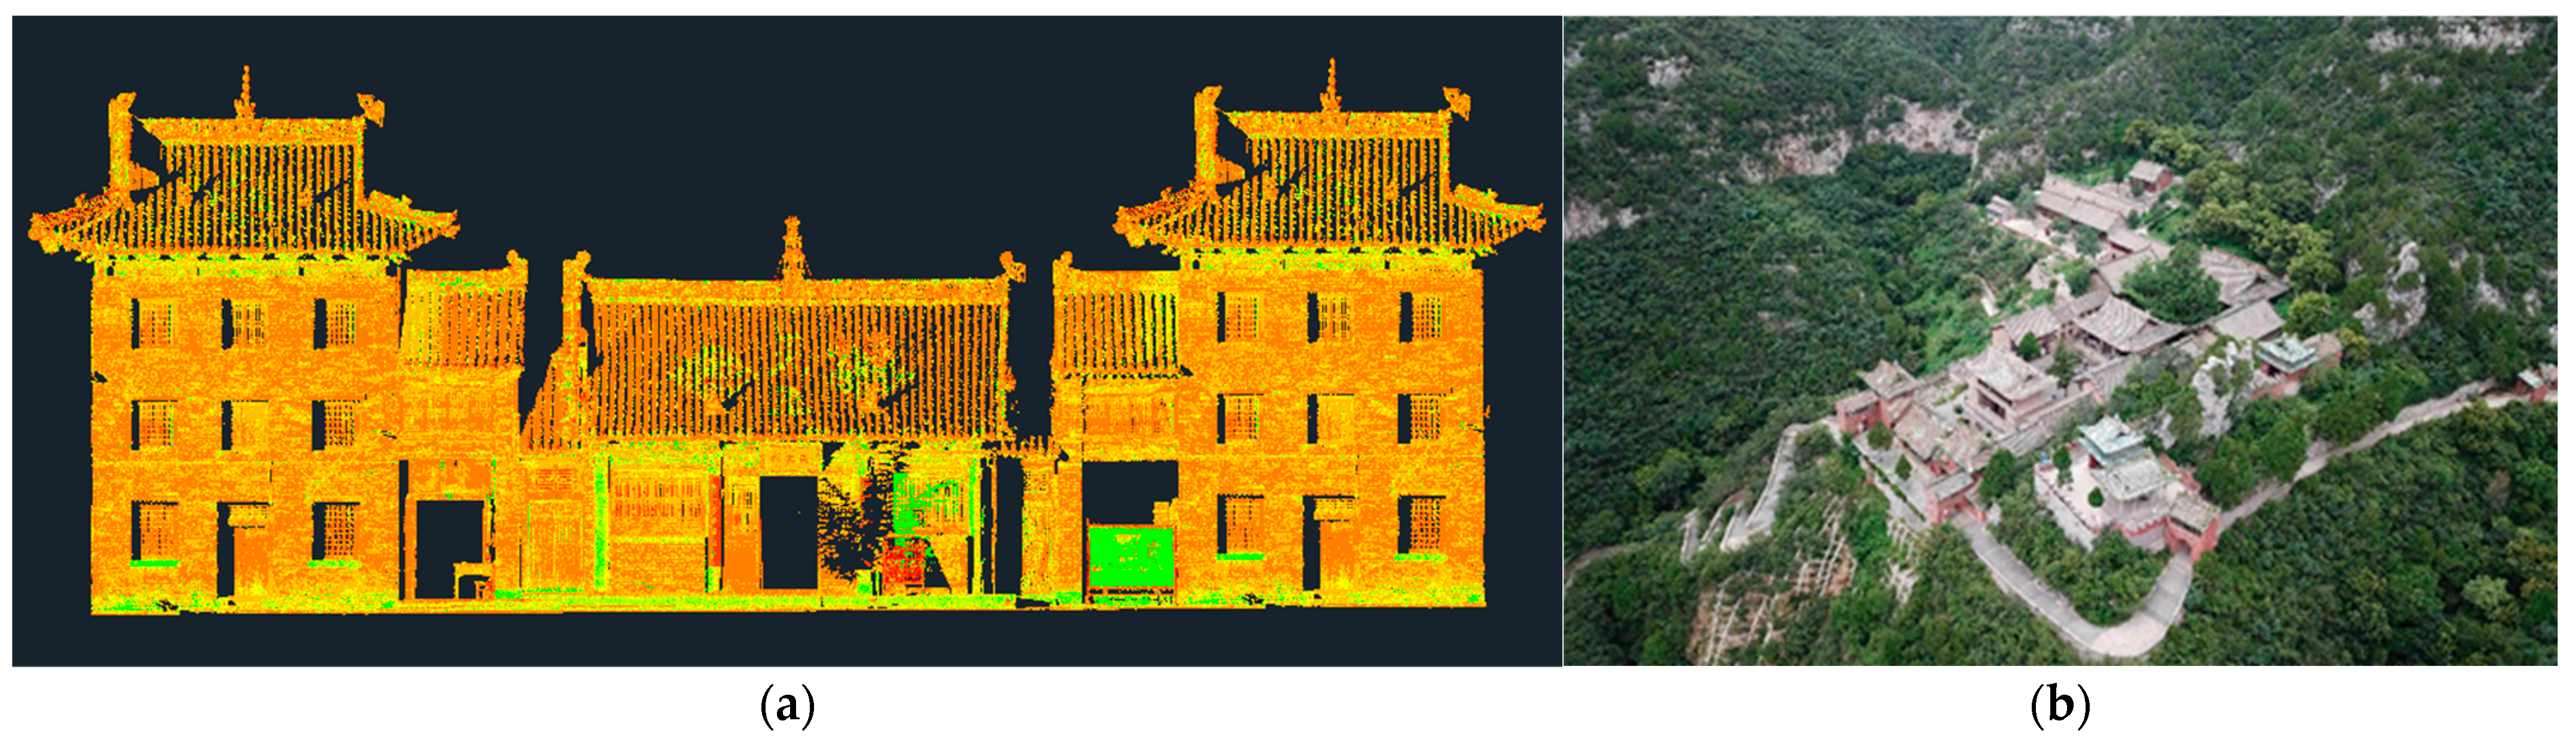
The point clouds accurately recorded the buildings’ geometric information. In our study, the point clouds were processed via denoising, registration, and fusion in Focus Scene software. The file formats were .las, .dxf, .ply, etc. Figure 9a shows the point clouds of a station in Tianwang Hall and the Bell Tower.
The images accurately recorded the textural information. In this study, images were processed in Lightroom and Photoshop software and saved as two files. One was the raw file, which saved the image metadata, such as the white balance and aperture value, while the others were the image files, including .jpg and .png files. Figure 9b shows the UAV image of Qinglian Temple.
- (2)
- CAD Drawings
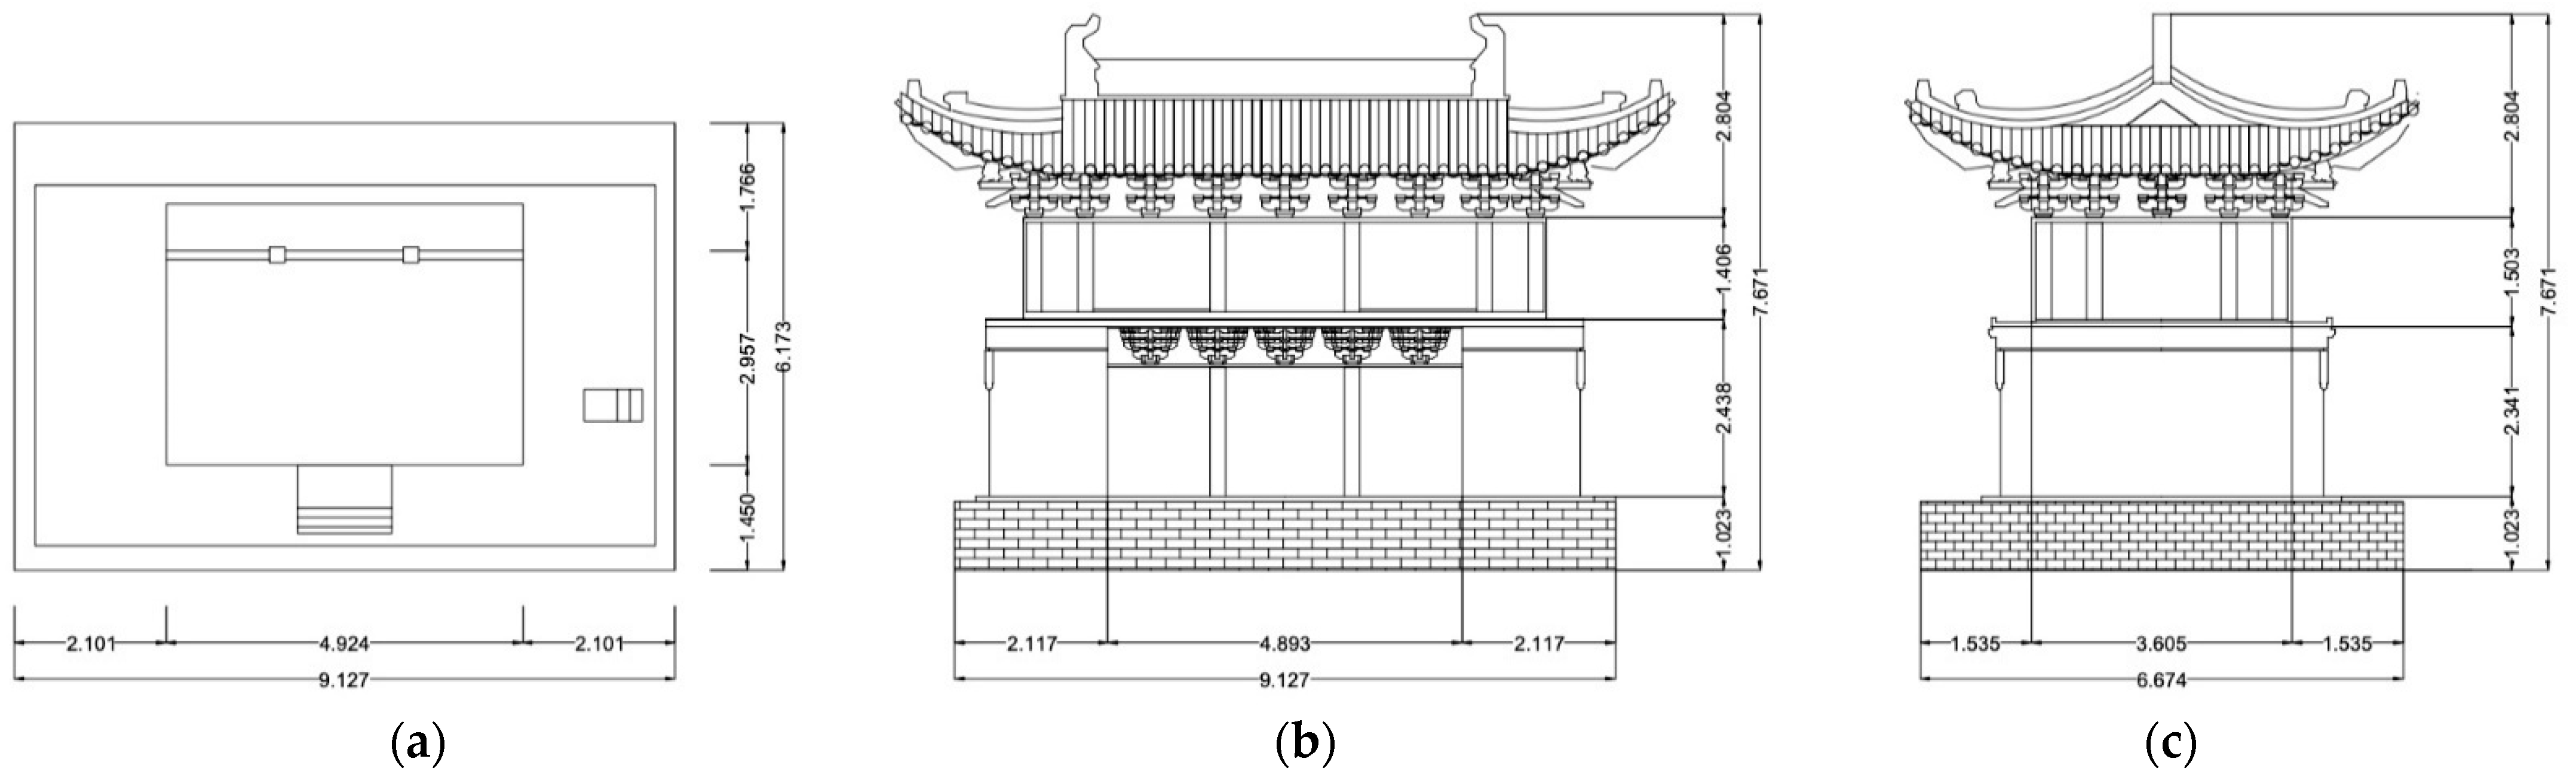
The CAD drawings accurately recorded the structures and dimensions of the buildings. In our study, the CAD drawings of overall buildings and important building elements were drawn in AutoCAD by measuring the point clouds. Figure 10 shows the CAD drawings of the plane, façade, and side elevation of the Sutra Pavilion.
Many architectural heritages in China were timber structures, especially in Shanxi, China. This kind of structure was complex, but it resulted in beautiful and flexible shapes, and strong oriental characteristics. Therefore, a detailed CAD drawing was drawn for the building elements made of timber, such as bucket arches, caissons, and beam frames. Table 2 shows the plane, elevation, and sections of a bucket arch.
- (3)
- Three-Dimensional Models
The three-dimensional models were created using polygons that consisted of the 3D prime model and 3D texture model. In this study, we built the 3D prime models in 3DMAX software according to the CAD drawings and point clouds. Texture mapping was implemented in Substance Painter software, which turned the 3D prime model into a 3D texture model. This accurately recorded the geometric and texture features of the architectural heritage using visualization.
Figure 11 shows the 3D texture model of the Sutra Pavilion, and each building element was decomposed into its precise dimensions. Other building models had the same description, and thus, they are not shown individually here.
4.2. Knowledge Reconstruction
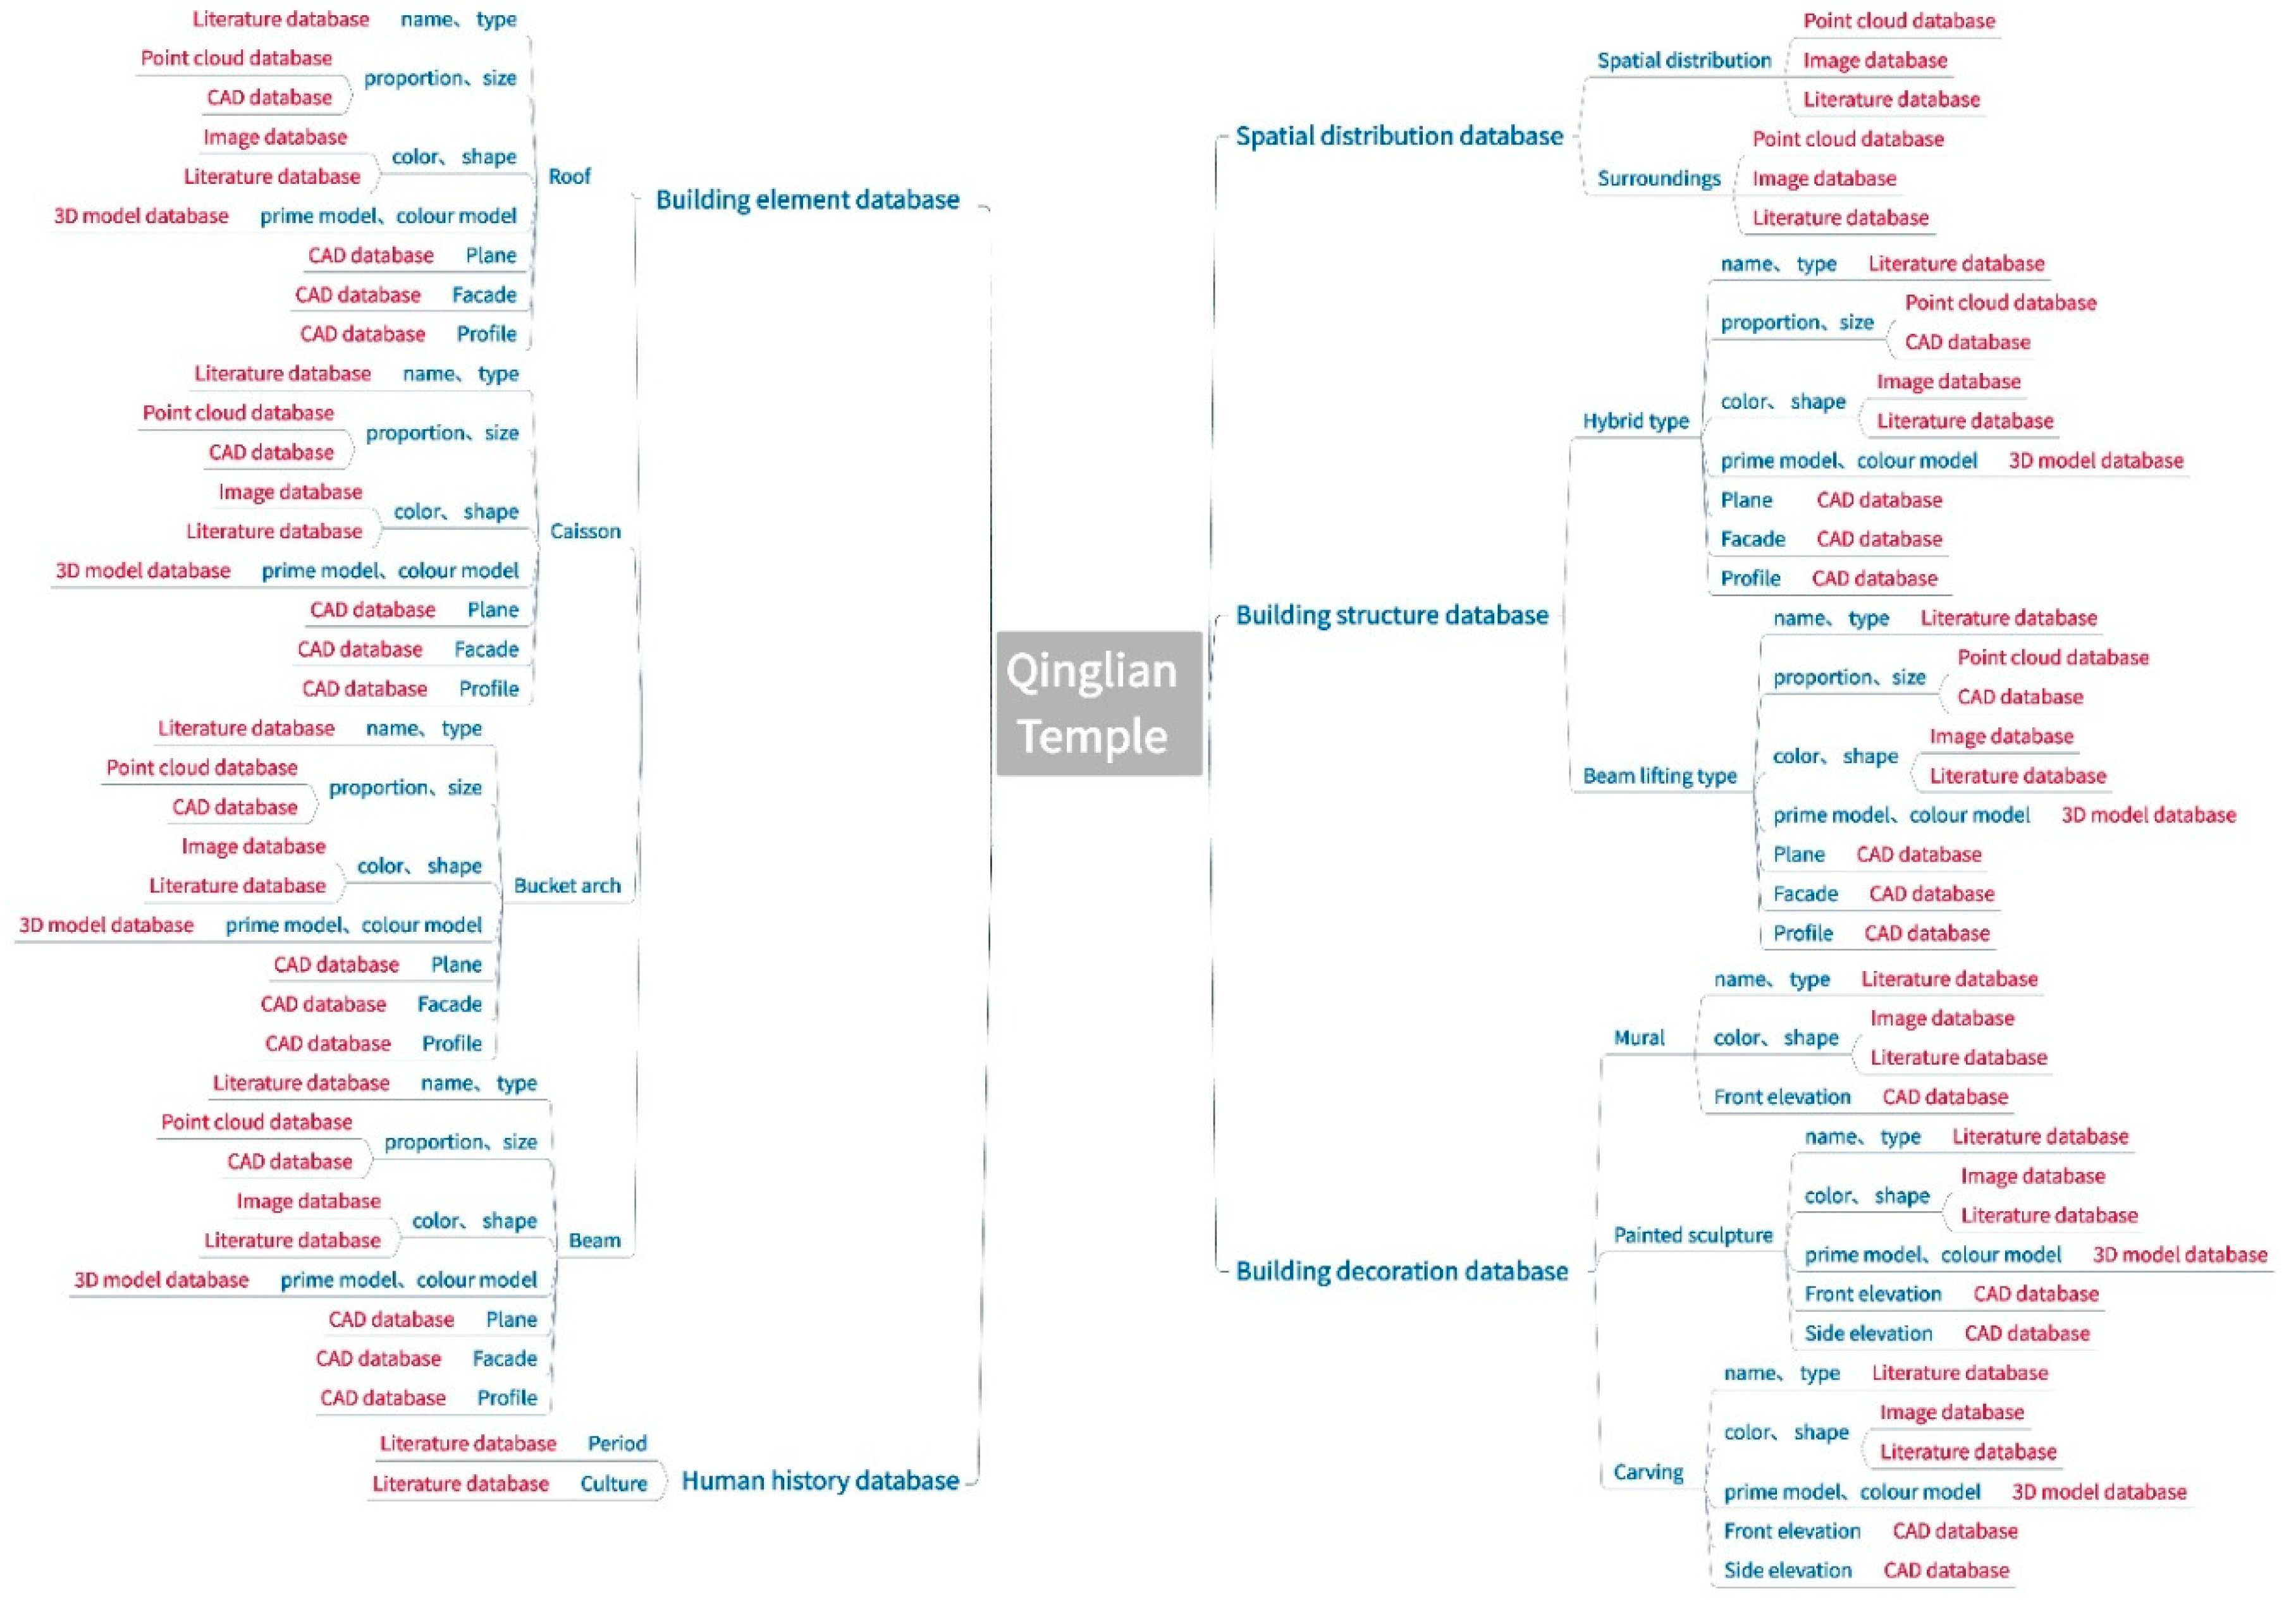
In this case study, a mind map was used to reconstruct the knowledge of Qinglian Temple using the pyramid principle, which was organized in Board Mix software. Figure 12 shows the data from the knowledge visualization basic database and the knowledge visualization material database, marked with red and blue, respectively, highlighting the logical relationships between each branch to clearly find the relationships between each knowledge point.
This mind map took Qinglian Temple as the central theme, which was defined using systematic thinking. It was divided into several databases, such as the spatial distribution, building structure, building element, building decoration, and historical cultural databases, which were placed along the primary branch. Then, the components of each database were taken as the secondary branch content. Finally, the three-level branches, i.e., their attribute information, were derived in the tree mind map using multi-dimensional thinking.
For example, the building element database was mainly composed of roofs, caissons, and bucket arches. The attributes of a bucket arch included its name, color, and shape, which were taken from the knowledge visualization base database that contained the point cloud database, 3D model database, CAD database, and so on. Table 2 shows part of a bucket arch. The color information was derived from the attributes of the 3D model and image. The shape was derived from the CAD drawing, 3D model, etc.
4.3. Knowledge Innovation
Knowledge innovation was a re-innovation based on knowledge acquisition and knowledge reconstruction to more effectively spread and inherit architectural heritage culture. In this study, we developed a knowledge map, digital display, and cultural creation.
4.3.1. Knowledge Graph
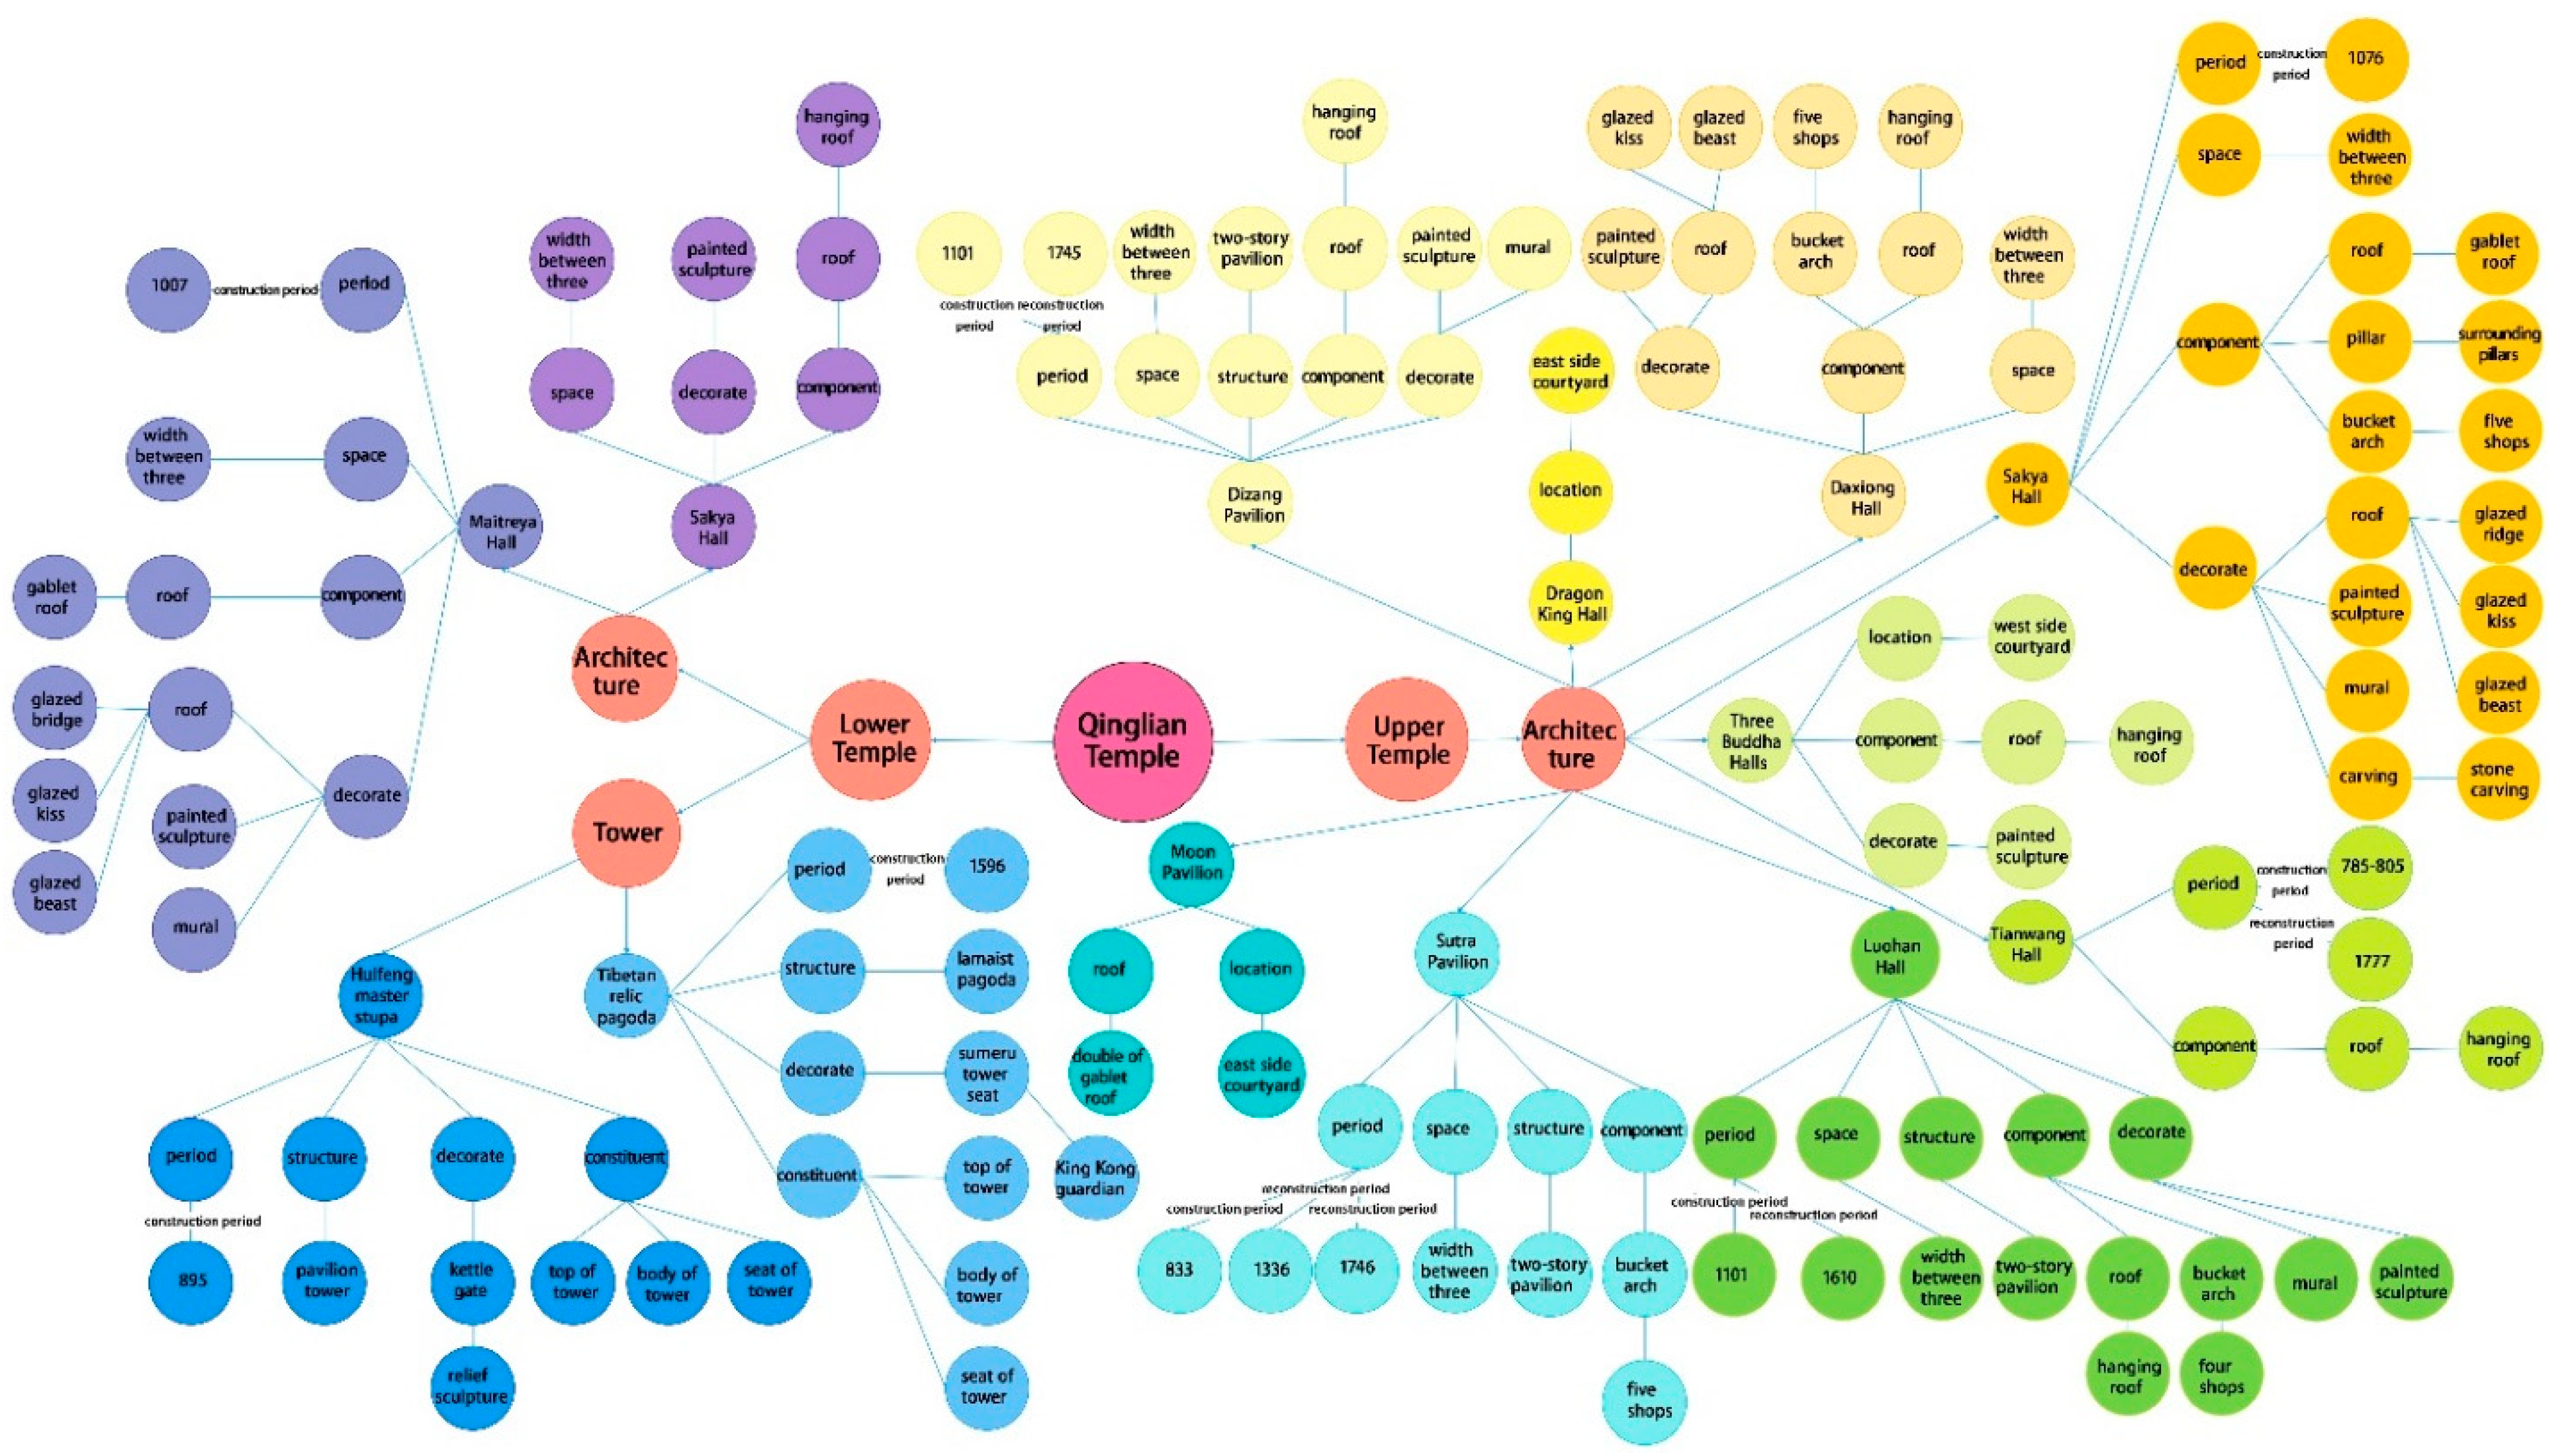
A knowledge graph can clearly express the hierarchical relationship of architectural heritage knowledge [35]. A knowledge graph effectively organizes and manages a great quantity of professional knowledge in the field of architecture, and clearly presents the relevant information about different buildings in terms of their age, space, and structure so that architectural knowledge can be more intuitively understood. In this study, the architectural knowledge graph of Qinglian Temple was constructed in the form of a tree diagram drawn in Board Mix software. We extracted and integrated the architectural knowledge of Qinglian Temple from the knowledge database, systematically collated and summarized this information, and then showed the hierarchical relationships of different types of knowledge of ancient architecture in a structured manner.
Figure 13 shows the connection of Qinglian Temple’s buildings and the information about each building, such as their age, space, structure, element, and decoration, which are clearly expressed in the tree diagram. As there were too many buildings in Qinglian Temple to present in this paper, only some buildings are shown in the figure.
4.3.2. Digital Display
A digital display can be displayed as an animation, video, VR/AR, image, etc. In this study, VR was separately designed for offline display. Others could also be used alone or integrated into an application online and offline.
- (1)
- VR Interaction
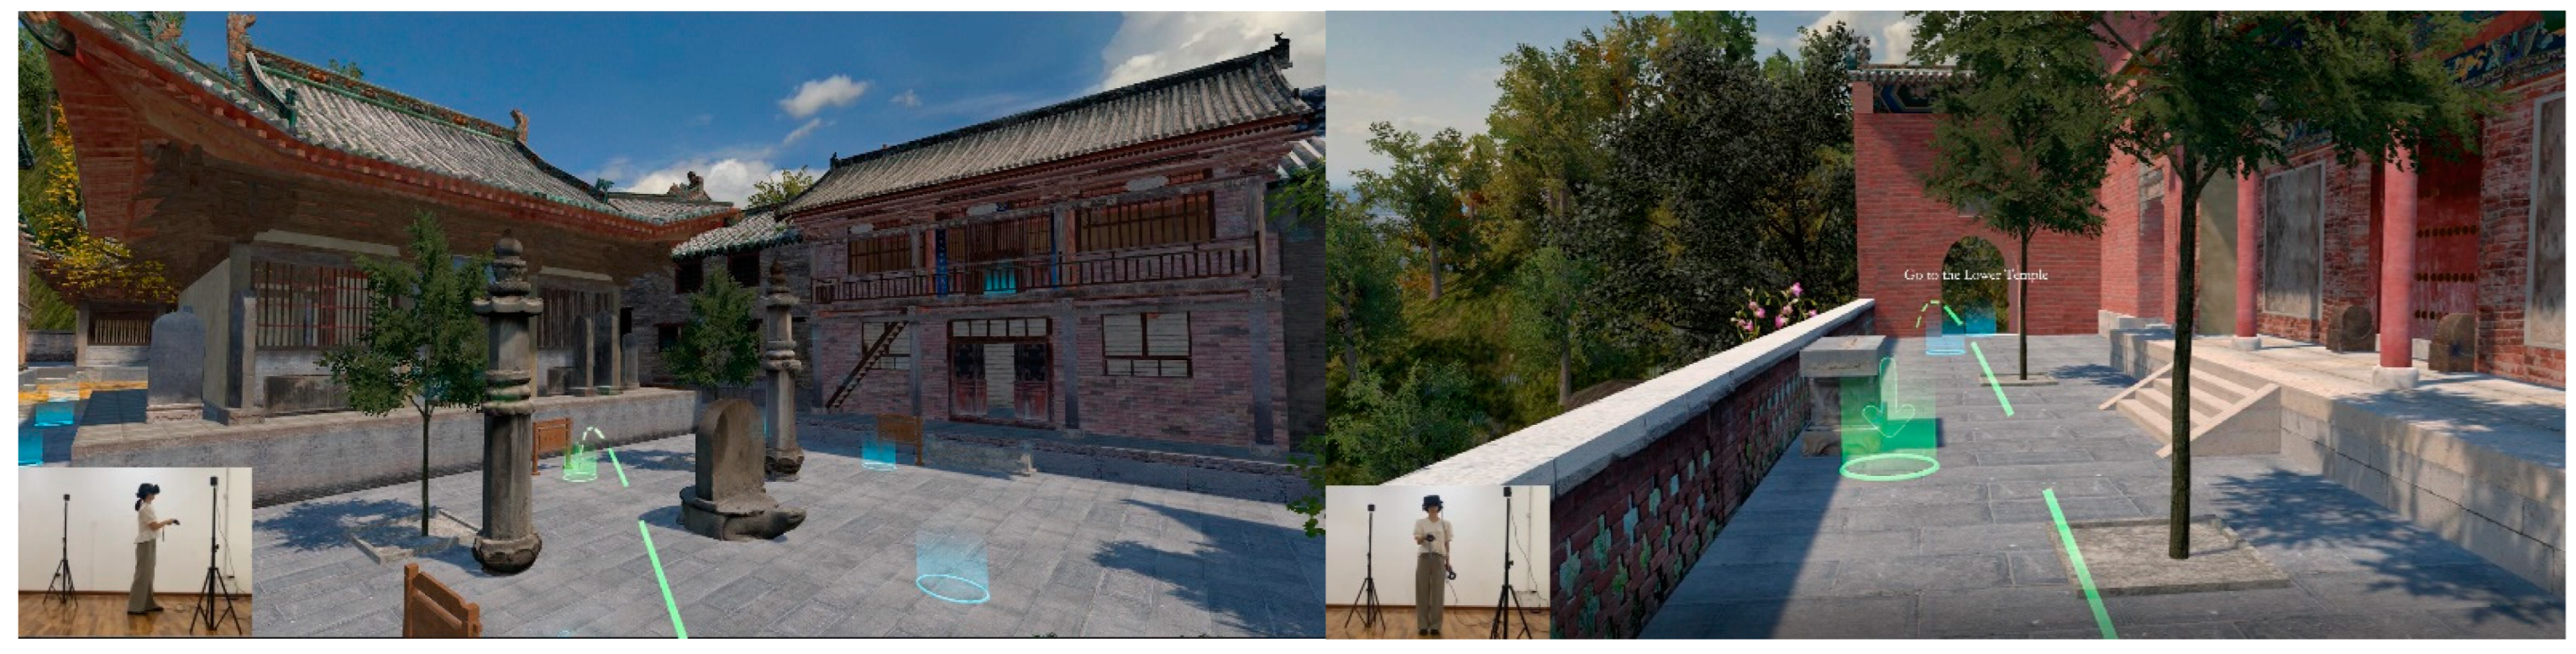
VR interaction involves interacting with the virtual world through VR perception, such as motion capture, gesture recognition, and sound perception, so that users can immerse themselves in the virtual world. We developed it with HTC VIVE and Unity3D. Although Qinglian Temple has so many buildings with complex structures, large courtyards with complex layouts, and a great distance between the two temples, users wore a VR helmet and held a VR handle to “walk” anywhere in the temple and “touch” any part of the building without being on site. They could appreciate them carefully and understand the architectural features and historical culture without worrying about the long journey, getting lost, or damaging them. The combination of advanced technology and traditional culture broke through the restrictions of time and space and allowed people to immerse themselves in the charm of architectural heritage anytime and anywhere.
Figure 14 shows the VR interaction with Qinglian Temple.
- (2)
- Cross-Platform Applications
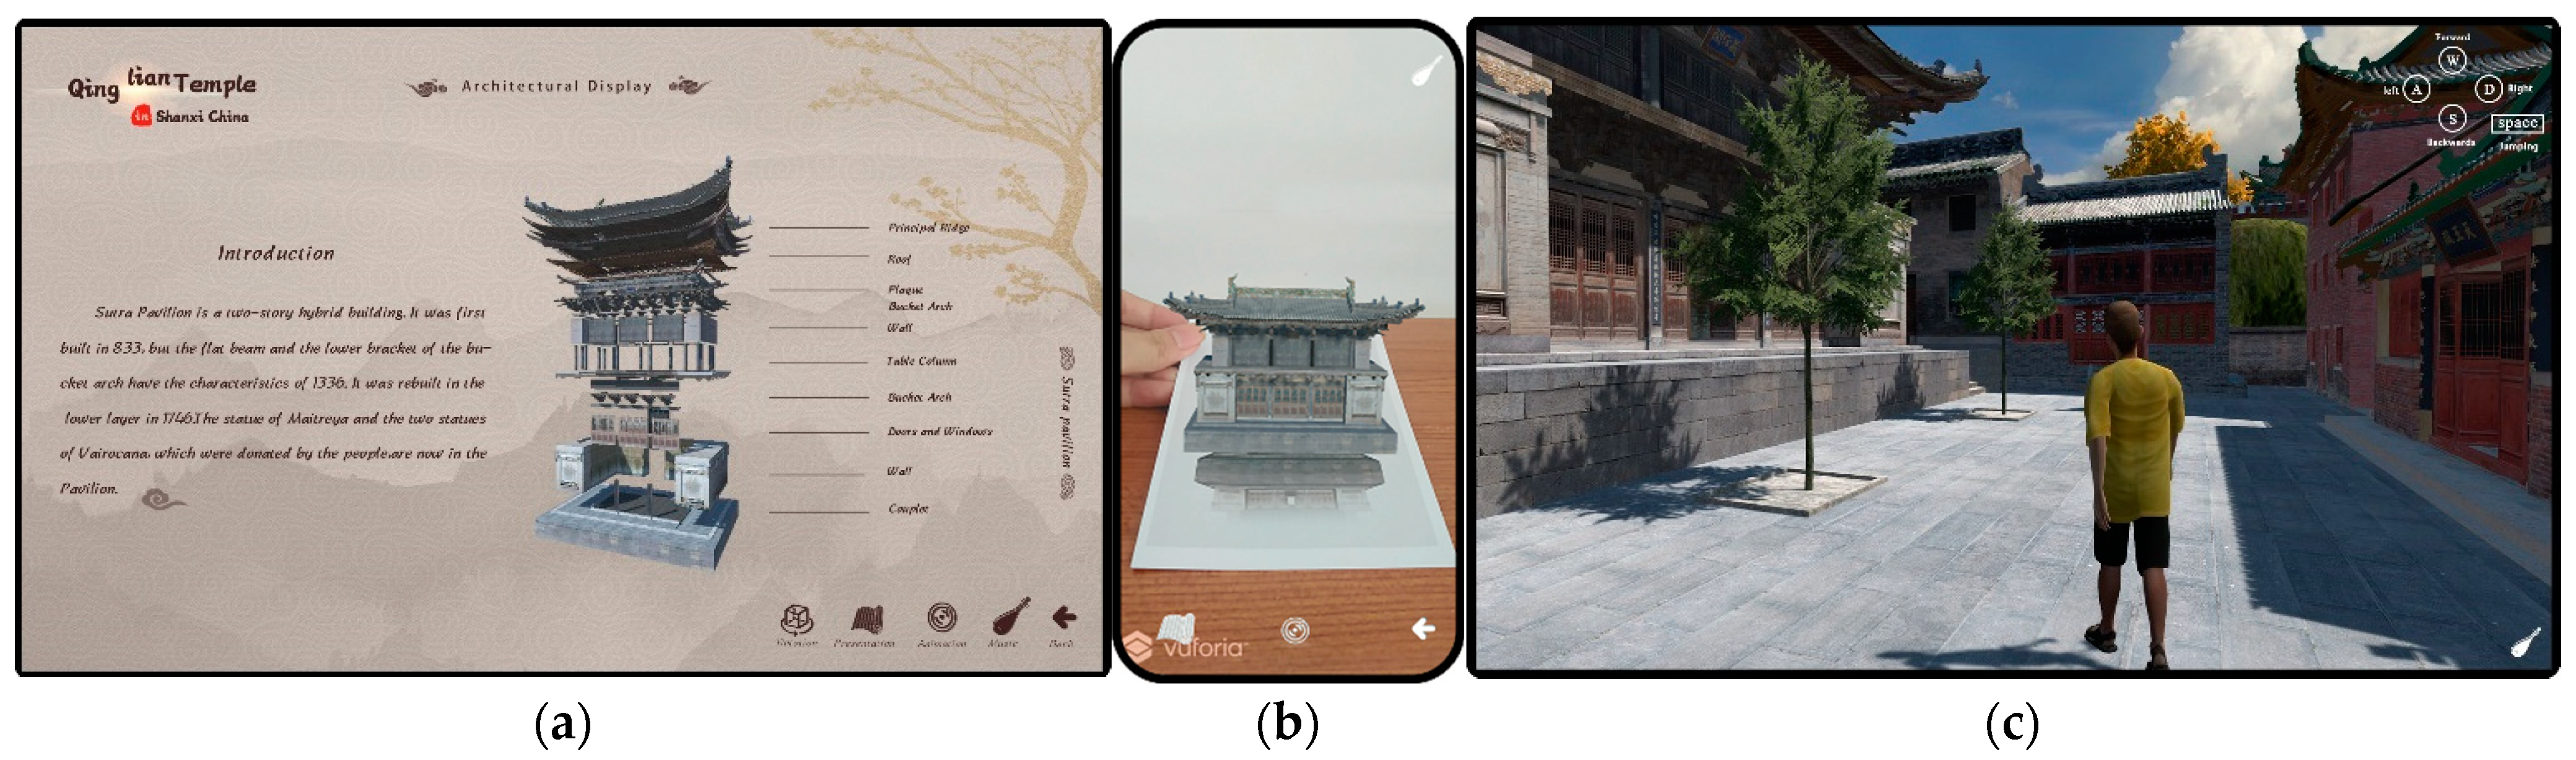
Cross-platform applications comprehensively introduce architectural heritage through multiple platforms in many ways, such as animations, videos, AR, text, and images. We designed a cross-platform application and developed it with Unity3D and Vuforia. This application can be outputted from a Smartphone, Table PC, and PC, which could not only be widely used as an app but also be placed in museums and other places, as shown in Figure 15. Their main functions consisted of autonomous scene roaming, automatic scene roaming, architectural introduction, and architectural decoration introduction, which were slightly different according to the platform. For example, in the architectural introduction on a Smartphone, the users could freely view the building by rotating and enlarging the model, intuitively understand the buildings through AR scanning, deeply understand the building structure through animation disassembly, and accurately master architectural knowledge through interactively assembling the buildings.
In particular, the AR scenes presented architectural culture in an interactive and virtual reality environment. When a target image was scanned, a 3D building model appeared on the screen, which could be scaled and rotated at will. In this way, users could appreciate it better. The interest in AR could enhance the understanding of architectural heritage and attract people to visit, and even promote cultural exchanges.
4.3.3. Cultural Creativity
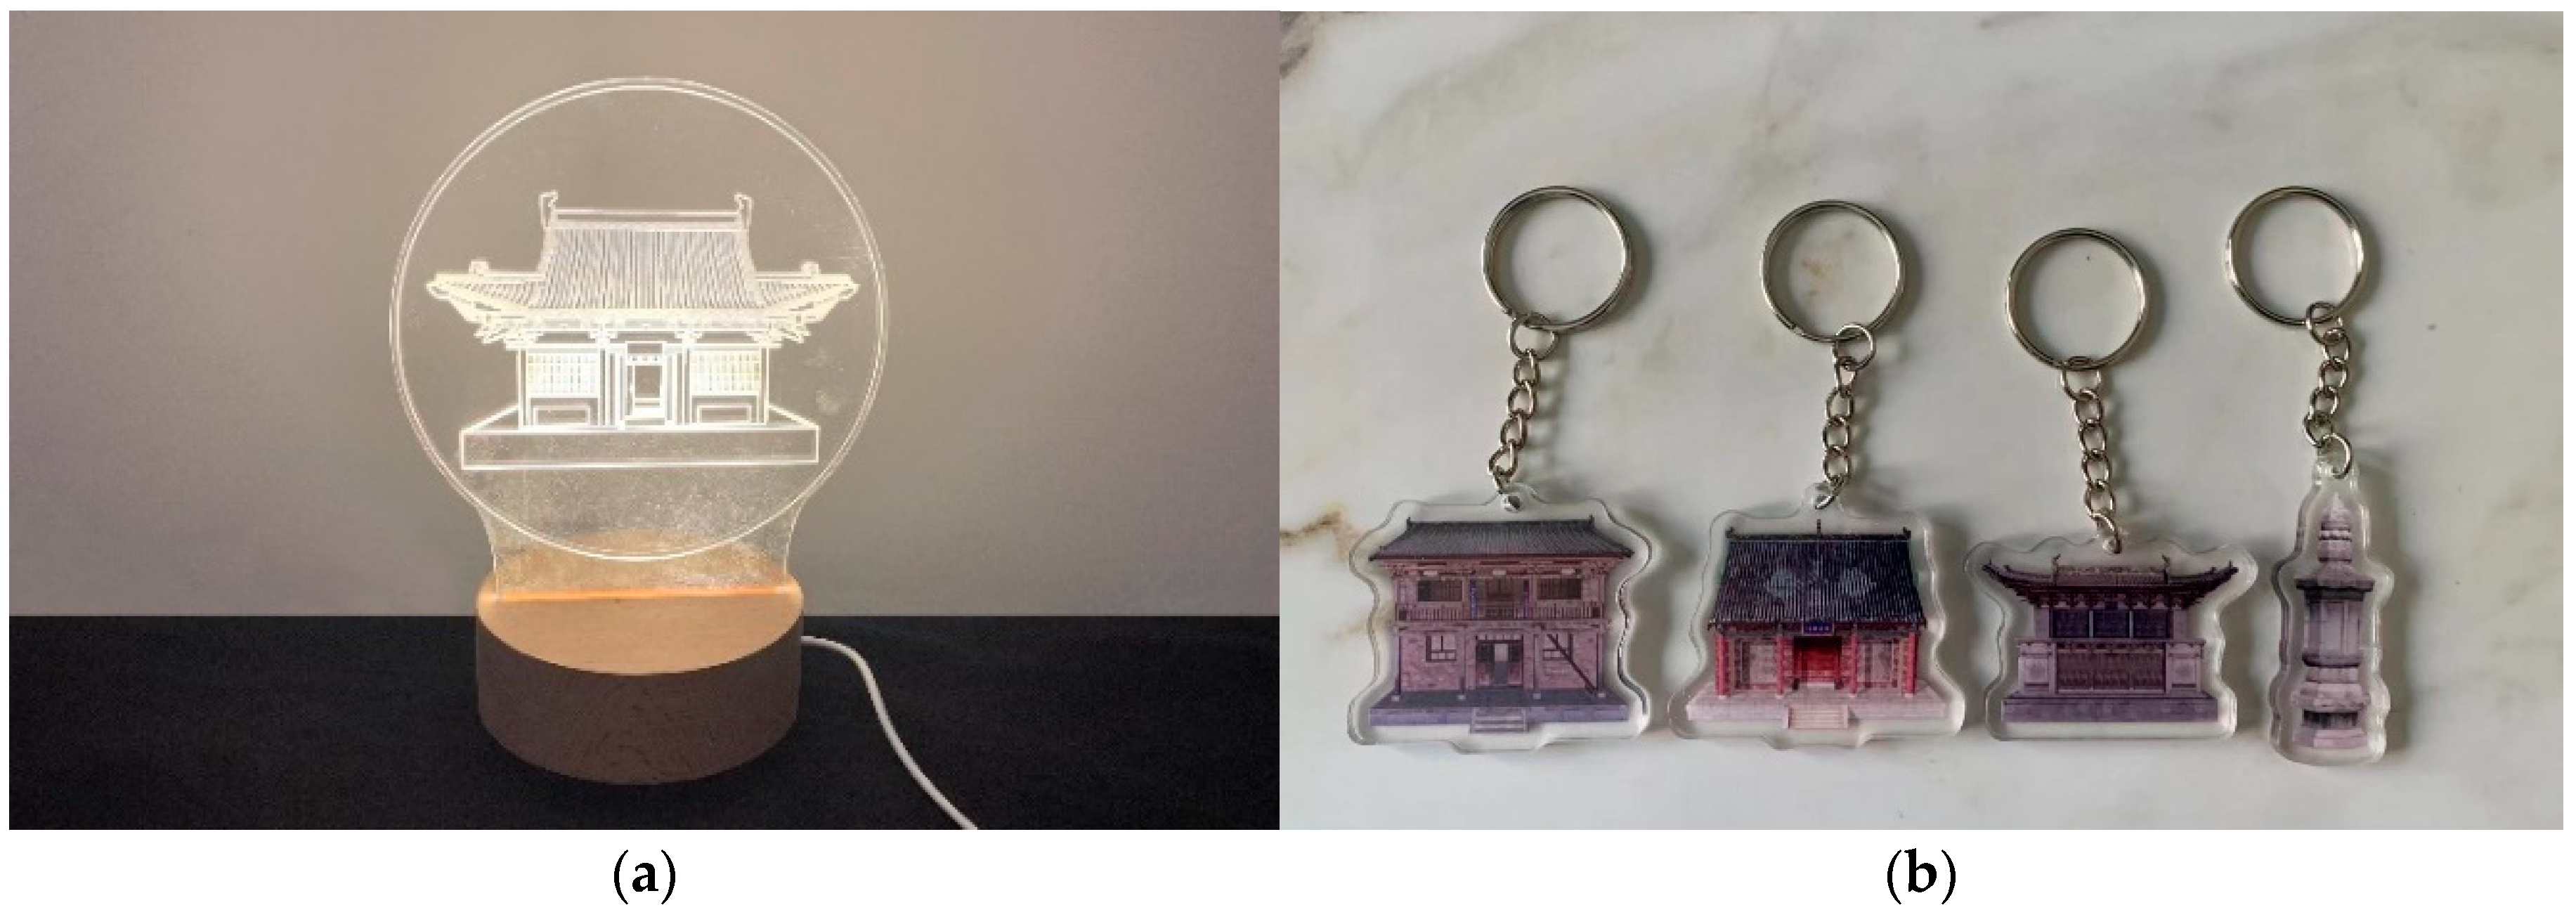
Cultural creativity products are a kind of special commodity that need to return to the essence of culture and guide people’s values and aesthetic orientations. In this study, cultural creativity was designed in a practical and aesthetic way by combining it with daily life. While ensuring the cultural value of architectural heritage, we extracted representative patterns or elements from the knowledge database and designed cultural creativity products in different categories by transforming product materials, reshaping product shapes, and improving product manufacturing processes. The products mainly included tourist souvenirs and daily necessities, such as lamps, bookmarks, mobile phone cases, notebooks, mirrors, keychains, and refrigerator stickers.
Figure 16 shows the table lamp and keychains. The table lamp was designed to represent Sakya Hall in the Supper Temple and is made of acrylic and wood. The keychains were designed to represent Dizang Pavilion, Tianwang Hall, Sutra Pavilion, and Huifeng Master Stupa, and are made of acrylic plates.
4.4. Knowledge Management
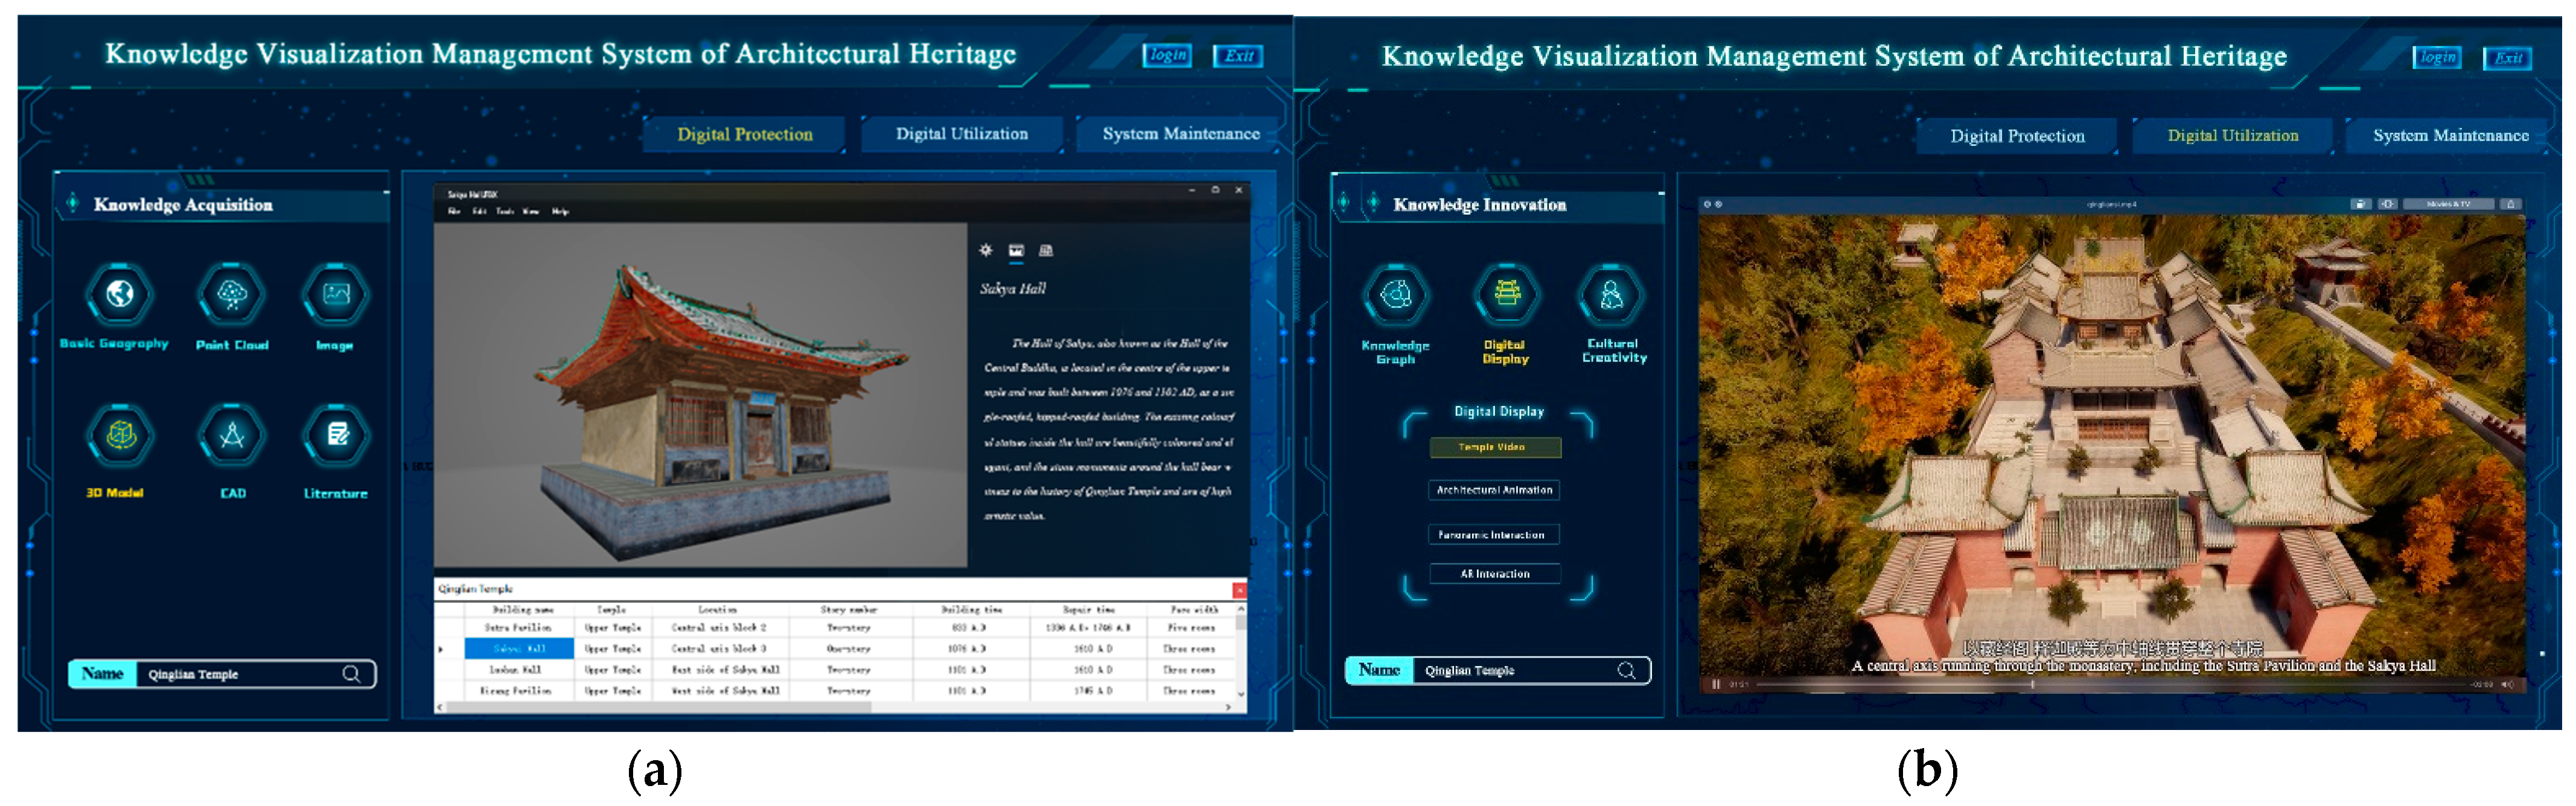
For more intelligent management, a knowledge visualization management system of architectural heritage was designed, which consisted of a front-end web and a back-end database. The system was developed using Visual Studio code 2020. The front-end page was programmed in HTML and the back-end linked Mysql-8.0.28. The Thinkphp6.0 development framework was used to connect and configure the database. The geographical distribution information of architectural heritage was realized through secondary development using ArcGIS with Visual Studio.
The main functions of this system were as follows, as seen in Figure 15.
- (1)
- Digital Protection
It was mainly aimed at the architectural heritage management department, with extremely high administrative authority. It was responsible for the management of various original and processed data, such as point clouds, images, and models, which were the core of the system. Users could view the required information through retrieval, according to permission. For example, if the user selected the “3D model” button and inputted the name of the heritage site, a list of all buildings in the heritage site would appear. When they selected a building from the list, they could view the 3D model of the building in detail and download the data according to their permission.
Figure 17a shows the 3D model information of Sakya Hall in the Upper Temple of Qinglian Temple.
- (2)
- Digital Utilization
This was mainly for researchers and the public. It provided the digital achievements of knowledge reconstruction and knowledge innovation, which belonged to a service platform of architectural heritage. The content in knowledge reconstruction was more professional and more suitable for professionals and researchers. The forms of knowledge innovation were diversified, and the contents were simpler and easy for the public to understand. It was oriented toward the public for cultural inheritance.
Figure 17b shows the video of Qinglian Temple, which was made using an animation clip in Unity3D and edited in Adobe Premiere Pro.
- (3)
- System Maintenance
This was mainly for background managers. It included data management, user management, and system management. Among them, data management was the most important, including data review, uploading, and editing. User management involved user registration, permission allocation, etc. System management was mainly about software maintenance.
5. Discussions
This method emphasized the protection and utilization process of knowledge visualization and digital technology. Digital protection via knowledge acquisition provides the most important foundation for preventive protection and building restoration. Digital utilization builds a bridge for people with different disciplinary backgrounds. For example, at present, there are great barriers between digital protection and architectural research. On the one hand, a large amount of digital protection data has been left idle. On the other hand, architectural research is shelved due to the lack of first-hand information. After knowledge reconstruction, various types of building professional knowledge can be classified and expressed, such as bucket arches of all buildings being in a database, which is convenient for researchers to obtain data and conduct in-depth research. It greatly improves data sharing and research efficiency.
In this case study, we investigated Qinglian Temple, including its 25 buildings, 87 stone tablets, and 67 painted sculptures. The total data volume was about 2.5 TB. Through this method, we quickly formed layered data, such as “bases”, “materials”, and “results”, and served various groups. Digital display works have been exhibited in a museum and won several awards. The reconstructed data also provides strong support for architectural history researchers.
However, this method still needs to improve. More professionals and advanced methods are needed to invest in this endeavor and strengthen it. For example, the cultural connotation needs to be further explored with multidisciplinary experts and methods. The digital display can also be further improved by combining the latest VR/AR technology. In particular, future research should focus on how to further transform the “tacit knowledge” into “explicit knowledge” using visualization technology and innovate architectural cultural knowledge using new media technology. In addition, there are so many architectural heritages in China, especially in Shanxi, and we have only completed a small part. These will be our research focus in the future.
6. Conclusions
Current methods of heritage protection and cultural inheritance extraordinarily lag the advances in digital techniques. This study filled the gap with an innovative method for the digital protection and utilization of architectural heritage. Using knowledge visualization, the method could realize the transformation from data protection to cultural inheritance in two ways. First, visualization technologies, such as mind mapping and concept mapping, were used to encourage knowledge absorption, integration, and reconstruction. Second, professional knowledge was transformed into popular language with new media technologies, such as VR/AR and a knowledge graph.
The method was further applied to architectural heritages by investigating the case of Qinglian Temple in Shanxi, China. The results showed that this multidisciplinary approach was effective. It can also be applicable to different types of cultural heritage. The digital achievements could be wildly disseminated via a website and handsets, as well as in museums and galleries.
In the future, we will further improve this method in terms of knowledge translation, cultural excavation, display innovation, interactive simulation, etc. We will also investigate more architectural heritages to form a huge knowledge database for various groups. Furthermore, the metauniverse has risen, and we can also try to integrate it into our knowledge innovation study, which is an important task for our future work.
Author Contributions
Conceptualization, X.Z.; methodology, X.Z.; software, J.X. and Y.Z.; validation, X.Z., Y.Z. and L.H.; formal analysis, X.Z.; investigation, X.Z. and J.X.; resources, X.Z.; data curation, Y.Z. and J.X.; writing—original draft preparation, X.Z.; writing—review and editing, X.Z.; visualization, Y.Z. and L.H.; supervision, X.Z.; project administration, X.Z.; funding acquisition, X.Z. All authors have read and agreed to the published version of the manuscript.
Funding
This research was funded by the Science and Technology Strategy Special Research Project of Shanxi, China, named “Research on Digital Activation of Shanxi Cultural Heritage Based on Knowledge Visualization” (202104031402046), as well as the scientific research project of Jincheng culture and Tourism Bureau, Shanxi, China, named “Research and demonstration of key technologies for intelligent protection and information service of cultural relics and ancient buildings” (BYGP2020-5001F).
Institutional Review Board Statement
Not applicable.
Informed Consent Statement
Not applicable.
Data Availability Statement
All the data that support the findings of this study are available from the corresponding author upon reasonable request.
Acknowledgments
This article is the result of 4 years of work and research. The authors express their acknowledgment of all the colleagues and students of the research team and thank the scholars and reviewers for their valuable suggestions.
Conflicts of Interest
The authors declare no conflict of interest.
References
- Chang, Q.; Jiang, T.Y.; Chen, C.; Li, Y.C. Reflection on the Fundamental Category of Heritage Architecture. Herit. Archit. 2016, 1, 44–61. [Google Scholar] [CrossRef]
- Fadli, F.; Alsaeed, M. Digitizing Vanishing Architectural Heritage; The Design and Development of Qatar Historic Buildings Information Modeling [Q-HBIM] Platform. Sustainability 2019, 11, 2501. [Google Scholar] [CrossRef] [Green Version]
- Zhang, X.; Zhang, A.W.; Xu, J.Q.; Ma, R.Q. Documentation and Inheritance of Ancient Opera Stage Based on Multidisciplinary Approach and Digital Technology. Buildings 2022, 12, 977. [Google Scholar] [CrossRef]
- Dang, A.R.; Wang, F. Information technology methods for locality preservation and inheritance of settlement cultural landscape. Indoor Built Environ. 2021, 30, 437–441. [Google Scholar] [CrossRef]
- Di Giulio, R.; Boeri, A.; Longo, D.; Gianfrate, V.; Boulanger, S.O.M.; Mariotti, C. ICTs for Accessing, Understanding and Safeguarding Cultural Heritage: The Experience of INCEPTION and ROCK H2020 Projects. Int. J. Arch. Herit. 2019, 15, 825–843. [Google Scholar] [CrossRef]
- Acke, L.; Vis, K.D.; Verwulgen, S.; Verlindenet, J. Survey and literature study to provide insights on the application of 3D technologies in objects conservation and restoration. J. Cult. Herit. 2021, 49, 279–288. [Google Scholar] [CrossRef]
- Oliveira, A.; Oliveira, J.F.; Pereira, J.M.; De Araújo, B.R.; Boavida, J. 3D modelling of laser scanned and photogrammetric data for digital documentation: The Mosteiro da Batalha case study. J. Real-Time Image Process. 2012, 9, 673–688. [Google Scholar] [CrossRef]
- Alshawabkeh, Y.; El-Khalili, M.; Almasri, E.; Bala’Awi, F.; Al-Massarweh, A. Heritage documentation using laser scanner and photogrammetry. The case study of Qasr Al-Abidit, Jordan. Digit. Appl. Archaeol. Cult. Herit. 2019, 16, e00133. [Google Scholar] [CrossRef]
- Osello, A.; Lucibello, G.; Morgagni, F. HBIM and Virtual Tools: A New Chance to Preserve Architectural Heritage. Buildings 2018, 8, 12. [Google Scholar] [CrossRef] [Green Version]
- Chen, S.; Yang, H.; Wang, S.; Hu, Q. Surveying and Digital Restoration of Towering Architectural Heritage in Harsh Environments: A Case Study of the Millennium Ancient Watchtower in Tibet. Sustainability 2018, 10, 3138. [Google Scholar] [CrossRef]
- Milosz, M.; Kesik, J.; Montusiewicz, J. 3D Scanning and Visualization of Large Monuments of Timurid Architecture in Central Asia—A Methodical Approach. J. Comput. Cult. Herit. JOCCH 2020, 14, 8. [Google Scholar] [CrossRef]
- Czerniawski, T.; Leite, F. Automated digital modeling of existing buildings: A review of visual object recognition methods. Autom. Constr. 2020, 113, 103131. [Google Scholar] [CrossRef]
- Hajirasouli, A.; Banihashemi, S.; Kumarasuriyar, A.; Talebi, S.; Tabadkani, A. Virtual reality-based digitisation for endangered heritage sites Theoretical framework and application. J. Cult. Herit. 2021, 49, 140–151. [Google Scholar] [CrossRef]
- Wang, T.H.; Zhao, L. Virtual Reality-Based Digital Restoration Methods and Applications for Ancient Buildings. J. Math. 2022, 2022, 1–10. [Google Scholar] [CrossRef]
- Maxwell, I.; Drdácký, M.; Vintzileou, E.; Bonazza, A.; Hanus, C. Safeguarding Cultural Heritage from Natural and Man-Made Disasters A Comparative Analysis of Risk Management in the EU; Publications Office of the European Union, European Union: Luxembourg, 2018. [Google Scholar]
- Torres-González, M.; Prieto, A.J.; Alejandre, F.J.; Blasco-López, F.J. Digital management focused on the preventive maintenance of World Heritage Sites. Autom. Constr. 2021, 129, 103813. [Google Scholar] [CrossRef]
- Fabbrocino, G. Combining Integrated Informative System and Historical Digital Twin for Maintenance and Preservation of Artistic Assets. Sensors 2021, 21, 5956. [Google Scholar] [CrossRef]
- Zhao, Y. Digital Protection of Cultural Heritage Based on Web Technology. Math. Probl. Eng. 2022, 2022, 3196063. [Google Scholar] [CrossRef]
- Zhao, G.Q. Knowledge Visualization 2004 definition of folding and revision. Audio Vis. Educ. Res. China 2009, 3, 15–18. [Google Scholar]
- Eppler, M.J.; Burkhard, R.A. Knowledge Visualization: Towards a New Discipline and its Fields of Application. ICA Working Paper. 2004. Available online: https://www.researchgate.net/publication/33682085 (accessed on 28 July 2004).
- Burkhard, R.A. Towards a Framework and a Model for Knowledge Visualization: Synergies between Information and Knowledge Visualization; Springer: Berlin/Heidelberg, Germany, 2005; Available online: https://www.researchgate.net/publication/221520309 (accessed on 1 January 2005).
- Cha, S.-D.; Yong, L.M. Knowledge Visualization Design Study on the History of Mission in Yanglim-dong, Gwangju Metropolitan City. J. Digit. Contents Soc. 2021, 22, 597–604. [Google Scholar] [CrossRef]
- Rodriguez-Gonzalvez, P.; Campo, A.G.; Munoz-Nieto, A.L.; Sanchez-Aparicio, L.J.; Gonzalez-Aguilera, D. Diachronic Reconstruction and Visualization of Lost Cultural Heritage Sites. ISPRS Int. J. Geo-Inf. 2019, 8, 61. [Google Scholar] [CrossRef] [Green Version]
- Sevilla, J.; Casanova-Salas, P.; Casas-Yrurzum, S.; Portalés, C. Multi-Purpose Ontology-Based Visualization of Spatio-Temporal Data: A Case Study on Silk Heritage. Appl. Sci. 2021, 11, 1636. [Google Scholar] [CrossRef]
- Zhang, X.; Xu, J.Q.; Wang, Y.H. Research on digital activation of Shanxi ancient stage based on knowledge visualization. Art Des. Theor. Ed. 2022, 2, 77–79. [Google Scholar]
- Tan, P.; Ji, Y. Research on interactive design of mobile panoramic virtual museum based on knowledge visualization. Packag. Eng. 2022, 43, 244–250. [Google Scholar]
- Katuscakova, M.; Capkova, E.; Grecnar, J. Capturing and Sharing Intangible Cultural Heritage Through Knowledge Visualization and Knowledge Modelling Tools. In Proceedings of the 20th European Conference on Knowledge Management (ECKM 2019), Lisbon, Portugal, 5–6 September 2019; Volumes 1–2, pp. 612–619. [Google Scholar] [CrossRef]
- Besancon, L.; Ynnerman, A.; Keefe, D.F.; Yu, L.Y.; Isenberg, T. The State of the Art of Spatial Interfaces for 3D Visualization. Comput. Graph. Forum 2021, 40, 293–326. [Google Scholar] [CrossRef]
- Gao, J.S.; Peng, B. Research on Knowledge Discovery Methods for Cultural Heritage Information Resources Based on Topic Identification. Inf. Sci. China 2021, 4, 9–14. [Google Scholar]
- Chen, Z.W.; Fan, J.S. Application of Cultural and Technological Convergence in Cultural Heritage Protection-A Case Study of the Digitalization of the Mogao Grottoes. Dunhuang Res. China 2016, 2, 100–107. [Google Scholar] [CrossRef]
- Zhang, H.P. Research on Knowledge Transformation Based on Visualization Technology; University of Electronic Science and Technology Press: Chengdu, China, 2011. [Google Scholar]
- Polanyi, M. The Study of Man (Routledge Revivals): The Lindsay Memorial Lectures, 1st ed.; University of Chicago Press: Chicago, IL, USA, 1958. [Google Scholar]
- Li, H.Z.; Gao, T. A historical study of Qinglian Temple in Jincheng, Shanxi. Cult. Relics World China 2003, 1, 24–32. [Google Scholar]
- Pei, Y. Research on the Coordination of Qinglian Temple between the Surrounding Environment. Master’s Thesis, Taiyuan University of Technology, Taiyuan, China, 2017. [Google Scholar]
- Fan, Q.; Shi, Z.C.; On, G.X. Construction of knowledge graph of Intangible Cultural Heritage. Libr. Forum 2021, 10, 100–109. [Google Scholar]
Figure 1.
General technical framework of this study.

Figure 2.
Technical framework of the knowledge acquisition.

Figure 3.
Technical framework of the knowledge reconstruction.

Figure 4.
Technical framework of the knowledge innovation.

Figure 5.
Technical framework of the knowledge management.

Figure 6.
Location of Qinglian Temple.

Figure 7.
Spatial layout of Qinglian Temple: (a) the Upper Temple and (b) the Lower Temple.

Figure 8.
Data collection: (a) terrestrial laser scanning, (b) handheld scanning, and (c) UAV photogrammetry.
Figure 8.
Data collection: (a) terrestrial laser scanning, (b) handheld scanning, and (c) UAV photogrammetry.

Figure 9.
Preprocessed data: (a) point cloud and (b) UAV image.

Figure 10.
CAD drawing of the Sutra Pavilion: (a) plane, (b) façade, and (c) side elevation.

Figure 11.
Three-dimensional model of the Sutra Pavilion.

Figure 12.
Mind map of Qinglian Temple.

Figure 13.
Knowledge graph of Qinglian Temple.

Figure 14.
VR interaction with Qinglian Temple.

Figure 15.
Cross-platform applications: (a) building disassembly animation using an Table PC, (b) AR using a Smartphone, and (c) automatic roaming using a PC.
Figure 15.
Cross-platform applications: (a) building disassembly animation using an Table PC, (b) AR using a Smartphone, and (c) automatic roaming using a PC.

Figure 16.
Cultural creativity products: (a) table lamp and (b) keychains.

Figure 17.
Cultural creativity products: (a) digital protection and (b) digital utilization.


Table 1.
Scanning data information table.
| Station Name | Measurement Area | Orientation Angle | Scanner Dist. Range | Angular Area | Scan Size | Measurement Accuracy | Number of Point Clouds |
|---|---|---|---|---|---|---|---|
| Station1 | Main Area: Front of the Dragon King’s Hall Auxiliary Area: Side of the Bell Tower | 1.37° | 613.974954 m | Vertical: 90–−60° Horizontal: 0–360° | 5166 × 2134 pt | Quality: 4× Resolution: 5120 pt/360 | 5,903,665 |
| Station2 | Main Area: Interior of the Three Buddha Hall building Auxiliary Area: The outer perimeter of the Three Buddha Hall | 0.95° | 613.974954 m | Vertical: 90–−60° Horizontal: 0–360° | 5166 × 2134 pt | Quality: 4× Resolution: 5120 pt/360 | 10,657,398 |
| Station3 | Main Area: Tibetan Relic Pagoda Auxiliary Area: Mountain gate and courtyard environment | 21.32° | 613.974954 m | Vertical: 90–−60° Horizontal: 0–360° | 5164 × 2134 pt | Quality: 4× Resolution: 5120 pt/360 | 5,398,417 |
| Station4 | Main Area: The front and interior of the Sakya Hall Auxiliary Area: The surroundings of the Sakya Hall and the main entrance of the Maitreya Hall | 140.54° | 613.974954 m | Vertical: 90–−60° Horizontal: 0–360° | 5172 ×2134 pt | Quality: 4× Resolution: 5120 pt/360 | 10,444,703 |
| … | … | … | … | … | … | … | … |
Table 2.
Bucket arch information table.
| Number | Bucket Arch Name | Building Name | Bucket Arch Number | Bracket Set Layer | Elevation CAD Drawing | Section CAD Drawing | Plan CAD Drawing | 3D Model | Image | … |
|---|---|---|---|---|---|---|---|---|---|---|
| 1 | Bucket arch between columns | Sutra Pavilion | 5 | Six-layer Bracket sets |  |  |  |  |  | … |
| 2 | Bucket arch between columns | Sakya Hall | 8 | Five-layer Bracket sets and single ang |  |  |  |  |  | … |
| 3 | Bucket arch between columns | Daxiong Hall | 24 | Five-layer Bracket sets and double ang |  |  |  |  |  | … |
| … | … | … | … | … | … |
Publisher’s Note: MDPI stays neutral with regard to jurisdictional claims in published maps and institutional affiliations. |
© 2022 by the authors. Licensee MDPI, Basel, Switzerland. This article is an open access article distributed under the terms and conditions of the Creative Commons Attribution (CC BY) license (https://creativecommons.org/licenses/by/4.0/).
Share and Cite
MDPI and ACS Style
Zhang, X.; Zhi, Y.; Xu, J.; Han, L. Digital Protection and Utilization of Architectural Heritage Using Knowledge Visualization. Buildings 2022, 12, 1604. https://doi.org/10.3390/buildings12101604
AMA Style
Zhang X, Zhi Y, Xu J, Han L. Digital Protection and Utilization of Architectural Heritage Using Knowledge Visualization. Buildings. 2022; 12(10):1604. https://doi.org/10.3390/buildings12101604
Chicago/Turabian StyleZhang, Xiao, Ying Zhi, Jiaqi Xu, and Lixia Han. 2022. "Digital Protection and Utilization of Architectural Heritage Using Knowledge Visualization" Buildings 12, no. 10: 1604. https://doi.org/10.3390/buildings12101604
Note that from the first issue of 2016, this journal uses article numbers instead of page numbers. See further details here.