Ponatinib Inhibits Multiple Signaling Pathways Involved in STAT3 Signaling and Attenuates Colorectal Tumor Growth

 , and
, and 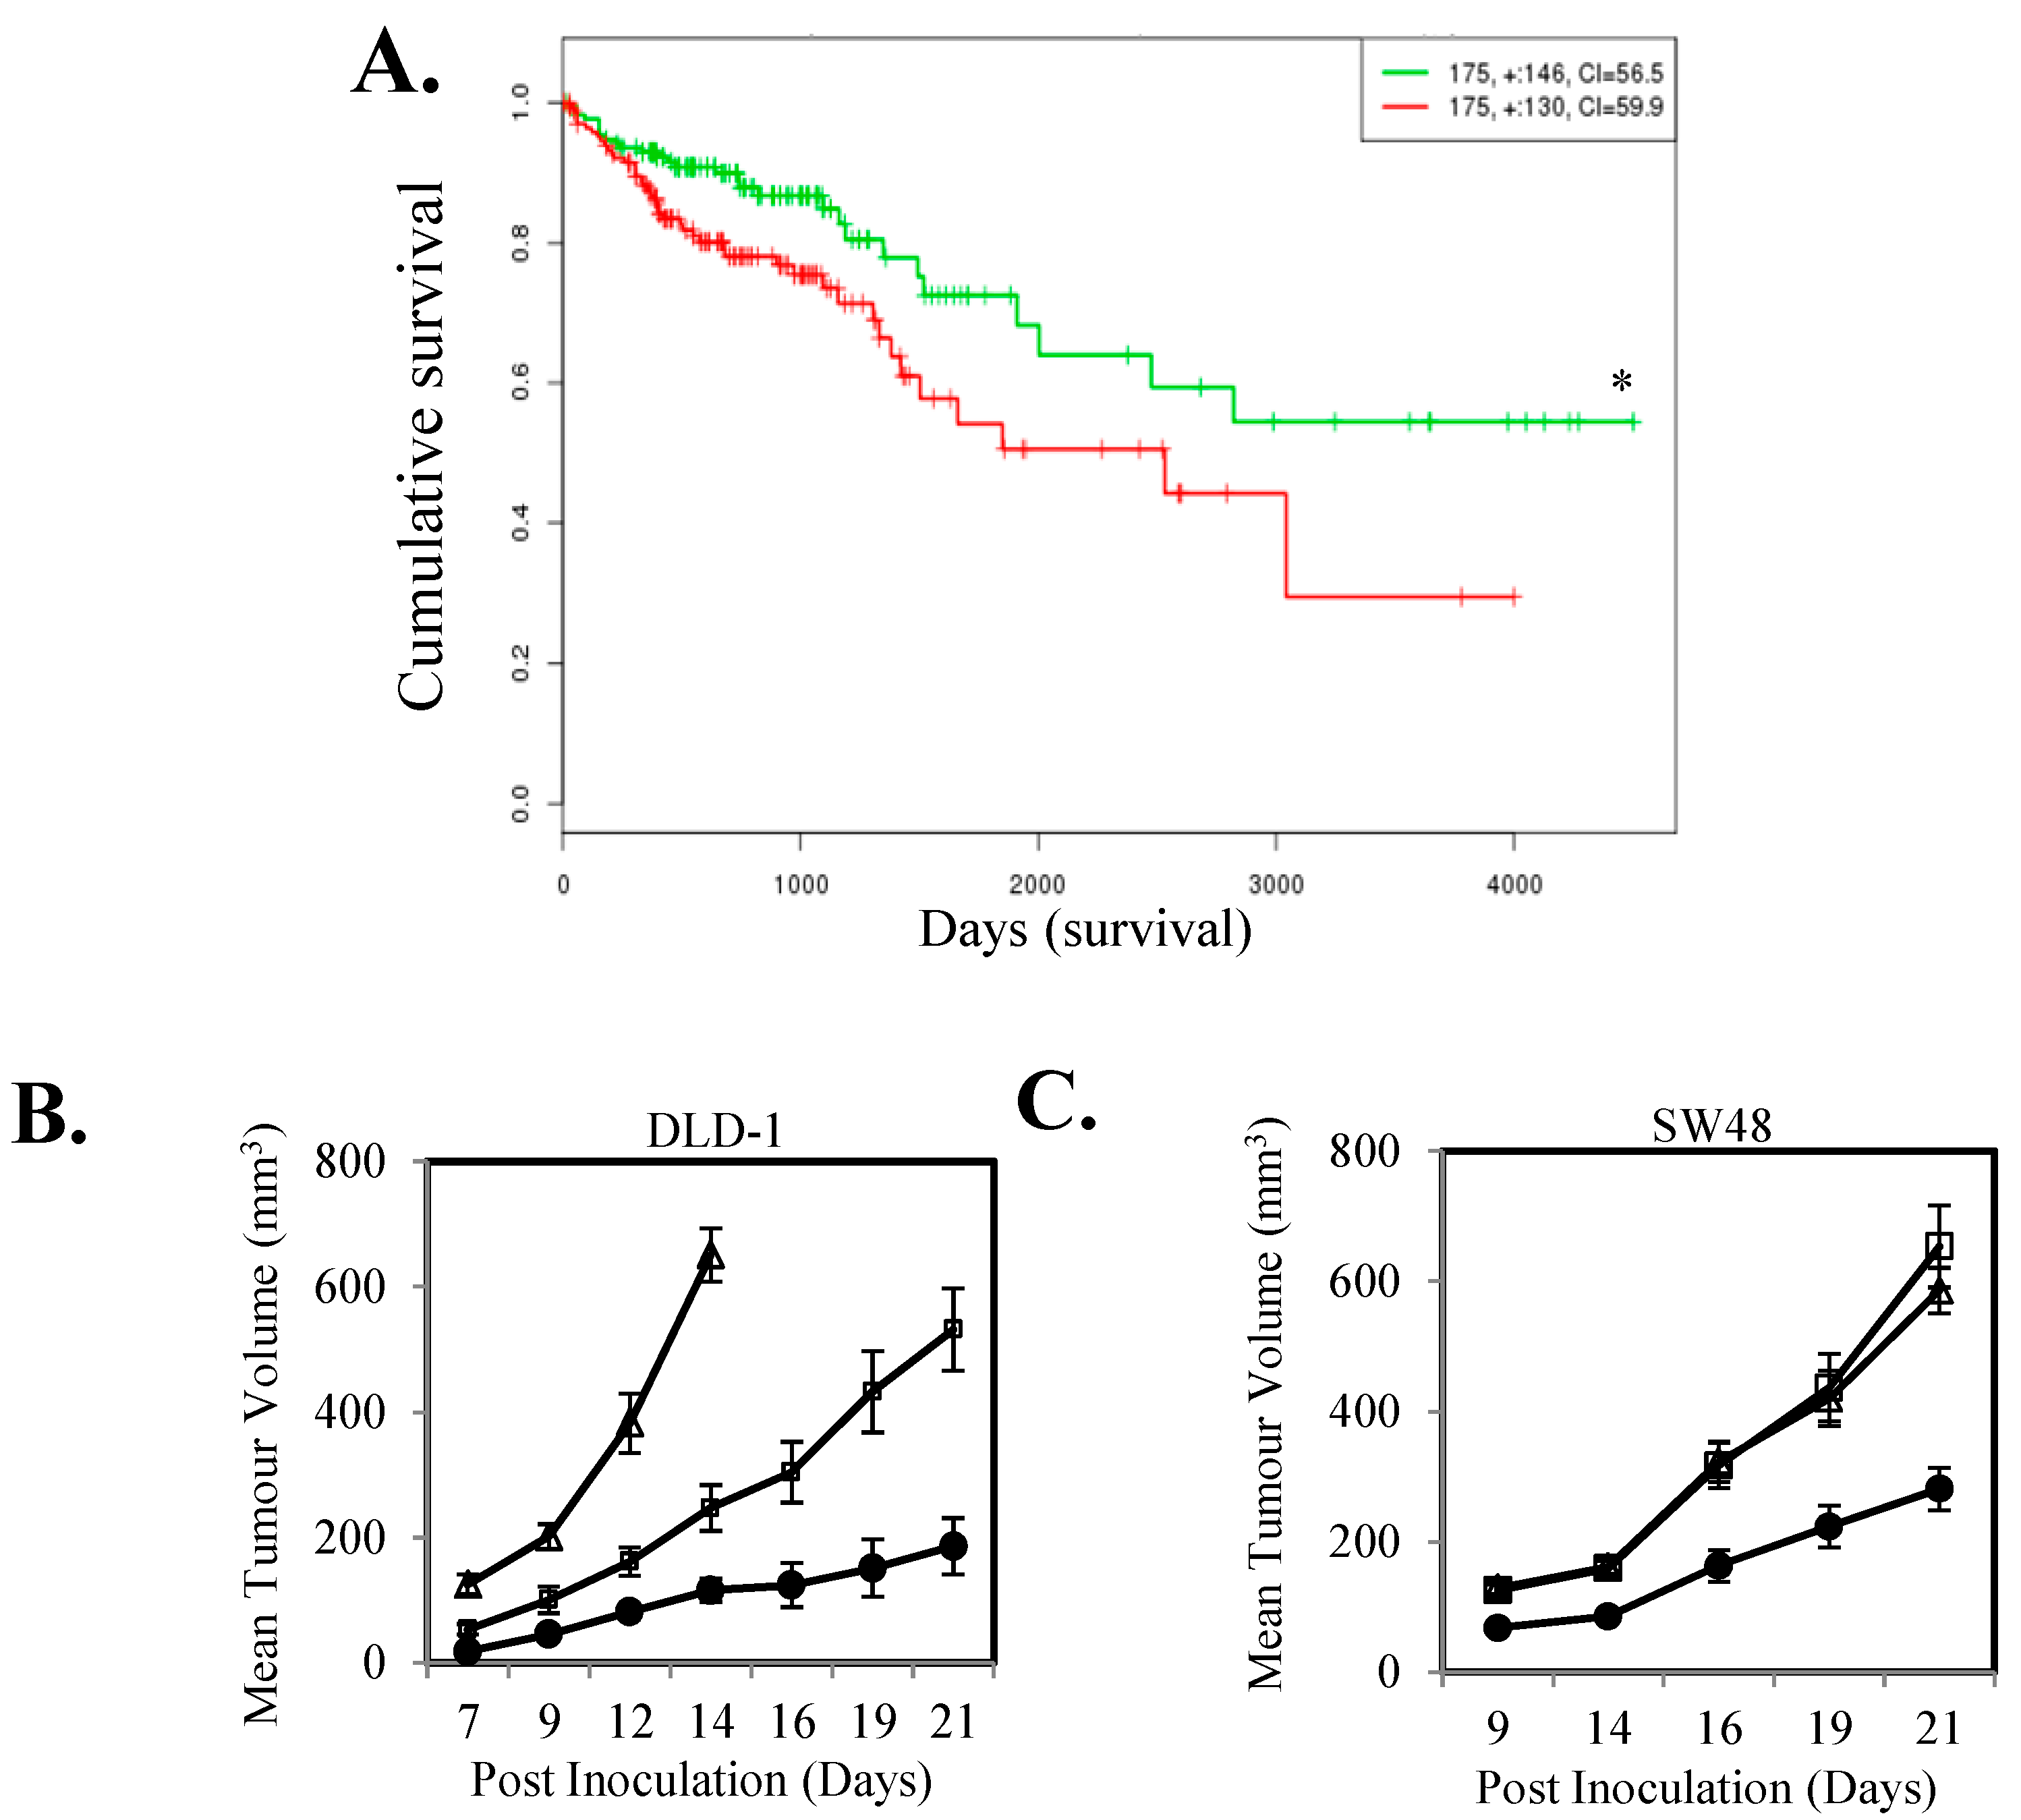
Abstract
:1. Introduction
2. Results
2.1. IL-11-STAT3 Signaling Enhances Tumor Growth
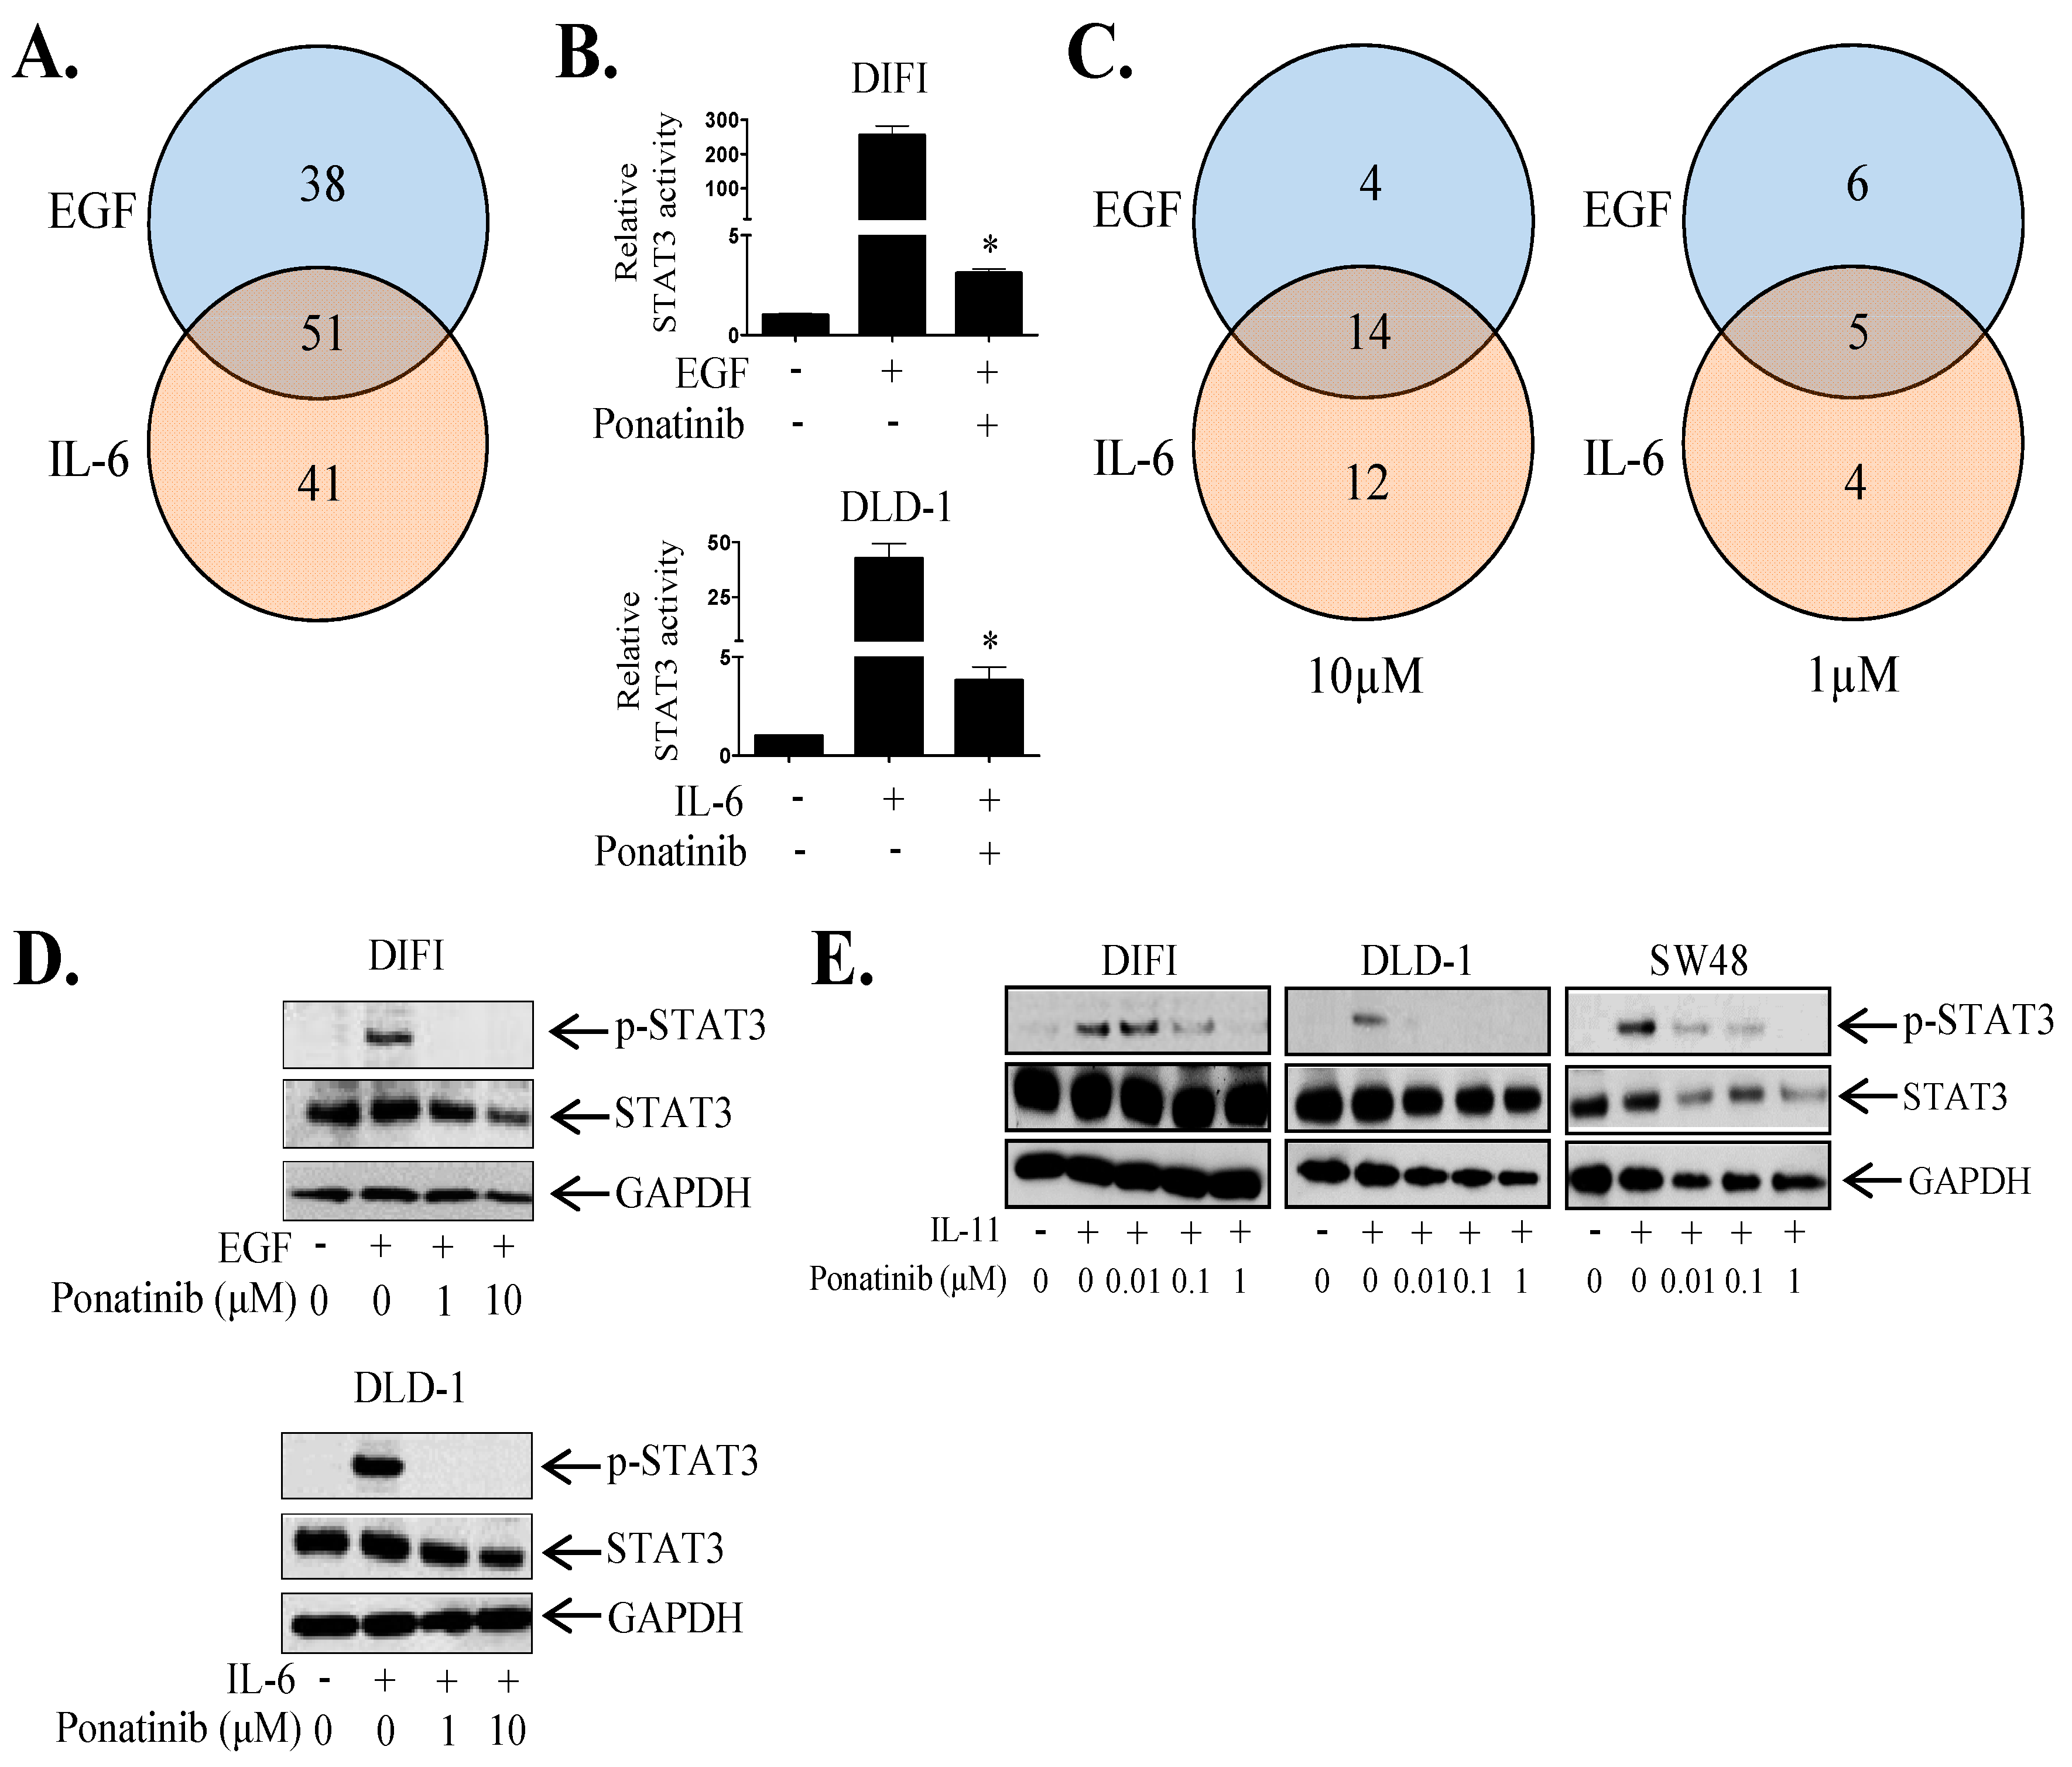
2.2. Ponatinib Inhibits STAT3 Phosphorylation and Transcriptional Activity
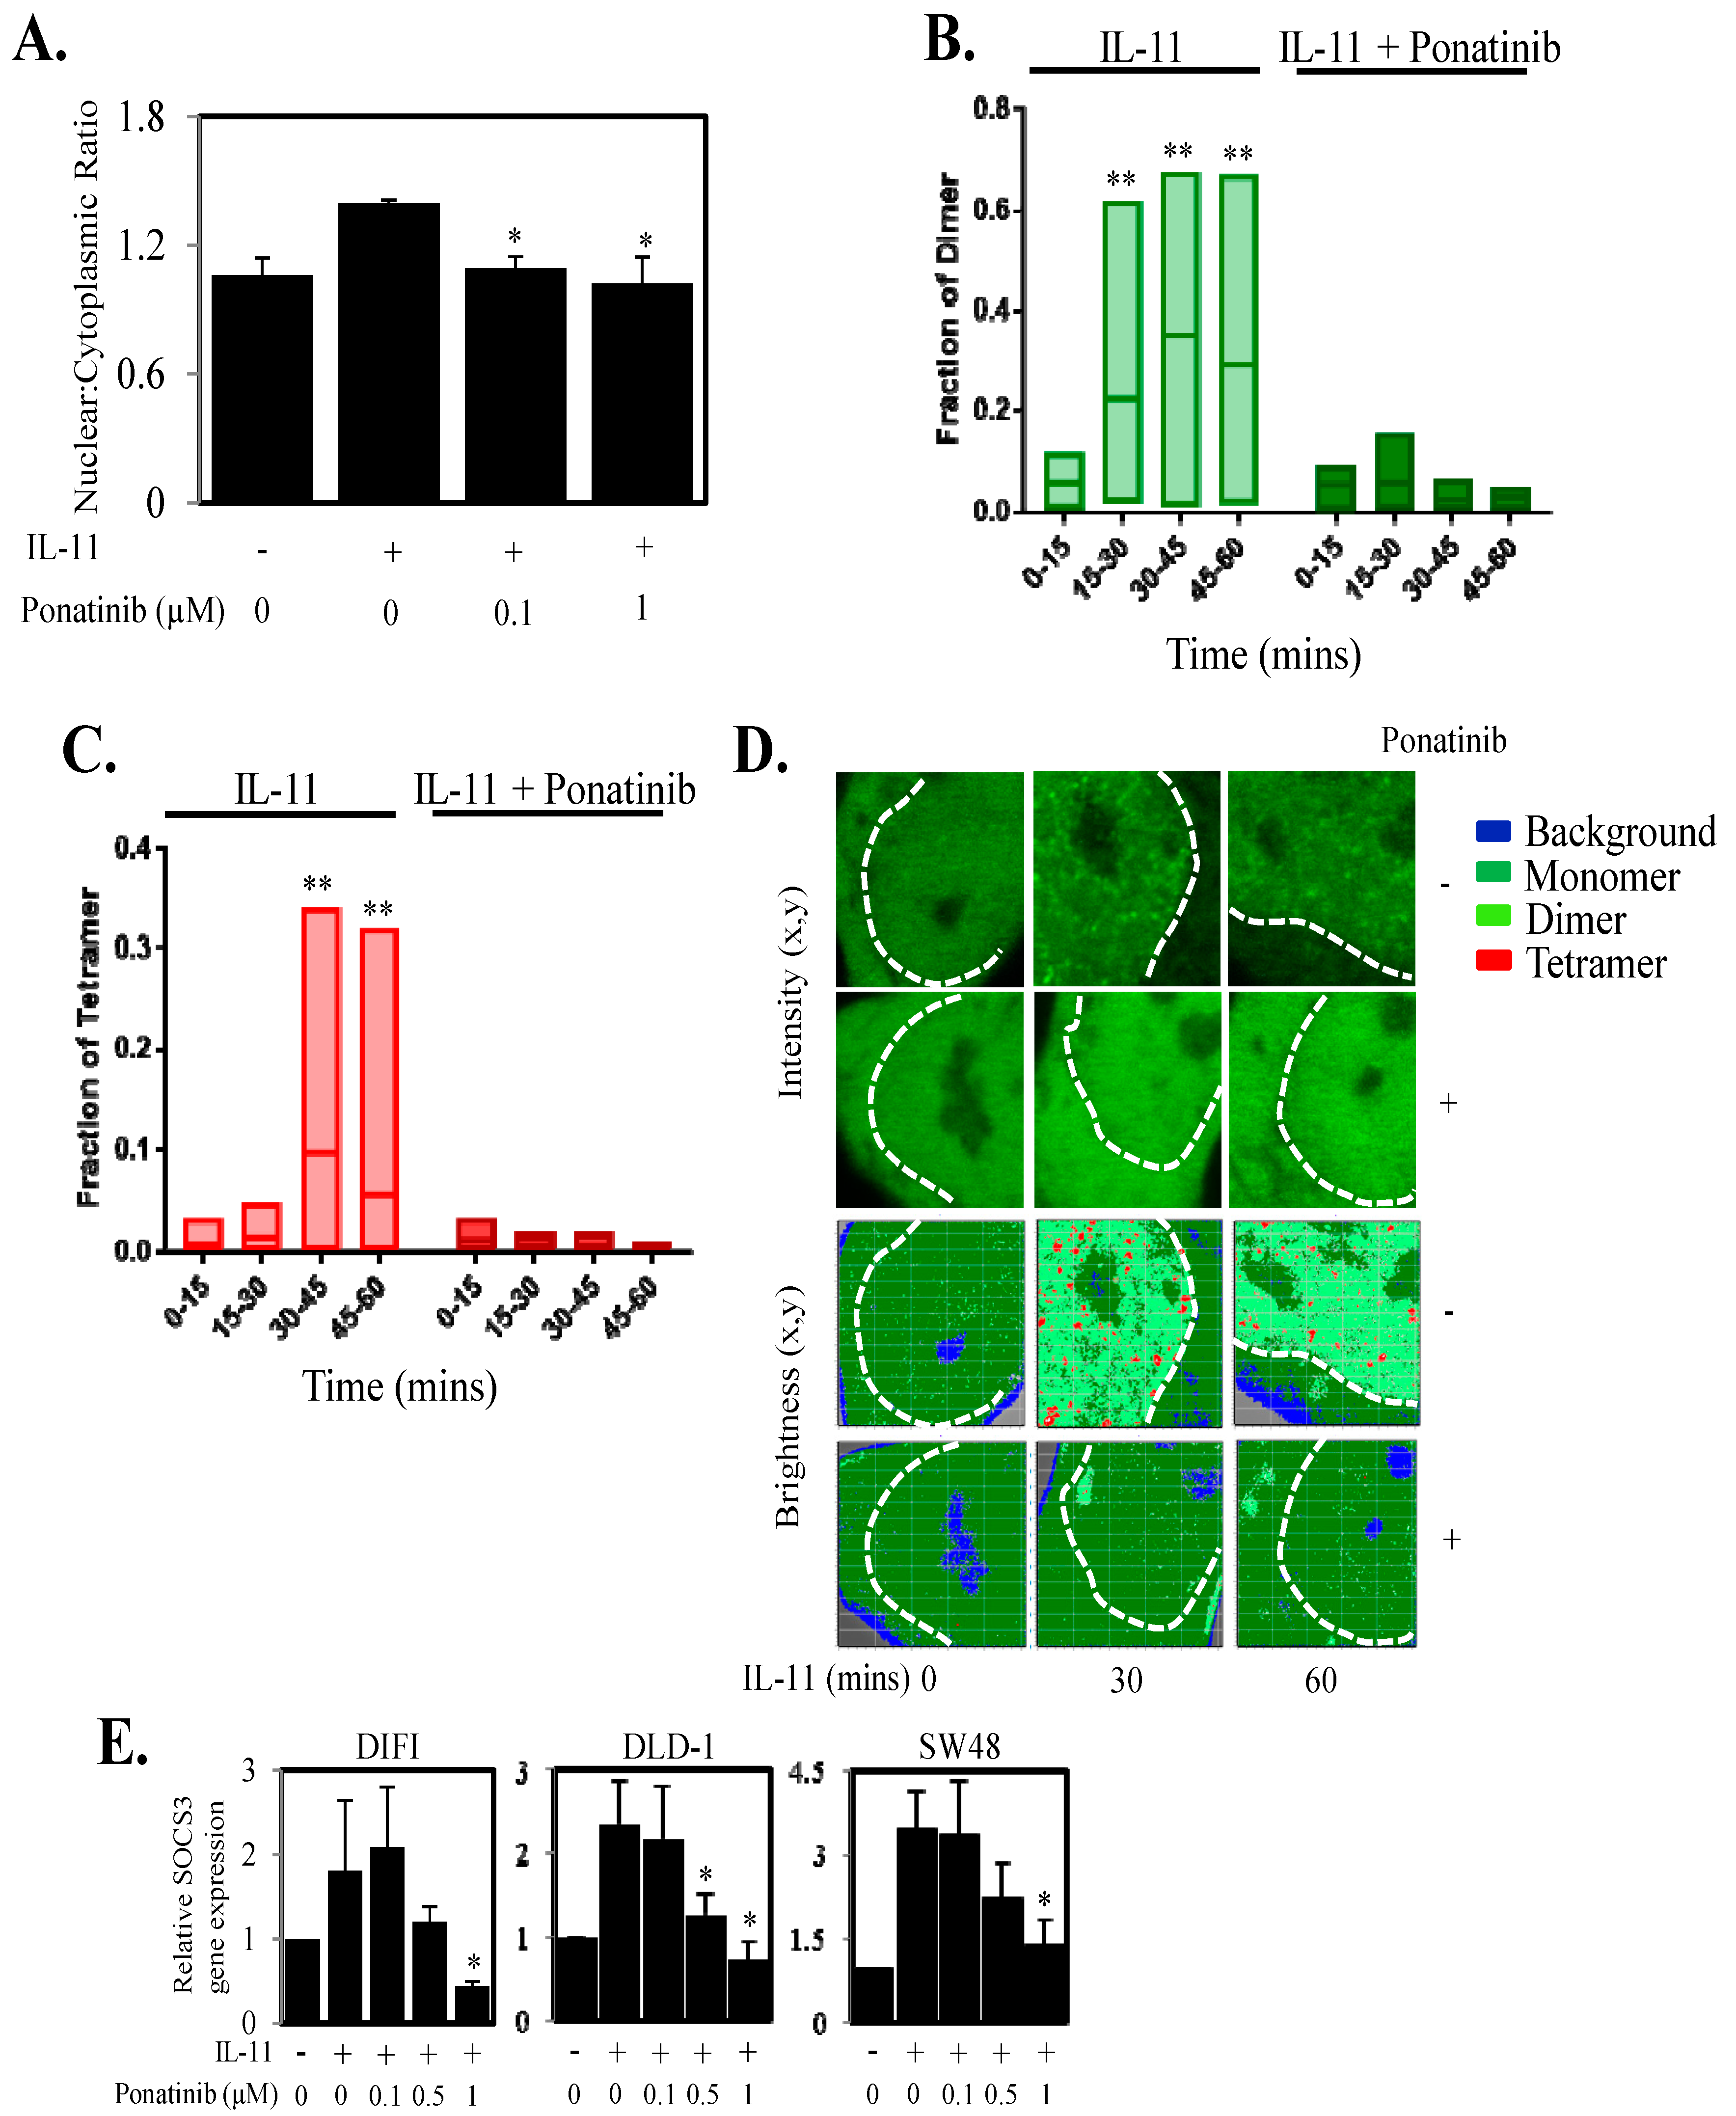
2.3. Reduces STAT3 Localization and Function in the Nucleus
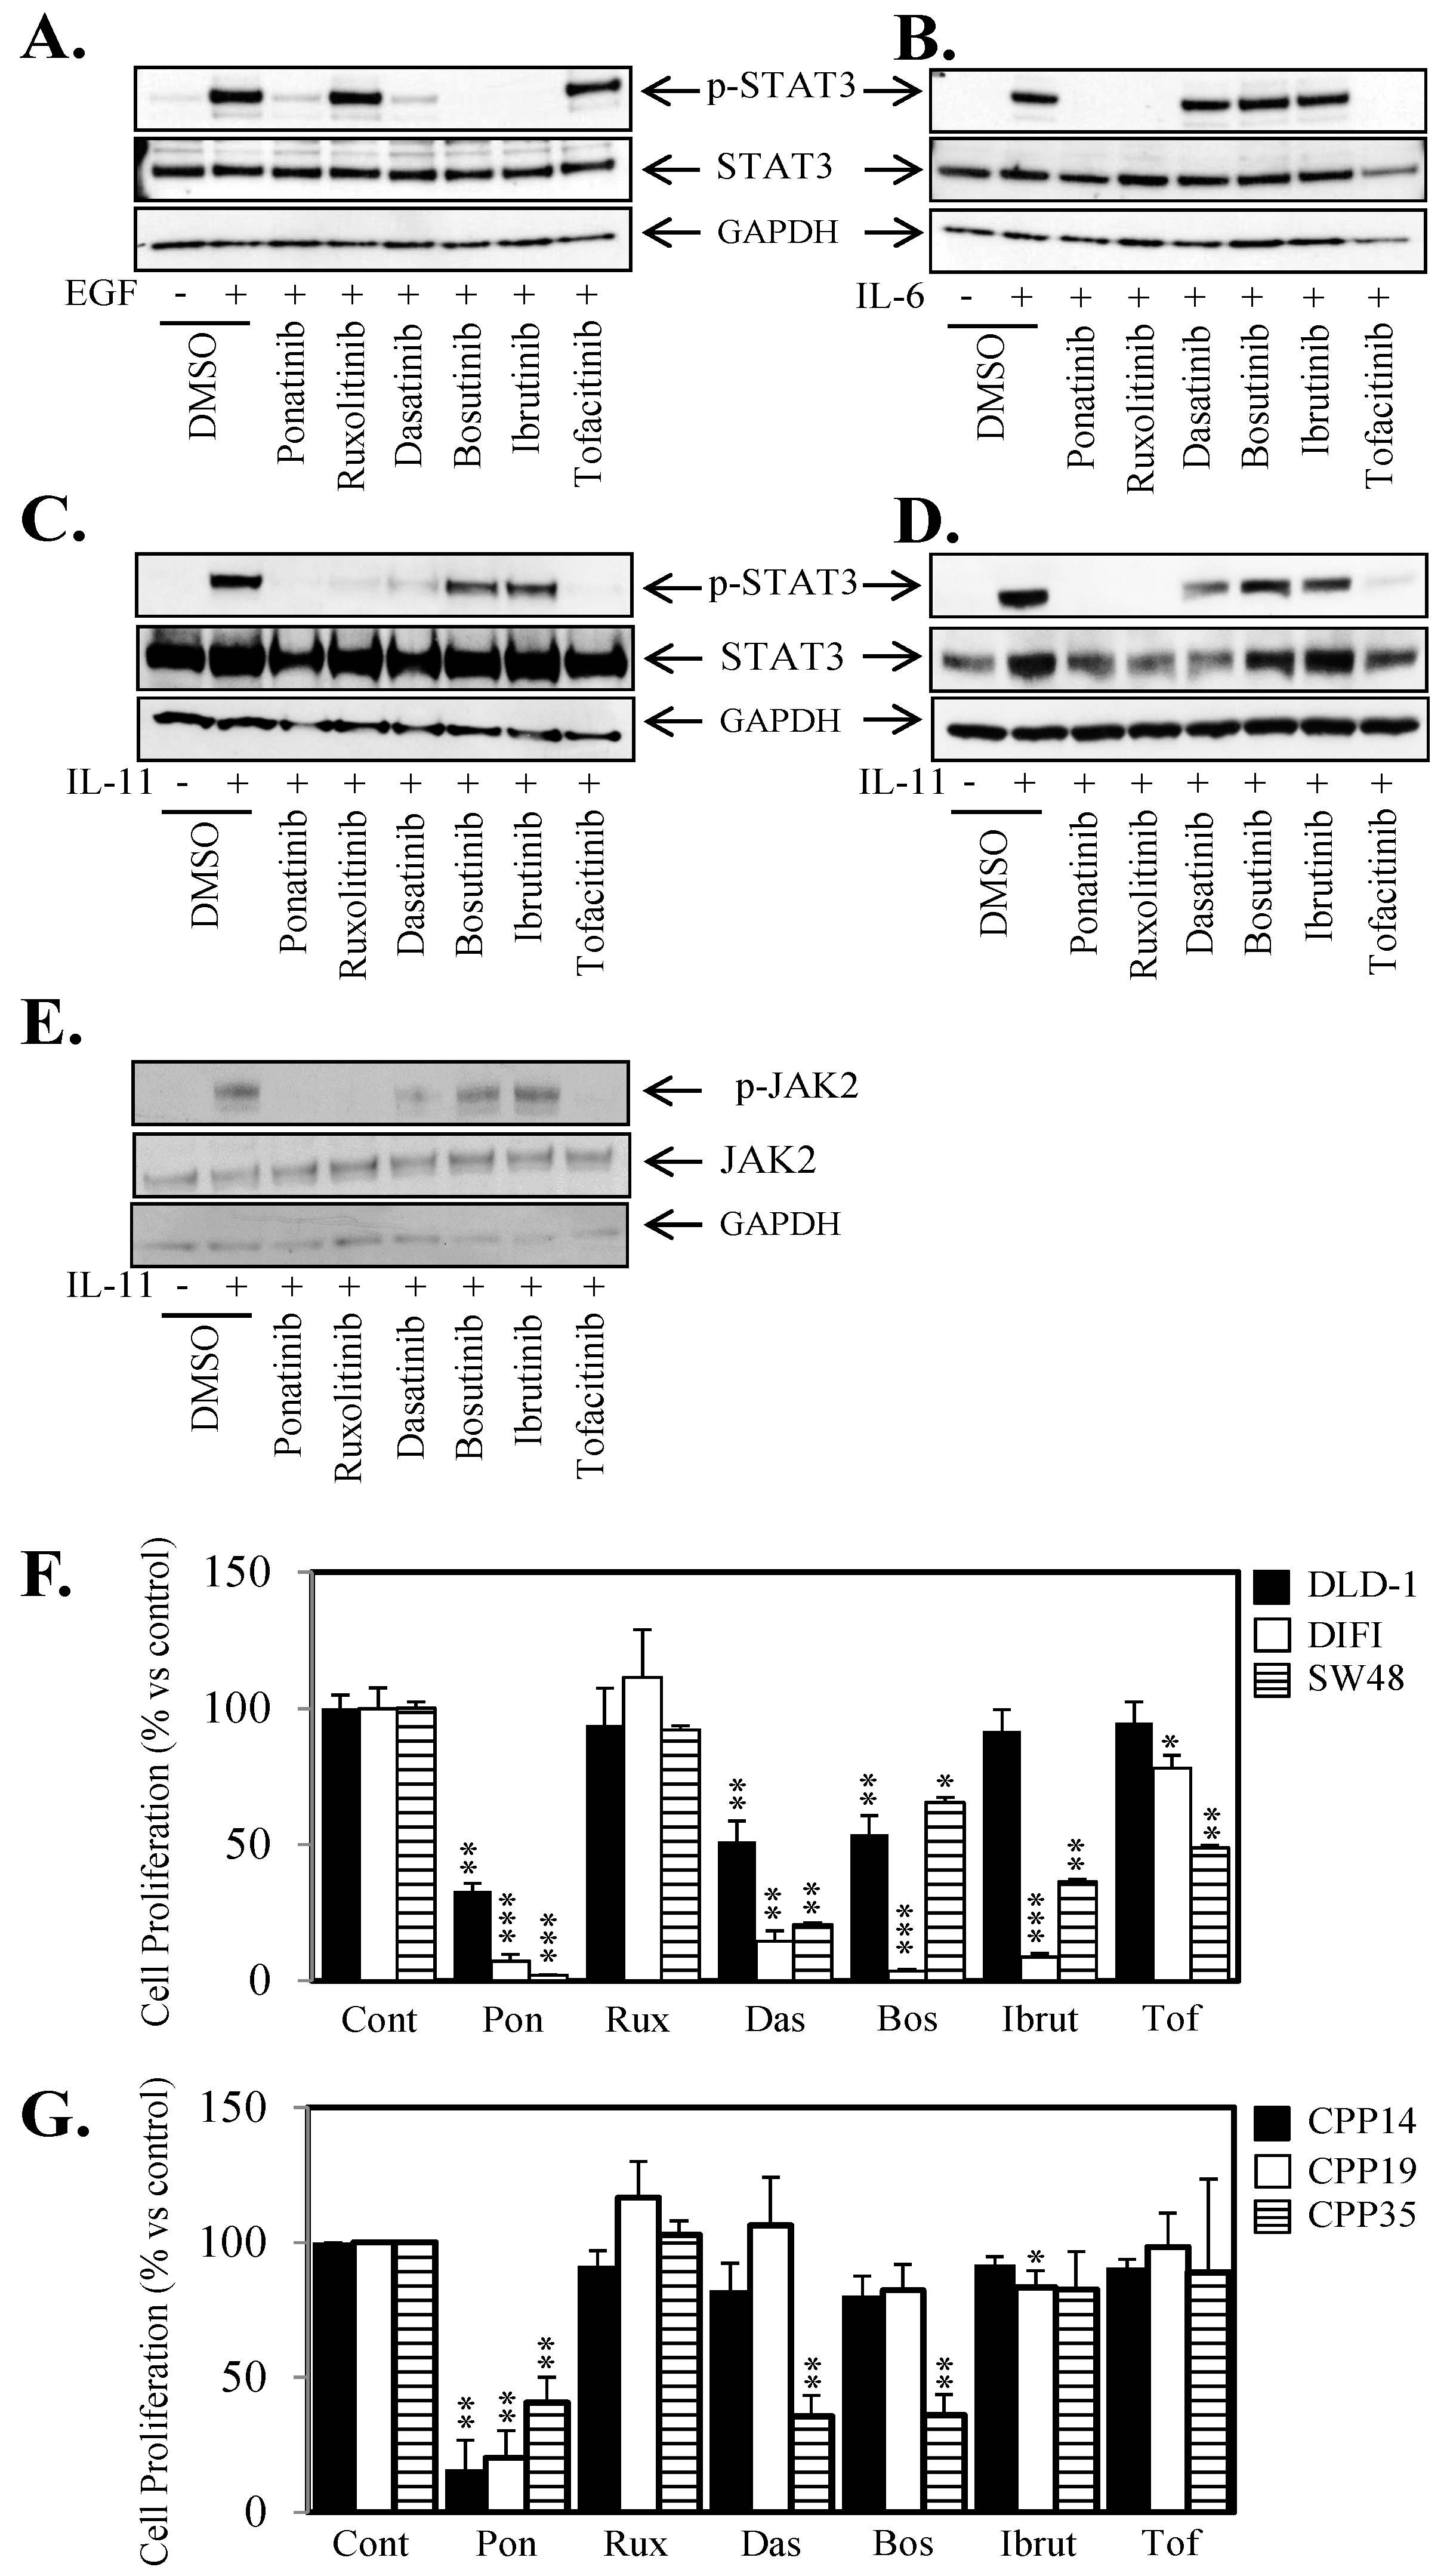
2.4. Ponatinib Displays a Broader Range of Anti-STAT3 Activity Compared to SRC and JAK Inhibitors
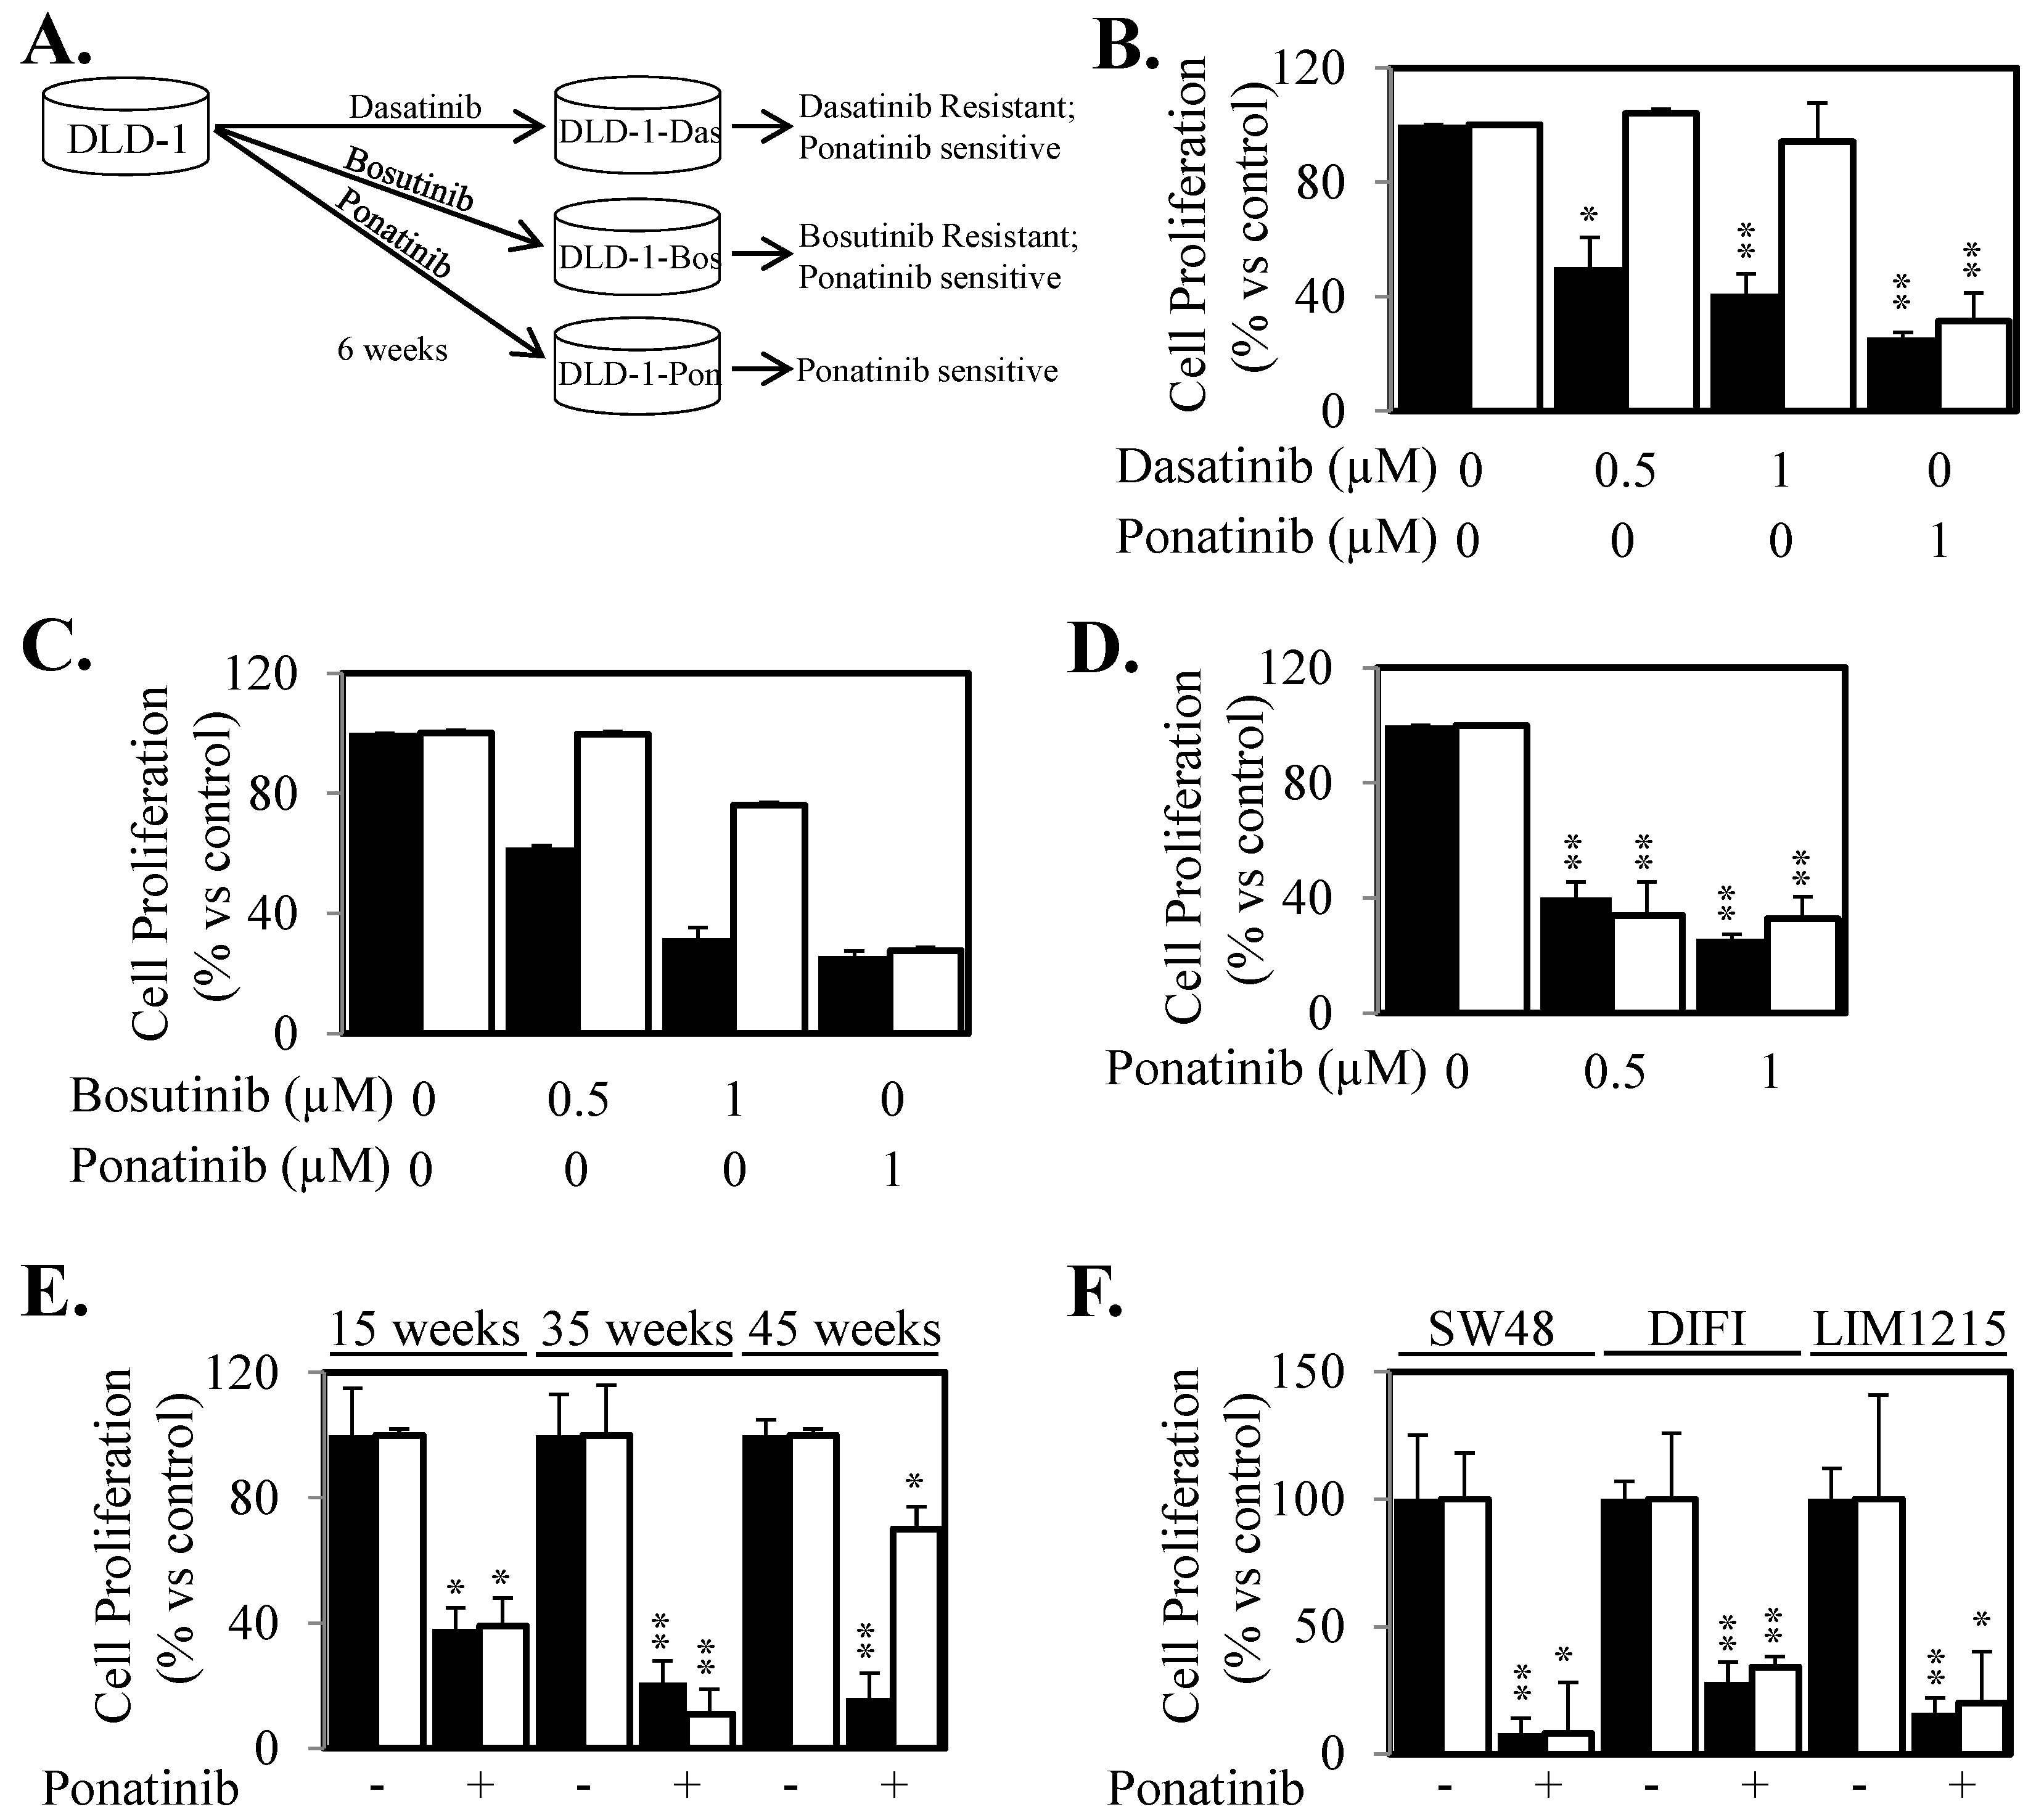
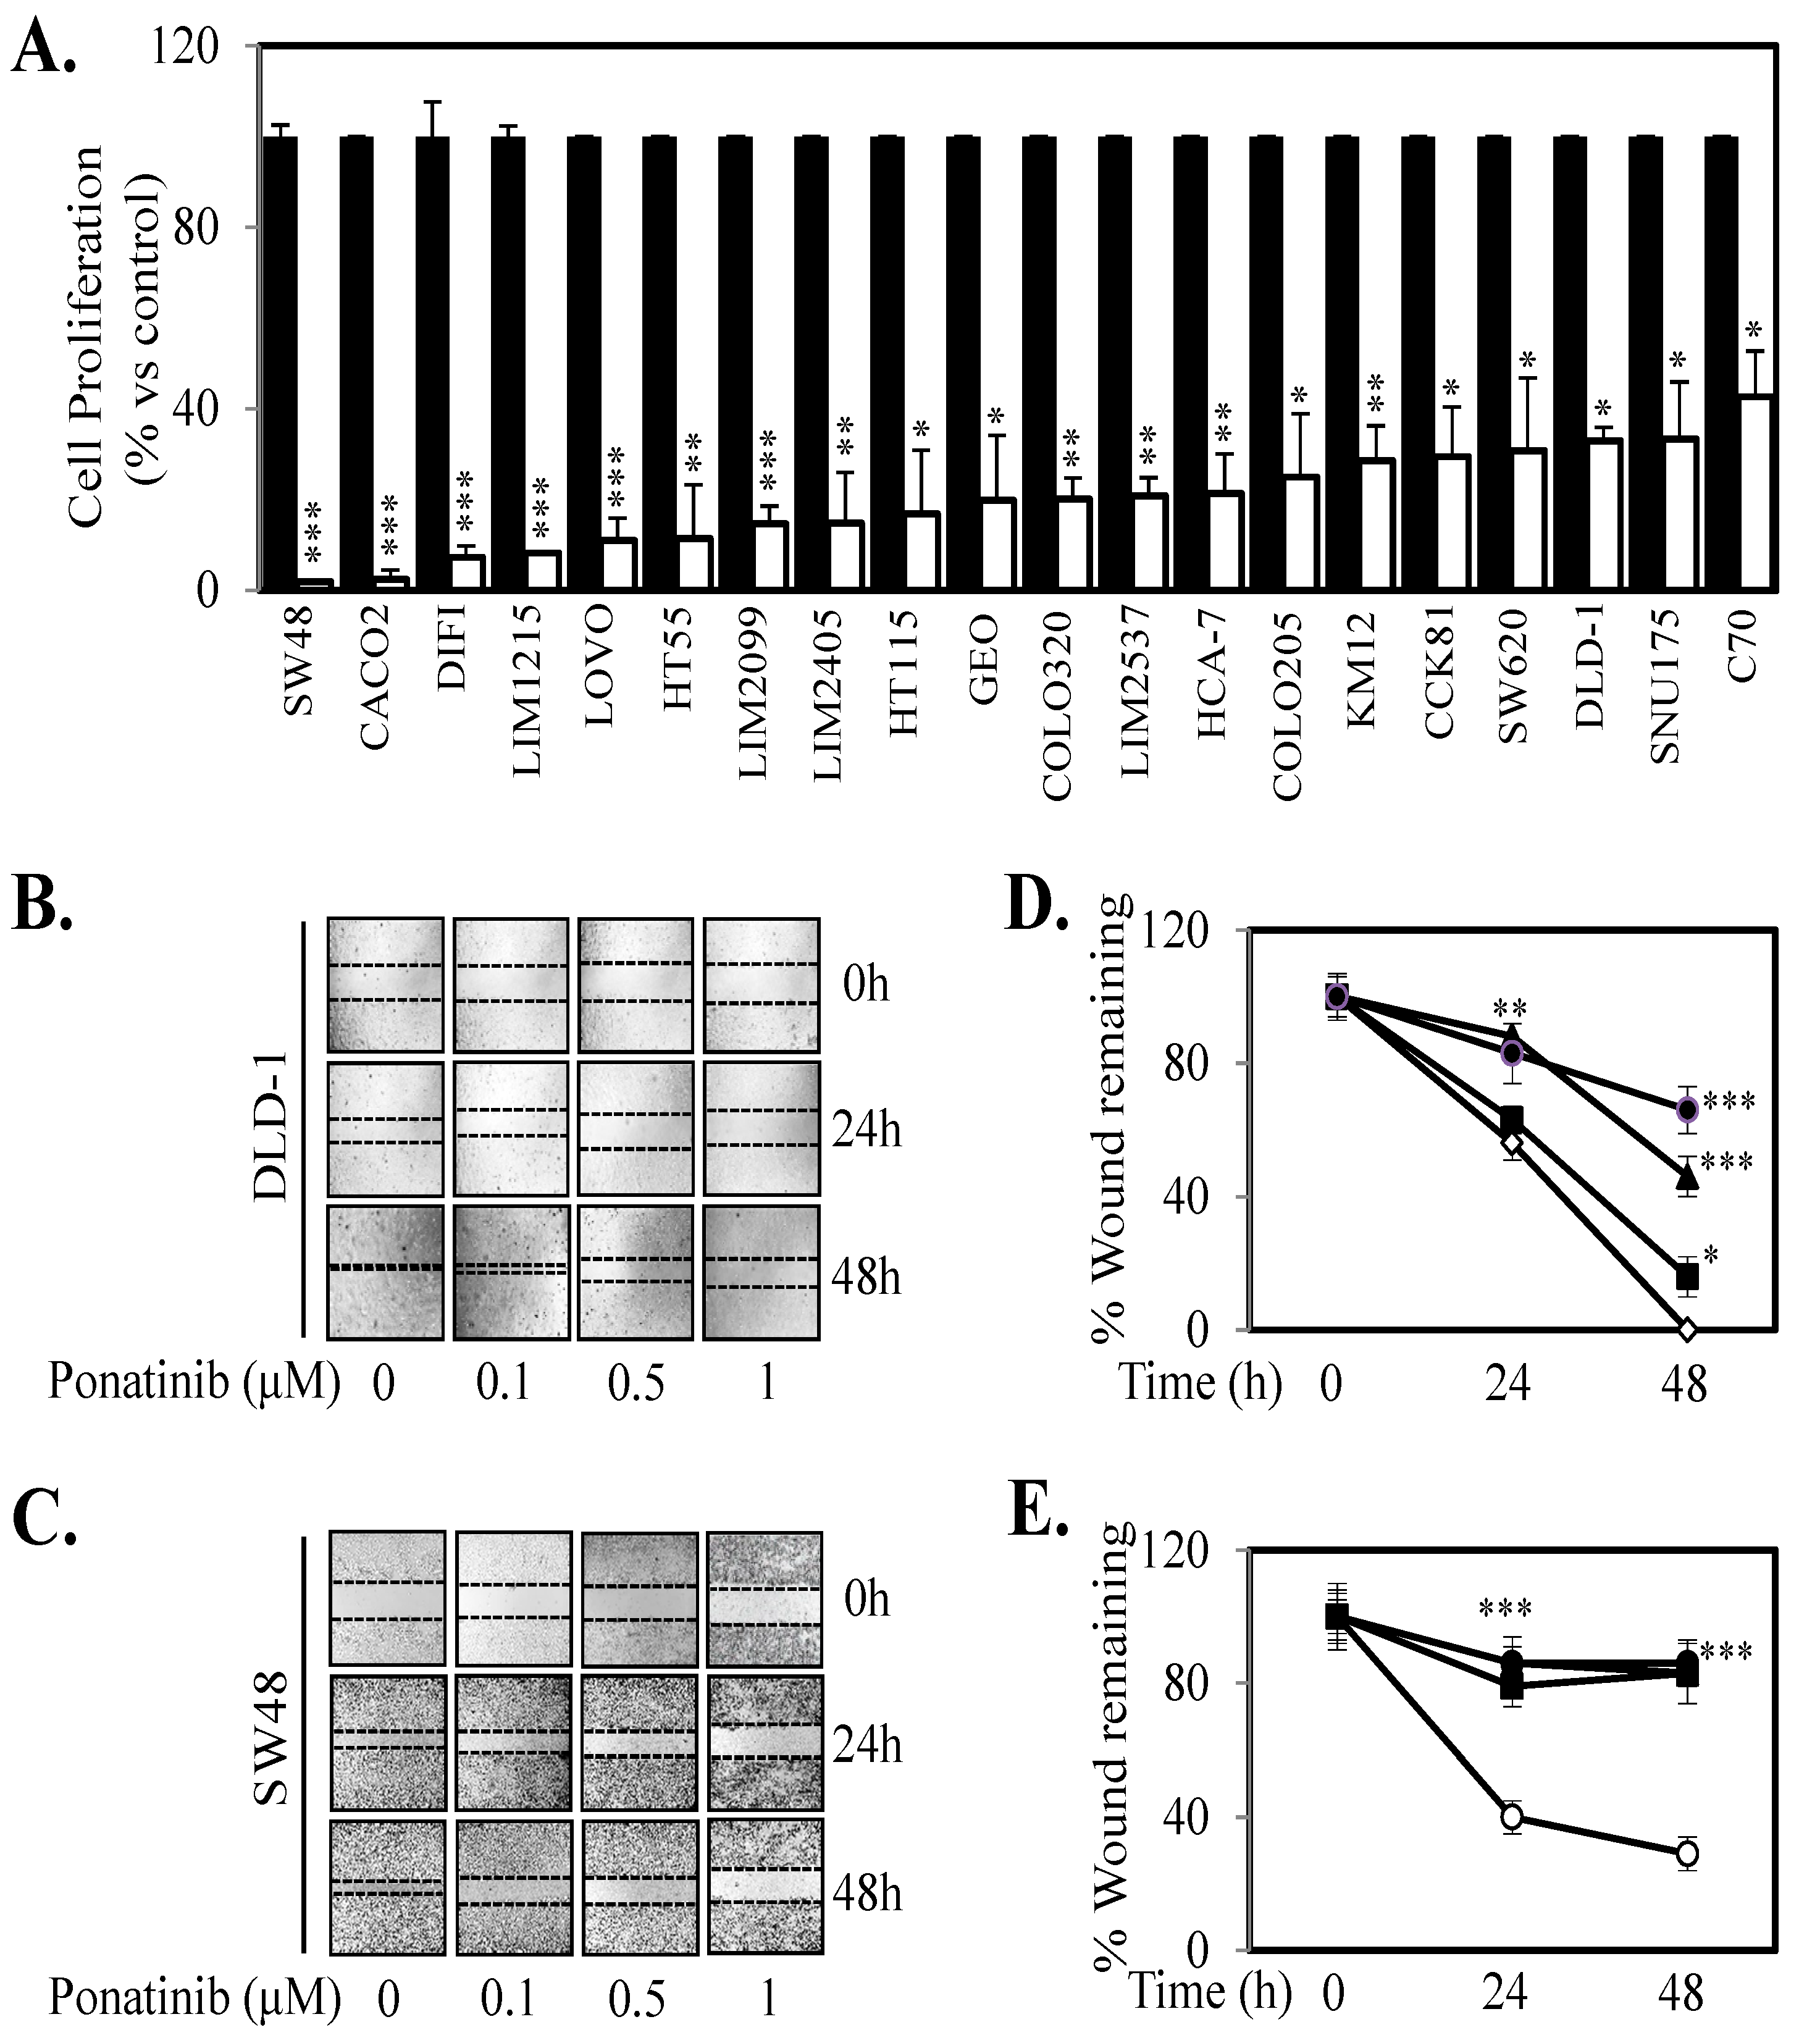
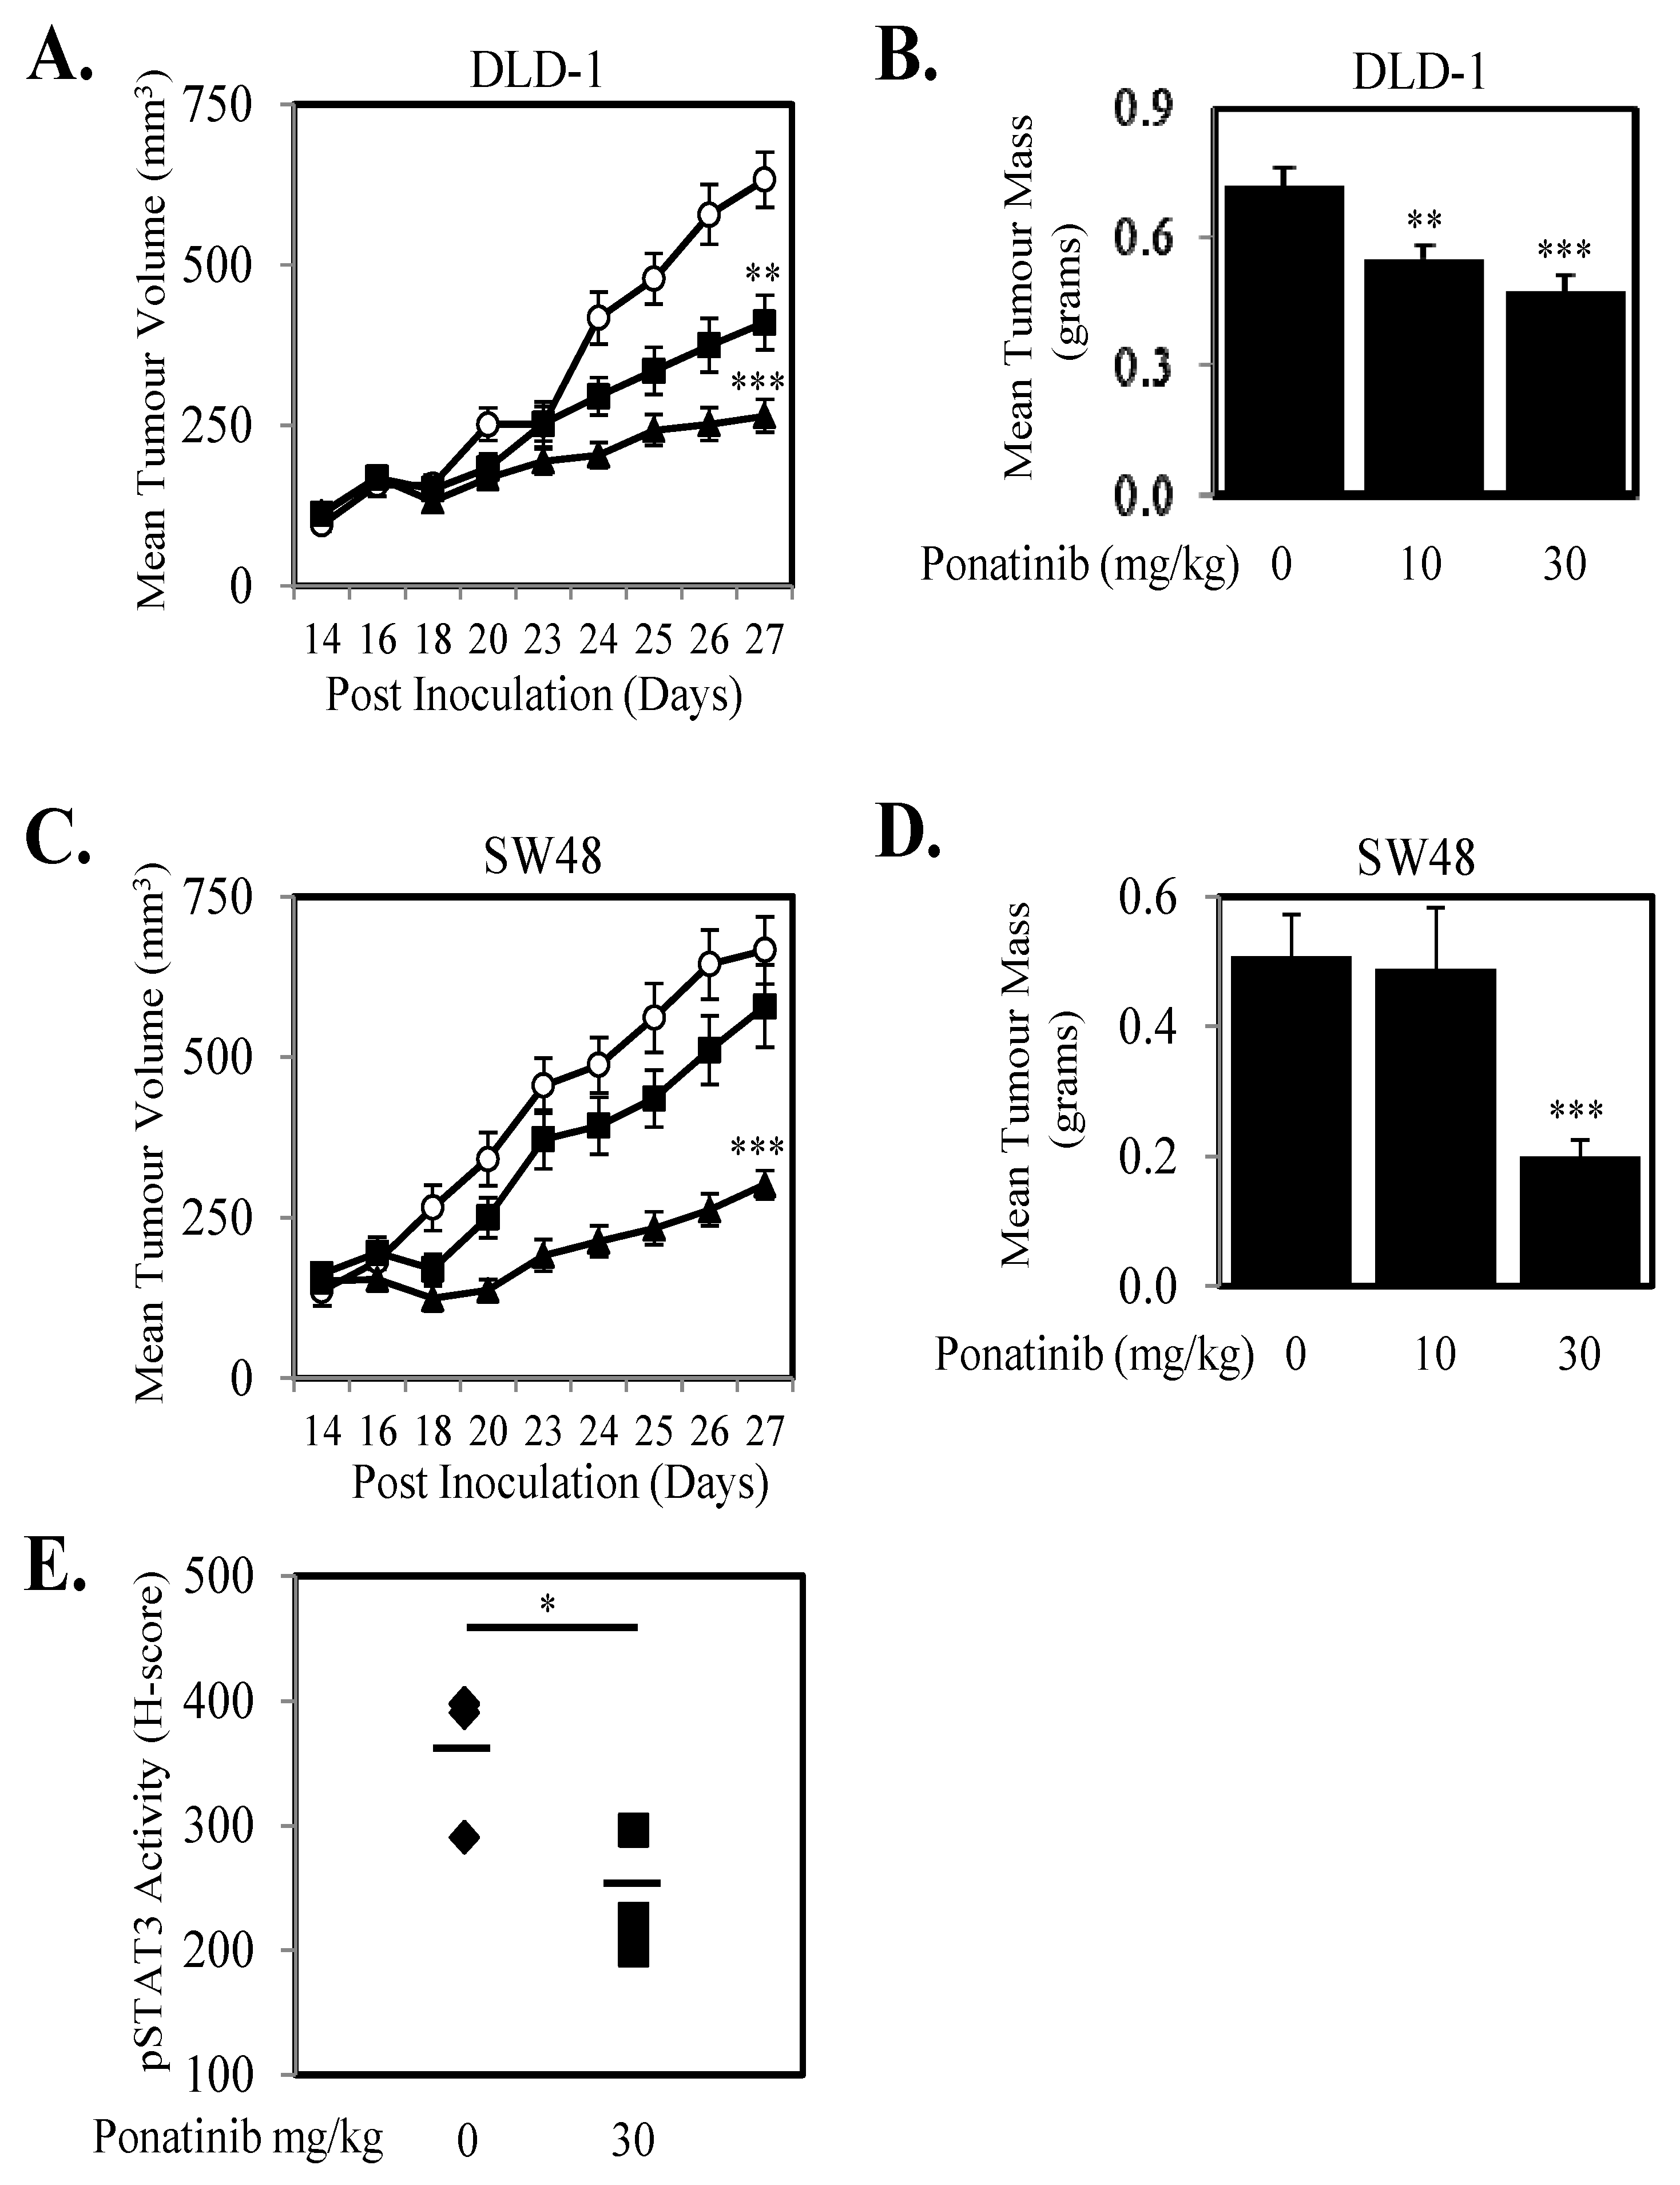
2.5. Ponatinib Inhibits Cell Proliferation, Migration and Tumor Growth In Vivo
3. Discussion
4. Materials and Methods
4.1. Survexpress Data Mining
4.2. Antibodies and Reagents
4.3. Cell Culture
4.4. Luciferase Assay
4.5. Western Blotting
4.6. Cell Viability Assays
4.7. RNA Extraction and RT-PCR
4.8. Wound Healing Assay
4.9. Immunohistochemistry Analysis
4.10. STAT3 Dimer and Tetramer Analysis
4.11. STAT3 Nuclear Localization Analysis
4.12. Subcutaneous Xenograft Mouse Model
4.13. Statistical Analysis
5. Conclusions
Supplementary Materials
Author Contributions
Funding
Conflicts of Interest
References
- Siegel, R.L.; Miller, K.D.; Fedewa, S.A.; Ahnen, D.J.; Meester, R.G.; Barzi, A.; Jemal, A. Colorectal cancer statistics, 2017. CA Cancer J. Clin. 2017, 67, 177–193. [Google Scholar] [CrossRef] [PubMed]
- Torre, L.A.; Bray, F.; Siegel, R.L.; Ferlay, J.; Lortet-Tieulent, J.; Jemal, A. Global cancer statistics, 2012. CA Cancer J. Clin. 2015, 65, 87–108. [Google Scholar] [CrossRef] [PubMed]
- Andre, T.; Boni, C.; Mounedji-Boudiaf, L.; Navarro, M.; Tabernero, J.; Hickish, T.; Topham, C.; Zaninelli, M.; Clingan, P.; Bridgewater, J.; et al. Oxaliplatin, fluorouracil, and leucovorin as adjuvant treatment for colon cancer. N. Engl. J. Med. 2004, 350, 2343–2351. [Google Scholar] [CrossRef] [PubMed]
- Douillard, J.Y.; Cunningham, D.; Roth, A.D.; Navarro, M.; James, R.D.; Karasek, P.; Jandik, P.; Iveson, T.; Carmichael, J.; Alakl, M.; et al. Irinotecan combined with fluorouracil compared with fluorouracil alone as first-line treatment for metastatic colorectal cancer: A multicentre randomised trial. Lancet 2000, 355, 1041–1047. [Google Scholar] [CrossRef]
- Van Cutsem, E.; Hoff, P.M.; Harper, P.; Bukowski, R.M.; Cunningham, D.; Dufour, P.; Graeven, U.; Lokich, J.; Madajewicz, S.; Maroun, J.A.; et al. Oral capecitabine vs intravenous 5-fluorouracil and leucovorin: Integrated efficacy data and novel analyses from two large, randomised, phase III trials. Br. J. Cancer 2004, 90, 1190–1197. [Google Scholar] [CrossRef] [PubMed]
- Bokemeyer, C.; Bondarenko, I.; Hartmann, J.T.; de Braud, F.; Schuch, G.; Zubel, A.; Celik, I.; Schlichting, M.; Koralewski, P. Efficacy according to biomarker status of cetuximab plus FOLFOX-4 as first-line treatment for metastatic colorectal cancer: The OPUS study. Ann. Oncol. 2011, 22, 1535–1546. [Google Scholar] [CrossRef] [PubMed]
- Douillard, J.Y.; Siena, S.; Cassidy, J.; Tabernero, J.; Burkes, R.; Barugel, M.; Humblet, Y.; Bodoky, G.; Cunningham, D.; Jassem, J.; et al. Randomized, phase III trial of panitumumab with infusional fluorouracil, leucovorin, and oxaliplatin (FOLFOX4) versus FOLFOX4 alone as first-line treatment in patients with previously untreated metastatic colorectal cancer: The PRIME study. J. Clin. Oncol. 2010, 28, 4697–4705. [Google Scholar] [CrossRef]
- Hurwitz, H.; Fehrenbacher, L.; Novotny, W.; Cartwright, T.; Hainsworth, J.; Heim, W.; Berlin, J.; Baron, A.; Griffing, S.; Holmgren, E.; et al. Bevacizumab plus irinotecan, fluorouracil, and leucovorin for metastatic colorectal cancer. N. Engl. J. Med. 2004, 350, 2335–2342. [Google Scholar] [CrossRef]
- Alberts, S.R.; Sargent, D.J.; Nair, S.; Mahoney, M.R.; Mooney, M.; Thibodeau, S.N.; Smyrk, T.C.; Sinicrope, F.A.; Chan, E.; Gill, S.; et al. Effect of oxaliplatin, fluorouracil, and leucovorin with or without cetuximab on survival among patients with resected stage III colon cancer: A randomized trial. JAMA 2012, 307, 1383–1393. [Google Scholar]
- de Gramont, A.; Van Cutsem, E.; Schmoll, H.J.; Tabernero, J.; Clarke, S.; Moore, M.J.; Cunningham, D.; Cartwright, T.H.; Hecht, J.R.; Rivera, F.; et al. Bevacizumab plus oxaliplatin-based chemotherapy as adjuvant treatment for colon cancer (AVANT): A phase 3 randomised controlled trial. Lancet Oncol. 2012, 13, 1225–1233. [Google Scholar] [CrossRef]
- Buettner, R.; Mora, L.B.; Jove, R. Activated STAT signaling in human tumors provides novel molecular targets for therapeutic intervention. Clin. Cancer Res. 2002, 8, 945–954. [Google Scholar] [PubMed]
- Dauer, D.J.; Ferraro, B.; Song, L.; Yu, B.; Mora, L.; Buettner, R.; Enkemann, S.; Jove, R.; Haura, E.B. Stat3 regulates genes common to both wound healing and cancer. Oncogene 2005, 24, 3397–3408. [Google Scholar] [CrossRef] [PubMed] [Green Version]
- Bromberg, J.F.; Wrzeszczynska, M.H.; Devgan, G.; Zhao, Y.; Pestell, R.G.; Albanese, C.; Darnell, J.E., Jr. Stat3 as an oncogene. Cell 1999, 98, 295–303. [Google Scholar] [CrossRef]
- Corvinus, F.M.; Orth, C.; Moriggl, R.; Tsareva, S.A.; Wagner, S.; Pfitzner, E.B.; Baus, D.; Kaufmann, R.; Huber, L.A.; Zatloukal, K.; et al. Persistent STAT3 activation in colon cancer is associated with enhanced cell proliferation and tumor growth. Neoplasia 2005, 7, 545–555. [Google Scholar] [CrossRef] [PubMed]
- Scaltriti, M.; Baselga, J. The epidermal growth factor receptor pathway: A model for targeted therapy. Clin. Cancer Res. 2006, 12, 5268–5272. [Google Scholar] [CrossRef] [PubMed]
- Ung, N.; Putoczki, T.L.; Stylli, S.S.; Ng, I.; Mariadason, J.M.; Chan, T.A.; Zhu, H.J.; Luwor, R.B. Anti-EGFR therapeutic efficacy correlates directly with inhibition of STAT3 activity. Cancer Biol. Ther. 2014, 15, 623–632. [Google Scholar] [CrossRef] [Green Version]
- Putoczki, T.L.; Thiem, S.; Loving, A.; Busuttil, R.A.; Wilson, N.J.; Ziegler, P.K.; Nguyen, P.M.; Preaudet, A.; Farid, R.; Edwards, K.M.; et al. Interleukin-11 is the dominant IL-6 family cytokine during gastrointestinal tumorigenesis and can be targeted therapeutically. Cancer Cell 2013, 24, 257–271. [Google Scholar] [CrossRef]
- Guschin, D.; Rogers, N.; Briscoe, J.; Witthuhn, B.; Watling, D.; Horn, F.; Pellegrini, S.; Yasukawa, K.; Heinrich, P.; Stark, G.R.; et al. A major role for the protein tyrosine kinase JAK1 in the JAK/STAT signal transduction pathway in response to interleukin-6. EMBO J. 1995, 14, 1421–1429. [Google Scholar] [CrossRef]
- Yu, C.L.; Meyer, D.J.; Campbell, G.S.; Larner, A.C.; Carter-Su, C.; Schwartz, J.; Jove, R. Enhanced DNA-binding activity of a Stat3-related protein in cells transformed by the Src oncoprotein. Science 1995, 269, 81–83. [Google Scholar] [CrossRef]
- Bendell, J.C.; Hong, D.S.; Burris, H.A., 3rd; Naing, A.; Jones, S.F.; Falchook, G.; Bricmont, P.; Elekes, A.; Rock, E.P.; Kurzrock, R. Phase 1, open-label, dose-escalation, and pharmacokinetic study of STAT3 inhibitor OPB-31121 in subjects with advanced solid tumors. Cancer Chemother. Pharmacol. 2014, 74, 125–130. [Google Scholar] [CrossRef]
- Sen, M.; Thomas, S.M.; Kim, S.; Yeh, J.I.; Ferris, R.L.; Johnson, J.T.; Duvvuri, U.; Lee, J.; Sahu, N.; Joyce, S.; et al. First-in-human trial of a STAT3 decoy oligonucleotide in head and neck tumors: Implications for cancer therapy. Cancer Discov. 2012, 2, 694–705. [Google Scholar] [CrossRef] [PubMed]
- Barosi, G.; Rosti, V.; Gale, R.P. Critical appraisal of the role of ruxolitinib in myeloproliferative neoplasm-associated myelofibrosis. Onco Targets Ther. 2015, 8, 1091–1102. [Google Scholar] [CrossRef] [PubMed]
- Sharma, M.R.; Wroblewski, K.; Polite, B.N.; Knost, J.A.; Wallace, J.A.; Modi, S.; Sleckman, B.G.; Taber, D.; Vokes, E.E.; Stadler, W.M.; et al. Dasatinib in previously treated metastatic colorectal cancer: A phase II trial of the University of Chicago Phase II Consortium. Investig. New Drugs 2012, 30, 1211–1215. [Google Scholar] [CrossRef] [PubMed]
- Lee, H.J.; Zhuang, G.; Cao, Y.; Du, P.; Kim, H.J.; Settleman, J. Drug resistance via feedback activation of Stat3 in oncogene-addicted cancer cells. Cancer Cell 2014, 26, 207–221. [Google Scholar] [CrossRef] [PubMed]
- Lee, J.S.; Kang, J.H.; Boo, H.J.; Hwang, S.J.; Hong, S.; Lee, S.C.; Park, Y.J.; Chung, T.M.; Youn, H.; Lee, S.M.; et al. STAT3-mediated IGF-2 secretion in the tumour microenvironment elicits innate resistance to anti-IGF-1R antibody. Nat. Commun. 2015, 6, 8499. [Google Scholar] [CrossRef] [PubMed] [Green Version]
- Druker, B.J.; Guilhot, F.; O’Brien, S.G.; Gathmann, I.; Kantarjian, H.; Gattermann, N.; Deininger, M.W.; Silver, R.T.; Goldman, J.M.; Stone, R.M.; et al. Five-year follow-up of patients receiving imatinib for chronic myeloid leukemia. N. Engl. J. Med. 2006, 355, 2408–2417. [Google Scholar] [CrossRef] [PubMed]
- Druker, B.J.; Talpaz, M.; Resta, D.J.; Peng, B.; Buchdunger, E.; Ford, J.M.; Lydon, N.B.; Kantarjian, H.; Capdeville, R.; Ohno-Jones, S.; et al. Efficacy and safety of a specific inhibitor of the BCR-ABL tyrosine kinase in chronic myeloid leukemia. N. Engl. J. Med. 2001, 344, 1031–1037. [Google Scholar] [CrossRef]
- Druker, B.J.; Tamura, S.; Buchdunger, E.; Ohno, S.; Segal, G.M.; Fanning, S.; Zimmermann, J.; Lydon, N.B. Effects of a selective inhibitor of the Abl tyrosine kinase on the growth of Bcr-Abl positive cells. Nat. Med. 1996, 2, 561–566. [Google Scholar] [CrossRef]
- Shah, N.P.; Tran, C.; Lee, F.Y.; Chen, P.; Norris, D.; Sawyers, C.L. Overriding imatinib resistance with a novel ABL kinase inhibitor. Science 2004, 305, 399–401. [Google Scholar] [CrossRef]
- Weisberg, E.; Manley, P.W.; Breitenstein, W.; Bruggen, J.; Cowan-Jacob, S.W.; Ray, A.; Huntly, B.; Fabbro, D.; Fendrich, G.; Hall-Meyers, E.; et al. Characterization of AMN107, a selective inhibitor of native and mutant Bcr-Abl. Cancer Cell 2005, 7, 129–141. [Google Scholar] [CrossRef] [Green Version]
- Gozgit, J.M.; Wong, M.J.; Moran, L.; Wardwell, S.; Mohemmad, Q.K.; Narasimhan, N.I.; Shakespeare, W.C.; Wang, F.; Clackson, T.; Rivera, V.M. Ponatinib (AP24534), a multitargeted pan-FGFR inhibitor with activity in multiple FGFR-amplified or mutated cancer models. Mol. Cancer Ther. 2012, 11, 690–699. [Google Scholar] [CrossRef] [PubMed]
- O’Hare, T.; Shakespeare, W.C.; Zhu, X.; Eide, C.A.; Rivera, V.M.; Wang, F.; Adrian, L.T.; Zhou, T.; Huang, W.S.; Xu, Q.; et al. AP24534, a pan-BCR-ABL inhibitor for chronic myeloid leukemia, potently inhibits the T315I mutant and overcomes mutation-based resistance. Cancer Cell 2009, 16, 401–412. [Google Scholar] [CrossRef] [PubMed]
- Cortes, J.E.; Kantarjian, H.; Shah, N.P.; Bixby, D.; Mauro, M.J.; Flinn, I.; O’Hare, T.; Hu, S.; Narasimhan, N.I.; Rivera, V.M.; et al. Ponatinib in refractory Philadelphia chromosome-positive leukemias. N. Engl. J. Med. 2012, 367, 2075–2088. [Google Scholar] [CrossRef]
- Cortes, J.E.; Kim, D.W.; Pinilla-Ibarz, J.; le Coutre, P.; Paquette, R.; Chuah, C.; Nicolini, F.E.; Apperley, J.F.; Khoury, H.J.; Talpaz, M.; et al. A phase 2 trial of ponatinib in Philadelphia chromosome-positive leukemias. N. Engl. J. Med. 2013, 369, 1783–1796. [Google Scholar] [CrossRef] [PubMed]
- Hinde, E.; Pandzic, E.; Yang, Z.; Ng, I.H.; Jans, D.A.; Bogoyevitch, M.A.; Gratton, E.; Gaus, K. Quantifying the dynamics of the oligomeric transcription factor STAT3 by pair correlation of molecular brightness. Nat. Commun. 2016, 7, 11047. [Google Scholar] [CrossRef] [PubMed] [Green Version]
- Lin, W.W.; Karin, M. A cytokine-mediated link between innate immunity, inflammation, and cancer. J. Clin. Investig. 2007, 117, 1175–1183. [Google Scholar] [CrossRef] [PubMed] [Green Version]
- Jonker, D.J.; Nott, L.; Yoshino, T.; Gill, S.; Shapiro, J.; Ohtsu, A.; Zalcberg, J.; Vickers, M.M.; Wei, A.C.; Gao, Y.; et al. Napabucasin versus placebo in refractory advanced colorectal cancer: A randomised phase 3 trial. Lancet Gastroenterol. Hepatol. 2018, 3, 263–270. [Google Scholar] [CrossRef]
- Spano, J.P.; Lagorce, C.; Atlan, D.; Milano, G.; Domont, J.; Benamouzig, R.; Attar, A.; Benichou, J.; Martin, A.; Morere, J.F.; et al. Impact of EGFR expression on colorectal cancer patient prognosis and survival. Ann. Oncol. 2005, 16, 102–108. [Google Scholar] [CrossRef] [PubMed] [Green Version]
- Xu, M.J.; Johnson, D.E.; Grandis, J.R. EGFR-targeted therapies in the post-genomic era. Cancer Metastasis Rev. 2017, 36, 463–473. [Google Scholar] [CrossRef] [PubMed]
- Kim, S.M.; Kwon, O.J.; Hong, Y.K.; Kim, J.H.; Solca, F.; Ha, S.J.; Soo, R.A.; Christensen, J.G.; Lee, J.H.; Cho, B.C. Activation of IL-6R/JAK1/STAT3 signaling induces de novo resistance to irreversible EGFR inhibitors in non-small cell lung cancer with T790M resistance mutation. Mol. Cancer Ther. 2012, 11, 2254–2264. [Google Scholar] [CrossRef]
- Stanam, A.; Love-Homan, L.; Joseph, T.S.; Espinosa-Cotton, M.; Simons, A.L. Upregulated interleukin-6 expression contributes to erlotinib resistance in head and neck squamous cell carcinoma. Mol. Oncol. 2015, 9, 1371–1383. [Google Scholar] [CrossRef] [PubMed]
- De Falco, V.; Buonocore, P.; Muthu, M.; Torregrossa, L.; Basolo, F.; Billaud, M.; Gozgit, J.M.; Carlomagno, F.; Santoro, M. Ponatinib (AP24534) is a novel potent inhibitor of oncogenic RET mutants associated with thyroid cancer. J. Clin. Endocrinol. Metab. 2013, 98, E811–E819. [Google Scholar] [CrossRef] [PubMed]
- Katagiri, S.; Tauchi, T.; Okabe, S.; Minami, Y.; Kimura, S.; Maekawa, T.; Naoe, T.; Ohyashiki, K. Combination of ponatinib with Hedgehog antagonist vismodegib for therapy-resistant BCR-ABL1-positive leukemia. Clin. Cancer Res. 2013, 19, 1422–1432. [Google Scholar] [CrossRef] [PubMed]
- Zhou, T.; Commodore, L.; Huang, W.S.; Wang, Y.; Thomas, M.; Keats, J.; Xu, Q.; Rivera, V.M.; Shakespeare, W.C.; Clackson, T.; et al. Structural mechanism of the Pan-BCR-ABL inhibitor ponatinib (AP24534): Lessons for overcoming kinase inhibitor resistance. Chem. Biol. Drug Des. 2011, 77, 1–11. [Google Scholar] [CrossRef] [PubMed]
- Gozgit, J.M.; Wong, M.J.; Wardwell, S.; Tyner, J.W.; Loriaux, M.M.; Mohemmad, Q.K.; Narasimhan, N.I.; Shakespeare, W.C.; Wang, F.; Druker, B.J.; et al. Potent activity of ponatinib (AP24534) in models of FLT3-driven acute myeloid leukemia and other hematologic malignancies. Mol. Cancer Ther. 2011, 10, 1028–1035. [Google Scholar] [CrossRef] [PubMed]
- Ren, M.; Hong, M.; Liu, G.; Wang, H.; Patel, V.; Biddinger, P.; Silva, J.; Cowell, J.; Hao, Z. Novel FGFR inhibitor ponatinib suppresses the growth of non-small cell lung cancer cells overexpressing FGFR1. Oncol. Rep. 2013, 29, 2181–2190. [Google Scholar] [CrossRef] [Green Version]
- Garner, A.P.; Gozgit, J.M.; Anjum, R.; Vodala, S.; Schrock, A.; Zhou, T.; Serrano, C.; Eilers, G.; Zhu, M.; Ketzer, J.; et al. Ponatinib inhibits polyclonal drug-resistant KIT oncoproteins and shows therapeutic potential in heavily pretreated gastrointestinal stromal tumor (GIST) patients. Clin. Cancer Res. 2014, 20, 5745–5755. [Google Scholar] [CrossRef]
- Gautschi, O.; Milia, J.; Filleron, T.; Wolf, J.; Carbone, D.P.; Owen, D.; Camidge, R.; Narayanan, V.; Doebele, R.C.; Besse, B.; et al. Targeting RET in Patients With RET-Rearranged Lung Cancers: Results From the Global, Multicenter RET Registry. J. Clin. Oncol. 2017, 35, 1403–1410. [Google Scholar] [CrossRef]
- Fauster, A.; Rebsamen, M.; Huber, K.V.; Bigenzahn, J.W.; Stukalov, A.; Lardeau, C.H.; Scorzoni, S.; Bruckner, M.; Gridling, M.; Parapatics, K.; et al. A cellular screen identifies ponatinib and pazopanib as inhibitors of necroptosis. Cell Death Dis. 2015, 6, e1767. [Google Scholar] [CrossRef]
- Klaeger, S.; Heinzlmeir, S.; Wilhelm, M.; Polzer, H.; Vick, B.; Koenig, P.A.; Reinecke, M.; Ruprecht, B.; Petzoldt, S.; Meng, C.; et al. The target landscape of clinical kinase drugs. Science 2017, 358, eaan4368. [Google Scholar] [CrossRef]
- Aguirre-Gamboa, R.; Gomez-Rueda, H.; Martinez-Ledesma, E.; Martinez-Torteya, A.; Chacolla-Huaringa, R.; Rodriguez-Barrientos, A.; Tamez-Pena, J.G.; Trevino, V. SurvExpress: An online biomarker validation tool and database for cancer gene expression data using survival analysis. PLoS ONE 2013, 8, e74250. [Google Scholar] [CrossRef] [PubMed]
- Mouradov, D.; Sloggett, C.; Jorissen, R.N.; Love, C.G.; Li, S.; Burgess, A.W.; Arango, D.; Strausberg, R.L.; Buchanan, D.; Wormald, S.; et al. Colorectal cancer cell lines are representative models of the main molecular subtypes of primary cancer. Cancer Res. 2014, 74, 3238–3247. [Google Scholar] [CrossRef] [PubMed]
- Giraud, J.; Failla, L.M.; Pascussi, J.M.; Lagerqvist, E.L.; Ollier, J.; Finetti, P.; Bertucci, F.; Ya, C.; Gasmi, I.; Bourgaux, J.F.; et al. Autocrine Secretion of Progastrin Promotes the Survival and Self-Renewal of Colon Cancer Stem-like Cells. Cancer Res. 2016, 76, 3618–3628. [Google Scholar] [CrossRef] [PubMed] [Green Version]
- Planque, C.; Rajabi, F.; Grillet, F.; Finetti, P.; Bertucci, F.; Gironella, M.; Lozano, J.J.; Beucher, B.; Giraud, J.; Garambois, V.; et al. Pregnane X-receptor promotes stem cell-mediated colon cancer relapse. Oncotarget 2016, 7, 56558–56573. [Google Scholar] [CrossRef] [Green Version]
- Livak, K.J.; Schmittgen, T.D. Analysis of relative gene expression data using real-time quantitative PCR and the 2(-Delta Delta C(T)) Method. Methods 2001, 25, 402–408. [Google Scholar] [CrossRef]
- Digman, M.A.; Dalal, R.; Horwitz, A.F.; Gratton, E. Mapping the number of molecules and brightness in the laser scanning microscope. Biophys. J. 2008, 94, 2320–2332. [Google Scholar] [CrossRef]
- Luwor, R.B.; Johns, T.G.; Murone, C.; Huang, H.J.; Cavenee, W.K.; Ritter, G.; Old, L.J.; Burgess, A.W.; Scott, A.M. Monoclonal antibody 806 inhibits the growth of tumor xenografts expressing either the de2-7 or amplified epidermal growth factor receptor (EGFR) but not wild-type EGFR. Cancer Res. 2001, 61, 5355–5361. [Google Scholar]


© 2018 by the authors. Licensee MDPI, Basel, Switzerland. This article is an open access article distributed under the terms and conditions of the Creative Commons Attribution (CC BY) license (http://creativecommons.org/licenses/by/4.0/).
Share and Cite
Tan, F.H.; Putoczki, T.L.; Lou, J.; Hinde, E.; Hollande, F.; Giraud, J.; Stylli, S.S.; Paradiso, L.; Zhu, H.-J.; Sieber, O.M.; et al. Ponatinib Inhibits Multiple Signaling Pathways Involved in STAT3 Signaling and Attenuates Colorectal Tumor Growth. Cancers 2018, 10, 526. https://doi.org/10.3390/cancers10120526
Tan FH, Putoczki TL, Lou J, Hinde E, Hollande F, Giraud J, Stylli SS, Paradiso L, Zhu H-J, Sieber OM, et al. Ponatinib Inhibits Multiple Signaling Pathways Involved in STAT3 Signaling and Attenuates Colorectal Tumor Growth. Cancers. 2018; 10(12):526. https://doi.org/10.3390/cancers10120526
Chicago/Turabian StyleTan, Fiona H., Tracy L. Putoczki, Jieqiong Lou, Elizabeth Hinde, Frédéric Hollande, Julie Giraud, Stanley S. Stylli, Lucia Paradiso, Hong-Jian Zhu, Oliver M. Sieber, and et al. 2018. "Ponatinib Inhibits Multiple Signaling Pathways Involved in STAT3 Signaling and Attenuates Colorectal Tumor Growth" Cancers 10, no. 12: 526. https://doi.org/10.3390/cancers10120526