MK2 Inhibition Induces p53-Dependent Senescence in Glioblastoma Cells

 , , , and
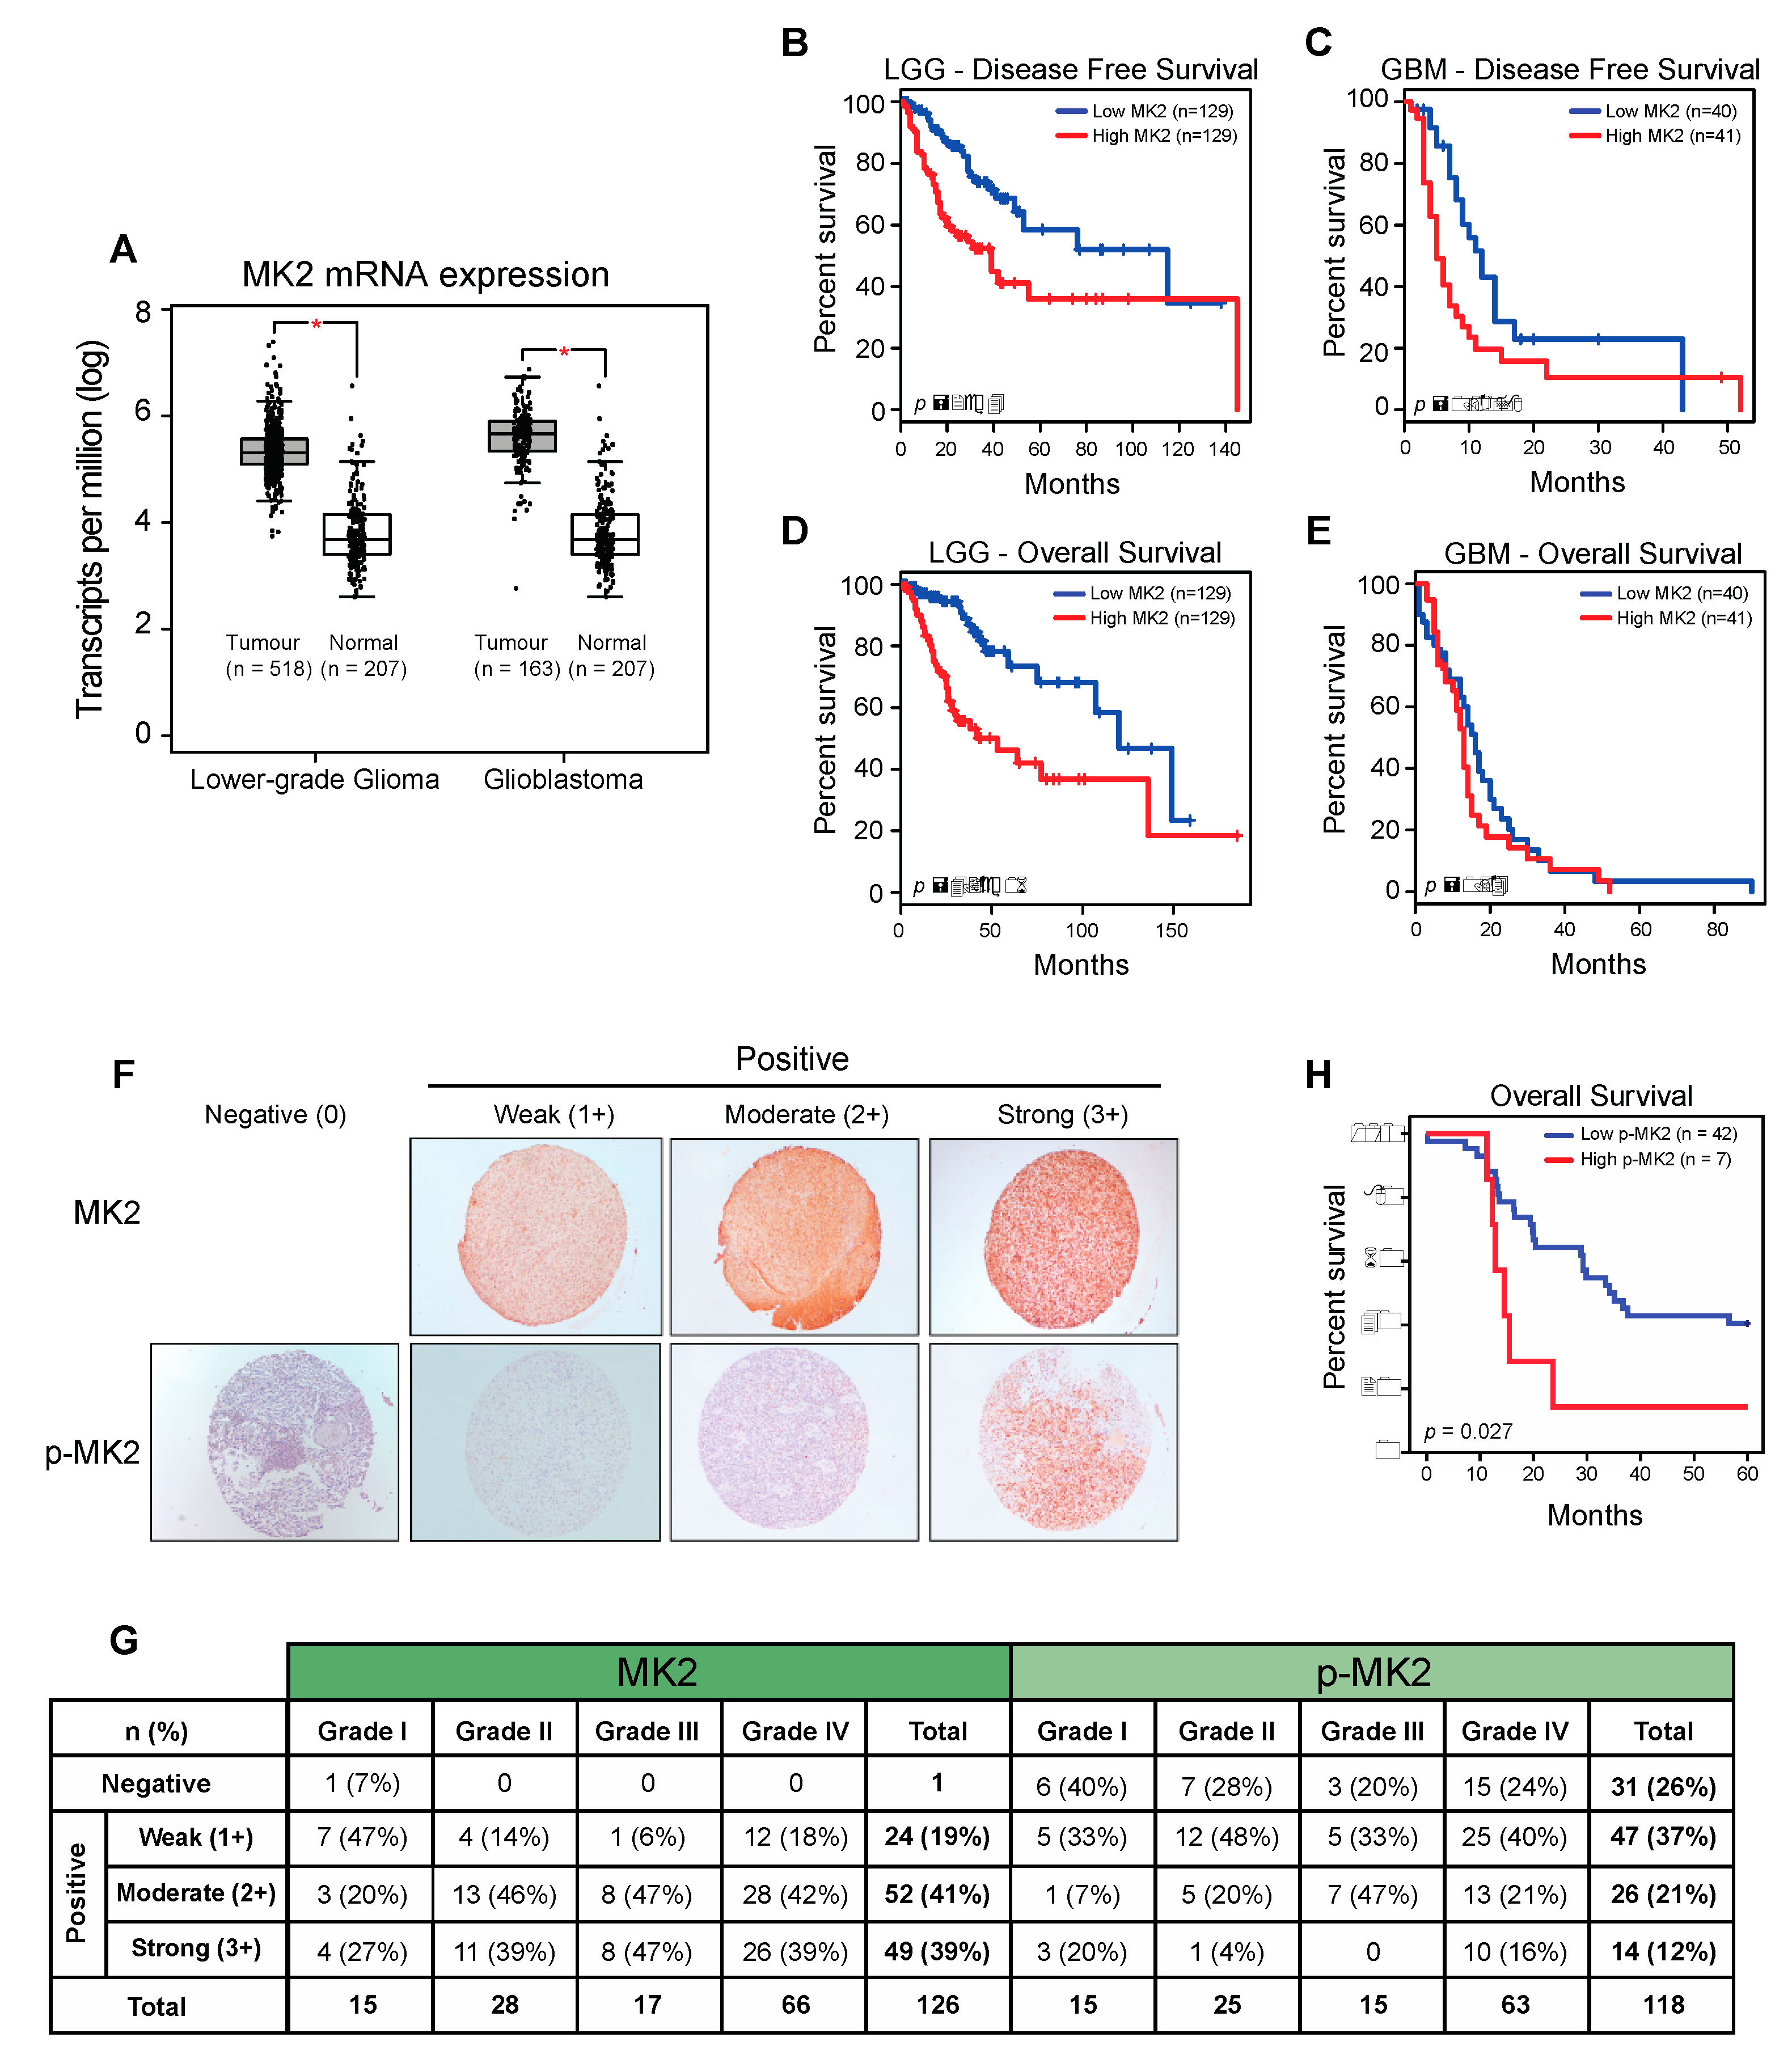
Abstract
:1. Introduction
2. Results
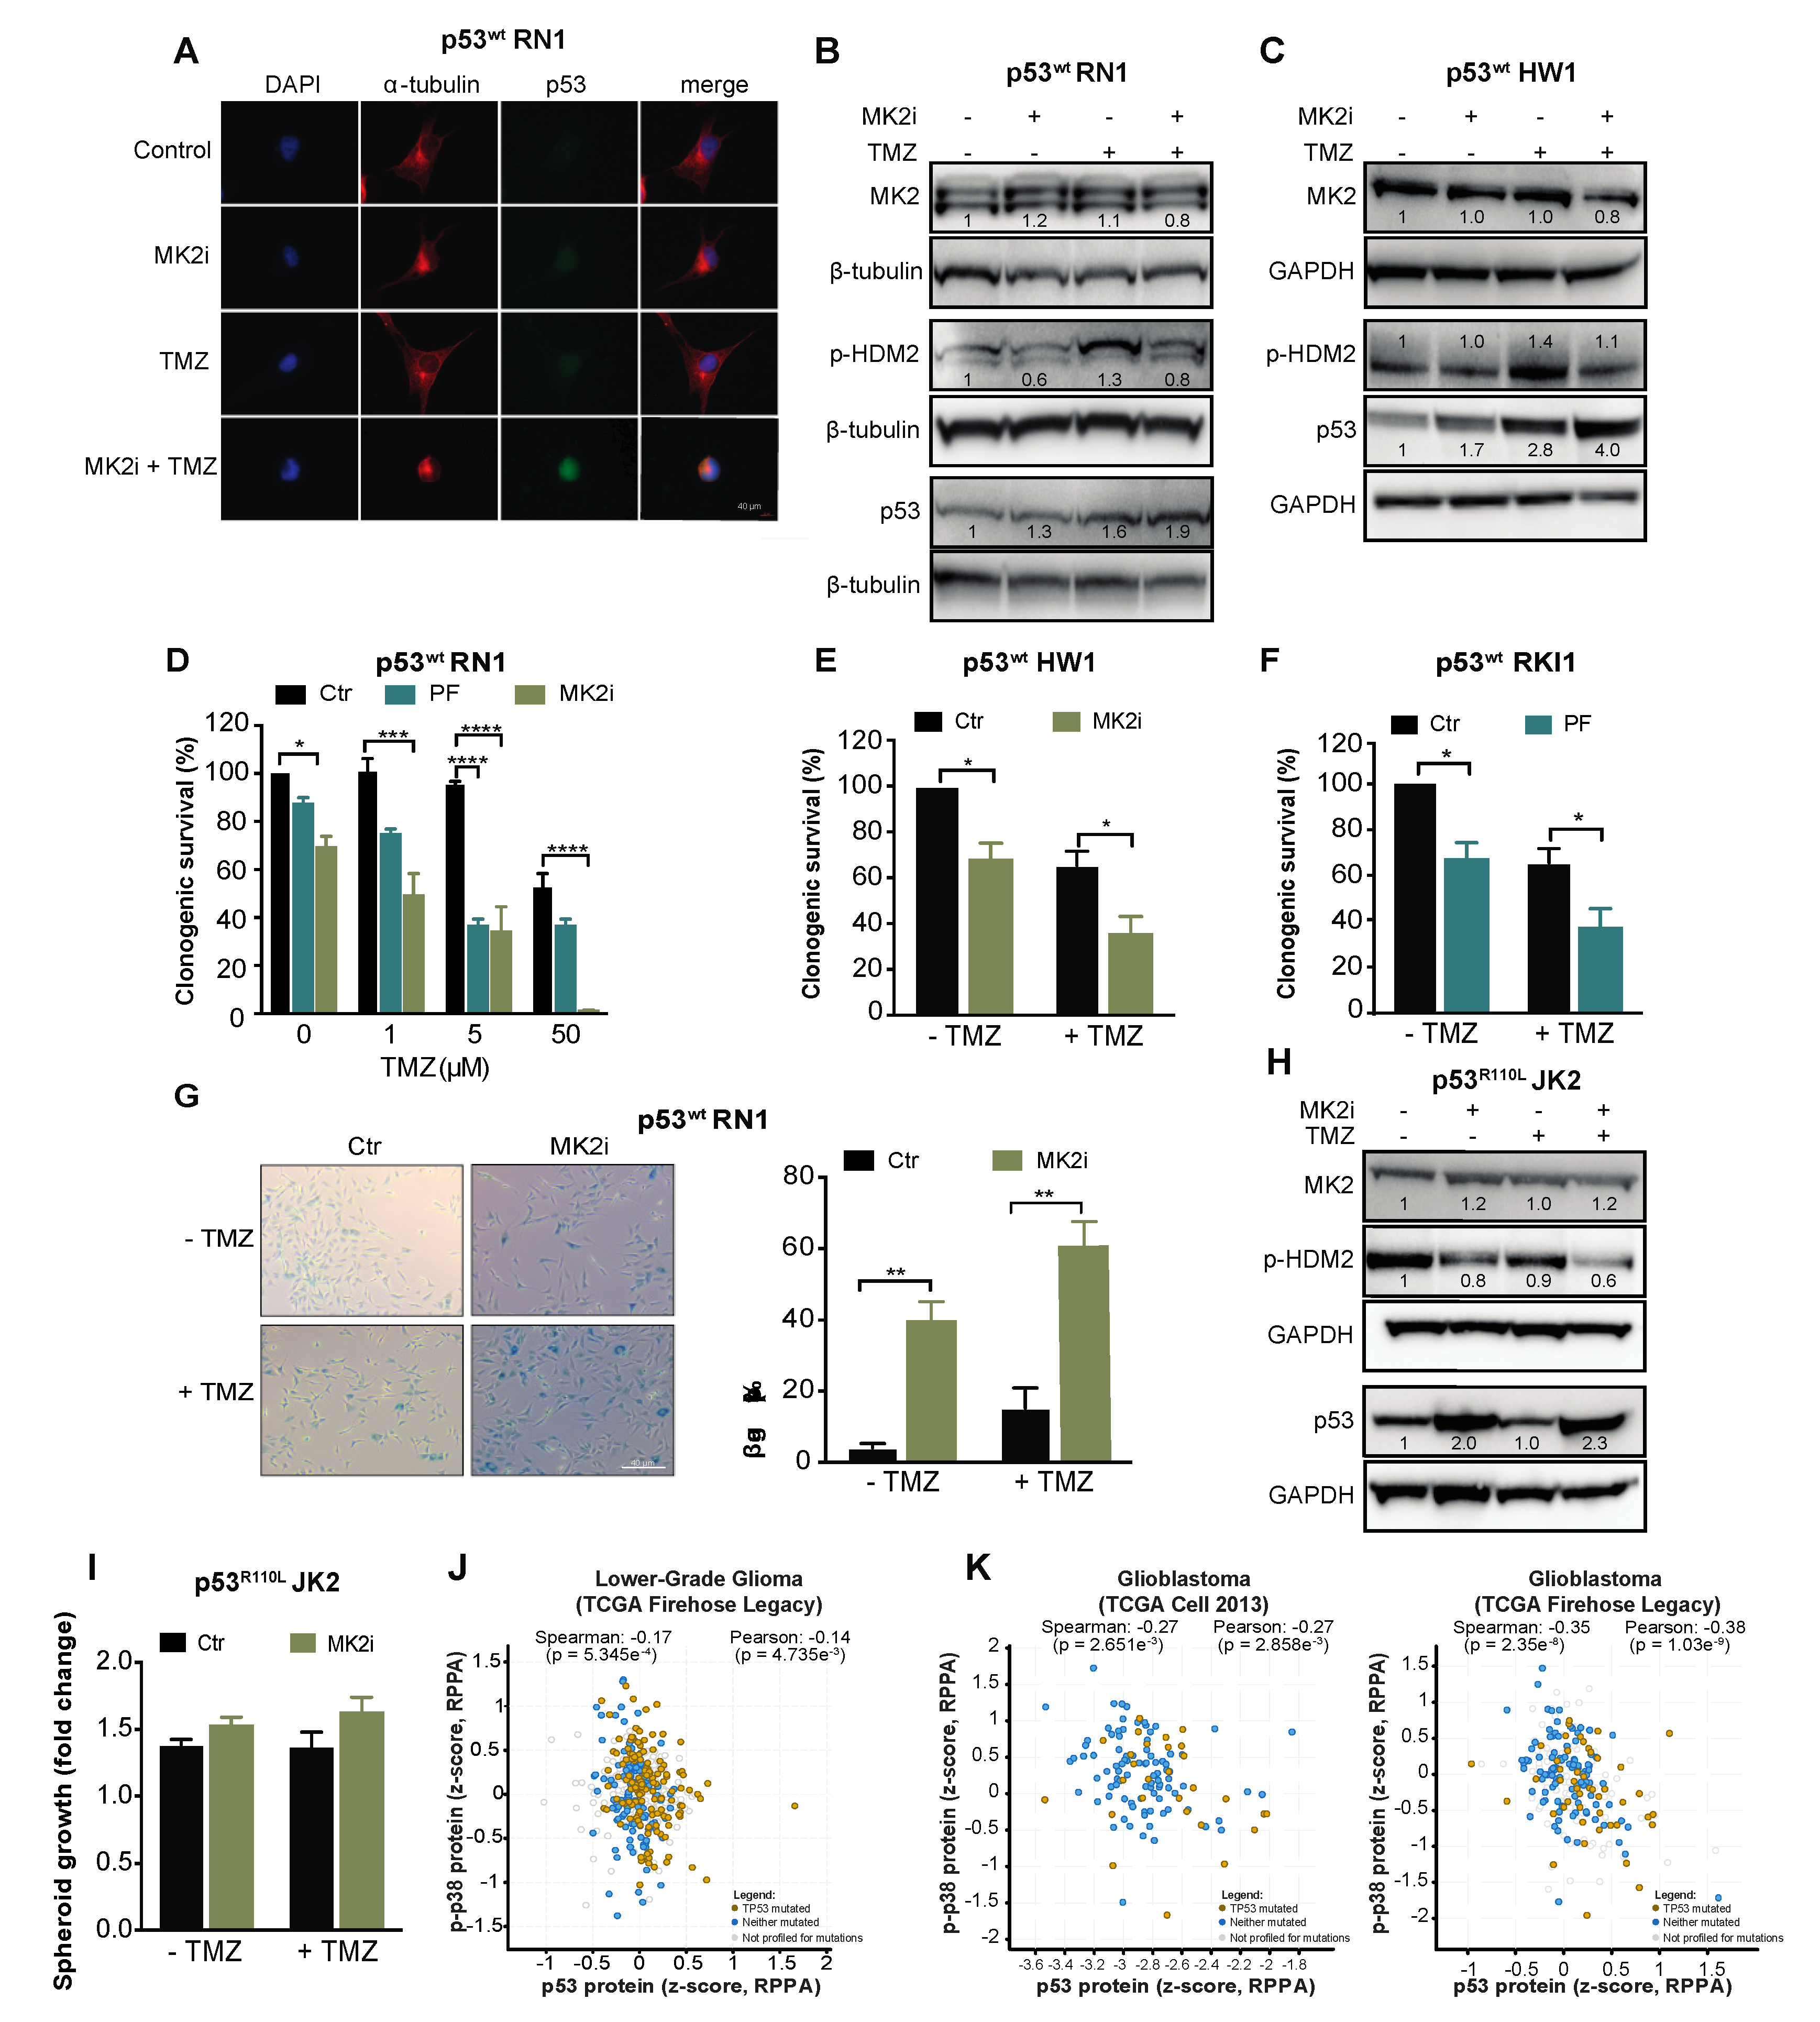
2.1. MK2 Activity Correlates with Poor Glioma Prognosis
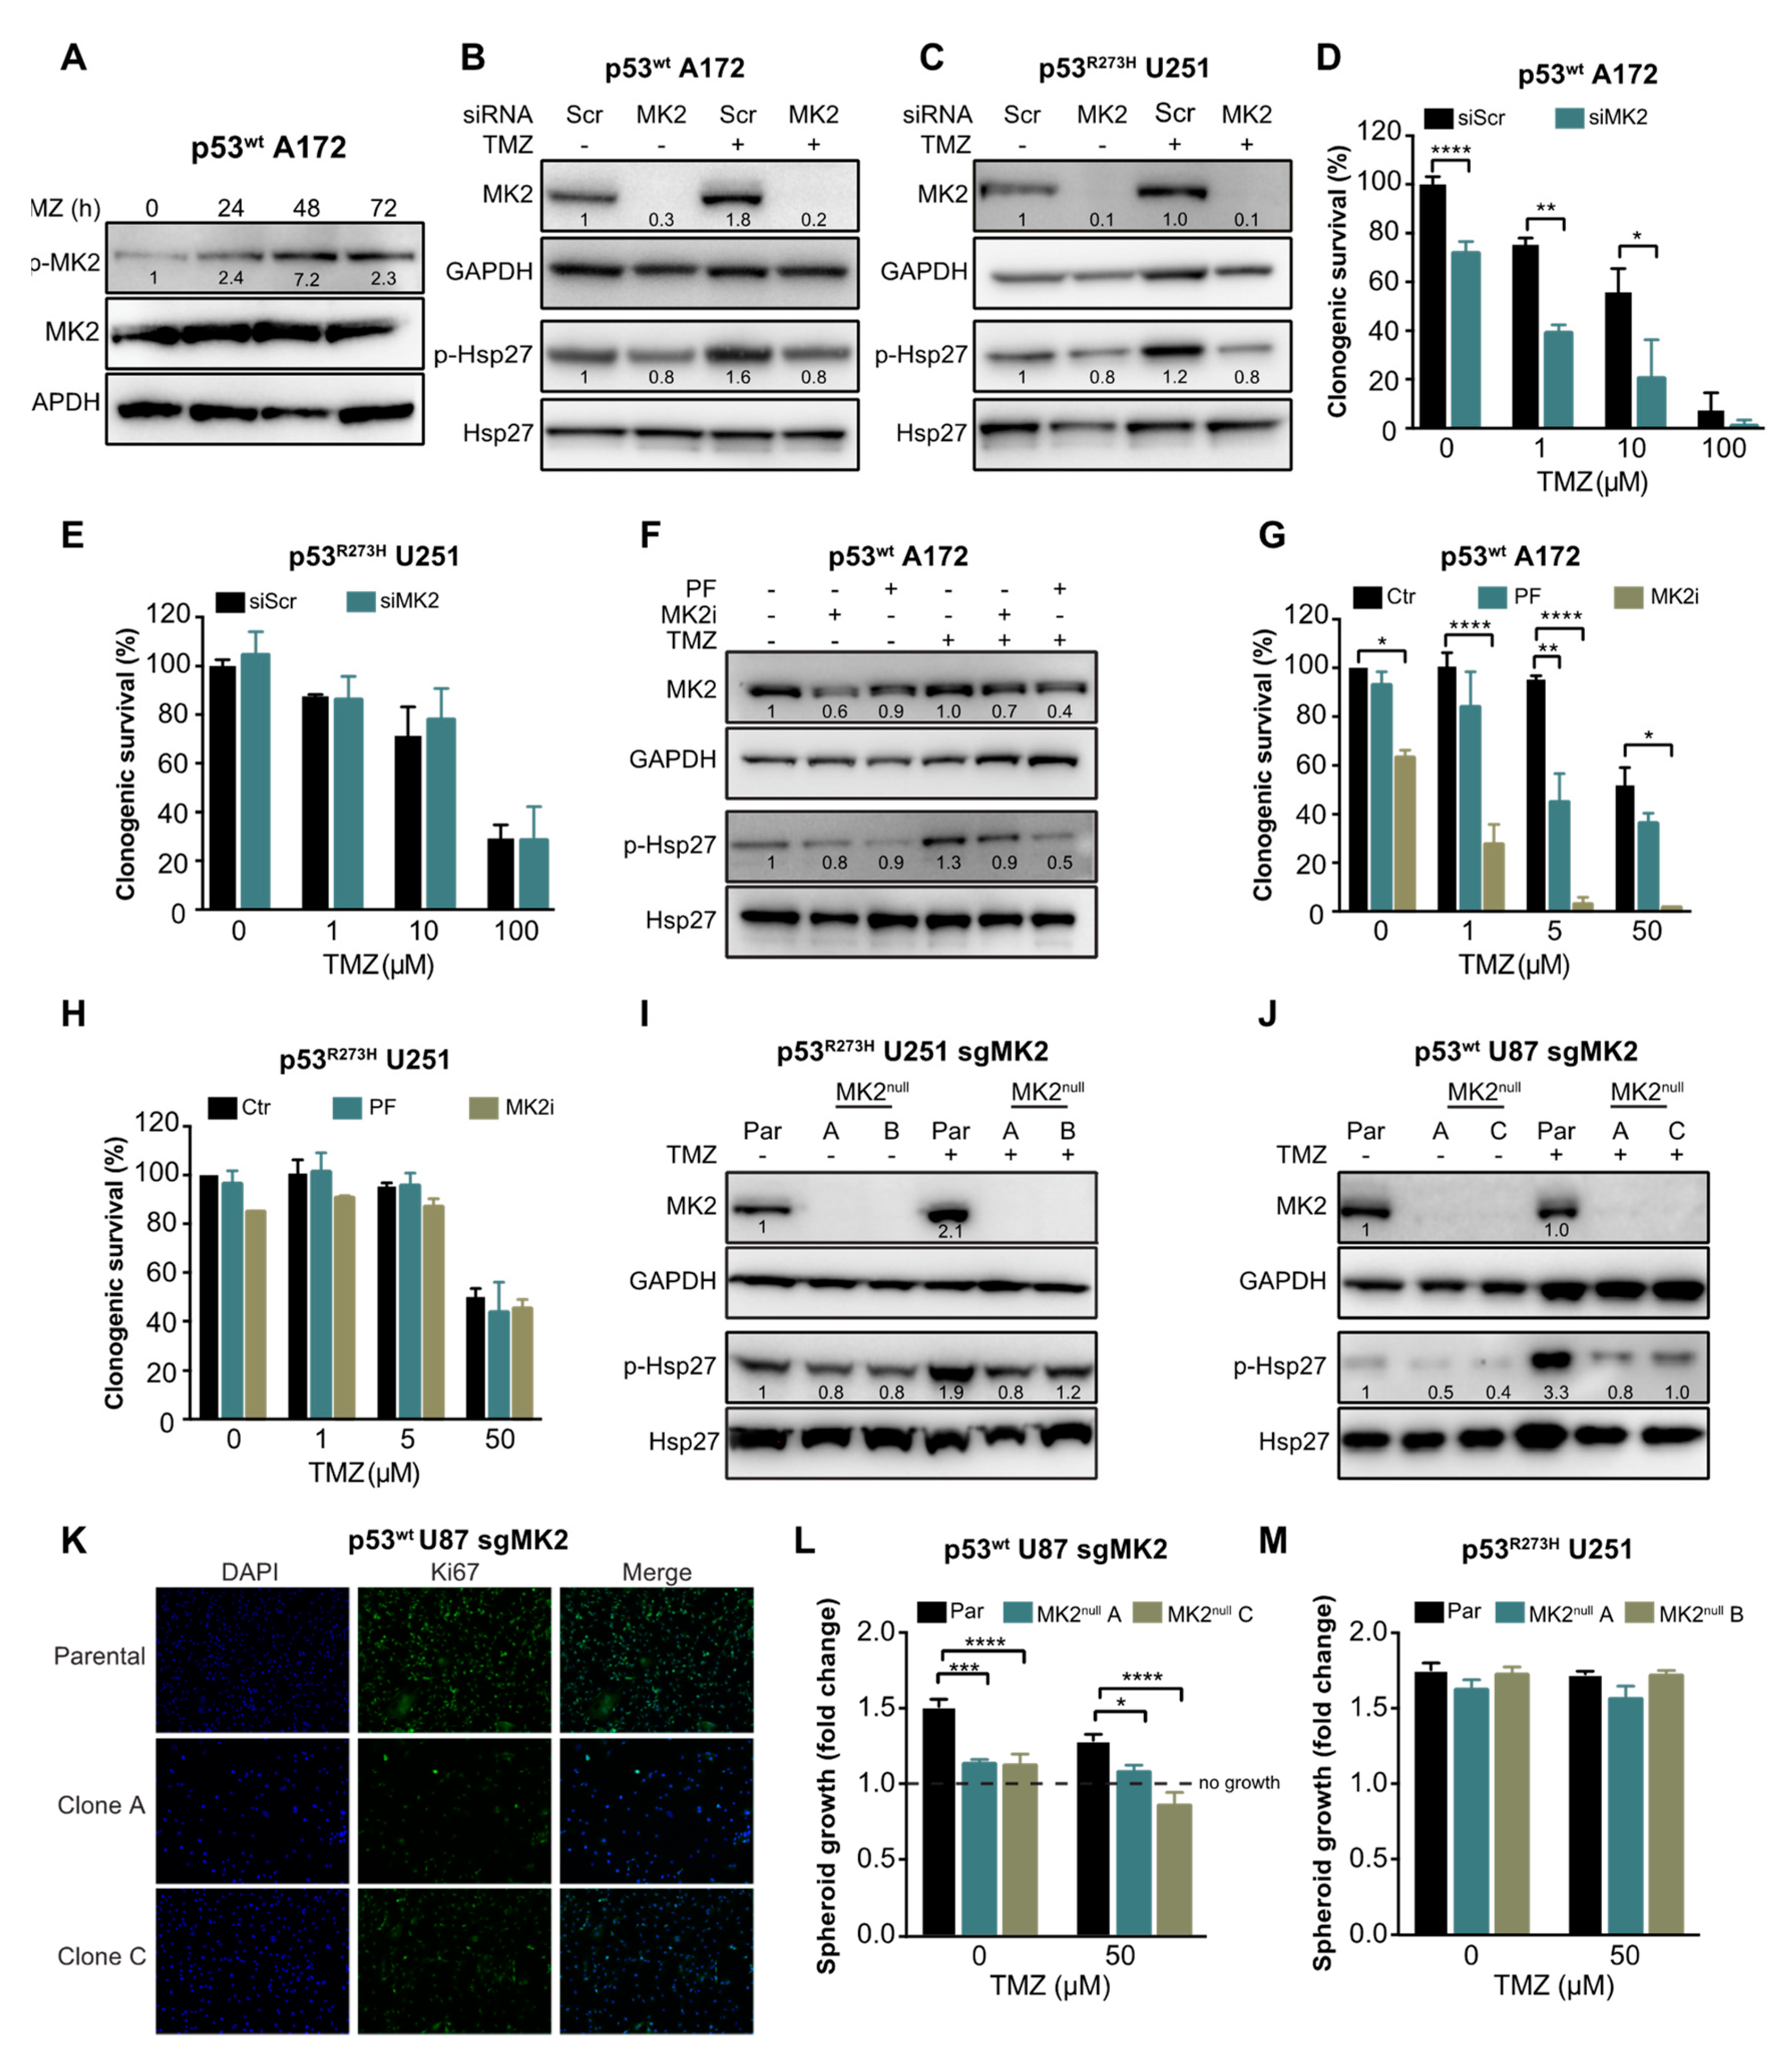
2.2. MK2 Inhibition Attenuates the Proliferation of p53wt Glioblastoma Cells
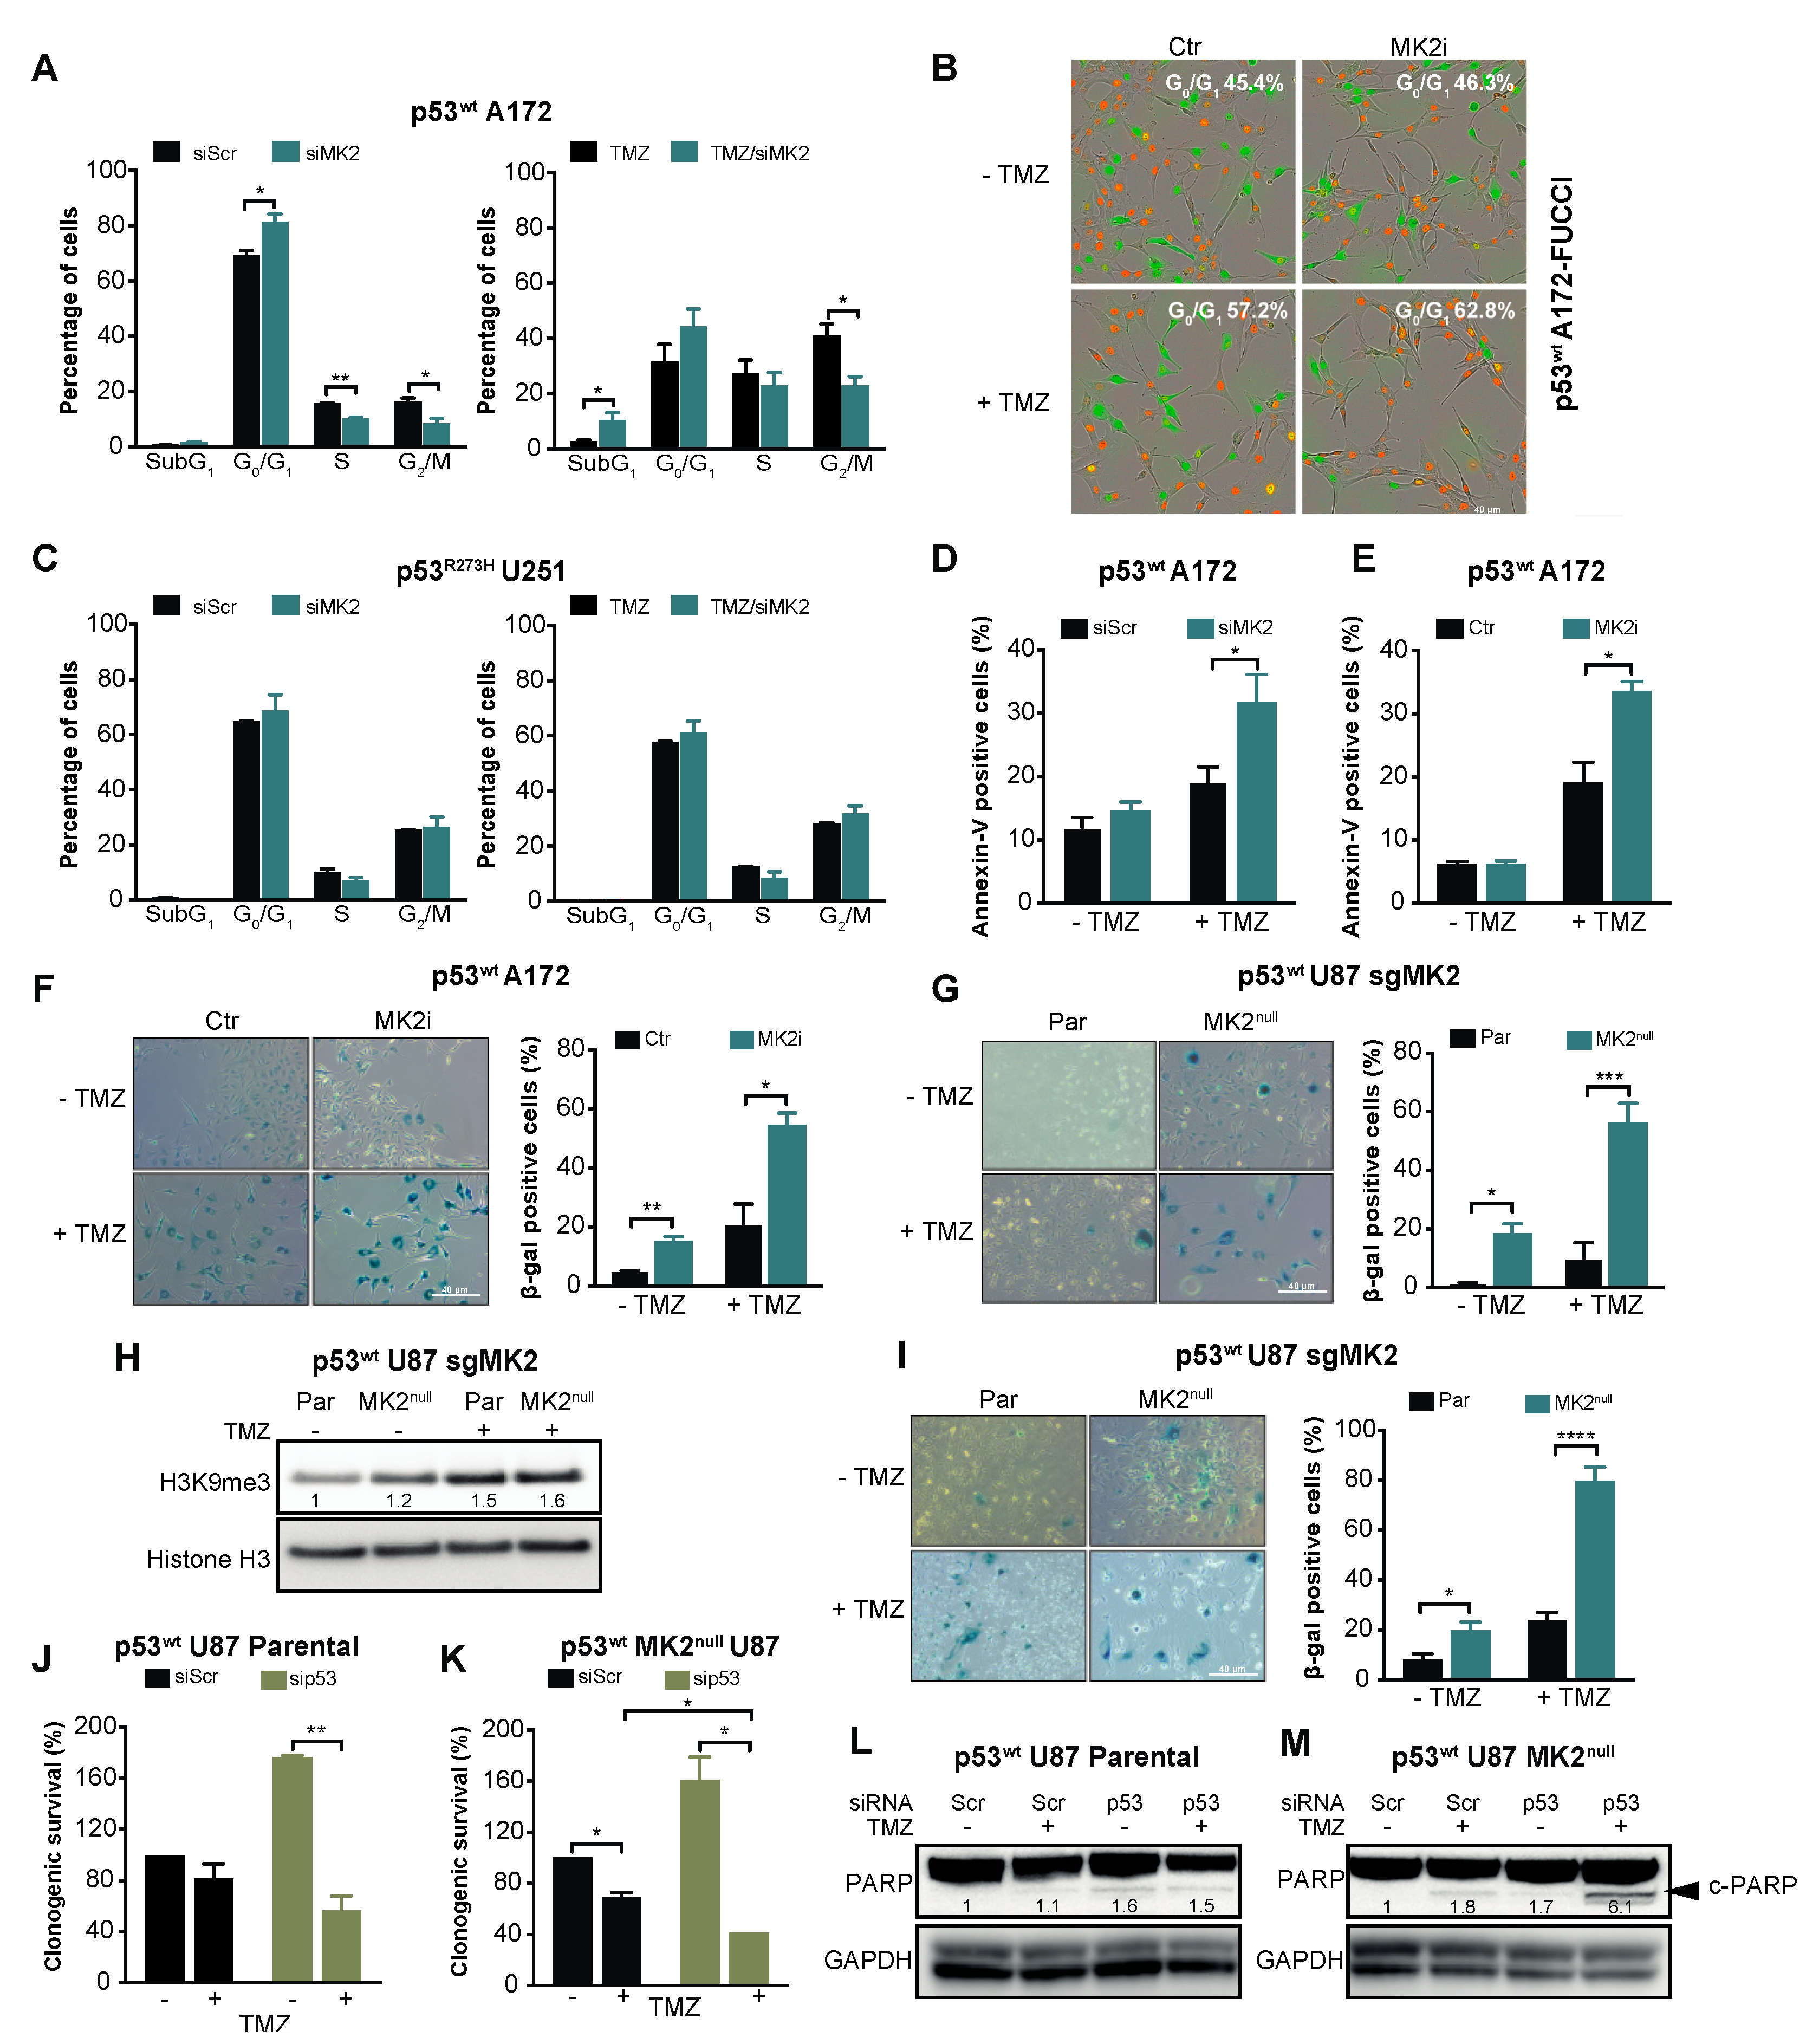
2.3. MK2 Inhibition Induces Senescence in p53wt Glioblastoma Cells
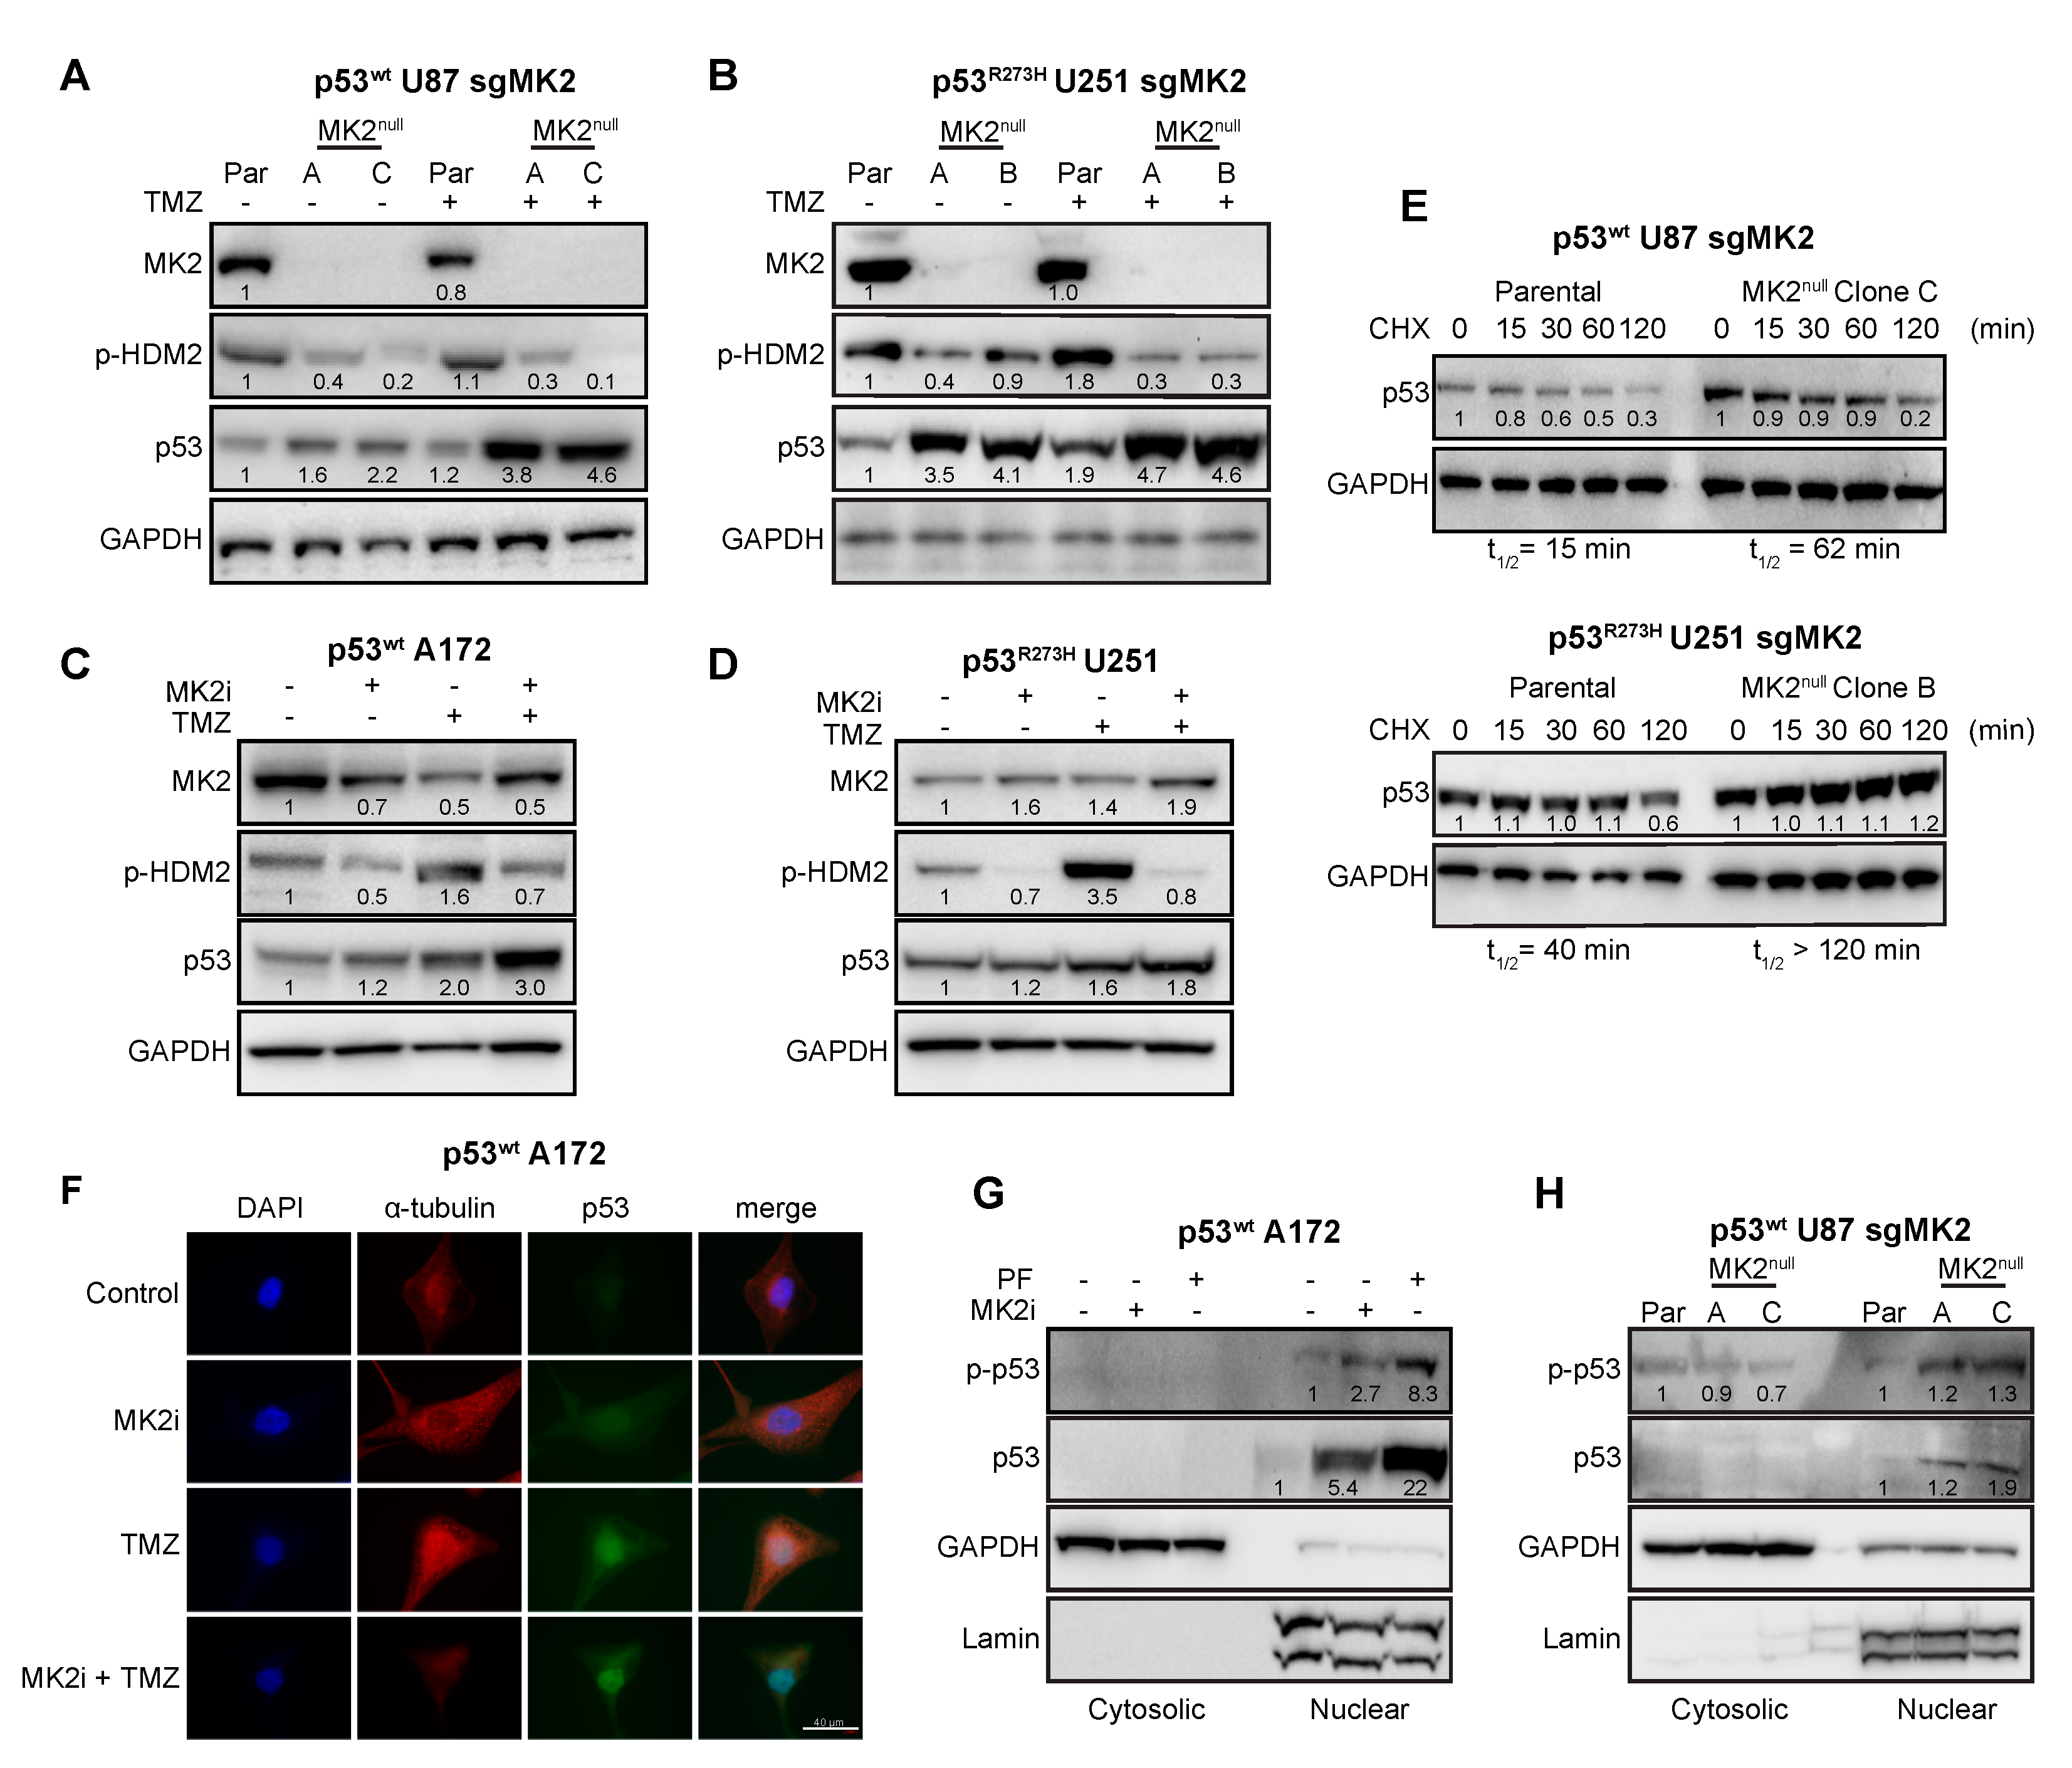
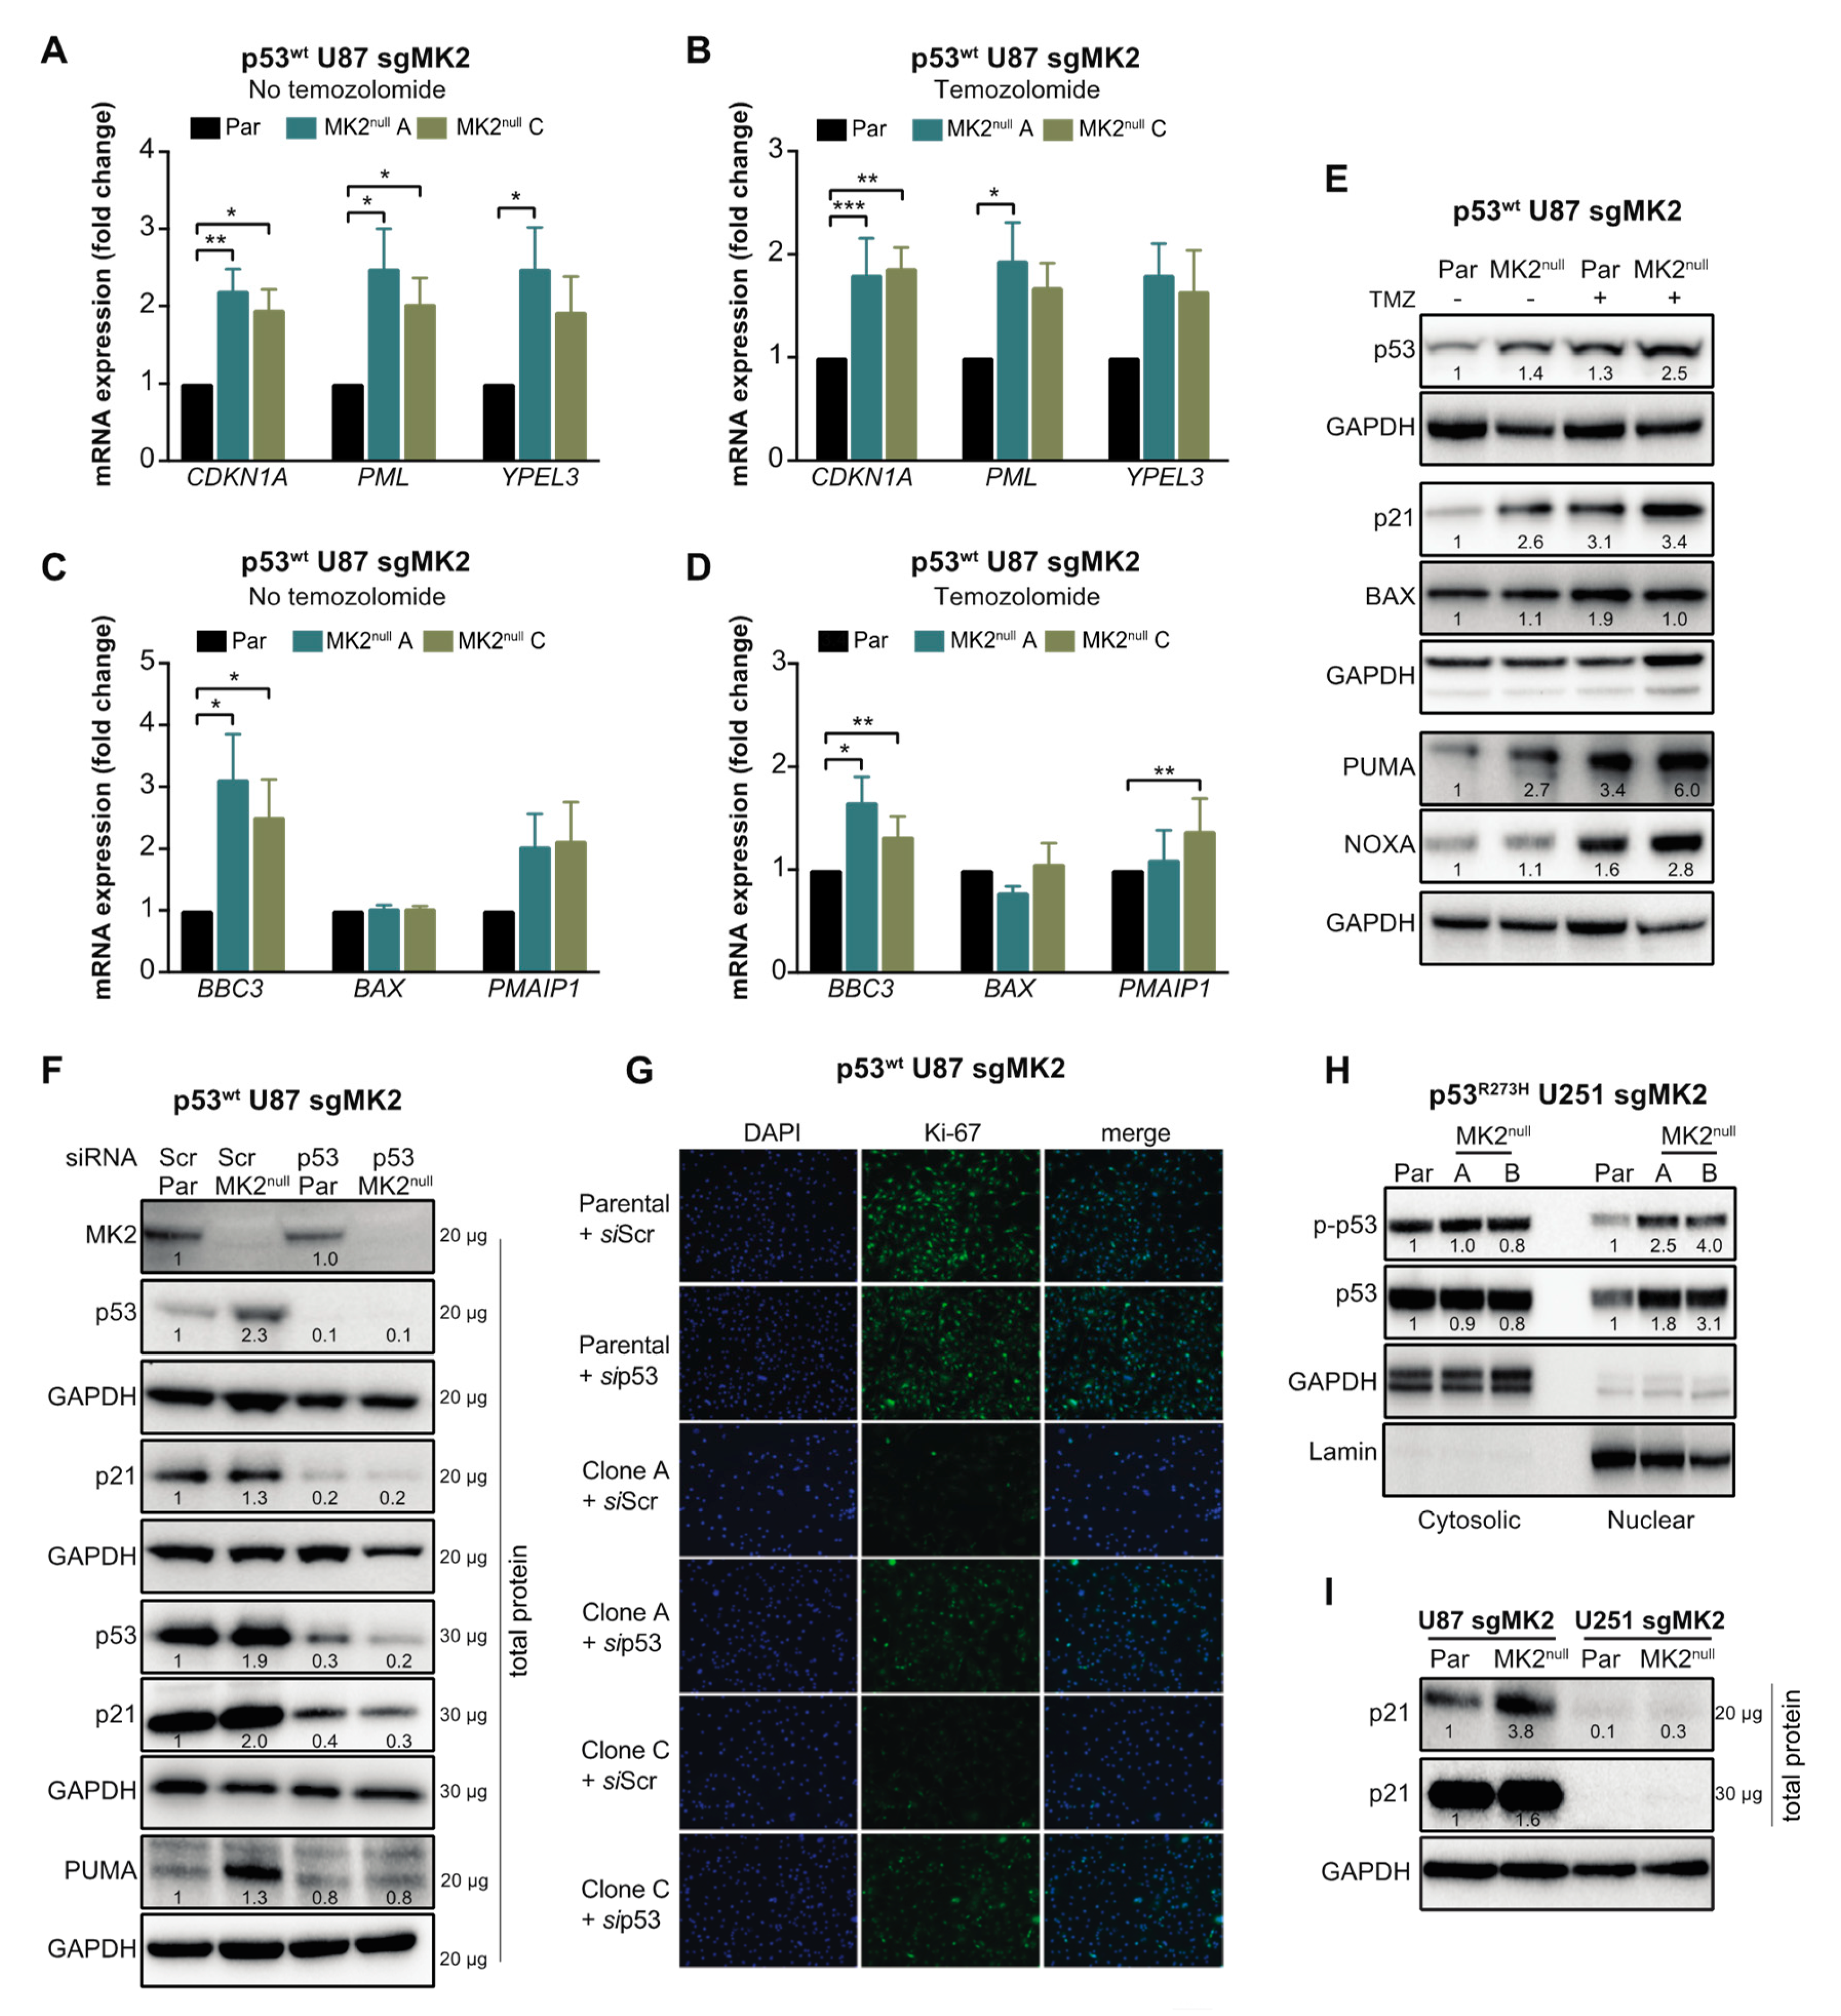
2.4. MK2 Inhibition Increases the Expression of Wild-Type and Mutated p53
2.5. p53wt Silencing Rescues the Antiproliferative Effect of MK2 Inhibition
2.6. MK2 Inhibitors Induce Senescence in p53wt Glioblastoma Stem-Like Cells
3. Discussion
4. Materials and Methods
4.1. Glioblastoma Cell Lines
4.2. Glioblastoma Stem-Like Cell Lines
4.3. siRNA Transfection
4.4. CRISPR-Cas9 Gene Editing
4.5. Antibodies
4.6. Subcellular Fractionation
4.7. Western Blotting
4.8. Flow Cytometry
4.9. Live Cell Imaging
4.10. Clonogenic Assay
4.11. Spheroid Assay
4.12. Cycloheximide-Chase Assay
4.13. qRT-PCR
4.14. β-Galactosidase Staining
4.15. Immunofluorescence
4.16. Immunohistochemistry
4.17. Statistics
5. Conclusions
Supplementary Materials
Author Contributions
Funding
Acknowledgments
Conflicts of Interest
References
- Gurgis, F.M.S.; Ziaziaris, W.; Munoz, L. Mitogen-Activated Protein Kinase–Activated Protein Kinase 2 in Neuroinflammation, Heat Shock Protein 27 Phosphorylation, and Cell Cycle: Role and Targeting. Mol. Pharmacol. 2014, 85, 345–356. [Google Scholar] [CrossRef] [PubMed] [Green Version]
- Johansen, C.; Vestergaard, C.; Kragballe, K.; Kollias, G.; Gaestel, M.; Iversen, L. MK2 regulates the early stages of skin tumor promotion. Carcinogenesis 2009, 30, 2100–2108. [Google Scholar] [CrossRef] [PubMed] [Green Version]
- Murali, B.; Ren, Q.; Luo, X.; Faget, D.V.; Wang, C.; Johnson, R.M.; Gruosso, T.; Flanagan, K.C.; Fu, Y.; Leahy, K.; et al. Inhibition of the Stromal p38MAPK/MK2 Pathway Limits Breast Cancer Metastases and Chemotherapy-Induced Bone Loss. Cancer Res. 2018, 78, 5618. [Google Scholar] [CrossRef] [PubMed] [Green Version]
- Suarez-Lopez, L.; Sriram, G.; Kong, Y.W.; Morandell, S.; Merrick, K.A.; Hernandez, Y.; Haigis, K.M.; Yaffe, M.B. MK2 contributes to tumor progression by promoting M2 macrophage polarization and tumor angiogenesis. Proc. Natl. Acad. Sci. USA 2018, 115, E4236–E4244. [Google Scholar] [CrossRef] [PubMed] [Green Version]
- Wang, L.; Yang, H.; Palmbos, P.L.; Ney, G.; Detzler, T.A.; Coleman, D.; Leflein, J.; Davis, M.; Zhang, M.; Tang, W.; et al. ATDC/TRIM29 Phosphorylation by ATM/MAPKAP Kinase 2 Mediates Radioresistance in Pancreatic Cancer Cells. Cancer Res. 2014, 74, 1778. [Google Scholar] [CrossRef] [Green Version]
- Morandell, S.; Reinhardt, H.C.; Cannell, I.G.; Kim, J.S.; Ruf, D.M.; Mitra, T.; Couvillon, A.D.; Jacks, T.; Yaffe, M.B. A Reversible Gene-Targeting Strategy Identifies Synthetic Lethal Interactions between MK2 and p53 in the DNA Damage Response in Vivo. Cell Rep. 2013, 5, 868–877. [Google Scholar] [CrossRef] [Green Version]
- Reinhardt, H.C.; Aslanian, A.S.; Lees, J.A.; Yaffe, M.B. p53-deficient cells rely on ATM- and ATR-mediated checkpoint signaling through the p38MAPK/MK2 pathway for survival after DNA damage. Cancer Cell 2007, 11, 175–189. [Google Scholar] [CrossRef] [Green Version]
- Dietlein, F.; Kalb, B.; Jokic, M.; Noll, E.M.; Strong, A.; Tharun, L.; Ozretić, L.; Künstlinger, H.; Kambartel, K.; Randerath, W.J.; et al. A Synergistic Interaction between Chk1- and MK2 Inhibitors in KRAS-Mutant Cancer. Cell 2015, 162, 146–159. [Google Scholar] [CrossRef] [Green Version]
- Lalaoui, N.; Hänggi, K.; Brumatti, G.; Chau, D.; Nguyen, N.Y.; Vasilikos, L.; Spilgies, L.M.; Heckmann, D.A.; Ma, C.; Ghisi, M.; et al. Targeting p38 or MK2 Enhances the Anti-Leukemic Activity of Smac-Mimetics. Cancer Cell 2016, 29, 145–158. [Google Scholar] [CrossRef] [Green Version]
- Gurgis, F.; Yeung, Y.T.; Tang, M.X.M.; Heng, B.; Buckland, M.; Ammit, A.J.; Haapasalo, J.; Haapasalo, H.; Guillemin, G.J.; Grewal, T.; et al. The p38-MK2-HuR pathway potentiates oncogene-microenvironment driven IL-6 secretion in glioblastoma cells. Oncogene 2015, 34, 2934–2942. [Google Scholar] [CrossRef]
- Munoz, L.; Yeung, Y.T.; Grewal, T. Oncogenic Ras modulates p38 MAPK-mediated inflammatory cytokine production in glioblastoma cells. Cancer Biol. Ther. 2016, 17, 355–363. [Google Scholar] [CrossRef] [Green Version]
- Campbell, R.M.; Anderson, B.D.; Brooks, N.A.; Brooks, H.B.; Chan, E.M.; De Dios, A.; Gilmour, R.; Graff, J.R.; Jambrina, E.; Mader, M.; et al. Characterization of LY2228820 Dimesylate, a Potent and Selective Inhibitor of p38 MAPK with Antitumor Activity. Mol. Cancer Ther. 2014, 13, 364–374. [Google Scholar] [CrossRef] [PubMed] [Green Version]
- Gurgis, F.; Akerfeldt, M.C.; Heng, B.; Wong, C.; Adams, S.; Guillemin, G.J.; Johns, T.G.; Chircop, M.; Munoz, L. Cytotoxic activity of the MK2 inhibitor CMPD1 in glioblastoma cells is independent of MK2. Cell Death Discov. 2015, 1, 15028. [Google Scholar] [CrossRef] [PubMed] [Green Version]
- Li, H.; Liu, Y.; Gu, Z.; Li, L.; Liu, Y.; Wang, L.; Su, L. p38 MAPK-MK2 pathway regulates the heat-stress-induced accumulation of reactive oxygen species that mediates apoptotic cell death in glial cells. Oncol. Lett. 2018, 15, 775–782. [Google Scholar] [CrossRef]
- Louis, D.N.; Perry, A.; Reifenberger, G.; Von Deimling, A.; Figarella-Branger, D.; Cavenee, W.K.; Ohgaki, H.; Wiestler, O.D.; Kleihues, P.; Ellison, D.W. The 2016 World Health Organization Classification of Tumors of the Central Nervous System: A summary. Acta Neuropathol. 2016, 131, 803–820. [Google Scholar] [CrossRef] [PubMed] [Green Version]
- Claus, E.B.; Walsh, K.M.; Wiencke, J.K.; Molinaro, A.M.; Wiemels, J.L.; Schildkraut, J.M.; Bondy, M.L.; Berger, M.; Jenkins, R.; Wrensch, M. Survival and low-grade glioma: the emergence of genetic information. Neurosurg. Focus 2015, 38, E6. [Google Scholar] [CrossRef]
- Stupp, R.; Hegi, M.E.; Mason, W.P.; Van Den Bent, M.J.; Taphoorn, M.J.; Janzer, R.C.; Ludwin, S.K.; Allgeier, A.; Fisher, B.; Belanger, K.; et al. Effects of radiotherapy with concomitant and adjuvant temozolomide versus radiotherapy alone on survival in glioblastoma in a randomised phase III study: 5-year analysis of the EORTC-NCIC trial. Lancet Oncol. 2009, 10, 459–466. [Google Scholar] [CrossRef]
- Wick, W.; Weller, M.; Van Den Bent, M.; Sanson, M.; Weiler, M.; Von Deimling, A.; Plass, C.; Hegi, M.; Platten, M.; Reifenberger, G. MGMT testing - the challenges for biomarker-based glioma treatment. Nat. Rev. Neurol. 2014, 10, 372–385. [Google Scholar] [CrossRef] [Green Version]
- Wu, L.; Bernal, G.M.; Cahill, K.E.; Pytel, P.; Fitzpatrick, C.A.; Mashek, H.; Weichselbaum, R.R.; Yamini, B. BCL3 expression promotes resistance to alkylating chemotherapy in gliomas. Sci. Transl. Med. 2018, 10, 2237. [Google Scholar] [CrossRef] [Green Version]
- Garnier, D.; Meehan, B.; Kislinger, T.; Daniel, P.; Sinha, A.; Abdulkarim, B.; Nakano, I.; Rak, J. Divergent evolution of temozolomide resistance in glioblastoma stem cells is reflected in extracellular vesicles and coupled with radiosensitization. Neuro-Oncology 2018, 20, 236–248. [Google Scholar] [CrossRef] [Green Version]
- Murphy, S.F.; Varghese, R.T.; Lamouille, S.; Guo, S.; Pridham, K.J.; Kanabur, P.; Osimani, A.M.; Sharma, S.; Jourdan, J.; Rodgers, C.M.; et al. Connexin 43 Inhibition Sensitizes Chemoresistant Glioblastoma Cells to Temozolomide. Cancer Res. 2016, 76, 139. [Google Scholar] [CrossRef] [Green Version]
- Nguyen, S.A.; Stechishin, O.D.; Luchman, H.A.; Lun, X.Q.; Senger, D.L.; Robbins, S.M.; Cairncross, J.G.; Weiss, S. Novel MSH6 Mutations in Treatment-Naïve Glioblastoma and Anaplastic Oligodendroglioma Contribute to Temozolomide Resistance Independently of MGMT Promoter Methylation. Clin. Cancer Res. 2014, 20, 4894. [Google Scholar] [CrossRef] [Green Version]
- Cannell, I.G.; Merrick, K.A.; Morandell, S.; Zhu, C.Q.; Braun, C.J.; Grant, R.A.; Cameron, E.R.; Tsao, M.S.; Hemann, M.T.; Yaffe, M.B. A Pleiotropic RNA-Binding Protein Controls Distinct Cell Cycle Checkpoints to Drive Resistance of p53-defective Tumors to Chemotherapy. Cancer Cell 2015, 28, 623–637. [Google Scholar] [CrossRef] [Green Version]
- Reinhardt, H.C.; Hasskamp, P.; Schmedding, I.; Morandell, S.; van Vugt, M.A.; Wang, X.; Linding, R.; Ong, S.E.; Weaver, D.; Carr, S.A.; et al. DNA damage activates a spatially distinct late cytoplasmic cell-cycle checkpoint network controlled by MK2-mediated RNA stabilization. Mol. Cell 2010, 40, 34–49. [Google Scholar] [CrossRef]
- Brennan, C.W.; Verhaak, R.G.; McKenna, A.; Campos, B.; Noushmehr, H.; Salama, S.R.; Zheng, S.; Chakravarty, D.; Sanborn, J.Z.; Berman, S.H.; et al. The Somatic Genomic Landscape of Glioblastoma. Cell 2013, 155, 462–477. [Google Scholar] [CrossRef]
- Johnson, B.E.; Mazor, T.; Hong, C.; Barnes, M.; Aihara, K.; McLean, C.Y.; Fouse, S.D.; Yamamoto, S.; Ueda, H.; Tatsuno, K.; et al. Mutational Analysis Reveals the Origin and Therapy-Driven Evolution of Recurrent Glioma. Science 2014, 343, 189. [Google Scholar] [CrossRef] [PubMed] [Green Version]
- Tang, Z.; Li, C.; Kang, B.; Gao, G.; Li, C.; Zhang, Z. GEPIA: a web server for cancer and normal gene expression profiling and interactive analyses. Nucleic Acids Res. 2017, 45, W98–W102. [Google Scholar] [CrossRef] [PubMed] [Green Version]
- Sun, L.; Sun, L.; Hui, A.M.; Su, Q.; Vortmeyer, A.; Kotliarov, Y.; Pastorino, S.; Passaniti, A.; Menon, J.; Walling, J.; et al. Neuronal and glioma-derived stem cell factor induces angiogenesis within the brain. Cancer Cell 2006, 9, 287–300. [Google Scholar] [CrossRef] [PubMed] [Green Version]
- Rosso, L.; Brock, C.S.; Gallo, J.M.; Saleem, A.; Price, P.M.; Turkheimer, F.E.; Aboagye, E.O. A New Model for Prediction of Drug Distribution in Tumor and Normal Tissues: Pharmacokinetics of Temozolomide in Glioma Patients. Cancer Res. 2008, 69, 120. [Google Scholar] [CrossRef] [PubMed] [Green Version]
- Portnow, J.; Badie, B.; Chen, M.; Liu, A.; Blanchard, S.; Synold, T.W. The neuropharmacokinetics of temozolomide in patients with resectable brain tumors: Potential implications for the current approach to chemoradiation. Clin. Cancer Res. 2009, 15, 7092–7098. [Google Scholar] [CrossRef] [PubMed] [Green Version]
- Mourey, R.J.; Burnette, B.L.; Brustkern, S.J.; Daniels, J.S.; Hirsch, J.L.; Hood, W.F.; Meyers, M.J.; Mnich, S.J.; Pierce, B.S.; Saabye, M.J.; et al. A Benzothiophene Inhibitor of Mitogen-Activated Protein Kinase-Activated Protein Kinase 2 Inhibits Tumor Necrosis Factor α Production and Has Oral Anti-Inflammatory Efficacy in Acute and Chronic Models of Inflammation. J. Pharmacol. Exp. Ther. 2010, 333, 797–807. [Google Scholar] [CrossRef] [Green Version]
- Huang, X.; Shipps Jr, G.W.; Cheng, C.C.; Spacciapoli, P.; Zhang, X.; McCoy, M.A.; Wyss, D.F.; Yang, X.; Achab, A.; Soucy, K.; et al. Discovery and Hit-to-Lead Optimization of Non-ATP Competitive MK2 (MAPKAPK2) Inhibitors. Acs Med. Chem. Lett. 2011, 2, 632–637. [Google Scholar] [CrossRef] [Green Version]
- Kastenhuber, E.R.; Lowe, S.W. Putting p53 in Context. Cell 2017, 170, 1062–1078. [Google Scholar] [CrossRef] [Green Version]
- Lee, S.; Schmitt, C.A. The dynamic nature of senescence in cancer. Nat. Cell Biol. 2019, 21, 94–101. [Google Scholar] [CrossRef]
- Weber, H.O.; Ludwig, R.L.; Morrison, D.; Kotlyarov, A.; Gaestel, M.; Vousden, K.H. HDM2 phosphorylation by MAPKAP kinase 2. Oncogene 2005, 24, 1965–1972. [Google Scholar] [CrossRef] [Green Version]
- Loughery, J.; Cox, M.; Smith, L.M.; Meek, D.W. Critical role for p53-serine 15 phosphorylation in stimulating transactivation at p53-responsive promoters. Nucleic Acids Res. 2014, 42, 7666–7680. [Google Scholar] [CrossRef] [Green Version]
- Purvis, J.E.; Karhohs, K.W.; Mock, C.; Batchelor, E.; Loewer, A.; Lahav, G. p53 Dynamics Control Cell Fate. Science 2012, 336, 1440. [Google Scholar] [CrossRef] [Green Version]
- Muller, P.A.J.; Vousden, K.H. Mutant p53 in Cancer: New Functions and Therapeutic Opportunities. Cancer Cell 2014, 25, 304–317. [Google Scholar] [CrossRef] [Green Version]
- Stringer, B.W.; Day, B.W.; D’Souza, R.C.; Jamieson, P.R.; Ensbey, K.S.; Bruce, Z.C.; Lim, Y.C.; Goasdoué, K.; Offenhäuser, C.; Akgül, S.; et al. A reference collection of patient-derived cell line and xenograft models of proneural, classical and mesenchymal glioblastoma. Sci. Rep. 2019, 9, 4902. [Google Scholar] [CrossRef] [Green Version]
- D’Souza, C.J.R.; Offenhäuser, C.; Straube, J.; Baumgartner, U.; Kordowski, A.; Li, Y.; Stringer, B.W.; Alexander, U.; Kordowski, A.; Li, Y.; et al. Q-Cell Glioblastoma Resource: Proteomics Analysis Reveals Unique Cell-States Are Maintained in 3D Culture. Cells 2020, 9, 267. [Google Scholar] [CrossRef] [Green Version]
- Pomerantz, J.; Schreiber-Agus, N.; Liégeois, N.J.; Silverman, A.; Alland, L.; Chin, L.; Potes, J.; Chen, K.; Lee, H.W.; Cordon-Cardo, C.; et al. The Ink4a Tumor Suppressor Gene Product, p19Arf, Interacts with MDM2 and Neutralizes MDM2’s Inhibition of p53. Cell 1998, 92, 713–723. [Google Scholar] [CrossRef] [Green Version]
- Menon, M.B.; Gaestel, M. MK2–TNF–Signaling Comes Full Circle. Trends Biochem. Sci. 2018, 43, 170–179. [Google Scholar] [CrossRef]
- Henriques, A.; Koliaraki, V.; Kollias, G. Mesenchymal MAPKAPK2/HSP27 drives intestinal carcinogenesis. Proc. Natl. Acad. Sci. USA 2018, 115, E5546–E5555. [Google Scholar] [CrossRef] [Green Version]
- Bykov, V.J.N.; Eriksson, S.E.; Bianchi, J.; Wilman, K.G. Targeting mutant p53 for efficient cancer therapy. Nat. Rev. Cancer 2017, 18, 89. [Google Scholar] [CrossRef]
- Kim, M.P.; Lozano, G. Mutant p53 partners in crime. Cell Death Differ. 2017, 25, 161. [Google Scholar] [CrossRef]
- Cannell, I.G.; Kong, Y.W.; Johnston, S.J.; Chen, M.L.; Collins, H.M.; Dobbyn, H.C.; Elia, A.; Kress, T.R.; Dickens, M.; Clemens, M.J.; et al. p38 MAPK/MK2-mediated induction of miR-34c following DNA damage prevents Myc-dependent DNA replication. Proc. Natl. Acad. Sci. USA 2010, 107, 5375–5380. [Google Scholar] [CrossRef] [Green Version]
- Schottelius, A.J.; Zügel, U.; Döcke, W.D.; Zollner, T.M.; Röse, L.; Mengel, A.; Buchmann, B.; Becker, A.; Grütz, G.; Naundorf, S.; et al. The Role of Mitogen-Activated Protein Kinase-Activated Protein Kinase 2 in the p38/TNF-α Pathway of Systemic and Cutaneous Inflammation. J. Investig. Dermatol. 2010, 130, 481–491. [Google Scholar] [CrossRef] [Green Version]
- Köpper, F.; Bierwirth, C.; Schön, M.; Kunze, M.; Elvers, I.; Kranz, D.; Saini, P.; Menon, M.B.; Walter, D.; Sorensen, C.S.; et al. Damage-induced DNA replication stalling relies on MAPK-activated protein kinase 2 activity. Proc. Natl. Acad. Sci. USA 2013, 110, 16856–16861. [Google Scholar] [CrossRef] [Green Version]
- Li, Y.; Köpper, F.; Dobbelstein, M. Inhibition of MAPKAPK2/MK2 facilitates DNA replication upon cancer cell treatment with gemcitabine but not cisplatin. Cancer Lett. 2018, 428, 45–54. [Google Scholar] [CrossRef]
- Köpper, F.; Binkowski, A.M.; Bierwith, C.; Dobbelstein, M. The MAPK-activated protein kinase 2 mediates gemcitabine sensitivity in pancreatic cancer cells. Cell Cycle 2014, 13, 884–889. [Google Scholar] [CrossRef] [Green Version]
- Hoque, M.; Abbassi, R.H.; Froio, D.; Man, J.; Johns, T.G.; Stringer, B.W.; Day, B.W.; Pajic, M.; Kassiou, M.; Munoz, L. Changes in cell morphology guide identification of tubulin as the off-target for protein kinase inhibitors. Pharmacol. Res. 2018, 134, 166–178. [Google Scholar] [CrossRef]
- Aubrey, B.J.; Kelly, G.L.; Kueh, A.J.; Brennan, M.S.; O’Connor, L.; Milla, L.; Wilcox, S.; Tai, L.; Strasser, A.; Herold, M.J. An Inducible Lentiviral Guide RNA Platform Enables the Identification of Tumor-Essential Genes and Tumor-Promoting Mutations In Vivo. Cell Rep. 2015, 10, 1422–1432. [Google Scholar]


© 2020 by the authors. Licensee MDPI, Basel, Switzerland. This article is an open access article distributed under the terms and conditions of the Creative Commons Attribution (CC BY) license (http://creativecommons.org/licenses/by/4.0/).
Share and Cite
Phoa, A.F.; Recasens, A.; Gurgis, F.M.S.; Betts, T.A.; Menezes, S.V.; Chau, D.; Nordfors, K.; Haapasalo, J.; Haapasalo, H.; Johns, T.G.; et al. MK2 Inhibition Induces p53-Dependent Senescence in Glioblastoma Cells. Cancers 2020, 12, 654. https://doi.org/10.3390/cancers12030654
Phoa AF, Recasens A, Gurgis FMS, Betts TA, Menezes SV, Chau D, Nordfors K, Haapasalo J, Haapasalo H, Johns TG, et al. MK2 Inhibition Induces p53-Dependent Senescence in Glioblastoma Cells. Cancers. 2020; 12(3):654. https://doi.org/10.3390/cancers12030654
Chicago/Turabian StylePhoa, Athena F., Ariadna Recasens, Fadi M. S. Gurgis, Tara A. Betts, Sharleen V. Menezes, Diep Chau, Kristiina Nordfors, Joonas Haapasalo, Hannu Haapasalo, Terrance G. Johns, and et al. 2020. "MK2 Inhibition Induces p53-Dependent Senescence in Glioblastoma Cells" Cancers 12, no. 3: 654. https://doi.org/10.3390/cancers12030654